Embed Size (px)
Citation preview

REFUGEE NUTRITION ASSESSMENT REPORT
FINAL REPORT OF THE NUTRITION AND FOOD SECURITY SUR VEY
CONDUCTED IN REFUGEE SETTLEMENTS OF UGANDA, 2012
SURVEY CONDUCTED
BY
ANDRE FOOD CONSULT
DECEMBER 2012

2
Table of Contents Executive Summary ....................................................................................................................................................... 6 1. Introduction ............................................................................................................................................................. 11 1.1 Survey Objectives .................................................................................................................................................. 12 2. Methodology ............................................................................................................................................................ 14 2.1 Sample Size ........................................................................................................................................................... 14
2.1.1 Sample size for children aged 6 to 59 months ............................................................................................ 14 2.1.2. Sample size for women of reproductive age (15 – 49years) ...................................................................... 14 2.1.3 Sample size for measurement of Anaemia .................................................................................................. 14
2.2 Sampling procedure: selecting clusters .................................................................................................................. 14 2.3 Sampling procedure: selecting households and individuals................................................................................... 14
2.3.1 Selection of children (6 to 59 months) ........................................................................................................ 15 2.3.2 Selection of women (15 to 49 years) .......................................................................................................... 15
2.4 Questionnaire and Measurement Methods ............................................................................................................. 15 2.5 Case definitions, inclusion criteria and calculations .............................................................................................. 15
2.5.1 Variables collected ...................................................................................................................................... 15 2.6 Classification of public health problems and targets ............................................................................................. 17
2.6.1 Acute Malnutrition: Weight-for-Height Index ............................................................................................ 17 2.6.2 Chronic Malnutrition: Height-for-Age Index ............................................................................................. 17 2.6.3 Malnutrition for women of reproductive age .............................................................................................. 18 2.6.4 Cut-off-point for defining Anaemia ............................................................................................................ 18 2.6.5 Morbidity .................................................................................................................................................... 18
2.7 Training, coordination and supervision ................................................................................................................. 18 2.7.1 Survey Teams and Supervision ................................................................................................................... 18 2.7.2 Training ...................................................................................................................................................... 19
2.8 Data Management and Analysis ............................................................................................................................ 20 2.8.1. Data Management ...................................................................................................................................... 20 2.8.2. Data Analysis ............................................................................................................................................. 20
3. Results ..................................................................................................................................................................... 21 3.1 Children 6-59 months ............................................................................................................................................ 21
3.1.1 Sample size and clusters ............................................................................................................................. 21 3.1.2 Distribution of age and sex ......................................................................................................................... 22 3.1.3 Anthropometric Survey .............................................................................................................................. 24 3.1.3.1 Acute malnutrition in Z-scores weight for height .................................................................................... 24 3.1.3. 2. Chronic Malnutrition (Height-for-Age Index in Z-Scores).................................................................... 34 3.1.3.3: Prevalence of underweight based on weight-for-age .............................................................................. 42 3.1.3.4. Prevalence of malnutrition by MUAC .................................................................................................... 45 3.1.4 Feeding programme coverage results ......................................................................................................... 46 3.1.5 Access to Health Services ........................................................................................................................... 46 3.1.6 Retrospective child morbidity ................................................................................................................ 47 3.1.7 Prevalence of Anaemia ............................................................................................................................... 47
3.2. Children 0-23 months ........................................................................................................................................... 49 3.2.1 Infant and Young Child Feeding Practices Indicators ................................................................................ 49 3.2.2 Type of liquid/ or solid foods given ............................................................................................................ 51
3.3 Women 15-49 years ............................................................................................................................................... 53 3.3.1 Physiological status and age ....................................................................................................................... 53 3.3.2 Prevalence of anaemia and haemoglobin concentration in non-pregnant women 15-49 years ................... 53 3.3.3 ANC enrollment and folic acid pills coverage among pregnant women (15-49 years) .............................. 54
3.4 Household food security situation in South West and West Nile Refugee settlements ......................................... 55 3.4.1 Sample size for food security assessment ................................................................................................... 55 3.4.2 Food Distribution ........................................................................................................................................ 55 3.4.3 Supplementary Food sources ................................................................................................................. 58 3.4.4 Household dietary diversity ........................................................................................................................ 58 3.4.5 Negative Coping Strategies ........................................................................................................................ 63
3.6 Water, Hygiene and Sanitation (WASH) ............................................................................................................... 64
3
3.6.1 Sample size for water, hygiene and sanitation indicators ........................................................................... 64 3.6.2 Water Quality ......................................................................................................................................... 64 3.6.3 Safe Excreta Disposal ................................................................................................................................. 67
3.7 Mosquito Net Coverage ......................................................................................................................................... 70 3.7.1 Sample size for mosquito net coverage ...................................................................................................... 70 3.7.2 Mosquito net ownership ............................................................................................................................. 70 3.7.3 Mosquito net utilisation by sub-groups....................................................................................................... 73
3.8 Other results ........................................................................................................................................................... 76 3.8.1 Crude mortality ........................................................................................................................................... 76
3.9 Limitations ............................................................................................................................................................. 77 4. Discussion ................................................................................................................................................................ 77 4.1 Nutritional status of young children ...................................................................................................................... 77 4.2 Programme coverage ............................................................................................................................................. 78 4.3 Anaemia in young children and women ................................................................................................................ 78 4.4 IYCF indicators ..................................................................................................................................................... 78 4.5 Food security ......................................................................................................................................................... 79 4.6 WASH ................................................................................................................................................................... 80 4.7 Mosquito net coverage ........................................................................................................................................... 80 5. Conclusions ............................................................................................................................................................. 80 6. Recommendations and priorities ............................................................................................................................. 81 7. References ............................................................................................................................................................... 82 8. Acknowledgements ................................................................................................................................................. 83 9. Appendices .............................................................................................................................................................. 84 Appendix 9.1: Plausibility Report ............................................................................................................................... 84 Appendix 9.2: Assignment of Clusters for South Western Refugee Settlements ....................................................... 89 Appendix 9.3: Result Tables for NCHS growth reference 1977 ................................................................................. 92 Appendix 9.4: Map of area ........................................................................................................................................ 119 Appendix 9.5: Questionnaires ................................................................................................................................... 120 Appendix 9.6: Local event calendar used during the survey to estimate age of young children ............................... 134 Appendix 9.7: Nutrition, Health, Food Security Assessment November, 2012 Child Age Calendar ........................ 135

4
List of Tables Table 1: Summary of results .......................................................................................................................................... 7 Table 2: Expression of Cut-off values for the results .................................................................................................. 17 Table 3: Classification of severity of severe and chronic malnutrition........................................................................ 17 Table 4: International classification of adult underweight according to BMI (kg/m2) ................................................ 18 Table 5. Categories of Anaemia using haemoglobin levels ......................................................................................... 18 Table 6: Demographic Characteristics of the study population ................................................................................... 21 Table 7: Target and actual number captured................................................................................................................ 21 Table 8. Distribution of age and sex of sample in Settlements .................................................................................... 22 Table 9: Acute malnutrition of children in Z-scores (WFH) by sex ............................................................................ 24 Table 10: Prevalence of acute malnutrition by age, based on weight-for-height z-scores and/or oedema .................. 27 Table 11: Distribution of severe acute malnutrition and oedema based on weight-for-height z-scores ...................... 31 Table 12: Prevalence of acute malnutrition based on the percentage of the median and/or oedema ........................... 34 Table 13: Prevalence of stunting based on height-for-age z-scores and by sex ........................................................... 34 Table 14: Prevalence of stunting by age based on height-for-age z-scores ................................................................. 36 Table 15: Prevalence of underweight based on weight-for-age z-scores by sex.......................................................... 42 Table 16: Mean z-scores, Design Effects and excluded subjects................................................................................. 44 Table 17: Prevalence of malnutrition based on MUAC ............................................................................................... 45 Table 18: Programme coverage for acutely malnourished children ............................................................................ 46 Table 19: Immunization coverage and other health services for children ................................................................... 46 Table 20: Retrospective morbidity .............................................................................................................................. 47 Table 21: Prevalence of anaemia in children (06-59months) ...................................................................................... 47 Table 21: Prevalence of anaemia in women (15-49yrs) .............................................................................................. 48 Table 22: Prevalence of infant and Young Child Feeding Practices Indicator ............................................................ 50 Table 23: Type of fluids given to the children the previous day ................................................................................. 51 Table 24: Intake of infant formula, Fortified Blended Foods and other special nutrition products ............................. 52 Table 25: Women physiological status and age ........................................................................................................... 53 Table 26: Prevalence of anaemia and haemoglobin concentration in non-pregnant women 15-49 years ................... 53 Table 27: ANC enrolment and iron-folic acid pills coverage among pregnant women (15-49 years) ........................ 55 Table 28: Sample size for food security assessment by settlement camps .................................................................. 55 Table 29: Ration card coverage by settlement camp ................................................................................................... 56 Table 30: Proportion (%) of households without card ................................................................................................. 56 Table 31: Reported duration of general food ration by settlement .............................................................................. 57 Table 32: Reported duration of general food ration ..................................................................................................... 57 Table 33: Supplementation of General Food ration ..................................................................................................... 58 Table 34: Average HDDS by Settlement camp .......................................................................................................... 59 Table 35: Combined household consumption of food aid commodities and micronutrient rich foods ....................... 62 Table 36: Consumption of Food aid Fortified Blended Foods .................................................................................... 63 Table 37: Coping strategies used by the surveyed population over the past month .................................................... 63 Table 38: Sample size for Water, hygiene and Sanitation indicators per settlement ................................................... 64 Table 39: Water Quality in the settlement camps of Uganda ...................................................................................... 65 Table 40: Amount of water used per person per day ................................................................................................... 65 Table 41: Time taken to collect water from main drinking water source .................................................................... 66 Table 42: Satisfaction with water supply ..................................................................................................................... 66 Table 43: Safe excreta disposal ................................................................................................................................... 68 Table 44: Sample size for mosquito net coverage by settlement camp ....................................................................... 70 Table 45: Household mosquito net ownership ............................................................................................................. 71 Table 46: Average number of LLINs and Average number of persons per LLIN ....................................................... 73 Table 47: Mosquito net utilisation by subgroups per camp ......................................................................................... 74 Table 48: Mortality results (retrospective over 3 months/days prior to interview) ...................................................... 77

5
Table of figures
Figure 1: Trend in GAM and SAM Rates in settlement camps in South West and West Nile Uganda (2010-2012) .. 26 Figure 2: Trends in the prevalence of wasting* by age in children 6-59 months ........................................................ 29 Figure 3: Distribution of weight-for-height z-scores based on WHO Growth Standards ............................................ 32 Figure 4: Trends in the prevalence of stunting by age in children 6-59 months .......................................................... 38 Figure 5: Distribution of height-for-age z-scores (based on WHO Growth Standards ................................................ 40 Figure 6: Trends in anaemia categories in children 6-59 months, 2010 and 2012 ....................................................... 48 Figure 7: Trends in anaemia in woemn15-59 years in SW and WN, 2010 and 2012 .................................................. 49 Figure 8: Trends in prevalence of key IYCF indicators in SW and WN Uganda (2010-2012) ................................... 51 Figure 9: Anaemia categories in women of reproductive age (non-pregnant) from 2010-2012 .................................. 54 Figure 10: Trend in mean haemoglobin concentration in women of reproductive age (non-pregnant women) in SW and WN settlements, Uganda ...................................................................................................................................... 54 Figure 11: Proportion of households by duration of general food ration in SW and WN ........................................... 58 Figure 12: Proportion of households consuming different food groups within last 24 hours ...................................... 59 Figure 13: Proportion of households that say they are satisfied with the water supply ............................................... 66 Figure 14: Proportion of households with children under the age of 3 years whose (last) stools were disposed off safely ........................................................................................................................................................................... 68 Figure 15: Household ownership of at least one mosquito net .................................................................................... 71 Figure 16: Household ownership of at least one LLIN ................................................................................................ 72 Figure 17: Mosquito Net Utilisation by sub-groups .................................................................................................... 74

6
Executive Summary Hostility in some countries neighbouring Uganda has led several refugees to seek asylum in the South West and West Nile sub-regions of Uganda. Currently more than 150000 refugees are living in Uganda and are mainly from Democratic Republic of Congo, Rwanda, Burundi, Somalia and Southern Sudan. On arrival, refugees are distributed in the settlement camps of Nakivale, Oruchinga, Kyaka II, Rwamwanja, Kyangwali, Kiryandongo, Adjumani and Rhino camp. At the moment due to the insurgency in DRC, Rwamwanja camp was reopened in April 2012 and up to date new arrivals are being brought in. A nutrition survey was carried out in these refugee settlement camps from 19th to 29th November 2012. The main objective of the survey was to assess indicators of health, nutrition, food security and retrospective mortality in the refugee settlements in order to generate information for improved programme and policy interventions. Two-stage cluster sampling technique was employed in this survey. Guidelines outlined in the UNHCR SENS manual for Standardized Expanded Nutrition Surveys for Refugees and SMART methodology (April 2006) for Emergency Nutrition Assessment (ENA) for measuring mortality and nutrition in crisis situations was used for sample size determination, cluster selection and sampling. Villages with clusters within the total population were selected randomly according to their sizes based on systematic sampling technique outlined in SENS guide. The required number of households within each cluster was selected by help of a local leader. A village list was used for random sampling of households to be assessed. A cluster design effect of 1.5 was used to calculate the sample size for all settlements based on prevalence of malnutrition established by WFP/UNHCR/ACF, 2011 survey. The WHO Child Growth Standards (2006) were used as the reference for the child anthropometric indices. A total 2395 children 6-59months were surveyed; 1547 in South West and 848 in West Nile. This was aimed at assessing nutritional status and anaemia levels among children and women of reproductive age. The results in Table 1 indicate a stable nutrition situation among refugee population with GAM of below 5% over the years. The GAM in Rwamwanja is highest at 4.9% but below the 5.6% reported in August 2012; the high aggravating factors due to infections and continuous influx means the situation is unstable. While the results for the previous surveys identified acceptable levels of global acute malnutrition (GAM), high anaemia rates and stunting rates (hidden hunger) among children remains a serious concern exceeding emergency thresholds of 40% and calls for continuous and collaborative efforts and supports for the on-going interventions to address this. Anaemia among non-pregnant women of reproductive age 15-49yrs is just below the emergency threshold of 40%.

7
Table 1: Summary of results South west %
(95% CI)
West Nile %
(95% CI)
Classification of public health significance or target
Children 6-59 months
Kyaka II Kyangwali Nakivale/ Oruchinga
Rwamwanja Kiryandongo Rhino camp
Adjumani
n = 251 n = 341 n = 565 n = 371 n = 173 n = 208 n = 456 Acute Malnutrition (WHO 2006 Growth Standards) Global Acute Malnutrition (GAM)
2.8 % (1.0 - 7.7)
2.6 % (1.1 - 6.0)
2.1 % (1.1 - 4.2)
4.9 % (3.1 - 7.4)
4.1 % (1.2 - 13.0)
3.4 % (1.8 - 6.3)
(4.6 % (3.2 - 6.6)
Critical if ≥ 15%
Moderate Acute Malnutrition (MAM)
2.8 % (1.0 - 7.7)
2.6 % (1.1 - 6.0)
1.9 % (0.9 - 4.0)
4.3 % (2.6 - 7.0)
3.5 % (1.0 - 11.4)
2.9 % (1.5 - 5.3)
4.4 % (3.1 - 6.2)
Severe Acute Malnutrition (SAM)
(0.0 % (0.0 - 0.0)
0.0 % (0.0 - 0.0)
0.2 % (0.0 - 1.4)
0.5 % (0.1- 1.9)
0.6 % (0.1 - 5.0)
0.5 % (0.1 - 3.9)
0.2 % (0.0 - 1.8)
Oedema 0.0 % 0.0 % 0.2 % 0.5 % 0.0 % 0.0 % 0.0 % Mid Upper Arm Circumference, MUAC
n=254 n=348 n =569 n =376 n=173 n =210 n =465
Moderate malnutrition (11.5-12.4 cm)
4.3 % (2.1 - 8.8)
1.4 % (0.6 - 3.3)
3.9 % (2.6 - 5.7 9)
5.9 % (3.6 - 9.3 )
4.0 % (1.8 - 8.7)
1.9 % (0.4 - 8.5)
2.8 % (1.4 - 5.6)
Severe malnutrition (<11.5 cm)
0.4 % (0.0 - 3.4 )
1.4 % (0.5 - 4.0)
0.9 % (0.4 - 2.0)
0.8 % (0.3 - 2.1 )
(0.0 % (0.0 - 0.0 )
0.5 % (0.0 - 4.6 )
0.2 % (0.0 - 1.7 )
Stunting (WHO 2006 Growth Standards)
Total Stunting 25.3 % (15.8-38.0)
31.8 % (24.2 - 40.0)
33.9 % (28.7 - 39.4)
31.6% (23.5-41.1
12.1 % (5.9 - 23.2
12.3 % (7.0 - 20.7)
16.4 % (12.4 - 21.4)
Critical if ≥ 40%
Severe Stunting 6.4 % (2.8 - 14.1)
13.4 % (9.4 - 18.7)
9.2 % (7.2 - 11.7)
8.0 % (4.7 -13.3)
4.0 % (1.5 - 10.3
0.5 % (0.1 - 4.6)
3.1 % (1.7 - 5.9)
Programme coverage
Measles vaccination with card or recall (9-59months)
88.2% (81.1-85.3)
88.8% (84.9-92.0)
94.1% (91.2-96.9)
86.4% (82.4-89.8)
88.1% (82.0-92.6)
90.2% (85.1-94.0)
93.8% (91.0-95.8)
Target of ≥ 95%
Vit. A supplementation vaccination with card or recall
95.6% (92.3-97.8)
89.0% (85.6-92.4)
92.8% (89.5-96.1)
84.8% (80.8-88.3)
68.8% (61.3-75.6)
89.6% (84.4-93.6)
93.5% (90.8-95.5)
Target of ≥ 90%
Deworming with card or recall (12-59months)
83.0% (77.4-87.8)
83.0% (78.4-87.0)
96.5% (94.1-99.0)
80.4% (75.6-84.5)
49.7% (42.0-57.4)
81.9% (75.7-87.0)
83.2% (79.4-86.6)
Retrospective Morbidity
Diarrhoea in last 2 weeks
30.3% (24.2-36.4)
34.2% (29.3-39.5)
23.2% (19.9-27.0)
52.9% (47.7-58.0)
27.2% (20.7-34.4)
46.9% (40.0-53.9)
27.7% (23.8-32.1)
Fever/Malaria in the last 2 weeks
31.9% (26.2-38.0)
22.4% (18.2-27.2)
23.7% (23.7-29.6)
76.3% (71.7-80.5)
18.5% (13.0-25.1)
35.4% (28.9-42.3)
28.0% (24.0-32.3)
Cough/ARI in the last 2 weeks
55.5% (49.2-61.2)
24.7% (20.3-29.7)
33.6% (94.1-99.0)
68.9% (63.9-73.5)
22.5% (16.5-29.5)
47.4% (40.4-54.4)
27.5% (23.6-31.9)
Retrospective Mortality Crude mortality rate (CMR)/10,000/day
0.53 (0.27-1.07)
0.27 (0.06-1.31)
0.49 (0.17-1.37)
0.38 (0.19-0.73)
0.23 (0.0-0.08)
0.21 (0.03-1.61)
0.26 (0.05-1.41)
0-5Mortality rate (U5MR) /10,000/day
0.91 (0.28-2.89)
0.64 (0.15-2.77)
0.53 (0.19-1.52)
0.91 (0.34-2.47)
0.75 (0.1-1.02)
0.46 (0.06-3.45)
0.45 (0.07-2.9)
Anaemia for Children 6-59months
Total Anaemia (Hb <11 g/dl)
33.5% (24.5-42.5)
51.5% (63.9-75.5)
31.8% (28-25.8)
53.7% (48.5-58.8)
53.2% (45.5-60.8)
42.4% (35.6-49.4)
57.0% (52.3-61.5)
High if ≥ 40%
Mild (Hb 10-10.9) 21.3% (15.6-26.9)
18.7% (14.8-23.3)
20.0% (16.5-23.50
21.0% (17.1-25.6)
25.4% (19.1-32.6)
20.5% (15.2-26.6)
25.4% (21.5-29.6)
Moderate (Hb 7-9.9) 12.2% (5.1-19.3)
32.8% (27.9-38.0)
11.1% (8.3-13.8)
28.2% (23.8-33.1)
22.4% (19.1-32.6)
21.4% (16.1-27.6)
30.1% (26.0-34.5)
Severe (Hb<7) 0.0% 0.0% 0.7% 4.5% 2.3% 0.5% 1.5%

8
(0.0-0.0) (0.0-0.0) (0.0-1.5) (2.7-7.3) (0.6-5.8%) (0.0-2.6) (0.7-3.2) Anaemia for WOMEN 15-49 years (non-pregnant)
Total Anaemia (Hb <12 g/dl)
47.0% (40.6-54.3)
32.4 (26.5-38.7)
34.0% (29.6-38.7)
41.3% (33.8-49.0)
25.7% (18.6-33.9)
35.1% (27.5-43.4)
33.0% (28.5-37.8)
High if ≥ 40%
Mild (Hb 11-11.9) 21.9% (16.5-28.0)
13.9% (9.7-18.9)
16.6% (12.9-19.9)
17.4% (12.1-24.0)
17.6% (11.6-25.1)
18.2% (12.4-25.4)
16.6% (13.2-20.6)
Moderate (Hb 8-10.9) 25.6% (19.9-32.0)
17.2 (12.7-22.6)
15.9% (12.7-19.7)
22.1% (16.1-29.0)
8.1% (4.1-14.0)
16.2% (10.7-23.2)
15.7% (12.4-19.6)
Severe (Hb<8) 0.0% (0.0-0.0)
1.3% (0.3-3.6)
2.0% 1.0-4.0)
1.7% (0.4-0.5)
0.0% (0.0-0.0)
0.7% (0.0-3.2)
0.7% (0.2-2.3)
FOOD SECURITY
Food distribution Proportion of HH on 50% food ration
76.0 (70.5-81.1)
9.2 (5.7-13.1)
65.5 (61.0-70.1)
0.3 (0.0-0.9)
35.1 (28.5-41.9)
96.6 (94.0-98.7)
38.0 (33.7-43.4)
Proportion of HH on 60% food ration
7.4 (4.0-10.8)
14.0 (9.7-18.3)
6.2 (3.9-8.5)
10.7 (7.8-14.1)
1.8 (0.0-4.0)
1.0 (0.0-2.2)
21.0 (17.6-25.8)
Proportion of HH on 100% food ration
12.0 (8.1-16.0)
34.5 (28.2-40.6)
21.7 (17.8-25.5)
87.5 (83.8-90.7)
1.8 (0.0-3.9) 1.3 (0.0-2.9)
31.7 (27.7-36.9)
Proportion of HH on 0% food ration
4.7% (2.2-7.3)
42.4% (35.7-48.9)
6.7% (4.5-9.2)
1.6% (0.5-3.0)
61.4% (53.9-68.1)
1.3% (0.0-3.0)
9.1% (6.5-11.8)
Proportion of HH on food ration
95.3 (91.0-99.7)
57.6 (40.3-75.0)
93.3 (89.7-97.0)
98.4 (97.0-99.8)
38.6 (19.3-57.8)
98.7 (97.1-100.3
90.9 (86.1-95.7)
Average number of days general food ration lasts out of 30 days
7.6 10.9 9.0 22.5 19.5 10.6 18.3
Positive household coping strategies Proportion of HH reporting supplementing GFR with own production over the past month
52.5 (46.1-58.5)
87.0 (82.5-91.0)
41.2 (36.5-45.8)
36.8 (32.2-41.6)
90.8 (86.2-95.0)
33.8 (26.8-38.9)
33.3 (28.9-37.9)
Proportion of HH reporting supplementing GFR with own purchase over the past month
7.8 (4.5-11.3)
8.2 (5.0-11.9)
58.8 (54.2-63.5)
31.2 (26.8-35.8)
5.2 (1.9-8.6)
15.7 (11.2-20.4)
24.8 (20.9-29.2)
Negative household coping strategies Proportion of HH reporting using none of the coping strategies over the past month
1.15 (0.0-2.5)
36 (23.3-49.1)
33.8 (19.1-48.5)
57.6 (39.9-75.4)
8.1 (2.99-13.2)
13.43 (8.07-18.8)
11.1 (2.6-19.6)
Household dietary diversity Average HDDS 2 4 3 3 4 5 4 Proportion of households not consuming any vegetables, fruits, meat, eggs, fish/seafood, and milk/milk products
68.5 (62.3-74.6)
83.6 (74.0-93.2)
80.5 (73.1-87.9)
74.4 (62.3-86.5)
98.3 (95.7-100.8)
97.9 (93.8-101.9
29.4 (17.1-41.6)
CHILDREN 0-23 MONTHS
IYCF indicators Timely initiation of breastfeeding
74.2% (62.4-85.9)
50.3% (33.3-67.4)
81.1% (74.9-87.3)
52.4% (36.7-68.1)
47.4% (30.1-64.7)
56.8% (21.3-92.4)
66.0% (52.2-79.8)
Exclusive Breastfeeding under 6
73.8% (60.6-87.1)
76.5% (59.4-93.6)
79.6% (67.9-91.3)
80.5% (64.7-96.2)
71.4% (38.5-104.0)
65.2% (49.6-80.9)
17.9% (0.2-35.5)
9
months Continued breastfeeding at 1 year
82.8% (66.5-99.0)
89.7% (77.5-101.8)
96.4% (91.9-100.8)
88.3% (81.0-95.6)
100% (100-100)
100% (100-100)
100% (100-100)
Continued breastfeeding at 2 years
62.5% (48.5-83.5)
63.2% (40.3-86.0)
59.3% (39.1-79.5)
17.6% (0-43.1)
50.0% (12.9-87.1)
75% (52.0-98.0)
57.9% (26.1-89.7)
Introduction of solid, semi-sold or soft foods
50% (25.2-74.8)
50% (18.2-81.8)
37.5% (14.7-60.3)
65.7% (47.0-84.2)
38.5% (12.5-79.4)
77.8% (58.5-97.0)
86.7% (67.3-98.7)
Consumption of iron-rich or iron-fortified foods
20% (2.1-37.9)
20.8% (1.6-39.9)
2.3% (0.2-4.8)
0% (0.0-0.0)
18.8% (0.8-36.9)
1.5% (0-5.3)
17.8% (2.9-32.7)
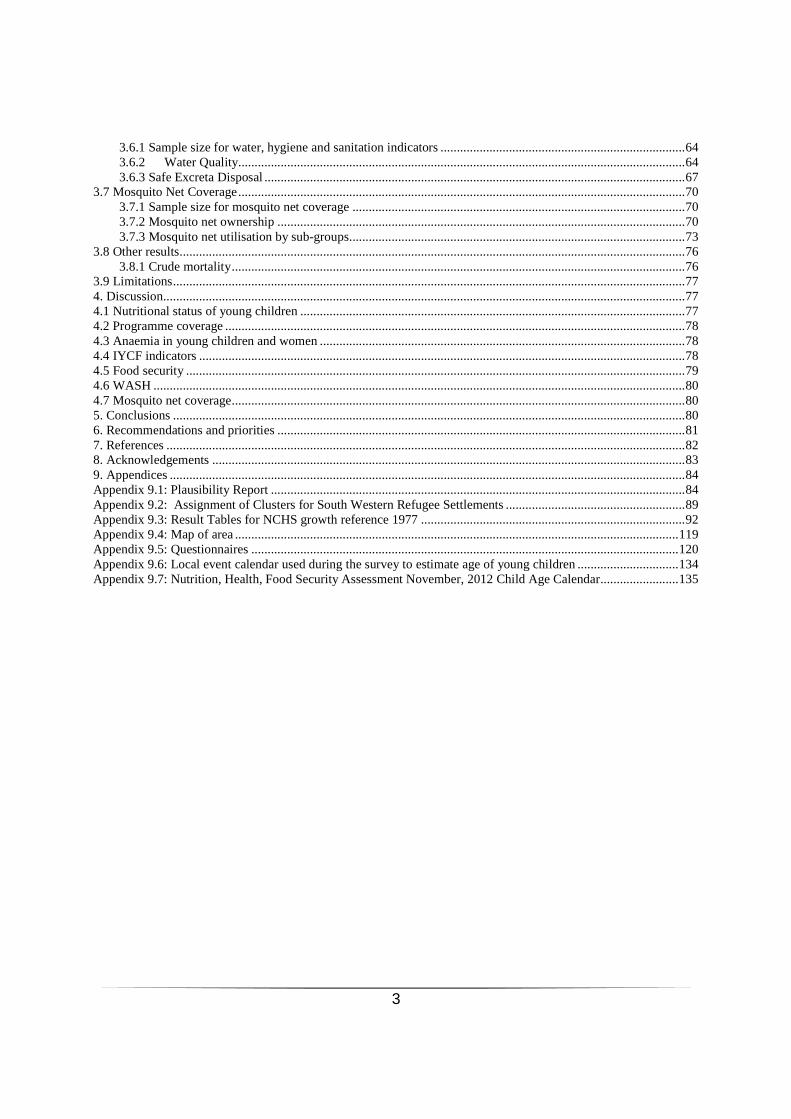
Bottle feeding 7.5%
(2.6-12.4) 7.1%
(1.2-13.1) 10.3%
(6.8-13.8) 12.7%
(4.3-21.2) 8.2%
(2.2-14.3) 36.8%
(3.0-70.7) 29.9%
(15.8-44.1)
WASH Water quality Proportion of households using improved drinking water source
99.2% (97.2-99.9%)
97.4% 94.4-99.0%
52.6% (47.7-57.5)
82.7% (78.1-86.7%)
100.0% (100.0-100%)
100.0% (100-100)
100.0% (100-100%)
Proportion of households that use a covered or narrow necked container for storing their drinking water
28.3% (22.8-34.3)
40.3% (33.9-46.9)
28.2% (24.0-32.8)
31.1% (26.5-36.1)
37.1% (29.8-44.9)
23.8% (18.5-29.8)
40.1 % (35.3-45.0)
Water quantity Proportion of households that use:
Average quantity of water available per person / day ≥ 20 litres
≥ 20 lpppd 19.3
(14.6-24.7) 29.0
(23.2-35.3) 6.5
(4.4-9.5) 20.2
(16.3-24.7) 45.2
(37.5-53.1) 64.1
(57.6-70.2) 54.3
(49.3-59.3)
15 - <20 lpppd 10.8
(7.3-15.4) 16.5
(11.9-21.9) 8.2
(5.8-11.4)
10.2 (7.4-13.9)
19.9 (14.1-26.8%)
21.4 (16.3-27.2)
20.6 (16.8-24.9)
<15 lpppd 69.9
(63.8-75.5) 54.5
(47.9-61.10 85.2
(81.4-88.4) 69.5
(64.6-74.2) 34.9
(27.7-42.7) 14.5
(10.3-19.70 25.1
(21.0-29.6) Proportion of households taking <30 minutes to collect their main drinking water
70.5 (64.2-76.3)
50.7 (43.8-57.6)
29.5 (25.1-34.3)
42.3 (37.1-47.5)
91.3 (86.0-95.0)
18.5 (11.7-27.1)
72.7 (68.0-76.9)
Satisfaction with drinking water supply Proportion of households that say they are satisfied with drinking water supply
79.5 (74.0-84.4)
53.5 (46.8-60.2)
20.2 (16.5-24.5)
43.4 (37.8-49.1)
86.5 (80.5-91.3)
20.2 (15.1-26.1)
77.1 (72.6-81.0)
Safe excreta disposal Proportion of households using an improved excreta disposal facility
54.7 (45.4-63.9)
21.7 (8.2-35.3)
12.0 (6.4-17.5)
18.2 (7.5-28.8)
44.1 (34.5-53.6)
0.4 (-0.4-1.3)
18.4 (4.2-32.5)
Proportion of HH using a shared family toilet
8.1 (3.2-12.9)
4.8 (0.3-9.2)
5.9 (2.1-9.6)
2.8 (0.4-5.2)
44.1 (28.7-59.5)
0.9 (-0.5-2.3)
6.6 (0.5-12.8)
Proportion of HH using a communal toilet
2.0 (0.3-3.7)
1.3 (0.7-3.3)
3.4 (0.1-6.9)
1.8 (0.0-3.7)
11.9 (0.7-24.4)
1.7 (0.4-3.9)
2.6 (0.0-5.1)
Proportion of HH using an unimproved toilet
35.2 (26.1-44.4)
72.2 (55.5-88.9)
78.8 (69.8-87.8)
77.2 (65.6-89.0)
0.0 (0.0-0.0)
97.0 93.9-100.1
72.4 (57.9-87.0)
Proportion of HH with 90.1 94.7 94.6 97.1 93.6 95.6 88.3

10
children <5 yrs disposing of faeces safely
(84.5-95.7) (89.8-99.6) (91.6-97.6) (94.4-99.8) (84.8-102.3) (90.4-100.8 (75.6-100.9
MOSQUITO NET Mosquito net ownership Proportion of HHs owning at least one LLIN
34.6 (28.8-40.8)
33.2 (27.1-39.7)
15.1 (11.9-18.9)
29.0 (24.5-34.0)
13.4 (8.7-19.4)
62.4 (55.8-68.6)
38.6 (33.9-43.5)
Target of >75%
Average number of persons per LLIN
9.6 12.1 24.5 12.4 25.5 5.2 7.0 1.8 persons per LLIN
Mosquito net utilisation Total HH members (all ages) who slept under an LLIN
24.2 21.5 9.4 23.5 9.8 44.7 29.5
Children 0-59 months who slept under an LLIN
29.0 27.4 12.0 25.6 21.6 57.3 30.1
Pregnant women who slept under an LLIN
25.0 39.6 25.3 21.0 39.1 56.3 27.1
Indoor residual spraying Indoor Residual Spraying HH Coverage
2.0 (0.6-4.5)
1.3 (0.3-3.7)
7.7 (5.4-10.7)
1.1 (0.3-2.9)
0.0 (0-0)
2.0 (0.6-4.5)
5.0 (3.2-7.7)
ANTENATAL AND FAMILY PLANNING
Antenatal attendance for pregnant women
90.5%
(69.6-98.8) 71.4%
(55.4-84.3)
78.1% 940.8-66.9)
54.1% 940.8-66.9)
76.5% (50.1-93.2)
81.0% (58.1-94.6)
75.0% (59.7-87.6)
Women receiving iron-folic acid pills through ANC clinics
89.5% (66.9-98.7)
58.1% (33.7-82.5)
69.8% (57.0-80.8)
46.7% (33.7-60.0)
70.6% (44.0-89.7)
61.5% (44.6-76.6)
66.7% (45.2-88.2)
Reported use of contraceptives among pregnant women
17.2%
(5.8-35.8) 21.4%
(10.3-36.8)
38.1% (26.1-51.2)
1.7% (0.0-8.9)
47.1% (23.0-72.2)
4.8% (0.1-23.8)
10.3% (2.0-24.2)
11
1. Introduction Several refugees from mainly Democratic Republic of Congo (DRC), Rwanda, Somalia, Southern Sudan and Burundi have sought asylum in Uganda. This has been due to prolonged insurgency and cross boarder conflicts in their home countries. In response, Uganda Government has designated South West and West Nile sub regions for settlement of these refugees. At the moment, the continuous escalation of insurgence in DRC has further led to influxes of refugees into the South West sub-region. The refugees are distributed mainly in settlement camps of Rwamwanja, Nakivale, Oruchinga, Kyaka and Kyangwali in South West and West Nile camps of Adjumani, Kiryandongo and Rhino camp. These settlements are long-term settlements with people having lived there for up to eighteen years. Many inhabitants have been allocated plots of land for cultivation and there are community services including primary schools, medical centers and community centers. The settlements are under the jurisdiction of the Office of the Prime Minister (OPM) of Uganda with UNHCR providing protection and programming. Nakivale refugee settlement (Nakivale) is located in western Uganda on 86 square kilometres of land, approximately 60 kilometres south of Mbarara town. Nakivale refugee settlement was created in 1960 in response to an influx of Rwandese Tutsi refugees fleeing the Hutu regime that had taken power in Rwanda. This area has nowadays hosted varying numbers of refugees from a diversity of nationalities since this time. Today the population at Nakivale is approximately 62,849. In close proximity to Nakivale is Oruchinga settlement. Oruchinga Refugee Settlement is located in Isingiro district 20 kilometres from the Tanzanian border. The government of Uganda and the UNHCR established the settlement between 1959 and 1961, when Uganda experienced the arrival of thousands of Rwandese Tutsis fleeing ethnic violence. The population (5,694) mainly constitutes Rwandese with a few Burundians. Kyaka II and Rwamwanja refugee settlements are a few kilometers away from each other and found in south western Uganda. Kyaka II refugee settlement (Kyaka) is located on 81 square kilometres of land, approximately 70 kilometres by road from the town of Mubende. It was opened in the 1950s to accommodate thousands of Tutsi people fleeing Rwanda. Many of these people stayed at Kyaka until 1994 when it became safe to return to Rwanda. Since 1994, Kyaka has hosted primarily Congolese refugees and Rwandese refugees of Hutu origin. Today the population at Kyaka is 16,414. Rwamwanja refugee camp is located in Nkoma Sub County in Kamwenge District, South West of Uganda. The camp is situated on 41.9 sq miles of land with each refugee household allocated 1.25 acres for housing and agriculture. The camp was originally inhabited by Rwandese refugees who returned home after the insurgence in Rwanda had sub-sided. It was re- opened in April 2012 to handle high numbers of refugees from the Democratic Republic of Congo. It has an estimated population of 22, 948. Kyangwali Refugee Settlement is also located in Western Uganda, 80 km from Hoima town. Kyangwali hosts approximately 21,957 mostly Congolese and Sudanese refugees. Rwandese, Burundians, Somalis, and Ethiopians are minority refugees in Kyangwali. Kiryandongo Refugee Settlement is located in the north-eastern corner of Uganda’s Masindi district. It was established in 1990 and hosts mostly Sudanese Refugees. The Settlement is well established with land divided into plots on which people have built houses and have cultivated crops on a small scale. In addition, Adjumani and Rhino camp are in West Nile part of Uganda.

12
According to 2011 Food Security and Nutrition Assessment, the Global Acute Malnutrition (GAM) rate for South West Uganda was at 3.8 %. Levels of underweight were within acceptable levels in all the settlement groupings. The rate of stunting was serious although much lower compared to a stunting rate of the host population of 49.6% as reported in the 2006 Demographic Health Survey. The rates of anaemia were above the severe public health threshold of 40% in Kyaka II and Kyangwali (48.4%). However, the Anaemia rates in children 6 to 59 months and women (15 to 49 years) in Oruchinga and Nakivale were below the threshold. Food aid assistance programme accounts for between 40 and 60% of the recommended daily allowances (RDA) for the population living in the refugee settlements of Uganda. New arrivals and extremely vulnerable groups continue to receive 100% food ration. According to recent findings, the mean food consumption score for all settlement groups was well above the threshold for acceptable food consumption. A small proportion of households (8-13%) across all settlement groups had Poor Food Consumption compared to the majority of households (56-76%) who had acceptable Food consumption. Protein energy malnutrition is therefore not uncommon in refugee settlements. Micronutrient deficiency is, however, still exceedingly prevalent among a sizeable proportion of refugees because of the insufficient dietary sources. The most prevalent micronutrient deficiency disorder among refugees is iron deficiency anaemia and vitamin A deficiency. Almost 50% of children and 35% of mothers are estimated to suffer from iron deficiency anaemia. However, while acute malnutrition is within the threshold, the rate of anaemia for children under five still remains above the emergency threshold (40%) and is a public health emergency. Dietary food inadequacies in refugee settlements are mainly because the population depends on subsistence agriculture, stemming from inadequate cultivable land, and food aid from international agencies. Malaria and acute respiratory infection (ARI) account for the highest rates of childhood illnesses. The proportion of malaria and ARI among children two weeks prior to the recent survey was 85.4% and 72.7% respectively. The incidences of respiratory infection and diarrhoea result from crowded conditions and inadequate sanitation and hygiene. Additionally, programme coverage in refugee settlements reveal that measles vaccination and vitamin A supplementation at present are below the national recommended levels (90%). Infant and young child feeding practices as well as breastfeeding practices amongst the refugee population are inappropriate which pauses a major challenge to adequate health care. 1.1 Survey Objectives General objective: To assess indicators of health, nutrition, food security and retrospective mortality in the refugee settlements in order to generate information for improved programme and policy interventions. Specific objectives are to: 1. Measure the prevalence of acute malnutrition in children aged 6-59; 2. Measure the prevalence of stunting in children aged 6-59 months; 3. Measure the prevalence of anaemia in children aged 6-59 months and in women of
reproductive age between 15-49 years (non-pregnant);

13
4. Determine the levels of retrospective morbidity in children aged 6- 59 months; 5. Determine the coverage of measles vaccination among children aged 9-59 months (or
context-specific target group e.g. 9-23 months); 6. Assess infant and young child feeding practises as well as breast feeding practises (specific
target group of 0 – 23 months); 7. Determine the coverage of vitamin A supplementation received during the last 6 months
among children aged 6-59 months; 8. Determine the levels of retrospective crude mortality rates and age specific mortality rates for
under-5s in a specific time period; 9. Determine the coverage of ration cards and the duration the general food ration lasts for
recipient households; 10. Collate available information on the performance of the food aid system; 11. Determine the population’s access to, and use of, improved water, sanitation and hygiene
facilities. 12. Determine the utilisation of mosquito nets (all types) by the total population, children 0-59
months and pregnant women.

14
2. Methodology Two-stage cluster sampling technique was employed in this survey. Guidelines outlined in the UNHCR SENS manual for Standardized Expanded Nutrition Surveys for Refugees and SMART methodology (April 2006) for Emergency Nutrition Assessment (ENA) for measuring mortality and nutrition in crisis situations was used for sample size determination, cluster selection and sampling. Villages with clusters within the total population were selected randomly according to their sizes based on systematic sampling technique outlined in SENS guide 2.1 Sample Size The calculation of sample size/or sample size determination was based on the 2011 survey report conducted in Refugee settlements. ENA for SMART (Ver. Oct 2012) planning screen was use to calculate the sample (details in 2.1.1 and 2.1.2). 2.1.1 Sample size for children aged 6 to 59 months The sample size for children aged between 6 to 59 months was calculated based on GAM rate for previous assessment in refugee settlements (UNHCR/WFP comprehensive Food Security and Nutrition Survey report, 2011). A design effect of 2 and desired precision of 1.5 percent was used. The computed sample size was increased by 10% to carter for error. 2.1.2. Sample size for women of reproductive age (15 – 49years) The sample size was calculated using the prevalence of malnutrition among women of reproductive age from 2011 nutrition survey report. A design effect of 2 was used in the calculation of the sample size based on the SMART Guideline. A precision of 4% was used to generate the sample size plus a 10% refusal. 2.1.3 Sample size for measurement of Anaemia The sample size for children under five was based on an assumed prevalence of anaemia of 38.7% in South west settlements and 60.3% in West Nile, a desired precision of 4.5%, a design effect of 1.5, and 10% refusal. The sample size generated from ENA for SMART computer software included a 10% refusal. Sample size for women of reproductive age was similarly computed. 2.2 Sampling procedure: selecting clusters A random number between zero and the sampling interval was identified using the random table of numbers to identify the first cluster. This number was subsequently systematically added to the cumulative population to identify the remaining clusters until required numbers of clusters were obtained. 2.3 Sampling procedure: selecting households and individuals The team with the help of a local leader or guide identifies using the available HH list systematically surveyed the HHs and all eligible children surveyed. Since villages are geographically large, a random number between 3 and 10 (inclusive) was drawn to select the first village. The next village was then systematically selected and every nth household was picked according to the obtained sampling interval. The procedure was continued until the required
15
number of children was selected. This was done to provide an equal chance to every household of being selected and reduce bias. 2.3.1 Selection of children (6 to 59 months) All children within the age range of 6 to 59 months in the sampled household were eligible to be included in the sample for measurement. Households without children were also included in the survey as they had been included in the sampling plan. Physically disabled children were excluded from the survey to avoid inaccurate or mis-representation of data. Only those with a height or length between 65 and 120 cm were included in the survey. 2.3.2 Selection of women (15 to 49 years) All women within the age range of 15 to 49 years in the sampled household were included in the sample for measurement. However, pregnant women and those with visible oedema were excluded from the survey. Households without women of reproductive age were also included in the assessment since they had been included in the sampling plan. Replacement clusters were included in the plan to cater for non-responding households. 2.4 Questionnaire and Measurement Methods Quantitative data was collected using six forms of questionnaires based on the SENS module: anthropometric data collection form, anaemia, infant and young child feeding practices, food security, mosquito coverage, WASH. While mortality data is collected from the HIS report from the partners implementing health and nutrition programme in the refugee settlements. Questionnaires were administered to the selected households with or without eligible women or children under five years old. One set of structured questionnaires, that is Child Health and anthropometric; women (15-49 years); household health; food Security, mosquito net were administered in each selected household. Questionnaires were prepared in English and presented in English. Qualitative data was obtained through Focus group discussions in villages. The Focus Group comprised of village leaders, household heads and child caregivers from selected villages. Members of focus groups were selected by the village leaders. Households taking part in FGDs were randomly selected and excluded those households from which an index child had been selected for anthropometric measurements. Anthropometric (height, weight, MUAC) data was obtained by measuring using a set of equipment; height board for length/height, UNICEF solar scale for weight, MUAC tapes for mid upper arm circumference. Since data on the participants’ ages was not always available due to absence of child health cards, age was determined through discussions with the heads of households using age and local events calendars. In such cases, children were included in the survey based on height cut-offs. 2.5 Case definitions, inclusion criteria and calculations 2.5.1 Variables collected Age: The exact age of the child in months was obtained using the information from health cards, age calendar, local events calendar and age calculating chart as well as height cut-offs of children between 60 cm and 120 cm.

16
Sex: Sex was recorded as 1: male or 2: female. Weight: With minimum clothing on the child, weighing was done using the UNICEF Solar Scale and expressed in kilograms (kg) to the nearest 100 grams (g). Height or length: Children above the age of two years were measured standing upright, whereas those aged below two years or ≤85 cm had their recumbent length taken to the nearest 0.1cm. Where age of the child was difficult to determine, those found measuring less than 85 centimetres (cm) were measured while lying down and those taller than 85 cm were measured standing upright. Height and length were expressed in cm, to the nearest 0.1 cm. Bilateral Pitting Oedema: Oedema was diagnosed by placing medium thumb pressure on the upper side (dorsal) of the foot, for three seconds. Oedema was considered to be present if a skin depression remained on both feet after the pressure was released. Infant Feeding Practice: Exclusive breast feeding practices were assessed for children below 2 years. Continued breast-feeding and current feeding practices for the selected children (6-59 months) was also assessed using IYCF questionnaire on children 0-23 months. Measles Vaccination Coverage (children aged 6 to 59 months): Mothers were asked for the vaccination or child Health card of the selected child. Where no vaccination card was available, the mothers were asked to provide the measles immunization history of the child. De-worming: Mothers or caregivers were asked if the selected child had been given Mebendazole, albendazole or Zentel within the previous 6 months. Reference to the size of the tablets was made while asking if any was taken, otherwise health information was used. Dietary Diversity: Households were interviewed through Focus Group Discussions (FGDs) to establish their sources of food. Vitamin A supplementation: Mothers or caregivers were asked if the children had received any Vitamin A capsules within the previous 6 months. Reference was made of the colour of red and blue Vitamin capsule. Sources of Water: Caregivers were asked to answer questions regarding their households’ access to different water sources. The distance to the major water source was determined. The amount of water used by individual households was estimated, computed and compared to the UNHCR standards (20 Litres/ person/day). Sanitation: Caregivers were asked if the household member used a latrine or not. If they shared with other households, they would be asked to approximate number of households that used a stance. Observation of the physical presence and it’s functionally of the latrine was also made. This was compared to the UNHCR standards of 20 persons/ stance to determine extent of access and use of latrines.

17
Health care services (access and availability): Access to health centres was assessed in terms of choice of health facility during illness. Number, availability and quality/type of health care staff within villages were investigated through the FGDs. In addition, the coverage of ITNs and use was assessed. Anaemia: Measurement of haemoglobin was performed in households using a portable photometer ‘HeamoCue HB301 for both children and women. Feeding centre coverage: Households were asked whether they had any child registered on either supplementary or therapeutic feeding programmes; and mothers/children registered on MCHN program. Through the FGD, information on frequency of general food distribution was also obtained. Retrospective mortality: Smart guidelines on mortality were adopted and used in data collection. Information on total number of individuals, children (<5 years), births, visitors and deaths in the last 3 months prior to the Assessment in the household were obtained. Crude Mortality and the Under Five Mortality Rates were then computed directly by the ENA software. 2.6 Classification of public health problems and targets 2.6.1 Acute Malnutrition: Weight-for-Height Index 1 Acute malnutrition was estimated from the weight-for-height (WFH) index values combined with the presence of oedema. The weight for height- Z scores and percent of median were obtained using WHO, 2006 reference values. Expression in Z-score has true statistical meaning and allows inter-study comparison. Table 2: Expression of Cut-off values for the results
Indicator Expressed in Z-score Severe acute malnutrition (SAM) WFH < -3 SD and/or existing bilateral oedema Moderate acute malnutrition (MAM) WFH < -2 SD and ≥ -3 SD and the absence of oedema Global acute malnutrition (GAM) WFH <-2 SD
2.6.2 Chronic Malnutrition: Height-for-Age Index 5 Table 3: Classification of severity of severe and chronic malnutrition Severity of malnutrition Acute WFH <-2 z-scores Chronic malnutrition, HFA<-2z-scores Acceptable (%) <5 <20 Poor (%) 5-9 20-29 Serious (%) 10-14 30-39 Critical (%) ≥15 ≥40
1 WHO Growth Standards, 2006

18
2.6.3 Malnutrition for women of reproductive age Table 4: International classification of adult underweight according to BMI (kg/m2) Classification Principal cut-off point Severe thinness <16.00 Moderate thinness 16.00 – 16.99 Mild thinness 17.00 – 18.49 2.6.4 Cut-off-point for defining Anaemia23 Table 5. Categories of Anaemia using haemoglobin levels
Age/sex group Categories of anaemia (Haemoglobin levels g/dl) Total Mild Moderate Severe
Children 6 – 59 months <11.0 10.9 – 10.0 9.9 – 7.0 <7 women of reproductive age 15 – 49 years
<12.0 11.9 – 11.0 10.9 – 8.0 <8
Pregnant women <11.0 10.9 – 10.0 9.9 – 7.0 <7 2.6.5 Morbidity This was estimated from the number of reported cases of the illnesses over the past two weeks prior to the survey and was computed as follows: Prevalence of disease = Number of children reporting illness x 100 Total number of children (6-59 months) 2.7 Training, coordination and supervision 2.7.1 Survey Teams and Supervision The survey team was composed of an overall coordinator, Data analysts, data entrants, Field supervisors, Enumerators and Guides. The survey teams worked closely with the Office of the Prime Minister (OPM), UNHCR field staff, implementing partners and other key stakeholders in the locality. 2.7.1.1 Roles and responsibilities Overall coordinator: The nutrition consultant was responsible for overseeing implementation of all the planned activities, management of resources and linking the organization to the Ministry of Health, Districts, implementing partners and other agencies. In addition, the coordinator procured the logistics and equipment that were required for effective implementation of the survey. 2 The management of nutrition in major emergencies, WHO, 2000 3 Values are given for a population living at sea level. The correct for altitude, add 1.0 g/liter for each 100m above 1000m altitude, up to 3000m

19
National Supervisors: These were responsible for all field operations and mobilization of logistics for the exercise. They were also tasked with supervision of data collection, editing questionnaires handed over by the district supervisors, ensuring quality control and spot checking during household interviewing. They ensured that interviews were conducted with eligible respondents and together with the district supervisors’ did a spot check on all questionnaires completed each day for completeness and consistency. They were also responsible for meeting team members to discuss problems faced and how best such problems could be addressed as well as conducting Key Informant Interviews. District Supervisors: These were responsible for introducing teams to ward/zone leaders, assisting team members in identifying selected households and also ensuring that enumerators had the necessary supplies for each day. They were in charge of monitoring the performance of the enumerators during the survey exercise as well as conducting interviews. They were also responsible for collecting all questionnaires, checking them for consistency and accuracy on a daily basis before leaving the field and then delivering them to the National supervisors. They were also responsible for conducting FGDs. Supervisors were either Nutritionists, Food Scientists or a public health graduate. Enumerators: These were responsible for locating selected zones/wards, households and identifying the respondents. They conducted the interviews using the questionnaires provided, carried out anthropometric measurements and worked with supervisors to resolve any inconsistencies that arose while in the field. Data entrants: They were responsible for entering and cleaning of data collected every day. Data analyst: Was responsible for editing, cleaning and analyzing the data collected. Office of the Prime Minister: The OPM mobilized local leaders, district staff and other partners and ensured a good working relationship between the survey team, local government officials and the community. Community Leaders: These included LCs, health workers and civil society organizations. They were responsible for mobilizing the community in preparation for implementation of the survey. Guides: They led and introduced the survey team to the selected households. 2.7.2 Training Training of Research Assistants The National supervisors together with the research assistants (data collectors) underwent a three days training in using SENS guideline and ENA for SMART software, the six (6) SENS modules

20
data collection questionnaires, the anthropometric equipment and sampling methodology. The methods employed for training included presentation, instruction and role-play. The training included the role of each person in the survey, an overview of the methodology, measurement and interview techniques. Data entrants were trained by a statistician. Enumerators underwent a two-days training at the base camps of respective refugee settlement to ensure quality data collection and they capacity. A field activity guideline manual developed by the consultant team was used to remind enumerators on the tasks in the field. The training modules included: background theory on nutrition, malnutrition, its causes and anthropometry; accuracy and precision of nutrition assessment techniques; an overview of the methodology, measurement and interview techniques, a standardization of measurement exercise for both anthropometry and haemoglobin measurements as well as a pilot test in settlement camps. The National team discussed the focus group guide together with district supervisors during the training. Standardization test for anthropometric measurements was performed for each team. Standardization of the language (words) used for specific questions in the questionnaires was also done. Interviewers for the FGDs were selected based on their person-to-person interviewing skills during the role play and the training session. 2.8 Data Management and Analysis 2.8.1. Data Management Questionnaires were edited every day. The supervisors reviewed and edited the questionnaires with the enumerators. The anthropometric data was entered each day in the ENA spread sheet for easy monitoring and identification of gaps. Errors and mistakes were communicated to the data collectors the following day to enable them improve on their data collection skills. The supervisors also reviewed the other parts of the questionnaires and the identified mistakes were corrected. Well edited filled in questionnaires were then sent for entry. Nutrition and mortality data was entered in the ENA software, while the rest of the data was entered in the programme for each SENS module in excel format. Focus group discussions and key informant interviews were coded and summarized by the data analyst and later used to supplement the quantitative findings. 2.8.2. Data Analysis Anthropometric data collected from the field was entered directly into ENA for SMART software package (latest ver. Of Oct 2012) by four AFC data entrants. Plausibility check was performed on each data set of settlements and analysis automically generated using WHO 2006 standard. The data from other modules are imported into EPIINFO 3.4.3. and analysis performed for each recommended indicators and exported to save the file. The AFC technical team and partnering technical advisors compiled the final report for each settlement surveyed.
21
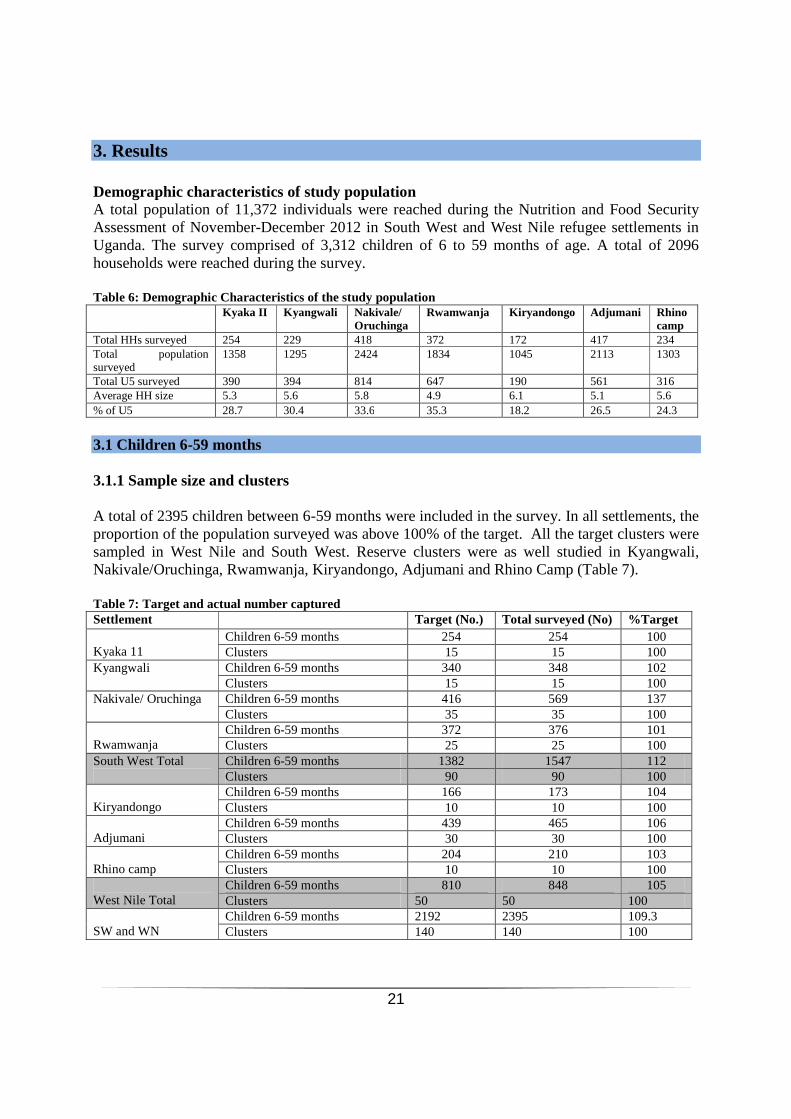
3. Results Demographic characteristics of study population A total population of 11,372 individuals were reached during the Nutrition and Food Security Assessment of November-December 2012 in South West and West Nile refugee settlements in Uganda. The survey comprised of 3,312 children of 6 to 59 months of age. A total of 2096 households were reached during the survey. Table 6: Demographic Characteristics of the study population Kyaka II Kyangwali Nakivale/
Oruchinga Rwamwanja Kiryandongo Adjumani Rhino
camp Total HHs surveyed 254 229 418 372 172 417 234 Total population surveyed
1358 1295 2424 1834 1045 2113 1303
Total U5 surveyed 390 394 814 647 190 561 316 Average HH size 5.3 5.6 5.8 4.9 6.1 5.1 5.6 % of U5 28.7 30.4 33.6 35.3 18.2 26.5 24.3
3.1 Children 6-59 months 3.1.1 Sample size and clusters A total of 2395 children between 6-59 months were included in the survey. In all settlements, the proportion of the population surveyed was above 100% of the target. All the target clusters were sampled in West Nile and South West. Reserve clusters were as well studied in Kyangwali, Nakivale/Oruchinga, Rwamwanja, Kiryandongo, Adjumani and Rhino Camp (Table 7). Table 7: Target and actual number captured Settlement Target (No.) Total surveyed (No) %Target Kyaka 11
Children 6-59 months 254 254 100 Clusters 15 15 100
Kyangwali Children 6-59 months 340 348 102 Clusters 15 15 100
Nakivale/ Oruchinga Children 6-59 months 416 569 137 Clusters 35 35 100
Rwamwanja
Children 6-59 months 372 376 101 Clusters 25 25 100
South West Total
Children 6-59 months 1382 1547 112 Clusters 90 90 100
Kiryandongo
Children 6-59 months 166 173 104 Clusters 10 10 100
Adjumani
Children 6-59 months 439 465 106 Clusters 30 30 100
Rhino camp
Children 6-59 months 204 210 103 Clusters 10 10 100
West Nile Total
Children 6-59 months 810 848 105 Clusters 50 50 100
SW and WN
Children 6-59 months 2192 2395 109.3 Clusters 140 140 100

22
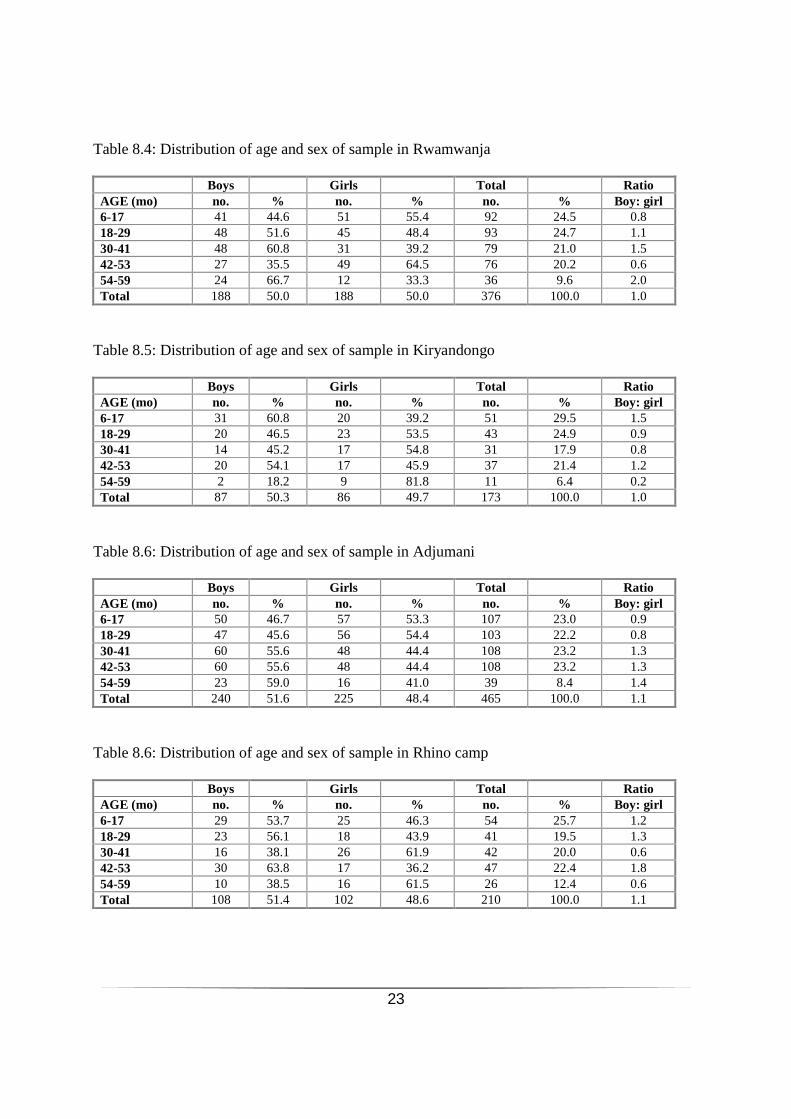
3.1.2 Distribution of age and sex In Kyaka II, Adjumani, Kyangwali and Rhino camp Settlements the percentage ratio of boys to girls surveyed was 1.1. In other settlements; Nakivale/Oruchinga, Kiryandongo and Rwamwanja the percentage ratio was 1.0. Apart from Nakivale/Oruchinga where the percentages of females (50.4%) were slightly more than males (49.6%), other settlements with the exception of Rwamwanja (equal percentages), the boys were slightly more than girls. The age category of 6 to 17 months presented the highest proportion while that between 54 to 59 months were the lowest in most camps (Table 8). Table 8. Distribution of age and sex of sample in Settlements Exclusion of z-scores from Observed mean SMART flags: WHZ -3 to 3; HAZ -3 to 3; WAZ -3 to 3 Table 8.1: Distribution of age and sex of sample in Kyaka II Boys Girls Total Ratio
Age (mo) no. % no. % no. % Boy: girl 6-17 28 45.2 34 54.8 62 24.4 0.8 18-29 32 55.2 26 44.8 58 22.8 1.2 30-41 31 58.5 22 41.5 53 20.9 1.4 42-53 28 50.9 27 49.1 55 21.7 1.0 54-59 14 53.8 12 46.2 26 10.2 1.2 Total 133 52.4 121 47.6 254 100.0 1.1
Table 8.2: Distribution of age and sex of sample in Kyangwali Boys Girls Total Ratio AGE (mo) no. % no. % no. % Boy:girl 6-17 46 52.3 42 47.7 88 25.3 1.1 18-29 36 48.6 38 51.4 74 21.3 0.9 30-41 36 50.7 35 49.3 71 20.4 1.0 42-53 44 57.1 33 42.9 77 22.1 1.3 54-59 20 52.6 18 47.4 38 10.9 1.1 Total 182 52.3 166 47.7 348 100.0 1.1
Table 8.3: Distribution of age and sex of sample in Nakivale/Oruchinga Boys Girls Total Ratio AGE (mo) no. % no. % no. % Boy: girl 6-17 76 51.7 71 48.3 147 25.8 1.1 18-29 63 46.7 72 53.3 135 23.7 0.9 30-41 57 48.3 61 51.7 118 20.7 0.9 42-53 66 53.2 58 46.8 124 21.8 1.1 54-59 20 44.4 25 55.6 45 7.9 0.8 Total 282 49.6 287 50.4 569 100.0 1.0
23
Table 8.4: Distribution of age and sex of sample in Rwamwanja Boys Girls Total Ratio AGE (mo) no. % no. % no. % Boy: girl 6-17 41 44.6 51 55.4 92 24.5 0.8 18-29 48 51.6 45 48.4 93 24.7 1.1 30-41 48 60.8 31 39.2 79 21.0 1.5 42-53 27 35.5 49 64.5 76 20.2 0.6 54-59 24 66.7 12 33.3 36 9.6 2.0 Total 188 50.0 188 50.0 376 100.0 1.0
Table 8.5: Distribution of age and sex of sample in Kiryandongo Boys Girls Total Ratio AGE (mo) no. % no. % no. % Boy: girl 6-17 31 60.8 20 39.2 51 29.5 1.5 18-29 20 46.5 23 53.5 43 24.9 0.9 30-41 14 45.2 17 54.8 31 17.9 0.8 42-53 20 54.1 17 45.9 37 21.4 1.2 54-59 2 18.2 9 81.8 11 6.4 0.2 Total 87 50.3 86 49.7 173 100.0 1.0
Table 8.6: Distribution of age and sex of sample in Adjumani Boys Girls Total Ratio AGE (mo) no. % no. % no. % Boy: girl 6-17 50 46.7 57 53.3 107 23.0 0.9 18-29 47 45.6 56 54.4 103 22.2 0.8 30-41 60 55.6 48 44.4 108 23.2 1.3 42-53 60 55.6 48 44.4 108 23.2 1.3 54-59 23 59.0 16 41.0 39 8.4 1.4 Total 240 51.6 225 48.4 465 100.0 1.1
Table 8.6: Distribution of age and sex of sample in Rhino camp Boys Girls Total Ratio AGE (mo) no. % no. % no. % Boy: girl 6-17 29 53.7 25 46.3 54 25.7 1.2 18-29 23 56.1 18 43.9 41 19.5 1.3 30-41 16 38.1 26 61.9 42 20.0 0.6 42-53 30 63.8 17 36.2 47 22.4 1.8 54-59 10 38.5 16 61.5 26 12.4 0.6 Total 108 51.4 102 48.6 210 100.0 1.1

24
3.1.3 Anthropometric Survey
3.1.3.1 Acute malnutrition in Z-scores weight for height Levels of Global Acute Malnutrition (GAM) defined as Weight for height/Length <-2 z-scores/with or without oedema were below the critical limits of <15% for an emergency setting across all settlements. Adjumani in West Nile and Rwamwanja in South West presented the highest GAM rates of 4.6 % (3.2 - 6.6 95% C.I.) and 4.9 % (3.1 – 7.4 95% C.I.), respectively. Kiryandongo followed closely with a GAM value of 4.1 % (1.2 – 13.0 95% C.I.). Nakivale/Oruchinga combined had the lowest GAM, 2.1 % (1.1 - 4.2 95% C.I.), while other settlements had values within close range. In Kyaka and Rhino camp, girls had high GAM rates compared to boys while in other settlements; boys had a higher percentage compared to girls. Present findings when compared to previous assessments indicate a decline in acute malnutrition rates. For example in Rwamwanja the rates decreased from 5.6% to 4.9%. Such low levels of GAM could be in part attributed to own food production and food donation. Severe Acute Malnutrition (SAM) defined as Weight–for-height/length <-3 z-scores /or oedema) was below the nutritional emergency threshold of <1% in all settlements. Kiryandongo with a percentage of 0.6 (0.1-5.0 95% CI) recorded the highest level while Kyaka and Kyangwali with 0.0% recorded the lowest levels. Rwamwanja had SAM of 0.5% (0.1 – 1.9 95% CI). Overall, 3 cases of oedema were reported in all settlements with two in Rwamwanja and one in Nakivale/Oruchinga combined. Table 9: Acute malnutrition of children in Z-scores (WFH) by sex Exclusion of z-scores from Observed mean SMART flags: WHZ -3 to 3; HAZ -3 to 3; WAZ -3 to 3 Table 9.1: Prevalence of acute malnutrition based on weight-for-height z-scores (and/or oedema) and by sex for Kyaka II All
n = 251 Boys
n = 131 Girls
n = 120 Prevalence of global malnutrition (<-2 z-score and/or oedema)
(7) 2.8 % (1.0 - 7.7 95% C.I.)
(1) 0.8 % (0.1 - 6.4 95% C.I.)
(6) 5.0 % (1.6 - 14.9 95% C.I.)
Prevalence of moderate malnutrition (<-2 z-score & >=-3 z-score, no oedema)
(7) 2.8 % (1.0 - 7.7 95% C.I.)
(1) 0.8 % (0.1 - 6.4 95% C.I.)
(6) 5.0 % (1.6 - 14.9 95% C.I.)
Prevalence of severe malnutrition (<-3 z-score and/or oedema)
(0) 0.0 % (0.0 - 0.0 95% C.I.)
(0) 0.0 % (0.0 - 0.0 95% C.I.)
(0) 0.0 % (0.0 - 0.0 95% C.I.)
The prevalence of oedema is 0.0 % Table 9.2: Prevalence of acute malnutrition based on weight-for-height z-scores (and/or oedema) and by sex for Kyangwali All
n = 341 Boys
n = 179 Girls
n = 162 Prevalence of global malnutrition (<-2 z-score and/or oedema)
(9) 2.6 % (1.1 - 6.0 95% C.I.)
(7) 3.9 % (1.6 - 9.1 95% C.I.)
(2) 1.2 % (0.3 - 5.4 95% C.I.)
Prevalence of moderate malnutrition (<-2 z-score & >=-3 z-score, no oedema)
(9) 2.6 % (1.1 - 6.0 95% C.I.)
(7) 3.9 % (1.6 - 9.1 95% C.I.)
(2) 1.2 % (0.3 - 5.4 95% C.I.)
Prevalence of severe malnutrition (<-3 z-score and/or oedema)
(0) 0.0 % (0.0 - 0.0 95% C.I.)
(0) 0.0 % (0.0 - 0.0 95% C.I.)
(0) 0.0 % (0.0 - 0.0 95% C.I.)
The prevalence of oedema is 0.0 %
25
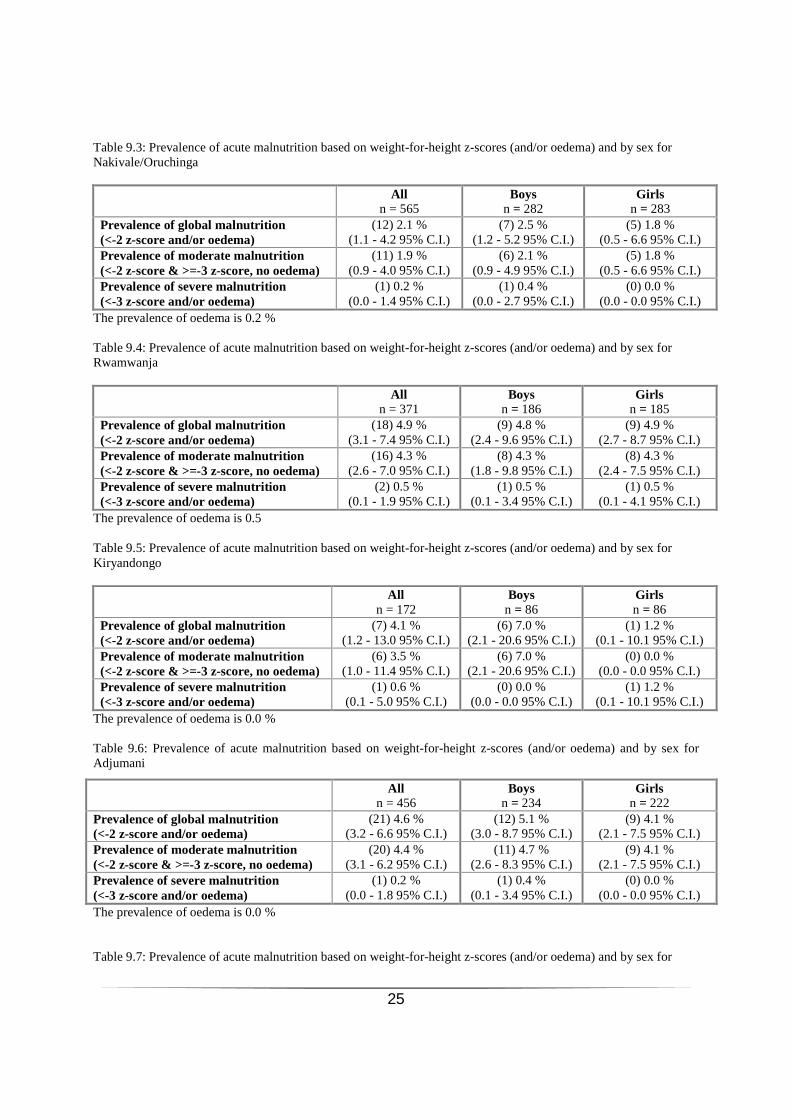
Table 9.3: Prevalence of acute malnutrition based on weight-for-height z-scores (and/or oedema) and by sex for Nakivale/Oruchinga All
n = 565 Boys
n = 282 Girls
n = 283 Prevalence of global malnutrition (<-2 z-score and/or oedema)
(12) 2.1 % (1.1 - 4.2 95% C.I.)
(7) 2.5 % (1.2 - 5.2 95% C.I.)
(5) 1.8 % (0.5 - 6.6 95% C.I.)
Prevalence of moderate malnutrition (<-2 z-score & >=-3 z-score, no oedema)
(11) 1.9 % (0.9 - 4.0 95% C.I.)
(6) 2.1 % (0.9 - 4.9 95% C.I.)
(5) 1.8 % (0.5 - 6.6 95% C.I.)
Prevalence of severe malnutrition (<-3 z-score and/or oedema)
(1) 0.2 % (0.0 - 1.4 95% C.I.)
(1) 0.4 % (0.0 - 2.7 95% C.I.)
(0) 0.0 % (0.0 - 0.0 95% C.I.)
The prevalence of oedema is 0.2 % Table 9.4: Prevalence of acute malnutrition based on weight-for-height z-scores (and/or oedema) and by sex for Rwamwanja All
n = 371 Boys
n = 186 Girls
n = 185 Prevalence of global malnutrition (<-2 z-score and/or oedema)
(18) 4.9 % (3.1 - 7.4 95% C.I.)
(9) 4.8 % (2.4 - 9.6 95% C.I.)
(9) 4.9 % (2.7 - 8.7 95% C.I.)
Prevalence of moderate malnutrition (<-2 z-score & >=-3 z-score, no oedema)
(16) 4.3 % (2.6 - 7.0 95% C.I.)
(8) 4.3 % (1.8 - 9.8 95% C.I.)
(8) 4.3 % (2.4 - 7.5 95% C.I.)
Prevalence of severe malnutrition (<-3 z-score and/or oedema)
(2) 0.5 % (0.1 - 1.9 95% C.I.)
(1) 0.5 % (0.1 - 3.4 95% C.I.)
(1) 0.5 % (0.1 - 4.1 95% C.I.)
The prevalence of oedema is 0.5 Table 9.5: Prevalence of acute malnutrition based on weight-for-height z-scores (and/or oedema) and by sex for Kiryandongo All
n = 172 Boys n = 86
Girls n = 86
Prevalence of global malnutrition (<-2 z-score and/or oedema)
(7) 4.1 % (1.2 - 13.0 95% C.I.)
(6) 7.0 % (2.1 - 20.6 95% C.I.)
(1) 1.2 % (0.1 - 10.1 95% C.I.)
Prevalence of moderate malnutrition (<-2 z-score & >=-3 z-score, no oedema)
(6) 3.5 % (1.0 - 11.4 95% C.I.)
(6) 7.0 % (2.1 - 20.6 95% C.I.)
(0) 0.0 % (0.0 - 0.0 95% C.I.)
Prevalence of severe malnutrition (<-3 z-score and/or oedema)
(1) 0.6 % (0.1 - 5.0 95% C.I.)
(0) 0.0 % (0.0 - 0.0 95% C.I.)
(1) 1.2 % (0.1 - 10.1 95% C.I.)
The prevalence of oedema is 0.0 % Table 9.6: Prevalence of acute malnutrition based on weight-for-height z-scores (and/or oedema) and by sex for Adjumani
The prevalence of oedema is 0.0 % Table 9.7: Prevalence of acute malnutrition based on weight-for-height z-scores (and/or oedema) and by sex for
All n = 456
Boys n = 234
Girls n = 222
Prevalence of global malnutrition (<-2 z-score and/or oedema)
(21) 4.6 % (3.2 - 6.6 95% C.I.)
(12) 5.1 % (3.0 - 8.7 95% C.I.)
(9) 4.1 % (2.1 - 7.5 95% C.I.)
Prevalence of moderate malnutrition (<-2 z-score & >=-3 z-score, no oedema)
(20) 4.4 % (3.1 - 6.2 95% C.I.)
(11) 4.7 % (2.6 - 8.3 95% C.I.)
(9) 4.1 % (2.1 - 7.5 95% C.I.)
Prevalence of severe malnutrition (<-3 z-score and/or oedema)
(1) 0.2 % (0.0 - 1.8 95% C.I.)
(1) 0.4 % (0.1 - 3.4 95% C.I.)
(0) 0.0 % (0.0 - 0.0 95% C.I.)

26
Rhino camp All
n = 208 Boys
n = 107 Girls
n = 101 Prevalence of global malnutrition (<-2 z-score and/or oedema)
(7) 3.4 % (1.8 - 6.3 95% C.I.)
(2) 1.9 % (0.4 - 9.0 95% C.I.)
(5) 5.0 % (2.2 - 10.9 95% C.I.)
Prevalence of moderate malnutrition (<-2 z-score & >=-3 z-score, no oedema)
(6) 2.9 % (1.5 - 5.3 95% C.I.)
(2) 1.9 % (0.4 - 9.0 95% C.I.)
(4) 4.0 % (1.7 - 8.8 95% C.I.)
Prevalence of severe malnutrition (<-3 z-score and/or oedema)
(1) 0.5 % (0.1 - 3.9 95% C.I.)
(0) 0.0 % (0.0 - 0.0 95% C.I.)
(1) 1.0 % (0.1 - 7.1 95% C.I.)
The prevalence of oedema is 0.0 % Figure 1: Trend in GAM and SAM Rates in settlement camps in SW and WN, Uganda (2010-2012)

27
Table 10: Prevalence of acute malnutrition by age, based on weight-for-height z-scores and/or oedema
Exclusion of z-scores from Observed mean SMART flags: WHZ -3 to 3; HAZ -3 to 3; WAZ -3 to 3. Table 10.1: Prevalence of acute malnutrition by age, based on weight-for-height z-scores and/or oedema for Kyaka II settlement Severe wasting
(<-3 z-score) Moderate wasting (>= -3 and <-2 z-
score )
Normal (> = -2 z score)
Oedema
Age (mo)
Total no.
No. % No. % No. % No. %
6-17 62 0 0.0 1 1.6 61 98.4 0 0.0 18-29 56 0 0.0 3 5.4 53 94.6 0 0.0 30-41 53 0 0.0 2 3.8 51 96.2 0 0.0 42-53 54 0 0.0 1 1.9 53 98.1 0 0.0 54-59 26 0 0.0 0 0.0 26 100.0 0 0.0 Total 251 0 0.0 7 2.8 244 97.2 0 0.0
Table 10.2: Prevalence of acute malnutrition by age, based on weight-for-height z-scores and/or oedema for Kyangwali Severe wasting
(<-3 z-score) Moderate wasting (>= -3 and <-2 z-
score )
Normal (> = -2 z score)
Oedema
Age (mo)
Total no.
No. % No. % No. % No. %
6-17 87 0 0.0 5 5.7 82 94.3 0 0.0 18-29 71 0 0.0 0 0.0 71 100.0 0 0.0 30-41 70 0 0.0 1 1.4 69 98.6 0 0.0 42-53 76 0 0.0 0 0.0 76 100.0 0 0.0 54-59 37 0 0.0 3 8.1 34 91.9 0 0.0 Total 341 0 0.0 9 2.6 332 97.4 0 0.0
Table 10.3: Prevalence of acute malnutrition by age, based on weight-for-height z-scores and/or oedema for Nakivale/Oruchinga Severe wasting
(<-3 z-score) Moderate wasting (>= -3 and <-2 z-
score )
Normal (> = -2 z score)
Oedema
Age (mo)
Total no.
No. % No. % No. % No. %
6-17 146 0 0.0 6 4.1 140 95.9 0 0.0 18-29 134 0 0.0 0 0.0 134 100.0 0 0.0 30-41 118 0 0.0 1 0.8 117 99.2 0 0.0 42-53 122 0 0.0 4 3.3 117 95.9 1 0.8 54-59 45 0 0.0 0 0.0 45 100.0 0 0.0 Total 565 0 0.0 11 1.9 553 97.9 1 0.2

28
Table 10.4: Prevalence of acute malnutrition by age, based on weight-for-height z-scores and/or oedema for Rwamwanja
Severe wasting (<-3 z-score)
Moderate wasting (>= -3 and <-2 z-
score )
Normal (> = -2 z score)
Oedema
Age (mo)
Total no.
No. % No. % No. % No. %
6-17 91 0 0.0 5 5.5 85 93.4 1 1.1 18-29 91 0 0.0 5 5.5 85 93.4 1 1.1 30-41 79 0 0.0 5 6.3 74 93.7 0 0.0 42-53 74 0 0.0 0 0.0 74 100.0 0 0.0 54-59 36 0 0.0 1 2.8 35 97.2 0 0.0 Total 371 0 0.0 16 4.3 353 95.1 2 0.5
Table 10.5: Prevalence of acute malnutrition by age, based on weight-for-height z-scores and/or oedema for Kiryandongo
Severe wasting (<-3 z-score)
Moderate wasting (>= -3 and <-2 z-
score )
Normal (> = -2 z score)
Oedema
Age (mo)
Total no.
No. % No. % No. % No. %
6-17 50 0 0.0 2 4.0 48 96.0 0 0.0 18-29 43 1 2.3 1 2.3 41 95.3 0 0.0 30-41 31 0 0.0 3 9.7 28 90.3 0 0.0 42-53 37 0 0.0 0 0.0 37 100.0 0 0.0 54-59 11 0 0.0 0 0.0 11 100.0 0 0.0 Total 172 1 0.6 6 3.5 165 95.9 0 0.0
Table 10.6: Prevalence of acute malnutrition by age, based on weight-for-height z-scores and/or oedema for Adjumani
Severe wasting (<-3 z-score)
Moderate wasting (>= -3 and <-2 z-
score )
Normal (> = -2 z score)
Oedema
Age (mo)
Total no.
No. % No. % No. % No. %
6-17 105 0 0.0 6 5.7 99 94.3 0 0.0 18-29 101 0 0.0 3 3.0 98 97.0 0 0.0 30-41 107 0 0.0 2 1.9 105 98.1 0 0.0 42-53 106 1 0.9 4 3.8 101 95.3 0 0.0 54-59 37 0 0.0 5 13.5 32 86.5 0 0.0 Total 456 1 0.2 20 4.4 435 95.4 0 0.0
Table 10.7: Prevalence of acute malnutrition by age, based on weight-for-height z-scores &or oedema for Rhino camp
Severe wasting (<-3 z-score)
Moderate wasting (>= -3 and <-2 z-
score )
Normal (> = -2 z score)
Oedema
Age (mo)
Total no.
No. % No. % No. % No. %
6-17 53 1 1.9 4 7.5 48 90.6 0 0.0 18-29 41 0 0.0 0 0.0 41 100.0 0 0.0 30-41 42 0 0.0 0 0.0 42 100.0 0 0.0 42-53 46 0 0.0 1 2.2 45 97.8 0 0.0 54-59 26 0 0.0 1 3.8 25 96.2 0 0.0 Total 208 1 0.5 6 2.9 201 96.6 0 0.0

29
Figure 2: Trends in the prevalence of wasting* by age in children 6-59 months
1.65.4 3.8 1.9
00
5
10
15
20
25
6-17m 18-29m 30-41m 42-53m 54-59m
Pre
vale
nce
(%
)
Age group (months)
Trend in the prevalence of wasting by age in children 6-59 months Kyaka II
Severe wasting
Moderate wasting
5.7
1.4
8.1
0
5
10
15
20
25
6-17m 18-29m 30-41m 42-53m 54-59m
Pre
vale
nce
(%)
Age group (months)
Trend in the prevalence of wasting by age in children 6-59 monthsKyangwali
Severe wasting
Moderate wasting
4.10
0.8 3.300
5
10
15
20
25
6-17m 18-29m 30-41m 42-53m 54-59m
Pre
vale
nce
(%
)
Age group (months)
Trend in the prevalence of wasting by age in children 6-59 months Nakivale/Oruchinga
Severe wasting
Moderate wasting
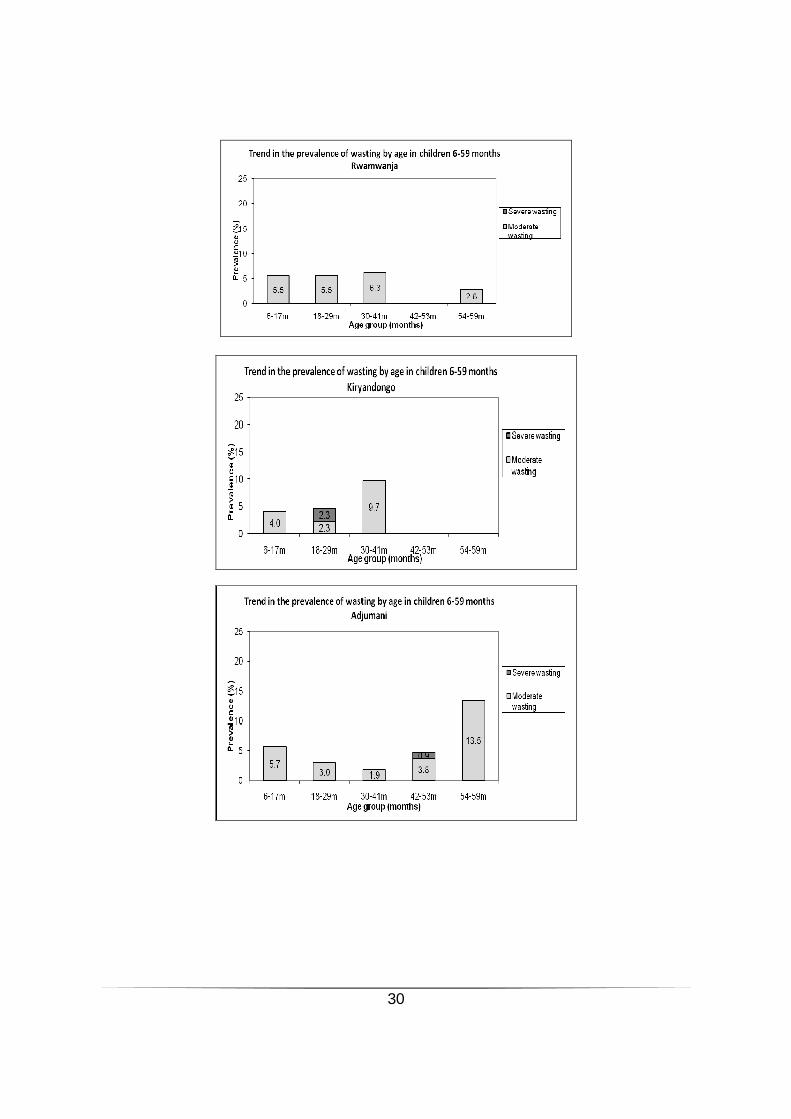
30

31
7.5
0.0 0.02.2
3.8
1.9
0.00
5
10
15
20
25
6-17m 18-29m 30-41m 42-53m 54-59m
Pre
vale
nce (
%)
Age group (months)
Trend in the prevalence of wasting by age in children 6-59 monthsRhino camp
Severe wasting
Moderate wasting
*All refugee settlements had no children with severe wasting, except Rhino camp, Kyangwali, Adjumani and Kiryandongo. Table 11: Distribution of severe acute malnutrition and oedema based on weight-for-height z-scores Exclusion of z-scores from Observed mean SMART flags: WHZ -3 to 3; HAZ -3 to 3; WAZ -3 to 3 Settlement <-3 z-score >=-3 z-score
Kyaka II
Oedema present Marasmic kwashiorkor No. 0 (0.0 %)
Kwashiorkor No. 0 (0.0 %)
Oedema absent Marasmic No. 3 (1.2 %)
Not severely malnourished No. 251 (98.8 %)
Kyangwali
Oedema present Marasmic kwashiorkor No. 0 (0.0 %)
Kwashiorkor No. 0 (0.0 %)
Oedema absent Marasmic No. 4 (1.1 %)
Not severely malnourished No. 344 (98.9 %)
Nakivale/ Oruchinga
Oedema present Marasmic kwashiorkor No. 0 (0.0 %)
Kwashiorkor No. 1 (0.2 %)
Oedema absent Marasmic No. 2 (0.4 %)
Not severely malnourished No. 566 (99.5 %)
Rwamwanja
Oedema present Marasmic kwashiorkor No. 0 (0.0 %)
Kwashiorkor No. 2 (0.5 %)
Oedema absent Marasmic No. 2 (0.5 %)
Not severely malnourished No. 372 (98.9 %)
Kiryandongo
Oedema present Marasmic kwashiorkor No. 0 (0.0 %)
Kwashiorkor No. 0 (0.0 %)
Oedema absent Marasmic No. 2 (1.2 %)
Not severely malnourished No. 171 (98.8 %)
Adjumani
Oedema present Marasmic kwashiorkor No. 0, (0.0 %)
Kwashiorkor No. 0, (0.0 %)
Oedema absent Marasmic No. 4, (0.9 %)
Not severely malnourished No. 461, (99.1 %)
Rhino camp
Oedema present Marasmic kwashiorkor No. 0 (0.0 %)
Kwashiorkor No. 0 (0.0 %)
Oedema absent Marasmic No. 3 (1.4 %)
Not severely malnourished No. 207 (98.6 %)
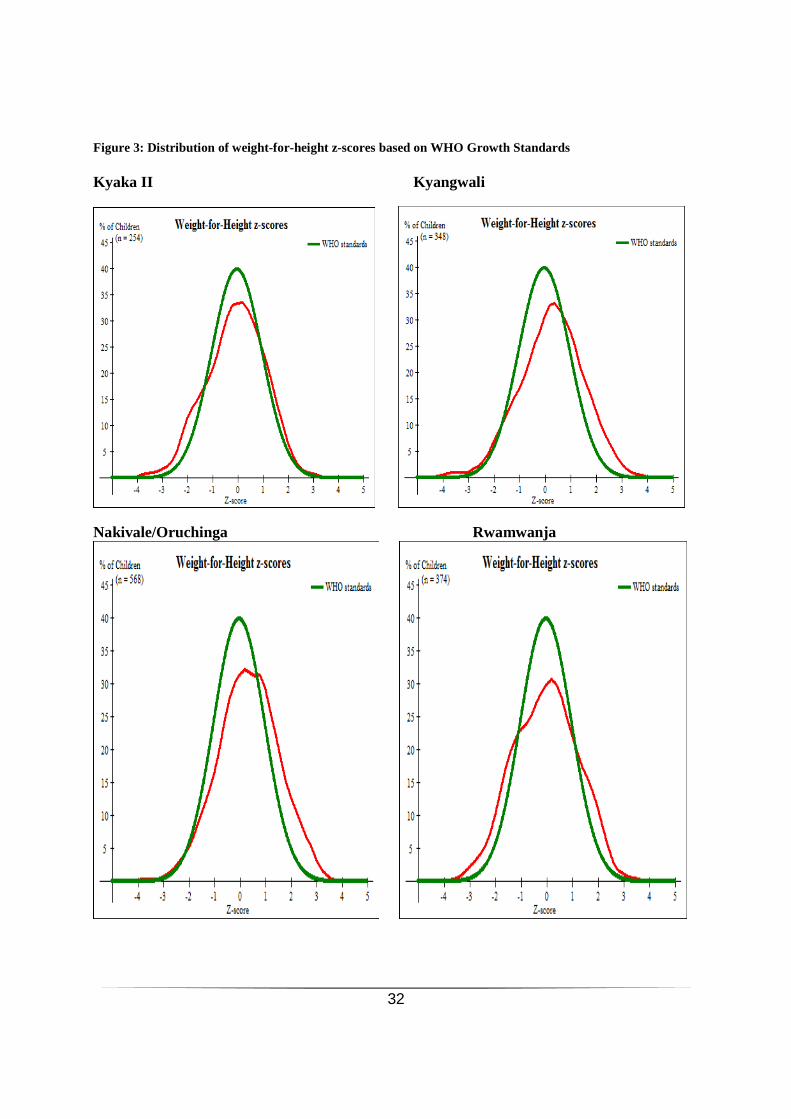
32
Figure 3: Distribution of weight-for-height z-scores based on WHO Growth Standards Kyaka II Kyangwali
Nakivale/Oruchinga Rwamwanja

33
Kiryandongo Adjumani
Rhino camp
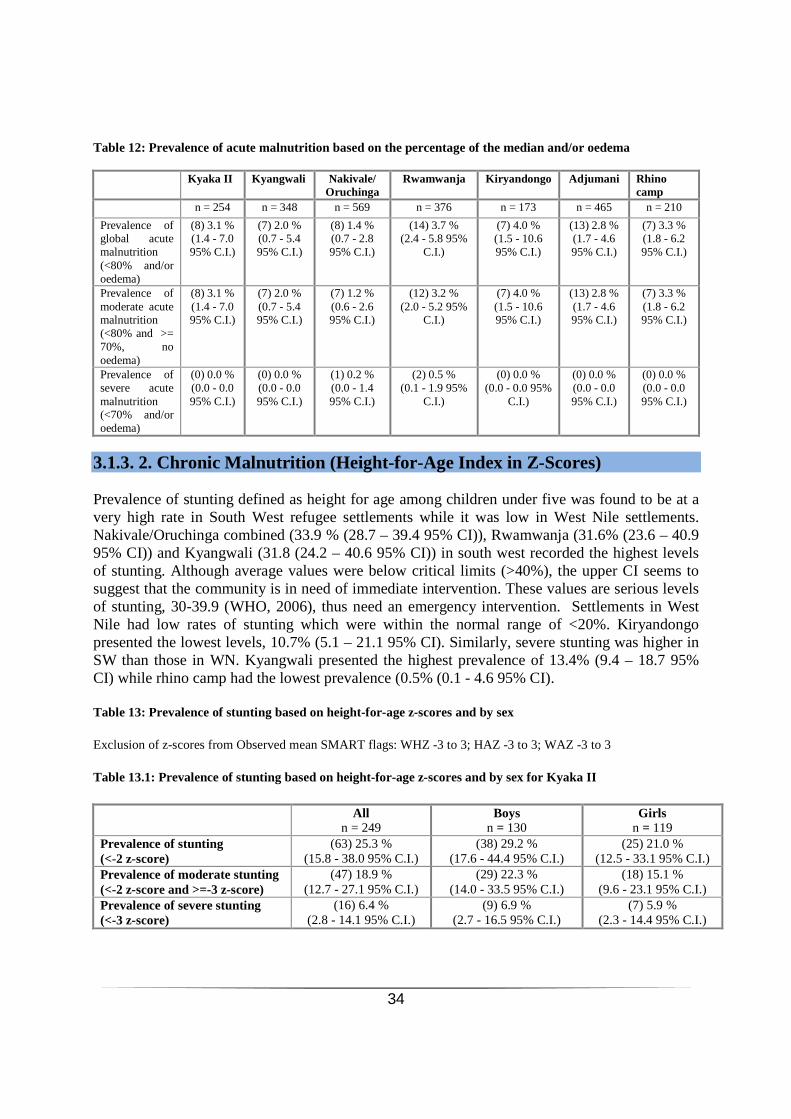
34
Table 12: Prevalence of acute malnutrition based on the percentage of the median and/or oedema
Kyaka II Kyangwali Nakivale/ Oruchinga
Rwamwanja Kiryandongo Adjumani Rhino camp
n = 254 n = 348 n = 569 n = 376 n = 173 n = 465 n = 210
Prevalence of global acute malnutrition (<80% and/or oedema)
(8) 3.1 % (1.4 - 7.0 95% C.I.)
(7) 2.0 % (0.7 - 5.4 95% C.I.)
(8) 1.4 % (0.7 - 2.8 95% C.I.)
(14) 3.7 % (2.4 - 5.8 95%
C.I.)
(7) 4.0 % (1.5 - 10.6 95% C.I.)
(13) 2.8 % (1.7 - 4.6 95% C.I.)
(7) 3.3 % (1.8 - 6.2 95% C.I.)
Prevalence of moderate acute malnutrition (<80% and >= 70%, no oedema)
(8) 3.1 % (1.4 - 7.0 95% C.I.)
(7) 2.0 % (0.7 - 5.4 95% C.I.)
(7) 1.2 % (0.6 - 2.6 95% C.I.)
(12) 3.2 % (2.0 - 5.2 95%
C.I.)
(7) 4.0 % (1.5 - 10.6 95% C.I.)
(13) 2.8 % (1.7 - 4.6 95% C.I.)
(7) 3.3 % (1.8 - 6.2 95% C.I.)
Prevalence of severe acute malnutrition (<70% and/or oedema)
(0) 0.0 % (0.0 - 0.0 95% C.I.)
(0) 0.0 % (0.0 - 0.0 95% C.I.)
(1) 0.2 % (0.0 - 1.4 95% C.I.)
(2) 0.5 % (0.1 - 1.9 95%
C.I.)
(0) 0.0 % (0.0 - 0.0 95%
C.I.)
(0) 0.0 % (0.0 - 0.0 95% C.I.)
(0) 0.0 % (0.0 - 0.0 95% C.I.)
3.1.3. 2. Chronic Malnutrition (Height-for-Age Index in Z-Scores) Prevalence of stunting defined as height for age among children under five was found to be at a very high rate in South West refugee settlements while it was low in West Nile settlements. Nakivale/Oruchinga combined (33.9 % (28.7 – 39.4 95% CI)), Rwamwanja (31.6% (23.6 – 40.9 95% CI)) and Kyangwali (31.8 (24.2 – 40.6 95% CI)) in south west recorded the highest levels of stunting. Although average values were below critical limits (>40%), the upper CI seems to suggest that the community is in need of immediate intervention. These values are serious levels of stunting, 30-39.9 (WHO, 2006), thus need an emergency intervention. Settlements in West Nile had low rates of stunting which were within the normal range of <20%. Kiryandongo presented the lowest levels, 10.7% (5.1 – 21.1 95% CI). Similarly, severe stunting was higher in SW than those in WN. Kyangwali presented the highest prevalence of 13.4% (9.4 – 18.7 95% CI) while rhino camp had the lowest prevalence (0.5% (0.1 - 4.6 95% CI). Table 13: Prevalence of stunting based on height-for-age z-scores and by sex Exclusion of z-scores from Observed mean SMART flags: WHZ -3 to 3; HAZ -3 to 3; WAZ -3 to 3 Table 13.1: Prevalence of stunting based on height-for-age z-scores and by sex for Kyaka II
All n = 249
Boys n = 130
Girls n = 119
Prevalence of stunting (<-2 z-score)
(63) 25.3 % (15.8 - 38.0 95% C.I.)
(38) 29.2 % (17.6 - 44.4 95% C.I.)
(25) 21.0 % (12.5 - 33.1 95% C.I.)
Prevalence of moderate stunting (<-2 z-score and >=-3 z-score)
(47) 18.9 % (12.7 - 27.1 95% C.I.)
(29) 22.3 % (14.0 - 33.5 95% C.I.)
(18) 15.1 % (9.6 - 23.1 95% C.I.)
Prevalence of severe stunting (<-3 z-score)
(16) 6.4 % (2.8 - 14.1 95% C.I.)
(9) 6.9 % (2.7 - 16.5 95% C.I.)
(7) 5.9 % (2.3 - 14.4 95% C.I.)
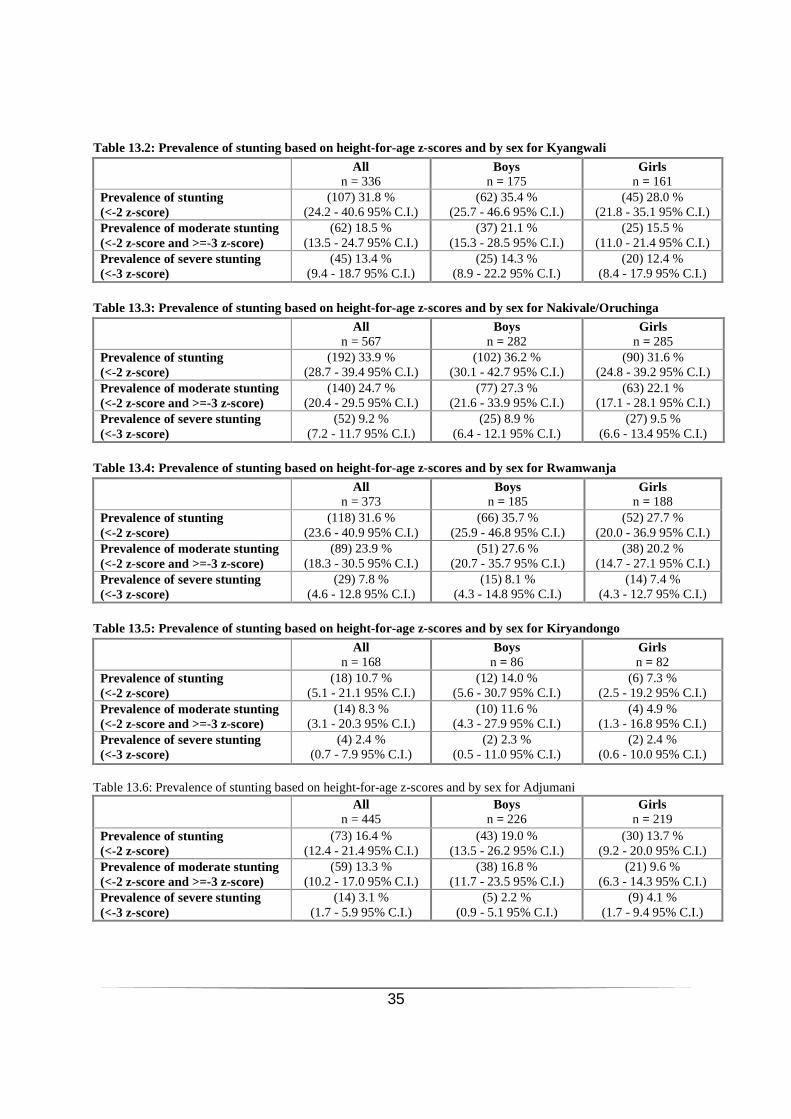
35
Table 13.2: Prevalence of stunting based on height-for-age z-scores and by sex for Kyangwali
All n = 336
Boys n = 175
Girls n = 161
Prevalence of stunting (<-2 z-score)
(107) 31.8 % (24.2 - 40.6 95% C.I.)
(62) 35.4 % (25.7 - 46.6 95% C.I.)
(45) 28.0 % (21.8 - 35.1 95% C.I.)
Prevalence of moderate stunting (<-2 z-score and >=-3 z-score)
(62) 18.5 % (13.5 - 24.7 95% C.I.)
(37) 21.1 % (15.3 - 28.5 95% C.I.)
(25) 15.5 % (11.0 - 21.4 95% C.I.)
Prevalence of severe stunting (<-3 z-score)
(45) 13.4 % (9.4 - 18.7 95% C.I.)
(25) 14.3 % (8.9 - 22.2 95% C.I.)
(20) 12.4 % (8.4 - 17.9 95% C.I.)
Table 13.3: Prevalence of stunting based on height-for-age z-scores and by sex for Nakivale/Oruchinga
All n = 567
Boys n = 282
Girls n = 285
Prevalence of stunting (<-2 z-score)
(192) 33.9 % (28.7 - 39.4 95% C.I.)
(102) 36.2 % (30.1 - 42.7 95% C.I.)
(90) 31.6 % (24.8 - 39.2 95% C.I.)
Prevalence of moderate stunting (<-2 z-score and >=-3 z-score)
(140) 24.7 % (20.4 - 29.5 95% C.I.)
(77) 27.3 % (21.6 - 33.9 95% C.I.)
(63) 22.1 % (17.1 - 28.1 95% C.I.)
Prevalence of severe stunting (<-3 z-score)
(52) 9.2 % (7.2 - 11.7 95% C.I.)
(25) 8.9 % (6.4 - 12.1 95% C.I.)
(27) 9.5 % (6.6 - 13.4 95% C.I.)
Table 13.4: Prevalence of stunting based on height-for-age z-scores and by sex for Rwamwanja
All n = 373
Boys n = 185
Girls n = 188
Prevalence of stunting (<-2 z-score)
(118) 31.6 % (23.6 - 40.9 95% C.I.)
(66) 35.7 % (25.9 - 46.8 95% C.I.)
(52) 27.7 % (20.0 - 36.9 95% C.I.)
Prevalence of moderate stunting (<-2 z-score and >=-3 z-score)
(89) 23.9 % (18.3 - 30.5 95% C.I.)
(51) 27.6 % (20.7 - 35.7 95% C.I.)
(38) 20.2 % (14.7 - 27.1 95% C.I.)
Prevalence of severe stunting (<-3 z-score)
(29) 7.8 % (4.6 - 12.8 95% C.I.)
(15) 8.1 % (4.3 - 14.8 95% C.I.)
(14) 7.4 % (4.3 - 12.7 95% C.I.)
Table 13.5: Prevalence of stunting based on height-for-age z-scores and by sex for Kiryandongo
All n = 168
Boys n = 86
Girls n = 82
Prevalence of stunting (<-2 z-score)
(18) 10.7 % (5.1 - 21.1 95% C.I.)
(12) 14.0 % (5.6 - 30.7 95% C.I.)
(6) 7.3 % (2.5 - 19.2 95% C.I.)
Prevalence of moderate stunting (<-2 z-score and >=-3 z-score)
(14) 8.3 % (3.1 - 20.3 95% C.I.)
(10) 11.6 % (4.3 - 27.9 95% C.I.)
(4) 4.9 % (1.3 - 16.8 95% C.I.)
Prevalence of severe stunting (<-3 z-score)
(4) 2.4 % (0.7 - 7.9 95% C.I.)
(2) 2.3 % (0.5 - 11.0 95% C.I.)
(2) 2.4 % (0.6 - 10.0 95% C.I.)
Table 13.6: Prevalence of stunting based on height-for-age z-scores and by sex for Adjumani All
n = 445 Boys
n = 226 Girls
n = 219 Prevalence of stunting (<-2 z-score)
(73) 16.4 % (12.4 - 21.4 95% C.I.)
(43) 19.0 % (13.5 - 26.2 95% C.I.)
(30) 13.7 % (9.2 - 20.0 95% C.I.)
Prevalence of moderate stunting (<-2 z-score and >=-3 z-score)
(59) 13.3 % (10.2 - 17.0 95% C.I.)
(38) 16.8 % (11.7 - 23.5 95% C.I.)
(21) 9.6 % (6.3 - 14.3 95% C.I.)
Prevalence of severe stunting (<-3 z-score)
(14) 3.1 % (1.7 - 5.9 95% C.I.)
(5) 2.2 % (0.9 - 5.1 95% C.I.)
(9) 4.1 % (1.7 - 9.4 95% C.I.)

36
Table 13.7: Prevalence of stunting based on height-for-age z-scores and by sex for Rhino camp All
n = 204 Boys
n = 105 Girls n = 99
Prevalence of stunting (<-2 z-score)
(25) 12.3 % (7.0 - 20.7 95% C.I.)
(16) 15.2 % (8.6 - 25.5 95% C.I.)
(9) 9.1 % (4.9 - 16.4 95% C.I.)
Prevalence of moderate stunting (<-2 z-score and >=-3 z-score)
(24) 11.8 % (6.3 - 21.0 95% C.I.)
(15) 14.3 % (7.3 - 26.1 95% C.I.)
(9) 9.1 % (4.9 - 16.4 95% C.I.)
Prevalence of severe stunting (<-3 z-score)
(1) 0.5 % (0.1 - 4.6 95% C.I.)
(1) 1.0 % (0.1 - 8.3 95% C.I.)
(0) 0.0 % (0.0 - 0.0 95% C.I.)
Table 14: Prevalence of stunting by age based on height-for-age z-scores Table 14.1 Prevalence of stunting by age based on height-for-age z-scores, Kyaka II Severe stunting
(<-3 z-score) Moderate stunting
(>= -3 and <-2 z-score ) Normal
(> = -2 z score) Age (mo) Total no. No. % No. % No. %
6-17 61 3 4.9 8 13.1 50 82.0 18-29 57 6 10.5 10 17.5 41 71.9 30-41 50 4 8.0 12 24.0 34 68.0 42-53 55 3 5.5 10 18.2 42 76.4 54-59 26 0 0.0 7 26.9 19 73.1 Total 249 16 6.4 47 18.9 186 74.7
Table 14.2 Prevalence of stunting by age based on height-for-age z-scores, Kyangwali Severe stunting
(<-3 z-score) Moderate stunting
(>= -3 and <-2 z-score ) Normal
(> = -2 z score) Age (mo) Total no. No. % No. % No. %
6-17 81 7 8.6 11 13.6 63 77.8 18-29 72 12 16.7 21 29.2 39 54.2 30-41 71 9 12.7 16 22.5 46 64.8 42-53 75 12 16.0 10 13.3 53 70.7 54-59 37 5 13.5 4 10.8 28 75.7 Total 336 45 13.4 62 18.5 229 68.2
Table 14.3 Prevalence of stunting by age based on height-fir-age z-scores, Nakivale/Oruchinga Severe stunting
(<-3 z-score) Moderate stunting
(>= -3 and <-2 z-score ) Normal
(> = -2 z score) Age (mo) Total no. No. % No. % No. %
6-17 146 8 5.5 27 18.5 111 76.0 18-29 135 22 16.3 37 27.4 76 56.3 30-41 118 16 13.6 32 27.1 70 59.3 42-53 123 3 2.4 38 30.9 82 66.7 54-59 45 3 6.7 6 13.3 36 80.0 Total 567 52 9.2 140 24.7 375 66.1
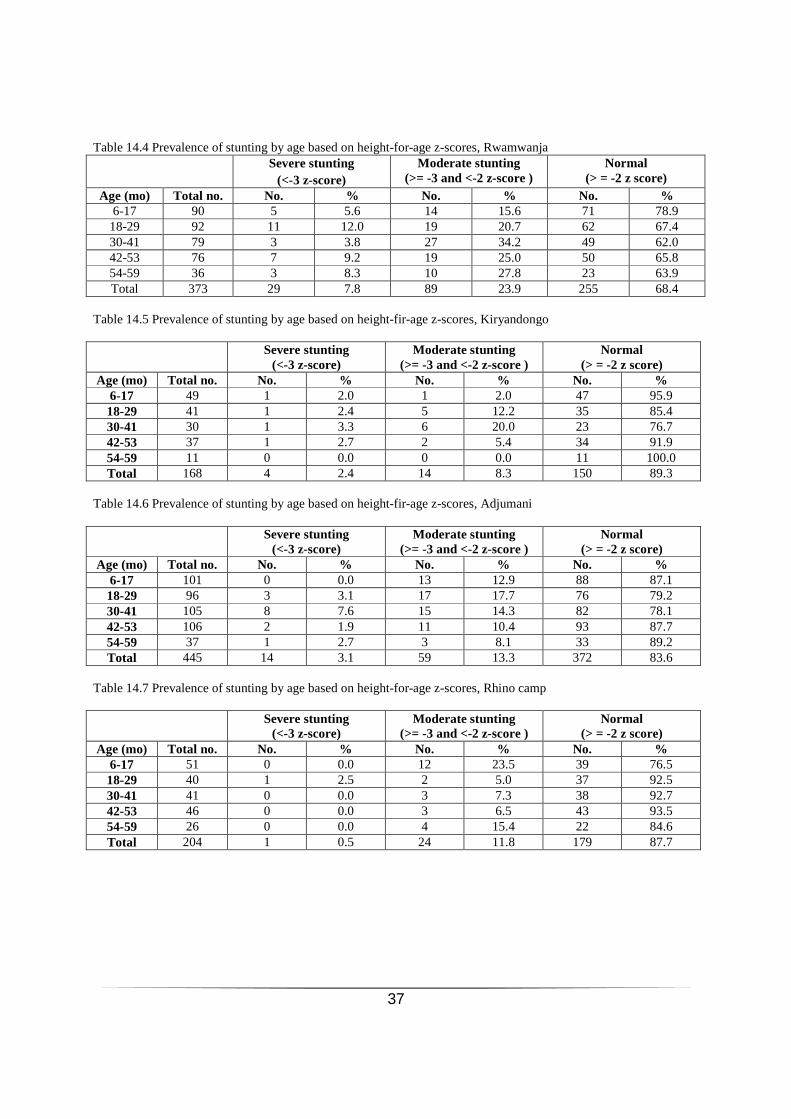
37
Table 14.4 Prevalence of stunting by age based on height-for-age z-scores, Rwamwanja Severe stunting
(<-3 z-score) Moderate stunting
(>= -3 and <-2 z-score ) Normal
(> = -2 z score) Age (mo) Total no. No. % No. % No. %
6-17 90 5 5.6 14 15.6 71 78.9 18-29 92 11 12.0 19 20.7 62 67.4 30-41 79 3 3.8 27 34.2 49 62.0 42-53 76 7 9.2 19 25.0 50 65.8 54-59 36 3 8.3 10 27.8 23 63.9 Total 373 29 7.8 89 23.9 255 68.4
Table 14.5 Prevalence of stunting by age based on height-fir-age z-scores, Kiryandongo Severe stunting
(<-3 z-score) Moderate stunting
(>= -3 and <-2 z-score ) Normal
(> = -2 z score) Age (mo) Total no. No. % No. % No. %
6-17 49 1 2.0 1 2.0 47 95.9 18-29 41 1 2.4 5 12.2 35 85.4 30-41 30 1 3.3 6 20.0 23 76.7 42-53 37 1 2.7 2 5.4 34 91.9 54-59 11 0 0.0 0 0.0 11 100.0 Total 168 4 2.4 14 8.3 150 89.3
Table 14.6 Prevalence of stunting by age based on height-fir-age z-scores, Adjumani Severe stunting
(<-3 z-score) Moderate stunting
(>= -3 and <-2 z-score ) Normal
(> = -2 z score) Age (mo) Total no. No. % No. % No. %
6-17 101 0 0.0 13 12.9 88 87.1 18-29 96 3 3.1 17 17.7 76 79.2 30-41 105 8 7.6 15 14.3 82 78.1 42-53 106 2 1.9 11 10.4 93 87.7 54-59 37 1 2.7 3 8.1 33 89.2 Total 445 14 3.1 59 13.3 372 83.6
Table 14.7 Prevalence of stunting by age based on height-for-age z-scores, Rhino camp Severe stunting
(<-3 z-score) Moderate stunting
(>= -3 and <-2 z-score ) Normal
(> = -2 z score) Age (mo) Total no. No. % No. % No. %
6-17 51 0 0.0 12 23.5 39 76.5 18-29 40 1 2.5 2 5.0 37 92.5 30-41 41 0 0.0 3 7.3 38 92.7 42-53 46 0 0.0 3 6.5 43 93.5 54-59 26 0 0.0 4 15.4 22 84.6 Total 204 1 0.5 24 11.8 179 87.7

38
Figure 4: Trends in the prevalence of stunting by age in children 6-59 months
13.117.5
24.018.2
26.94.9
10.5
8.0
5.5
0.0
0
5
10
15
20
25
30
35
40
45
50
6-17m 18-29m 30-41m 42-53m 54-59m
Pre
vale
nce
(%
)
Age group (months)
Trend in the prevalence of stunting by age in children 6-59 monthsKyaka II
Severe stunting
Moderate stunting
13.6
29.222.5
13.3 10.8
8.6
16.7
12.7
16.013.5
0
5
10
15
20
25
30
35
40
45
50
6-17m 18-29m 30-41m 42-53m 54-59m
Pre
vale
nce
(%
)
Age group (months)
Trend in the prevalence of stunting by age in children 6-59 monthsKyangwali
Severe stunting
Moderate stunting
18.5
27.4 27.130.9
13.3
5.5
16.313.6
2.4
6.7
0
5
10
15
20
25
30
35
40
45
50
6-17m 18-29m 30-41m 42-53m 54-59m
Pre
vale
nce
(%
)
Age group (months)
Trend in the prevalence of stunting by age in children 6-59 monthsNakivale/Oruchinga
Severe stunting
Moderate stunting

39
15.620.7
34.2
25.027.8
5.6
12.0
3.8
9.2
8.3
0
5
10
15
20
25
30
35
40
45
50
6-17m 18-29m 30-41m 42-53m 54-59m
Pre
vale
nce
(%
)
Age group (months)
Trend in the prevalence of stunting by age in children 6-59 monthsRwamwanja
Severe stunting
Moderate stunting
2.0
12.2
20.0
5.42.0
2.4
3.3
2.7
0
5
10
15
20
25
30
35
40
45
50
6-17m 18-29m 30-41m 42-53m 54-59m
Pre
vale
nce
(%
)
Age group (months)
Trend in the prevalence of stunting by age in children 6-59 monthsKiryandongo
Severe stunting
Moderate stunting
12.917.7
14.310.4 8.1
3.1
0
5
10
15
20
25
30
35
40
45
50
6-17m 18-29m 30-41m 42-53m 54-59m
Pre
vale
nce
(%
)
Age group (months)
Trend in the prevalence of stunting by age in children 6-59 monthsAdjumani
Severe stunting
Moderate stunting
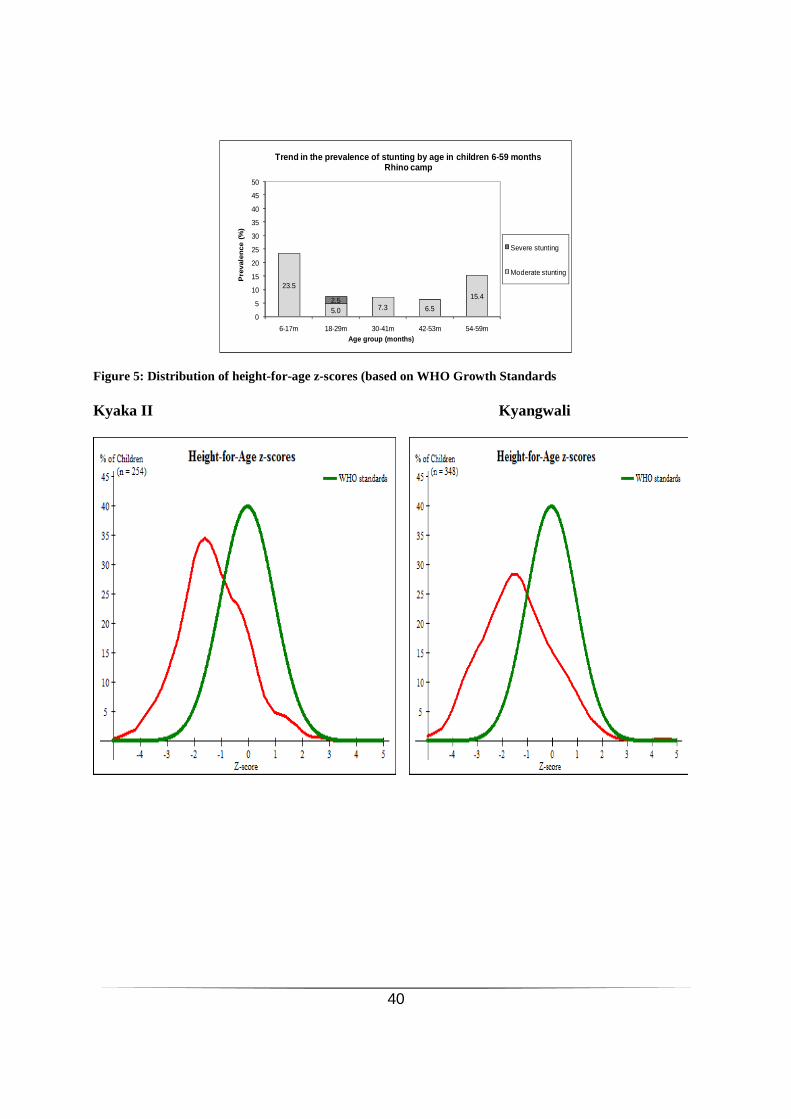
40
23.5
5.0 7.3 6.5
15.42.5
0
5
10
15
20
25
30
35
40
45
50
6-17m 18-29m 30-41m 42-53m 54-59m
Pre
val
en
ce
(%)
Age group (months)
Trend in the prevalence of stunting by age in children 6-59 monthsRhino camp
Severe stunting
Moderate stunting
Figure 5: Distribution of height-for-age z-scores (based on WHO Growth Standards Kyaka II Kyangwali

41
Nakivale/Oruchinga Rwamwanja
Kiryandongo Adjumani
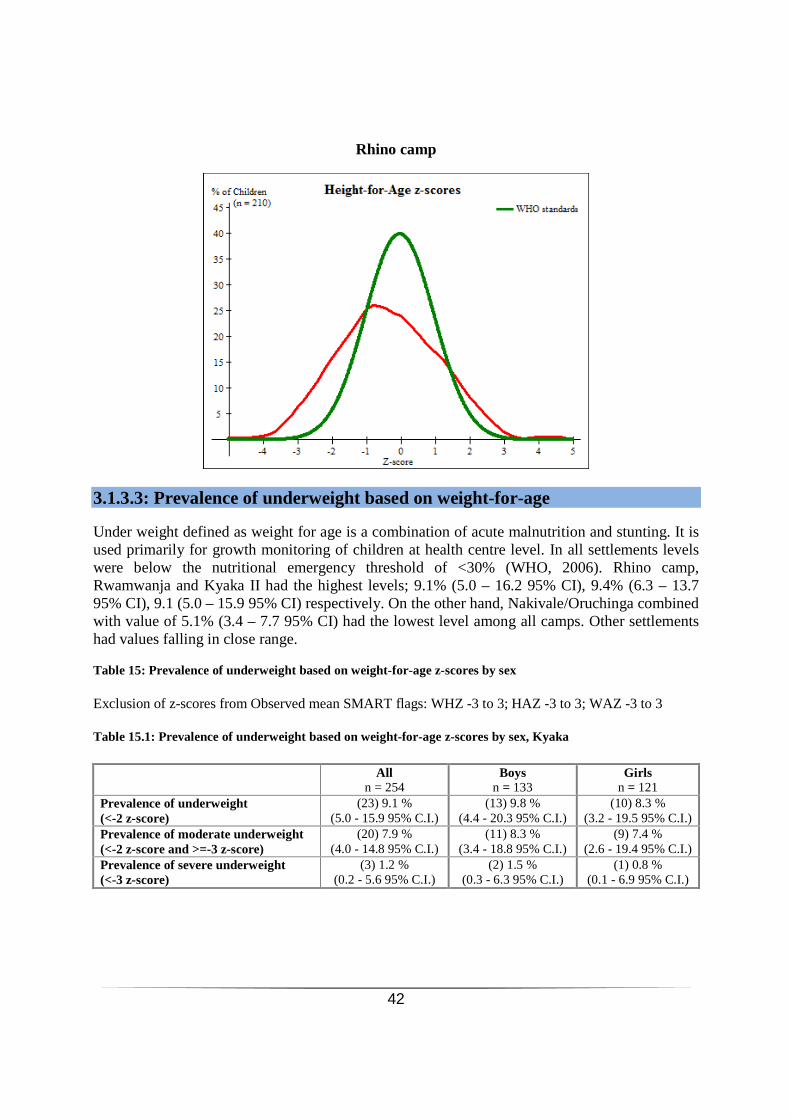
42
Rhino camp
3.1.3.3: Prevalence of underweight based on weight-for-age Under weight defined as weight for age is a combination of acute malnutrition and stunting. It is used primarily for growth monitoring of children at health centre level. In all settlements levels were below the nutritional emergency threshold of <30% (WHO, 2006). Rhino camp, Rwamwanja and Kyaka II had the highest levels; 9.1% (5.0 – 16.2 95% CI), 9.4% (6.3 – 13.7 95% CI), 9.1 (5.0 – 15.9 95% CI) respectively. On the other hand, Nakivale/Oruchinga combined with value of 5.1% (3.4 – 7.7 95% CI) had the lowest level among all camps. Other settlements had values falling in close range. Table 15: Prevalence of underweight based on weight-for-age z-scores by sex Exclusion of z-scores from Observed mean SMART flags: WHZ -3 to 3; HAZ -3 to 3; WAZ -3 to 3 Table 15.1: Prevalence of underweight based on weight-for-age z-scores by sex, Kyaka
All n = 254
Boys n = 133
Girls n = 121
Prevalence of underweight (<-2 z-score)
(23) 9.1 % (5.0 - 15.9 95% C.I.)
(13) 9.8 % (4.4 - 20.3 95% C.I.)
(10) 8.3 % (3.2 - 19.5 95% C.I.)
Prevalence of moderate underweight (<-2 z-score and >=-3 z-score)
(20) 7.9 % (4.0 - 14.8 95% C.I.)
(11) 8.3 % (3.4 - 18.8 95% C.I.)
(9) 7.4 % (2.6 - 19.4 95% C.I.)
Prevalence of severe underweight (<-3 z-score)
(3) 1.2 % (0.2 - 5.6 95% C.I.)
(2) 1.5 % (0.3 - 6.3 95% C.I.)
(1) 0.8 % (0.1 - 6.9 95% C.I.)

43
Table 15.2: Prevalence of underweight based on weight-for-age z-scores by sex, Kyangwali
All n = 345
Boys n = 179
Girls n = 166
Prevalence of underweight (<-2 z-score)
(26) 7.5 % (4.4 - 12.5 95% C.I.)
(16) 8.9 % (4.9 - 15.8 95% C.I.)
(10) 6.0 % (2.8 - 12.4 95% C.I.)
Prevalence of moderate underweight (<-2 z-score and >=-3 z-score)
(22) 6.4 % (3.5 - 11.3 95% C.I.)
(13) 7.3 % (4.0 - 12.9 95% C.I.)
(9) 5.4 % (2.2 - 12.5 95% C.I.)
Prevalence of severe underweight (<-3 z-score)
(4) 1.2 % (0.5 - 2.8 95% C.I.)
(3) 1.7 % (0.6 - 4.9 95% C.I.)
(1) 0.6 % (0.1 - 4.3 95% C.I.)
Table 15.3: Prevalence of underweight based on weight-for-age z-scores by sex, Nakivale/Oruchinga combined
All n = 568
Boys n = 281
Girls n = 287
Prevalence of underweight (<-2 z-score)
(29) 5.1 % (3.4 - 7.7 95% C.I.)
(15) 5.3 % (3.3 - 8.4 95% C.I.)
(14) 4.9 % (2.9 - 8.1 95% C.I.)
Prevalence of moderate underweight (<-2 z-score and >=-3 z-score)
(25) 4.4 % (2.7 - 7.1 95% C.I.)
(12) 4.3 % (2.4 - 7.4 95% C.I.)
(13) 4.5 % (2.6 - 7.7 95% C.I.)
Prevalence of severe underweight (<-3 z-score)
(4) 0.7 % (0.3 - 1.8 95% C.I.)
(3) 1.1 % (0.4 - 3.0 95% C.I.)
(1) 0.3 % (0.0 - 2.7 95% C.I.)
Table 15.4: Prevalence of underweight based on weight-for-age z-scores by sex, Rwamwanja
All n = 374
Boys n = 187
Girls n = 187
Prevalence of underweight (<-2 z-score)
(35) 9.4 % (6.3 - 13.7 95% C.I.)
(22) 11.8 % (7.0 - 19.2 95% C.I.)
(13) 7.0 % (3.7 - 12.8 95% C.I.)
Prevalence of moderate underweight (<-2 z-score and >=-3 z-score)
(29) 7.8 % (5.5 - 10.7 95% C.I.)
(17) 9.1 % (5.9 - 13.8 95% C.I.)
(12) 6.4 % (3.0 - 13.2 95% C.I.)
Prevalence of severe underweight (<-3 z-score)
(6) 1.6 % (0.5 - 5.4 95% C.I.)
(5) 2.7 % (0.6 - 11.3 95% C.I.)
(1) 0.5 % (0.1 - 3.2 95% C.I.)
Table 15.5: Prevalence of underweight based on weight-for-age z-scores by sex, Kiryandongo
All n = 172
Boys n = 87
Girls n = 85
Prevalence of underweight (<-2 z-score)
(11) 6.4 % (2.6 - 15.1 95% C.I.)
(8) 9.2 % (2.9 - 25.9 95% C.I.)
(3) 3.5 % (1.1 - 11.2 95% C.I.)
Prevalence of moderate underweight (<-2 z-score and >=-3 z-score)
(10) 5.8 % (2.5 - 13.0 95% C.I.)
(8) 9.2 % (2.9 - 25.9 95% C.I.)
(2) 2.4 % (0.5 - 10.2 95% C.I.)
Prevalence of severe underweight (<-3 z-score)
(1) 0.6 % (0.1 - 5.3 95% C.I.)
(0) 0.0 % (0.0 - 0.0 95% C.I.)
(1) 1.2 % (0.1 - 11.0 95% C.I.)
Table 15.6: Prevalence of underweight based on weight-for-age z-scores by sex, Adjumani
All n = 461
Boys n = 237
Girls n = 224
Prevalence of underweight (<-2 z-score)
(31) 6.7 % (4.7 - 9.5 95% C.I.)
(15) 6.3 % (3.9 - 10.2 95% C.I.)
(16) 7.1 % (3.9 - 12.8 95% C.I.)
Prevalence of moderate underweight (<-2 z-score and >=-3 z-score)
(27) 5.9 % (3.8 - 9.0 95% C.I.)
(12) 5.1 % (2.7 - 9.2 95% C.I.)
(15) 6.7 % (3.4 - 12.7 95% C.I.)
Prevalence of severe underweight (<-3 z-score)
(4) 0.9 % (0.4 - 2.1 95% C.I.)
(3) 1.3 % (0.4 - 3.7 95% C.I.)
(1) 0.4 % (0.1 - 3.1 95% C.I.)
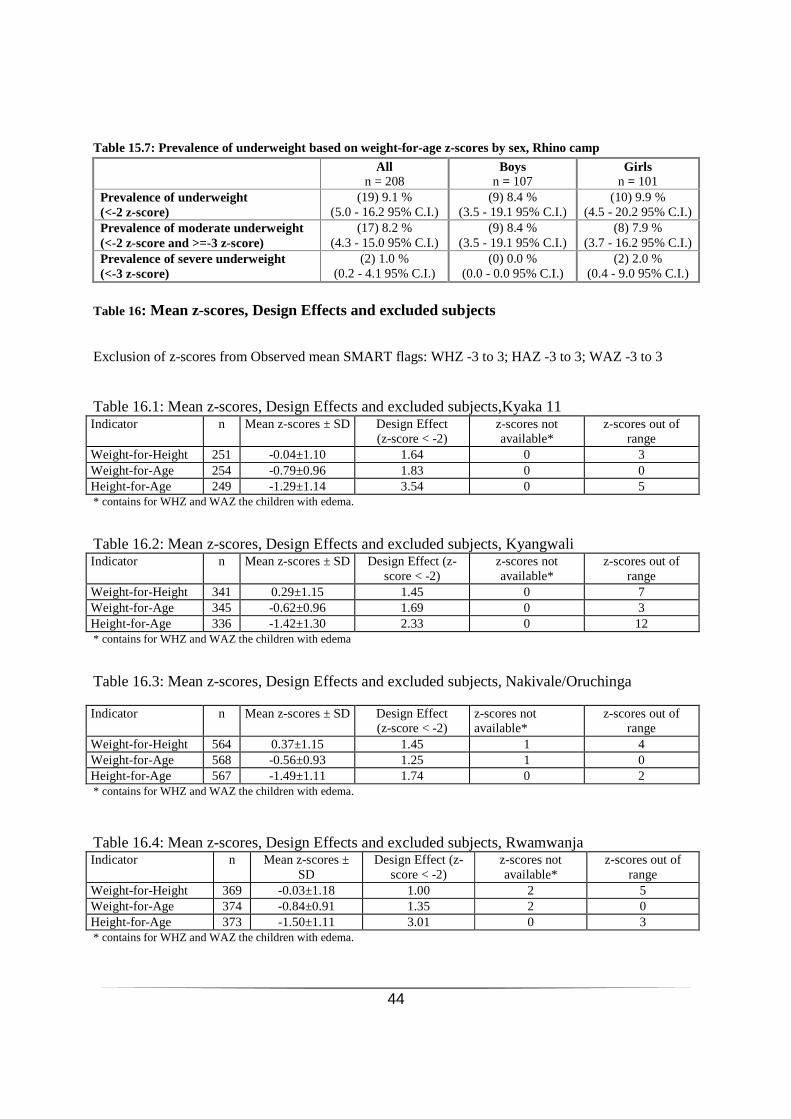
44
Table 15.7: Prevalence of underweight based on weight-for-age z-scores by sex, Rhino camp
All n = 208
Boys n = 107
Girls n = 101
Prevalence of underweight (<-2 z-score)
(19) 9.1 % (5.0 - 16.2 95% C.I.)
(9) 8.4 % (3.5 - 19.1 95% C.I.)
(10) 9.9 % (4.5 - 20.2 95% C.I.)
Prevalence of moderate underweight (<-2 z-score and >=-3 z-score)
(17) 8.2 % (4.3 - 15.0 95% C.I.)
(9) 8.4 % (3.5 - 19.1 95% C.I.)
(8) 7.9 % (3.7 - 16.2 95% C.I.)
Prevalence of severe underweight (<-3 z-score)
(2) 1.0 % (0.2 - 4.1 95% C.I.)
(0) 0.0 % (0.0 - 0.0 95% C.I.)
(2) 2.0 % (0.4 - 9.0 95% C.I.)
Table 16: Mean z-scores, Design Effects and excluded subjects Exclusion of z-scores from Observed mean SMART flags: WHZ -3 to 3; HAZ -3 to 3; WAZ -3 to 3 Table 16.1: Mean z-scores, Design Effects and excluded subjects,Kyaka 11 Indicator n Mean z-scores ± SD Design Effect
(z-score < -2) z-scores not available*
z-scores out of range
Weight-for-Height 251 -0.04±1.10 1.64 0 3 Weight-for-Age 254 -0.79±0.96 1.83 0 0 Height-for-Age 249 -1.29±1.14 3.54 0 5 * contains for WHZ and WAZ the children with edema.
Table 16.2: Mean z-scores, Design Effects and excluded subjects, Kyangwali Indicator n Mean z-scores ± SD Design Effect (z-
score < -2) z-scores not available*
z-scores out of range
Weight-for-Height 341 0.29±1.15 1.45 0 7 Weight-for-Age 345 -0.62±0.96 1.69 0 3 Height-for-Age 336 -1.42±1.30 2.33 0 12 * contains for WHZ and WAZ the children with edema
Table 16.3: Mean z-scores, Design Effects and excluded subjects, Nakivale/Oruchinga Indicator n Mean z-scores ± SD Design Effect
(z-score < -2) z-scores not available*
z-scores out of range
Weight-for-Height 564 0.37±1.15 1.45 1 4 Weight-for-Age 568 -0.56±0.93 1.25 1 0 Height-for-Age 567 -1.49±1.11 1.74 0 2 * contains for WHZ and WAZ the children with edema.
Table 16.4: Mean z-scores, Design Effects and excluded subjects, Rwamwanja Indicator n Mean z-scores ±
SD Design Effect (z-
score < -2) z-scores not available*
z-scores out of range
Weight-for-Height 369 -0.03±1.18 1.00 2 5 Weight-for-Age 374 -0.84±0.91 1.35 2 0 Height-for-Age 373 -1.50±1.11 3.01 0 3 * contains for WHZ and WAZ the children with edema.

45
Table 16.5: Mean z-scores, Design Effects and excluded subjects, Kiryandongo Indicator n Mean z-scores ± SD Design Effect (z-
score < -2) z-scores not available*
z-scores out of range
Weight-for-Height 172 -0.39±1.08 2.08 0 1 Weight-for-Age 172 -0.76±0.91 1.85 0 1 Height-for-Age 168 -0.86±1.02 2.02 0 5 * contains for WHZ and WAZ the children with edema.
Table 16.6: Mean z-scores, Design Effects and excluded subjects, Adjumani Indicator n Mean z-scores ±
SD Design Effect (z-
score < -2) z-scores not available*
z-scores out of range
Weight-for-Height 456 -0.27±1.13 1.00 0 9 Weight-for-Age 461 -0.56±0.96 1.00 0 4 Height-for-Age 445 -0.80±1.27 1.55 0 20 * contains for WHZ and WAZ the children with edema.
Table 16.7: Mean z-scores, Design Effects and excluded subjects, Rhino camp Indicator n Mean z-scores ± SD Design Effect (z-
score < -2) z-scores not available*
z-scores out of range
Weight-for-Height 208 -0.50±0.99 1.00 0 2 Weight-for-Age 208 -0.55±1.08 1.45 0 2 Height-for-Age 204 -0.35±1.33 1.67 0 6 * contains for WHZ and WAZ the children with edema.
3.1.3.4. Prevalence of malnutrition by MUAC The prevalence of child malnutrition according to MUAC indicates that most children were normal. Rwamwanja had the highest prevalence of moderately malnourished, 5.9% (3.6 – 9.3 95% CI) followed by Kyaka at 4.3% (2.1 – 8.8 95%CI) and Kiryandongo 4.0% (1.8 – 8.7 95% CI). The lowest level was in Kyangwali at 1.4% (0.6 – 3.3 95% CI). In terms of severe malnutrition, Kyangwali had the highest prevalence of severe malnutrition, 1.4% (0.5 – 4.0 95% CI) while Kiryandongo had no child with severe malnutrition (Table 17). Table 17: Prevalence of malnutrition based on MUAC Kyaka II Kyangwali Nakivale/
Oruchinga Rwamwanja Kiryandongo Adjumani Rhino
camp n = 254 n = 348 n = 569 n = 376 n = 173 n = 465 n = 210
Moderate acute malnutrition ( ≥ 115mm & <125 mm
(11) 4.3 % (2.1 - 8.8 95% C.I.)
(5) 1.4 % (0.6 - 3.3 95% C.I.)
(22) 3.9 % (2.6 - 5.7 95% C.I.)
(22) 5.9 % (3.6 - 9.3 95% C.I.)
(7) 4.0 % (1.8 - 8.7 95% C.I.)
(13) 2.8 % (1.4 - 5.6 95% C.I.)
(4) 1.9 % (0.4 - 8.5 95% C.I.)
Severe acute malnutrition (< 115mm)
(1) 0.4 % (0.0 - 3.4 95% C.I.)
(5) 1.4 % (0.5 - 4.0 95% C.I.)
(5) 0.9 % (0.4 - 2.0 95% C.I.)
(3) 0.8 % (0.3 - 2.1 95% C.I.)
(0) 0.0 % (0.0 - 0.0 95% C.I.)
(1) 0.2 % (0.0 - 1.7 95% C.I.)
(1) 0.5 % (0.0 - 4.6 95% C.I.)

46
3.1.4 Feeding programme coverage results A small proportion of children surveyed were enrolled onto a feeding program (Table 18) Table 18: Programme coverage for acutely malnourished children Kyaka II Kyangwali Nakivale/Oruchinga Rwamwanja No/
total % (95% CI) No/
total % (95% CI) No/
total % (95% CI) No/
total % (95% CI)
Supplementary feeding programme coverage
2/254 0.79 (0-1.96
1/348 0.29 (0-0.88)
31/569 5.45 (1.74-9.15)
129/376 34.3 (20.0-48.6)
Therapeutic feeding programme coverage
2/254 0.79 (0.39-1.96)
1/348 0.29 (0-0.90)
4/569 0.70 (0.05-1.35)
5/376 1.33 (0.01-2.67)
Kiryandongo Adjumani Rhino camp No/
total % (95% CI) No/
total % (95% CI) No/
total % (95% CI)
Supplementary feeding programme coverage
4/173 2.3 (0.3-4.3)
1/465 0.22 (0-0.67
1/210 0.48 (0-1.56)
Therapeutic feeding programme coverage
0/173 0 (0-0) 1/465 0.22 (0-0.67)
0/210 0 (0-0)
3.1.5 Access to Health Services Measles vaccination was above the national target of 90% in settlements of Nakivale/Oruchinga, Rhino camp and Adjumani. In addition, Kyaka II (88.29% (81.1-95.3 95%CI), Kyangwali (88.8(84.9-92 95%CI) and Kiryandongo (88.1(82-92.6 95%CI) had high coverage. Rwamwanja presented the lowest level at 86.4% (82.4-89.8 95%CI). Deworming coverage was below the national target of 85% in all settlements with the exception of Nakivale/Oruchinga. Vitamin A and deworming coverage was lowest in Kiryandongo compared to other settlements. Notably, deworming was at 49.7% (42-57.4 95%CI) while Vitamin A was 68.8 %( 61.3-75.6 95%CI) in Kiryandongo. In general, there was an increase in the immunisation coverage and health services compared to previous assessments which recorded highest coverage at 78.7%. Table 19: Immunization coverage and other health services for children
Kyaka II Kyangwali Nakivale/Oruchinga Rwamwanja Kir yandongo Rhino Adjumani
% children Measles with cards
22.4 (17.5-28.1%)
67.7 (62.3-72.7%)
56.2 (51.8-60.5%)
17.5 (13.8-22.0%)
39.0 (31.4-47.0%)
60.6 (53.3-67.6%)
69.3 (64.7-73.6%)
Measles without cards
65.7 (59.6-71.6%)
21.1 (17.0-26.0%)
37.9 (33.7-42.2%)
68.9 (63.8-73.7%)
49.1 (41.1-57.1%)
29.5 (23.2-36.5%)
24.5 (20.6-28.8%)
Total Measles coverage
88.2 (81.1-95.3%)
88.8 (84.9-92%)
94.1 (91.2-96.9%)
86.4 (82.4-89.8%)
88.1 (82.0-92.6%)
90.2 (85.1-94.0%)
93.8 (91.0-95.8%)
Vitamin A with card
26.2 (20.9-32.1%)
66.7 (61.4-71.6%)
56.2 (46.2-66.1%)
14.9 (11.5-19.0%)
39.3 (32.0-47.0%)
61.1 (53.9-68.1%)
63.9 (59.3-68.2%)
Vitamin A without card
69.4 (63.4-75.1%)
22.7 (18.5-27.5%)
36.6 (27.2-46.1%)
69.9 (65.0-74.5%)
29.5 (22.8-36.9%)
28.5 (22.2-35.4%)
29.7 (25.6-34.1%)
Total vitamin A coverage
95.6 (92.3-7.8%)
89.4 (85.6-2.4%)
92.8 (89.5-96.1%)
84.8 (80.8-8.3%)
68.8 (61.3-75.6%)
89.6 (84.4-3.6%)
93.5 (90.8-95.5%)
Deworming with card
19.7 (14.7-25.6%)
55.8 (50.1-61.4%)
49.0 (44.5-53.5%)
14.7 (11.2-19.1%)
22.0 (16.0-28.9%)
56.0 (48.7-63.1%)
54.4 (49.8-59.0%)
Deworming without card
63.3 (56.5-69.7%)
27.2 (22.5-32.6%)
47.6 (43.1-52.1%)
65.6 (60.2-70.8%)
27.7 (21.2-35.1%)
25.9 (19.9-32.7%)
28.8 (24.8-33.2%)
Total deworming coverage
83.0 (77.4-87.8%)
83.0 (78.4-87.0%)
96.6 (94.1-99.0%)
80.4 (75.6-84.5%)
49.7 (42.0-57.4%)
81.9% (75.7-87.0%)
83.2 (79.4-86.4%)
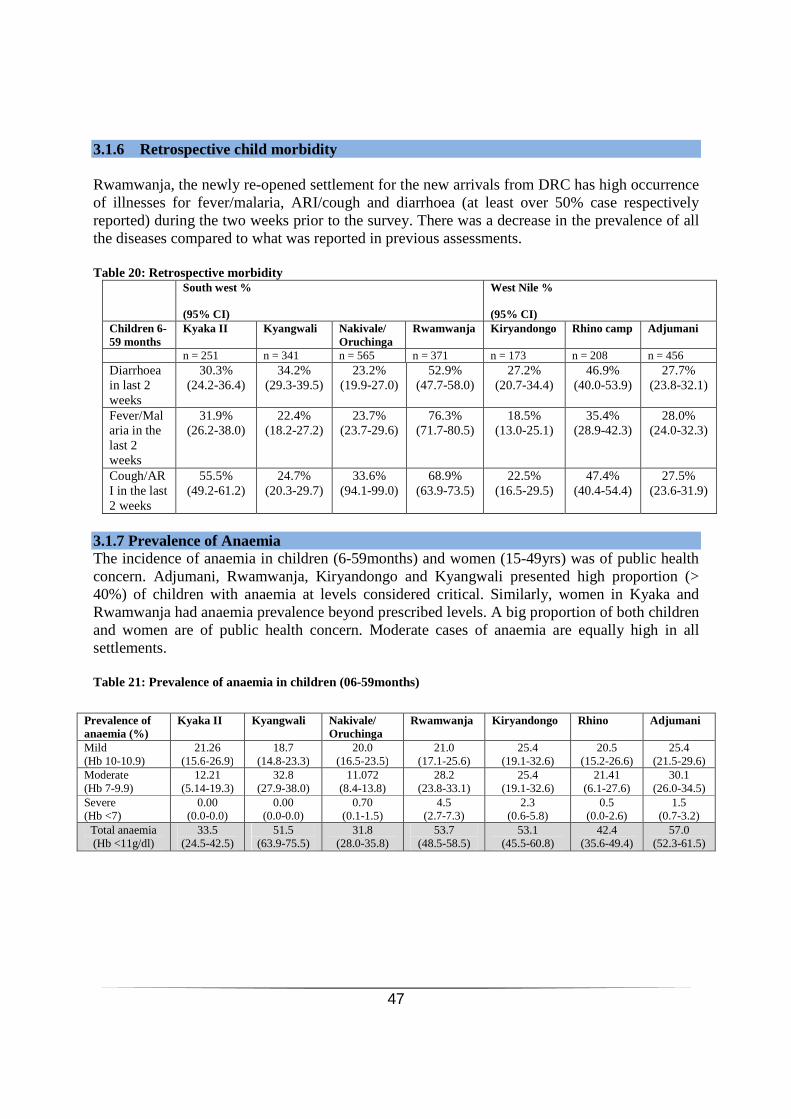
47
3.1.6 Retrospective child morbidity Rwamwanja, the newly re-opened settlement for the new arrivals from DRC has high occurrence of illnesses for fever/malaria, ARI/cough and diarrhoea (at least over 50% case respectively reported) during the two weeks prior to the survey. There was a decrease in the prevalence of all the diseases compared to what was reported in previous assessments. Table 20: Retrospective morbidity
South west % (95% CI)
West Nile % (95% CI)
Children 6-59 months
Kyaka II Kyangwali Nakivale/ Oruchinga
Rwamwanja Kiryandongo Rhino camp Adjumani
n = 251 n = 341 n = 565 n = 371 n = 173 n = 208 n = 456 Diarrhoea in last 2 weeks
30.3% (24.2-36.4)
34.2% (29.3-39.5)
23.2% (19.9-27.0)
52.9% (47.7-58.0)
27.2% (20.7-34.4)
46.9% (40.0-53.9)
27.7% (23.8-32.1)
Fever/Malaria in the last 2 weeks
31.9% (26.2-38.0)
22.4% (18.2-27.2)
23.7% (23.7-29.6)
76.3% (71.7-80.5)
18.5% (13.0-25.1)
35.4% (28.9-42.3)
28.0% (24.0-32.3)
Cough/ARI in the last 2 weeks
55.5% (49.2-61.2)
24.7% (20.3-29.7)
33.6% (94.1-99.0)
68.9% (63.9-73.5)
22.5% (16.5-29.5)
47.4% (40.4-54.4)
27.5% (23.6-31.9)
3.1.7 Prevalence of Anaemia The incidence of anaemia in children (6-59months) and women (15-49yrs) was of public health concern. Adjumani, Rwamwanja, Kiryandongo and Kyangwali presented high proportion (> 40%) of children with anaemia at levels considered critical. Similarly, women in Kyaka and Rwamwanja had anaemia prevalence beyond prescribed levels. A big proportion of both children and women are of public health concern. Moderate cases of anaemia are equally high in all settlements. Table 21: Prevalence of anaemia in children (06-59months)
Prevalence of anaemia (%)
Kyaka II Kyangwali Nakivale/ Oruchinga
Rwamwanja Kiryandongo Rhino Adjumani
Mild (Hb 10-10.9)
21.26 (15.6-26.9)
18.7 (14.8-23.3)
20.0 (16.5-23.5)
21.0 (17.1-25.6)
25.4 (19.1-32.6)
20.5 (15.2-26.6)
25.4 (21.5-29.6)
Moderate (Hb 7-9.9)
12.21 (5.14-19.3)
32.8 (27.9-38.0)
11.072 (8.4-13.8)
28.2 (23.8-33.1)
25.4 (19.1-32.6)
21.41 (6.1-27.6)
30.1 (26.0-34.5)
Severe (Hb <7)
0.00 (0.0-0.0)
0.00 (0.0-0.0)
0.70 (0.1-1.5)
4.5 (2.7-7.3)
2.3 (0.6-5.8)
0.5 (0.0-2.6)
1.5 (0.7-3.2)
Total anaemia (Hb <11g/dl)
33.5 (24.5-42.5)
51.5 (63.9-75.5)
31.8 (28.0-35.8)
53.7 (48.5-58.5)
53.1 (45.5-60.8)
42.4 (35.6-49.4)
57.0 (52.3-61.5)

48
Figure 6: Anaemia rates in children 6-59 months, 2010 -2012
Table 22: Prevalence of anaemia in women (15-49yrs) South west %
(95% CI)
West Nile % (95% CI)
Children 6-59 months
Kyaka II Kyangwali Nakivale/ Oruchinga
Rwamwanja Kiryandongo Rhino camp
Adjumani
n = 251 n = 341 n = 565 n = 371 n = 173 n = 208 n = 456 Total Anaemia (Hb <12 g/dl)
47.0% (40.6-54.3)
32.4% (26.5-38.7)
34.0% (29.6-38.7)
41.3% (33.8-49.0)
25.7% (18.6-33.9)
35.1% (27.5-43.4)
33.0% (28.5-37.8)
Mild (Hb 11-11.9)
21.9% (16.5-28.0)
13.9% (9.7-18.9)
16.6% (12.9-19.9)
17.4% (12.1-24.0)
17.6% (11.6-25.1)
18.2% (12.4-25.4)
16.6% (13.2-20.6)
Moderate (Hb 8-10.9)
25.6% (19.9-32.0)
17.2 (12.7-22.6)
15.9% (12.7-19.7)
22.1% (16.1-29.0)
8.1% (4.1-14.0)
16.2% (10.7-23.2)
15.7% (12.4-19.6)
Severe (Hb<8) 0.0% (0.0-0.0)
1.3% (0.3-3.6)
2.0% 1.0-4.0)
1.7% (0.4-0.5)
0.0% (0.0-0.0)
0.7% (0.0-3.2)
0.7% (0.2-2.3)
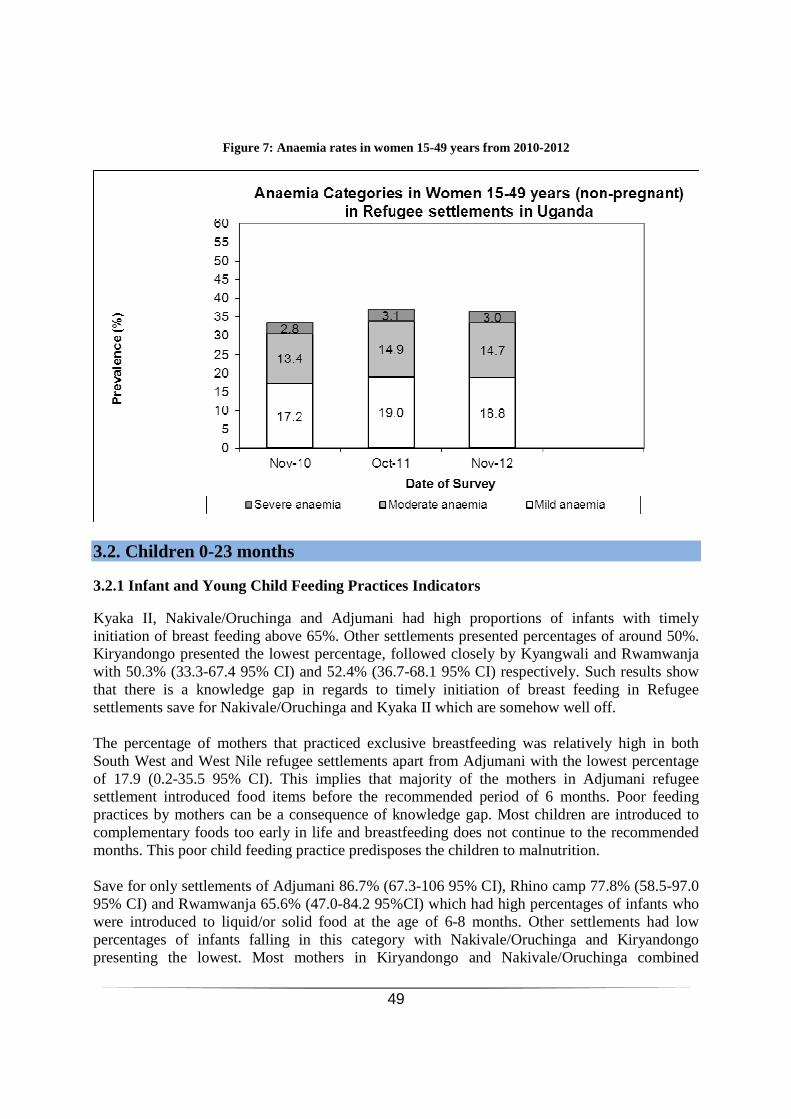
49
Figure 7: Anaemia rates in women 15-49 years from 2010-2012
3.2. Children 0-23 months 3.2.1 Infant and Young Child Feeding Practices Indicators Kyaka II, Nakivale/Oruchinga and Adjumani had high proportions of infants with timely initiation of breast feeding above 65%. Other settlements presented percentages of around 50%. Kiryandongo presented the lowest percentage, followed closely by Kyangwali and Rwamwanja with 50.3% (33.3-67.4 95% CI) and 52.4% (36.7-68.1 95% CI) respectively. Such results show that there is a knowledge gap in regards to timely initiation of breast feeding in Refugee settlements save for Nakivale/Oruchinga and Kyaka II which are somehow well off. The percentage of mothers that practiced exclusive breastfeeding was relatively high in both South West and West Nile refugee settlements apart from Adjumani with the lowest percentage of 17.9 (0.2-35.5 95% CI). This implies that majority of the mothers in Adjumani refugee settlement introduced food items before the recommended period of 6 months. Poor feeding practices by mothers can be a consequence of knowledge gap. Most children are introduced to complementary foods too early in life and breastfeeding does not continue to the recommended months. This poor child feeding practice predisposes the children to malnutrition. Save for only settlements of Adjumani 86.7% (67.3-106 95% CI), Rhino camp 77.8% (58.5-97.0 95% CI) and Rwamwanja 65.6% (47.0-84.2 95%CI) which had high percentages of infants who were introduced to liquid/or solid food at the age of 6-8 months. Other settlements had low percentages of infants falling in this category with Nakivale/Oruchinga and Kiryandongo presenting the lowest. Most mothers in Kiryandongo and Nakivale/Oruchinga combined

50
introduced liquid/or solid food to their children before making 6 months. These foodstuffs were given to children before the first six months recommended for exclusive breastfeeding. Discussion with the community revealed that the practice of introducing foods as early as four months is widely accepted, almost for all children. This was explained on the basis that at four months, the breast milk becomes insufficient to support the normal development of the child. Consumption of iron-rich or iron-fortified foods was low in all settlements; for example in Rwamwanja the percentage of consumption was 0.0. Kyaka II and Kyangwali with percentages of 20% (2.1-37.9 95% CI) and 20.8% (1.6-39.9 95% CI) had the highest study population which had consumed iron rich foods. This explains why the prevalence of anaemia in children (6-59months) was high beyond prescribed levels and is of great public health concern. Over all of the children surveyed, those practising bottle feeding presented a very low percentage, below 15%, apart from settlements of Adjumani and Rhino camp with 29.9% (15.8-44.1 95% CI) and 36.8% (3.0-70.7 95% CI) respectively. Such low percentages can be attributed in part to bottle feeding being an expensive practise for such communities. Table 23: Prevalence of infant and Young Child Feeding Practices Indicator Kyaka II Kyangwali Nakivale/Oruchinga Rwamwanja
Indicator Age range (Months)
No/total Prevalence (%) 95% CI
No/total Prevalence (%) 95% CI
No/total Prevalence (%) 95% CI
No/total Prevalence (%) 95% CI
Timely initiation of breastfeeding
0-23 109/147 74.2 62.4-85.9 74/147
50.3
33.3-67.4
227/280
81.1
74.9-87.3
109/208
52.4
36.7-68.1
Exclusive breastfeeding under 6 months
0-5 31/42 73.8 60.6-87.1 26/34
76.5
59.4-93.6
78/98
79.6
67.9-91.3
33/41
80.5
64.7-96.2
Continued breastfeeding at 1 year
12-15 24/29 82.8 66.5-99.0 26/29
89.7
77.5-101.8
53/55
96.4
91.9-100.8
53/60
88.3
81.0-95.6
Continued breastfeeding at 2 years
20-23 5/8 62.5
48.5-83.5
12/19
63.2
40.3-86.0
35/59
59.3
39.1-79.5
3/17
17.6
7.8-43.1
Introduction of solid, semi-solid or soft foods
6-8 9/18 50.0 25.2-74.8 9/18
50.0
18.2-81.8
12/32
37.5
14.7-60.3
21/32
65.6
47.0-84.2
Consumption of iron-rich or iron-fortified foods
6-23 19/95 20.0 2.1-37.9 21/101
20.8
1.6-39.9
5/220
2.3
0.2-4.8
0/159
0.0
0-0
Bottle feeding 0-23 11/146 7.5 2.6-12.4 10/140 7.14 1.2-13.1 31/302 10.3 6.8-13.8 26/204 12.7 4.3-21.2
Kiryandongo Adjumani Rhino camp
Indicator Age range Number/ total
Prevalence (%)
95% CI Number/ total
Prevalence (%)
95% CI Number/ total
Prevalence (%)
95% CI
Timely initiation of breastfeeding
0-23 months
46/97
47.4
30.1-64.7
99/150
66
52.2-79.8
54/95
56.8
21.3-92.4
Exclusive breastfeeding under 6 months
0-5 months 15/21 71.4 38.5-104.0
5/28
17.9
0.2-35.5
15/23
65.2
49.6-80.9
Continued breastfeeding at 1 year
12-15 months 18/18 100 100-100
29/29
100
100-100
26/26
100
100-100
Continued breastfeeding at 2 years
20-23 months 7/14 50 12.9-87.1 11/19 57.9 26.1-89.7
3/4 75 52.0-98.0
Introduction of solid, semi-solid or soft foods
6-8 months 5/13 38.5 2.5-79.4
13/15
86.7
67.3-106.0
7/9
77.8
58.5-97.0
Consumption of iron-rich or iron-fortified foods
6-23 months 13/69 18.8 0.8-36.9
18/101
17.8
2.9-32.7
1/68
1.5
0-5.3
Bottle feeding 0-23 months 8/97 8.2 2.2-14.3 44/147 29.9 15.8-44.1 35/95 36.8 3.0-70.7

51
Figure 8: Comparison in prevalence of key IYCF indicators (2010-2012)
53.7 68.4
31.2 75.8
0
10
20
30
40
50
60
70
80
90
100
Nov-10 Nov-12
Pre
va
len
ce (
%)
Date of Survey
Trends in Prevalence of Key IYCF Indicators*
South West and West Nile refugee settlements
Timely initiation of
breastfeeding
Exclusive breastfeeding
under 6m
*Prevalence of consumption of iron rich foods and bottle feeding were not captured in 2010 and 2011 nutrition assessment
3.2.2 Type of liquid/ or solid foods given Infants who had been fed on infant formula were at 37.7% (21.0-54.4 95% CI) in Rwamwanja, 38.3% (8.1-68.4% 95%CI) in Rhino camp and 30.5% (18.1-42.9 95%CI) in Adjumani. Other settlements had very low percentages below 20%. The rest of the items were consumed by few children, in most cases less than 20% except in Adjumani and Rhino camp at about 35%. Juice and yoghurt were the least consumed items. Table 24: Type of fluids given to the children the previous day
Kyaka Kyangwali Nakivale/Oruchinga Rwamwanja
Type of food No/Total % (95% CI) No/Total % (95% CI) No/Total % (95% CI) No/Total % (95% CI)
Plain Water 97/147 66.0 (54-78%)
93/130 71.5 (60.4-82.7%)
213/305 69.8 (64-75.7%)
159/207 76.8 (69.5-84.1%)
Infant Formula 25/148 16.9 (8.4-25%)
16/129 12.4 (3.3-21.5%)
18/301 6.0 (1.8-10.1%)
78/207 37.7 (21.0-54.4%)
Milk (Tinned, powdered, fresh animal milk)
13/147 8.8 (2.1-15.6%)
11/129 8.5 (1.4-15.6%)
19/305 6.2 (3.3-9.1%)
10/205 4.9 (1.3-8.5%)
Juice or juice drinks
3/148 2.0 (0.3-4.4)
32/132 24.2 (10.1-38.4%)
22/306 7.2 (3.6-10.8%)
3/205 1.5 (0.2-3.1)
Sour milk or yogurt
4/148 2.7 (0.7-97%)
9/134 6.7 (1.8-11.6%)
23/305 7.5 (3.6-11.5)
10/207 4.8 (1.9-7.8%)
Thin porridge (sorghum, CSB maize, millet,)
67/147 45.6 (32.3-58.9%)
85/144 59.0 (47.8-70.3%)
147/304 48.4 (38.0-58.7%)
144/206 69.9 (62.1-77.7%)
Tea or coffee with milk
2/148 1.4 (0.6-3.3%)
16/135 11.9 (6.5-17.2%)
24/307 7.8 (4.0-11.7%)
11/204 5.4 (1.3-9.5%)
others 8/146 5.5 (0.4-10.6%)
26/134 19.4 (13.8-25.0%)
24/306 7.8 (3.7-11.9%)
21/202 10.4 (6.3-14.5%)
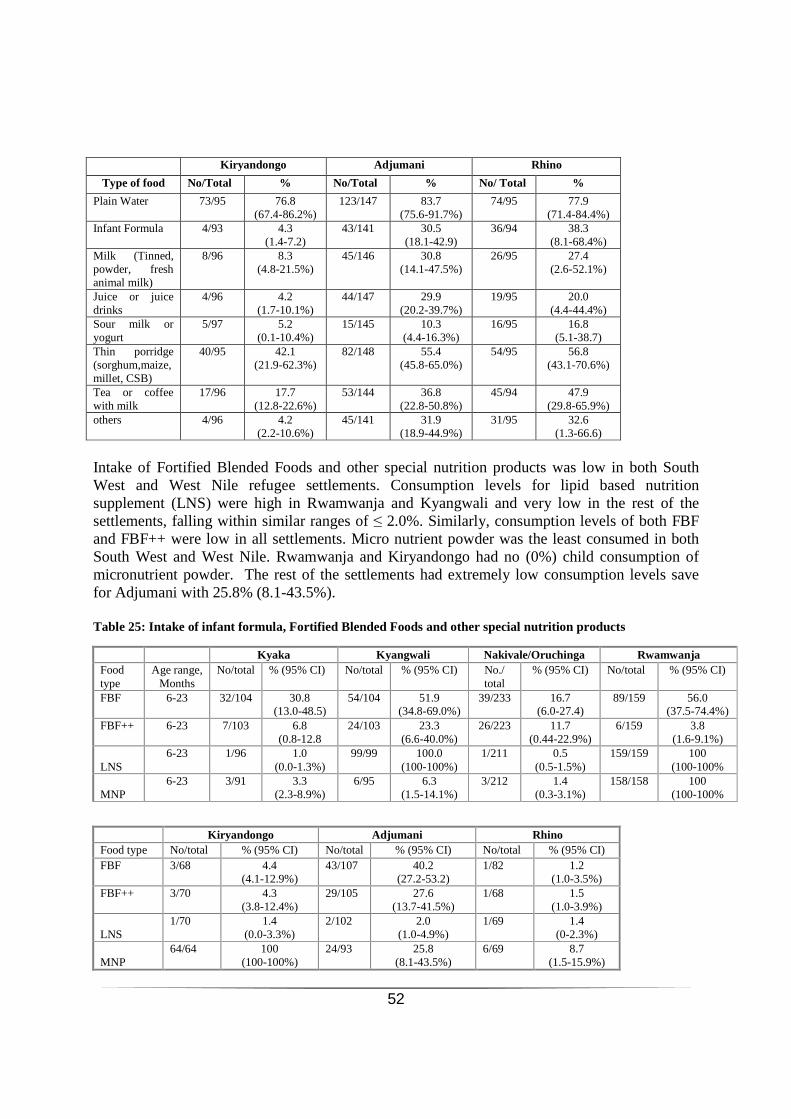
52
Kiryandongo Adjumani Rhino
Type of food No/Total % No/Total % No/ Total %
Plain Water 73/95 76.8 (67.4-86.2%)
123/147 83.7 (75.6-91.7%)
74/95 77.9 (71.4-84.4%)
Infant Formula 4/93 4.3 (1.4-7.2)
43/141 30.5 (18.1-42.9)
36/94 38.3 (8.1-68.4%)
Milk (Tinned, powder, fresh animal milk)
8/96 8.3 (4.8-21.5%)
45/146 30.8 (14.1-47.5%)
26/95 27.4 (2.6-52.1%)
Juice or juice drinks
4/96 4.2 (1.7-10.1%)
44/147 29.9 (20.2-39.7%)
19/95 20.0 (4.4-44.4%)
Sour milk or yogurt
5/97 5.2 (0.1-10.4%)
15/145 10.3 (4.4-16.3%)
16/95 16.8 (5.1-38.7)
Thin porridge (sorghum,maize, millet, CSB)
40/95 42.1 (21.9-62.3%)
82/148 55.4 (45.8-65.0%)
54/95 56.8 (43.1-70.6%)
Tea or coffee with milk
17/96 17.7 (12.8-22.6%)
53/144 36.8 (22.8-50.8%)
45/94 47.9 (29.8-65.9%)
others 4/96 4.2 (2.2-10.6%)
45/141 31.9 (18.9-44.9%)
31/95 32.6 (1.3-66.6)
Intake of Fortified Blended Foods and other special nutrition products was low in both South West and West Nile refugee settlements. Consumption levels for lipid based nutrition supplement (LNS) were high in Rwamwanja and Kyangwali and very low in the rest of the settlements, falling within similar ranges of ≤ 2.0%. Similarly, consumption levels of both FBF and FBF++ were low in all settlements. Micro nutrient powder was the least consumed in both South West and West Nile. Rwamwanja and Kiryandongo had no (0%) child consumption of micronutrient powder. The rest of the settlements had extremely low consumption levels save for Adjumani with 25.8% (8.1-43.5%). Table 25: Intake of infant formula, Fortified Blended Foods and other special nutrition products
Kyaka Kyangwali Nakivale/Oruchinga Rwamwanja Food type
Age range, Months
No/total % (95% CI) No/total % (95% CI) No./ total
% (95% CI) No/total % (95% CI)
FBF 6-23 32/104 30.8 (13.0-48.5)
54/104 51.9 (34.8-69.0%)
39/233 16.7 (6.0-27.4)
89/159 56.0 (37.5-74.4%)
FBF++ 6-23 7/103 6.8 (0.8-12.8
24/103 23.3 (6.6-40.0%)
26/223 11.7 (0.44-22.9%)
6/159 3.8 (1.6-9.1%)
LNS 6-23 1/96 1.0
(0.0-1.3%) 99/99 100.0
(100-100%) 1/211 0.5
(0.5-1.5%) 159/159 100
(100-100%
MNP 6-23 3/91 3.3
(2.3-8.9%) 6/95 6.3
(1.5-14.1%) 3/212 1.4
(0.3-3.1%) 158/158 100
(100-100%
Kiryandongo Adjumani Rhino Food type No/total % (95% CI) No/total % (95% CI) No/total % (95% CI) FBF 3/68 4.4
(4.1-12.9%) 43/107 40.2
(27.2-53.2) 1/82 1.2
(1.0-3.5%) FBF++ 3/70 4.3
(3.8-12.4%) 29/105 27.6
(13.7-41.5%) 1/68 1.5
(1.0-3.9%)
LNS 1/70 1.4
(0.0-3.3%) 2/102 2.0
(1.0-4.9%) 1/69 1.4
(0-2.3%)
MNP 64/64 100
(100-100%) 24/93 25.8
(8.1-43.5%) 6/69 8.7
(1.5-15.9%)
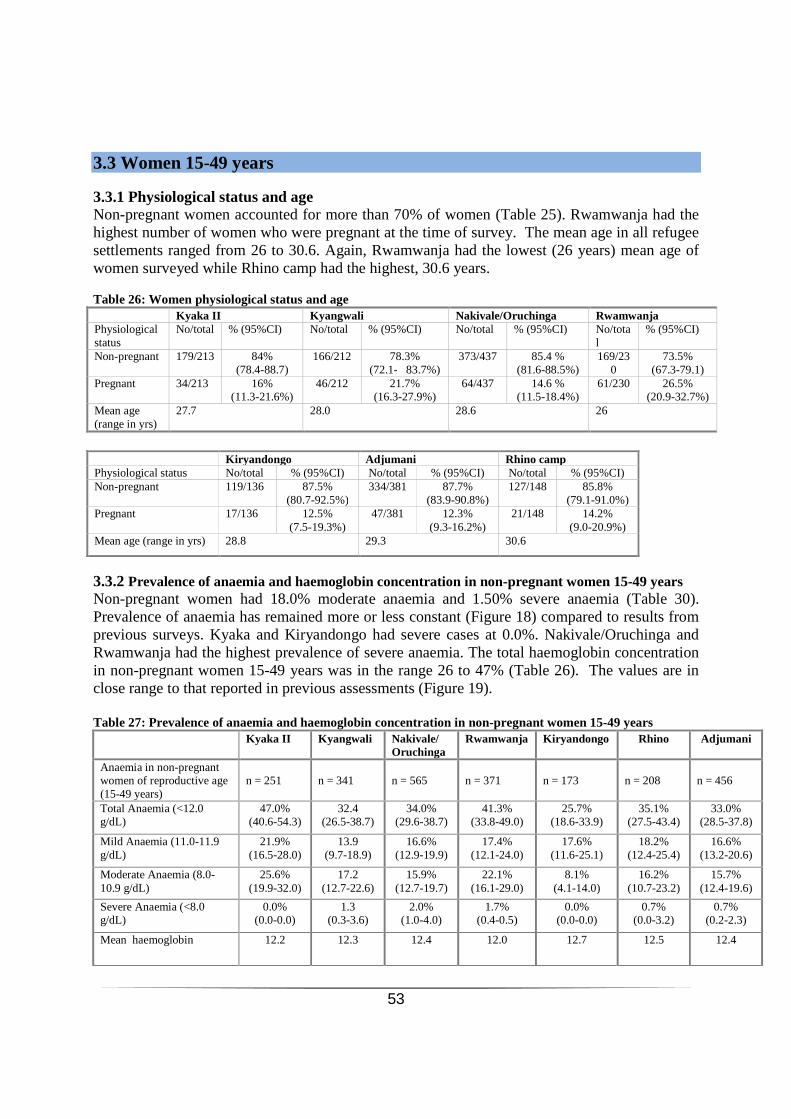
53
3.3 Women 15-49 years 3.3.1 Physiological status and age Non-pregnant women accounted for more than 70% of women (Table 25). Rwamwanja had the highest number of women who were pregnant at the time of survey. The mean age in all refugee settlements ranged from 26 to 30.6. Again, Rwamwanja had the lowest (26 years) mean age of women surveyed while Rhino camp had the highest, 30.6 years. Table 26: Women physiological status and age Kyaka II Kyangwali Nakivale/Oruchinga Rwamwanja Physiological status
No/total % (95%CI) No/total % (95%CI) No/total % (95%CI) No/total
% (95%CI)
Non-pregnant 179/213 84% (78.4-88.7)
166/212 78.3% (72.1- 83.7%)
373/437 85.4 % (81.6-88.5%)
169/230
73.5% (67.3-79.1)
Pregnant 34/213 16% (11.3-21.6%)
46/212 21.7% (16.3-27.9%)
64/437 14.6 % (11.5-18.4%)
61/230 26.5% (20.9-32.7%)
Mean age (range in yrs)
27.7 28.0 28.6 26
Kiryandongo Adjumani Rhino camp Physiological status No/total % (95%CI) No/total % (95%CI) No/total % (95%CI) Non-pregnant 119/136 87.5%
(80.7-92.5%) 334/381 87.7%
(83.9-90.8%) 127/148 85.8%
(79.1-91.0%) Pregnant 17/136 12.5%
(7.5-19.3%) 47/381 12.3%
(9.3-16.2%) 21/148 14.2%
(9.0-20.9%) Mean age (range in yrs) 28.8 29.3 30.6
3.3.2 Prevalence of anaemia and haemoglobin concentration in non-pregnant women 15-49 years Non-pregnant women had 18.0% moderate anaemia and 1.50% severe anaemia (Table 30). Prevalence of anaemia has remained more or less constant (Figure 18) compared to results from previous surveys. Kyaka and Kiryandongo had severe cases at 0.0%. Nakivale/Oruchinga and Rwamwanja had the highest prevalence of severe anaemia. The total haemoglobin concentration in non-pregnant women 15-49 years was in the range 26 to 47% (Table 26). The values are in close range to that reported in previous assessments (Figure 19). Table 27: Prevalence of anaemia and haemoglobin concentration in non-pregnant women 15-49 years
Kyaka II Kyangwali Nakivale/ Oruchinga
Rwamwanja Kiryandongo Rhino Adjumani
Anaemia in non-pregnant women of reproductive age (15-49 years)
n = 251
n = 341
n = 565
n = 371
n = 173
n = 208
n = 456
Total Anaemia (<12.0 g/dL)
47.0% (40.6-54.3)
32.4 (26.5-38.7)
34.0% (29.6-38.7)
41.3% (33.8-49.0)
25.7% (18.6-33.9)
35.1% (27.5-43.4)
33.0% (28.5-37.8)
Mild Anaemia (11.0-11.9 g/dL)
21.9% (16.5-28.0)
13.9 (9.7-18.9)
16.6% (12.9-19.9)
17.4% (12.1-24.0)
17.6% (11.6-25.1)
18.2% (12.4-25.4)
16.6% (13.2-20.6)
Moderate Anaemia (8.0-10.9 g/dL)
25.6% (19.9-32.0)
17.2 (12.7-22.6)
15.9% (12.7-19.7)
22.1% (16.1-29.0)
8.1% (4.1-14.0)
16.2% (10.7-23.2)
15.7% (12.4-19.6)
Severe Anaemia (<8.0 g/dL)
0.0% (0.0-0.0)
1.3 (0.3-3.6)
2.0% (1.0-4.0)
1.7% (0.4-0.5)
0.0% (0.0-0.0)
0.7% (0.0-3.2)
0.7% (0.2-2.3)
Mean haemoglobin 12.2 12.3 12.4 12.0 12.7 12.5 12.4
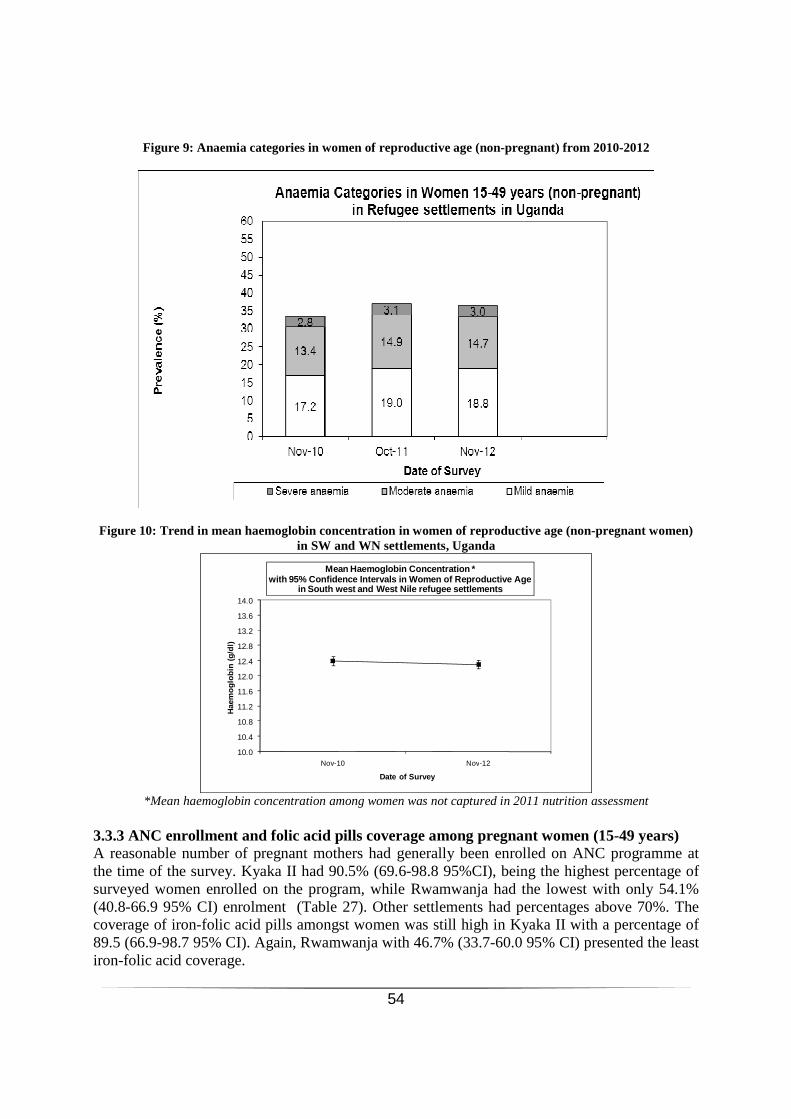
54
Figure 9: Anaemia categories in women of reproductive age (non-pregnant) from 2010-2012
Figure 10: Trend in mean haemoglobin concentration in women of reproductive age (non-pregnant women)
in SW and WN settlements, Uganda
10.0
10.4
10.8
11.2
11.6
12.0
12.4
12.8
13.2
13.6
14.0
Nov-10 Nov-12
Hae
mo
glo
bin
(g
/dl)
Date of Survey
Mean Haemoglobin Concentration *with 95% Confidence Intervals in Women of Reproductive Age
in South west and West Nile refugee settlements
*Mean haemoglobin concentration among women was not captured in 2011 nutrition assessment
3.3.3 ANC enrollment and folic acid pills coverage among pregnant women (15-49 years) A reasonable number of pregnant mothers had generally been enrolled on ANC programme at the time of the survey. Kyaka II had 90.5% (69.6-98.8 95%CI), being the highest percentage of surveyed women enrolled on the program, while Rwamwanja had the lowest with only 54.1% (40.8-66.9 95% CI) enrolment (Table 27). Other settlements had percentages above 70%. The coverage of iron-folic acid pills amongst women was still high in Kyaka II with a percentage of 89.5 (66.9-98.7 95% CI). Again, Rwamwanja with 46.7% (33.7-60.0 95% CI) presented the least iron-folic acid coverage.

55
Table 28: ANC enrolment and iron-folic acid pills coverage among pregnant women (15-49 years) Kyaka II Kyangwali Nakivale/Oruchinga Rwamwanja
No /total % (95% CI) No/total % (95%CI) No /total % (95%CI) No /total
% (95%CI)
Currently enrolled in ANC programme
19/21 90.5 (69.6-98.8)
31/43 72.1 (52.9-91.3)
50/64 78.1 (66.0-87.5)
33/61 54.1 (40.8-66.9)
Currently receiving iron-folic acid pills
17/19 89.5 (66.9-98.7)
25/43 58.14 (33.7-82.5)
44/63 69.8 (57.0-80.8)
28/60 46.7 (33.7-60.0)
Kiryandongo Adjumani Rhino
No /total % (95% CI) No/ total % (95%CI) No/ total % (95% CI)
Currently enrolled in ANC programme
13/17 76.5 (50.1-93.2)
31/41 75.6 (59.7-87.6)
18/24 75.0 (55.6-94.4)
Currently receiving iron-folic acid pills
12/17 70.6 (44.0-89.7)
24/39 61.5 (44.6-76.6)
16/24 66.7 (45.2-88.2)
3.4 Household food security situation in South West and West Nile Refugee settlements 3.4.1 Sample size for food security assessment A total of 2102 households were surveyed for food security status in the refugee settlements of Uganda. This represented a percentage of 97.5% of the target. The details of the numbers surveyed per settlement camp are provided in table 28 below. Table 29: Sample size for food security assessment by settlement camps Settlement Planned Actual % of target Kyaka II 254 258 101.6 Kyangwali 340 229 67.4 Nakivale/Oruchinga 381 420 110 Rwamwanja 372 375 100.8 Kiryandongo 166 171 103 Adjumani 439 416 94.8 Rhino 204 233 114 Total 2156 2102 97.5
3.4.2 Food Distribution About 46% of the households received food at 50% the month prior to the survey. 10% of the households received 60% of food ration, 31.7% received 100% food ration while 13.7% received no food ration. Rwamwanja had the highest number of beneficiaries on 100% food ration. Kiryandongo and Kyangwali refugee settlements had the highest number of households who mentioned that they did not receive food in the previous month. Of the households who said they did not receive food, in both South West and West Nile settlements, very few households reported that they had lost their cards with Kyaka and Rwamwanja having the highest values of not greater than 20%. Nakivale/Oruchinga and Rhino had the highest number of households that were not registered at 64.5 % and 50.0%, respectively. Kyangwali had the highest number of households that were not in the targeting

56
criteria with 74.5% followed by Kiryandongo and Adjumani whose prevalence were within the same range of 51.9 and 51.4 respectively. Rwamwanja and Rhino camp had the greatest percentage of households that gave other reasons with the same prevalence rate of 50 %. Almost no household mentioned that they had traded their card. Table 30: Ration card coverage by settlement camp Ration Percentage
Kyaka II Kyangwali Nakivale/Oruchinga Rwamwanja
No/total % (95% CI) No/total % (95% CI) No/total % (95% CI) No/total % (95% CI)
Proportion of households with 50% ration
196/258 76.0 (70.5-81.1)
21/229 9.2 (5.7-13.1)
275/420 65.5% (61.0%-70.1%)
1/375 0.3 (0.0-0.9)
Proportion of households with 60% ration
19/258 7.4 (4.0-10.8)
32/229
14.0 (9.7-18.3)
26/420 6.2% (3.9%-8.5%)
40/375 10.7 (7.8-14.1)
Proportion of households with 100% ration
31/258 12.0 (8.1-16.0)
79/229 34.5 (28.2-40.6)
91/420 21.7% (17.8%-25.5)%
328/375 87.5 (83.8-90.7)
Proportion of households with card (total)
246/258 95.3% (91.0-99.7)
132/229 57.6% (40.3-75.0)
392/420 93.3% (89.7-97.0)
369/375 98.4 % (97.0-99.8)
Proportion of households without card/or on zero (0%) food ration
12/258
4.7 (2.2-7.3)
97/229 42.4 (35.7-48.9)
28/420 6.7% (4.5%-9.2%)
6/375 1.6 (0.5-3.0)
Ration Percentage
Kiryandongo Adjumani Rhino
No/ total % (95% CI) No/ total % (95% CI) No/ total % (95% CI)
Proportion of households with 50% ration
60/171 35.1 (28.5-41.9)
158/416 38.0 (33.7-43.4)
225/233 96.6 (94.0-98.7)
Proportion of households with 60% ration
3/171 1.8 (0.0-4.0)
88/416 21.0 (17.6-25.8)
2/233 1.0 (0.0-2.2)
Proportion of households with 100% ration
3/171 1.8 (0.0-3.9)
132/416 31.7 (27.7-36.9)
3/233 1.3 (0.0-2.9)
Proportion of households with card (total)
66/171 38.6 (19.3-57.8)
378/417 90.9 (86.1-95.7)
230/233 98.7 (97.1-100.3)
Proportion of households without card
105/171 61.4 (53.9-68.1)
38/416 9.1 (6.5-11.8)
3/233 1.3 (0.0-3.0)
Table 31: Proportion (%) of households without card Kyaka II
Kyangwali
Nakivale/ Oruchinga
Rwamwanja
Kiryandongo
Adjumani
Rhino
Not registered (but eligible)
18.2
11.2
64.5
33.3
12.5
34.3
50
Lost card 18.2 1.0 9.7 16.7 1.9 11.4 0.0 Traded card 0.0 1.0 3.2 0.0 0.0 0.0 0.0 Not eligible 36.4 74.5 6.5 0.0 51.9 51.4 0.0 Other reasons 27.3 12.2 16.1 50.0 33.7 2.9 50

57
Rwamwanja had the highest average duration/days for the general food ration with 22.5 days, followed by Kiryandongo, Adjumani, Kyangwali, Rhino camp and Kyaka. Nakivale/Oruchinga combined had the least average duration of 9 days for the general food ration. Table 32: Reported duration of general food ration by settlement Settlement Average number of days Average duration (%) in relation to theoretical
duration Kyaka 7.6 7.6/30 x 100 = 25.3% Kyangwali 10.9 10.9/30 x 100 = 36.3% Nakivale/Oruchinga 9.0 9/30 x 100 = 30.0% Rwamwanja 22.5 22.5/30x100 = 75% Kiryandongo 19.5 19.5/30 x 100 = 65% Adjumani 18.3 18.3/30 x 100 = 61% Rhino 10.6 10.6/30 x 100 = 35.3% Total In general, food ration reportedly lasted for about 14 days from the time of distribution. Households who received 100% food ration had the longest duration within which the food lasted. The difference between the expected number of days within which the food ration is supposed to last and the actual number of days it lasted was minimal for households on 50% ration but slightly higher for households on 100% food ration. However, there was no difference for households on 60% food ration. According to the information obtained from the survey, the majority of the households (83%) had food lasting less than 75% of the cycle. It should however be noted that food utilization in the household is dependent on a number of factors such as selling food, presence of visitors, theft etc which were not taken into account during the study. Table 33: Reported duration of general food ration Settlement Entire duration of cycle
(100% of cycle) < 75% of the cycle > 75% of the cycle
Number of HH/ Total
% (95% CI) Number of HH/ Total
% (95% CI) Number of HH/ Total
% (95% CI)
Kyaka 12/247 4.9 (2.5-8.3)
198/247 80.2 (74.6-84.9)
49/247 19.8 (15.1-25.4)
Kyangwali 21/135 15.6 (9.9-22.8)
66/135 48.9 (40.2-57.6)
69/135 51.1 (42.4-59.8)
Nakivale/Oruchinga 42/389 10.8 ( 8.0-14.4)
269/389 69.2 ( 64.2-73.7)
120/389 30.8 (26.3-35.7)
Rwamwanja 364/368 98.9 (97.0-99.7)
1/368 0.3 (0.0-1.7)
367/368 99.7 (98.3-100.0)
Kiryandongo 0/165 0.0 (0.0-0.0)
165/165 100.0 (100.0-100.0)
0/165 0.0 (0.0-0.0)
Adjumani 246/383 64.2 (59.2-69.0)
62/383 16.2 (12.7-20.4)
321/383 83.8 (79.7-87.4)
Rhino 30/231 13.0 (8.9-18.0)
143/231 61.9 (55.3-68.2)
88/231 38.1 (31.8-44.7)
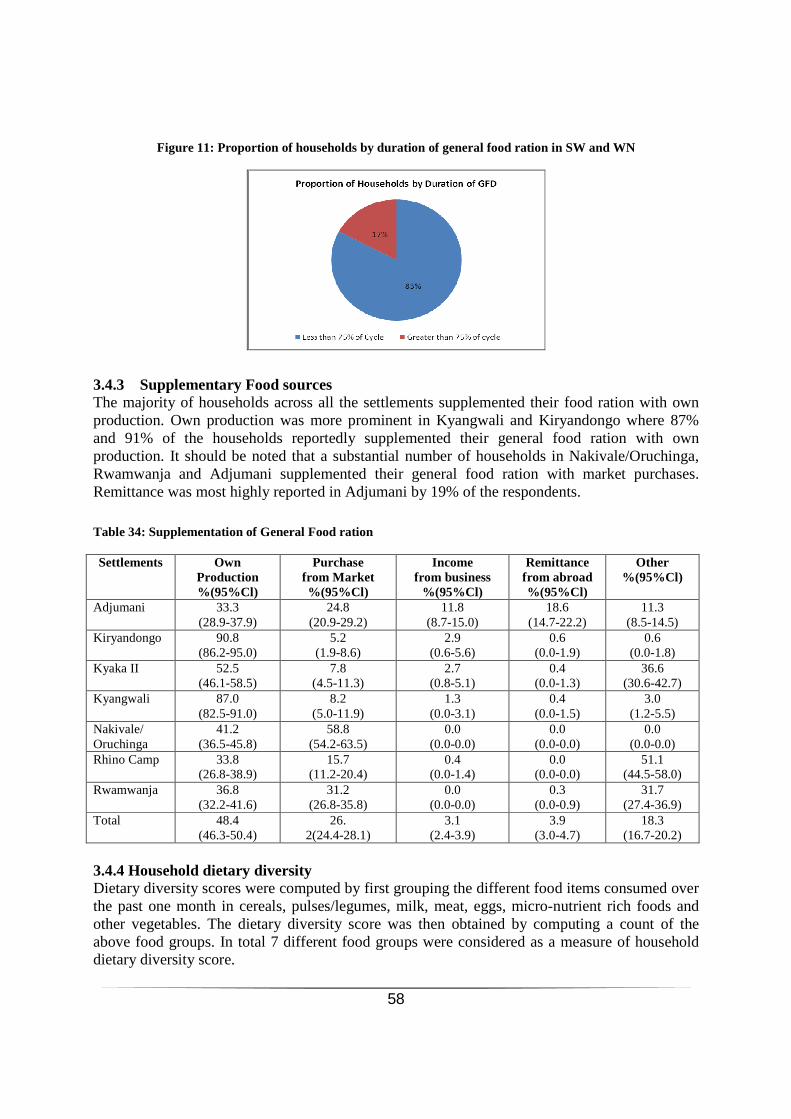
58
Figure 11: Proportion of households by duration of general food ration in SW and WN
3.4.3 Supplementary Food sources The majority of households across all the settlements supplemented their food ration with own production. Own production was more prominent in Kyangwali and Kiryandongo where 87% and 91% of the households reportedly supplemented their general food ration with own production. It should be noted that a substantial number of households in Nakivale/Oruchinga, Rwamwanja and Adjumani supplemented their general food ration with market purchases. Remittance was most highly reported in Adjumani by 19% of the respondents.
Table 34: Supplementation of General Food ration Settlements Own
Production %(95%Cl)
Purchase from Market %(95%Cl)
Income from business
%(95%Cl)
Remittance from abroad %(95%Cl)
Other %(95%Cl)
Adjumani 33.3 (28.9-37.9)
24.8 (20.9-29.2)
11.8 (8.7-15.0)
18.6 (14.7-22.2)
11.3 (8.5-14.5)
Kiryandongo 90.8 (86.2-95.0)
5.2 (1.9-8.6)
2.9 (0.6-5.6)
0.6 (0.0-1.9)
0.6 (0.0-1.8)
Kyaka II 52.5 (46.1-58.5)
7.8 (4.5-11.3)
2.7 (0.8-5.1)
0.4 (0.0-1.3)
36.6 (30.6-42.7)
Kyangwali 87.0 (82.5-91.0)
8.2 (5.0-11.9)
1.3 (0.0-3.1)
0.4 (0.0-1.5)
3.0 (1.2-5.5)
Nakivale/ Oruchinga
41.2 (36.5-45.8)
58.8 (54.2-63.5)
0.0 (0.0-0.0)
0.0 (0.0-0.0)
0.0 (0.0-0.0)
Rhino Camp 33.8 (26.8-38.9)
15.7 (11.2-20.4)
0.4 (0.0-1.4)
0.0 (0.0-0.0)
51.1 (44.5-58.0)
Rwamwanja 36.8 (32.2-41.6)
31.2 (26.8-35.8)
0.0 (0.0-0.0)
0.3 (0.0-0.9)
31.7 (27.4-36.9)
Total 48.4 (46.3-50.4)
26. 2(24.4-28.1)
3.1 (2.4-3.9)
3.9 (3.0-4.7)
18.3 (16.7-20.2)
3.4.4 Household dietary diversity Dietary diversity scores were computed by first grouping the different food items consumed over the past one month in cereals, pulses/legumes, milk, meat, eggs, micro-nutrient rich foods and other vegetables. The dietary diversity score was then obtained by computing a count of the above food groups. In total 7 different food groups were considered as a measure of household dietary diversity score.
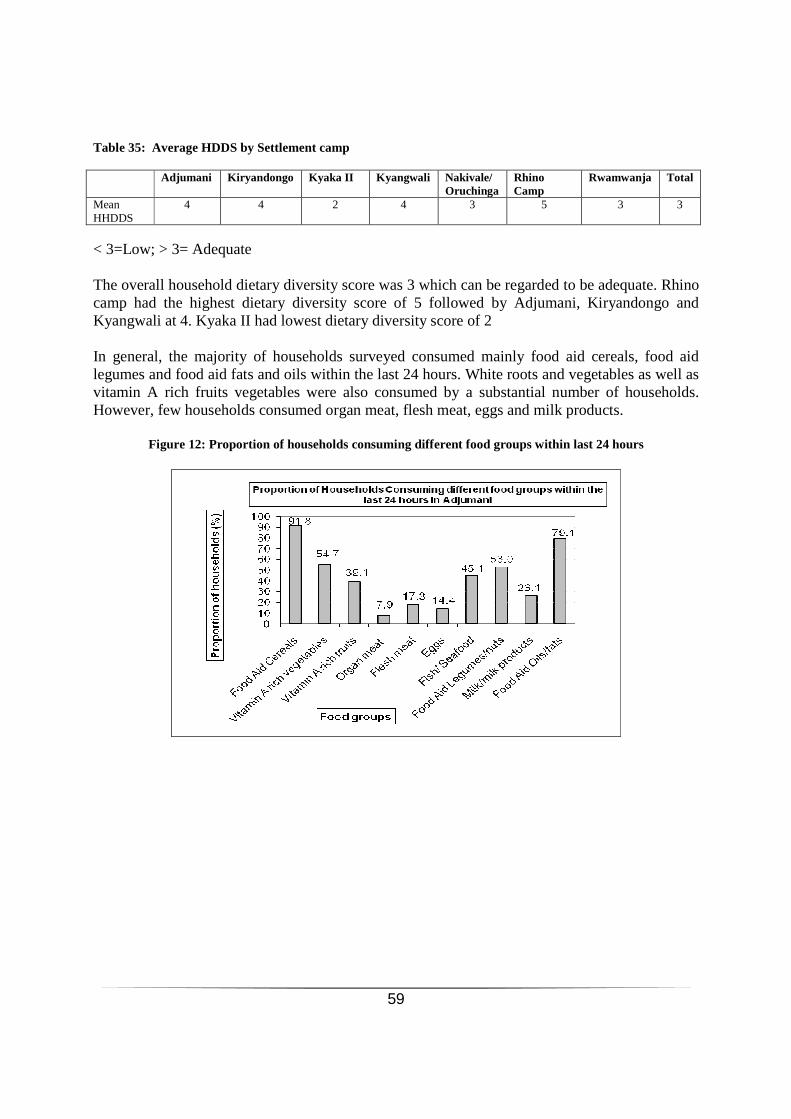
59
Table 35: Average HDDS by Settlement camp Adjumani Kiryandongo Kyaka II Kyangwali Nakivale/
Oruchinga Rhino Camp
Rwamwanja Total
Mean HHDDS
4 4 2 4 3 5 3 3
< 3=Low; > 3= Adequate The overall household dietary diversity score was 3 which can be regarded to be adequate. Rhino camp had the highest dietary diversity score of 5 followed by Adjumani, Kiryandongo and Kyangwali at 4. Kyaka II had lowest dietary diversity score of 2 In general, the majority of households surveyed consumed mainly food aid cereals, food aid legumes and food aid fats and oils within the last 24 hours. White roots and vegetables as well as vitamin A rich fruits vegetables were also consumed by a substantial number of households. However, few households consumed organ meat, flesh meat, eggs and milk products.
Figure 12: Proportion of households consuming different food groups within last 24 hours
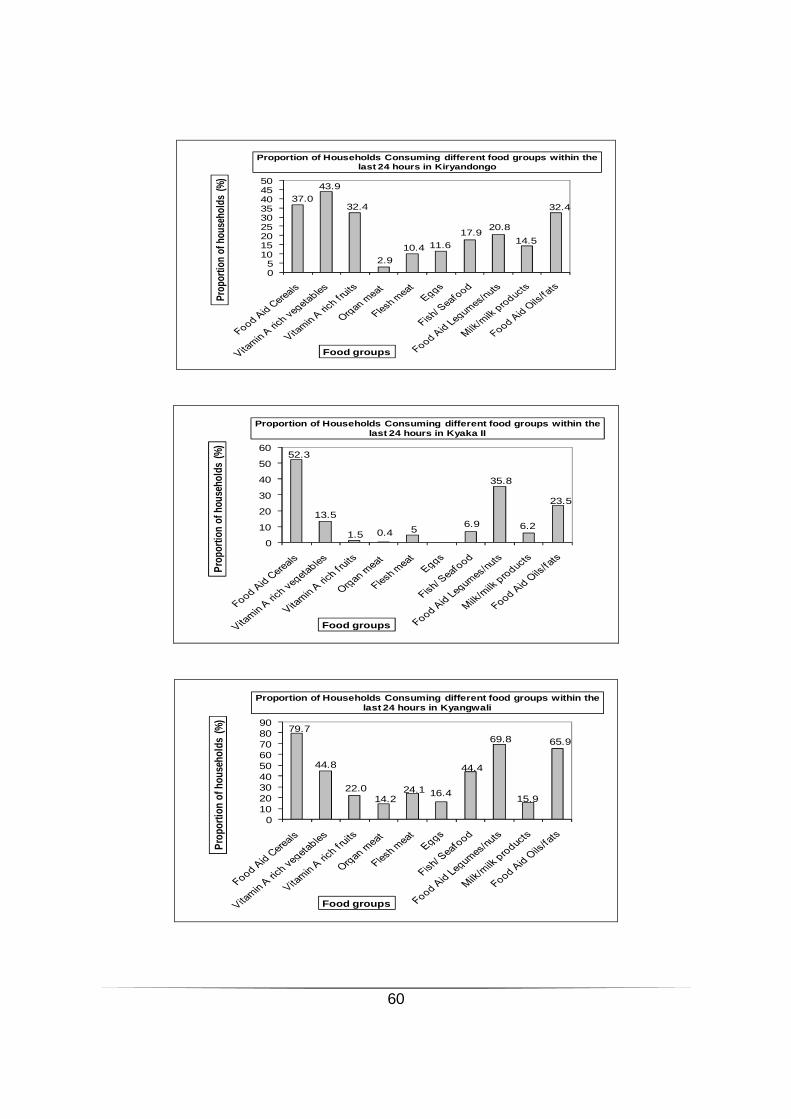
60
37.0
43.9
32.4
2.9
10.4 11.6
17.920.8
14.5
32.4
05
101520253035404550
Prop
ortio
n of
hou
seho
lds
(%)
Food groups
Proportion of Households Consuming different food groups within the last 24 hours in Kiryandongo
52.3
13.5
1.5 0.4 56.9
35.8
6.2
23.5
0
10
20
30
40
50
60
Prop
ortio
n of
hou
seho
lds
(%)
Food groups
Proportion of Households Consuming different food groups within the last 24 hours in Kyaka II
79.7
44.8
22.014.2
24.1 16.4
44.4
69.8
15.9
65.9
0102030405060708090
Prop
ortio
n of
hou
seho
lds
(%)
Food groups
Proportion of Households Consuming different food groups within the last 24 hours in Kyangwali

61
58.3
33.1
15.58.8 10.2
6.0
15.5
62.4
7.9
60.7
0
10
20
30
40
50
60
70
Pro
port
ion
of h
ouse
hold
s (%
)
Food groups
Proportion of Households Consuming different food groups within the last 24 hours in Nakivale/Oruchinga
85.9
67.9
37.229.5
43.2 38.0
54.362.8
46.2
63.7
0102030405060708090
100
Pro
port
ion
of h
ouse
hold
s (%
)
Food groups
Proportion of Households Consuming different food groups within the last 24 hours in Rhino camp
77.6
34.1
6.9 0.3 4.51.3 4.8
63.2
5.3
75.7
0102030405060708090
Pro
port
ion
of h
ouse
hold
s (%
)
Food groups
Proportion of Households Consuming different food groups within the last 24 hours in Rwamwanja

62
SW/WN combined
Table 36: Combined household consumption of food aid commodities and micronutrient rich foods Settlement Food Aid
Cereals
% (95% CI)
Vitamin A rich
vegetables %
(95% CI)
Vitamin A rich Fruits
%
(95%CI)
Organ meat
%
(95% CI)
Flesh meat
% (95% CI)
Eggs
% (95% CI)
Fish/Sea Food
% (95% CI)
Food aid Legumes/
nuts %
(95% CI)
Milk/Milk products
%
(95% CI)
Food Aid oils and
Fats %
(95% CI) Adjumani 91.8
(89.1-94.3) 54.7
(49.8-59.7) 39.1
(34.5-44.0) 7.9
(5.4-10.9) 17.3
(13.5-20.9) 14.4
(11.0-17.9) 45.1
(40.3-50.0) 53.0
(48.3-58.1) 26.1
(21.8-30.3) 79.1
(75.2-83.1) Kiryandongo 37.0
(29.4-44.5) 43.9
(36.9-51.2) 32.4
(25.0-39.4) 2.9
(0.6-5.6) 10.4
(5.7-15.1) 11.6
(6.8-16.6) 17.9
(12.0-24.2) 20.8
(14.4-27.1) 14.5
(9.1-20.0) 32.4
(25.6-39.3) Kyaka II 52.3
(45.7-58.4) 13.5
(9.2-18.0) 1.5
(0.4-3.1) 0.4
(0.0-1.3) 5.0
(2.6-7.9) 0.0%
(0.0-0.0) 6.9
(4.1-10.3) 35.8
(30.1-41.7) 6.2
(3.3-9.3) 23.5
(18.3-29.0) Kyangwali 79.7
(74.1-84.5) 44.8
(38.3-51.4) 22.0
(16.7-27.2) 14.2
(9.9-18.9) 24.1
(18.5-29.7) 16.4
(12.1-21.5) 44.4
(37.9-51.3) 69.8
(63.8-76.1) 15.9
(11.0-20.7) 65.9
(59.2-71.9) Nakivale/ Oruchinga
58.3 (53.9-62.8)
33.1 (28.8-37.6)
15.5 (12.2-19.2)
8.8 (6.1-11.5)
10.2 (7.5-13.2)
6.0 (4.0-8.4)
15.5 (12.0-18.8)
62.4 (57.7-67.0)
7.9 (5.4-10.3)
60.7 (56.2-65.3)
Rhino Camp 85.9 (81.5-90.6)
67.9 (61.8-74.2)
37.2 (30.8-43.4)
29.5 (23.7-35.9)
43.2 (36.7-50)
38.0 (32.0-44.9)
54.3 (47.8-60.9)
62.8 (56.7-69.1)
46.2 (40.0-52.1)
63.7 (57.8-70.0)
Rwamwanja 77.6 (73.1-82.0)
34.1 (30.0-39.1)
6.9 (4.5-9.8)
0.3 (0.0-0.8)
4.5 (2.6-6.8)
1.3 (0.3-2.6)
4.8 (2.8-7.2)
63.2 (58.1-67.9)
5.3 (3.3-7.7)
75.7 (71.4-80.2)
Total 71.3 (69.4-73.1)
41.2 (39.2-43.4)
21.4 (19.7-23.4)
8.5 (7.3-9.7)
15.2 (13.5-16.6)
11.2 (9.9-12.6)
26.1 (24.3-27.9)
54.9 (52.7-57.0)
16.5 (15.0-18.1)
61.0 (59.1-63.0)
Vitamin A rich fruits as well as fish/sea food was consumed by a substantial number of households in Adjumani, Kyangwali and Rhino camp. Kyaka II recorded the poorest frequency of households in terms of consumption of all food items. However in general, less than 50% of the households across all the settlements had access to micronutrient rich vegetables, fruits and animal products such as organ meat, flesh meat, fish and milk products. Consumption of Food aid Fortified Blended Foods The majority of households who received food aid in the previous one month (92%) reported having consumed fortified blended foods. The proportion of households having reported consumption of fortified blended foods was however lower in Kiryandongo compared to the other settlements. The high frequency of households consuming fortified blended could most likely be due to the provision of Corn Soy Blend as part of the food ration.

63
Table 37: Consumption of Food aid Fortified Blended Foods Settlement % of Households
Percent 95%CI Adjumani 95.10 92.9-97.0 Kiryandongo 54.30 46.9-61.7 Kyaka II 99.60 98.7-100.0 Kyangwali 98.30 96.2-99.6 Nakivale/Oruchinga 99.00 98.0-99.8 Rhino Camp 78.50 73.1-83.8 Rwamwanja 100.00 100.0-100.0 Total 92.50 91.3-93.6 3.4.5 Negative Coping Strategies A substantial number of household employed coping mechanisms to sustain their livelihoods over the past one month. In the general, the majority of households mentioned that they either begged or reduced the frequency and size of meals they consumed over the past one month. Adjumani and Kyaka II had the highest number of households reporting that they engaged in one or more coping strategies over the past one month. Table 38: Coping strategies used by the surveyed population over the past month
Kyaka II Kyangwali Nakivale/Oruchinga Rwamwanja
No/total % (95% CI) No/total % (95% CI) No/total % (95% CI) No/total % (95% CI)
Proportion of households reporting using the following coping strategies over the past month*:
321.6 130.2 167.2 110.5
Borrowed cash, food or other items without interest
163/258 63.8 (57.8-69.7)
71/229 31.0 (24.9-37.1)
173/420 41.1 (36.1-45.8)
42/375 11.3 (11.2-14.6)
Sold any assets (furniture, seed stocks, tools, other NFI, livestock etc.)
132/258 50.8 (44.5-57.1)
71/229 15.5 (10.8-20.4)
110/420 26.3 (22.3-30.6)
63/375 16.7 (12.9-20.5)
Requested increase remittances or gifts as compared to normal
95/258 37.0 (31.1-42.9)
35/229 6.9 (4.1-10.5)
98/420 23.4 (19.6-27.5)
109/375 29.0 (24.3-33.6)
Reduced the quantity and/or frequency of meals
222/258 86.2 (81.9-90.5)
16/229 43.1 (37.3-50.0)
197/420 46.9 (41.9-52.0)
69/375 18.3 (14.4-22.2)
Begged
138/258 53.5 (47.6-59.6)
99/229 27.2 (21.6-32.8)
110/420 26.3 (21.9-30.6)
123/375 32.8 (27.9-37.8)
Engaged in potentially risky or harmful activities (list activities)
52/258 21.3 (16.3-26.0)
15/229 6.5 (3.5-9.7)
13/420 3.1 (1.6-5.0)
9/375 2.4 (1.1-4.0)
Proportion of households reporting using none of the coping strategies over the past month
3/258 1.15 (0-2.5)
82/229 36 (23.3-49.1)
142/420 33.8% (19.1-48.5)
216/375 57.6 (39.9-75.4)

64
Kiryandongo Adjumani Rhino
No/total % (95% CI) No/total % (95% CI) No/total % (95% CI)
Proportion of households reporting using the following coping strategies over the past month*:
259.9 270.5 285.4
Borrowed cash, food or other items without interest
53/171 31.2 (25.5-37.1)
235/416 56.7 (51.4-61.5)
73/233 31.2 (25.5-37.1)
Sold assets (furniture, seed stocks, tools, other NFI, livestock etc.)
99/171 58.0 (51.5-64.2)
100/416 24.0 (19.8-28.1)
135/233 58.0 (51.5-64.2)
Requested increase remittances or gifts as compared to normal
77/171 45.0 (38.8-51.3)
249/416 60.0 (55.1-64.5)
105/233 45.0 (38.8-51.3)
Reduced the quantity and/or frequency of meals
140/171 81.0 (75.3-86.0)
294/416 70.7 (6.4-74.9)
189/233 81.0 (75.3-86.0)
Begged
105/171 61.5 (55.0-67.8)
216/416 52.1 (46.8-57.2)
143/233 61.5 (55.0-67.8)
Engaged in potentially risky or harmful activities (list activities)
15/171 8.7 (5.2-12.7)
29/416 7.0 (4.5-9.7)
20/233 8.7 (5.2-12.7)
Proportion of households reporting using none of the coping strategies over the past month
14/171 8.1% (2.99-13.2)
56/416 13.43% (8.07-18.8)
26/233 11.1% (2.6-19.6)
* The total is be over 100% as households may use several negative coping strategies. 3.6 Water, Hygiene and Sanitation (WASH) 3.6.1 Sample size for water, hygiene and sanitation indicators A total of 2098 (97.3% of those targeted) households across all refugee settlements of Uganda were surveyed for water, hygiene and sanitation indicators (Table 38). Table 39: Sample size for Water, hygiene and Sanitation indicators per settlement Camp Planned Actual % of target Kyaka II 254 253 100 Kyangwali 340 231 70 Nakivale/Oruchinga 381 420 110 Rwamwanja 372 372 100 Kiryandongo 166 172 104 Adjumani 439 416 95 Rhino camp 204 233 92 Total 2156 2098 97 3.6.2 Water Quality An estimated 95% of households in all settlements apart from Nakivale/Oruchinga and Rwamwanja had access to improved water source (Table 39). All settlements in West Nile that is; Kiryandongo, Adjumani and Rhino camp had 100% access to improved water sources. Kyaka II and Kyangwali in South West had high values of 99.2% (97.2-99.9 95%) and 97.4% (94.4-99.0 95%), respectively. Nakivale/Oruchinga and Rwamwanja had low access to quality water at 52.6 % (47.7-57.5 95%) and 82.7% (78.1-86.7 95%), respectively.

65
Table 40: Water Quality in the settlement camps of Uganda Camp Improved drinking water
source Unimproved drinking water source
Use a covered or narrow necked container for storing drinking water
Number of HH/ Total % (95% CI)
Number of HH/ Total % (95% CI)
Number of HH/ Total % (95% CI)
Kyaka 251/253 99.2 (97.2-99.9)
2/253 0.8 (0.1-2.8)
71/251 28.3 (22.8-34.3)
Kyangwali 225/231 97.4 (94.4-99.0)
6/231 2.6 (1.0-5.6)
93/231 40.3 (33.9-46.9)
Nakivale / Oruchinga
221/420 52.6 (47.7-57.5)
199/420 47.4 (42.5-52.3)
118/419 28.2 (24.0-32.8)
Rwamwanja 263/318 82.7 (78.1-86.7)
55/318 17.3 (13.4-22.0)
116/373 31.1 (26.5-36.1)
Kiryandongo 172/172 100.0 (100.0-100.0)
0/172 0.0 (0.0-0.0)
62/167 37.1 (29.8-44.9)
Adjumani 416/416 100.0 (100.0-100.0)
0/416 0.0 (0.0-0.0)
164/409 40.1 (35.3-45.0)
Rhino camp 233/233 100.0 (100.0-100.0)
0/233 0.0 (0.0-0.0)
55/231 23.8 (18.5-29.8)
West Nile settlements reported higher percentages of households using > 20 litres of water per person per day than those of South West. SW reported higher fraction of households using < 15 litres of water per person per day (Table 40). This trend links access to improved water source and the amount of water used per person per day. This means that settlements without access to improved water source lack water in their homes. Table 41: Amount of water used per person per day Camp ≥ 20 lpppd 15 – <20 lpppd <15 lpppd
Number of HH/ Total % (95% CI)
Number of HH/ Total % (95% CI)
Number of HH/ Total % (95% CI)
Kyaka 48/249 19.3 (14.6-24.7%)
27/249 10.8 (7.3-15.4%)
174/249 69.9 (63.8-75.5%)
Kyangwali 67/231 29.0 (23.2-35.3%)
38/231 16.5 (11.9-21.9%)
126/231 54.5 (47.9-61.1%)
Nakivale/ Oruchinga
27/413 6.5 (4.4-9.5%)
34/413 8.2 (5.8-11.4%)
352/413 85.2 (81.4-88.4%)
Rwamwanja 75/371 20.2 (16.3-24.7%)
38/371 10.2 (7.4-13.9%)
258/371 69.5 (64.6-74.2%)
Kiryandongo 75/166 45.2 (37.5-53.1)
33/166 19.9 (14.1-26.8)
58/166 34.9 (27.7-42.7)
Adjumani 219/403 54.3 (49.3-59.3%)
83/403 20.6 (16.8-24.9%)
101/403 14.5 (10.3-19.7%)
Rhino camp 150/234 64.1 (57.6-70.2%)
50/234 21.4 (16.3-27.2%)
34/234 25.1 (21.0-29.6%)
A reasonable proportion of households took less than 30 minutes to and from the main drinking water source (Table 41). This was particularly apparent in Kyaka II, Kiryandongo and Adjumani with percentages of 70.5 (64.2-76.3 95%), 91.3 (86.0-95.0 95%) and 72.7 (68.0-76.9 95%), respectively. Meanwhile, majority in Nakivale/Oruchinga (70.5% (65.7-74.9 95% CI), Rwamwanja (57.7 % (52.5-62.9 95% CI) and Rhino camp (81.5% (72.9-88.3 95% CI) reported taking more than 30 minutes.

66
Table 42: Time taken to collect water from main drinking water source Camp Take less than 30 minutes Take more than 30 minutes
Number of HH / Total % (95% CI)
Number of HH / Total % (95% CI)
Kyaka 165/234 70.5 (64.2-76.3%)
69/234 29.5 (23.7-35.8%)
Kyangwali 108/213 50.7 (43.8-57.6%)
105/213 49.3 (42.4-56.2%)
Nakivale/ Oruchinga 117/397 29.5 (25.1-34.3%)
280/397 70.5 (65.7-74.9%)
Rwamwanja 153/362 42.3 (37.1-47.5%)
209/362 57.7 (52.5-62.9%)
Kiryandongo 157/172 91.3 (86.0-95.0%)
15/172 8.7 (5.0-14.0%)
Adjumani 298/410 72.7 (68.0-76.9%)
112/410 27.3 (23.1-32.0%)
Rhino camp 20/108 18.5 (11.7-27.1%)
88/108 81.5 (72.9-88.3%)
A high proportion of households Kiryandongo (86.5% (80.5-91.3 95% CI), Adjumani (77.1% (72.6-81.0 95% CI), and Kyaka II (79.5% (74.0-84.4 95%CI) were satisfied with the drinking water supply. In Kyangwali and Rwamwanja, level of appreciation of water supply was respectively, 53.5% (46.8-60.2) and 43.4% (37.8-49.1). Nakivale/Oruchinga and Rhino camp had the least percentage, 20.2% (16.5-24.5 95% CI), of people who reported being satisfied with the drinking water supply (Table 42).
Table 43: Satisfaction with water supply
Camp Number /Total % (95% CI) Kyaka 198/249 79.5 (74.0-84.4) Kyangwali 121/226 53.5 (46.8-60.2) Nakivale/Oruchinga 83/410 20.2 (16.5-24.5) Rwamwanja 134/309 43.4 (37.8-49.1) Kiryandongo 148/171 86.5 (80.5-91.3) Adjumani 316/410 77.1 (72.6-81.0) Rhino 45/223 20.2 (15.1-26.1)
Figure 13: Proportion of households that say they are satisfied with the water supply
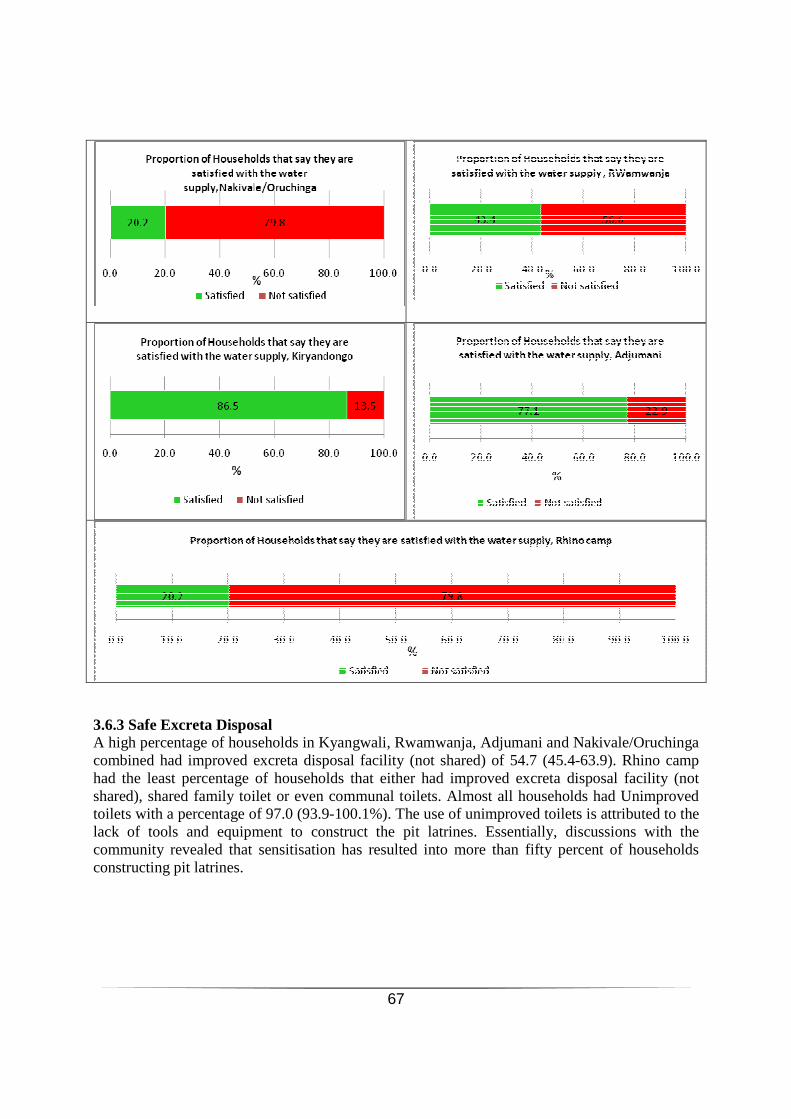
67
3.6.3 Safe Excreta Disposal A high percentage of households in Kyangwali, Rwamwanja, Adjumani and Nakivale/Oruchinga combined had improved excreta disposal facility (not shared) of 54.7 (45.4-63.9). Rhino camp had the least percentage of households that either had improved excreta disposal facility (not shared), shared family toilet or even communal toilets. Almost all households had Unimproved toilets with a percentage of 97.0 (93.9-100.1%). The use of unimproved toilets is attributed to the lack of tools and equipment to construct the pit latrines. Essentially, discussions with the community revealed that sensitisation has resulted into more than fifty percent of households constructing pit latrines.
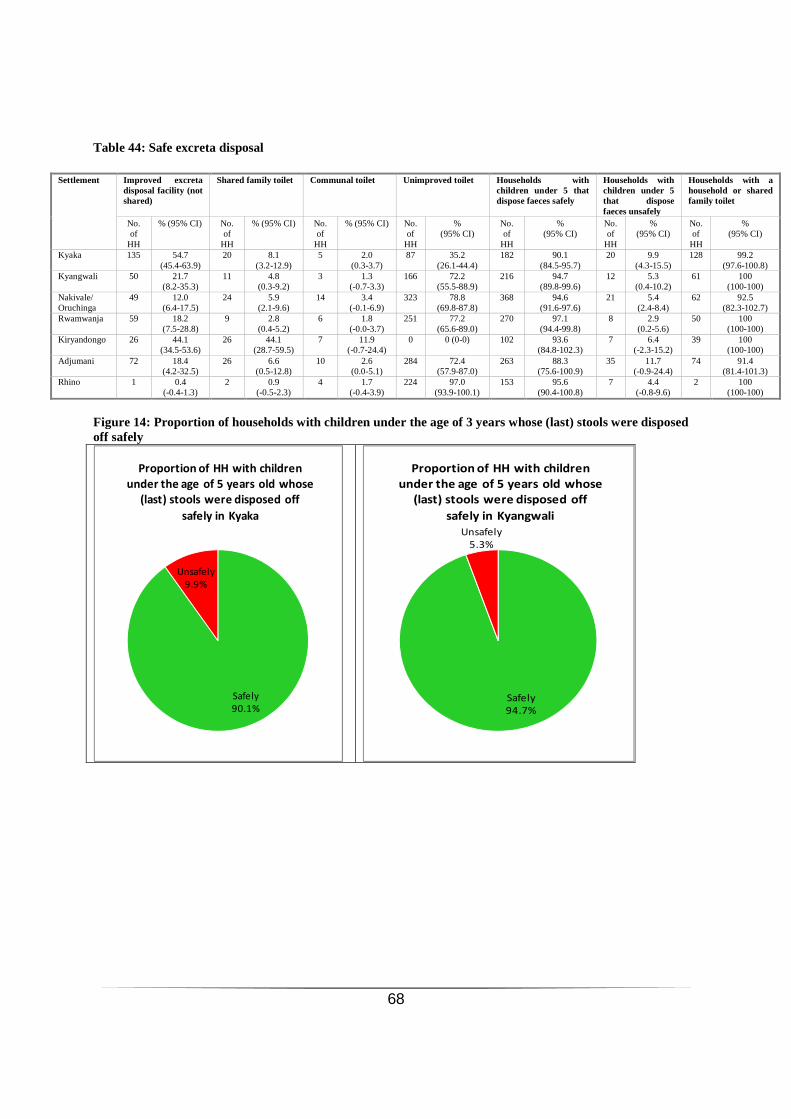
68
Table 44: Safe excreta disposal
Settlement Improved excreta disposal facility (not shared)
Shared family toilet Communal toilet Unimproved toilet Households with children under 5 that dispose faeces safely
Households with children under 5 that dispose faeces unsafely
Households with a household or shared family toilet
No. of
HH
% (95% CI) No. of
HH
% (95% CI) No. of
HH
% (95% CI) No. of
HH
% (95% CI)
No. of
HH
% (95% CI)
No. of
HH
% (95% CI)
No. of
HH
% (95% CI)
Kyaka 135 54.7 (45.4-63.9)
20 8.1 (3.2-12.9)
5 2.0 (0.3-3.7)
87 35.2 (26.1-44.4)
182 90.1 (84.5-95.7)
20 9.9 (4.3-15.5)
128 99.2 (97.6-100.8)
Kyangwali 50 21.7 (8.2-35.3)
11 4.8 (0.3-9.2)
3 1.3 (-0.7-3.3)
166 72.2 (55.5-88.9)
216 94.7 (89.8-99.6)
12 5.3 (0.4-10.2)
61 100 (100-100)
Nakivale/ Oruchinga
49 12.0 (6.4-17.5)
24 5.9 (2.1-9.6)
14 3.4 (-0.1-6.9)
323 78.8 (69.8-87.8)
368 94.6 (91.6-97.6)
21 5.4 (2.4-8.4)
62 92.5 (82.3-102.7)
Rwamwanja 59 18.2 (7.5-28.8)
9 2.8 (0.4-5.2)
6 1.8 (-0.0-3.7)
251 77.2 (65.6-89.0)
270 97.1 (94.4-99.8)
8 2.9 (0.2-5.6)
50 100 (100-100)
Kiryandongo 26 44.1 (34.5-53.6)
26 44.1 (28.7-59.5)
7 11.9 (-0.7-24.4)
0 0 (0-0) 102 93.6 (84.8-102.3)
7 6.4 (-2.3-15.2)
39 100 (100-100)
Adjumani 72 18.4 (4.2-32.5)
26 6.6 (0.5-12.8)
10 2.6 (0.0-5.1)
284 72.4 (57.9-87.0)
263 88.3 (75.6-100.9)
35 11.7 (-0.9-24.4)
74 91.4 (81.4-101.3)
Rhino 1 0.4 (-0.4-1.3)
2 0.9 (-0.5-2.3)
4 1.7 (-0.4-3.9)
224 97.0 (93.9-100.1)
153 95.6 (90.4-100.8)
7 4.4 (-0.8-9.6)
2 100 (100-100)
Figure 14: Proportion of households with children under the age of 3 years whose (last) stools were disposed off safely
Safely
90.1%
Unsafely
9.9%
Proportion of HH with children
under the age of 5 years old whose
(last) stools were disposed off
safely in Kyaka
Safely
94.7%
Unsafely
5.3%
Proportion of HH with children
under the age of 5 years old whose
(last) stools were disposed off
safely in Kyangwali

69
Safely
94.6%
Unsafely
5.4%
Proportion of HH with children
under the age of 5 years old whose
(last) stools were disposed off
safely in Nakivale/Oruchinga
Safely
97.1%
Unsafely
2.9%
Proportion of HH with children
under the age of 5 years old whose
(last) stools were disposed off
safely in Rwamwanja
Safely
93.6%
Unsafely
6.4%
Proportion of HH with children
under the age of 5 years old whose
(last) stools were disposed off
safely in Kiryandongo

70
Safely
95.6%
Unsafely
4.4%
Proportion of HH with children
under the age of 5 years old whose
(last) stools were disposed off
safely in Rhino camp
3.7 Mosquito Net Coverage 3.7.1 Sample size for mosquito net coverage A total of 1924 households were assessed for mosquito net coverage. The breakdown for the sample sizes per settlement camp is provided in table 44.
Table 45: Sample size for mosquito net coverage by settlement camp
Camp Planned Actual % of target Kyaka II 254 254 100 Kyangwali 340 229 67
Nakivale and Oruchinga 381 418 110 Rwamwanja 372 372 100 Kiryandongo 166 172 104 Adjumani 439 417 95 Rhino camp 204 234 115
Total 2156 1924 89.2
3.7.2 Mosquito net ownership The proportion of households who owned at least one mosquito net was below 50% except in Adjumani and Rhino camp (Table 45). Households in Rhino camp had the highest proportion with 64.1% (57.6-70.2 95% CI) while that in Adjumani had 50% (45.5-55.3 95% CI). Kiryandongo (15.1% (10.1-21.4 95%CI) and Nakivale/Oruchinga (15.6% (11.9-18.9 95%CI) had the lowest numbers of households that owned a mosquito net. The same trend was observed for LLIN ownership.
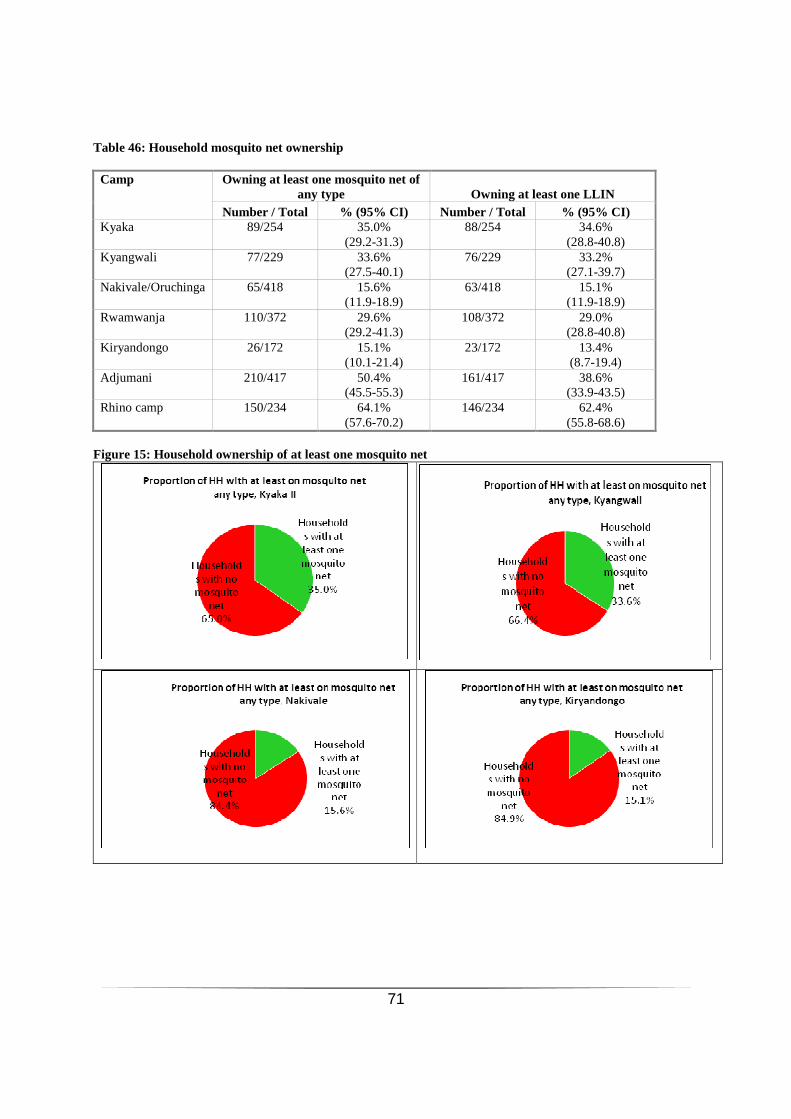
71
Table 46: Household mosquito net ownership Camp Owning at least one mosquito net of
any type Owning at least one LLIN Number / Total % (95% CI) Number / Total % (95% CI)
Kyaka 89/254 35.0% (29.2-31.3)
88/254 34.6% (28.8-40.8)
Kyangwali 77/229 33.6% (27.5-40.1)
76/229 33.2% (27.1-39.7)
Nakivale/Oruchinga 65/418 15.6% (11.9-18.9)
63/418 15.1% (11.9-18.9)
Rwamwanja 110/372 29.6% (29.2-41.3)
108/372 29.0% (28.8-40.8)
Kiryandongo 26/172 15.1% (10.1-21.4)
23/172 13.4% (8.7-19.4)
Adjumani 210/417 50.4% (45.5-55.3)
161/417 38.6% (33.9-43.5)
Rhino camp 150/234 64.1% (57.6-70.2)
146/234 62.4% (55.8-68.6)
Figure 15: Household ownership of at least one mosquito net

72
Figure 16: Household ownership of at least one LLIN

73
Adjumani had the highest average (1.88%) number of LLINs per household while Kyangwali had the lowest, 1.4%. In terms of average number of persons per LLIN, Rhino camp had the lowest value with 5.2 while Kiryandongo presented the highest, 25.5%. The details for average number of LLINs per household and persons per LLIN in each settlement camp are provided in Table 46. Table 47: Average number of LLINs and Average number of persons per LLIN
Camp Average number of LLINs per household (%)
Average number of persons per LLIN (%)
Kyaka II 1.61 9.6
Kyangwali 1.40 12.1 Nakivale and Oruchinga 1.57 24.5 Rwamwanja 1.37 12.4 Kiryandongo 1.78 25.5 Adjumani 1.88 7.0 Rhino camp 1.73 5.2
3.7.3 Mosquito net utilisation by sub-groups Children 0-59 months presented the highest proportion among all sub groups that slept under a

74
mosquito net (both LLIN and any type). Considering total population (all ages), Rhino camp had the highest proportion of surveyed population sleeping under a net, 46.6%. This was followed by Adjumani with 35.1%. Kiryandongo and Nakivale/Oruchinga had the lowest percentages 9.8 and10.2%, respectively. Other settlements had percentages below 40%. Among pregnant women, again Rhino camp presented the highest proportion (59.4%) of pregnant women sleeping under mosquito net. Again it was followed by Adjumani at 48%. Rwamwanja had the lowest proportion (21%) of pregnant women sleeping under a mosquito net of any type Details for each settlement are represented in Table 47. Table 48: Mosquito net utilisation by subgroups per camp Camp Slept under net of any type Slept under LLIN
Total population (all ages)
0-59 months Pregnant women
Total population (all ages)
0-59 months Pregnant women
Total No. % Total No.
% Total No.
% Total No.
% Total No.
% Total No.
%
Kyaka II 1358 24.7 390 29.5 52 36.5 1358 24.2 390 29.9 52 25 Kyangwali 1295 21.9 394 28.7 53 39.6 1295 21.5 394 27.4 53 39.6 Nakivale and Oruchinga
2424 10.2 814 13.3 91 25.3 2424 9.4 814 12.0 91 25.3
Rwamwanja 1834 24 647 26.4 115 21.0 1834 23.5 647 25.6 115 21.0 Kiryandongo 1045 9.8 190 21.6 23 39.1 1045 9.8 190 21.6 23 39.1 Adjumani 2113 35.1 561 36.4 96 48.0 2113 29.5 561 30.1 96 27.1 Rhino camp 1303 46.6 316 60.8 32 59.4 1303 44.7 316 57.3 32 56.3
Figure 17: Mosquito Net Utilisation by sub-groups
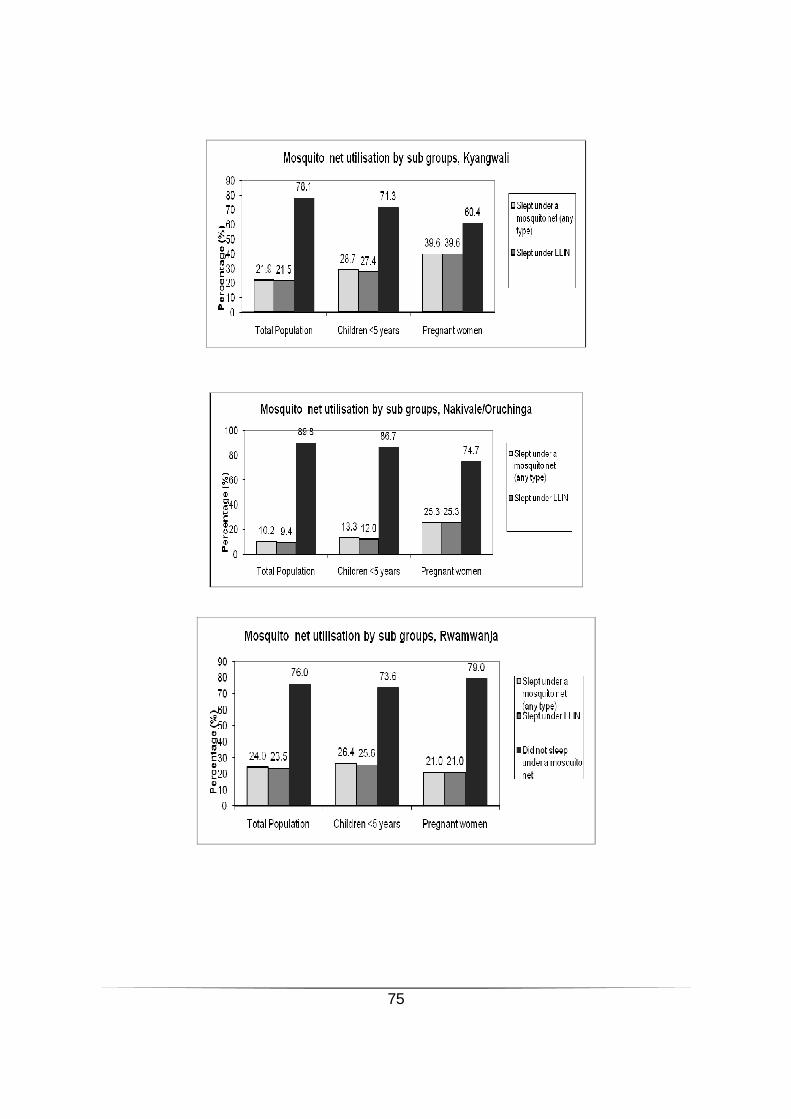
75
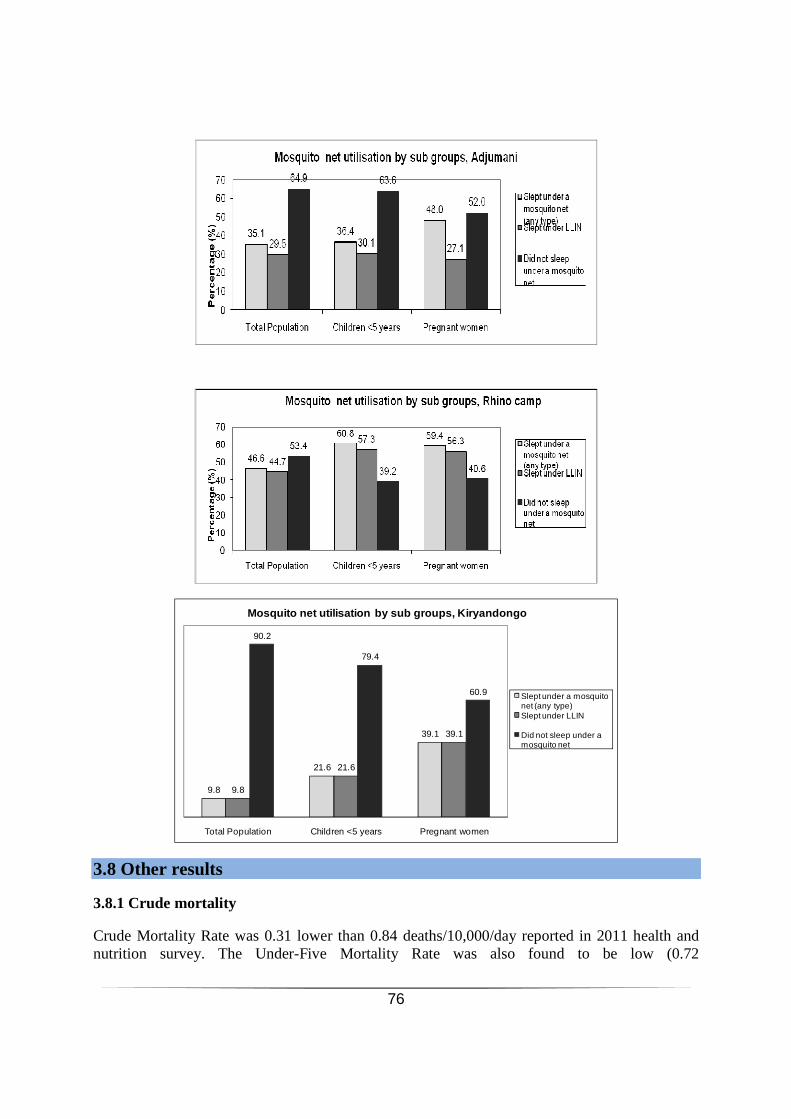
76
9.8
21.6
39.1
9.8
21.6
39.1
90.2
79.4
60.9
Total Population Children <5 years Pregnant women
Mosquito net utilisation by sub groups, Kiryandongo
Slept under a mosquito net (any type)Slept under LLIN
Did not sleep under a mosquito net
3.8 Other results 3.8.1 Crude mortality Crude Mortality Rate was 0.31 lower than 0.84 deaths/10,000/day reported in 2011 health and nutrition survey. The Under-Five Mortality Rate was also found to be low (0.72

77
deaths/10,000/day) compared to 1.09 deaths/10,000/day reported in 2011. Both rates are below the critical levels of 2/10,000 and 4/10,000/day. All settlements in West Nile and South West had Mortality rates less than 1.0/10,000/day which is normal for stable situations. Kyaka II and Rwamwanja had the highest rate of 0.91/10,000/day (0.28-2.89 95%CI) and 0.91/10,000 (0.34-2.47 95%CI), respectively. Kiryandongo, Kyangwali and Nakivale/Oruchinga combined had respective mortality rates of 0.75, 0.64 and 0.53. Adjumani and Rhino camp had the least prevalence of mortality rates. Table 49: Mortality results (retrospective over 3 months/days prior to interview)
Settlement
Mortality rates CMR(total deaths/10,000 people / day) (95% CI)
U5MR/10,000 children under five / day) (95% CI)
Kyaka 0.53 (0.27-1.02)
0.91 (0.28-2.89)
Kyangwali 0.27 (0.06-1.31)
0.64 (0.15-2.77)
Nakivale/Oruchinga 0.49 (0.17-1.37)
0.53 (0.19-1.52)
Rwamwanja 0.38 (0.19-0.73)
0.91 (0.34-2.47)
Kiryandongo 0.23 (0.00-110.80)
0.75 (0.00-110.20)
Adjumani 0.26 (0.05-1.41)
0.45 (0.07-2.90)
Rhino camp 0.21 (0.03-1.61)
0.46 (0.06-3.45)
3.9 Limitations Although respondents were informed that the survey was an information gathering exercise only, unrelated to any kind of distribution, it is possible that some respondents may have exaggerated/misrepresented their situation slightly in the hope of receiving some benefits. 4. Discussion 4.1 Nutritional status of young children Distribution of male to female, sex ratio, followed an equal distribution. In all settlements boys were slightly more than girls with the exemption of Nakivale/Oruchinga. Prevalence of GAM rates were below the critical limits of <15% for an emergency setting across all settlements. Similarly, the SAM levels were below the nutritional emergency threshold of <1%. Three cases of oedema were reported, two in Rwamwanja and one in Nakivale/Oruchinga. The age category of 6-17 months is the worst affected. Present findings when compared to previous assessments indicate a decline in acute malnutrition. Low levels of GAM can partly be attributed to food donation and own food production considering that the assessment was conducted during harvest period. Poor infant and child feeding practices, diseases especially malaria and ARI, unsafe water for drinking, illiteracy among caretakers and mothers were major causes of malnutrition. Stunting rates were high in south west (above 30%) while West Nile low rates within the normal range of <20%. In south west, though average values were below the critical limits (<40%), upper CI suggests that an immediate intervention is needed. Programs that focuses on basic
78
health care services, access to clean water, fortified blended food targeting young children 6-24months and their mothers and sensitization is required to tackle chronic malnutrition 4.2 Programme coverage Measles vaccination was above the national target of 85% in all settlements but below 90% needed to establish herd immunity in some settlements, particularly in Kyaka, Kyangwali, Kiryandongo and Rwamwanja. Deworming coverage was also very low, with the exception of Nakivale/Oruchinga. Kiryandongo in particular had very low vitamin A and deworming coverage. Generally, deworming coverage was below the national target of 85%. The coverage of vitamin A supplementation was above the national target except in Rwamwanja and Kiryandongo. It is therefore vital to step up immunization, continue integrated child health day strategy and health care programmes. In addition, expansion of health care and nutrition services are highly recommended. About 70% of pregnant women had been enrolled on ANC program in all settlements apart from Rwamwanja which had an exceptionally low percentage. With regard to iron-folic acid pills, the same trend was reported in all settlements. Rwamwanja having the lowest percentage of women receiving iron-folic acid pills (46.7%).This is expected since Rwamwanja is newly created with most programmes being rolled out.
4.3 Anaemia in young children and women The incidence of anaemia in children (6-59months) and women (15-49yrs) was of public health concern. Adjumani, Rwamwanja, Kiryandongo and Kyangwali presented high proportion (> 40%) of children with anaemia at levels considered critical. Similarly, women in Kyaka and Rwamwanja had anaemia prevalence beyond prescribed levels. However, anaemia in children decreased when compared to 2010 data. Meanwhile, there was an increase in anaemia among women. This perhaps is attributed to inadequate dietary sources of iron, helminth infestation such as hookworm and jiggers, frequent infections and poor sanitation and hygiene practices. Low enrolment of pregnant women on iron-folic acid pills programme also partly explain such high prevalence levels of anaemia, mainly in Rwamwanja. Diet diversification, better sanitation, continued de-worming and provision of iron supplements are required to avert iron deficiency. 4.4 IYCF indicators Assessment showed that all infants surveyed had ever been breast fed. However it revealed gaps as far as timely initiation of breast feeding and exclusive breast feeding are concerned. For example all settlements apart from Kyaka and Nakivale/Oruchinga reported percentages below 70% of infants that had been timely initiated to breast feeding. Continuous breast feeding up to 2 years also had gaps, as assessment revealed that it was practiced by a few mothers. The introduction of solid foods varied among settlements; in Adjumani and Rhino camp a high percentage of infants were introduced to complementary foods at the age category of 6-8 month while in other settlements solid foods were introduced below the age of 6 month, in most cases at 4 month. Consumption of iron-rich/fortified foods coupled with bottle feeding was very low perhaps explaining the high prevalence of anaemia among children. Generally consumption of other liquids like plain water and juices was very low yet they are very important in an infant’s diet. This signifies a knowledge gap as far as feeding is concerned. Such poor feeding practices explain why acute malnutrition is high among infants. Putting in place community support groups along with training of existing community health workers on infant and young child feeding practices and counselling is recommended. This is meant to reduce on delay in timely

79
initiation of breast feeding and lack of knowledge on foods to feed infants. Strengthening of already existing programmes for example through more facilitation is also recommended. Improving on food availability through provision of food aid in particular CSB to support complementary feeding can do a lot. 4.5 Food security Generally food security situation was not so alarming in all settlements as they tend to positively cope through largely own production. Considering ration card coverage, about 46% of the households received food at 50% the month prior to the survey. 10% of the households received 60% of food ration, 31.7% received 100% food ration while 13.7% received no food ration. Rwamwanja had the highest number of beneficiaries on 100% food ration. Kiyandongo and Kyangwali refugee settlements had the highest number of households who mentioned that they did not receive food in the previous month. Of households who said they did not receive food, about 53% mentioned that they were not in the targeting criteria, 21% mentioned that they were eligible but not registered, about 5% mentioned that they had lost their card. Almost no household mentioned that they had traded their card. In general, food ration lasted for about 14 days from the time of distribution. Households who received 100% food ration had the longest duration within which the food lasted. The difference between the expected number of days within which the food ration is expected to last and the actual number of days it lasted was minimal for households on 50% ration but slightly higher for households on 100% food ration. However, there was no difference for households on 60% food ration. According to the information obtained from the survey, the majority of the households (83%) had food lasting less than 75% of the cycle. It should however be noted that food utilization in the household is dependent on a number of factors such as selling food, presence of visitors, theft etc which were not taken into account during the study. The majority of households across all the settlements supplemented their food ration with own production. Own production was more prominent in Kyangwali and Kiryandongo where 87% and 91% of the households reportedly supplemented their general food ration with own production respectively. It should be noted that a substantial number of households in Nakivale/Oruchinga, Rwamwanja and Adjumani supplemented their general food ration with market purchases. Remittance was most highly reported in Adjumani by 19% of the respondents. A substantial number of household employed coping mechanisms to sustain their livelihoods over the past one month. Broadly, the majority of households mentioned that they either begged or reduced the frequency and size of meals they consumed over the past one month. Adjumani and Kyaka II had the highest number of households reporting that they engaged in one or more coping strategies over the past one month. With regard to household dietary diversity score, overall it was 3.5 which according to the classification, is between low and adequate. Rhino camp had the highest dietary diversity score of 5 followed by Adjumani, Kiryandongo and Kyangwali at 4. Kyaka II had the lowest dietary diversity score of 2. In most cases, majority of the households surveyed consumed mainly food aid cereals, food aid legumes and food aid fats and oils over the past one month. White roots and vegetables as well as vitamin A rich fruits and vegetables were also consumed by a substantial number of households. However few households consumed organ meat, flesh meat, eggs and milk products.

80
Vitamin A rich fruits as well as fish/sea food were consumed by a substantial number of households in Adjumani, Kyangwali and Rhino camp. Kyaka II recorded the lowest number of households in terms of consumption of all food items. However in general, less than 50% of the households across all the settlements had access to micro-nutrient rich vegetables, fruits and animal products such as organ meat, flesh meat, fish and milk products. The majority of households (92%) reported having consumed fortified blended foods. The proportion of households that reported consumption of fortified blended foods was however lower in Kiryandongo compared to other settlements. The high frequency of households consuming fortified blended foods could most likely be due to the provision of Corn Soy Blend as part of the food ration. 4.6 WASH Overall 95% of the surveyed households in all settlements except Nakivale/Oruchinga combined and Rwamwanja had access to quality water source. Nakivale/Oruchinga had the lowest percentage, 52.6%. Rwamwanja being a new settlement, water and sanitation services are still being initiated. Nakivale/Rwamwanja could point to breakdown in systems necessitating major repairs and reconstruction. The access to quality water and amount of water used per person per day were closely related. West Nile settlements with access to quality water proportionally reported high proportions of households using ≥ 20L of water. South west settlements, with bigger gaps than west Nile, recorded higher fractions of households using <15L of water. However, access to quality water didn’t compare well with time taken to collect it from the source. For example, Rhino camp where all households reported having access to quality water source took more than 30 minutes to collect it. This shows that though access is there, many people use the same water source resulting in long lines at water sources hence taking longer time. In Nakivale/Oruchinga and Rhino camp settlements, majority of households were not satisfied with the water source. This is likely a result of time taken to collect water and nature of water source. With regard to owning an improved excreta disposal facility (not shared) all settlements had very low percentages (<22) with exemption of Kyaka (54.7%) signifying a gap in excreta disposal. This in part explains the high prevalence of diarrhoea and anaemia. Drilling of boreholes and creating of latrines are required especially in Nakivale/Oruchinga and Rwamwanja. 4.7 Mosquito net coverage In all settlements, mosquito net ownership was low below 40% except in Adjumani and Rhino camp. Most of these nets were of LLIN type. A percentage of at most 25% of the total population surveyed was sleeping under a mosquito net with the exemption of Adjumani and Rhino camp which reported 35% and 46%, respectively. The same trend was reported among the vulnerable groups (pregnant women and children U-5). The low mosquito net utilization in part explains the high prevalence of malaria and anaemia. For example, in Rwamwanja people use mosquito nets as curtains while in Nakivale use them as fishing nets. Hence, community sensitization and continued distribution of mosquito nets is required. 5. Conclusions • On the whole, the current findings indicate a stable nutrition situation among children in
refugee population given that GAM rates were below 5% over years. In spite of the

81
acceptable GAM levels, high anaemia rates and stunting rates (hidden hunger) among children remains a serious concern exceeding emergency thresholds of 40% in all settlements except Kyaka II and Nakivale/Oruchinga. It therefore calls for continuous efforts and concerted support for the on-going interventions to address anaemia. Similarly, anaemia among non-pregnant women of reproductive age 15-49yrs is just below the emergency threshold of 40%.
• Despite most households engaging in coping strategies, the household dietary diversity score
was generally not alarming. While majority of the households reported that the food does not last more than 75% of the cycle, the average number of days food aid lasts compared to what is expected is not substantially far given the fact that, food may be used for other aspects other than home consumption. A significant number of households also had access to micro-nutrient rich vegetables even though this was less than 50% in most of settlements. However, Kyaka II seems to be performing poorly in most indicators. It may therefore need special attention in terms of food security interventions.
6. Recommendations and priorities • Existing nutrition programmes should be continued and linkages between the programmes
strengthened; • Strengthen the food distribution monitoring system including the introduction of on-site food
to monitor the efficiency and equity of the general ration distribution system, and conduct/analyse regular post-distribution monitoring assessments;
• Increase the ratio of Community Health Workers to population served in the newly established Rwamwanja to enhance active case finding of malnourished children and uptake of nutrition programme services by the refugee community;
• Strengthening of community nutrition outreach, community management of acute malnutrition and support to infant and young child nutrition;
• Strengthen the awareness, promotion, and protection of Infant and Young Child Feeding through baby tents, expanded mother to mother support groups, increase sensitisation, and awareness creation on appropriate breast-feeding and complementary feeding practices; and
• Key attention to addressing anaemia and stunting (hidden hunger) levels among children U5s which are still above the Public Health Threshold.
• More attention should also be paid to promoting access to micro-nutrients given that less than 50% of the households had access to Vitamin A rich vegetables and fruits as well as animal proteins especially in Kyaka II.
• There is need to scale up livelihoods activities especially agriculture given that, majority of the households are engaged in the activity to supplement their general food ration.
• In addition, cash related interventions may also be an option to be considered given that a substantial number of households rely on the market to supplement their general food ration.
82
7. References 1. UNHCR (March 2012). Standardized Expanded Nutrition Survey (SENS)guidelines for refugee
populations. Step by step Guide, Modules 1-6,VERSION 1.3. 2. WHO (1995). Physical Status: The Use and Interpretation of Anthropometry and WHO
(2000) The Management of Nutrition in Major Emergencies. 3. WHO (2000). The Management of Nutrition in Major Emergencies. Values are given for a
population living at sea level. 4. Harmonised Training Package (2011) Version 2 Module 17. Infant and young children
feeding: www.ennonline.net/ife 5. Infant and Young Child Feeding Practices (2010): Collecting and Using Data: A Step-by-
Step Guide. Cooperative for Assistance and Relief Everywhere, Inc. (Care USA): www.ennonline.net/ife
6. WHO Indicators for assessing infant and young child feeding practices Part 1 Definitions
(2007) and Part 2 Measurement (2009): 7. FAO (2011) Guidelines for measuring household and individual dietary diversity. 8. FANTA (2006). Household Dietary Diversity Score (HDDS) for Measurement of Household
Food Access: Indicator Guide Version 2.
9. UNHCR/WFP (2010 & 2011). Nutrition, health and food security assessments in south western and west Nile Refugee assessments inn Uganda.

83
8. Acknowledgements
Andre Food Consult (AFC) wishes to thank the United Nations High Commissioner for
Refugees, UNHCR, for the financial and technical support provided during the Health, Nutrition
and Food Security Assessment in South Western and West Nile refugee settlements. We
particularly thank Michael Mawadri, Dr. Kevin Tsatsiyo and Dr. Julius Kasozi for their technical
input.
The assessment was coordinated by Andrew Kiri in West Nile and Dr. Patrick Ogwok in South
West. Their technical support during the planning process, implementation as well as
compilation of the report deserves mention. In addition, Peter Yiga and Catherine Ndibalekela
are commended for field supervision and report writing. Data was analysed by Joseph Irumba
and Stewart Kiwanuka.
We also extend gratitude to the Office of the Prime Minister (OPM), UN World Food
Programme (WFP), NRC, MTI, AAH, GIZ, AHA, Samaritan’s Purse, Red Cross,
Mwanamugimu Nutrition Unit and School of Public Health, Mulago, for the assistance without
which this work would not be possible.
Our profound appreciation goes to the field supervisors; George Drati in Rhino Camp, Joseph
Irumba, Polly Adero and Phillip Akena in Adjumani, Stewart Kiwanuka, Harriet Lydia Muruya
and Kenneth Oonyu in Nakivale and Oruchinga, Peter Yiga, Morris Gleins Ochan, Margaret
Nanyonjo, Vincent Ocaga in Kyaka and Rwamwanja, Catherine Ndibalekela (Kyangwali) and
Tom Onzima (Kiryandogno).
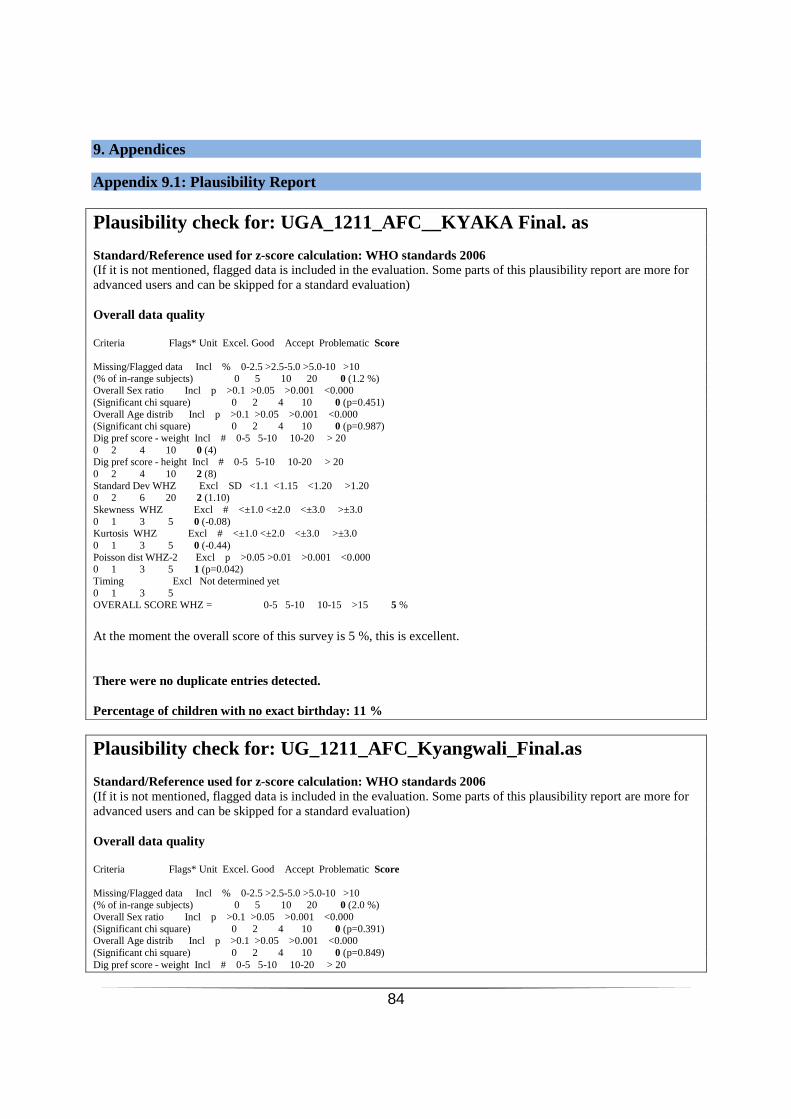
84
9. Appendices Appendix 9.1: Plausibility Report
Plausibility check for: UGA_1211_AFC__KYAKA Final. as Standard/Reference used for z-score calculation: WHO standards 2006 (If it is not mentioned, flagged data is included in the evaluation. Some parts of this plausibility report are more for advanced users and can be skipped for a standard evaluation) Overall data quality Criteria Flags* Unit Excel. Good Accept Problematic Score Missing/Flagged data Incl % 0-2.5 >2.5-5.0 >5.0-10 >10 (% of in-range subjects) 0 5 10 20 0 (1.2 %) Overall Sex ratio Incl p >0.1 >0.05 >0.001 <0.000 (Significant chi square) 0 2 4 10 0 (p=0.451) Overall Age distrib Incl p >0.1 >0.05 >0.001 <0.000 (Significant chi square) 0 2 4 10 0 (p=0.987) Dig pref score - weight Incl # 0-5 5-10 10-20 > 20 0 2 4 10 0 (4) Dig pref score - height Incl # 0-5 5-10 10-20 > 20 0 2 4 10 2 (8) Standard Dev WHZ Excl SD <1.1 <1.15 <1.20 >1.20 0 2 6 20 2 (1.10) Skewness WHZ Excl # <±1.0 <±2.0 <±3.0 >±3.0 0 1 3 5 0 (-0.08) Kurtosis WHZ Excl # <±1.0 <±2.0 <±3.0 >±3.0 0 1 3 5 0 (-0.44) Poisson dist WHZ-2 Excl p >0.05 >0.01 >0.001 <0.000 0 1 3 5 1 (p=0.042) Timing Excl Not determined yet 0 1 3 5 OVERALL SCORE WHZ = 0-5 5-10 10-15 >15 5 %
At the moment the overall score of this survey is 5 %, this is excellent. There were no duplicate entries detected. Percentage of children with no exact birthday: 11 %
Plausibility check for: UG_1211_AFC_Kyangwali_Final.as Standard/Reference used for z-score calculation: WHO standards 2006 (If it is not mentioned, flagged data is included in the evaluation. Some parts of this plausibility report are more for advanced users and can be skipped for a standard evaluation) Overall data quality Criteria Flags* Unit Excel. Good Accept Problematic Score Missing/Flagged data Incl % 0-2.5 >2.5-5.0 >5.0-10 >10 (% of in-range subjects) 0 5 10 20 0 (2.0 %) Overall Sex ratio Incl p >0.1 >0.05 >0.001 <0.000 (Significant chi square) 0 2 4 10 0 (p=0.391) Overall Age distrib Incl p >0.1 >0.05 >0.001 <0.000 (Significant chi square) 0 2 4 10 0 (p=0.849) Dig pref score - weight Incl # 0-5 5-10 10-20 > 20

85
0 2 4 10 0 (5) Dig pref score - height Incl # 0-5 5-10 10-20 > 20 0 2 4 10 2 (8) Standard Dev WHZ Excl SD <1.1 <1.15 <1.20 >1.20 0 2 6 20 2 (1.15) Skewness WHZ Excl # <±1.0 <±2.0 <±3.0 >±3.0 0 1 3 5 0 (-0.09) Kurtosis WHZ Excl # <±1.0 <±2.0 <±3.0 >±3.0 0 1 3 5 0 (-0.43) Poisson dist WHZ-2 Excl p >0.05 >0.01 >0.001 <0.000 0 1 3 5 0 (p=0.111) Timing Excl Not determined yet 0 1 3 5 OVERALL SCORE WHZ = 0-5 5-10 10-15 >15 4 %
At the moment the overall score of this survey is 4 %, this is excellent. There were no duplicate entries detected. Percentage of children with no exact birthday: 0 %
Plausibility check for: UG_1211_AFC_NakivaleOruch_Final.as Standard/Reference used for z-score calculation: WHO standards 2006 (If it is not mentioned, flagged data is included in the evaluation. Some parts of this plausibility report are more for advanced users and can be skipped for a standard evaluation) Overall data quality Criteria Flags* Unit Excel. Good Accept Problematic Score Missing/Flagged data Incl % 0-2.5 >2.5-5.0 >5.0-10 >10 (% of in-range subjects) 0 5 10 20 0 (0.7 %) Overall Sex ratio Incl p >0.1 >0.05 >0.001 <0.000 (Significant chi square) 0 2 4 10 0 (p=0.834) Overall Age distrib Incl p >0.1 >0.05 >0.001 <0.000 (Significant chi square) 0 2 4 10 0 (p=0.167) Dig pref score - weight Incl # 0-5 5-10 10-20 > 20 0 2 4 10 2 (6) Dig pref score - height Incl # 0-5 5-10 10-20 > 20 0 2 4 10 2 (6) Standard Dev WHZ Excl SD <1.1 <1.15 <1.20 >1.20 0 2 6 20 2 (1.15) Skewness WHZ Excl # <±1.0 <±2.0 <±3.0 >±3.0 0 1 3 5 0 (-0.01) Kurtosis WHZ Excl # <±1.0 <±2.0 <±3.0 >±3.0 0 1 3 5 0 (-0.32) Poisson dist WHZ-2 Excl p >0.05 >0.01 >0.001 <0.000 0 1 3 5 0 (p=0.071) Timing Excl Not determined yet 0 1 3 5 OVERALL SCORE WHZ = 0-5 5-10 10-15 >15 6 %
At the moment the overall score of this survey is 6 %, this is good. There were no duplicate entries detected. Percentage of children with no exact birthday: 41 %

86
Plausibility check for: UG_1211_AFC_Rwamwanja_Final.as Standard/Reference used for z-score calculation: WHO standards 2006 (If it is not mentioned, flagged data is included in the evaluation. Some parts of this plausibility report are more for advanced users and can be skipped for a standard evaluation) Overall data quality Criteria Flags* Unit Excel. Good Accept Problematic Score Missing/Flagged data Incl % 0-2.5 >2.5-5.0 >5.0-10 >10 (% of in-range subjects) 0 5 10 20 0 (1.3 %) Overall Sex ratio Incl p >0.1 >0.05 >0.001 <0.000 (Significant chi square) 0 2 4 10 0 (p=1.000) Overall Age distrib Incl p >0.1 >0.05 >0.001 <0.000 (Significant chi square) 0 2 4 10 0 (p=0.755) Dig pref score - weight Incl # 0-5 5-10 10-20 > 20 0 2 4 10 2 (6) Dig pref score - height Incl # 0-5 5-10 10-20 > 20 0 2 4 10 2 (8) Standard Dev WHZ Excl SD <1.1 <1.15 <1.20 >1.20 0 2 6 20 6 (1.18) Skewness WHZ Excl # <±1.0 <±2.0 <±3.0 >±3.0 0 1 3 5 0 (-0.08) Kurtosis WHZ Excl # <±1.0 <±2.0 <±3.0 >±3.0 0 1 3 5 0 (-0.64) Poisson dist WHZ-2 Excl p >0.05 >0.01 >0.001 <0.000 0 1 3 5 0 (p=0.883) Timing Excl Not determined yet 0 1 3 5 OVERALL SCORE WHZ = 0-5 5-10 10-15 >15 10 %
At the moment the overall score of this survey is 10 %, this is good. There were no duplicate entries detected. Percentage of children with no exact birthday: 62 %
Plausibility check for: UG_1211_AFC_Kriyandong_Final.as Standard/Reference used for z-score calculation: WHO standards 2006 (If it is not mentioned, flagged data is included in the evaluation. Some parts of this plausibility report are more for advanced users and can be skipped for a standard evaluation) Overall data quality Criteria Flags* Unit Excel. Good Accept Problematic Score Missing/Flagged data Incl % 0-2.5 >2.5-5.0 >5.0-10 >10 (% of in-range subjects) 0 5 10 20 0 (0.6 %) Overall Sex ratio Incl p >0.1 >0.05 >0.001 <0.000 (Significant chi square) 0 2 4 10 0 (p=0.939) Overall Age distrib Incl p >0.1 >0.05 >0.001 <0.000 (Significant chi square) 0 2 4 10 0 (p=0.107) Dig pref score - weight Incl # 0-5 5-10 10-20 > 20 0 2 4 10 2 (9) Dig pref score - height Incl # 0-5 5-10 10-20 > 20 0 2 4 10 0 (5) Standard Dev WHZ Excl SD <1.1 <1.15 <1.20 >1.20 0 2 6 20 0 (1.08)

87
Skewness WHZ Excl # <±1.0 <±2.0 <±3.0 >±3.0 0 1 3 5 0 (0.18) Kurtosis WHZ Excl # <±1.0 <±2.0 <±3.0 >±3.0 0 1 3 5 0 (-0.35) Poisson dist WHZ-2 Excl p >0.05 >0.01 >0.001 <0.000 0 1 3 5 1 (p=0.017) Timing Excl Not determined yet 0 1 3 5 OVERALL SCORE WHZ = 0-5 5-10 10-15 >15 3 %
At the moment the overall score of this survey is 3 %, this is excellent. There were no duplicate entries detected. Percentage of children with no exact birthday: 0 %
Plausibility check for: UG_1211_AFC_Adjumani_Final.as Standard/Reference used for z-score calculation: WHO standards 2006 (If it is not mentioned, flagged data is included in the evaluation. Some parts of this plausibility report are more for advanced users and can be skipped for a standard evaluation) Overall data quality Criteria Flags* Unit Excel. Good Accept Problematic Score Missing/Flagged data Incl % 0-2.5 >2.5-5.0 >5.0-10 >10 (% of in-range subjects) 0 5 10 20 0 (1.9 %) Overall Sex ratio Incl p >0.1 >0.05 >0.001 <0.000 (Significant chi square) 0 2 4 10 0 (p=0.487) Overall Age distrib Incl p >0.1 >0.05 >0.001 <0.000 (Significant chi square) 0 2 4 10 0 (p=0.513) Dig pref score - weight Incl # 0-5 5-10 10-20 > 20 0 2 4 10 0 (5) Dig pref score - height Incl # 0-5 5-10 10-20 > 20 0 2 4 10 4 (12) Standard Dev WHZ Excl SD <1.1 <1.15 <1.20 >1.20 0 2 6 20 2 (1.13) Skewness WHZ Excl # <±1.0 <±2.0 <±3.0 >±3.0 0 1 3 5 0 (0.20) Kurtosis WHZ Excl # <±1.0 <±2.0 <±3.0 >±3.0 0 1 3 5 0 (-0.18) Poisson dist WHZ-2 Excl p >0.05 >0.01 >0.001 <0.000 0 1 3 5 0 (p=0.957) Timing Excl Not determined yet 0 1 3 5 OVERALL SCORE WHZ = 0-5 5-10 10-15 >15 6 %
At the moment the overall score of this survey is 6 %, this is good. There were no duplicate entries detected. Percentage of children with no exact birthday: 1 %

88
Plausibility check for: UG_1211_AFC_Rhino camp_Final.as Standard/Reference used for z-score calculation: WHO standards 2006 (If it is not mentioned, flagged data is included in the evaluation. Some parts of this plausibility report are more for advanced users and can be skipped for a standard evaluation) Overall data quality Criteria Flags* Unit Excel. Good Accept Problematic Score Missing/Flagged data Incl % 0-2.5 >2.5-5.0 >5.0-10 >10 (% of in-range subjects) 0 5 10 20 0 (1.0 %) Overall Sex ratio Incl p >0.1 >0.05 >0.001 <0.000 (Significant chi square) 0 2 4 10 0 (p=0.679) Overall Age distrib Incl p >0.1 >0.05 >0.001 <0.000 (Significant chi square) 0 2 4 10 0 (p=0.653) Dig pref score - weight Incl # 0-5 5-10 10-20 > 20 0 2 4 10 2 (7) Dig pref score - height Incl # 0-5 5-10 10-20 > 20 0 2 4 10 4 (17) Standard Dev WHZ Excl SD <1.1 <1.15 <1.20 >1.20 0 2 6 20 0 (0.99) Skewness WHZ Excl # <±1.0 <±2.0 <±3.0 >±3.0 0 1 3 5 0 (0.25) Kurtosis WHZ Excl # <±1.0 <±2.0 <±3.0 >±3.0 0 1 3 5 0 (-0.20) Poisson dist WHZ-2 Excl p >0.05 >0.01 >0.001 <0.000 0 1 3 5 0 (p=0.754) Timing Excl Not determined yet 0 1 3 5 OVERALL SCORE WHZ = 0-5 5-10 10-15 >15 6 %
At the moment the overall score of this survey is 6 %, this is good. There were no duplicate entries detected. Percentage of children with no exact birthday: 6 %
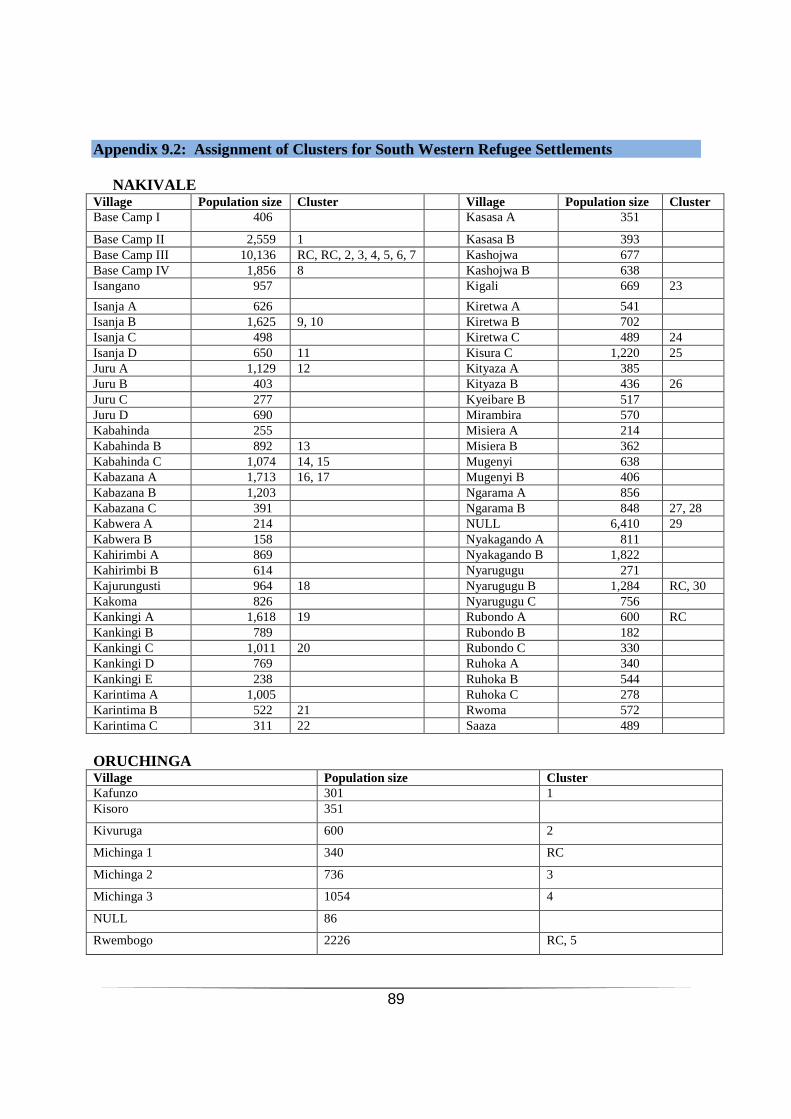
89
Appendix 9.2: Assignment of Clusters for South Western Refugee Settlements NAKIVALE Village Population size Cluster Village Population size Cluster Base Camp I 406 Kasasa A 351
Base Camp II 2,559 1 Kasasa B 393 Base Camp III 10,136 RC, RC, 2, 3, 4, 5, 6, 7 Kashojwa 677 Base Camp IV 1,856 8 Kashojwa B 638 Isangano 957 Kigali 669 23
Isanja A 626 Kiretwa A 541 Isanja B 1,625 9, 10 Kiretwa B 702 Isanja C 498 Kiretwa C 489 24 Isanja D 650 11 Kisura C 1,220 25 Juru A 1,129 12 Kityaza A 385 Juru B 403 Kityaza B 436 26 Juru C 277 Kyeibare B 517 Juru D 690 Mirambira 570 Kabahinda 255 Misiera A 214 Kabahinda B 892 13 Misiera B 362 Kabahinda C 1,074 14, 15 Mugenyi 638 Kabazana A 1,713 16, 17 Mugenyi B 406 Kabazana B 1,203 Ngarama A 856 Kabazana C 391 Ngarama B 848 27, 28 Kabwera A 214 NULL 6,410 29 Kabwera B 158 Nyakagando A 811 Kahirimbi A 869 Nyakagando B 1,822 Kahirimbi B 614 Nyarugugu 271 Kajurungusti 964 18 Nyarugugu B 1,284 RC, 30 Kakoma 826 Nyarugugu C 756 Kankingi A 1,618 19 Rubondo A 600 RC Kankingi B 789 Rubondo B 182 Kankingi C 1,011 20 Rubondo C 330 Kankingi D 769 Ruhoka A 340 Kankingi E 238 Ruhoka B 544 Karintima A 1,005 Ruhoka C 278 Karintima B 522 21 Rwoma 572 Karintima C 311 22 Saaza 489
ORUCHINGA Village Population size Cluster Kafunzo 301 1 Kisoro 351
Kivuruga 600 2
Michinga 1 340 RC
Michinga 2 736 3
Michinga 3 1054 4
NULL 86
Rwembogo 2226 RC, 5

90
KYAKA II
Village Population size Cluster Village Population size Cluster
Bukere A 742 RC Kaborogota A 812 8
Bukere B 1345 1 Kaborogota B 399
Buliti A 432 Kakoni A 486
Buliti B 411 Kakoni B 378
Byabakora I 289 2, 3 Kitonzi 1409 9, 10
Byabakora II 732 Kyamagabo 428 11
Byabakora III 543 4 Mukondo A 1239 RC, 12
Byabakora IV 761 Mukondo B 798 13, 14
Byabakora V 469 Mukondo C 428
Byabakora VI 353 5 Mukondo D 446
Central 372 Ndolelire 870 15
Dam I 523 6
Ruchinga/Nyarugugu B/Kisoro/Kigali/Kahirimbi B/NULL 171
Dam II 861 7 Umura 312
Itambabiniga 404 KYANGWALI
Village Population size Cluster Ngurue 816 Nyambogo 1,274 1 Kyebitaka 3,394 2, 3, 4 Kasonga 1,950 5, 6 Mukarange 1,851 7 Kinekyeitaka 1,598 Kagoma 2,229 8 Nyampindu 861 RC Munsisa A 1,422 9 Munsisa B 1,016 10, 11 Malembo 1,080 12
Mukunyu 1,105 RC Rwenyawawa 1,907 13, 14 Nyamiganda 1,454 15
RWAMWANJA
Village Population size Cluster Rwamwanja 1,599 1, 2, 3, 4, 5 Base Camp 2,236 6, 7 Buguta 458 8, 9 Kaihora 4,739 RC, 10, 11 Kyempango 7,761 12, 13, RC, 14, 15, 16, 17, 18, 19 Mahani 2,959 20, 21 Nkoma 2,614 RC, 22, 23, 24
Waijagahe 582 25
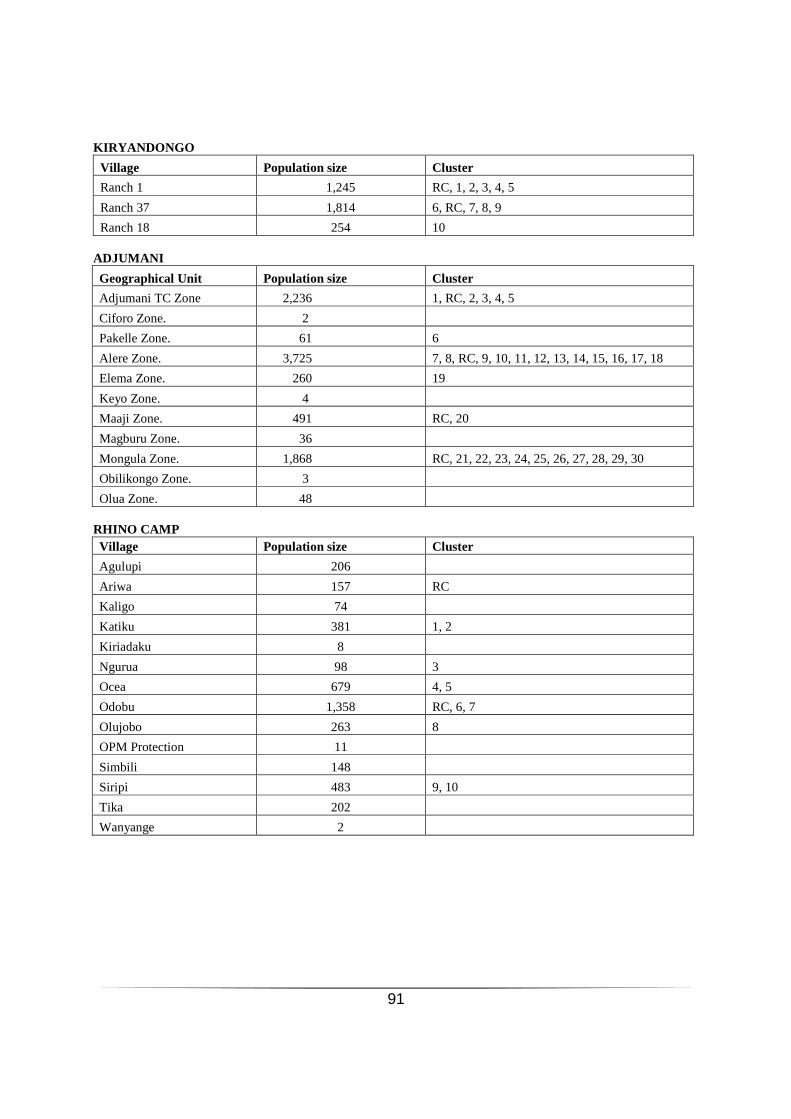
91
KIRYANDONGO
Village Population size Cluster
Ranch 1 1,245 RC, 1, 2, 3, 4, 5
Ranch 37 1,814 6, RC, 7, 8, 9
Ranch 18 254 10 ADJUMANI
Geographical Unit Population size Cluster
Adjumani TC Zone 2,236 1, RC, 2, 3, 4, 5
Ciforo Zone. 2
Pakelle Zone. 61 6
Alere Zone. 3,725 7, 8, RC, 9, 10, 11, 12, 13, 14, 15, 16, 17, 18
Elema Zone. 260 19
Keyo Zone. 4
Maaji Zone. 491 RC, 20
Magburu Zone. 36
Mongula Zone. 1,868 RC, 21, 22, 23, 24, 25, 26, 27, 28, 29, 30
Obilikongo Zone. 3
Olua Zone. 48
RHINO CAMP Village Population size Cluster
Agulupi 206
Ariwa 157 RC
Kaligo 74
Katiku 381 1, 2
Kiriadaku 8
Ngurua 98 3
Ocea 679 4, 5
Odobu 1,358 RC, 6, 7
Olujobo 263 8
OPM Protection 11
Simbili 148
Siripi 483 9, 10
Tika 202
Wanyange 2
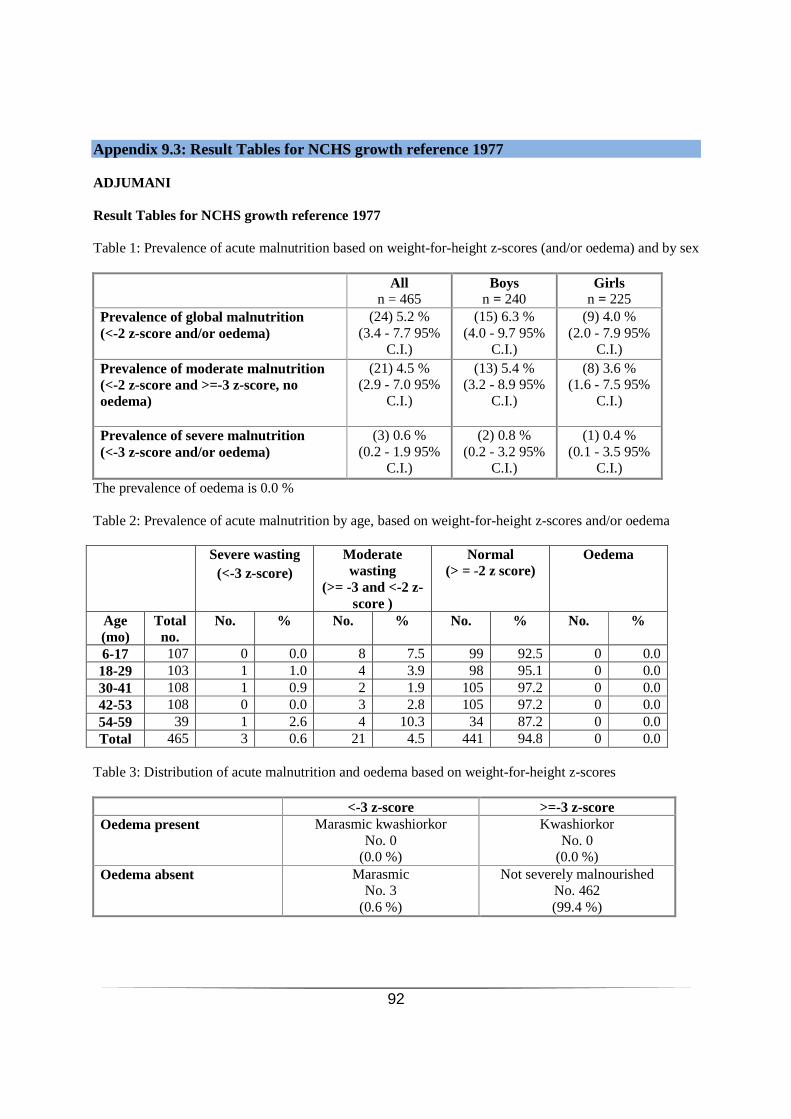
92
Appendix 9.3: Result Tables for NCHS growth reference 1977 ADJUMANI Result Tables for NCHS growth reference 1977 Table 1: Prevalence of acute malnutrition based on weight-for-height z-scores (and/or oedema) and by sex All
n = 465 Boys
n = 240 Girls
n = 225 Prevalence of global malnutrition (<-2 z-score and/or oedema)
(24) 5.2 % (3.4 - 7.7 95%
C.I.)
(15) 6.3 % (4.0 - 9.7 95%
C.I.)
(9) 4.0 % (2.0 - 7.9 95%
C.I.) Prevalence of moderate malnutrition (<-2 z-score and >=-3 z-score, no oedema)
(21) 4.5 % (2.9 - 7.0 95%
C.I.)
(13) 5.4 % (3.2 - 8.9 95%
C.I.)
(8) 3.6 % (1.6 - 7.5 95%
C.I.)
Prevalence of severe malnutrition (<-3 z-score and/or oedema)
(3) 0.6 % (0.2 - 1.9 95%
C.I.)
(2) 0.8 % (0.2 - 3.2 95%
C.I.)
(1) 0.4 % (0.1 - 3.5 95%
C.I.)
The prevalence of oedema is 0.0 % Table 2: Prevalence of acute malnutrition by age, based on weight-for-height z-scores and/or oedema Severe wasting
(<-3 z-score) Moderate wasting
(>= -3 and <-2 z-score )
Normal (> = -2 z score)
Oedema
Age (mo)
Total no.
No. % No. % No. % No. %
6-17 107 0 0.0 8 7.5 99 92.5 0 0.0 18-29 103 1 1.0 4 3.9 98 95.1 0 0.0 30-41 108 1 0.9 2 1.9 105 97.2 0 0.0 42-53 108 0 0.0 3 2.8 105 97.2 0 0.0 54-59 39 1 2.6 4 10.3 34 87.2 0 0.0 Total 465 3 0.6 21 4.5 441 94.8 0 0.0
Table 3: Distribution of acute malnutrition and oedema based on weight-for-height z-scores <-3 z-score >=-3 z-score Oedema present Marasmic kwashiorkor
No. 0 (0.0 %)
Kwashiorkor No. 0
(0.0 %) Oedema absent Marasmic
No. 3 (0.6 %)
Not severely malnourished No. 462 (99.4 %)
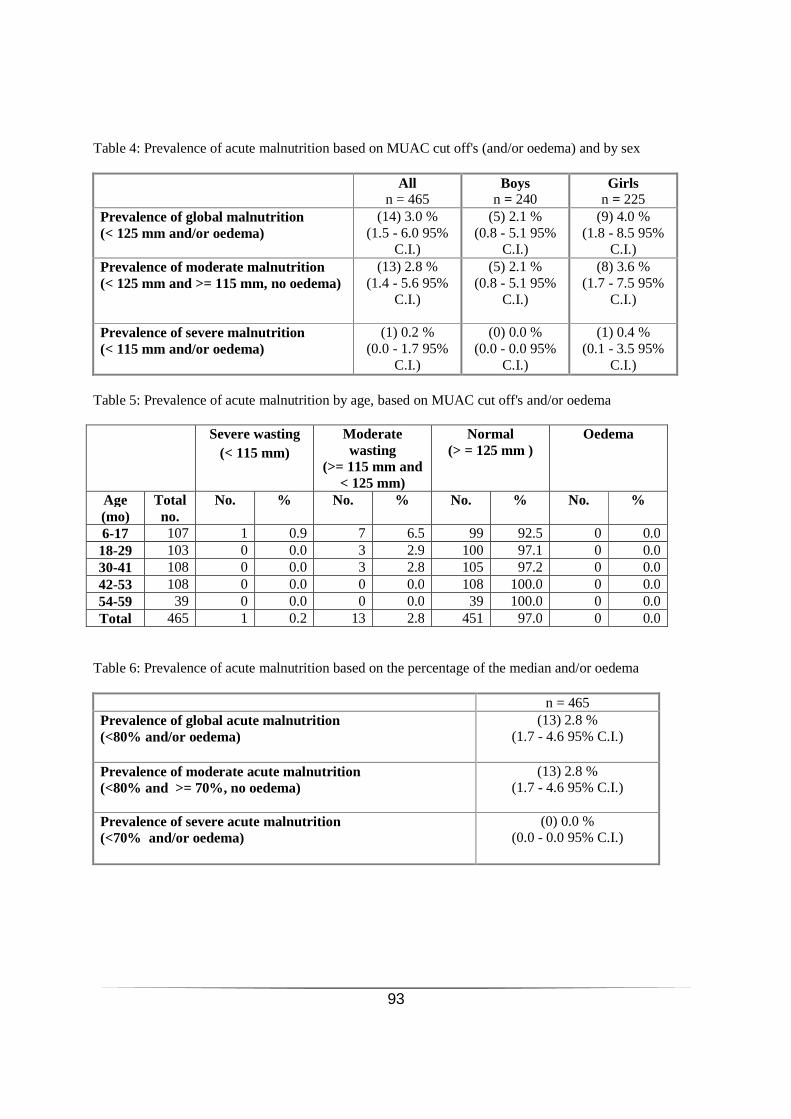
93
Table 4: Prevalence of acute malnutrition based on MUAC cut off's (and/or oedema) and by sex All
n = 465 Boys
n = 240 Girls
n = 225 Prevalence of global malnutrition (< 125 mm and/or oedema)
(14) 3.0 % (1.5 - 6.0 95%
C.I.)
(5) 2.1 % (0.8 - 5.1 95%
C.I.)
(9) 4.0 % (1.8 - 8.5 95%
C.I.) Prevalence of moderate malnutrition (< 125 mm and >= 115 mm, no oedema)
(13) 2.8 % (1.4 - 5.6 95%
C.I.)
(5) 2.1 % (0.8 - 5.1 95%
C.I.)
(8) 3.6 % (1.7 - 7.5 95%
C.I.)
Prevalence of severe malnutrition (< 115 mm and/or oedema)
(1) 0.2 % (0.0 - 1.7 95%
C.I.)
(0) 0.0 % (0.0 - 0.0 95%
C.I.)
(1) 0.4 % (0.1 - 3.5 95%
C.I.) Table 5: Prevalence of acute malnutrition by age, based on MUAC cut off's and/or oedema Severe wasting
(< 115 mm) Moderate wasting
(>= 115 mm and < 125 mm)
Normal (> = 125 mm )
Oedema
Age (mo)
Total no.
No. % No. % No. % No. %
6-17 107 1 0.9 7 6.5 99 92.5 0 0.0 18-29 103 0 0.0 3 2.9 100 97.1 0 0.0 30-41 108 0 0.0 3 2.8 105 97.2 0 0.0 42-53 108 0 0.0 0 0.0 108 100.0 0 0.0 54-59 39 0 0.0 0 0.0 39 100.0 0 0.0 Total 465 1 0.2 13 2.8 451 97.0 0 0.0
Table 6: Prevalence of acute malnutrition based on the percentage of the median and/or oedema n = 465 Prevalence of global acute malnutrition (<80% and/or oedema)
(13) 2.8 % (1.7 - 4.6 95% C.I.)
Prevalence of moderate acute malnutrition (<80% and >= 70%, no oedema)
(13) 2.8 % (1.7 - 4.6 95% C.I.)
Prevalence of severe acute malnutrition (<70% and/or oedema)
(0) 0.0 % (0.0 - 0.0 95% C.I.)
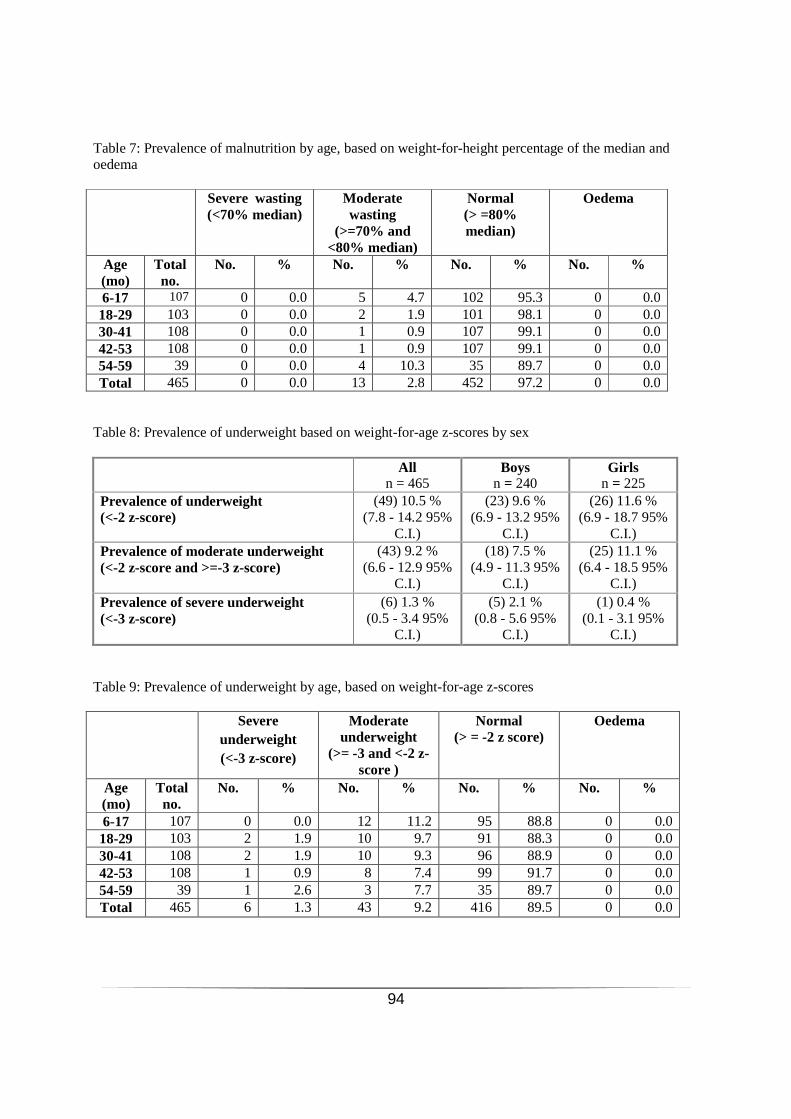
94
Table 7: Prevalence of malnutrition by age, based on weight-for-height percentage of the median and oedema Severe wasting
(<70% median) Moderate wasting
(>=70% and <80% median)
Normal (> =80% median)
Oedema
Age (mo)
Total no.
No. % No. % No. % No. %
6-17 107 0 0.0 5 4.7 102 95.3 0 0.0 18-29 103 0 0.0 2 1.9 101 98.1 0 0.0 30-41 108 0 0.0 1 0.9 107 99.1 0 0.0 42-53 108 0 0.0 1 0.9 107 99.1 0 0.0 54-59 39 0 0.0 4 10.3 35 89.7 0 0.0 Total 465 0 0.0 13 2.8 452 97.2 0 0.0
Table 8: Prevalence of underweight based on weight-for-age z-scores by sex All
n = 465 Boys
n = 240 Girls
n = 225 Prevalence of underweight (<-2 z-score)
(49) 10.5 % (7.8 - 14.2 95%
C.I.)
(23) 9.6 % (6.9 - 13.2 95%
C.I.)
(26) 11.6 % (6.9 - 18.7 95%
C.I.) Prevalence of moderate underweight (<-2 z-score and >=-3 z-score)
(43) 9.2 % (6.6 - 12.9 95%
C.I.)
(18) 7.5 % (4.9 - 11.3 95%
C.I.)
(25) 11.1 % (6.4 - 18.5 95%
C.I.) Prevalence of severe underweight (<-3 z-score)
(6) 1.3 % (0.5 - 3.4 95%
C.I.)
(5) 2.1 % (0.8 - 5.6 95%
C.I.)
(1) 0.4 % (0.1 - 3.1 95%
C.I.) Table 9: Prevalence of underweight by age, based on weight-for-age z-scores Severe
underweight (<-3 z-score)
Moderate underweight
(>= -3 and <-2 z-score )
Normal (> = -2 z score)
Oedema
Age (mo)
Total no.
No. % No. % No. % No. %
6-17 107 0 0.0 12 11.2 95 88.8 0 0.0 18-29 103 2 1.9 10 9.7 91 88.3 0 0.0 30-41 108 2 1.9 10 9.3 96 88.9 0 0.0 42-53 108 1 0.9 8 7.4 99 91.7 0 0.0 54-59 39 1 2.6 3 7.7 35 89.7 0 0.0 Total 465 6 1.3 43 9.2 416 89.5 0 0.0

95
Table 10: Prevalence of stunting based on height-for-age z-scores and by sex All
n = 465 Boys
n = 240 Girls
n = 225 Prevalence of stunting (<-2 z-score)
(62) 13.3 % (9.3 - 18.8 95%
C.I.)
(35) 14.6 % (9.4 - 21.9 95%
C.I.)
(27) 12.0 % (7.4 - 18.8 95%
C.I.) Prevalence of moderate stunting (<-2 z-score and >=-3 z-score)
(43) 9.2 % (6.6 - 12.9 95%
C.I.)
(27) 11.3 % (6.8 - 18.0 95%
C.I.)
(16) 7.1 % (4.3 - 11.6 95%
C.I.) Prevalence of severe stunting (<-3 z-score)
(19) 4.1 % (2.3 - 7.1 95%
C.I.)
(8) 3.3 % (1.5 - 7.1 95%
C.I.)
(11) 4.9 % (2.3 - 10.1 95%
C.I.) Table 11: Prevalence of stunting by age based on height-for-age z-scores Severe stunting
(<-3 z-score) Moderate stunting
(>= -3 and <-2 z-score ) Normal
(> = -2 z score)
Age (mo) Total no.
No. % No. % No. %
6-17 107 0 0.0 11 10.3 96 89.7 18-29 103 6 5.8 9 8.7 88 85.4 30-41 108 10 9.3 10 9.3 88 81.5 42-53 108 2 1.9 9 8.3 97 89.8 54-59 39 1 2.6 4 10.3 34 87.2 Total 465 19 4.1 43 9.2 403 86.7
Table 12: Mean z-scores, Design Effects and excluded subjects Indicator n Mean z-scores
± SD Design Effect (z-
score < -2) z-scores not available*
z-scores out of range
Weight-for-Height 465 -0.46±1.15 1.00 0 0 Weight-for-Age 465 -0.78±1.04 1.18 0 0 Height-for-Age 465 -0.59±1.48 2.13 0 0 * contains for WHZ and WAZ the children with edema. RWAMWANJA Table 13: Prevalence of acute malnutrition based on weight-for-height z-scores (and/or oedema) and by sex
All n = 376
Boys n = 188
Girls n = 188
Prevalence of global malnutrition (<-2 z-score and/or oedema)
(21) 5.6 % (3.7 - 8.4 95%
C.I.)
(11) 5.9 % (2.8 - 11.7 95%
C.I.)
(10) 5.3 % (3.1 - 8.9 95%
C.I.) Prevalence of moderate malnutrition (<-2 z-score and >=-3 z-score, no oedema)
(18) 4.8 % (3.2 - 7.2 95%
C.I.)
(9) 4.8 % (2.1 - 10.4 95%
C.I.)
(9) 4.8 % (2.9 - 7.9 95%
C.I.) Prevalence of severe malnutrition (<-3 z-score and/or oedema)
(3) 0.8 % (0.3 - 2.2 95%
C.I.)
(2) 1.1 % (0.3 - 3.9 95%
C.I.)
(1) 0.5 % (0.1 - 4.1 95%
C.I.)
The prevalence of oedema is 0.5 %

96
Table 14: Prevalence of acute malnutrition by age, based on weight-for-height z-scores and/or oedema Severe wasting
(<-3 z-score) Moderate wasting (>= -3 and <-2 z-
score )
Normal (> = -2 z score)
Oedema
Age (mo)
Total no.
No. % No. % No. % No. %
6-17 92 0 0.0 6 6.5 85 92.4 1 1.1 18-29 93 1 1.1 6 6.5 85 91.4 1 1.1 30-41 79 0 0.0 4 5.1 75 94.9 0 0.0 42-53 76 0 0.0 1 1.3 75 98.7 0 0.0 54-59 36 0 0.0 1 2.8 35 97.2 0 0.0 Total 376 1 0.3 18 4.8 355 94.4 2 0.5
Table 15: Distribution of acute malnutrition and oedema based on weight-for-height z-scores <-3 z-score >=-3 z-score Oedema present Marasmic kwashiorkor
No. 0(0.0 %) Kwashiorkor No. 2(0.5 %)
Oedema absent Marasmic No. 1(0.3 %)
Not severely malnourished No. 373(99.2 %)
Table 16: Prevalence of acute malnutrition based on MUAC cut off's (and/or oedema) and by sex All
n = 376 Boys
n = 188 Girls
n = 188 Prevalence of global malnutrition (< 125 mm and/or oedema)
(25) 6.6 % (4.4 - 9.9 95% C.I.)
(7) 3.7 % (1.7 - 8.0 95%
C.I.)
(18) 9.6 % (5.7 - 15.6 95% C.I.)
Prevalence of moderate malnutrition (< 125 mm and >= 115 mm, no oedema)
(22) 5.9 % (3.6 - 9.3 95% C.I.)
(6) 3.2 % (1.2 - 8.2 95%
C.I.)
(16) 8.5 % (4.9 - 14.3 95% C.I.)
Prevalence of severe malnutrition (< 115 mm and/or oedema)
(3) 0.8 % (0.3 - 2.1 95% C.I.)
(1) 0.5 % (0.1 - 3.4 95%
C.I.)
(2) 1.1 % (0.3 - 4.2 95%
C.I.) Table 17: Prevalence of acute malnutrition by age, based on MUAC cut off's and/or oedema Severe wasting
(< 115 mm) Moderate wasting (>= 115 mm and <
125 mm)
Normal (> = 125 mm )
Oedema
Age (mo)
Total no.
No. % No. % No. % No. %
6-17 92 2 2.2 13 14.1 77 83.7 1 1.1 18-29 93 1 1.1 4 4.3 88 94.6 1 1.1 30-41 79 0 0.0 1 1.3 78 98.7 0 0.0 42-53 76 0 0.0 3 3.9 73 96.1 0 0.0 54-59 36 0 0.0 1 2.8 35 97.2 0 0.0 Total 376 3 0.8 22 5.9 351 93.4 2 0.5
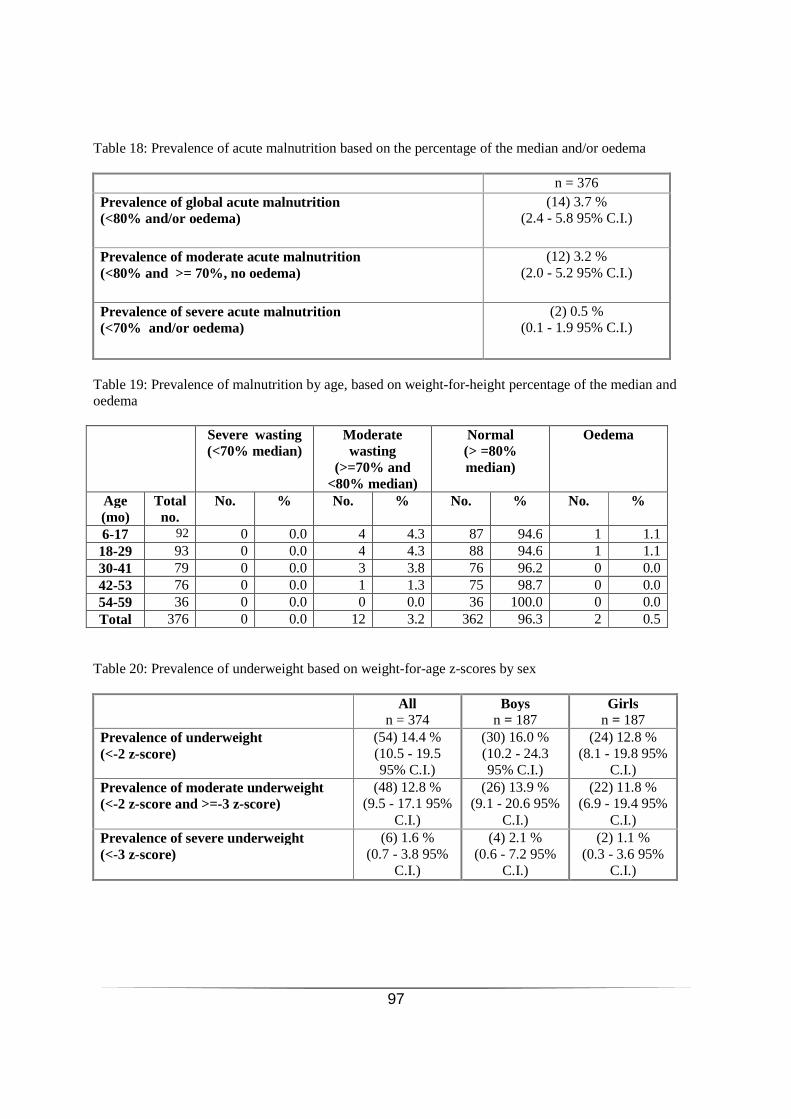
97
Table 18: Prevalence of acute malnutrition based on the percentage of the median and/or oedema n = 376 Prevalence of global acute malnutrition (<80% and/or oedema)
(14) 3.7 % (2.4 - 5.8 95% C.I.)
Prevalence of moderate acute malnutrition (<80% and >= 70%, no oedema)
(12) 3.2 % (2.0 - 5.2 95% C.I.)
Prevalence of severe acute malnutrition (<70% and/or oedema)
(2) 0.5 % (0.1 - 1.9 95% C.I.)
Table 19: Prevalence of malnutrition by age, based on weight-for-height percentage of the median and oedema Severe wasting
(<70% median) Moderate wasting
(>=70% and <80% median)
Normal (> =80% median)
Oedema
Age (mo)
Total no.
No. % No. % No. % No. %
6-17 92 0 0.0 4 4.3 87 94.6 1 1.1 18-29 93 0 0.0 4 4.3 88 94.6 1 1.1 30-41 79 0 0.0 3 3.8 76 96.2 0 0.0 42-53 76 0 0.0 1 1.3 75 98.7 0 0.0 54-59 36 0 0.0 0 0.0 36 100.0 0 0.0 Total 376 0 0.0 12 3.2 362 96.3 2 0.5
Table 20: Prevalence of underweight based on weight-for-age z-scores by sex All
n = 374 Boys
n = 187 Girls
n = 187 Prevalence of underweight (<-2 z-score)
(54) 14.4 % (10.5 - 19.5 95% C.I.)
(30) 16.0 % (10.2 - 24.3 95% C.I.)
(24) 12.8 % (8.1 - 19.8 95%
C.I.) Prevalence of moderate underweight (<-2 z-score and >=-3 z-score)
(48) 12.8 % (9.5 - 17.1 95%
C.I.)
(26) 13.9 % (9.1 - 20.6 95%
C.I.)
(22) 11.8 % (6.9 - 19.4 95%
C.I.) Prevalence of severe underweight (<-3 z-score)
(6) 1.6 % (0.7 - 3.8 95%
C.I.)
(4) 2.1 % (0.6 - 7.2 95%
C.I.)
(2) 1.1 % (0.3 - 3.6 95%
C.I.)
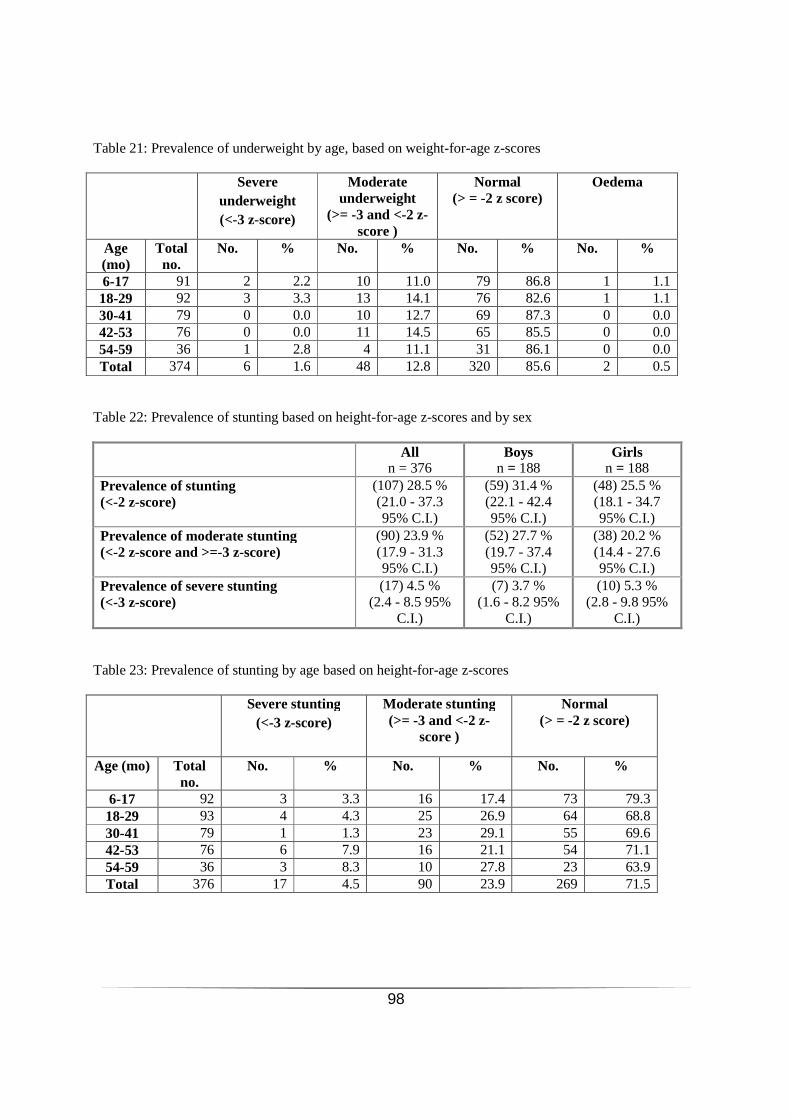
98
Table 21: Prevalence of underweight by age, based on weight-for-age z-scores Severe
underweight (<-3 z-score)
Moderate underweight
(>= -3 and <-2 z-score )
Normal (> = -2 z score)
Oedema
Age (mo)
Total no.
No. % No. % No. % No. %
6-17 91 2 2.2 10 11.0 79 86.8 1 1.1 18-29 92 3 3.3 13 14.1 76 82.6 1 1.1 30-41 79 0 0.0 10 12.7 69 87.3 0 0.0 42-53 76 0 0.0 11 14.5 65 85.5 0 0.0 54-59 36 1 2.8 4 11.1 31 86.1 0 0.0 Total 374 6 1.6 48 12.8 320 85.6 2 0.5
Table 22: Prevalence of stunting based on height-for-age z-scores and by sex All
n = 376 Boys
n = 188 Girls
n = 188 Prevalence of stunting (<-2 z-score)
(107) 28.5 % (21.0 - 37.3 95% C.I.)
(59) 31.4 % (22.1 - 42.4 95% C.I.)
(48) 25.5 % (18.1 - 34.7 95% C.I.)
Prevalence of moderate stunting (<-2 z-score and >=-3 z-score)
(90) 23.9 % (17.9 - 31.3 95% C.I.)
(52) 27.7 % (19.7 - 37.4 95% C.I.)
(38) 20.2 % (14.4 - 27.6 95% C.I.)
Prevalence of severe stunting (<-3 z-score)
(17) 4.5 % (2.4 - 8.5 95%
C.I.)
(7) 3.7 % (1.6 - 8.2 95%
C.I.)
(10) 5.3 % (2.8 - 9.8 95%
C.I.) Table 23: Prevalence of stunting by age based on height-for-age z-scores Severe stunting
(<-3 z-score) Moderate stunting (>= -3 and <-2 z-
score )
Normal (> = -2 z score)
Age (mo) Total no.
No.
% No. % No. %
6-17 92 3 3.3 16 17.4 73 79.3 18-29 93 4 4.3 25 26.9 64 68.8 30-41 79 1 1.3 23 29.1 55 69.6 42-53 76 6 7.9 16 21.1 54 71.1 54-59 36 3 8.3 10 27.8 23 63.9 Total 376 17 4.5 90 23.9 269 71.5
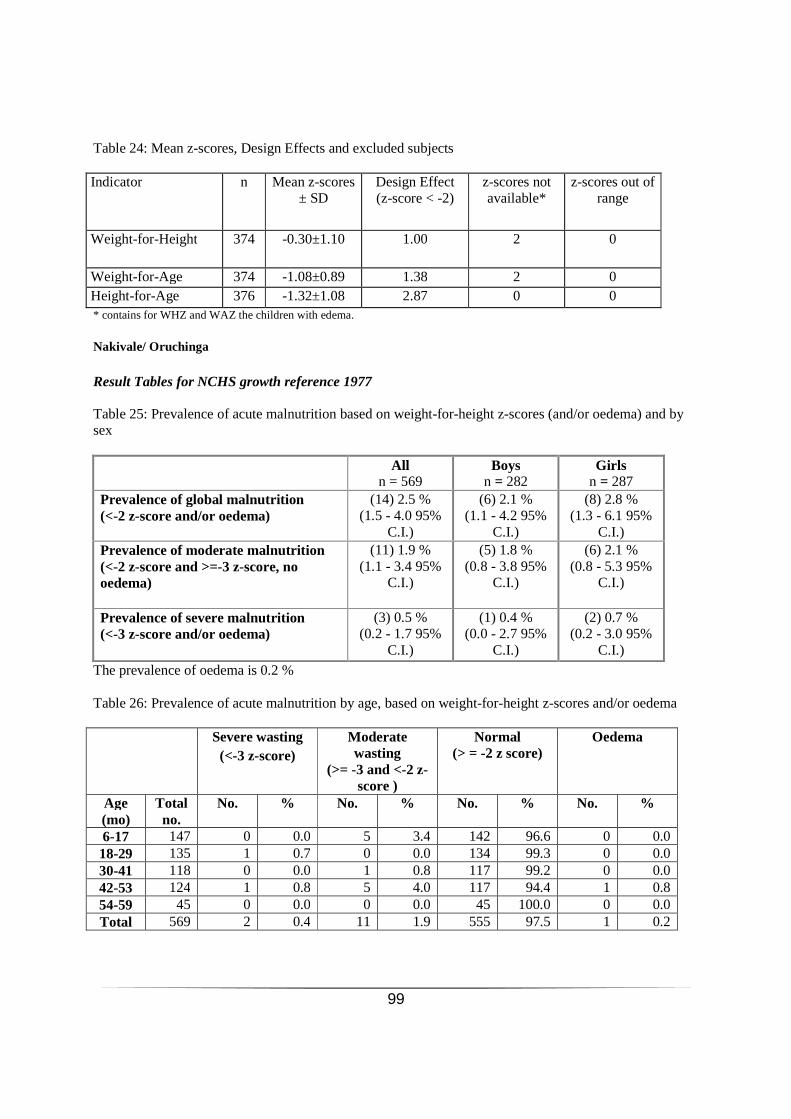
99
Table 24: Mean z-scores, Design Effects and excluded subjects
Indicator n Mean z-scores ± SD
Design Effect (z-score < -2)
z-scores not available*
z-scores out of range
Weight-for-Height 374 -0.30±1.10 1.00 2 0
Weight-for-Age 374 -1.08±0.89 1.38 2 0 Height-for-Age 376 -1.32±1.08 2.87 0 0 * contains for WHZ and WAZ the children with edema. Nakivale/ Oruchinga Result Tables for NCHS growth reference 1977 Table 25: Prevalence of acute malnutrition based on weight-for-height z-scores (and/or oedema) and by sex All
n = 569 Boys
n = 282 Girls
n = 287 Prevalence of global malnutrition (<-2 z-score and/or oedema)
(14) 2.5 % (1.5 - 4.0 95%
C.I.)
(6) 2.1 % (1.1 - 4.2 95%
C.I.)
(8) 2.8 % (1.3 - 6.1 95%
C.I.) Prevalence of moderate malnutrition (<-2 z-score and >=-3 z-score, no oedema)
(11) 1.9 % (1.1 - 3.4 95%
C.I.)
(5) 1.8 % (0.8 - 3.8 95%
C.I.)
(6) 2.1 % (0.8 - 5.3 95%
C.I.)
Prevalence of severe malnutrition (<-3 z-score and/or oedema)
(3) 0.5 % (0.2 - 1.7 95%
C.I.)
(1) 0.4 % (0.0 - 2.7 95%
C.I.)
(2) 0.7 % (0.2 - 3.0 95%
C.I.)
The prevalence of oedema is 0.2 % Table 26: Prevalence of acute malnutrition by age, based on weight-for-height z-scores and/or oedema Severe wasting
(<-3 z-score) Moderate wasting
(>= -3 and <-2 z-score )
Normal (> = -2 z score)
Oedema
Age (mo)
Total no.
No. % No. % No. % No. %
6-17 147 0 0.0 5 3.4 142 96.6 0 0.0 18-29 135 1 0.7 0 0.0 134 99.3 0 0.0 30-41 118 0 0.0 1 0.8 117 99.2 0 0.0 42-53 124 1 0.8 5 4.0 117 94.4 1 0.8 54-59 45 0 0.0 0 0.0 45 100.0 0 0.0 Total 569 2 0.4 11 1.9 555 97.5 1 0.2

100
Table 27: Distribution of acute malnutrition and oedema based on weight-for-height z-scores <-3 z-score >=-3 z-score Oedema present Marasmic kwashiorkor
No. 0 (0.0 %)
Kwashiorkor No. 1
(0.2 %) Oedema absent Marasmic
No. 2 (0.4 %)
Not severely malnourished No. 566 (99.5 %)
Table 28: Prevalence of acute malnutrition based on MUAC cut off's (and/or oedema) and by sex All
n = 569 Boys
n = 282 Girls
n = 287 Prevalence of global malnutrition (< 125 mm and/or oedema)
(27) 4.7 % (3.4 - 6.6 95%
C.I.)
(12) 4.3 % (2.5 - 7.1 95%
C.I.)
(15) 5.2 % (3.5 - 7.7 95%
C.I.) Prevalence of moderate malnutrition (< 125 mm and >= 115 mm, no oedema)
(22) 3.9 % (2.6 - 5.7 95%
C.I.)
(9) 3.2 % (1.7 - 5.9 95%
C.I.)
(13) 4.5 % (2.9 - 7.1 95%
C.I.)
Prevalence of severe malnutrition (< 115 mm and/or oedema)
(5) 0.9 % (0.4 - 2.0 95%
C.I.)
(3) 1.1 % (0.4 - 3.2 95%
C.I.)
(2) 0.7 % (0.2 - 2.8 95%
C.I.) Table 29: Prevalence of acute malnutrition by age, based on MUAC cut off's and/or oedema Severe wasting
(< 115 mm) Moderate wasting
(>= 115 mm and < 125 mm)
Normal (> = 125 mm )
Oedema
Age (mo)
Total no.
No. % No. % No. % No. %
6-17 147 3 2.0 17 11.6 127 86.4 0 0.0 18-29 135 1 0.7 2 1.5 132 97.8 0 0.0 30-41 118 0 0.0 3 2.5 115 97.5 0 0.0 42-53 124 0 0.0 0 0.0 124 100.0 1 0.8 54-59 45 0 0.0 0 0.0 45 100.0 0 0.0 Total 569 4 0.7 22 3.9 543 95.4 1 0.2

101
Table 30: Prevalence of acute malnutrition based on the percentage of the median and/or oedema n = 569 Prevalence of global acute malnutrition (<80% and/or oedema)
(8) 1.4 % (0.7 - 2.8 95% C.I.)
Prevalence of moderate acute malnutrition (<80% and >= 70%, no oedema)
(7) 1.2 % (0.6 - 2.6 95% C.I.)
Prevalence of severe acute malnutrition (<70% and/or oedema)
(1) 0.2 % (0.0 - 1.4 95% C.I.)
Table 31: Prevalence of malnutrition by age, based on weight-for-height percentage of the median and oedema Severe wasting
(<70% median) Moderate wasting
(>=70% and <80% median)
Normal (> =80% median)
Oedema
Age (mo)
Total no.
No. % No. % No. % No. %
6-17 147 0 0.0 3 2.0 144 98.0 0 0.0 18-29 135 0 0.0 1 0.7 134 99.3 0 0.0 30-41 118 0 0.0 0 0.0 118 100.0 0 0.0 42-53 124 0 0.0 3 2.4 120 96.8 1 0.8 54-59 45 0 0.0 0 0.0 45 100.0 0 0.0 Total 569 0 0.0 7 1.2 561 98.6 1 0.2
Table 32: Prevalence of underweight based on weight-for-age z-scores by sex All
n = 568 Boys
n = 281 Girls
n = 287 Prevalence of underweight (<-2 z-score)
(52) 9.2 % (7.0 - 11.9 95%
C.I.)
(26) 9.3 % (6.2 - 13.6 95%
C.I.)
(26) 9.1 % (6.5 - 12.4 95%
C.I.) Prevalence of moderate underweight (<-2 z-score and >=-3 z-score)
(47) 8.3 % (6.3 - 10.7 95%
C.I.)
(22) 7.8 % (5.3 - 11.4 95%
C.I.)
(25) 8.7 % (6.4 - 11.8 95%
C.I.) Prevalence of severe underweight (<-3 z-score)
(5) 0.9 % (0.4 - 1.9 95%
C.I.)
(4) 1.4 % (0.6 - 3.4 95%
C.I.)
(1) 0.3 % (0.0 - 2.7 95%
C.I.)
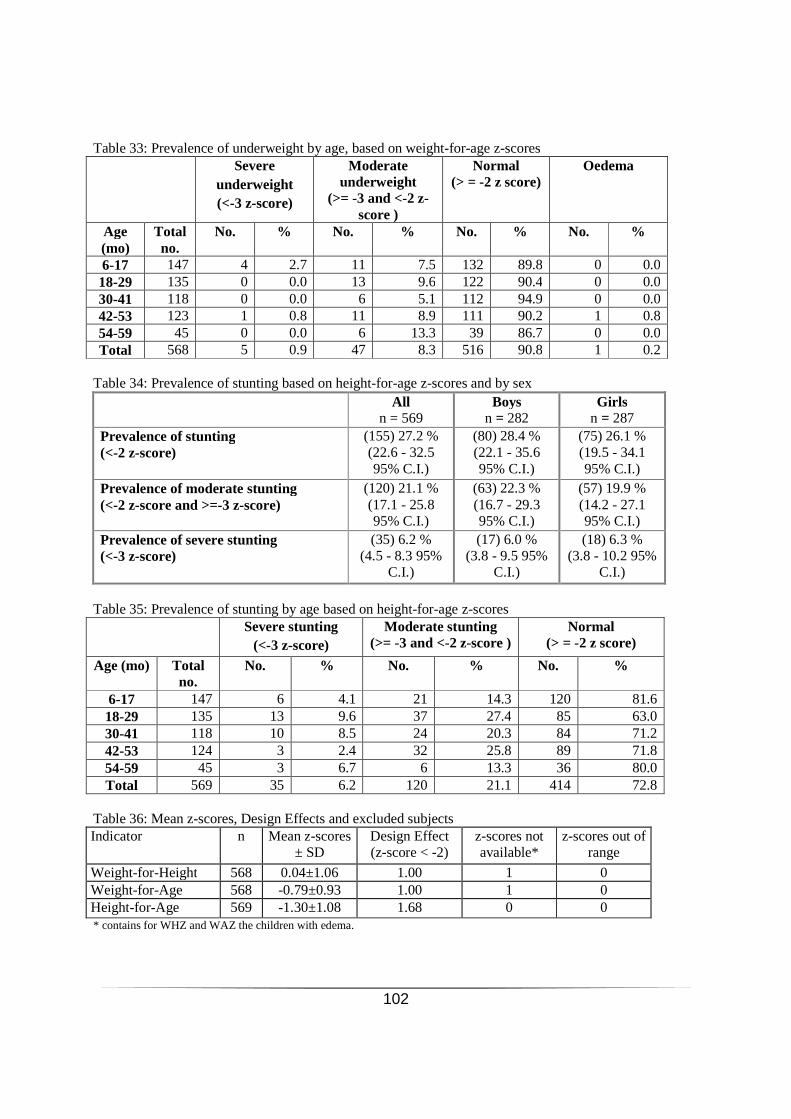
102
Table 33: Prevalence of underweight by age, based on weight-for-age z-scores Severe
underweight (<-3 z-score)
Moderate underweight
(>= -3 and <-2 z-score )
Normal (> = -2 z score)
Oedema
Age (mo)
Total no.
No. % No. % No. % No. %
6-17 147 4 2.7 11 7.5 132 89.8 0 0.0 18-29 135 0 0.0 13 9.6 122 90.4 0 0.0 30-41 118 0 0.0 6 5.1 112 94.9 0 0.0 42-53 123 1 0.8 11 8.9 111 90.2 1 0.8 54-59 45 0 0.0 6 13.3 39 86.7 0 0.0 Total 568 5 0.9 47 8.3 516 90.8 1 0.2
Table 34: Prevalence of stunting based on height-for-age z-scores and by sex All
n = 569 Boys
n = 282 Girls
n = 287 Prevalence of stunting (<-2 z-score)
(155) 27.2 % (22.6 - 32.5 95% C.I.)
(80) 28.4 % (22.1 - 35.6 95% C.I.)
(75) 26.1 % (19.5 - 34.1 95% C.I.)
Prevalence of moderate stunting (<-2 z-score and >=-3 z-score)
(120) 21.1 % (17.1 - 25.8 95% C.I.)
(63) 22.3 % (16.7 - 29.3 95% C.I.)
(57) 19.9 % (14.2 - 27.1 95% C.I.)
Prevalence of severe stunting (<-3 z-score)
(35) 6.2 % (4.5 - 8.3 95%
C.I.)
(17) 6.0 % (3.8 - 9.5 95%
C.I.)
(18) 6.3 % (3.8 - 10.2 95%
C.I.)
Table 35: Prevalence of stunting by age based on height-for-age z-scores Severe stunting
(<-3 z-score) Moderate stunting
(>= -3 and <-2 z-score ) Normal
(> = -2 z score)
Age (mo) Total no.
No. % No. % No. %
6-17 147 6 4.1 21 14.3 120 81.6 18-29 135 13 9.6 37 27.4 85 63.0 30-41 118 10 8.5 24 20.3 84 71.2 42-53 124 3 2.4 32 25.8 89 71.8 54-59 45 3 6.7 6 13.3 36 80.0 Total 569 35 6.2 120 21.1 414 72.8
Table 36: Mean z-scores, Design Effects and excluded subjects Indicator n Mean z-scores
± SD Design Effect (z-score < -2)
z-scores not available*
z-scores out of range
Weight-for-Height 568 0.04±1.06 1.00 1 0 Weight-for-Age 568 -0.79±0.93 1.00 1 0 Height-for-Age 569 -1.30±1.08 1.68 0 0 * contains for WHZ and WAZ the children with edema.

103
Kyangwali Result Tables for NCHS growth reference 1977 Table 37: Prevalence of acute malnutrition based on weight-for-height z-scores (and/or oedema) and by sex All
n = 348 Boys
n = 182 Girls
n = 166 Prevalence of global malnutrition (<-2 z-score and/or oedema)
(11) 3.2 % (1.5 - 6.7 95%
C.I.)
(6) 3.3 % (1.3 - 8.2 95%
C.I.)
(5) 3.0 % (1.0 - 8.6 95%
C.I.) Prevalence of moderate malnutrition (<-2 z-score and >=-3 z-score, no oedema)
(8) 2.3 % (0.9 - 5.6 95%
C.I.)
(5) 2.7 % (0.9 - 7.9 95%
C.I.)
(3) 1.8 % (0.6 - 5.6 95%
C.I.) Prevalence of severe malnutrition (<-3 z-score and/or oedema)
(3) 0.9 % (0.2 - 4.2 95%
C.I.)
(1) 0.5 % (0.1 - 4.5 95%
C.I.)
(2) 1.2 % (0.1 - 9.9 95%
C.I.) The prevalence of oedema is 0.0 % Table 38: Prevalence of acute malnutrition by age, based on weight-for-height z-scores and/or oedema Severe wasting
(<-3 z-score) Moderate wasting
(>= -3 and <-2 z-score )
Normal (> = -2 z score)
Oedema
Age (mo)
Total no.
No. % No. % No. % No. %
6-17 88 0 0.0 3 3.4 85 96.6 0 0.0 18-29 74 3 4.1 0 0.0 71 95.9 0 0.0 30-41 71 0 0.0 2 2.8 69 97.2 0 0.0 42-53 77 0 0.0 0 0.0 77 100.0 0 0.0 54-59 38 0 0.0 3 7.9 35 92.1 0 0.0 Total 348 3 0.9 8 2.3 337 96.8 0 0.0
Table 39: Distribution of acute malnutrition and oedema based on weight-for-height z-scores <-3 z-score >=-3 z-score Oedema present Marasmic kwashiorkor
No. 0 (0.0 %)
Kwashiorkor No. 0
(0.0 %) Oedema absent Marasmic
No. 3 (0.9 %)
Not severely malnourished No. 345 (99.1 %)

104
Table 40: Prevalence of acute malnutrition based on MUAC cut off's (and/or oedema) and by sex All
n = 348 Boys
n = 182 Girls
n = 166 Prevalence of global malnutrition (< 125 mm and/or oedema)
(10) 2.9 % (1.5 - 5.5 95%
C.I.)
(3) 1.6 % (0.6 - 4.8 95%
C.I.)
(7) 4.2 % (1.8 - 9.5 95%
C.I.) Prevalence of moderate malnutrition (< 125 mm and >= 115 mm, no oedema)
(5) 1.4 % (0.6 - 3.3 95%
C.I.)
(2) 1.1 % (0.3 - 4.2 95%
C.I.)
(3) 1.8 % (0.5 - 6.1 95%
C.I.)
Prevalence of severe malnutrition (< 115 mm and/or oedema)
(5) 1.4 % (0.5 - 4.0 95%
C.I.)
(1) 0.5 % (0.1 - 4.5 95%
C.I.)
(4) 2.4 % (0.9 - 6.1 95%
C.I.) Table 41: Prevalence of acute malnutrition by age, based on MUAC cut off's and/or oedema Severe wasting
(< 115 mm) Moderate wasting
(>= 115 mm and < 125 mm)
Normal (> = 125 mm )
Oedema
Age (mo)
Total no.
No. % No. % No. % No. %
6-17 88 3 3.4 4 4.5 81 92.0 0 0.0 18-29 74 2 2.7 0 0.0 72 97.3 0 0.0 30-41 71 0 0.0 1 1.4 70 98.6 0 0.0 42-53 77 0 0.0 0 0.0 77 100.0 0 0.0 54-59 38 0 0.0 0 0.0 38 100.0 0 0.0 Total 348 5 1.4 5 1.4 338 97.1 0 0.0
Table 42: Prevalence of acute malnutrition based on the percentage of the median and/or oedema n = 348 Prevalence of global acute malnutrition (<80% and/or oedema)
(7) 2.0 % (0.7 - 5.4 95% C.I.)
Prevalence of moderate acute malnutrition (<80% and >= 70%, no oedema)
(7) 2.0 % (0.7 - 5.4 95% C.I.)
Prevalence of severe acute malnutrition (<70% and/or oedema)
(0) 0.0 % (0.0 - 0.0 95% C.I.)

105
Table 43: Prevalence of malnutrition by age, based on weight-for-height percentage of the median and oedema Severe wasting
(<70% median) Moderate wasting
(>=70% and <80% median)
Normal (> =80% median)
Oedema
Age (mo)
Total no.
No. % No. % No. % No. %
6-17 88 0 0.0 0 0.0 88 100.0 0 0.0 18-29 74 0 0.0 3 4.1 71 95.9 0 0.0 30-41 71 0 0.0 2 2.8 69 97.2 0 0.0 42-53 77 0 0.0 0 0.0 77 100.0 0 0.0 54-59 38 0 0.0 2 5.3 36 94.7 0 0.0 Total 348 0 0.0 7 2.0 341 98.0 0 0.0
Table 44: Prevalence of underweight based on weight-for-age z-scores by sex All
n = 348 Boys
n = 182 Girls
n = 166 Prevalence of underweight (<-2 z-score)
(33) 9.5 % (5.5 - 15.8 95%
C.I.)
(19) 10.4 % (6.2 - 17.0 95%
C.I.)
(14) 8.4 % (4.1 - 16.6 95%
C.I.) Prevalence of moderate underweight (<-2 z-score and >=-3 z-score)
(32) 9.2 % (5.2 - 15.7 95%
C.I.)
(19) 10.4 % (6.2 - 17.0 95%
C.I.)
(13) 7.8 % (3.5 - 16.8 95%
C.I.) Prevalence of severe underweight (<-3 z-score)
(1) 0.3 % (0.0 - 2.2 95%
C.I.)
(0) 0.0 % (0.0 - 0.0 95%
C.I.)
(1) 0.6 % (0.1 - 4.3 95%
C.I.)
Table 45: Prevalence of underweight by age, based on weight-for-age z-scores Severe
underweight (<-3 z-score)
Moderate underweight
(>= -3 and <-2 z-score )
Normal (> = -2 z score)
Oedema
Age (mo)
Total no.
No. % No. % No. % No. %
6-17 88 0 0.0 6 6.8 82 93.2 0 0.0 18-29 74 0 0.0 9 12.2 65 87.8 0 0.0 30-41 71 0 0.0 9 12.7 62 87.3 0 0.0 42-53 77 1 1.3 4 5.2 72 93.5 0 0.0 54-59 38 0 0.0 4 10.5 34 89.5 0 0.0 Total 348 1 0.3 32 9.2 315 90.5 0 0.0

106
Table 46: Prevalence of stunting based on height-for-age z-scores and by sex All
n = 348 Boys
n = 182 Girls
n = 166 Prevalence of stunting (<-2 z-score)
(91) 26.1 % (19.4 - 34.2 95% C.I.)
(51) 28.0 % (19.4 - 38.6 95% C.I.)
(40) 24.1 % (17.5 - 32.2 95% C.I.)
Prevalence of moderate stunting (<-2 z-score and >=-3 z-score)
(57) 16.4 % (11.6 - 22.7 95% C.I.)
(34) 18.7 % (12.0 - 28.0 95% C.I.)
(23) 13.9 % (9.5 - 19.8 95%
C.I.) Prevalence of severe stunting (<-3 z-score)
(34) 9.8 % (5.5 - 16.8 95%
C.I.)
(17) 9.3 % (4.4 - 18.7 95%
C.I.)
(17) 10.2 % (5.7 - 17.6 95%
C.I.)
Table 47: Prevalence of stunting by age based on height-for-age z-scores Severe stunting
(<-3 z-score) Moderate stunting (>= -3 and <-2 z-
score )
Normal (> = -2 z score)
Age (mo) Total no.
No. % No. % No. %
6-17 88 5 5.7 13 14.8 70 79.5 18-29 74 7 9.5 17 23.0 50 67.6 30-41 71 6 8.5 13 18.3 52 73.2 42-53 77 10 13.0 12 15.6 55 71.4 54-59 38 6 15.8 2 5.3 30 78.9 Total 348 34 9.8 57 16.4 257 73.9
Table 48: Mean z-scores, Design Effects and excluded subjects Indicator n Mean z-scores
± SD Design Effect (z-
score < -2) z-scores not available*
z-scores out of range
Weight-for-Height 348 -0.05±1.11 1.45 0 0
Weight-for-Age 348 -0.81±1.04 2.24 0 0 Height-for-Age 348 -1.21±1.39 2.23 0 0 * contains for WHZ and WAZ the children with edema.
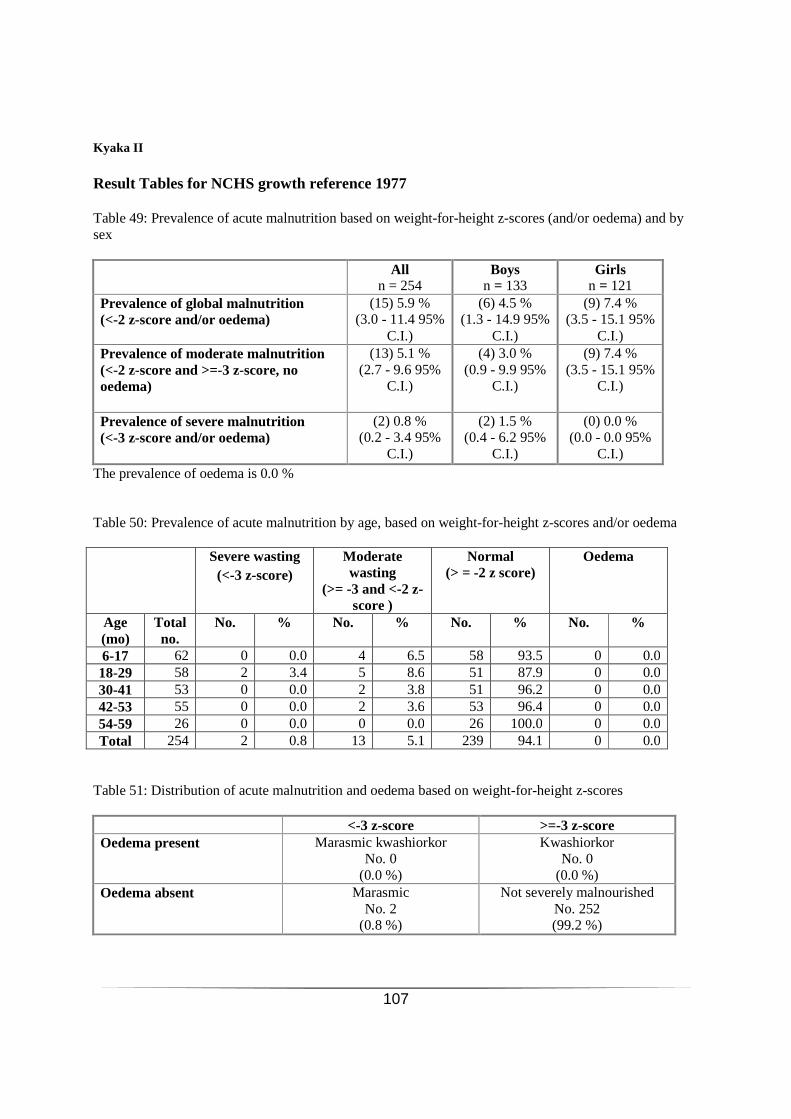
107
Kyaka II
Result Tables for NCHS growth reference 1977 Table 49: Prevalence of acute malnutrition based on weight-for-height z-scores (and/or oedema) and by sex All
n = 254 Boys
n = 133 Girls
n = 121 Prevalence of global malnutrition (<-2 z-score and/or oedema)
(15) 5.9 % (3.0 - 11.4 95%
C.I.)
(6) 4.5 % (1.3 - 14.9 95%
C.I.)
(9) 7.4 % (3.5 - 15.1 95%
C.I.) Prevalence of moderate malnutrition (<-2 z-score and >=-3 z-score, no oedema)
(13) 5.1 % (2.7 - 9.6 95%
C.I.)
(4) 3.0 % (0.9 - 9.9 95%
C.I.)
(9) 7.4 % (3.5 - 15.1 95%
C.I.)
Prevalence of severe malnutrition (<-3 z-score and/or oedema)
(2) 0.8 % (0.2 - 3.4 95%
C.I.)
(2) 1.5 % (0.4 - 6.2 95%
C.I.)
(0) 0.0 % (0.0 - 0.0 95%
C.I.) The prevalence of oedema is 0.0 % Table 50: Prevalence of acute malnutrition by age, based on weight-for-height z-scores and/or oedema Severe wasting
(<-3 z-score) Moderate wasting
(>= -3 and <-2 z-score )
Normal (> = -2 z score)
Oedema
Age (mo)
Total no.
No. % No. % No. % No. %
6-17 62 0 0.0 4 6.5 58 93.5 0 0.0 18-29 58 2 3.4 5 8.6 51 87.9 0 0.0 30-41 53 0 0.0 2 3.8 51 96.2 0 0.0 42-53 55 0 0.0 2 3.6 53 96.4 0 0.0 54-59 26 0 0.0 0 0.0 26 100.0 0 0.0 Total 254 2 0.8 13 5.1 239 94.1 0 0.0
Table 51: Distribution of acute malnutrition and oedema based on weight-for-height z-scores <-3 z-score >=-3 z-score Oedema present Marasmic kwashiorkor
No. 0 (0.0 %)
Kwashiorkor No. 0
(0.0 %) Oedema absent Marasmic
No. 2 (0.8 %)
Not severely malnourished No. 252 (99.2 %)

108
Table 52: Prevalence of acute malnutrition based on MUAC cut off's (and/or oedema) and by sex All
n = 254 Boys
n = 133 Girls
n = 121 Prevalence of global malnutrition (< 125 mm and/or oedema)
(12) 4.7 % (2.5 - 8.8 95%
C.I.)
(2) 1.5 % (0.4 - 6.2 95%
C.I.)
(10) 8.3 % (4.0 - 16.4 95%
C.I.) Prevalence of moderate malnutrition (< 125 mm and >= 115 mm, no oedema)
(11) 4.3 % (2.1 - 8.8 95%
C.I.)
(2) 1.5 % (0.4 - 6.2 95%
C.I.)
(9) 7.4 % (3.2 - 16.5 95%
C.I.)
Prevalence of severe malnutrition (< 115 mm and/or oedema)
(1) 0.4 % (0.0 - 3.4 95%
C.I.)
(0) 0.0 % (0.0 - 0.0 95%
C.I.)
(1) 0.8 % (0.1 - 6.9 95%
C.I.)
Table 53: Prevalence of acute malnutrition by age, based on MUAC cut off's and/or oedema Severe wasting
(< 115 mm) Moderate wasting
(>= 115 mm and < 125 mm)
Normal (> = 125 mm )
Oedema
Age (mo)
Total no.
No. % No. % No. % No. %
6-17 62 1 1.6 6 9.7 55 88.7 0 0.0 18-29 58 0 0.0 3 5.2 55 94.8 0 0.0 30-41 53 0 0.0 1 1.9 52 98.1 0 0.0 42-53 55 0 0.0 1 1.8 54 98.2 0 0.0 54-59 26 0 0.0 0 0.0 26 100.0 0 0.0 Total 254 1 0.4 11 4.3 242 95.3 0 0.0
Table 54: Prevalence of acute malnutrition based on the percentage of the median and/or oedema n = 254 Prevalence of global acute malnutrition (<80% and/or oedema)
(8) 3.1 % (1.4 - 7.0 95% C.I.)
Prevalence of moderate acute malnutrition (<80% and >= 70%, no oedema)
(8) 3.1 % (1.4 - 7.0 95% C.I.)
Prevalence of severe acute malnutrition (<70% and/or oedema)
(0) 0.0 % (0.0 - 0.0 95% C.I.)
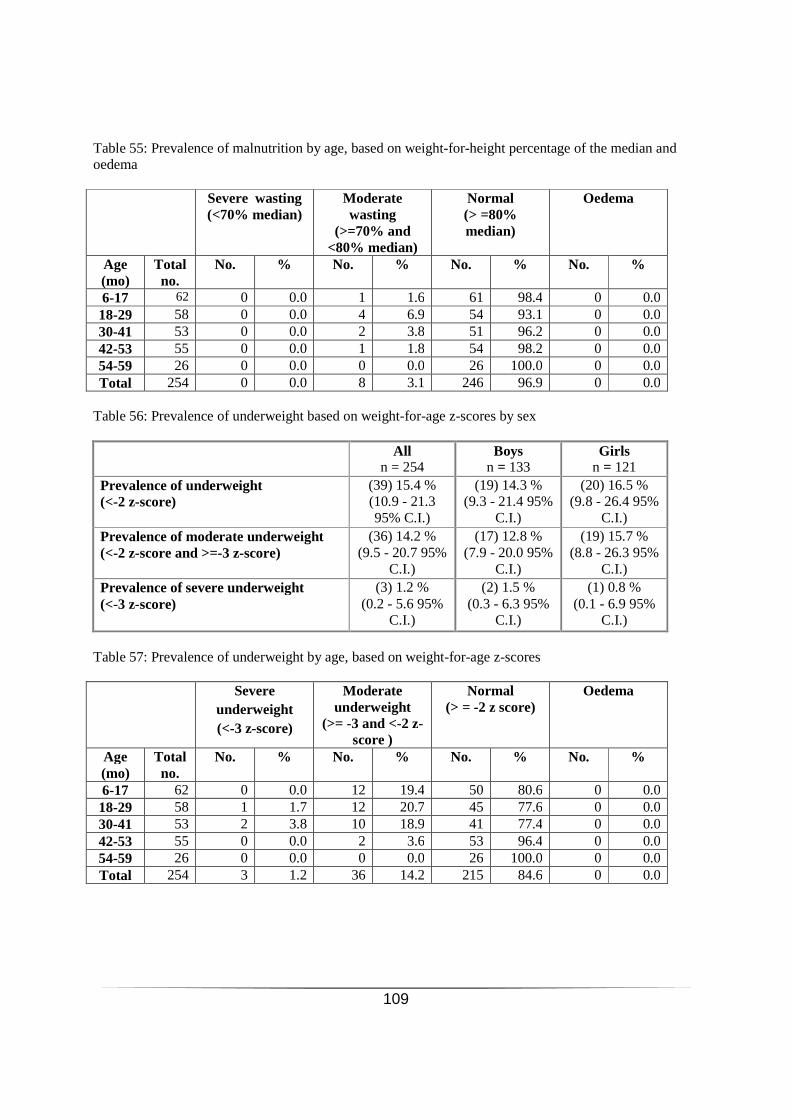
109
Table 55: Prevalence of malnutrition by age, based on weight-for-height percentage of the median and oedema Severe wasting
(<70% median) Moderate wasting
(>=70% and <80% median)
Normal (> =80% median)
Oedema
Age (mo)
Total no.
No. % No. % No. % No. %
6-17 62 0 0.0 1 1.6 61 98.4 0 0.0 18-29 58 0 0.0 4 6.9 54 93.1 0 0.0 30-41 53 0 0.0 2 3.8 51 96.2 0 0.0 42-53 55 0 0.0 1 1.8 54 98.2 0 0.0 54-59 26 0 0.0 0 0.0 26 100.0 0 0.0 Total 254 0 0.0 8 3.1 246 96.9 0 0.0
Table 56: Prevalence of underweight based on weight-for-age z-scores by sex All
n = 254 Boys
n = 133 Girls
n = 121 Prevalence of underweight (<-2 z-score)
(39) 15.4 % (10.9 - 21.3 95% C.I.)
(19) 14.3 % (9.3 - 21.4 95%
C.I.)
(20) 16.5 % (9.8 - 26.4 95%
C.I.) Prevalence of moderate underweight (<-2 z-score and >=-3 z-score)
(36) 14.2 % (9.5 - 20.7 95%
C.I.)
(17) 12.8 % (7.9 - 20.0 95%
C.I.)
(19) 15.7 % (8.8 - 26.3 95%
C.I.) Prevalence of severe underweight (<-3 z-score)
(3) 1.2 % (0.2 - 5.6 95%
C.I.)
(2) 1.5 % (0.3 - 6.3 95%
C.I.)
(1) 0.8 % (0.1 - 6.9 95%
C.I.)
Table 57: Prevalence of underweight by age, based on weight-for-age z-scores Severe
underweight (<-3 z-score)
Moderate underweight
(>= -3 and <-2 z-score )
Normal (> = -2 z score)
Oedema
Age (mo)
Total no.
No. % No. % No. % No. %
6-17 62 0 0.0 12 19.4 50 80.6 0 0.0 18-29 58 1 1.7 12 20.7 45 77.6 0 0.0 30-41 53 2 3.8 10 18.9 41 77.4 0 0.0 42-53 55 0 0.0 2 3.6 53 96.4 0 0.0 54-59 26 0 0.0 0 0.0 26 100.0 0 0.0 Total 254 3 1.2 36 14.2 215 84.6 0 0.0

110
Table 58: Prevalence of stunting based on height-for-age z-scores and by sex All
n = 254 Boys
n = 133 Girls
n = 121 Prevalence of stunting (<-2 z-score)
(58) 22.8 % (13.6 - 35.8 95% C.I.)
(36) 27.1 % (15.4 - 43.0 95% C.I.)
(22) 18.2 % (10.9 - 28.8 95% C.I.)
Prevalence of moderate stunting (<-2 z-score and >=-3 z-score)
(43) 16.9 % (11.3 - 24.7 95% C.I.)
(28) 21.1 % (13.2 - 31.9 95% C.I.)
(15) 12.4 % (8.1 - 18.6 95%
C.I.)
Prevalence of severe stunting (<-3 z-score)
(15) 5.9 % (2.4 - 14.0 95%
C.I.)
(8) 6.0 % (2.2 - 15.3 95%
C.I.)
(7) 5.8 % (2.2 - 14.2 95%
C.I.)
Table 59: Prevalence of stunting by age based on height-for-age z-scores Severe stunting
(<-3 z-score) Moderate stunting (>= -3 and <-2 z-
score )
Normal (> = -2 z score)
Age (mo) Total no.
No. % No. % No. %
6-17 62 3 4.8 7 11.3 52 83.9 18-29 58 4 6.9 8 13.8 46 79.3 30-41 53 5 9.4 12 22.6 36 67.9 42-53 55 3 5.5 10 18.2 42 76.4 54-59 26 0 0.0 6 23.1 20 76.9 Total 254 15 5.9 43 16.9 196 77.2
Table 60: Mean z-scores, Design Effects and excluded subjects Indicator n Mean z-scores
± SD Design Effect (z-score < -2)
z-scores not available*
z-scores out of range
Weight-for-Height 254 -0.34±1.04 1.54 0 0
Weight-for-Age 254 -1.00±0.96 1.12 0 0 Height-for-Age 254 -1.13±1.17 3.85 0 0 * contains for WHZ and WAZ the children with edema.

111
Rhino camp Result Tables for NCHS growth reference 1977 Table 61: Prevalence of acute malnutrition based on weight-for-height z-scores (and/or oedema) and by sex All
n = 210 Boys
n = 108 Girls
n = 102 Prevalence of global malnutrition (<-2 z-score and/or oedema)
(9) 4.3 % (2.3 - 7.8 95%
C.I.)
(3) 2.8 % (0.9 - 8.4 95%
C.I.)
(6) 5.9 % (2.8 - 11.8 95%
C.I.) Prevalence of moderate malnutrition (<-2 z-score and >=-3 z-score, no oedema)
(8) 3.8 % (1.8 - 7.9 95%
C.I.)
(2) 1.9 % (0.4 - 8.1 95%
C.I.)
(6) 5.9 % (2.8 - 11.8 95%
C.I.)
Prevalence of severe malnutrition (<-3 z-score and/or oedema)
(1) 0.5 % (0.0 - 4.5 95%
C.I.)
(1) 0.9 % (0.1 - 8.1 95%
C.I.)
(0) 0.0 % (0.0 - 0.0 95%
C.I.) The prevalence of oedema is 0.0 % Table 62: Prevalence of acute malnutrition by age, based on weight-for-height z-scores and/or oedema Severe wasting
(<-3 z-score) Moderate wasting
(>= -3 and <-2 z-score )
Normal (> = -2 z score)
Oedema
Age (mo)
Total no.
No. % No. % No. % No. %
6-17 54 0 0.0 5 9.3 49 90.7 0 0.0 18-29 41 0 0.0 1 2.4 40 97.6 0 0.0 30-41 42 0 0.0 0 0.0 42 100.0 0 0.0 42-53 47 1 2.1 1 2.1 45 95.7 0 0.0 54-59 26 0 0.0 1 3.8 25 96.2 0 0.0 Total 210 1 0.5 8 3.8 201 95.7 0 0.0
Table 63: Distribution of acute malnutrition and oedema based on weight-for-height z-scores <-3 z-score >=-3 z-score Oedema present Marasmic kwashiorkor
No. 0 (0.0 %)
Kwashiorkor No. 0
(0.0 %) Oedema absent Marasmic
No. 1 (0.5 %)
Not severely malnourished No. 209 (99.5 %)
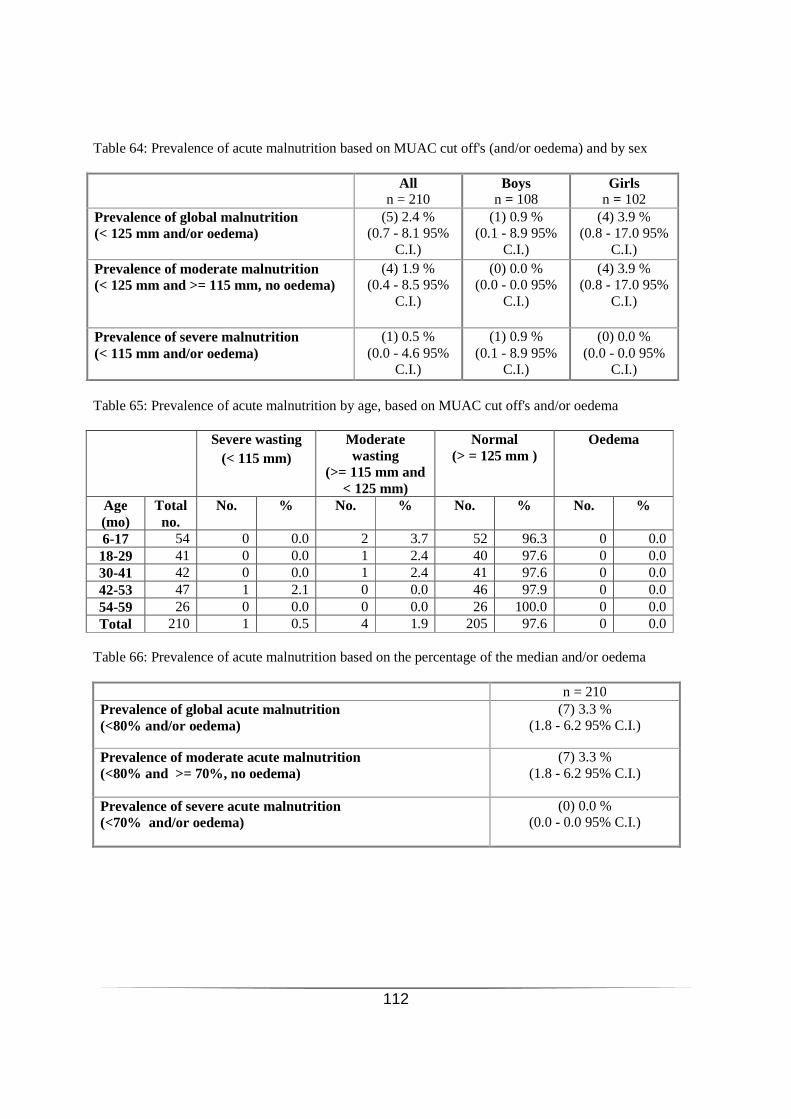
112
Table 64: Prevalence of acute malnutrition based on MUAC cut off's (and/or oedema) and by sex All
n = 210 Boys
n = 108 Girls
n = 102 Prevalence of global malnutrition (< 125 mm and/or oedema)
(5) 2.4 % (0.7 - 8.1 95%
C.I.)
(1) 0.9 % (0.1 - 8.9 95%
C.I.)
(4) 3.9 % (0.8 - 17.0 95%
C.I.) Prevalence of moderate malnutrition (< 125 mm and >= 115 mm, no oedema)
(4) 1.9 % (0.4 - 8.5 95%
C.I.)
(0) 0.0 % (0.0 - 0.0 95%
C.I.)
(4) 3.9 % (0.8 - 17.0 95%
C.I.)
Prevalence of severe malnutrition (< 115 mm and/or oedema)
(1) 0.5 % (0.0 - 4.6 95%
C.I.)
(1) 0.9 % (0.1 - 8.9 95%
C.I.)
(0) 0.0 % (0.0 - 0.0 95%
C.I.) Table 65: Prevalence of acute malnutrition by age, based on MUAC cut off's and/or oedema Severe wasting
(< 115 mm) Moderate wasting
(>= 115 mm and < 125 mm)
Normal (> = 125 mm )
Oedema
Age (mo)
Total no.
No. % No. % No. % No. %
6-17 54 0 0.0 2 3.7 52 96.3 0 0.0 18-29 41 0 0.0 1 2.4 40 97.6 0 0.0 30-41 42 0 0.0 1 2.4 41 97.6 0 0.0 42-53 47 1 2.1 0 0.0 46 97.9 0 0.0 54-59 26 0 0.0 0 0.0 26 100.0 0 0.0 Total 210 1 0.5 4 1.9 205 97.6 0 0.0
Table 66: Prevalence of acute malnutrition based on the percentage of the median and/or oedema n = 210 Prevalence of global acute malnutrition (<80% and/or oedema)
(7) 3.3 % (1.8 - 6.2 95% C.I.)
Prevalence of moderate acute malnutrition (<80% and >= 70%, no oedema)
(7) 3.3 % (1.8 - 6.2 95% C.I.)
Prevalence of severe acute malnutrition (<70% and/or oedema)
(0) 0.0 % (0.0 - 0.0 95% C.I.)

113
Table 67: Prevalence of malnutrition by age, based on weight-for-height percentage of the median and oedema Severe wasting
(<70% median) Moderate wasting
(>=70% and <80% median)
Normal (> =80% median)
Oedema
Age (mo)
Total no.
No. % No. % No. % No. %
6-17 54 0 0.0 4 7.4 50 92.6 0 0.0 18-29 41 0 0.0 0 0.0 41 100.0 0 0.0 30-41 42 0 0.0 0 0.0 42 100.0 0 0.0 42-53 47 0 0.0 2 4.3 45 95.7 0 0.0 54-59 26 0 0.0 1 3.8 25 96.2 0 0.0 Total 210 0 0.0 7 3.3 203 96.7 0 0.0
Table 68: Prevalence of underweight based on weight-for-age z-scores by sex All
n = 210 Boys
n = 108 Girls
n = 102 Prevalence of underweight (<-2 z-score)
(20) 9.5 % (5.3 - 16.6 95%
C.I.)
(9) 8.3 % (3.8 - 17.3 95%
C.I.)
(11) 10.8 % (5.5 - 20.0 95%
C.I.) Prevalence of moderate underweight (<-2 z-score and >=-3 z-score)
(17) 8.1 % (4.2 - 15.1 95%
C.I.)
(8) 7.4 % (2.8 - 17.9 95%
C.I.)
(9) 8.8 % (4.7 - 16.0 95%
C.I.) Prevalence of severe underweight (<-3 z-score)
(3) 1.4 % (0.5 - 4.3 95%
C.I.)
(1) 0.9 % (0.1 - 8.1 95%
C.I.)
(2) 2.0 % (0.4 - 9.0 95%
C.I.)
Table 69: Prevalence of underweight by age, based on weight-for-age z-scores Severe
underweight (<-3 z-score)
Moderate underweight
(>= -3 and <-2 z-score )
Normal (> = -2 z score)
Oedema
Age (mo)
Total no.
No. % No. % No. % No. %
6-17 54 2 3.7 10 18.5 42 77.8 0 0.0 18-29 41 0 0.0 1 2.4 40 97.6 0 0.0 30-41 42 0 0.0 2 4.8 40 95.2 0 0.0 42-53 47 0 0.0 3 6.4 44 93.6 0 0.0 54-59 26 1 3.8 1 3.8 24 92.3 0 0.0 Total 210 3 1.4 17 8.1 190 90.5 0 0.0

114
Table 70: Prevalence of stunting based on height-for-age z-scores and by sex All
n = 210 Boys
n = 108 Girls
n = 102 Prevalence of stunting (<-2 z-score)
(22) 10.5 % (6.0 - 17.6 95%
C.I.)
(15) 13.9 % (7.7 - 23.7 95%
C.I.)
(7) 6.9 % (3.0 - 14.8 95%
C.I.)
Prevalence of moderate stunting (<-2 z-score and >=-3 z-score)
(20) 9.5 % (4.8 - 17.9 95%
C.I.)
(14) 13.0 % (6.5 - 24.3 95%
C.I.)
(6) 5.9 % (2.0 - 16.1 95%
C.I.)
Prevalence of severe stunting (<-3 z-score)
(2) 1.0 % (0.2 - 3.8 95%
C.I.)
(1) 0.9 % (0.1 - 8.1 95%
C.I.)
(1) 1.0 % (0.1 - 7.0 95%
C.I.)
Table71: Prevalence of stunting by age based on height-for-age z-scores Severe stunting
(<-3 z-score) Moderate stunting
(>= -3 and <-2 z-score )
Normal (> = -2 z score)
Age (mo) Total no.
No. % No. % No. %
6-17 54 1 1.9 9 16.7 44 81.5
18-29 41 0 0.0 2 4.9 39 95.1 30-41 42 0 0.0 3 7.1 39 92.9 42-53 47 1 2.1 2 4.3 44 93.6 54-59 26 0 0.0 4 15.4 22 84.6 Total 210 2 1.0 20 9.5 188 89.5
Table 72: Mean z-scores, Design Effects and excluded subjects Indicator n Mean z-scores
± SD Design Effect (z-
score < -2) z-scores not available*
z-scores out of range
Weight-for-Height 210 -0.68±0.91 1.00 0 0
Weight-for-Age 210 -0.73±1.12 1.44 0 0 Height-for-Age 210 -0.19±1.46 1.40 0 0 * contains for WHZ and WAZ the children with edema.

115
Kiryandongo
Result Tables for NCHS growth reference 1977 Table 73: Prevalence of acute malnutrition based on weight-for-height z-scores (and/or oedema) and by sex All
n = 173 Boys n = 87
Girls n = 86
Prevalence of global malnutrition (<-2 z-score and/or oedema)
(11) 6.4 % (2.7 - 14.3 95%
C.I.)
(8) 9.2 % (4.1 - 19.5 95%
C.I.)
(3) 3.5 % (0.7 - 15.6 95%
C.I.) Prevalence of moderate malnutrition (<-2 z-score and >=-3 z-score, no oedema)
(9) 5.2 % (2.0 - 12.8 95%
C.I.)
(7) 8.0 % (3.1 - 19.5 95%
C.I.)
(2) 2.3 % (0.5 - 9.7 95%
C.I.)
Prevalence of severe malnutrition (<-3 z-score and/or oedema)
(2) 1.2 % (0.3 - 4.7 95%
C.I.)
(1) 1.1 % (0.1 - 10.8 95%
C.I.)
(1) 1.2 % (0.1 - 10.1 95%
C.I.) The prevalence of oedema is 0.0 % Table 74: Prevalence of acute malnutrition by age, based on weight-for-height z-scores and/or oedema Severe wasting
(<-3 z-score) Moderate wasting
(>= -3 and <-2 z-score )
Normal (> = -2 z score)
Oedema
Age (mo)
Total no.
No. % No. % No. % No. %
6-17 51 1 2.0 4 7.8 46 90.2 0 0.0 18-29 43 1 2.3 2 4.7 40 93.0 0 0.0 30-41 31 0 0.0 3 9.7 28 90.3 0 0.0 42-53 37 0 0.0 0 0.0 37 100.0 0 0.0 54-59 11 0 0.0 0 0.0 11 100.0 0 0.0 Total 173 2 1.2 9 5.2 162 93.6 0 0.0
Table 75: Distribution of acute malnutrition and oedema based on weight-for-height z-scores <-3 z-score >=-3 z-score Oedema present Marasmic kwashiorkor
No. 0 (0.0 %)
Kwashiorkor No. 0
(0.0 %) Oedema absent Marasmic
No. 2 (1.2 %)
Not severely malnourished No. 171 (98.8 %)

116
Table 76: Prevalence of acute malnutrition based on MUAC cut off's (and/or oedema) and by sex All
n = 173 Boys n = 87
Girls n = 86
Prevalence of global malnutrition (< 125 mm and/or oedema)
(173) 100.0 % (0.0 - 0.0 95%
C.I.)
(87) 100.0 % (0.0 - 0.0 95%
C.I.)
(86) 100.0 % (0.0 - 0.0 95%
C.I.)
Prevalence of moderate malnutrition (< 125 mm and >= 115 mm, no oedema)
(0) 0.0 % (0.0 - 0.0 95%
C.I.)
(0) 0.0 % (0.0 - 0.0 95%
C.I.)
(0) 0.0 % (0.0 - 0.0 95%
C.I.)
Prevalence of severe malnutrition (< 115 mm and/or oedema)
(173) 100.0 % (0.0 - 0.0 95%
C.I.)
(87) 100.0 % (0.0 - 0.0 95%
C.I.)
(86) 100.0 % (0.0 - 0.0 95%
C.I.)
Table 77: Prevalence of acute malnutrition by age, based on MUAC cut off's and/or oedema Severe wasting
(< 115 mm) Moderate wasting
(>= 115 mm and < 125 mm)
Normal (> = 125 mm )
Oedema
Age (mo)
Total no.
No. % No. % No. % No. %
6-17 51 51 100.0 0 0.0 0 0.0 0 0.0 18-29 43 43 100.0 0 0.0 0 0.0 0 0.0 30-41 31 31 100.0 0 0.0 0 0.0 0 0.0 42-53 37 37 100.0 0 0.0 0 0.0 0 0.0 54-59 11 11 100.0 0 0.0 0 0.0 0 0.0 Total 173 173 100.0 0 0.0 0 0.0 0 0.0
Table 78: Prevalence of acute malnutrition based on the percentage of the median and/or oedema n = 173 Prevalence of global acute malnutrition (<80% and/or oedema)
(7) 4.0 % (1.5 - 10.6 95% C.I.)
Prevalence of moderate acute malnutrition (<80% and >= 70%, no oedema)
(7) 4.0 % (1.5 - 10.6 95% C.I.)
Prevalence of severe acute malnutrition (<70% and/or oedema)
(0) 0.0 % (0.0 - 0.0 95% C.I.)

117
Table 79: Prevalence of malnutrition by age, based on weight-for-height percentage of the median and oedema Severe wasting
(<70% median) Moderate wasting
(>=70% and <80% median)
Normal (> =80% median)
Oedema
Age (mo)
Total no.
No. % No. % No. % No. %
6-17 51 0 0.0 3 5.9 48 94.1 0 0.0 18-29 43 0 0.0 2 4.7 41 95.3 0 0.0 30-41 31 0 0.0 2 6.5 29 93.5 0 0.0 42-53 37 0 0.0 0 0.0 37 100.0 0 0.0 54-59 11 0 0.0 0 0.0 11 100.0 0 0.0 Total 173 0 0.0 7 4.0 166 96.0 0 0.0
Table 80: Prevalence of underweight based on weight-for-age z-scores by sex All
n = 173 Boys n = 87
Girls n = 86
Prevalence of underweight (<-2 z-score)
(21) 12.1 % (7.6 - 18.8 95%
C.I.)
(12) 13.8 % (6.7 - 26.2 95%
C.I.)
(9) 10.5 % (5.0 - 20.6 95%
C.I.) Prevalence of moderate underweight (<-2 z-score and >=-3 z-score)
(18) 10.4 % (6.7 - 15.8 95%
C.I.)
(12) 13.8 % (6.7 - 26.2 95%
C.I.)
(6) 7.0 % (2.9 - 16.0 95%
C.I.) Prevalence of severe underweight (<-3 z-score)
(3) 1.7 % (0.3 - 8.5 95%
C.I.)
(0) 0.0 % (0.0 - 0.0 95%
C.I.)
(3) 3.5 % (0.7 - 15.9 95%
C.I.) Table 81: Prevalence of underweight by age, based on weight-for-age z-scores Severe
underweight (<-3 z-score)
Moderate underweight
(>= -3 and <-2 z-score )
Normal (> = -2 z score)
Oedema
Age (mo)
Total no.
No. % No. % No. % No. %
6-17 51 0 0.0 6 11.8 45 88.2 0 0.0 18-29 43 2 4.7 6 14.0 35 81.4 0 0.0 30-41 31 1 3.2 5 16.1 25 80.6 0 0.0 42-53 37 0 0.0 1 2.7 36 97.3 0 0.0 54-59 11 0 0.0 0 0.0 11 100.0 0 0.0 Total 173 3 1.7 18 10.4 152 87.9 0 0.0
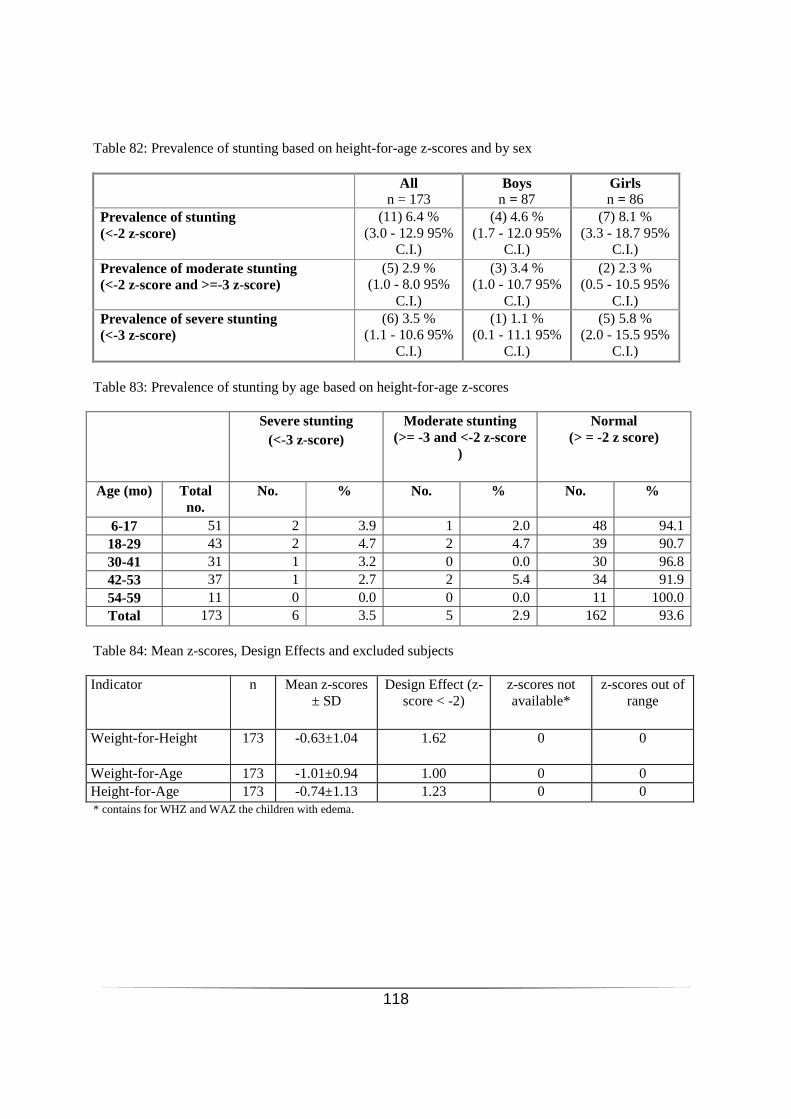
118
Table 82: Prevalence of stunting based on height-for-age z-scores and by sex All
n = 173 Boys n = 87
Girls n = 86
Prevalence of stunting (<-2 z-score)
(11) 6.4 % (3.0 - 12.9 95%
C.I.)
(4) 4.6 % (1.7 - 12.0 95%
C.I.)
(7) 8.1 % (3.3 - 18.7 95%
C.I.) Prevalence of moderate stunting (<-2 z-score and >=-3 z-score)
(5) 2.9 % (1.0 - 8.0 95%
C.I.)
(3) 3.4 % (1.0 - 10.7 95%
C.I.)
(2) 2.3 % (0.5 - 10.5 95%
C.I.) Prevalence of severe stunting (<-3 z-score)
(6) 3.5 % (1.1 - 10.6 95%
C.I.)
(1) 1.1 % (0.1 - 11.1 95%
C.I.)
(5) 5.8 % (2.0 - 15.5 95%
C.I.) Table 83: Prevalence of stunting by age based on height-for-age z-scores Severe stunting
(<-3 z-score) Moderate stunting
(>= -3 and <-2 z-score )
Normal (> = -2 z score)
Age (mo) Total no.
No. % No. % No. %
6-17 51 2 3.9 1 2.0 48 94.1 18-29 43 2 4.7 2 4.7 39 90.7 30-41 31 1 3.2 0 0.0 30 96.8 42-53 37 1 2.7 2 5.4 34 91.9 54-59 11 0 0.0 0 0.0 11 100.0 Total 173 6 3.5 5 2.9 162 93.6
Table 84: Mean z-scores, Design Effects and excluded subjects Indicator n Mean z-scores
± SD Design Effect (z-
score < -2) z-scores not available*
z-scores out of range
Weight-for-Height 173 -0.63±1.04 1.62 0 0
Weight-for-Age 173 -1.01±0.94 1.00 0 0 Height-for-Age 173 -0.74±1.13 1.23 0 0 * contains for WHZ and WAZ the children with edema.

119
Appendix 9.4: Map of area

120
Appendix 9.5: Questionnaires
ANNEX 9.5.1: FOOD SECURITY (THIS QUESTIONNAIRE WILL BE ADMINISTERED TO THE MAIN CARETAKERS RESPONSIBLE FOR COOKING THE MEALS) Settlement: ____________Village/Block/cluster name: _________Consent: yes / no / absent:_________________
Date of interview (dd/mm/yyyy) Cluster Number (in cluster survey only)
|___|___|/|___|___|/|___|___||___|___| |___|___| Team Number HH Number |___| |___|___|
HH size |___|___|
Name of HH of Household |___|___| Supervisor:_______________________________
NO QUESTIONS ANSWER CODES
SECTION FS1
FS1 In the last month, did you receive any food ration
Yes at 50%.................................................................1 |___|
Yes at 60%.................................................................2 IF ANSWER IS 1 or 2 or 3 GO TO FS3
Yes at 100%...............................................................3
No…………………………………………………...………………….. 4
FS2 If you did not receive any food ration in the last month, Why?
Not registered (but eligible)……………………….….…….. 1
Lost card………………………………………………………….…... 2 |___|
Traded card…………………………………………………….…... 3
Not eligible (not in targeting criteria)…………….…….. 5 GO TO FS4
Other…………………………………………………………..………. 6
FS3 How many days did the food from the general ration from the last month distribution cycle last?
INSERT DAYS
|___|___|
FS4 How did you supplement the food from the general ration?
Own production…………………………………………………….. 1
Purchase from market ( formal employment)………... 2
Income from Business …………………………………………....3
Remittance from abroad……………………………………….. 5
Other…………………………………………………………….....…… 6
FS5 In the last month, have you or anyone in your household borrowed cash, food or other items without interest?
Yes……………………………………………………………………….. 1
|___| No………………………………………………………………………... 2
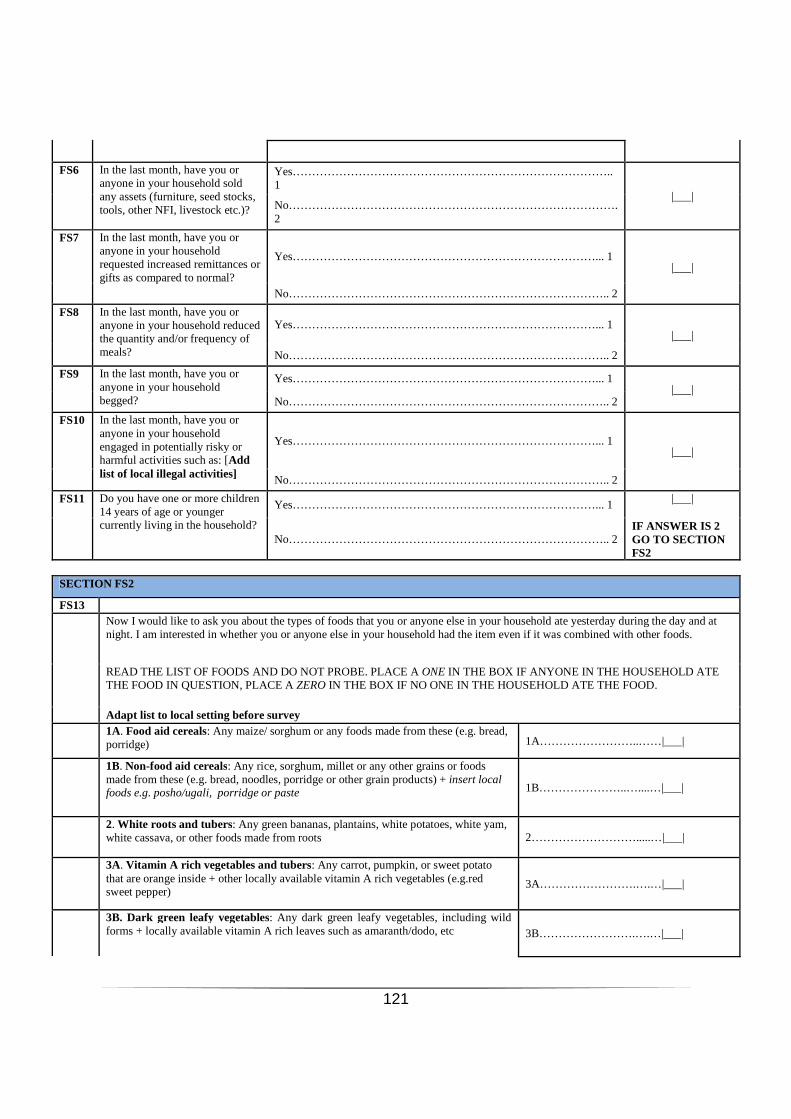
121
FS6 In the last month, have you or anyone in your household sold any assets (furniture, seed stocks, tools, other NFI, livestock etc.)?
Yes……………………………………………………………………….. 1
|___| No…………………………………………………………………………. 2
FS7 In the last month, have you or anyone in your household requested increased remittances or gifts as compared to normal?
Yes……………………………………………………………………... 1 |___|
No……………………………………………………………………….. 2
FS8 In the last month, have you or anyone in your household reduced the quantity and/or frequency of meals?
Yes……………………………………………………………………... 1 |___|
No……………………………………………………………………….. 2
FS9 In the last month, have you or anyone in your household begged?
Yes……………………………………………………………………... 1 |___|
No……………………………………………………………………….. 2
FS10 In the last month, have you or anyone in your household engaged in potentially risky or harmful activities such as: [Add list of local illegal activities]
Yes……………………………………………………………………... 1 |___|
No……………………………………………………………………….. 2
FS11 Do you have one or more children 14 years of age or younger currently living in the household?
Yes……………………………………………………………………... 1 |___|
No……………………………………………………………………….. 2 IF ANSWER IS 2 GO TO SECTION FS2
SECTION FS2
FS13 Now I would like to ask you about the types of foods that you or anyone else in your household ate yesterday during the day and at
night. I am interested in whether you or anyone else in your household had the item even if it was combined with other foods.
READ THE LIST OF FOODS AND DO NOT PROBE. PLACE A ONE IN THE BOX IF ANYONE IN THE HOUSEHOLD ATE THE FOOD IN QUESTION, PLACE A ZERO IN THE BOX IF NO ONE IN THE HOUSEHOLD ATE THE FOOD.
Adapt list to local setting before survey 1A. Food aid cereals: Any maize/ sorghum or any foods made from these (e.g. bread,
porridge) 1A……………………..……|___|
1B. Non-food aid cereals: Any rice, sorghum, millet or any other grains or foods made from these (e.g. bread, noodles, porridge or other grain products) + insert local foods e.g. posho/ugali, porridge or paste 1B…………………..…....…|___|
2. White roots and tubers: Any green bananas, plantains, white potatoes, white yam, white cassava, or other foods made from roots 2……………………….....…|___|
3A. Vitamin A rich vegetables and tubers: Any carrot, pumpkin, or sweet potato that are orange inside + other locally available vitamin A rich vegetables (e.g.red sweet pepper)
3A…………………….….…|___|
3B. Dark green leafy vegetables: Any dark green leafy vegetables, including wild forms + locally available vitamin A rich leaves such as amaranth/dodo, etc 3B…………………….….…|___|
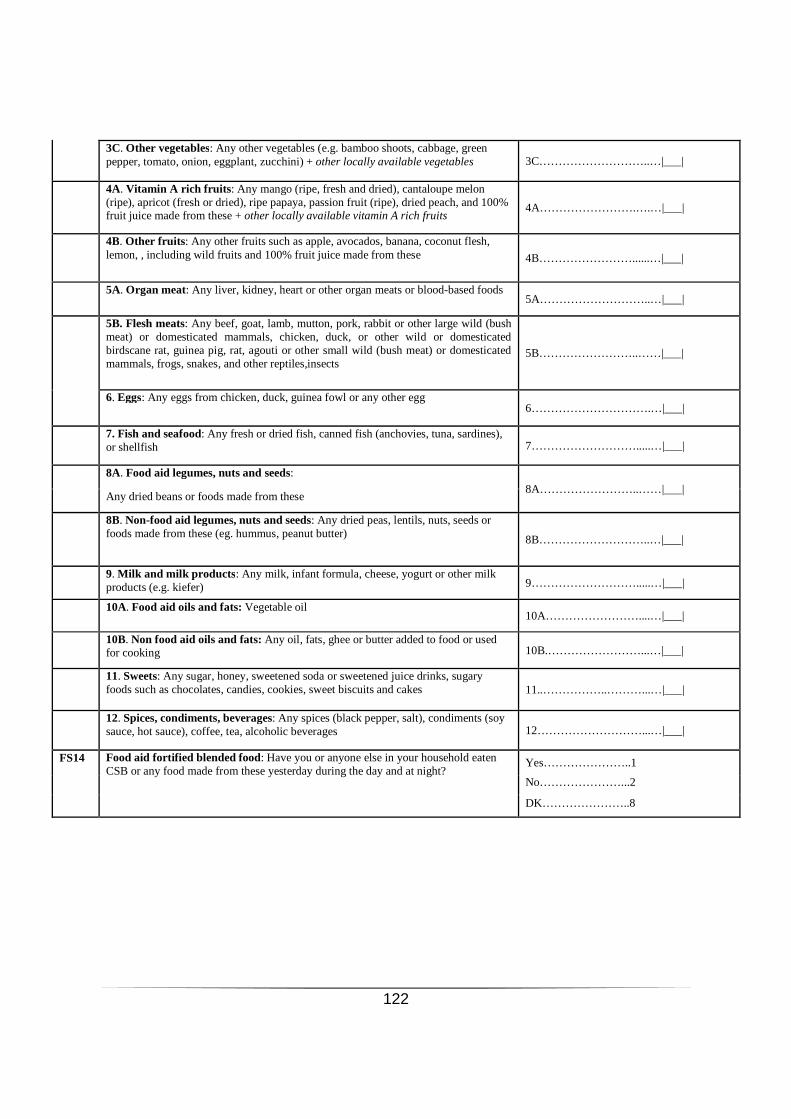
122
3C. Other vegetables: Any other vegetables (e.g. bamboo shoots, cabbage, green pepper, tomato, onion, eggplant, zucchini) + other locally available vegetables 3C………………………..…|___|
4A. Vitamin A rich fruits : Any mango (ripe, fresh and dried), cantaloupe melon (ripe), apricot (fresh or dried), ripe papaya, passion fruit (ripe), dried peach, and 100% fruit juice made from these + other locally available vitamin A rich fruits
4A…………………….….…|___|
4B. Other fruits : Any other fruits such as apple, avocados, banana, coconut flesh, lemon, , including wild fruits and 100% fruit juice made from these 4B……………………......…|___|
5A. Organ meat: Any liver, kidney, heart or other organ meats or blood-based foods 5A………………………..…|___|
5B. Flesh meats: Any beef, goat, lamb, mutton, pork, rabbit or other large wild (bush meat) or domesticated mammals, chicken, duck, or other wild or domesticated birdscane rat, guinea pig, rat, agouti or other small wild (bush meat) or domesticated mammals, frogs, snakes, and other reptiles,insects
5B……………………..……|___|
6. Eggs: Any eggs from chicken, duck, guinea fowl or any other egg 6………………………….…|___|
7. Fish and seafood: Any fresh or dried fish, canned fish (anchovies, tuna, sardines), or shellfish 7……………………….....…|___|
8A. Food aid legumes, nuts and seeds: 8A……………………..……|___|
Any dried beans or foods made from these
8B. Non-food aid legumes, nuts and seeds: Any dried peas, lentils, nuts, seeds or foods made from these (eg. hummus, peanut butter) 8B………………………..…|___|
9. Milk and milk products : Any milk, infant formula, cheese, yogurt or other milk products (e.g. kiefer) 9……………………….....…|___|
10A. Food aid oils and fats: Vegetable oil 10A……………………....…|___|
10B. Non food aid oils and fats: Any oil, fats, ghee or butter added to food or used for cooking 10B.……………………...…|___|
11. Sweets: Any sugar, honey, sweetened soda or sweetened juice drinks, sugary foods such as chocolates, candies, cookies, sweet biscuits and cakes 11..……………..………...…|___|
12. Spices, condiments, beverages: Any spices (black pepper, salt), condiments (soy sauce, hot sauce), coffee, tea, alcoholic beverages 12………………………...…|___|
FS14 Food aid fortified blended food: Have you or anyone else in your household eaten CSB or any food made from these yesterday during the day and at night?
Yes…………………..1
No…………………...2
DK…………………..8

123
ANNEX 9.5.4: INFANT AND YOUNY CHILD FEEDING (IYCF-questionnaire per child 0-23 months) (THIS QUESTIONNAIRE IS TO BE ADMINISTERED TO THE MOTHER OR THE MAIN CAREGIVER WHO IS RESPONSIBLE FOR FEEDING THE CHILD AND THE CHILD SHOULD BE BETWEEN 0 AND 23 MONTHS OF AGE) Settlement: ____________Village/Block/cluster name: _________Consent: yes / no / absent:_____________
Date of interview (dd/mm/yyyy) Cluster Number (in cluster survey only)
|___|___|/|___|___|/|___|___||___|___| |___|___| Team Number |___| Name of HH of Household |___|___|
Supervisor: ________________
No QUESTION ANSWER CODES SECTION IF1
IF1 Sex
Male ............................................................................ 1 Female ........................................................................ 2
|___|
IF2 Birth date (RECORD FROM AGE
DOCUMENTATION. LEAVE BLANK IF NO VALID AGE DOCUMENTATION)
Day/Month/Year…..|___|___| /|___|___| / |___|___||___|___|
IF3 Child’s age in months
IF AGE DOCUMENTATION NOT AVAILABLE, ESTIMATE USING EVENT CALENDAR. IF AGE DOCUMENTATION AVAILABLE, RECORD THE AGE IN MONTHS FROM THE DATE OF BIRTH
|___|___|
IF4 Has the child ever been breastfed? Yes .............................................................................. 1
No ................................................................................ 2 DK ............................................................................... 8
IF ANSWER IS 2 or 8 GO TO IF7
|___|
IF5 How long after birth did you first put the child to the breast?
Less than one hour ..................................................... 1 Between 1 and 23 hours ............................................. 2 More than 24 hours ..................................................... 3 DK ............................................................................... 8
|___|
IF6 Was the breastfed yesterday during the day or at night?
Yes .............................................................................. 1 No ................................................................................ 2 DK ............................................................................... 8
|___|
IF7 How long did you feed the child on
breast milk only ( in months)
|___|
IF8 At what age did you introduce liquid/or solid foods to the child?
( in months)
|___|
IF9 At what age did you completely stopped feeding the child on breast milk?
( in months)
|___|
SECTION IF2 IF10 Now I would like to ask you about liquids that [NAME] may have had yesterday during the day and at night. I am interested in
whether your child had the item even if it was combined with other foods. Yesterday, during the day or at night, did [NAME] receive any of the following? ASK ABOUT EVERY LIQUID. IF ITEM WAS GIVEN, CIRCLE ‘1’. IF ITEM WAS NOT GIVEN, CIRCLE ‘2’. IF CAREGIVER DOESN’T KNOW, CIRCLE ‘8’. EVERY LINE MUST HAVE A CODE. Adapt list to local setting before survey
Yes No DK
10A. Plain water
10A………………………1 2 8
10B. Infant formula: ( give local examples) 10B………………………1 2 8
10C. Milk such as tinned, powdered, or fresh animal milk( give examples)
10C………………………1 2 8
10D. Juice or juice drinks [give examples)
10D………………………1 2 8
10E. Sour milk or yogurt for example: [add local names of yogurt]
10E………………………1 2 8
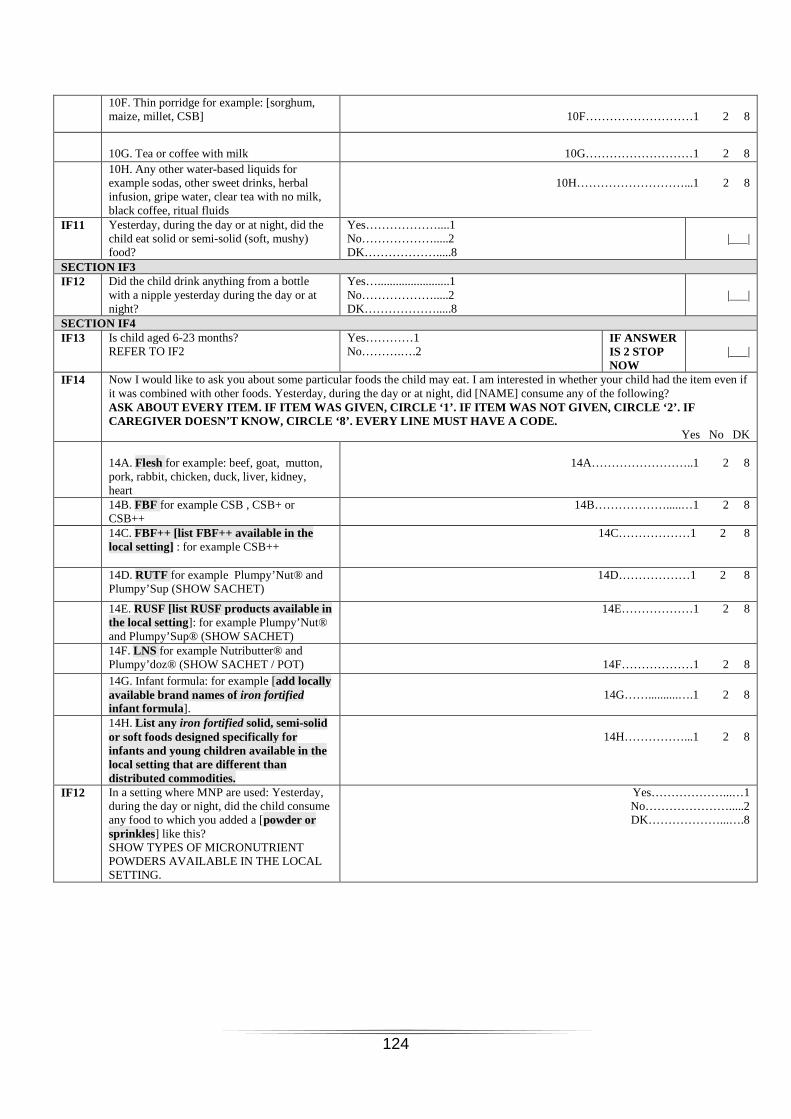
124
10F. Thin porridge for example: [sorghum, maize, millet, CSB]
10F………………………1 2 8
10G. Tea or coffee with milk
10G………………………1 2 8
10H. Any other water-based liquids for example sodas, other sweet drinks, herbal infusion, gripe water, clear tea with no milk, black coffee, ritual fluids
10H………………………...1 2 8
IF11 Yesterday, during the day or at night, did the child eat solid or semi-solid (soft, mushy) food?
Yes………………....1 No……………….....2 DK……………….....8
|___|
SECTION IF3 IF12 Did the child drink anything from a bottle
with a nipple yesterday during the day or at night?
Yes…........................1 No……………….....2 DK……………….....8
|___|
SECTION IF4 IF13 Is child aged 6-23 months?
REFER TO IF2 Yes…………1 No……….….2
IF ANSWER IS 2 STOP NOW
|___|
IF14 Now I would like to ask you about some particular foods the child may eat. I am interested in whether your child had the item even if it was combined with other foods. Yesterday, during the day or at night, did [NAME] consume any of the following? ASK ABOUT EVERY ITEM. IF ITEM WAS GIVEN, CIRCLE ‘1’. IF ITEM W AS NOT GIVEN, CIRCLE ‘2’. IF CAREGIVER DOESN’T KNOW, CIRCLE ‘8’. EVERY LINE MUST HAVE A CODE.
Yes No DK
14A. Flesh for example: beef, goat, mutton, pork, rabbit, chicken, duck, liver, kidney, heart
14A……………………..1 2 8
14B. FBF for example CSB , CSB+ or CSB++
14B……………….....…1 2 8
14C. FBF++ [list FBF++ available in the local setting] : for example CSB++
14C………………1 2 8
14D. RUTF for example Plumpy’Nut® and Plumpy’Sup (SHOW SACHET)
14D………………1 2 8
14E. RUSF [list RUSF products available in the local setting]: for example Plumpy’Nut® and Plumpy’Sup® (SHOW SACHET)
14E………………1 2 8
14F. LNS for example Nutributter® and Plumpy’doz® (SHOW SACHET / POT)
14F………………1 2 8
14G. Infant formula: for example [add locally available brand names of iron fortified infant formula ].
14G……..........….1 2 8
14H. List any iron fortified solid, semi-solid or soft foods designed specifically for infants and young children available in the local setting that are different than distributed commodities.
14H……………...1 2 8
IF12 In a setting where MNP are used: Yesterday, during the day or night, did the child consume any food to which you added a [powder or sprinkles] like this? SHOW TYPES OF MICRONUTRIENT POWDERS AVAILABLE IN THE LOCAL SETTING.
Yes………………...…1 No………………….....2 DK………………...….8

125
ANNEX 9.5.5: WATER, SANITATION AND HYGIENE (WASH qu estionnaire) Settlement: ____________Village/Block/cluster name: _________Consent: yes / no / absent:_____________
Date of interview (dd/mm/yyyy) Cluster Number (in cluster survey only)
|___|___|/|___|___|/|___|___||___|___| |___|___| Team Number |___| Name of HH of Household |___|___| Supervisor: ________________
No QUESTION ANSWER CODES SECTION WS1 WS1
How many people live in this household? |___|___|
WS2 What is the main source of drinking water for members of your household? Adapt list to local setting before survey DO NOT READ THE ANSWERS SELECT ONE ONLY
Piped water ................................................... 01 Public tap/standpipe ...................................... 02 Tubewell/borehole (& pump) ....................... 03
Protected dug well ............................................ 04 Protected spring ............................................ 05 Rain water collection .................................... 06 UNHCR Tanker ........................................... 07 Unprotected spring........................................ 08
Unprotected dug well ....................................... 09 Small water vendor ....................................... 10 Tanker truck .................................................. 11 Bottled water ................................................. 12 Surface water (e.g. river, pond) ................... 13 Other ............................................................. 96 Don’t know ................................................... 98
|___|___|
WS3 How long does it usually take you to go to your main water source, get water, and come back? THIS RELATES TO DRINKING WATER
RECORD THE NUMBER OF MINUTES IF KNOWN (RECORD 000 IF ON PREMISE AND 998 IF UNKNOWN)
|___|___|___|
Minutes SUPERVISOR TO SELECT ONE ONLY On premises .................................................... 1 Less than 30 minutes ...................................... 2 More than 30 minutes ..................................... 3 Don’t know ..................................................... 8
|___|
WS4 Are you satisfied with the water supply? THIS RELATES TO THE DRINKING WATER SUPPLY
Yes .................................................................. 1 No ................................................................... 2 Other ............................................................... 6
|___|
WS5 What kind of toilet facility does this household use? Adapt list to local setting before survey DO NOT READ THE ANSWERS SELECT ONE ONLY
Flush to piped sewer system .......................... 01 Flush to septic system .................................... 02 Pour-flush to pit ............................................. 03 VIP/simple pit latrine with floor/slab ............ 04 Composting/dry latrine .................................. 05 Flush or pour-flush elsewhere........................ 06 Pit latrine without floor/slab .......................... 07 Service or bucket latrine ............................... 08 Hanging toilet/latrine ..................................... 09 No facility, field, bush, plastic bag ................ 10
|___|___| IF ANSWER IS 10 GO TO WS7
WS6 How many households share this toilet?
RECORD NUMBER OF HOUSEHOLDS IF KNOWN (RECORD 96 IF PUBLIC TOILET OR 98 IF UNKNOWN)
|___|___|
Households SUPERVISOR SELECT ONE ONLY Not shared (1 HH) .......................................... 1 Shared family (2 HH) ..................................... 2 Communal toilet (3 HH or more) .................. 3 Public toilet (in market or clinic etc.) ........... 4 Don’t know ..................................................... 8
|___|
Yes .................................................................. 1 IF ANSWER IS 2 GO TO

126
WS7 Do you have children under five years old? No .................................................................... 2 WS9 |___|
WS8 If yes, what was done to dispose of the stools each time child passed stools in the last 7days. DO NOT READ THE ANSWERS CHECK ONE ONLY
Child used toilet/latrine .................................. 01 Put/rinsed into toilet or latrine ....................... 02 Buried ............................................................ 03 Thrown into garbage ...................................... 04 Put/rinsed into drain or ditch ......................... 05 Left in the open .............................................. 06 Other (specify) ............................................... 96 Don’t know .................................................. 98
|___|___|
SECTION WS2 Observation Based Questions (done after the initial questions to ensure the flow of the interview is not broken )
No OBSERVATION / QUESTION ANSWER
WS9
CALCULATE THE TOTAL AMOUNT OF WATER USED BY THE HOUSEHOLD PER DAY THIS RELATES TO ALL SOURCES OF WATER (DRINKING WATER AND NON-DRINKING WATER SOURCES)
Please show me the containers you used yesterday for collecting water ASSIGN A NUMBER TO EACH CONTAINER
Capacity in litres
Number of journeys made with each container
Total litres per day
1
2
3
4
5
6
7
8
9
10
Total litres used by household
WS10 Please show me where you store your drinking water. ARE THE DRINKING WATER CONTAINERS COVERED OR NARROW NECKED?
All are .............................................................. 1 Some are .......................................................... 2 None are .......................................................... 3
|____|
WS11 Please show me the toilet facility that is usually used by family members. CONFIRM ANSWER TO WS5 ABOVE
ONLY ANSWER THIS FOR TOILETS USED BY 1 OR 2 HH (SEE WS4). IF TOILETS USED BY 3 HH OR MORE, SKIP TO NEXT MODULE AND LEAVE BLANK Toilet in use .................................................... 1 Toilet not in use ............................................. 2 Not observed .................................................. 3
|____|

127
Annex 9.5.6-Mosquito Net Coverage questionnaire Settlement: _____________________Village/Block/cluster name: ___________________________Consent: yes / no / absent:_____ _________________
Date of interview (dd/mm/yyyy) Cluster Number (in cluster survey only)
|___|___|/|___|___|/|___|___||___|___| |___|___| Team Number |___| Name of HH of Household |___|___| Supervisor: ________________
No QUESTION ANSWER CODES SECTION TN1
TN1 How many people live in this household and slept here last night? INSERT NUMBER
|___|___|
TN2 How many children 0-59 months live in this household and slept here last night? INSERT NUMBER
|___|___|
TN3 How many pregnant women live in this household and slept here last night? INSERT NUMBER
|___|___|
TN4 Did you have your house sprayed with insecticide in an indoor residual spray campaign in the past I___I months?
Yes .................................................................. 1 No .................................................................... 2
|___|
TN5 Do you have mosquito nets in this household that can be used while sleeping?
Yes .................................................................. 1 No .................................................................... 2
|___| IF ANSWER IS 2 STOP
NOW TN6 How many of these mosquito nets that can be used while
sleeping does your household have? INSERT NUMBER IF 4 NETS OR MORE, ENTER THE NUMBER AND USE ADDITIONAL NET QUESTIONNAIRE SHEETS ENTERING THE NUMBER OF THE NETS SEQUENTIALLY AT THE TOP
|___| Nets
TN7 ASK RESPONDENT TO SHOW YOU THE NET(S) IN THE HH. IF NETS ARE NOT OBSERVED � CORRECT TN6 ANSWER
NET #|___|
NET #|___|
NET #|___|
NET #|___|
TN8 OBSERVE NET AND RECORD THE BRANDNAME OF NET ON THE TAG. IF NO TAG EXISTS OR IS UNREADABLE RECORD ‘DK’ FOR DON’T KNOW.
TN9 For supervisor only (not to be 1=LLIN 1=LLIN 1=LLIN 1=LLIN

128
SECTION TN2 Line no Household
members Sex Age Pregnancy
status Slept under net
Which net Type of net
# COL1 COL2
COL3 COL4 COL5 COL6 COL7
Please give me the names of the HH members who live here and who slept in your house last night
Sex m/f
Age years
FOR WOMEN ≥ 15 years, ASK: Is (NAME) currently pregnant? (CIRCLE not applicable ‘99’ if female < 15 or male) Yes No/DK N/A
Did (NAME) sleep under a net last night? Yes No/DK
ASK THE RESPONDENT TO PHYSICALLY IDENTIFY WHICH OF THE OBSERVED NETS THEY SLEPT UNDER. CIRCLE THE NUMBER ORRESPONDING TO THE NET THEY USED. net#1 net#2 net# 3 net#4
For supervisor only: BASED ON THE OBSERVED NET BRANDNAME RECORDED (TN8) INDICATE IF IT IS AN LLIN OR OTHER OR UNKNOWN (DK) LLIN OTHER/DK
01
m f <5 ≥5
1 0 99
1 0 1 2 3 4 1 2
02
m f <5 ≥5 1 0 99
1 0 1 2 3 4 1 2
done during interview): WHAT TYPE OF NET IS THIS? BASED ON THE TAG INDICATE IF THIS IS A LLIN OR OTHER TYPE OF NET OR DON’T KNOW.
2=Other/DK |___|
2=Other/DK |___|
2=Other/DK |___|
2=Other/DK |___|
TN10 For supervisor only (not to be done during interview): RECORD THE TOTAL NUMBER OF LLINs IN HH BY COUNTING THE NUMBER OF ‘1’ IN TN9.
|___| LLINs
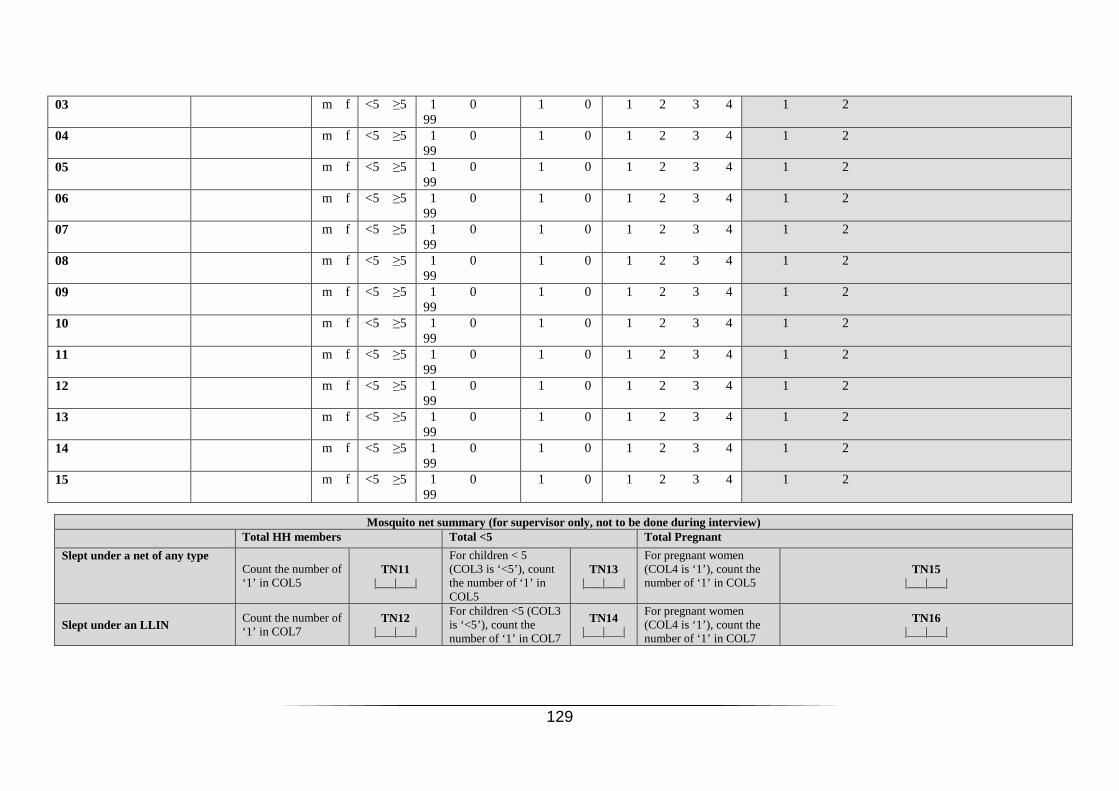
129
03
m f <5 ≥5 1 0 99
1 0 1 2 3 4 1 2
04
m f <5 ≥5 1 0 99
1 0 1 2 3 4 1 2
05
m f <5 ≥5 1 0 99
1 0 1 2 3 4 1 2
06
m f <5 ≥5 1 0 99
1 0 1 2 3 4 1 2
07
m f <5 ≥5 1 0 99
1 0 1 2 3 4 1 2
08
m f <5 ≥5 1 0 99
1 0 1 2 3 4 1 2
09
m f <5 ≥5 1 0 99
1 0 1 2 3 4 1 2
10
m f <5 ≥5 1 0 99
1 0 1 2 3 4 1 2
11
m f <5 ≥5 1 0 99
1 0 1 2 3 4 1 2
12
m f <5 ≥5 1 0 99
1 0 1 2 3 4 1 2
13
m f <5 ≥5 1 0 99
1 0 1 2 3 4 1 2
14
m f <5 ≥5 1 0 99
1 0 1 2 3 4 1 2
15
m f <5 ≥5 1 0 99
1 0 1 2 3 4 1 2
Mosquito net summary (for supervisor only, not to be done during interview) Total HH members Total <5 Total Pregnant
Slept under a net of any type
Count the number of ‘1’ in COL5
TN11 |___|___|
For children < 5 (COL3 is ‘<5’), count the number of ‘1’ in COL5
TN13 |___|___|
For pregnant women (COL4 is ‘1’), count the number of ‘1’ in COL5
TN15 |___|___|
Slept under an LLIN Count the number of ‘1’ in COL7
TN12 |___|___|
For children <5 (COL3 is ‘<5’), count the number of ‘1’ in COL7
TN14 |___|___|
For pregnant women (COL4 is ‘1’), count the number of ‘1’ in COL7
TN16 |___|___|

130
Annex 7: Mortality Questionnaire (Household data collection form for a mortality rate calculation survey (One sheet/household)
Settlement: Village/Block/Cluster Name: Date:_____/______/2012 Team number:________________ Cluster No: __________________ HH No:__________________ Supervisor:___________________
S1 1 2 3 4 5 6 7
ID HH
member
Slept in the household last
night
Present at beginning of recall (include those not present now and indicate which members were not present at
the start of the recall period )
Sex Date of
birth/or age in years
Born during recall
period?
Died during the
recall period
1 2 3 4 5 6 7 8 9 10 11 12 13 14 15 16 17 18 19 20
Tally (these data are entered into ENA for each household): S2
1 Current HH members – total Number of ticks in column 2 2 Current HH members - < 5

131
4 If the child subsequently died during the recall period tally up as death ONLY
3 Current HH members who arrived during recall (exclude births)
Number of crosses in column 3
4 Current HH members who arrived during recall - <5 5 Past HH members who left during recall (exclude deaths) Number of crosses in column 2 6 Past HH members who left during recall - < 5 7 Births during recall4 Number of ticks in column 6 8 Total deaths Number of ticks in column 7 9 Deaths < 5
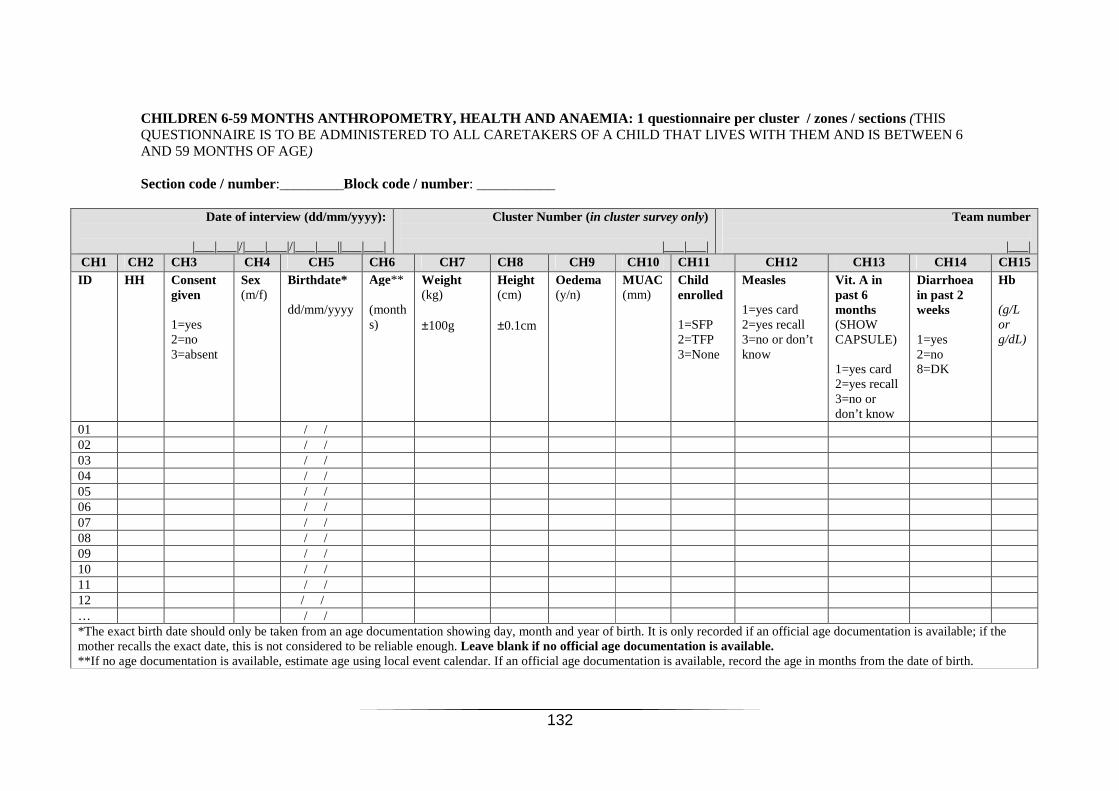
132
CHILDREN 6-59 MONTHS ANTHROPOMETRY, HEALTH AND ANAE MIA: 1 questionnaire per cluster / zones / sections (THIS QUESTIONNAIRE IS TO BE ADMINISTERED TO ALL CARETAKERS OF A CHILD THAT LIVES WITH THEM AND IS BETWEEN 6 AND 59 MONTHS OF AGE) Section code / number:_________Block code / number: ___________
Date of interview (dd/mm/yyyy):
|___|___|/|___|___|/|___|___||___|___|
Cluster Number (in cluster survey only)
|___|___|
Team number
|___| CH1 CH2 CH3 CH4 CH5 CH6 CH7 CH8 CH9 CH10 CH11 CH12 CH13 CH14 CH15 ID HH Consent
given 1=yes 2=no 3=absent
Sex (m/f)
Birthdate* dd/mm/yyyy
Age** (months)
Weight (kg) ±100g
Height (cm) ±0.1cm
Oedema (y/n)
MUAC (mm)
Child enrolled 1=SFP 2=TFP 3=None
Measles 1=yes card 2=yes recall 3=no or don’t know
Vit. A in past 6 months (SHOW CAPSULE) 1=yes card 2=yes recall 3=no or don’t know
Diarrhoea in past 2 weeks 1=yes 2=no 8=DK
Hb (g/L or g/dL)
01 / / 02 / / 03 / / 04 / / 05 / / 06 / / 07 / / 08 / / 09 / / 10 / / 11 / / 12 / / … / / *The exact birth date should only be taken from an age documentation showing day, month and year of birth. It is only recorded if an official age documentation is available; if the mother recalls the exact date, this is not considered to be reliable enough. Leave blank if no official age documentation is available. **If no age documentation is available, estimate age using local event calendar. If an official age documentation is available, record the age in months from the date of birth.
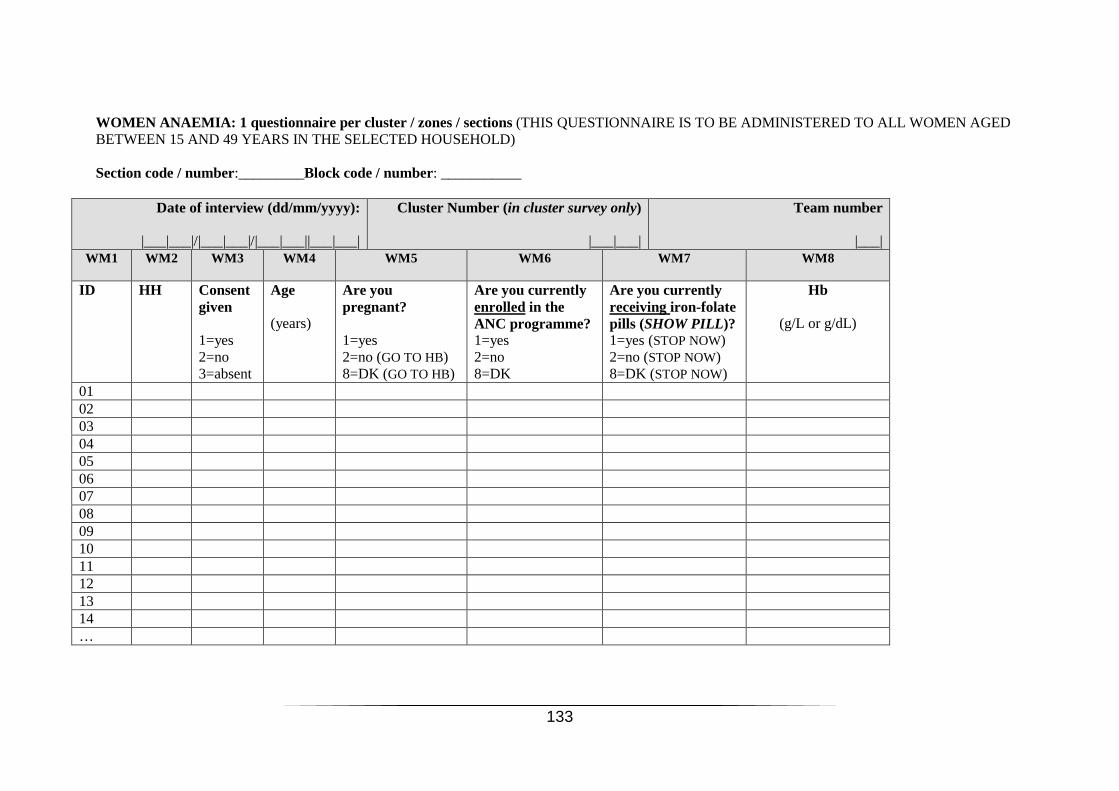
133
WOMEN ANAEMIA: 1 questionnaire per cluster / zones / sections (THIS QUESTIONNAIRE IS TO BE ADMINISTERED TO ALL WOMEN AGED BETWEEN 15 AND 49 YEARS IN THE SELECTED HOUSEHOLD) Section code / number:_________Block code / number: ___________
Date of interview (dd/mm/yyyy):
|___|___|/|___|___|/|___|___||___|___|
Cluster Number (in cluster survey only)
|___|___|
Team number
|___| WM1 WM2 WM3 WM4 WM5 WM6 WM7 WM8
ID HH Consent
given 1=yes 2=no 3=absent
Age (years)
Are you pregnant? 1=yes 2=no (GO TO HB) 8=DK (GO TO HB)
Are you currently enrolled in the ANC programme? 1=yes 2=no 8=DK
Are you currently receiving iron-folate pills (SHOW PILL)? 1=yes (STOP NOW) 2=no (STOP NOW) 8=DK (STOP NOW)
Hb
(g/L or g/dL)
01 02 03 04 05 06 07 08 09 10 11 12 13 14 …
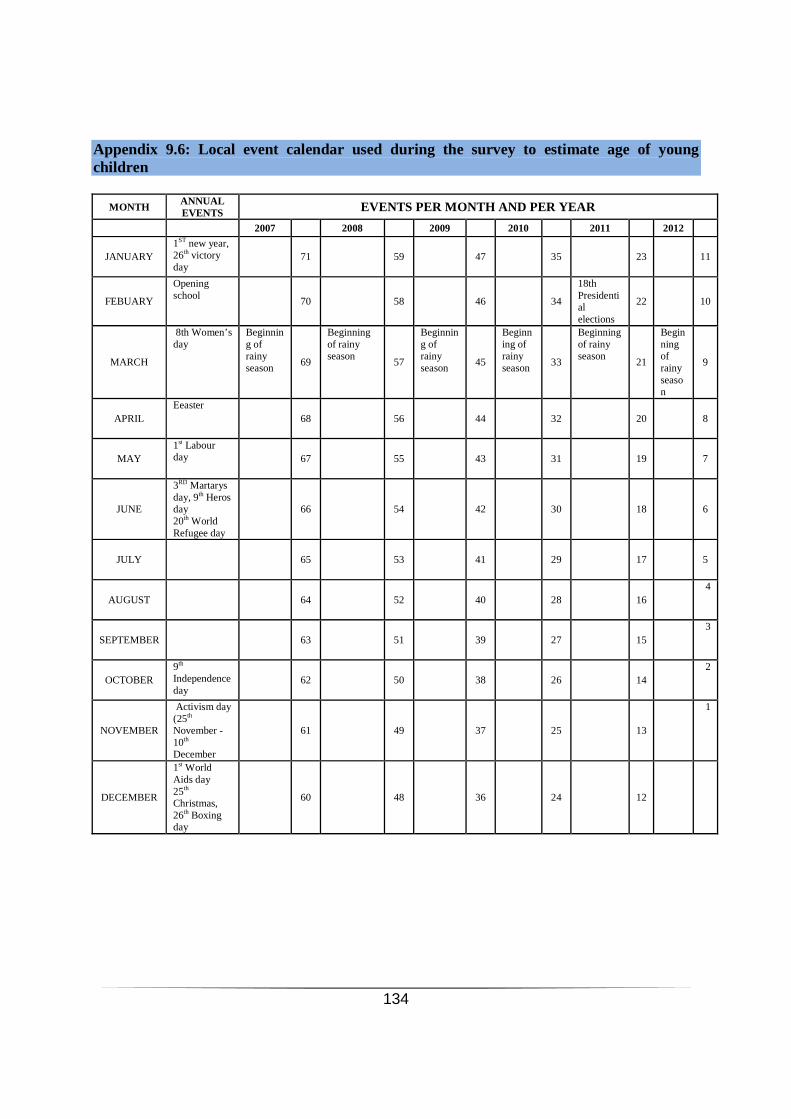
134
Appendix 9.6: Local event calendar used during the survey to estimate age of young children
MONTH ANNUAL EVENTS EVENTS PER MONTH AND PER YEAR
2007 2008 2009 2010 2011 2012
JANUARY 1ST new year, 26th victory day
71
59
47
35
23
11
FEBUARY
Opening school
70
58
46
34
18th Presidential elections
22
10
MARCH
8th Women’s day
Beginning of rainy season
69
Beginning of rainy season
57
Beginning of rainy season
45
Beginning of rainy season
33
Beginning of rainy season
21
Beginning of rainy season
9
APRIL Eeaster
68
56
44
32
20
8
MAY 1st Labour day
67
55
43
31
19
7
JUNE
3RD Martarys day, 9th Heros day 20th World Refugee day
66
54
42
30
18
6
JULY
65
53
41
29
17
5
AUGUST
64
52
40
28
16 4
SEPTEMBER
63
51
39
27
15 3
OCTOBER 9th Independence day
62
50
38
26
14
2
NOVEMBER
Activism day (25th November -10th December
61
49
37
25
13
1
DECEMBER
1st World Aids day 25th Christmas, 26th Boxing day
60
48
36
24
12

135
Appendix 9.7: Nutrition, Health, Food Security Assessment November, 2012 Child Age Calendar
Birth date Age Birth date Age Birth date Age Birth date Age Birth date Age Birth date Age
1.12.2012 1.12.2011 11 1.12.2010 23 1.12.2009 35 1.12.2008 47 1.12.2007 59
1.11.2012 0 1.11.2011 12 1.11.2010 24 1.11.2009 36 1.11.2008 48 1.11.2007
1.10.2012 1 1.10.2011 13 1.10.2010 25 1.10.2009 37 1.10.2008 49 1.10.2007
1.09.2012 2 1.09.2011 14 1.09.2010 26 1.09.2009 38 1.09.2008 50 1.09.2007
1.08.2012 3 1.08.2011 15 1.08.2010 27 1.08.2009 39 1.08.2008 51 1.08.2007
1.07.2012 4 1.07.2011 16 1.07.2010 28 1.07.2009 40 1.07.2008 52 1.07.2007
1.06.2012 5 1.06.2011 17 1.06.2010 29 1.06.2009 41 1.06.2008 53 1.06.2007
1.05.2012 6 1.05.2011 18 1.05.2010 30 1.05.2009 42 1.05.2008 54 1.05.2007
1.04.2012 7 1.04.2011 19 1.04.2010 31 1.04.2009 43 1.04.2008 55 1.04.2007
1.03.2012 8 1.03.2011 20 1.03.2010 32 1.03.2009 44 1.03.2008 56 1.03.2007
1.02.2012 9 1.02.2011 21 1.02.2010 33 1.02.2009 45 1.02.2008 57 1.02.2007
1.01.2012 10 1.01.2011 22 1.01.2010 34 1.01.2009 46 1.01.2008 58 1.01.2007


![[DE] PROJECT CONSULT Newsletter 2010 | PROJECT CONSULT Unternehmensberatung GmbH](https://img.dokumen.tips/doc/110x75/579078681a28ab6874c250ef/de-project-consult-newsletter-2010-project-consult-unternehmensberatung.jpg)
![[DE] PROJECT CONSULT Newsletter 2008 | PROJECT CONSULT Unternehmensberatung GmbH](https://img.dokumen.tips/doc/110x75/579078681a28ab6874c250b1/de-project-consult-newsletter-2008-project-consult-unternehmensberatung.jpg)
![[DE] PROJECT CONSULT Newsletter 2013 | PROJECT CONSULT Unternehmensberatung GmbH](https://img.dokumen.tips/doc/110x75/579078681a28ab6874c25153/de-project-consult-newsletter-2013-project-consult-unternehmensberatung.jpg)
![[DE] PROJECT CONSULT Newsletter 2004 | PROJECT CONSULT Unternehmensberatung GmbH](https://img.dokumen.tips/doc/110x75/579078671a28ab6874c24f26/de-project-consult-newsletter-2004-project-consult-unternehmensberatung.jpg)
![[DE] PROJECT CONSULT Newsletter 2009 | PROJECT CONSULT Unternehmensberatung GmbH](https://img.dokumen.tips/doc/110x75/579078681a28ab6874c250cd/de-project-consult-newsletter-2009-project-consult-unternehmensberatung-579b2702234a2.jpg)


