Embed Size (px)
Citation preview
03 March 2015
Readers in all geographies please refer to important disclosures and disclaimers starting on page 56 In the United Kingdom this document is a MARKETING COMMUNICATION. It has not been prepared in accordance with the rules in the FCA Conduct of Business Sourcebook designed to promote the independence of research and is also not subject to any prohibition on dealing ahead of the dissemination of research. The global contacts include: Andrew Fitchie (EU) and Leon van Heerden (SA). Full analyst and global contact details are shown on the back page.
Robert Murphy, CFA +353 1 421 0465
Co
mp
an
y R
ese
arc
h
Ryanair (RYA.I)
Ryanair (Buy - TP: €13.00)
Ireland | Travel & Leisure
Buy
Big wheel keeps on turning
€10.1 €13.00
We reinitiate coverage with a Buy recommendation and TP of €13.00. Ryanair’s
recent transformation should drive higher load factor (LF), reduce unit costs,
facilitate price leadership and drive share gains. A virtuous circle has been set
in motion and momentum is building. The arrival of the MAX in FY20 will
further reinforce a best in class unit cost platform. Valuation is undemanding
relative to recent history, trading at 14.4x FY16E P/E and 8.7x FY16E Adj
EV/EBITDAR. Our returns based DCF TP of €13.00 implies a TSR of 32%.
Robert Murphy +353 1 421 0465
Virtuous circle of unit costs: We see an industry increasingly characterised
by a more homogeneous product offering. Against this backdrop, we view the
industry price leader in pole position to take sizeable market share. Ryanair’s
enhanced product offering should drive LF higher, reduce unit costs, facilitate
price leadership and drive market share gains. We are 5% above consensus for
FY16E net profit and 5m ahead of long term passenger guidance.
Enter the MAX: We see the arrival of the MAX creating a unit cost tailwind.
Increased fuel efficiency, greater seat density and reduced operating costs of
18% per seat underscore the most competitive cost platform in the industry.
Moreover, we see the potential for Ryanair to generate substantial profit – PV of
€0.37/share, from the sale of aircraft as part of its fleet rollover programme.
Fortress Stansted (STN): Anchored by STN we see good airport deals laying
the groundwork for future primary expansion. We also believe STN could be
developed as a hub, driving circa. 1m additional passengers and incremental
profit of €40m per annum.
Step up in ROCE: We forecast lease adjusted ROCE increasing from 23.6% in
FY15E to 30.8% in FY24E, driven primarily by greater LF and improved
revenue per aircraft. Ryanair trades at 14.4x FY16E P/E and 8.7x FY16E Adj
EV/EBITDAR, inexpensive against recent history. Our returns based DCF target
price of €13.00 implies a TSR of 32% driving our Buy recommendation.
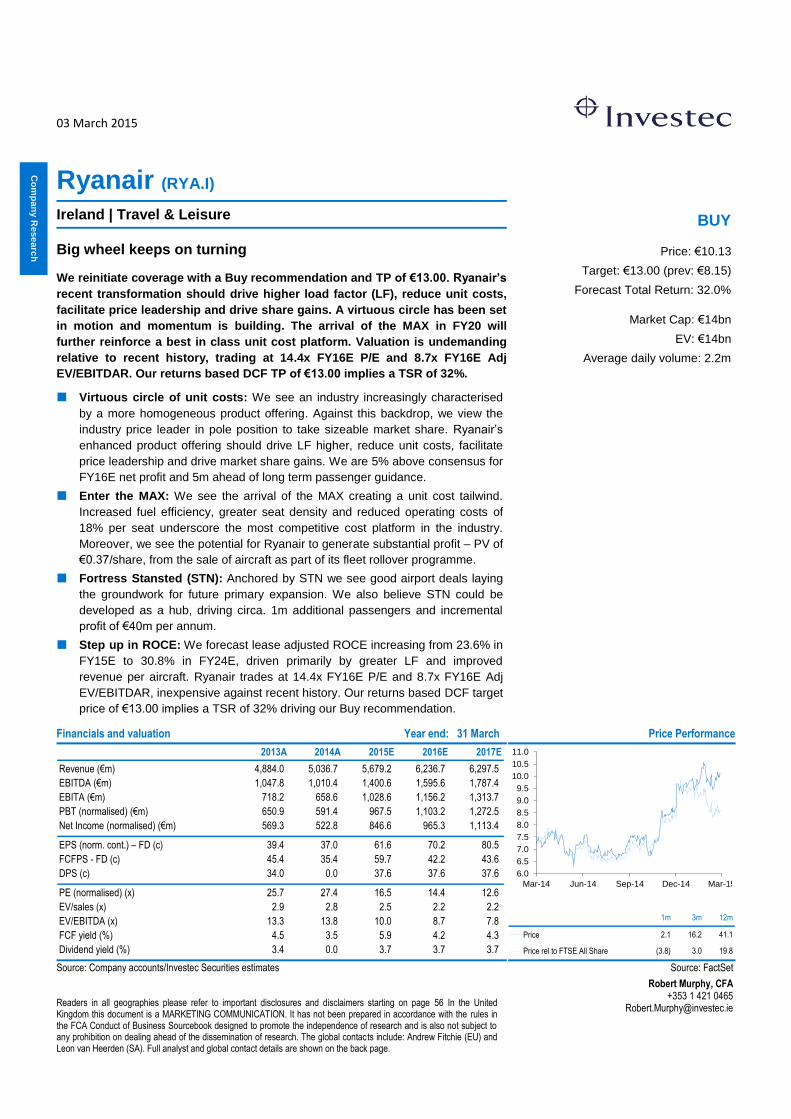
Financials and valuation Year end: 31 March Price Performance
Source: Company accounts/Investec Securities estimates Source: FactSet
BUY
Price: €10.13
Target: €13.00 (prev: €8.15)
Forecast Total Return: 32.0%
Market Cap: €14bn
EV: €14bn
Average daily volume: 2.2m
2013A 2014A 2015E 2016E 2017E
Revenue (€m) 4,884.0 5,036.7 5,679.2 6,236.7 6,297.5
EBITDA (€m) 1,047.8 1,010.4 1,400.6 1,595.6 1,787.4
EBITA (€m) 718.2 658.6 1,028.6 1,156.2 1,313.7
PBT (normalised) (€m) 650.9 591.4 967.5 1,103.2 1,272.5
Net Income (normalised) (€m) 569.3 522.8 846.6 965.3 1,113.4
EPS (norm. cont.) – FD (c) 39.4 37.0 61.6 70.2 80.5
FCFPS - FD (c) 45.4 35.4 59.7 42.2 43.6
DPS (c) 34.0 0.0 37.6 37.6 37.6
PE (normalised) (x) 25.7 27.4 16.5 14.4 12.6
EV/sales (x) 2.9 2.8 2.5 2.2 2.2
EV/EBITDA (x) 13.3 13.8 10.0 8.7 7.8
FCF yield (%) 4.5 3.5 5.9 4.2 4.3
Dividend yield (%) 3.4 0.0 3.7 3.7 3.7
6.0
6.5
7.0
7.5
8.0
8.5
9.0
9.5
10.0
10.5
11.0
Mar-14 Jun-14 Sep-14 Dec-14 Mar-15
1m 3m 12m
____________________________Price 2.1 16.2 41.1
____________________________Price rel to FTSE All Share (3.8) 3.0 19.8

Page 2 | 03 March 2015| Ryanair
Ryanair at a glance Figure 1: Sales by region FY14 Figure 2: Network seat capacity by country, February 2015
Source: Company reports Source: Innovata
Figure 3: 12 month LF step change narrows the gap vs peers Figure 4: EBIT per passenger to eclipse pre-crisis levels, €
Source: Company reports Source: Company reports, Investec Securities Estimates
Figure 5: Step up in ROCE Figure 6: Higher quality revenue generation
Source: Investec Securities estimates Source: Investec Securities estimates
Ireland, 11%
United Kingdom,
25%
Other European countries,
65%
Italy22.9%
UK19.5%
Spain14.8%
Ireland7.8%
Poland4.8%
France4.7%
Germany4.6%
Belgium4.3%
Portugal3.4%
Greece2.8%
0%
2%
4%
6%
8%
10%
12%
14%
16%
0%
1%
2%
3%
4%
5%
6%
7%
8% RYA EZJ EZJ vs. RYA (RHS)
0.0
2.0
4.0
6.0
8.0
10.0
12.0
14.0
16.0
2004
A
2005
A
2006
A
2007
A
2008
A
2009
A
2010
A
2011
A
2012
A
2013
A
2014
A
2015
E
2016
E
2017
E
2018
E
2019
E
2020
E
2021
E
2022
E
2023
E
2024
E
0%
5%
10%
15%
20%
25%
30%
35% Lease adj ROCE Historical Average
€0
€2
€4
€6
€8
€10
€12
€14
€16
€18
€20
-10%
-5%
0%
5%
10%
15%
20%
25% NOPAT / % of sales (LHS) Sales / Aircraft €m (RHS)

Page 3 | 03 March 2015| Ryanair
Ryanair investment thesis
Move to the centre plays to RYA’s strengths
The fundamentals underlying the intra-European commercial passenger market are
undergoing significant structural change. The low cost carrier (LCC) platform is
evolving with both an improved product offering and service level perception. In
parallel, competitive pressure has resulted in product unbundling by legacy carriers.
We see the end result as an increasingly homogenised marketplace. With less
product differentiation, we believe the price leader stands to take significant share.
The opportunity space is large with too many operators in Europe. Step forward
Ryanair. Armed with a significant cost of production advantage, we see the carrier
as positioned to benefit substantially from the industry shift.
Figure 7: An increasingly homogenous marketplace
Source: Investec Securities estimates
New strategy and primary airports sets virtuous circle in motion
Ryanair’s enhanced product offering should drive LF higher, reduce unit costs,
facilitate price leadership and drive market share gains. A virtuous circle has been
set in motion and momentum is gaining.
Figure 8: Higher LF spin the wheel of unit costs
Source: Investec Securities estimates
At the heart of Ryanair’s transition is a move into the last bastion of European
legacy carriers - the primary airport. We estimate that the carrier already operates
BA SH
Ryanair
Finnair SH
AF/KLM SH
Easyjet
LH SH
Air Berlin
SASNorwegian
Price point
Product offering /service level
A move to the centre
A more homogeneous product offering
lends itself to the price leader
Primary airport growth to drive both
volume and LF driving lower unit costs
- Primary airports to provide a
3.2% yield uplift
- Yield upside to be reinvested in
the market in pursuit of volume
- A virtuous circle of unit costs
has begun

Page 4 | 03 March 2015| Ryanair
from half of Europe’s primary airports representing 60% of Ryanair’s current seat
capacity, a figure we see reaching 80% by FY20E. Assuming primary airports merit
an average fare uplift of €10, group average revenue per passenger could be
boosted by 3.2% - upside that we believe Ryanair will reinvest in the market for
share gain and higher LF.
Max will reinforce Ryanair’s competitive position
We estimate Ryanair’s ex-fuel unit costs per passenger to be 28% below that of its
closest rivals. From this position, we see the arrival of the MAX in FY20 providing
opportunities for Ryanair to widen the gap vs. competition. Costs stand to benefit
from an increase in seat density of 4.2%, an 18% improvement in fuel burn per seat
and importantly a potential 1.1% delta over NEO customers in terms of fuel
efficiency. Moreover, we forecast that a 6% delta in depreciation costs vs. peers will
widen the ownership cost gap. We see the potential for Ryanair to generate €519m
in profit from the sale of assets as part of its upcoming fleet rollover programme,
with a PV per share of €0.37. To cap it all off, the MAX offers incremental annual
revenue with an estimated PV/share of €0.09.
Building out fortress Stansted
Ryanair’s airport strategy, centred on Stansted, should allow the carrier to enhance
its competitive position while maintaining cost discipline. Airport charges are backed
by good deals at airfields, with an estimated 25% of network capacity locked in at
declining rates. We view existing deals driving an estimated cumulative network
wide 2% per passenger saving through FY24E, laying the groundwork for future
primary airport expansion. Industry consolidation and opportunistic deals should
further underscore unit cost performance. Furthermore, Ryanair may look to turn
Stansted into a hub, which would connect network traffic flows, driving higher
volume and LF. We think such a move could result in an initial 785k additional
passenger, 0.7pts of LF and €40m EBIT per annum.
LF to the fore
We believe that the changes at Ryanair will allow the company to drive sustainably
higher LF, while also providing greater revenue per seat potential. Traffic data
indicates that the strategy is already working with rolling 12 month LF +3pts to 86%
and Q3:15 +6.4pts to 88.4%. While consensus is bullish, we see further upside to
Ryanair’s traffic and subsequent LF performance.
Table 1: Summary Ryanair forecasts
Operational statistics 2015E 2016E 2017E 2018E 2019E 2020E 2021E 2022E 2023E 2024E
Investec passenger numbers (m) 90.3 100.6 107.0 115.2 122.4 131.3 139.8 148.2 156.4 165.0
Guided passenger numbers (m) 90.0 100.0 106.0 114.0 120.0 128.0 136.0 143.0 150.0 160.0
Delta 0.3% 0.6% 0.9% 1.1% 2.0% 2.6% 2.8% 3.7% 4.3% 3.1%
Investec capacity growth 3.9% 11.3% 6.0% 7.0% 6.0% 7.0% 6.0% 5.0% 5.0% 5.0%
Investec LF 88.3% 88.4% 88.7% 89.3% 89.5% 89.7% 90.1% 91.0% 91.4% 91.8%
Investec ex fuel unit costs 0.4% -0.7% -0.4% -0.2% -0.5% 0.7% -0.8% -0.5% -0.2% -0.3%
Source: Company presentations, Investec Securities estimates
We forecast a 10 year CAGR in volume growth of 7.3% vs. company guidance of
6.9%, driving materially higher LF and unit cost gains. We estimate annualised LF
peaking at 91.8% in FY24 vs. a FY15E LF of 88.3%, outstripping the broader
market LF growth by 1.3pp. In parallel, ex-fuel unit costs are forecast to decline by
2.9% between FY15E and FY24E, driven by higher LF and new aircraft technology.
…..We estimate that a 1% increase in LF is worth 4% in FY16E EPS.
MAX to generate a unit cost tailwind. We
see:
- 4.2% seat density improvement
- 18% fuel burn improvement
- Potential 1.1% fuel efficiency
delta vs. peers
- 6% delta in ownership costs
- Aftermarket sales offer upside
of €0.37 per share
Fortress Stansted – to anchor the network
- STN as a hub could drive 785k
passengers, 0.7pts of LF and
€40m in annual EBIT
Market share and LF gains to be
prioritised with unit costs the beneficiary
- A 1% increase in LF is worth 4%
in FY16 EPS

Page 5 | 03 March 2015| Ryanair
Leading the LCC model does not equate to low ROCE
Ryanair continues to show that the LCC model does not equate to a low return on
capital employed (ROCE). Continued execution of the group’s commercial strategy,
underscored by a sustainable unit cost position, will allow volumes and LF to drive
improved profitability. Ryanair has historically generated robust ROCE, averaging
15.5% since FY04. We forecast lease adjusted ROCE increasing from 23.6% in
FY15E to 30.8% in FY24E, driven primarily by greater LF and improved revenue per
aircraft. We outline our lease adj ROCE calculation in the appendix (p. 51). Over our
10 year forecast horizon, we expect the capital base to grow by a CAGR of 5.9%,
which should be more than offset by an EBIT CAGR of 13.3% on our forecasts.
Figure 9: Ryanair ROCE FY04A-FY24E Figure 10: More profitable revenue from the capital base
Source: Investec Securities estimates Source: Investec Securities estimates
Undemanding valuation
In our view Ryanair’s valuation is undemanding against its own history as well as
relative to that of its closest peer, Easyjet (Not Rated). On a 12 month forward price
to earnings multiple, Ryanair trades on 14.4x, a 3% premium to its 3 year average
and in line with its 10 year average. Assessed alongside Easyjet, Ryanair trades on
a relative premium of 19% versus a 3 year average premium of 18% and a 10 year
average premium of 9%.
Figure 11: Ryanair 1 year forward P/E, trading above 3 year average Figure 12: RYA relative premium to EZJ below its 3 year average
Source: Bloomberg Source: Bloomberg
TP of €13.00 implies 32% upside
We value Ryanair on a returns-driven 10 year DCF basis (page 43). Our DCF maps
an improving return outlook to a target price of €13.00, implying 28% capital upside
from current levels on a 12 month view. With the strong possibility of further capital
returns in FY16E, Ryanair shares look attractive in our view. On our forecasts
Ryanair is trading at 14.4x FY16E and 8.7x Adj EV/EBITDAR. Under new analyst
coverage, we reinitiate with a retained positive stance– BUY.
0%
5%
10%
15%
20%
25%
30%
35% Lease adj ROCE Historical Average
€0
€2
€4
€6
€8
€10
€12
€14
€16
€18
€20
-10%
-5%
0%
5%
10%
15%
20%
25% NOPAT / % of sales (LHS) Sales / Aircraft €m (RHS)
10 x
11 x
12 x
13 x
14 x
15 x
16 x
17 x
Jan-12 Jul-12 Jan-13 Jul-13 Jan-14 Jul-14 Jan-15
RYA fwd P/E 3 yr avg 10 yr avg
0%
5%
10%
15%
20%
25%
30%
35%
40%
45%
Jan-12 Jul-12 Jan-13 Jul-13 Jan-14 Jul-14 Jan-15
RYA fwd P/E premium 3 yr avg 10 yr avg

Page 6 | 03 March 2015| Ryanair
Move to the centre plays to RYA’s strengths
We believe the fundamentals underlying the intra-European commercial passenger
market are undergoing significant structural change. The Low cast carrier (LCC)
platform is evolving, with both an improved product offering and service level
perception. Legacy carriers continue their retrenchment, with service attributes
being stripped back to better align cost of production to an increasingly competitive
operating environment. We see the end result as an increasingly homogenised
marketplace. With less product differentiation, the price leader should take
significant share. The opportunity space is large with too many operators in Europe.
Step forward Ryanair. Armed with a significant cost of production advantage the
carrier is positioned to substantially benefit from the industry shift.
Figure 13: An increasingly homogenous marketplace
Source: Investec Securities estimates
LCCs pressure forcing legacy unbundling
Ryanair was arguably not the first European LCC to recognise the benefits of an
enhanced product line and brand image. Several players such as Easyjet and Wizz
Air have made product upgrades, albeit less dramatic than Ryanair. We view the
trend as now widespread across the LCC space, accelerating a move to a more
homogeneous marketplace. In parallel to the LCC product upgrades, the European
short haul P2P market has witnessed flag carriers unbundling and scaling back
premium product offerings in an attempt to reduce costs and remain competitive.
Most notably, table 2 below highlights several recent moves taken by legacy
carriers in order to better align the cost competitiveness of their short haul
operations in the face of continued LCC pressure.
Table 2: European carriers adjusting short haul operations to remain competitive
Carrier Year(s) Changes
Air France / KLM 2013-2015 P2P short haul growth through LCC arm Transavia as opposed to mainline
British Airways 2014/2015 Short haul business seat pitch reduced from 34 to 30 inches
British Airways 2013 Lowest lead in short haul fare no longer includes a checked bag
Lufthansa 2013-2015 P2P short haul transitioning to LCC arm Germanwings
Lufthansa 2014/2015 Business class seat pitch moves down from 34 to 32
Lufthansa 2014/2015 Economy seat pitch moves down to 29 from 30
Source: Company reports
BA SH
Ryanair
Finnair SH
AF/KLM SH
Easyjet
LH SH
Air Berlin
SASNorwegian
Price point
Product offering /service level
A move to the centre
A more homogeneous product offering
lends itself to the price leader
LCC competitive pressure has seen
product unbundling by legacy carriers

Page 7 | 03 March 2015| Ryanair
A crowded middle with price as the key variable
The below table provides a snapshot of the intra-European P2P short haul market-
increasingly homogeneous in its core offering, both in economy and business.
Table 3: An equivalent P2P short haul product offering
Business Class Economy Class
Carrier Allocated seating Seat Pitch (inches) Seat Pitch (inches)
Ryanair Yes 30 30
BA short haul Yes 30 30
Lufthansa short haul (Germanwings) Yes 29 29
Norwegian Yes 30 30
Easyjet Yes 29 29
Vueling Yes 30 30
Wizz Yes 30 30
Source: SeatGuru
Following the parallel moves from Ryanair, LCCs and legacy carriers, we view the
product offering as broadly equivalent. Logically, a market with less differentiation
places price to the fore. In this environment, we expect Ryanair to be even more
successful in gaining market share.
European P2P short haul now
commoditised, placing a greater
emphasis on price

Page 8 | 03 March 2015| Ryanair
Ryanair is eradicating the value perception gap In our view, a series of strategic initiatives by Ryanair - under the auspice of the
‘Always Getting Better’ program – are eradicating the value perception gap that had
existed in the marketplace. In doing so, Ryanair increases its addressable market,
places increased competitive pressure on incumbent legacy carriers and facilitates
traffic and share growth.
A move to primary airports: We estimate that the carrier already operates
from half of Europe’s primary airports and that these airports account for 60%
of Ryanair’s seat capacity. Based on the company’s growth guidance, we
forecast that this exposure will increase to 80% by FY20E. Assuming primary
airports merit an average fare uplift of €10 group average revenue per
passenger could be boosted by 3.2%, with upside reinvested in the market in
pursuit of share gain and higher LF. We see Amsterdam Schiphol (AMS),
Dusseldorf (DUS), Munich (MUC), Oslo (OSL) and Zurich (ZRH) as the logical
next steps for Ryanair expansion.
Increasing frequency and schedule quality: Ryanair continues to place
competitive pressure on peers, both LCC and legacy incumbents, through
enhancing its network with increased frequencies on core business routes. The
carrier’s most recent February schedule sees Ryanair seat capacity +13% with
the number of routes served declining by 1%. As a result, route thickness (total
seats per route) increases 14%. Ryanair’s summer 2015 schedule highlights
the continuation of this trend.
Expanded product offering: Allocated seating, fast track access, and
business products are some of the headline product improvements rolled out
by the carrier in 2014. The overhaul of legacy revenue management strategies
has resulted in a linear yield curve favouring far out booking accumulation and
supporting higher LF performance.
Brand and distribution overhaul: Beginning with its shop window -
Ryanair.com - the carrier has refreshed its product positioning. The revamped
website and increased social media interaction represent a step change in
marketing and brand awareness activities. We see further scope for the carrier
to narrow the brand perception gap through a cabin interior refit coinciding with
the arrival of 40 new aircraft in FY16.
Is the strategy working? The proof is in the LF
Brand surveys suggest this change is well received by customers with Ryanair
ranking at the top of the recent YouGov airline brand improvement survey.
Ryanair.com is now the most searched for airline website in the UK. The end
result is clearly visible, with rolling 12 month LF performance +4pp yoy and
rolling 3 month performance +8.7pp yoy.
Primary airport capacity rising from 60%
to 80% by FY20E to drive 3.2% uplift in
average revenue per passenger
LF highlights a strategy gaining
momentum:
- Rolling 12 month LF +4pp yoy
- Rolling 3 month LF +8.7pp yoy

Page 9 | 03 March 2015| Ryanair
Primary airports – growing the addressable market
The Winter 2014/2015 schedule saw Ryanair build out frequencies at Dublin (DUB),
STN and a host of other central airports. Ryanair has effectively continued its
expansion into the last bastion of European legacy carriers - the primary airport.
This trend is set to continue with 50% of summer capacity growth guided by
management for primary airports. By changing its network and frequency, Ryanair
is eradicating the value perception gap thereby creating a more homogeneous
marketplace. The endgame is to fulfil ambitious growth plans by increasing the
addressable market size. Primary airports appear attractive; they offer higher
yielding passengers, reduce seasonality of traffic flows and provide economies of
scale (marketing, support costs etc.).
Significant progress already made
We believe that Ryanair is already deep into its program of changing its network
footprint. Primary airports that have or will soon hear the arrival jingle from a
Ryanair Boeing 737 aircraft include: Athens (ATH), Brussels (BRU), Copenhagen
(CPH), Lisbon (LIS), Rome Fiumicino (FCO), as well as more central level 2 airports
such as Cologne (CGN), Glasgow Intl (GLA) and Gdansk (GDN). The carrier
already has greater than 50% coverage at primary airports, a fact that we believe is
underappreciated by the market. While much debate persists over the definition of a
primary airport, we adopt IATA’s definition of a Level 3 airport to be a primary
airport. According to the following classification:
Level 3 (Fully Coordinated Airport): Demand for the airport infrastructure
significantly exceeds the airport’s capacity. We view IATA level 3 airports as
primary airports.
Level 2 (Schedules Facilitated Airport): Demand exceeds supply only during
certain time periods. We view IATA level 2 airports as secondary airports.
Level 1 (Non-Coordinated): The capacity of the airport is sufficiently
adequate to meet demand at all times. We view IATA level 1 airports as
secondary airports.
We highlight below Ryanair’s presence at Level 3 (primary) and Level 2 airports.
Table 4: Snapshot of Ryanair’s primary airport coverage
Classification Number RYA coverage Examples
Level 3 100 50% DUB, BRU and STN
Level 2 74 42% Edinburgh (EDI), GLA, and Budapest (BUD)
Source: IATA
Wasting no time, more new routes than any other airline
No other global carrier launched more routes in 2014 than Ryanair, with 134 routes
launched - 50 more routes than its closest peer, Germanwings. Germanwings - the
LCC subsidiary of Deutsche Lufthansa - can attribute the majority of its 2014 route
launches to the legacy parent retrenching from intra-European point to point (P2P)
flying. This legacy retrenchment echoes the move to the centre and a more
homogeneous product environment.
50% of summer2015 capacity growth is
guided for Primary Airports
Supply and demand imbalances highlight
primary airports

Page 10 | 03 March 2015| Ryanair
Figure 14: Top airline for new route launches in 2014
Source: Anna Aero
What is left on the table?
Management has recently stated that Charles De Gaulle (CDG) and Frankfurt Main
(FRA), both Level 3 primary airports, are off the table for future Ryanair operations.
We see 48 Level 3 airports in contention and highlight below the primary European
airports, with both the greatest passenger throughput and Ryanair operations in
2014.
Table 5: Current and potential primary airports for Ryanair
Current primary airports Ryanair operate from Potential primary airports Ryanair could move to
Airport IATA Code 2014 Passenger volume (m) yoy growth Airport IATA Code 2014 Passenger volume (m) yoy growth
Madrid MAD 41.8 5.3% Heathrow LHR 73.3 1.4%
Gatwick LGW 38.1 7.4% Amsterdam AMS 55.0 4.6%
Rome Fiumicino FCO 38.0 5.1% Munich MUC 40.0 3.5%
Barcelona BCN 37.6 6.7% Paris Orly ORY 28.9 2.1%
Copenhagen CPH 25.6 6.5% Zurich ZRH 25.4 2.5%
Palma Majorca PMI 23.1 1.5% Oslo OSL 24.3 4.8%
Brussels BRU 22.0 15.2% Stockholm Arlanda ARN 22.5 8.9%
Dublin DUB 21.7 7.7% Vienna VIE 22.5 2.3%
Stansted STN 19.9 11.6% Dusseldorf DUS 22.0 3.6%
Lisbon LIS 17.9 11.9% Berlin Tegel TXL 20.8 6.4%
Malaga AGP 13.7 6.4% Helsinki HEL 15.9 4.4%
Source: Anna Aero, IATA
Where next for Ryanair?
We see the logical next steps for Ryanair in its primary airport build out as AMS,
DUS, MUC, ZRH and OSL. We also view a partial move from Paris Beauvais
(BVA) to Paris Orly (ORY) as a reasonable step for the carrier. However ORY - a
level 3 airport - is highly slot constrained, with existing operators such as Easyjet
reportedly waiting in the wings should slots materialise. Finally, LHR remains in
play as management has stated that it “would look at LHR if slots became
available, however a 25 min turnaround would be hard”.
28
28
28
29
33
33
36
41
43
46
50
58
68
80
83
84
134
0 20 40 60 80 100 120 140
Germania
Jetairfly
Volaris
Meridiana
Aegean
Delta
Flybe
United
Norwegian
SAS
Wizz Air
Southwest
Frontier
Vueling
Easyjet
Germanwings
Ryanair
2014 Route launches
Several key primary airports in the mix for
future expansion
With the exception of CDG and FRA, all
Primary airports are in play. We see AMS,
MUC, ZRH, and OSL as the next steps.

Page 11 | 03 March 2015| Ryanair
Table 6: Recent commentary on primary airport growth
Market(s) Airport Recent Announcements
The Netherlands, Ireland, UK & Europe AMS Ryanair intends to increase its Dutch market share, estimated at 4%. Signalling future operations at AMS linking both DUB and STN builds out the primary airport footprint. A new secondary airport leisure base at
Leystadt (LEY) has been flagged and we believe this compliments existing Eindhoven operations.
Italy FCO Ryanair grows Italian presence at Rome FCO with destinations doubling from 5 to 10 for Summer 2015. In
contrast Vueling are reducing domestic Italian services and increasing its international FCO operations.
Belgium & Ireland BRU Ryanair indicates that they have secured ca. 50% market share on the key primary airport business route
within 3 months of the inaugural service
UK LHR Ryanair indicates that it would look at London Heathrow (LHR) slots should they become available. The
carrier states that it would not however conform to its 25 minute turn business model.
Source: Company presentations
Primary airports yield uplift - a snapshot
Primary airports are characterised by passengers with a lower price elasticity of
demand, a higher proportion of business travellers, less seasonality in the traffic
flows and ultimately a passenger mix that has a higher propensity to book later in
the booking cycle.
In table 7 below, we highlight average fares and yield per passenger kilometre on
two intra-European P2P routes from London. While a health warning should be
placed on the below example, the findings highlight that even in an increasingly
homogenised market, passengers are willing to pay a €60 premium to fly from LHR
and LCY compared to STN. We see the continued move by Ryanair to primary
airports providing yield uplift for the carrier, which will be reinvested in the market as
the airline pursues its market share ambitions.
Table 7: Yield analysis from London metro area to Amsterdam (AMS) and Geneva (GVA)
London airport
AMS GVA
Code Fare Yield Fare Yield
London Heathrow LHR €108.80 €0.30 €149.60 €0.20
London Gatwick LGW €64.80 €0.18 €61.60 €0.09
London Stansted STN €42.40 €0.14 €53.60 €0.07
London Luton LTN €43.20 €0.12 €56.00 €0.07
London City LCY €104.80 €0.30 €155.20 €0.21
Source: IATA
While primary airports will bring obvious
yield uplift, we view near term gains as
being reinvested in the market

Page 12 | 03 March 2015| Ryanair
Increased frequencies backfill an already strong network
Ryanair continues to place competitive pressure on peers through enhancing its
network with increased frequencies on core business routes. The carrier’s February
2015 schedule sees its seat capacity rising +13% with the number of routes served
declining -1%. As a result route thickness (total seats per route) increases +14%.
Table 8: Ryanair winter frequency build out
Winter 13/14 Winter 14/15 Variance
Seat capacity 5,719,896 6,451,326 13%
Routes 1,649 1,635 -1%
Thickness 3,469 3,946 14%
Source: Innovata
Ryanair’s summer 2015 schedule highlights the build out of frequency at primary
airports. Figure 9 below highlights the airports benefitting from a flexing of frequency
with weekly departures driving a 6.2% increase in seat capacity for the summer
2015 season.
Figure 15: Increase in weekly departures on Ryanair’s network, August’15 vs. August’14
Source: Anna Aero
24
24
25
28
38
39
44
54
58
58
63
65
75
99
127
0 20 40 60 80 100 120 140
Porto (OPO)
Berlin (SXF)
Edinburgh (EDI)
Copenhagen (CPH)
Barcelona (BCN)
Milan (BGY)
Colgone (CGN)
Glasgow (GLA)
Lisbon (LIS)
Warsaw (WMI)
Rome (FCO)
Dublin (DUB)
Athens (ATH)
Madrid (MAD)
London (STN)
Route thickness increased 13% in winter
14/15 and summer schedules indicate
further build out.

Page 13 | 03 March 2015| Ryanair
Legacy carrier P2P operations at primary airports under pressure
With an increased primary airport mix and a thickening of route frequencies
Ryanair’s competitive presence on traditional primary P2P routes is growing.
Utilising its cost of production advantage, the carrier can ‘price for growth’. The fare
gap between LCC and legacy airlines is evident on traditional routes linking two
primary airports, for example Rome and Brussels. Here we see Ryanair 75% and
82% cheaper on leisure and corporate fares respectively.
Table 9: Rome Fiumicino (FCO) to Brussels Zaventum (BRU) market
Ryanair
Vueling
Depart Arrive Depart Arrive
Depart Arrive Depart Arrive
07:35 09:50 10:15 12:20
08:00 10:15 10:50 12:50
18:30 20:50 15:40 17:55
18:05 20:20 21:00 23:00
Lead in fare €98.98
Lead in €87.00
Business Plus €199.98
Excellence Fare €309.98
Alitalia
Brussels Airlines
08:20 10:35 11:25 13:30
06:30 08:40 07:50 09:50
15:00 17:15 18:15 20:20
10:30 12:40 15:05 17:10
17:55 20:00 20:40 22:40
Lead in €399.72
Lead in €338.72
Business Basic €1,085.72
Flex & Fast €498.72
Source: Airline direct websites. Date of travel 26/2/2015. Date of capture 27/1/2015
Fare structure gap is striking on a key
European P2P city pair

Page 14 | 03 March 2015| Ryanair
Expanded product line, enhanced brand
Under the auspice of the ‘Always Getting Better’ program, Ryanair has also rolled
out a series of radical improvements to eradicate the product differentiation gap in
the intra-European short haul market. By refreshing its brand and expanding its
product portfolio, the carrier is seeking to increase its addressable market by
appealing to a wider consumer base. We see the end result as an airline that no
longer pushes away subsets of the corporate and leisure market. Early indications
in both brand perception and LF performance indicate the strategy is working.
Figure 16:Ryanair ‘Always Getting Better’
Source: Company presentation
Scope to narrow the gap further, an accelerated cabin refresh
The above chart summarises product enhancements already announced by
Ryanair. We see potential for further improvements. For example, we see scope for
a cabin refresh to begin in Q116, some 16 quarters earlier than guided by
management. The Boeing Sky Interior concept, highlighted in Fig.10 below, is
currently scheduled to form part of Ryanair’s MAX200 delivery with the first aircraft
scheduled for arrival in FY20. Our view is that management will look for an
accelerated roll out of the upgraded cabin appearance as part of their 3 year
‘Always Getting Better’ program. By doing so Ryanair could further narrow the
product perception gap currently present in the European marketplace thereby
growing its addressable market potential.
Figure 17: Current Ryanair cabin interior Figure 18: Future Ryanair sky interior cabin
Source: SeatGuru Source: Boeing
Brand refresh and expanded product line
targets a larger traffic base
Digital improvements drive conversion
factors, traffic volumes and LF
Page 15 | 03 March 2015| Ryanair
Broadening distribution reach
Historically distributing 100% of its tickets via the direct channel, Ryanair.com, the
company maintained complete control over its fares while keeping costs of
distribution to a minimum. In March 2014 Ryanair moved away from this model by
providing its fares and related products through the global distribution system (GDS)
Travelport. The GDS market is the traditional market for distribution of airline tickets
and one in which travel agents and corporate booking portals still conduct the bulk
of their business. Ryanair has incorporated the GDS channel to both increase its
addressable market and to facilitate share gains in the corporate traveller space.
With deals inked with Amadeus, Travelport and Sabre, the airline now has 100%
visibility across the GDS platform.
Changing the booking curve
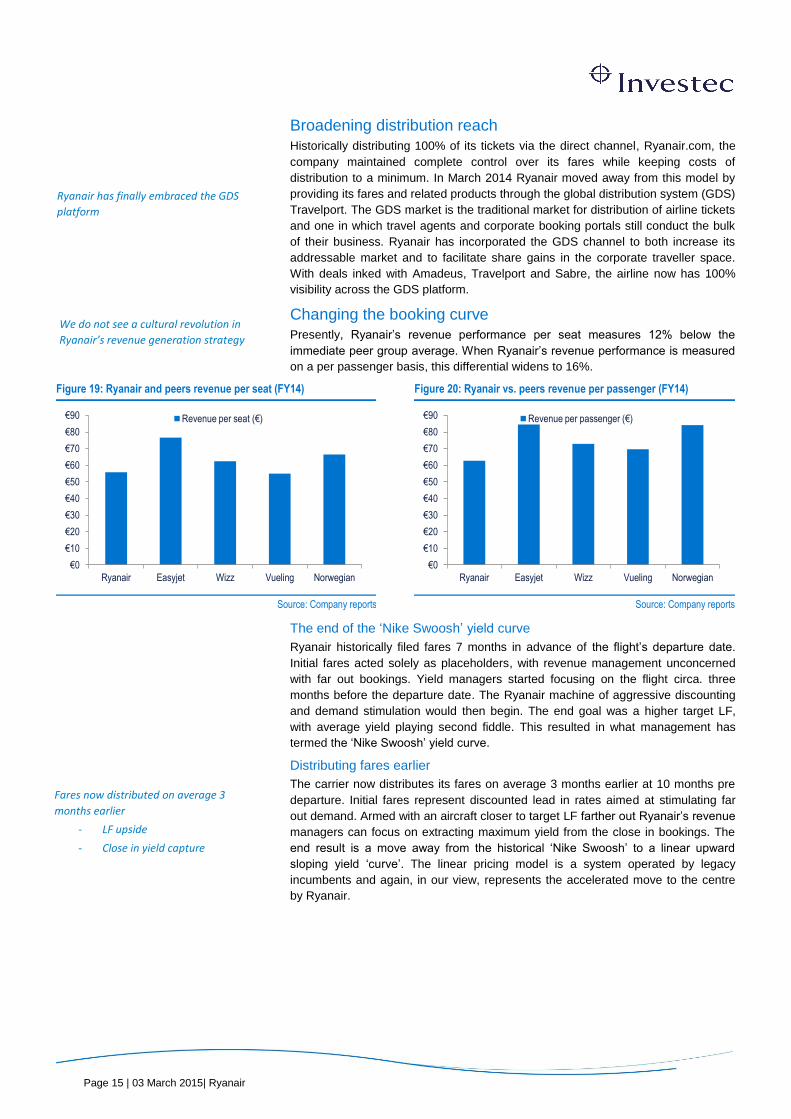
Presently, Ryanair’s revenue performance per seat measures 12% below the
immediate peer group average. When Ryanair’s revenue performance is measured
on a per passenger basis, this differential widens to 16%.
Figure 19: Ryanair and peers revenue per seat (FY14) Figure 20: Ryanair vs. peers revenue per passenger (FY14)
Source: Company reports Source: Company reports
The end of the ‘Nike Swoosh’ yield curve
Ryanair historically filed fares 7 months in advance of the flight’s departure date.
Initial fares acted solely as placeholders, with revenue management unconcerned
with far out bookings. Yield managers started focusing on the flight circa. three
months before the departure date. The Ryanair machine of aggressive discounting
and demand stimulation would then begin. The end goal was a higher target LF,
with average yield playing second fiddle. This resulted in what management has
termed the ‘Nike Swoosh’ yield curve.
Distributing fares earlier
The carrier now distributes its fares on average 3 months earlier at 10 months pre
departure. Initial fares represent discounted lead in rates aimed at stimulating far
out demand. Armed with an aircraft closer to target LF farther out Ryanair’s revenue
managers can focus on extracting maximum yield from the close in bookings. The
end result is a move away from the historical ‘Nike Swoosh’ to a linear upward
sloping yield ‘curve’. The linear pricing model is a system operated by legacy
incumbents and again, in our view, represents the accelerated move to the centre
by Ryanair.
€0
€10
€20
€30
€40
€50
€60
€70
€80
€90
Ryanair Easyjet Wizz Vueling Norwegian
Revenue per seat (€)
€0
€10
€20
€30
€40
€50
€60
€70
€80
€90
Ryanair Easyjet Wizz Vueling Norwegian
Revenue per passenger (€)
Ryanair has finally embraced the GDS
platform
We do not see a cultural revolution in
Ryanair’s revenue generation strategy
Fares now distributed on average 3
months earlier
- LF upside
- Close in yield capture

Page 16 | 03 March 2015| Ryanair
Figure 21: Reshaping the yield curve (illustrative)
Source: Investec Securities estimates
Incorporating modular product offering
The introduction of a modular product offering allows Ryanair to maintain its
industry leading fares, preserve its linear pricing model and increase the size of its
target market through the introduction of Business Plus, Family Extra and allocated
seating.
By allowing passengers to customise their travel experience Ryanair’s revenue
managers are effectively price discriminating a linear curve, increasing yield capture
and most importantly facilitating higher LF. We see LF moving to the fore as a result
of: 1) fares distributed earlier allowing for a longer booking window, 2) a linear
pricing curve favouring LF capture and 3) an expanded product portfolio increasing
the addressable market size.
Figure 22: Modular product offering
Source: Investec Securities estimates
10 9 8 7 6 5 4 3 2 1
Linear Pricing Model Historic Nike Swoosh
Months pre departure
Extended distribution period
Business Plus/ Fast Track
Allocated Seating
Baggage
Air Ticket
Linear pricing model resembles that of
legacy competition highlighting the
‘move to the centre’
Modular product offering protects lead in
airfare and allows product customisation

Page 17 | 03 March 2015| Ryanair
Is Ryanair’s brand strategy working?
Early indications suggest that Ryanair’s brand strategy is starting to work. Public
perception in the UK indicates that Ryanair’s brand improvement is outpacing that
of its airline industry peers. The change in brand perception results in table 10
below are based on the YouGov Brand Index Buzz Tracker survey which asks
respondents, “If you’ve heard anything about the brand in the last two weeks was it
positive or negative? Ryanair’s brand perception improved by a measure of 5 index
points between Jan-Jun 2014.
Table 10: Change in brand perception, (Jan–Jun’14 vs. Jan-Jun’13)
Rank Brand Improvement Jan-Jun'14 Score Jan-Jun'13 Score
1 Ryanair 5.0 -15.4 -20.4
2 Easyjet 3.9 2.8 -1.1
3 British Airways 2.8 8.9 6.2
4 Flybe 1.5 0.8 -0.7
5 Jet2.com 1.0 0. 1.1
Source: CAPA
Brand perception gaining momentum
In a broader contect, the Ryanair brand improvement is gaining traction, with an
improvement of 10.6 index points at the time of the FY14 results (Table 11).
Table 11: FY:14 Change in brand perception, YouGov Brand Index Buzz Tracker (2014-2013)
Rank Brand Improvement
1 Lidl 11.6
2 Ryanair 10.6
3 Aldi 10.0
4 Findus 9.8
5 HMV 7.5
Source: Company presentation
Increased addressable market driving higher LF
Ryanair’s UK website visit ranking has been transformed moving from 3rd
to 1st, on
Hitwise data, further evidence that the brand transformation is gaining traction.
Importantly, Ryanair’s efforts are translating into a clear pick up in passenger
volumes and LF since its recent transformation.
Figure 23:UK’s most searched airline websites Dec13-Sep14 Figure 24: Ryanair LF Performance (% change)
Source: Company presentation Source: Company reports
-6%
-4%
-2%
0%
2%
4%
6%
8%
10%
12%
14%
0%
1%
2%
3%
4%
5%
6%
7%
8% Load Factor (LHS) Capacity (RHS)
Brand Depth: Ryanair value change
starting to resonate with the public.
LF transformation
- Rolling 12 month LF + 4pp yoy
- Rolling 3 month LF +8.7pp yoy

Page 18 | 03 March 2015| Ryanair
New strategy sets virtuous circle in motion
Ryanair growth was historically perpetuated on the basis of its lowest cost base,
permitting it to discount fares aggressively and stimulate demand to secondary
airports that European consumers would previously have not considered.
Figure 25: Unit costs per passenger, € (FY14) Figure 26: Ex fuel unit costs per passenger, € (FY14)
Source: Company reports Source: Company reports
Contrary to popular belief, we do not now see a cultural revolution underway at the
carrier. Ryanair is playing to its strengths as the lowest unit cost producer in an
increasingly homogeneous market (P2P intra-European air travel) allowing it a price
advantage over legacy and LCC carriers alike (average fares estimated at 26%
below that of closest peer, Easyjet). Ryanair can push its unit costs down even
farther, reinforcing its structural advantage, by driving increased traffic and higher
LF. Armed with a reinforced cost position, the carrier is positioned to ‘price for
growth’. We see this as a ‘virtuous circle’ of unit costs.
Figure 27: Ryanair’s virtuous circle of unit costs
Source: Investec Securities estimates
0
10
20
30
40
50
60
70
80
Ryanair Wizz Easyjet Vueling
0
10
20
30
40
50
60
Ryanair Wizz Easyjet Vueling
Ex fuel unit cost per passenger 28% below
that of rivals
Higher LF and passenger growth spins the
wheel of unit costs

Page 19 | 03 March 2015| Ryanair
Higher LF
We believe that the changes at Ryanair will allow the company to drive sustainably
higher LF while also providing greater revenue per seat potential.
Figure 28: Ryanair LF Progression Figure 29: Industry LF Performance Snapshot (%)
Source: Company reports Source: Innovata
Fig 29 above shows a Ryanair lagging peer improvements over recent years before
a change in strategic direction transformed LF performance. Traffic data indicates
that the strategy is already working with rolling 12 month LF+3pts to 86% and Q3:15
+6.4pts to 88.4%. While consensus is bullish, we see further upside to Ryanair’s
traffic and subsequent LF performance. Fig. 30 below shows Ryanair closing the
monthly LF performance gap vs. Easyjet at an impressive rate. With momentum
behind Ryanair and a comercial department favouring LF over yield. We see asset
utilisation levels eclipsing that of Easyjet. We forecast annualised LF peaking at
91.8%, outstripping broad market LF growth by almost 3pp.
Figure 30: RYA and EZJ year on year LF performance (LHS) and monthly LF spread (RHS)
Source: Company reports
Raising the bar on traffic
Ryanair is on course to achieve 10.5% passenger growth in FY15 and the carrier
has guided to passenger growth of between 5% and 11% per annum out through
FY24. This clear growth strategy will see passengers carried move from 81.7m in
FY14 to a company guided 160m in FY24. Fig. 31 below outlines company guided
traffic against implied seat capacity growth from the fleet delivery pipeline. We
believe that with seat capacity in its arsenal the company is well poised to raise the
bar on traffic forecast.
60%
65%
70%
75%
80%
85%
90%
95%
20
03
20
03
20
04
20
04
20
05
20
05
20
06
20
07
20
07
20
08
20
08
20
09
20
10
20
10
20
11
20
11
20
12
20
12
20
13
20
14
20
14
Ryanair Monthly Load Factor
70%
75%
80%
85%
90%
2006 07 08 09 10 11 12 13 2014
Ryanair
Easyjet
Wizz Air
Vueling
BA
Norwegian
Transavia
LF
0%
2%
4%
6%
8%
10%
12%
14%
16%
0%
1%
2%
3%
4%
5%
6%
7%
8% RYA EZJ EZJ vs. RYA (RHS)
Fuller, more profitable planes operating
on Ryanair’s growing network
Closing the gap on the league leaders of
LF in just 12 months

Page 20 | 03 March 2015| Ryanair
Figure 31: Guided passenger growth vs. aircraft delivery implied seat growth
Source: Company presentations
We estimate a 10 year CAGR of 5.3% in terms of seat capacity growth based on
the fleet evolution profile out through FY24. We believe that not only will Ryanair fill
its additional capacity, but that it will outstrip capacity growth with traffic growth.
Table 9: Fleet evolution highlights capacity outlook
Fleet development 2015E 2016E 2017E 2018E 2019E 2020E 2021E 2022E 2023E 2024E
Beginning Fleet 300 308 342 370 402 420 474 483 497 512
737NG Deliveries 11 40 50 50 29 0 0 0 0 0
MAX 200 Deliveries 0 0 0 0 0 62 34 42 40 22
737NG Exits (3) (6) (22) (18) (11) (8) (25) (28) (25) (14)
Ending Fleet 308 342 370 402 420 474 483 497 512 520
Additional seat capacity (millions)
737NG 2.5 10.6 8.7 9.9 5.6 (2.5) (7.8) (8.7) (7.8) (4.3)
MAX200 0.0 0.0 0.0 0.0 0.0 20.1 11.0 13.6 12.9 7.1
Net seat change 2.5 10.6 8.7 9.9 5.6 17.6 3.2 4.9 5.2 2.8
Total network seats 102.3 112.9 121.5 131.5 137.1 154.6 157.9 162.8 168.0 170.7
% change in seats
10.3% 7.7% 8.2% 4.2% 12.8% 2.1% 3.1% 3.2% 1.7%
% change in fleet units
11.0% 8.2% 8.6% 4.5% 12.9% 1.9% 2.9% 3.0% 1.6%
Source: Investec Securities estimates
Unit costs to benefit from higher traffic and LF
With renewed emphasis on traffic, share growth and increased seat occupancy, we
see higher LF performance driving yet lower unit costs per seat. Flexing our LF
assumptions drives healthy drop-through margins. We estimate that for every 1%
increase in LF, unit costs decrease by 0.8%. All else being equal, as a result of a
1% increase in our FY16E LF assumption, EPS receives a 4% uplift.
0%
2%
4%
6%
8%
10%
12%
14%
0%
2%
4%
6%
8%
10%
12%
14%
2015E 2016E 2017E 2018E 2019E 2020E 2012E 2022E 2023E 2024E
Guided passenger growth Implied seat capacity growth
Passenger and capacity growth
underscored by fleet evolution
A 1% increase in LF results in a 4%
increase in FY16E EPS.

Page 21 | 03 March 2015| Ryanair
Greater market share, a fragmented market ripe for consolidation
While questions have been raised on how Ryanair will deliver passenger growth
amounting to a 10year CAGR of 5.9%, we believe there remains a significant
opportunity for Ryanair to grab market share in Europe. The European commercial
aviation market is fragmented with a total of 34 carriers holding 80% of intra-
European seat capacity. In contrast, the domestic U.S. market currently has 4
carriers providing 80% of seat domestic capacity. We see both an aggregation of
capacity providers and suppliers exiting the market as a result of increased and
prolonged competitive pressure.
Supply and demand dynamics in equilibrium
Against a backdrop of 3% forecast average annual growth in regional European
economic activity over the next 10 years (according to the IMF), we expect
passenger traffic to increase by 3.5% per annum as measured by revenue
passenger kilometres (RPKs) and based on Airbus’ Global Market Forecast. Such
passenger growth is equivalent to a 1.2x GDP multiple, reflective of a relatively
mature industry underpinned by an improving macroeconomic environment.
Meanwhile, we forecast capacity increasing by 3.2% annually, marginally outpaced
by demand. As a result we forecast industry wide load factor increasing modestly
over our forecast period by circa 25bps per annum from 80.8% to 83.0%.
Figure 32: Long run rational capacity allocation observable in European short haul market
Source: IATA
Figure 32 above highlights a European marketplace exhibiting rational capacity
deployment over the last 10 years. We expect net intra-European seat capacity
growth to remain relatively benign, with continued retrenchment of legacy carriers
from non-hub P2P flying and carriers exiting the industry counter balancing the LCC
capacity coming on-stream.
The evolution of LCC capacity in Europe
LCC share growth dynamics are well embedded in the intra-European market. Over
the past decade, LCC capacity growth has averaged 14% per annum. In contrast,
the legacy carrier model has produced average capacity growth rates of 1% per
annum Figure 33 below depicts the growth of the broader LCC and hybrid LCC
capacity share growth in the European market.
-15%
-10%
-5%
0%
5%
10%
15%
20%
25%
30%
35%
Jan-04 Jan-06 Jan-08 Jan-10 Jan-12 Jan-14
Passenger Demand (RPKs) Capacity (ASKs)
80% of seat capacity delivery:
Domestic US: 4 carriers
Intra-Europe: 34 carriers
European passenger capacity deployment
has followed a rational path over the last
10 years

Page 22 | 03 March 2015| Ryanair
Figure 33: The evolution of the broader LCC movement in the European market
Source: CAPA
Ryanair to lead LCC share gains
Ryanair has already taken sizeable market share, with a 10 year CAGR in
passenger growth of 13%. We estimate that Ryanair commands 14% total market
share, a figure that we see rising to 25% by 2024. We see the LCC space leading
European market consolidation, with Ryanair as best positioned to lead the charge
supported by its fleet order book.
Order books highlight the growth trajectory in Europe
The individual order books of both LCC and legacy carriers, alongside assumed
retirement profiles for the European commercial fleet, support our share thesis. Our
analysis highlights a European capacity environment adding 3% CAGR of
incremental seat capacity between 2014 and 2024, with Ryanair, Easyjet,
Norwegian Air and Wizz Air together accounting for between 47-66% of annual seat
capacity deployment in any given year.
Figure 36: LCC share of intra-European capacity growth
Source: Ascend, Investec Securities estimates
Delivery / Retirement profiles highlight a changing hierarchy
Based on current order books and aircraft retirement profiles, we estimate that
Ryanair’s share of seat capacity will increase by c.4pp by 2019 in an intra-European
context, equating to 30m additional passengers. We view this as a relatively
conservative assumption, exiting Ryanair jets at c.15 years to maintain an average
fleet age profile of c.6 years, Easyjet aircraft at 15 years and the remaining
European peer base at an average age of 21 years.
5%
8%
14%
18%
21%
24%
29%
31% 32%
35% 36%38%
0%
5%
10%
15%
20%
25%
30%
35%
40%
2001 2002 2003 2004 2005 2006 2007 2008 2009 2010 2011 2012
0%
1%
2%
3%
4%
5%
6%
40%
45%
50%
55%
60%
65%
70% LCC share of capacity growth (LHS) European capacity growth (RHS)
We estimate Ryanair market share could
reach 25% by 2024
LCCs to account for 47%-66% of annual
seat capacity deployment in any given
year

Page 23 | 03 March 2015| Ryanair
Table 13: European seat forecast to 2019, assuming fleet retirements and new orders
Carrier 2014 closing fleet 2015 2016 2017 2018 2019
Ryanair 57,078 63,693 72,387 82,026 87,129 90,100
Easyjet 37,056 39,936 43,176 49,296 55,236 57,876
Norwegian 17,035 18,003 21,141 26,643 30,187 32,115
Wizz 9,900 14,220 17,900 21,200 21,020 21,020
IAG 47,577 46,182 47,982 50,202 53,865 57,333
Lufthansa Passenger Group 63,187 54,976 56,714 57,273 56,275 56,175
Air France / KLM Group 45,803 44,734 43,840 42,408 42,118 41,279
Other 247,111 255,871 239,067 242,028 247,704 256,798
Total Europe 524,747 537,615 542,207 571,076 593,534 612,696
Source: Ascend, Investec Securities estimates
Table 14: Relative % size of fleet seat capacity assuming fleet retirements and new orders
Carrier 2014 closing fleet 2015 2016 2017 2018 2019
Ryanair 10.9% 11.8% 13.4% 14.4% 14.7% 14.7%
Easyjet 7.1% 7.4% 8.0% 8.6% 9.3% 9.4%
Norwegian 3.2% 3.3% 3.9% 4.7% 5.1% 5.2%
Wizz 1.9% 2.6% 3.3% 3.7% 3.5% 3.4%
IAG 9.1% 8.6% 8.8% 8.8% 9.1% 9.4%
Lufthansa Passenger Group 12.0% 10.2% 10.5% 10.0% 9.5% 9.2%
Air France / KLM Group 8.7% 8.3% 8.1% 7.4% 7.1% 6.7%
Other 47.1% 47.6% 44.1% 42.4% 41.7% 41.9%
Total Europe 100% 100% 100% 100% 100% 100%
Source: Ascend, Investec Securities estimates
Share gains should remain on track
No company is immune to periodic economic down-cycles, Ryanair included.
Potential macroeconomic shocks and irrational competitor activity, while disruptive,
should not derail our investment thesis. A high degree of operational flexibility and a
best in class unit cost platform provide protection in downturns, allowing the
company to continue its pursuit of volume growth and aggregation of intra-European
P2P market share.
High degree of operational flexibility: Ryanair has a high degree of
operational flexibility in its business model, enabling it to scale back production
and variable costs in the event of an economic downturn. In FY12 the carrier
grounded 30% of its fleet as a result of a weak economic backdrop and high
fuel prices. During that year, net profit increased 50% yoy with lease adjusted
ROCE + 1.5% yoy.
Lowest average fares: Operating from an industry leading cost position
allows the carrier to charge the lowest average fares in the European sector
(estimated at 26% below that of peers – see Figure 37 below) while continuing
to generate economic returns. As a result, we see any potential destabilisation
from lower industry yields as short term, with the long term sustainability of
discounting by peers unviable.
Ryanair’s fleet to become the largest
provider of intra-Euro seat capacity
Ryanair’s business model has been ‘stress
tested’ for macroeconomic downturns

Page 24 | 03 March 2015| Ryanair
Figure 37: Ryanair average fare 26% below that of its closest peer
Source: Company reports, Investec Securities estimates
Ryanair, the leader of the pack
LCC share of intra-European capacity indicates a divergence in growth ambitions
vs. legacy carriers. A fragmented market presents ample scope for carriers to exit
the industry providing upside to share projections. We estimate that Ryanair will
take its share from 14% to 25% of the total market by 2024, leading the LCC sector.
We view 25% market share as achievable for Ryanair as it grows its forecasted
traffic base by 102% from 81.7m in FY14 to 165m in FY24E. Share gains are
consistent with historical trends exhibited by the carrier. We see potential for some
rationalisation in future short haul deliveries to European carriers, with any deferrals
or cancellations providing scope for further share gain by Ryanair. Furthermore,
with 34 carriers currently providing 80% of intra-European short haul capacity vs. 4
in the domestic US, we see large scope for consolidation through carriers exiting
the market and LCCs, led by Ryanair, absorbing share. After only a month of
trading in 2015, we have seen the demise of 2 capacity providers - Cyprus Airways
and Eurolot.
Table 15: The virtuous circle of unit costs driving share gain to 25% in FY24E
2015E 2016E 2017E 2018E 2019E 2020E 2021E 2022E 2023E 2024E
Passenger growth 10.5% 11.5% 6.3% 7.7% 6.3% 7.3% 6.5% 6.0% 5.5% 5.5%
Capacity growth 3.9% 11.3% 6.0% 7.0% 6.0% 7.0% 6.0% 5.0% 5.0% 5.0%
LF 88.3% 88.4% 88.7% 89.3% 89.5% 89.7% 90.1% 91.0% 91.4% 91.8%
Ex fuel unit costs 0.4% -0.7% -0.4% -0.2% -0.5% 0.7% -0.8% -0.5% -0.2% -0.3%
Source: Investec Securities estimates
And the circle continues… Market share gains will facilitate Ryanair’s impressive roll out of capacity. Higher
volumes will drive down unit costs reinforcing Ryanair’s competitive pricing. And the
circle continues…
€0
€20
€40
€60
€80
€100
€120
€140
Ryanair Easyjet Norwegian Air Berlin AF / KLM short haul
We forecast 25% market share by 2024

Page 25 | 03 March 2015| Ryanair
Enter the Max
While Ryanair’s new strategy is building LF and reducing unit costs, we believe the
introduction of the MAX in FY20 will provide scope for the carrier to increase its
competitive advantage vs. the competition. Increased fuel efficiency and reduced
operating costs alongside reduced noise and emissions underscore what is widely
aknowledged to be the most competitive unit cost platform in the industry.
Refreshed cabin interiors, improved range and best in class seat capacity
accelerate a brand refresh and leverage the volume driven revenue generation
strategy. Finally, in transitioning to the MAX we see scope for revenue generation
opportunities in the aftermarket before the wheels leave the tarmac.
Figure 38: Ryanair’s MAX order will see the carrier reach new heights
Source: Boeing
Fleet strategy sees Ryanair reaching new heights
We forecast that the cost gap enjoyed over competitors will not only be maintained,
but should actually widen. Costs stand to benefit from an increase in seat density of
4.2%, an 18% improvement in fuel burn per seat and importantly a potential 1.1%
per seat delta over competitors in fuel efficiency. An estimated 6% delta in
depreciation costs per seat vs. peers should widen the ownership cost gap.
Furthermore, we see the potential for Ryanair to generate €519m in after tax profits
from asset sales as part of its upcoming fleet rollover program, with a PV / share of
€0.37 on our estimates. In addition, we believe the MAX offers incremental annual
revenue generation with a PV/share of €0.09.
The arrival of the MAX in FY20 provides
scope for revenue, cost and brand refresh
opportunities
Unit cost tailwind:
- 4.2% seat density improvement
- 18% fuel burn improvement
- Potential 1.1% fuel efficiency
per seat delta vs. peers
- 6% delta in ownership costs per
seat vs. peers

Page 26 | 03 March 2015| Ryanair
Seat density underscores unit costs
Ultimately seat density represents the trump card when assessing unit costs. By
increasing the maximum potential passenger count per aircraft the denominator of
the unit costs equation is driven ever lower. Aircraft manufacturers are acutely
aware of this trend. While Airbus’ recent patent application for bicycle style airplane
seating may be a bridge too far, it nevertheless highlights the industry wide
acknowledgement that by increasing capacity you lower unit costs.
Figure 39:The pursuit of seat density, patented bicycle airline seating
Source: Airbus
Ryanair currently has a 2% advantage against a best in class industry peer, Wizz
Air and an 8% seat density advantage vs. a selection of its short haul peers. When
compared against the global industry average (Fig.40), the extent of Ryanair’s
advantage is clear, with a 20% seat density differential. We see this seat density
differential as placing Ryanair at a structural advantage in terms of maintaining its
industry leading unit cost position.
Figure 40:Seat density vs. peers Figure 41: Staying ahead of the curve - industry seat density trends
Source: Innovata, SeatGuru Source: Airbus, SeatGuru
100110120130140150160170180190200
120
140
160
180
200
1992 1994 1996 1998 2000 2002 2004 2006 2008 2010 2012 2014
Current Ryanair Average (189 seats)
Current industry average (157 seats)
Ryanair seat density:
- 20% above the industry
- 8% above peers
- 2% above best in class Wizz Air

Page 27 | 03 March 2015| Ryanair
Greater seat density
Boeing’s MAX aircraft provides prospective airlines with a 200 seat configuration,
while the NEO offers a maximum seat layout of 189. Ryanair’s proposed 197 seat
configuration for the MAX would offer an additional 8 seats per aircraft representing
an increase of 4.2% in seat capacity vs. the carriers’ industry leading B737-800NG
configuration. Meanwhile, A320NEO recipients look set to configure aircraft with
186 seats, an increase of 3.3% vs. the current in service A320CEO jets. Assuming
configurations remain as indicated we see the potential for Ryanair to widen the
relative seat density gap vs. the competition as it introduces the MAX in FY20.
Table 10: Maximum manufacturer specifications vs. forecast configurations
Maximum seat configuration Forecasted seat configuration
A320CEO /NEO
B737NG/ MAX200
Est LCC peers Ryanair
Current generation technology 180 189 Current generation technology 180 189
Next generation technology 189 200 Next generation technology 186 197
Potential upside 5% 6% Potential upside 3% 4%
Source: Company presentations, Investec Securities estimates
Better fuel efficiency
The emergence of the NEO and MAX, iterations of the long standing 737 and A320
families, offers approximately 20% fuel burn savings to prospective purchasers.
Ryanair stands to decrease its fuel burn per seat by 18% with the arrival of the MAX
in FY20. While competitors are re-fleeting and deriving similar benefits, we see
scope for Ryanair to widen its unit cost gap vs. NEO customers by an estimated
1.1% delta in structural payload efficiency.
Table 17: NEO and MAX customer snapshot
Airbus NEO Boeing MAX
British Airways Ryanair
Easyjet Norwegian
Lufthansa Icelandair
Norwegian Monarch
Swiss Southwest
SAS American
Vueling Westjet
Wizz Air Canada Source: Ascend

Page 28 | 03 March 2015| Ryanair
Ryanair and the industry to benefit from next generation technology
In FY15E, fuel will represent 44% of Ryanair’s operating cost - 13% above that of
the industry average. The arrival of the MAX should offer Ryanair 18% fuel burn per
seat savings vs. its current 737-800NG, offering a projected fuel savings of €51m
upon introduction.
Table 18: Ryanair’s MAX fuel efficiency forecast
737-800NG MAX200
Seats 189 197
Fuel burn/seat - -18%
2020E Fuel cost - €2,277.6
Relative MAX fleet composition - 38%
Projected fuel saving (m) €51
Source: Investec Securities estimates
Weight is the key to fuel efficiency
As both the NEO and MAX are yet to enter service, we are reliant on marketing
material from both manufacturers for the relative benefits of each unit. In assessing
whether any competitive advantage is to be derived from choosing the NEO over
the MAX, or vice versa, one must return to the overriding principal in the
determinant of fuel efficiency - weight.
Aircraft suffer a performance penalty in terms of fuel efficiency for every pound (lb)
of weight they have to lift. The majority of this weight is unavoidable as it is tied to
making flight possible (airframes, engines etc.). Weight over and above this can be
used for revenue generation by means of transporting passengers and freight. This
extra weight – the payload - is paid for by passengers. The structural payload is the
carrying capacity of the aircraft. It is calculated by taking the Operating Empty
Weight (OEW) from the Zero Fuel Weight (ZFW).
We measure the percentage of structural payload utilised by both the Airbus
A320CEO and the Boeing 737-800NG using seat configurations employed by the
best in class LCC peers and those of Ryanair. We then assess this differential vs.
the maximum specifications of the next generation technology, namely the 189 seat
layout for the NEO and 200 seat layout for the MAX. Finally, we evaluate the seat
configurations that are being indicated for the first wave of next generation
deliveries with 186 seats for the NEO and 197 for Ryanair’s MAX200 cabin. Taking
an average weight of 210lb per passenger plus checked and hand luggage, we
assess the relative percentage of payload utilised.
Table 1911: A320 CEO and B737-800NG structural payload comparison (lb)
LCC peers Ryanair Variance
Aircraft A320 CEO B737-800NG
Seats 180 189
ZFW 137,789 136,000
OEW 93,476 91,300
Structural Payload 44,313 44,700
210lb per passenger / baggage 37,800 39,690
Payload utilised 85.3% 88.8% 3.5%
Source: Ascend, Investec Securities estimates
New engine technology with the MAX to
reduce fuel burn / seat by 18%
The structural payload weight is the
revenue carrying capacity of an aircraft.
The percentage of payload utilised
highlights relative efficiency.

Page 29 | 03 March 2015| Ryanair
Table 20: A320 NEO and MAX200 payload comparison (full density) Table 21: A320 NEO and MAX200 payload comparison (Est density)
LCC peers Ryanair Variance
Aircraft A320 NEO B737MAX
Seats 189 200
ZFW 141,789 140,000
OEW 97,476 95,300
Structural Payload 44,313 44,700
210lb per passenger/ baggage 39,690 42,000
Payload utilised 89.6% 94.0% 4.4%
LCC peers Ryanair Variance
Aircraft A320 NEO B737MAX
Seats 186 197
ZFW 141,789 140,000
OEW 97,476 95,300
Structural Payload 44,313 44,700
210lb per passenger/ baggage 39,060 41,370
Payload utilised 88.1% 92.6% 4.4%
Source: Ascend, Investec Securities estimates Source: Ascend, Investec Securities estimates
Ryanair’s relative fuel efficiency differential is set to widen
Based on our estimates the NEO is using 88.1% of its structural payload. In
contrast, the MAX uses 92.6% of its structural payload for passenger transport.
Conceivably excess capacity could be used to transport freight, however, the LCC
model strays away from freight transport. We forecast the payload use gap to widen
by 1.1% to 4.4% when comparing the Ryanair configured MAX200 to the 186 seat
NEO configuration. In our view, this positive delta underscores Ryanair’s fuel
efficiency advantage and, in our view, provides scope to drive the gap wider.
Ownership costs to remain best in class
We believe that Ryanair’s current order book preserves the carrier’s industry
leading ownership cost differential. Ryanair currently has a 23% unit cost per seat
advantage in ownership costs. Given Ryanair’s order book was secured at above
industry average discounts we see this gap widening by 2%. Furthermore, we see
Ryanair generating €519m from the disposal of some 140 737-800NG units as part
of its fleet rollover program targeting an average fleet age of ca. 6yrs.
Ownership costs, leading the charge
Ownership costs comprise maintenance, aircraft hire and depreciation. Depreciation
of aircraft represents 62% of Ryanair’s FY15E ownership costs, it is through this line
item that we estimate Ryanair will widen its cost differential by 6% vs. peers.
Figure 42:Ryanair has a 23% advantage in unit ownership costs Figure 43: GDP projections and major Ryanair aircraft orders
Source: Company reports Source: Company reports, OECD
Ryanair has an impressive track record in both the timing and negotiating of its
aircraft orders. We estimate that the airline has secured above industry average
discounts from manufacturers, lowering its book value per aircraft. We estimate that
on a BV per seat basis, Ryanair’s most recent 180 737-800NG order delivers a 35%
delta vs. the average of peer Airbus A320 CEO orders. We estimate the BV per
seat gap as being secured and widening by 6%, driven by a 14% differential when
comparing the MAX orders vs. the average of peers’ NEO orders.
€0
€2
€4
€6
€8
€10
€12
€14
€16
€18
Ryanair Easyjet Wizz Vueling -1%
0%
1%
2%
3%
4%
5%
6% 2002 Boeing contract 737NG order MAX order
Ryanair fuel efficiency:
4% per seat ahead of rivals
Scope for gap to widen
Ryanair has a 23% unit cost per seat
ownership cost advantage.
A 5% lower book value per seat drives
ownership cost savings

Page 30 | 03 March 2015| Ryanair
Table 22: Ownership cost delta as carriers transfer to the next generation of aircraft
Operator Aircraft Variant Seats Unit price BV/seat Delta Operator Aircraft Variant Seats Unit price BV/seat Delta
Est. LCC peer average Airbus A320 CEO 180 $40.0m $0.22m
Est. LCC peer average Airbus NEO 186 $45.0m $0.24m
Ryanair Boeing 737-800NG 189 $31.0m $0.16m -35% Ryanair MAX200 197 $41.0m $0.21m -14%
Source: Investec Securities estimates
In table 22 above we have summarised our estimates on delivery prices for both
Ryanair’s oldest B737-800NG and its MAX200 aircraft vs. an average A320CEO
and A320 NEO of its LCC competitors. Our estimates are based on market
commentary and observed tranactions at the time of aircraft delivery.
Maintenance and aircraft hire capped by industry leading order book
Ryanair’s order book is the largest of its peer group, representing 50% of the total
group backlog. We see this as tangible as it:
Reduces Ryanair’s future requirements for aircraft hire vs. peers
Maintains Ryanair’s average fleet age at 6.9 years vs. peers’ at 7.9 by FY24
Figure 44: Ryanair’s order book vs. peers, aircraft units
Source: Ascend, Investec Securities estimates
Maintenance related charges, at 16% of Ryanair’s ownership costs are highly
correlated to aircraft age. With Ryanair guiding average fleet age relatively flat out
to FY24 (moving from 5.4 years to 6.9 years between FY15-FY24) we forecast
maintenance charges will remain relatively stable. In contrast, we forecast a gradual
ageing of LCC peers’ fleets from a FY15 starting point of 4.4 years to a FY24
average age of 7.9 years).
Figure 45: Average fleet age of current LCC peer group Figure 46: Forecasted average fleet age of select LCC peer group
Source: Ascend Source: Ascend, Investec Securities estimates
0
10
20
30
40
50
60
2015 2016 2017 2018 2019 2020 2021 2022 2023 2024
Easyjet Wizzair Vueling Ryanair
4.0
5.4
6.4
7.4
2.0
3.0
4.0
5.0
6.0
7.0
8.0
Wizz Ryanair Easyjet Vueling
3
4
5
6
7
8
9
10 Norwegian Ryanair Wizz Air
Easyjet Peer Average
Ryanair’s delivery pipeline represents 50%
of its immediate peer’s backlog

Page 31 | 03 March 2015| Ryanair
Capturing more revenue
The MAX offers Ryanair clear revenue upside with increased range bringing new
markets and primary airports into scope. With 8 extra seats vs. the current
generation of Boeing jets, we forecast 4% revenue per aircraft uplift with the advent
of the MAX. We estimate that the additional seats, when fully in place by FY24, will
generate €128m in additional EBIT, which when discounted by our WACC of 8.5%
implies a present value per share of €0.09.
Table 23: MAX capacity provides revenue opportunity, €
737-800NG MAX200 Variance
Flights/Day 5 5 0
Seats 189 197 8
Seats/Day 945 985 40
Seats/Year 344,925 359,525 14,600
Passengers (target LF 91%) 13,360
Average fare
€60
Additional revenue per aircraft
€804,005
Number of MAX aircraft
200
Total additional MAX revenue, €m
€160.8m
Additional EBIT (80% drop through) €128.6m
PV per share, € cent
€0.09
Source: Investec Securities estimates
MAX to drive increased revenue per
aircraft equating to a PV/share of €0.09

Page 32 | 03 March 2015| Ryanair
Ryanair’s fleet renewal, a solid cost base with aftermarket profit potential
We highlight our fleet evolution projections for Ryanair in table 24 below. Not only
does this fleet evolution profile drive reduced ownership costs but it highlights the
exit of some 160 737-800NG units through FY24. We see this as significant in both
size and scope and we detail below how we believe Ryanair could benefit from
€519m in profit with a PV of €0.37 / share through disposal of aircraft.
Table 24: Fleet renewal program highlights a profitable opportunity
Fleet Evolution FY15E FY16E FY17E FY18E FY19E FY20E FY21E FY22E FY23E FY24E
Beginning year fleet 300 308 342 370 402 420 474 483 497 512
Deliveries -737-800NG 11 40 50 50 29 0 0 0 0 0
Deliveries - 737MAX200 0 0 0 0 0 62 34 42 40 22
Returns/Disposals -3 -6 -22 -18 -11 -8 -25 -28 -25 -14
Year End Fleet 308 342 370 402 420 474 483 497 512 520
- 737-800NG 308 342 370 402 420 412 387 359 334 320
- 737MAX200 0 0 0 0 0 62 96 138 178 200
Average fleet age (yrs.) 6.5 6.6 6.2 6.1 6.4 6.2 6.0 6.1 6.3 6.9
Source: Investec Securities estimates
Extracting value from the aftermarket
With an upcoming fleet rollover program we believe that Ryanair is set make further
gains from its order book. Between Mar’99 and Mar’13 Ryanair took delivery of 348
B737-800NG (NG) aircraft and exited 43 units (26 disposals and 17 lease hand
backs). We estimate that the period FY15-FY24 will see the company exit 160 NG
aircraft with 20 lease hand backs. We take our estimated BV of Ryanir’s oldest NG
units and benchmark this against observed half-life market values for 12 year old
units to arrive at a potential gain on disposal.
Table 25: Ryanair stands to materially benefit from its fleet rollover program, millions
B737-800NG list price $81.00
Assumed Ryanair discount of 62% $50.22
Estimated unit price $30.78
Book Value (BV) $30.78
Residual Value (RV) 15% $4.62
Depreciation per annum $1.14
(Straight line over 23yrs to RV)
12yr old Ryanair 737-800NG BV $17.13
12yr old 737-800NG Half-Life Market Value (MV) $22.00
Gain on disposal $4.87
2015-2024 Estimated disposals (aircraft) 140
2015-2024 Forecasted Upside €519
Source: Ascend, Investec Securities estimates
Risk is mitigated by deepest embedded fleet in history
The current Boeing NG fleet is the most established in recent history providing a
deep, liquid and stable aftermarket leading to a greater degree of price certainty.
The NG entered service in 1997 and when the MAX enters service in 2017 Boeing
forecast that 6,200 NG aircraft will have been delivered from a total order book of
6,700.
Aircraft trading has the potential to
generate €519m with a PV of €0.37 /
share
Residual value risk limited by deep liquid
aftermarket

Page 33 | 03 March 2015| Ryanair
Fortress Stansted, the cornerstone of the network Ryanair’s airport strategy should further allow the carrier to reinforce its competitive
position. Negotiated strong deals at existing bases have been achieved at
favourable terms and will facilitate a transfer to primary airports while maintaining
cost discipline. Moreover, we believe that Ryanair may turn Stansted into a hub,
which would connect network traffic flows driving higher volume and LF.
Airport charges are backed by good deals:
We view the outlook for Ryanair’s airport charges as favourable, backed by
impressive airport deals. In a recently secured ground breaking deal at
Stansted airport, Ryanair secured unit passenger charges that will decline as
volumes grow. This deal combines reduced passenger charges at both DUB
and BGY to ensure that the top 3 bases in the network – (25% of summer
2015 capacity) - are locked in at declining rates.
Good deals lay the groundwork for primary expansion:
We forecast primary airport network capacity growing from a current base of
60% to 80% by FY20. Facilitating this primary expansion, while maintaining
unit cost discipline, is an estimated network wide FY16E-FY24E 2% per
passenger airport charge saving secured from strategic long term deals.
Consolidation and selective expansion create further scope for growth:
An aggregation of capacity and consolidation decreasing supplier power
should provide Ryanair with opportunities to secure favourable rates at primary
airports. Budapest (BUD) was a case in point. Furthermore, in assessing
airport and handling related charges across Europe we have encountered
instances whereby some primary airport charges are actually lower than those
of secondary airports.
Stansted as a hub
STN, as Ryanair’s biggest airport, accounts for 12% of total network capacity.
We forecast the carrier expanding its traffic at STN by 46% from a 2014 figure
of 15m passengers per annum to 22m by 2024. On this firm footing and given
the characteristics of Stansted, we see clear potential for Ryanair to turn the
North East London airport into a hub. We see significant scope to leverage the
network scale from connecting traffic flows at STN. We estimate that such a
move could result in an initial 785k additional passenger, 0.7pts of LF and
€40m EBIT.
Airport charges are backed by good deals
- 25% of capacity at declining
rates
- 43% of capacity at flat or
declining rates
20% primary capacity expansion
facilitated by
- Good existing deals
- Opportunistic expansion
- Primary charges in some
instances cheaper than select
secondary airports

Page 34 | 03 March 2015| Ryanair
Airport charges are backed by good deals
Airport costs represent 15% of Ryanair’s FY15E cost base and we estimate
the carrier has a 32% unit cost gap vs. peers. We forecast primary airport
network capacity growing from a current base of 60% to 80% by FY20E.
Facilitating this primary expansion, while maintaining unit cost discipline is an
estimated cumulative network wide FY16E-FY24E 2% per passenger airport
charge saving secured from strategic long term deals.
Figure 47: Airport handling charges per passenger, € (FY14) Figure 48: Ryanair’s top 10 airports in seat capacity
Source: Company reports Source: Innovata
Fortress Stansted, a new dawn a new deal
STN is Ryanair’s biggest airport, accounting for 12% of total network capacity, while
Ryanair represents 83% of total seat capacity at STN. Despite the relative
importance of Ryanair, airport management at STN have learnt that deterioration in
its passenger numbers and growth in passengers across the Ryanair network are
not mutually exclusive. Fig. 48 below highlights the period 2006-2013 in which STN
traffic declined by 26% while network wide Ryanair traffic grew by 87%. We believe
that this fact aided Ryanair management in securing a long term deal that has
paved the way for growth at reduced unit costs per passenger.
Figure 49: STN and Ryanair traffic growth, passengers, m Figure 50: RYA per passenger airport charge at STN
Source: Company reports Source: Company reports
Fig. 49 above highlights a break from tradition with the old airport charges model of
a pure linear relationship between passenger growth and billable charges broken.
Instead, Ryanair’s 10 year airport deal sees charges levied by STN inversely related
to growth, incentivising a significantly larger presence by Ryanair, while at the same
time driving down average unit costs. We forecast the carrier expanding its traffic at
STN by 57% from a figure of 14m passengers per annum to 22m by FY24E.
Assuming a 2% discount for every additional 1m passengers at STN, this deal
would deliver a total savings of €128m by FY24E.
€0
€5
€10
€15
€20
€25
Ryanair Norwegian Vueling Easyjet0% 2% 4% 6% 8% 10% 12%
PSA
OPO
BVA
MAD
BCN
CRL
CIA
BGY
DUB
STN
Declining per passenger charges
0
10
20
30
40
50
60
70
80
2006 2007 2008 2009 2010 2011 2012 2013
Stanted Total Ryanair
Airport charges are backed by good deals
- 25% of capacity at declining
rates
- 43% of capacity at flat or
declining rates
Airport operator and its largest tenant
are now primed for growth

Page 35 | 03 March 2015| Ryanair
A tailwind from DUB and the continent experience
Airport charges at DUB (7% of network capacity) look set to provide a significant
cost tailwind for Ryanair’s DUB operations out to FY20. The Commission for
Aviation Regulation (CAR) announced in October that it would place a cap on per
passenger costs at DUB that would see charges fall by 4.2% per annum in the
period 2015-2019. This move would see charges reduced from €10.30 to €8.68 per
passenger by FY20 - a 16% reduction.
Table 26: Regulatory charge tailwind at DUB Table 27: A relatively benign regulatory charges environment
FY16E FY17E 2018E FY19E
Per passenger airport charge
€9.87 €9.45 €9.06 €8.68
Annual change % -4.20% -4.20% -4.20% -4.20%
Estimated saving, €m 4.30 4.76 4.90 5.04
Market Driver Weighting
United Kingdom Long term STN deal 12%
Spain Aena freezing charges for 2015 15%
Ireland DUB airport charges falling 8%
Italy 5 year deal inked at Bergamo 8%
Airport charges locked in 43% Source: Irish Commission for Aviation Regulation (CAR), Investec Securities
estimates
Source: Innovata, Investec Securities estimates
We view the remaining Ryanair network as benefitting from an environment of more
benign regulatory charges combined with competition for growth from both primary
and secondary airports. We summarise in table 27 above the headline moves on
the continent that either freeze or lower current regulated airport charges for
Ryanair.
Good deals lay the groundwork for primary expansion
We forecast primary airport network capacity growing from a current base of 60% to
80% by FY20E. An estimated network wide FY16E-FY24E 2% per passenger
airport charge saving, secured from strategic long term deals, should facilitate this
primary expansion while maintaining unit cost discipline. These savings, in
conjunction with consolidation and opportunistic deals, should support a primary
airport build out and maintain airport cost discipline.
Industry consolidation, reduces supplier power
Furthermore, we see scope for further cost containment through selective primary
airport expansion and continued strong deal execution. The aggregation of seat
capacity in an increasingly homogenised European marketplace will decrease
supplier power. Ryanair should benefit through increased opportunities to deploy
capacity in return for favourable long term primary airport deals. We note 2015 has
seen the demise of both Cyprus Airways and Eurolot and we see this trend
continuing.
More opportunistic BUD type deals likely
We see Ryanair acting as first responder as carriers exit the industry and a
fragmented market consolidates. With primary airports increasingly reliant on
passenger volume as legacy carriers retrench, we view Ryanair as well positioned
to take advantage of advantageous deals to secure cost competitive growth. After
Malev collapsed on February 3rd
2012; Ryanair had an operational base at the
capital by February 17th
. Initially basing 5 aircraft and opening an additional 32 new
routes Ryanair demonstrated tactical operational flexibility and timely decision
making to acquire sizeable share at a low cost.
A favourable regulatory environment at
DUB to provide €25m in savings out
through FY19
20% primary capacity expansion
facilitated by
- Good existing deals
- Opportunistic expansion
- Primary charges in some
instances cheaper than select
secondary airports
Malev had 45% capacity share at BUD. Its
collapse was instantly absorbed by the
LCCs

Page 36 | 03 March 2015| Ryanair
Figure 51:BUD traffic progression, passengers ‘000s Figure 52:BUD capacity share December 2014
Source: Innovata Source: Innovata
Saving the day at BUD - decreased supplier power
Prior to its 2012 exit, Malev had circa 45% capacity share at BUD. Ryanair and the
regional LCC Wizz were the big share winners, instantly absorbing Malev’s deficit
and assuming control of 41% of the market. The airport’s tenant list was
subsequently transformed with 5 out of the top 10 airlines now in the LCC / budget
carrier category and an overall LCC penetration level of 54%. After the setback of
losing its anchor tenant, BUD reported 2012 traffic down just 4.7% year-on-year.
Traffic performance of -0.5% in 2013 and +8.44% in 2014 saw traffic surpass the
Malev era and reach record highs. Having saved the day at BUD, we believe
Ryanair’s operational flexibility will place it atop the speed dial list of primary and
secondary airport operators.
Not all primary airports are created equal
In assessing airport and handling related charges across Europe we have
encountered some instances where primary airport charges are actually cheaper
than those of secondary airports on the continent. We view this as highlighting an
avenue of primary market growth for Ryanair that could facilitate unit cost
containment.
STN as a Hub
STN is Ryanair’s biggest airport, accounting for 12% of total network capacity. We
forecast the carrier expanding its traffic at STN by 46% from a 2014 figure of 15m
passengers per annum to 22m by 2024E. On this firm footing and given the
characteristics of Stansted, we see clear potential for Ryanair to turn the North East
London airport into a hub. We see significant scope to leverage the network scale
from connecting traffic flows at STN. We estimate that such a move could result in
an initial 785k additional passengers - 0.7pts of LF and €40m EBIT.
Figure 53: Proportion of connecting traffic at London airports Figure 54: STN daily frequencies to European cities
Source: UK CAA Source: Innovata
0
1,000
2,000
3,000
4,000
5,000
6,000
7,000
8,000
9,000
10,000
2004 2005 2006 2007 2008 2009 2010 2011 2012 2013 0% 5% 10% 15% 20% 25%
Turkish Airlines
BA
KLM
Norwegian
Air France
Germanwings
EasyJet
Lufthansa
Ryanair
Wizz Air
0%
5%
10%
15%
20%
25%
30%
35%
40%
Heathrow Gatwick Stansted Luton LondonCity
LondonMetro Area
0
1
2
3
4
5
6
7
8
We see Ryanair offering instantaneous
capacity to stricken primary airports.

Page 37 | 03 March 2015| Ryanair
With a relatively low proportion of connecting traffic, STN has both the catchment
area and the geographic location to become a hub airport. Hub airports require both
scale and scope: STN as satisfies both requirements with 19.1m passengers in the
twelve months to September 2014 and a network offering high frequency services
to 136 destinations spanning 34 countries.
High frequency services facilitates traffic flow linkage
STN has untapped potential to link short haul traffic flows, while providing ample
scope for any long haul operations. Figure 54 below highlights the dense nature that
Ryanair has built out, serving 185 airports in summer 2015. Figure 55 highlights
STN’s positioning at the heart of Ryanair’s network linking pan European traffic
flows.
Figure 55: Ryanair European network, a visible hub at STN Figure 56: STN leveraging Ryanair’s network
Source: Innovata Source: Innovata
Leveraging the network at STN
By packaging STN as a simple self-connecting hub product, Ryanair could broaden
its network, increase its addressable market and facilitate above consensus traffic
and LF performance. In table 28 below, we highlight 8 high frequency services that
could drive 785k additional passengers per annum from self-connecting traffic flows.
Such connecting traffic flows would be incremental, with a high drop through margin
resulting in an estimated €40m EBIT per annum. This could prove conservative with
STN boasting 113 Ryanair routes - all potential drivers of incremental connecting
traffic.
STN boasts a solid point to point base
with strong development potential
We estimate the creation of a STN hub
could generate 0.7% incremental network
LF and €40m in annual EBIT

Page 38 | 03 March 2015| Ryanair
Table 28: STN as a hub connects traffic flows across a vast network
Origin Hub Additional destinations Annual traffic
DUB STN 54 575,000
BGY STN 100 51,830
LIS STN 95 34,310
BCN STN 94 33,580
MAD STN 92 28,470
CIA STN 78 26,645
BUD STN 73 18,250
WMI STN 71 17,338
Incremental traffic 785,423
Average fare, €63 €50m
Drop through margin, 80% €40m
Source: Investec Securities estimates
Annualised passenger forecasts in table 28 above are based on an assumed
number of connecting passengers per day each way (PDEW) to additional
destinations offered by using STN as a transfer point.
Connecting traffic - the Ryanair way
We believe Ryanair will harness an increasing proportion of connecting traffic,
providing upside to traffic volume and LF performance. Management have stated
that the company would be unlikely to sign formal 'interline' agreements for feeder
flights, but legacy carriers could instead schedule their long-haul flights to fit in with
Ryanair's arrival times.
Table 29: Ryanair sidestepping historical connecting traffic costs
Cost Item Description Ryanair 'side step'
Missed connection costs Costs incurred from passengers missing a leg of
an itinerary
Itinerary sold as two tickets. Self-check in at
STN required
IT development costs Linking reservation systems with external carriers
drives cost. Offer a self-connecting
(RYA-RYA) product only
Interline service charges (ISC)
Charges resulting from two carriers cooperating on connecting traffic
Offer a self-connecting (RYA-RYA) product only
Codeshare commission Fees payable when carriers share each other’s
flight numbers Offer a self-connecting
(RYA-RYA) product only
Frequent Flyer (FFP) costs
Connecting traffic can involve the cost of frequent flyer points
Offer a self-connecting (RYA-RYA) product only
Misconnected baggage Costs associated with delivery of transfer
baggage Offer a hand baggage
only connecting product
Source: Investec Securities estimates
Connecting traffic without the additional
costs and complexities -, the Ryanair way

Page 39 | 03 March 2015| Ryanair
Section 5: Forecast & Valuation Ryanair continues to prove that the LCC model does not equate to a low ROCE.
Continued execution of the group’s commercial strategy underscored by a
sustainable unit cost position should allow volumes and LF to drive improved
profitability. More specifically, we forecast a FY15E-FY24E volume CAGR of 0.4%
above guidance and FY16E net profit (€1,113m) 5% above Bloomberg consensus
(€1,065m). Greater LF and improved revenue per aircraft will drive higher ROCE. In
parallel, free cash flow generation (FCF) should remain robust – averaging €1bn per
annum, 8% FCF yield - from FY15E though FY24E.
Above guidance volume growth - declining unit costs
As summarised in table 30 below we forecast a 10 year CAGR in volume growth of
7.3% vs. company guidance 6.9%, driving materially higher LF and unit cost gains.
Ex-fuel unit costs are forecast to decline by 2.9% between FY15E and FY24E,
driven by higher LF and new aircraft technology.
Table 30: Summary Ryanair operational forecasts
2015E 2016E 2017E 2018E 2019E 2020E 2021E 2022E 2023E 2024E
Investec passenger volume, m 90.3 100.6 107.0 115.2 122.4 131.3 139.8 148.2 156.4 165.0
Guided passenger volume, m 90.0 100.0 106.0 114.0 120.0 128.0 136.0 143.0 150.0 160.0
Delta 0.3% 0.6% 0.9% 1.1% 2.0% 2.6% 2.8% 3.7% 4.3% 3.1%
Investec capacity growth 3.9% 11.3% 6.0% 7.0% 6.0% 7.0% 6.0% 5.0% 5.0% 5.0%
Investec LF 88.3% 88.4% 88.7% 89.3% 89.5% 89.7% 90.1% 91.0% 91.4% 91.8%
Investec ex fuel unit costs growth 0.4% -0.7% -0.4% -0.2% -0.5% 0.7% -0.8% -0.5% -0.2% -0.3%
Source: Investec Securities estimates
Fuller planes drive above consensus FY16E net profit
We forecast FY16E net profit of €1,113mm - 5% above Bloomberg consensus
(€1,065m), in our view primarily due to higher passenger volumes and LF
assumptions stemming from Ryanair’s strategic changes. We show our more
detailed P&L and KPI forecasts out to FY17E starting on page 45.
Table 31: Summary Ryanair Income Statement forecasts
Income statement (€m) 2015E 2016E 2017E 2018E 2019E 2020E 2021E 2022E 2023E 2024E
Total revenue 5,679 6,237 6,298 6,782 7,206 7,729 8,231 8,725 9,205 9,711
Total costs 4,651 5,080 4,984 5,358 5,669 6,050 6,373 6,672 6,986 7,323
EBITDAR 1,510 1,713 1,906 2,060 2,197 2,416 2,619 2,851 3,061 3,270
margin % 26.6% 27.5% 30.3% 30.4% 30.5% 31.3% 31.8% 32.7% 33.3% 33.7%
EBIT 1,029 1,156 1,314 1,425 1,537 1,679 1,858 2,053 2,219 2,388
margin % 18.1% 18.5% 20.9% 21.0% 21.3% 21.7% 22.6% 23.5% 24.1% 24.6%
NOPAT 847 965 1,113 1,221 1,329 1,446 1,589 1,751 1,885 2,024
yoy % 62% 14% 15% 10% 9% 9% 10% 10% 8% 7%
Source: Investec Securities estimates

Page 40 | 03 March 2015| Ryanair
ROCE expansion – fuelled by increased revenue per aircraft
Ryanair has historically generated robust ROCE, averaging 15.5% since FY04. We
forecast a FY15E lease adjusted ROCE of 23.6% rising to 30.8% in FY24E (see
page 53 for details of our methodology). This improvement in ROCE is driven by
higher LF and increased revenue per aircraft. Over our 10 year forecast horizon, we
expect the capital base to grow by a CAGR of 5.9%, which should be more than
offset by an EBIT CAGR of 13.3% on our forecasts.
Figure 57: Ryanair lease adjusted ROCE FY04A-FY24E Figure 58: More profitable revenue from the capital base
Source: Investec Securities estimates Source: Investec Securities estimates
Total returns - built off a platform of robust cash generation
Ryanair has a history of strong cash generation and returning this cash to
shareholders. Since FY13, a large proportion of the value created by the carrier has
been returned to shareholders, amounting to €2bn – 15% of the market cap - in the
form of special dividends and share buybacks. Most recently, Ryanair has returned
€520m in a special dividend and launched a €400m share repurchase programme.
Supported by this, Ryanair has generated a 12 month total shareholder return of
34% vs. 4% for Easyjet and 13% for the broader index (Figure 58 below).
Figure 59: Total returns benefiting shareholders, (Indexed at 100) Figure 60: Robust FCF generation to provide a base for returns
Source: Bloomberg Source: Investec Securities estimates
Capex visibility – shines the light on FCF
Ryanair’s fleet programme provides excellent capex visibility out through FY24E.
Taking this capex into account, we estimate that Ryanair will generate an average
FCF of €1bn per annum, equivalent to an average FCF yield of 8%.
Undemanding valuation
In our view Ryanair’s valuation is undemanding against its own history as well as
relative to its main peer Easyjet. On a 12 month forward price to earnings multiple,
based on consensus, Ryanair trades on 14.4x, a 3% premium to its 3 year average
and in line with its 10 year average. Assessed alongside Easyjet, Ryanair trades on
0%
5%
10%
15%
20%
25%
30%
35% ROCE Historical Average
€0
€2
€4
€6
€8
€10
€12
€14
€16
€18
€20
-10%
-5%
0%
5%
10%
15%
20%
25% NOPAT / % of sales (LHS) Sales / Aircraft €m (RHS)
70
80
90
100
110
120
130
140
150 RYA EZJ SXXP
-€2,500
-€2,000
-€1,500
-€1,000
-€500
€0
€500
€1,000
€1,500
€2,000
€2,500
2012A 2014A 2016E 2018E 2020E 2022E 2024E
FCF Net Capex
We see this strong tradition of rewarding
shareholders with capital returns as
continuing.

Page 41 | 03 March 2015| Ryanair
a relative premium of 19% versus a 3 year average premium of 18% and a 10 year
average premium of 9%.
Figure 61: Ryanair 1 year forward P/E, trading above 3 year average Figure 62: RYA relative premium to EZJ close to 3 year average
Source: Bloomberg Source: Bloomberg
Comparing Ryanair and LCCs to legacy flag carriers has its obvious shortcomings.
Diverse business models and fundamentally different organisational DNA create
varied challenges faced by flags and LCCs. Nevertheless, on a traditional
comparative multiples Ryanair is currently trading at 14.4x FY16E P/E and 8.7x
FY16E Adj EV/EBITDAR, an average 50% premium to its industry peers. We
believe Ryanair’s premium to the peer average, which has been the case for some
time, is justified given Ryanair’s attractive business model and strong growth profile.
Table 32: Ryanair peer comparatives
PER Adj EV/EBITDAR Net Debt/ EBITDA Carrier Y/E Curr Price (LC) YTD % chg MV, €m FY1 FY2 FY1 FY2
IAG Dec EUR 580 19.3% 11,489 13.0 10.2 5.9 5.0 0.3
Lufthansa Dec EUR 13.10 -5.3% 6,060 14.3 6.5 5.1 4.1 1.0
Air France Dec EUR 7.08 -11.1% 2,125 NM 4.8 4.3 3.7 2.5
Scandinavian Airlines Oct SEK 18 20.4% 946 NM 18.3 6.9 5.1 1.7
Norwegian Dec NOK 233 -15.6% 820 NM 8.0 9.4 8.5 7.2
Easyjet Sep GBP 1732 3.7% 9,479 13.0 11.6 7.4 6.8 -0.6
Peer Average 13.4 9.9 6.5 5.5 2.0
Ryanair Mar EUR 10.13 7.8% 14,014 16.5 14.4 9.9 8.7 -0.3
Premium / Discount to peers 23% 45% 52% 58%
Source: Bloomberg consensus data for all peers except Ryanair (IS estimates) as at close 27/2/2015
TP of €13.00 highlights 32% upside
Our target price is derived from our returns-driven 10 year DCF. We adjust our
valuation by capitalising operating leases at 7x and adjusting EBIT for the interest
component of lease payments. A target EV/EBIT multiple of 12.3x is derived from a
long term sales growth of 2%, a weighted average cost of capital (WACC) of 8.5%
and a sustainable lease adjusted ROCE of 26% - reflective of the average ROCE
across our forecast horizon.
10 x
11 x
12 x
13 x
14 x
15 x
16 x
17 x
Jan-12 Jul-12 Jan-13 Jul-13 Jan-14 Jul-14 Jan-15
RYA fwd P/E 3 yr avg 10 yr avg
0%
5%
10%
15%
20%
25%
30%
35%
40%
45%
Jan-12 Jul-12 Jan-13 Jul-13 Jan-14 Jul-14 Jan-15
RYA fwd P/E premium 3 yr avg 10 yr avg
Re-initiating on Ryanair with a Buy
recommendation and a target price of
€13.00 per share

Page 42 | 03 March 2015| Ryanair
Table 33: Ryanair multiples at current and target price
At current price €10.13
At target price €13.00
x FY14A FY15E FY16E
FY14A FY15E FY16E
Adj EV/EBITDAR 13.4 9.9 8.7
17.1 12.6 11.1
P/E 27.4 16.5 14.4
35.2 21.1 18.5
Adj EV/Sales 3.0 2.6 2.4
3.8 3.4 3.0
Source:Company reports, Investec Securities estimates

Page 43 | 03 March 2015| Ryanair
Table 34: Ryanair; DCF Valuation
Source: Investec Securities estimates
Table 35: DCF sensitivity analysis to changes in WACC and terminal growth rate
Source: Investec Securities estimates
Table 36: DCF sensitivity analysis to changes in EBIT margin and terminal growth rate
Source: Investec Securities estimates
€m 2012A 2013A 2014A 2015E 2016E 2017E 2018E 2019E 2020E 2021E 2022E 2023E 2024E TV
Sales 4,325 4,884 5,037 5,679 6,237 6,298 6,782 7,206 7,729 8,231 8,725 9,205 9,711 9,901
% change 19.2% 12.9% 3.1% 12.8% 9.8% 1.0% 7.7% 6.3% 7.3% 6.5% 6.0% 5.5% 5.5% 2.0%
EBIT 618 718 659 1,029 1,156 1,314 1,425 1,537 1,679 1,858 2,053 2,219 2,388 2,079
margin 14.3% 14.7% 13.1% 18.1% 18.5% 20.9% 21.0% 21.3% 21.7% 22.6% 23.5% 24.1% 24.6% 21.0%
Operating leases 91 98 102 110 118 119 121 122 122 122 122 122 122 125
Interest element of op leases 27 29 30 33 35 36 36 37 37 37 37 37 37 37
Lease adjusted EBIT 645 748 689 1,062 1,192 1,349 1,461 1,574 1,715 1,895 2,089 2,256 2,424 2,116
margin 14.9% 15.3% 13.7% 18.7% 19.1% 21.4% 21.5% 21.8% 22.2% 23.0% 23.9% 24.5% 25.0% 21.4%
Depreciation (ex isting assets) 309 330 352 372 439 474 515 538 615 639 676 720 760
Depreciation (capitalised op leases) 63 69 71 77 82 83 85 85 85 85 85 85 85
Change in working capital 130 221 297 205 178 19 154 135 166 160 157 153 161
Tax -81 -93 -86 -133 -149 -169 -183 -197 -214 -237 -261 -282 -303
Operating cash 1,067 1,274 1,323 1,582 1,742 1,757 2,032 2,135 2,368 2,543 2,747 2,932 3,128
Capex -290 -311 -506 -600 -1,000 -1,000 -1,200 -1,306 -2,077 -1,413 -1,606 -1,343 -1,073
as a % of sales 6.7% 6.4% 10.0% 10.6% 16.0% 15.9% 17.7% 18.1% 26.9% 17.2% 18.4% 14.6% 11.1%
Cash flow pre divs & int. 777 963 817 982 742 757 832 829 291 1,130 1,141 1,589 2,055 25,959
Discount factor 1.0 1.0 1.0 1.0 0.9 0.8 0.8 0.7 0.7 0.6 0.6 0.5 0.5 0.48
Discounted cash flow 777 963 817 982 683 642 650 597 193 691 642 824 982 12,407
Summary DCF assumptions FCF Valuation
LT sales growth 2.0% Enterprise value 18,313
Tax rate 12.5% Net debt March FY 15 -61
Discount rate (WACC) 8.5% Operating leases capitalised (x7) 767
Sustainable ROCE 26.0% Pension and other liabilities 0
Target EV/EBIT 12.3 Financial assets -367
Estimated equity value 17,973
Shares issued (m) 1,378
Estimated value per fully diluted share €13.04
Terminal growth rate
8.0 8.5 9.0 9.5 10.0 10.5 11.0
0.5% 12.82 11.75 10.98 10.22 9.55 8.95 8.40
1.0% 13.30 12.14 11.31 10.50 9.78 9.14 8.57
1.5% 13.86 12.59 11.68 10.81 10.04 9.36 8.75
2.0% 14.50 13.04 12.06 11.15 10.33 9.60 8.96
2.5% 15.26 13.68 12.59 11.55 10.65 9.87 9.18
3.0% 16.17 14.38 13.16 12.01 11.02 10.17 9.43
WACC
Terminal growth rate
18% 19% 20% 21% 22% 23% 24%
0.5% 10.67 11.03 11.39 11.75 12.11 12.48 12.84
1.0% 11.01 11.38 11.76 12.14 12.52 12.90 13.28
1.5% 11.39 11.79 12.19 12.59 12.99 13.39 13.78
2.0% 11.78 12.20 12.62 13.04 13.46 13.88 14.30
2.5% 12.33 12.78 13.23 13.68 14.14 14.59 15.04
3.0% 12.93 13.41 13.90 14.38 14.86 15.35 15.83
EBIT margin

Page 44 | 03 March 2015| Ryanair
Fuel and yield sensitivities The tables below detail sensitivities to average revenue per passenger and jet fuel
price.
Table 37: Ryanair FY16E net income sensitivity to average revenue and fuel price
Unhedged fuel price ($) FY16E revenue per passenger
Jet $ / mt -4% -2% 0% 2% 4%
525 854 963 1,067 1,175 1,279
575 844 952 1,056 1,164 1,269
625 833 941 1,046 1,150 1,258
675 822 931 1,035 1,143 1,247
725 812 920 1,024 1,133 1,237
Source: Investec Securities estimates
Table 38: Ryanair FY16E net income sensitivity to average revenue and fuel price (vs. Investec)
Unhedged fuel price ($) FY16E revenue per passenger
Jet $ / mt -4% -2% 0% 2% 4%
525 -11% 0% 11% 22% 33%
575 -13% -1% 9% 21% 31%
625 -14% -3% 8% 19% 30%
675 -15% -4% 7% 18% 29%
725 -16% -5% 6% 17% 28%
Source: Investec Securities estimates
Table 39: Ryanair FY17E net income sensitivity to average revenue and fuel price
Unhedged fuel price ($) FY17E revenue per passenger
Jet $ / mt -7% -6% -5% -4% -3%
525 1,146 1,201 1,255 1,313 1,368
575 1,076 1,130 1,184 1,243 1,297
625 1,005 1,059 1,113 1,172 1,226
675 934 989 1,043 1,101 1,155
725 864 918 972 1,030 1,085
Source: Investec Securities estimates
Table 40: Ryanair FY17E net income sensitivity to average revenue and fuel price (vs. Investec)
Unhedged fuel price ($) FY17E revenue per passenger
Jet $ / mt -7% -6% -5% -4% -3%
525 3% 8% 13% 18% 23%
575 -3% 1% 6% 12% 16%
625 -10% -5% 0% 5% 10%
675 -16% -11% -6% -1% 4%
725 -22% -18% -13% -7% -3%
Source: Investec Securities estimates

Page 45 | 03 March 2015| Ryanair
Detailed P&L analysis Table 41: Ryanair profit & loss account 2012A – 2017E
€ millions, unless otherwise stated 2012A 2013A 2014A 2015E 2016E 2017E
Operating revenues Scheduled revenues 3,438.7 3,819.8 3,789.5 4,289.3 4,686.9 4,658.3
Ancillary revenues 886.2 1,064.2 1,247.2 1,389.9 1,549.8 1,639.2
Total operating revenues 4,324.9 4,884.0 5,036.7 5,679.2 6,236.7 6,297.5
Opeating expenses Staff costs 415.0 435.6 463.6 498.3 555.1 589.2
Depreciation 309.2 329.6 351.8 372.0 439.4 473.7
Fuel & oil 1,593.6 1,885.6 2,013.1 2,027.9 2,176.3 1,908.6
Maintenance 104.0 120.7 116.1 142.0 158.2 167.7
Aircraft rentals 90.7 98.2 101.5 109.6 117.7 118.6
En-route charges 460.5 486.6 522.0 549.3 611.4 648.1
Airport charges 554.0 611.6 617.2 717.5 760.2 808.1
Marketing, distribution and other 180.0 197.9 192.8 234.0 262.1 269.9
Operating profit 617.9 718.2 658.6 1,028.6 1,156.2 1,313.7
Total other income / (expenses) (60.6) (67.3) (67.2) (61.1) (53.0) (41.2)
Profit before tax 557.3 650.9 591.4 967.5 1,103.2 1,272.5
Tax on profit of ordinary activities (65.1) (81.6) (68.6) (120.9) (137.9) (159.1)
Net operating profit after tax 560.4 569.3 522.8 846.6 965.3 1,113.4
Adjusted EPS Basic 38.03 39.45 36.96 61.57 70.21 80.48
Diluted 37.94 39.33 36.86 61.41 70.03 80.13
EBITDA (m) 927.1 1,047.8 1,010.4 1,400.6 1,595.6 1,787.4
EBITDA margin 21.4% 21.5% 20.1% 24.7% 25.6% 28.4%
EBITDAR (m) 1,017.8 1,146.0 1,111.9 1,510.3 1,713.3 1,905.9
EBITDAR margin 23.5% 23.5% 22.1% 26.6% 27.5% 30.3%
EBIT (m) 617.9 718.2 658.6 1,028.6 1,156.2 1,313.7
EBIT margin 14.3% 14.7% 13.1% 18.1% 18.5% 20.9%
Net income (m) 560.4 569.3 522.8 846.6 965.3 1113.4
Net margin 13.0% 11.7% 10.4% 14.9% 15.5% 17.7%
Source: Company data, Investec Securities estimates

Page 46 | 03 March 2015| Ryanair
KPI analysis Table 42: Ryanair KPIs 2012A – 2017E
Year to March 2012A 2013A 2014A 2015E 2016E 2017E
Operating Assumptions
ASKs (m) 114,488 117,208 125,394 129,681 144,335 152,995
Growth % 12.3% 2.4% 7.0% 3.4% 11.3% 6.0%
Seats 92.4 96.7 98.4 102.3 113.8 120.6
Growth % 6.3% 4.7% 1.8% 3.9% 11.3% 6.0%
Passengers 75.8 79.3 81.7 90.3 100.6 107.0
Growth % 5.1% 4.6% 3.0% 10.5% 11.5% 6.3%
Block hours ('000) 1,288 1,273 1,305 1,395 1,528 1,657
Sectors flown ('000) 490 513 525 541 602 638
Sector length growth 6.1% -2.2% 4.5% 0.0% 0.0% 0.0%
Load factor 82.0% 82.0% 83.0% 88.3% 88.4% 88.7%
Growth pps -1.0 0.0 1.0 5.3 0.2 0.3
Revenue Assumptions Average fares 45.4 48.2 46.4 47.5 46.6 43.5
Growth % 15.7% 6.2% -3.7% 2.5% -2.0% -6.5%
Ancillay revenue per passenger 11.7 13.4 15.3 15.4 15.4 15.3
Growth % 5.2% 14.8% 13.7% 0.9% 0.0% -0.5%
Total revenue per passenger 57.1 61.6 61.6 62.9 62.0 58.9
Growth % 13.3% 7.9% 0.1% 2.1% -1.5% -5.0%
Total revenue per seat 46.8 50.5 51.2 55.5 54.8 52.2
Growth % 12.0% 7.9% 1.3% 8.5% -1.3% -4.7%
Cost Assumptions Total cost per passenger 48.9 52.5 53.6 51.5 50.5 46.6
Growth % 12.2% 7.4% 2.0% -3.8% -2.0% -7.7%
Total cost per seat 40.1 43.1 44.5 45.5 44.6 41.3
Growth % 11.0% 7.4% 3.3% 2.3% -1.8% -7.5%
Fuel cost per passenger 21.0 23.8 24.6 22.5 21.6 17.8
Growth % 23.6% 13.1% 3.6% -8.8% -3.7% -17.5%
Fuel cost per seat 17.2 19.5 20.5 19.8 19.1 15.8
Growth % 22.2% 13.0% 4.9% -3.0% -3.6% -17.3%
Ex-fuel cost per passenger 27.9 28.8 28.9 29.1 28.9 28.7
Growth % 5.0% 3.1% 0.7% 0.4% -0.7% -0.4%
Ex-fuel cost per seat 22.9 23.6 24.0 25.6 25.5 25.5
Growth % 3.8% 3.1% 1.9% 6.7% -0.5% -0.1%
Source: Company data, Investec Securities estimates
Page 47 | 03 March 2015| Ryanair
Key risks Outlined below are what we believe to be the key risks facing Ryanair in the core
businesses in which it operates and that could have a material impact on our
forecasts:
Macroeconomic risk
Airlines are affected by economic demand with airline traffic highly correlated to
GDP. In the event of a macroeconomic shock airlines have historically reduced
capacity and parked aircraft to preserve profitability. Demonstrating its operational
flexibility in FY12 Ryanair grounded 30% of its fleet as a result of a weak economic
backdrop and high fuel prices. During that year net profit increased 50% yoy with
lease adjusted ROCE + 1.5% yoy.
Environmental disruption
The demand environment for the company is affected by environmental disruptions.
Environmental factors such as volcanic ash, snow and high winds can severely
curtail or halt regular operations.
Fuel risk
Jet fuel, a derivative of petroleum, represents 44% of FY15E operating expenses
and the company has limited visibility into price changes. The Group’s fuel risk
policy is to hedge between 70 per cent and 90 per cent of its forecast rolling annual
volumes required to ensure that the future cost per gallon is locked in. This policy
has been adopted to prevent exposures, in the short-term, to adverse movements in
world jet fuel prices and provides cost certainty for forward planning purposes.
Foreign exchange
Ryanair has a euro denominated balance sheet and P&L. However a large
proportion of its costs are US dollar denominated - namely jet fuel, maintenance
costs, insurance and aircraft capex. In addition a significant portion of Ryanair’s
revenues is in sterling. Where possible, the carrier’s foreign exchange risk is
reduced by holding assets/liabilities in euro; matching foreign currency income and
expenditures with each other; and using financial instruments to hedge a high
percentage of the remaining exposures on a twelve-month rolling basis.
Liquidity
The airline industry is capital intensive. When markets are capital constrained the
options for Ryanair to finance aircraft purchases and deliveries are reduced. In 2014
Ryanair received a BBB+ credit rating from both Fitch and Standard & Poor’s,
making it the highest rated airline in the world and providing potential access to
favourable financing rates in the debt capital markets.
Seasonality
The airline industry in European is exposed to seasonal patterns in demand. As a
result the company has historically generated cash in Q1 and Q2 and used cash in
Q3 and Q4. Ryanair has a higher proportion of its traffic base in secondary leisure
markets exposing it to greater swings in seasonality in its traffic base when
compared to legacy flag carriers and LCC’s with higher primary airport penetration,
such as Easyjet.
Regulation
The European airline industry is heavily regulated and taxed and Ryanair is
exposed to the risk of changing policies. An increase in regulated airport charges,
en route charges and environmental emissions regulation could negatively impact
the carriers’ earnings.

Page 48 | 03 March 2015| Ryanair
Residual value fleet risk
Ryanair is embarking on an aircraft delivery programme that could invole the future
disposal of units in the secondary market. As such, the carrier is exposed to
fluctuations in the market value of its aircraft type which in turn could affect the
residual value of its fleet.
Legacy brand perception
Ryanair has historically operated an ultra low cost carrier model (ULCC) with a
perceived low degree of customer service. While the carrier has embarked on a
new strategic direction with a more customer friendly business model there exists a
risk that this legacy brand perception persists hampering a product repositioning.

Page 49 | 03 March 2015| Ryanair
Porter Analysis Analysing Ryanair’s competitive position within the industry suggests the company
is structurally insulated from major risk factors. Producing seats at the lowest cost
allows the company to charge fares below that of its competition while continuing to
generate a profit. While it would be expected that the company would be a cost
taker on jet fuel - its largest operating expense, the group hedges its fuel risk with
an active policy to hedge between 70 and 90% of its forecast rolling annual volumes
required to ensure that the future cost is locked in.
In our view the scale and flexibility in the group’s operations, in our view, generates
above average industry supplier bargaining power. Barriers to entry are high given
the requirement to source and procure aircraft and scarcity of infrastructure capacity
at airports. Ryanair’s business is exposed to a threat of substitution, but this is
mitigated, by its scale and price positioning in the marketplace.
Figure 63:Porters 5 Forces
Supplier Power: LOW
Airports compete aggressively for traffic and Ryanair is willing to shift traffic accordingly.
Switching costs are low for Ryanair.
Barriers to entry: HIGH Degree of rivalry: MEDIUM Threat of substitute: MEDIUM
The airline industry is capital intensive, with the cost of acquiring aircraft a sizeable barrier to entry.
There are multiple players in the sector going after market share in a relatively mature market.
Consumers can easily switch airlines dependent on market conditions and preferences.
Access to capacity constrained airports is restricted for new entrants.
Ryanair is structurally insulated from a large degree of industry competition by its leading cost of production.
The price point of Ryanair's operations minimises risk of price substitution. Improving network mix insulates the carrier from itinerary related switching.
Buyer power: MEDIUM
Aircraft manufacturers compete aggressively for airline orders.
Limited alternatives to the few large suppliers in the market
Source: Investec Securities estimates

Page 50 | 03 March 2015| Ryanair
SWOT analysis Ryanair benefits from a strong balance sheet and it has a proven track record in
strong free cash flow generation. Having established an industry leading position in
terms of unit costs the company has the ability to price significantly below the
competition, while continuing to generate profit per passenger. The primary threats
to Ryanair are an increase in competition on its routes and network, changing
industry regulation and adverse volatility in the level of jet fuel.
Figure 64: Ryanair SWOT Analysis
Strengths Weaknesses
Industry leading cost position Legacy brand perception
Low fares / price leadership Seasonality of earnings
Industry leader in innovation Residual value fleet risk
Network size
Fleet
Opportunities Threats
Scope to widen unit cost gap Volatility in the oil price
Increasingly homogeneous market Geopolitical unrest disrupting end markets
Improved brand perception Environmental disruption / volcanic ash
Enlarged addressable market Increased competition from peers
Higher yielding customer mix Currency fluctuations
Source: Investec Securities estimates

Page 51 | 03 March 2015| Ryanair
Sector calendar Table 43: Airlines calendar
Date Stock Event
Date Stock Event
4-Mar IAG February 2015 traffic
6-Jul Easyjet June 2015 traffic
5-Mar Aer Lingus February 2015 traffic
6-Jul Aer Lingus June 2015 traffic
5-Mar Easyjet February 2015 traffic
8-Jul Air France KLM June 2015 traffic
9-Mar Air France KLM February 2015 traffic
9-Jul Lufthansa June 2015 traffic
10-Mar Lufthansa February 2015 traffic
22-Jul Easyjet Q3 2015 results
12-Mar Lufthansa FY 2014 statements
24-Jul Air France KLM H1 2015 results
6-Apr Easyjet March 2015 traffic
27-Jul Ryanair Q1 2016 results
8-Apr IAG March 2015 traffic
30-Jul Lufthansa H12015 results
8-Apr Air France KLM March 2015 traffic
31-Jul IAG H12015 results
8-Apr Aer Lingus March 2015 traffic
5-Aug IAG July 2015 traffic
13-Apr Lufthansa March 2015 traffic
6-Aug Easyjet July 2015 traffic
29-Apr Lufthansa AGM
7-Aug Aer Lingus July 2015 traffic
30-Apr IAG Q1 2015 results
11-Aug Lufthansa July 2015 traffic
30-Apr Air France KLM Q1 2015 results
3-Sep IAG August 2015 traffic
3-May IAG May 2015 traffic
4-Sep Easyjet August 2015 traffic
5-May Lufthansa Q1 2015 results
4-Sep Aer Lingus August 2015 traffic
6-May IAG April 2015 traffic
9-Sep Lufthansa August 2015 traffic
6-May Easyjet April 2015 traffic
5-Oct IAG September 2015 traffic
7-May Aer Lingus April 2015 traffic
6-Oct Aer Lingus September 2015 traffic
11-May Air France KLM April 2015 traffic
6-Oct Easyjet September 2015 traffic
12-May Lufthansa April 2015 traffic
9-Oct Lufthansa September 2015 traffic
12-May Easyjet H1 2015 results
29-Oct Lufthansa Q3 2015 results
21-May Air France KLM AGM
30-Oct IAG Q3 2015 results
26-May Ryanair FY 2015 results
2-Nov Ryanair H1 2016 results
4-Jun Easyjet May 2015 traffic
5-Nov Aer Lingus October 2015 traffic
5-Jun Aer Lingus May 2015 traffic
6-Nov IAG October 2015 traffic
6-Jun IAG June 2015 traffic
10-Nov Lufthansa October 2015 traffic
8-Jun Air France KLM May 2015 traffic
17-Nov Easyjet FY 2015 results
10-Jun Lufthansa May 2015 traffic
3-Dec IAG November 2015 traffic
Source: Company filings

Page 52 | 03 March 2015| Ryanair
Fuel hedging snapshot Table 44: Industry fuel hedging snapshot
Disclosure Airline Hedging period % Hedged Price ($/mt)
Disclosure Airline Hedging period % Hedged Price ($/mt)
25/02/2015 Aer Lingus 2016 21% $845
31/10/2014 IAG Fwd. 12 months 74% Not Disclosed
25/02/2015 Aer Lingus 2015 90% $830
31/10/2014 IAG Jul 2015 - Sep 2015 51% Not Disclosed
25/02/2015 Aer Lingus 2014 100% $954
31/10/2014 IAG Apr 2015 - Jun 2015 72% Not Disclosed
31/10/2014 IAG Jan 2015 - Mar 2015 85% Not Disclosed
19/02/2015 Air France / KLM 2016 27% Not Disclosed
19/02/2015 Air France / KLM 2015 62% $605
12/01/2015 Lufthansa 2015 73% 680
27/01/2015 Easyjet Oct 2015 - Sep 2016 63% $908
02/02/2015 Ryanair Apr 2016 - Mar 2017 35% 680
27/01/2015 Easyjet Oct 2014 - Sep 2015 84% $936
02/02/2015 Ryanair Apr 2015 - Mar 2016 90% $930
27/01/2015 Easyjet Oct 2014 - Mar 2015 91% $957
02/02/2015 Ryanair Apr 2014 - Mar 2015 90% $950
31/10/2014 Finnair Jul 2015 - Dec 2015 50% Not Disclosed
18/12/2014 SAS Aug 2015 - Oct 2015 6% $901 - $950
31/10/2014 Finnair Jan 2015 - Jun 2015 72% Not Disclosed
18/12/2014 SAS May 2015 - Jul 2015 26% $901 - $950
18/12/2014 SAS Feb 2015 - Apr 2015 72% $901 - $950
26/01/2015 Flybe Oct 2015 - Mar 2016 66% $900
26/01/2015 Flybe Apr 2015 - Sep 2015 71% $937
26/01/2015 Flybe Oct 2014 - Mar 2015 97% $948
Source: Company reports

Page 53 | 03 March 2015| Ryanair
Appendix Our ROCE calculation is on a lease adjusted basis. We capitalise operating leases
at 7x and adjust EBIT for the taxed interest element of the capitalised lease
payment. Capital employed is calculated by taking the average over two reporting
periods of shareholders equity, net cash and capitalised operating leases. We view
this approach appropriately capturing the capital deployed by an airline in the
generation of revenue during both the summer and winter IATA seasons.
More specifically ROCE = Adjusted EBIT
Average capital employed
Table 45: Ryanair lease adjusted ROCE calculation
€m FY14A FY15E FY16E FY17E
EBIT - reported 658.6 1,028.6 1,156.2 1,313.7
Interest element of operating lease payments 30.5 32.9 35.3 35.6
Adjusted EBIT 689.1 1,061.5 1,191.6 1,349.3
Tax 11.6% 12.5% 12.5% 12.5%
NOPAT 609.1 928.8 1,042.6 1,180.6
Average shareholders equity - reported 3,279.2 3,302.1 3,541.0 4,060.37
Average net cash - reported 109.4 109.7 142.7 451.60
Average capital leases (7x) 699.0 738.9 795.7 827.01
Average capital employed 3,868.8 3,931.3 4,194.0 4,435.77
ROCE 15.7% 23.6% 24.9% 26.6%
Source: Investec Securities estimates

Page 54 | 03 March 2015| Ryanair
Summary Financials (€m) Year end: 31 March
Source: Company accounts, Investec Securities estimates
Income Statement 2013 2014 2015E 2016E 2017E Revenue 4,884.0 5,036.7 5,679.2 6,236.7 6,297.5EBITDA 1,047.8 1,010.4 1,400.6 1,595.6 1,787.4Depreciation and amortisation (329.6) (351.8) (372.0) (439.4) (473.7)Operating profit 718.2 658.6 1,028.6 1,156.2 1,313.7Other income 0.0 0.0 0.0 0.0 0.0Net interest (67.3) (67.2) (61.1) (53.0) (41.2)Share-based-payments - - - - - PBT (normalised) 650.9 591.4 967.5 1,103.2 1,272.5Impairment of acquired intangibles 0.0 0.0 0.0 0.0 0.0Non-recurring items/exceptionals 0.0 0.0 0.0 0.0 0.0PBT (reported) 650.9 591.4 967.5 1,103.2 1,272.5Taxation (25.8) (32.4) (120.9) (137.9) (159.1)Minorities & preference dividends 0.0 0.0 0.0 0.0 0.0Discontinued/assets held for sale 0.0 0.0 0.0 0.0 0.0Net Income (normalised) 569.3 522.8 846.6 965.3 1,113.4Attributable profit 625.1 559.0 846.6 965.3 1,113.4EPS (reported) 39.3 36.9 61.4 70.0 80.1EPS (norm., cont.) – FD (c) 39.4 37.0 61.6 70.2 80.5EPS (norm., cont., IAS19R adj.) – FD - - - - - DPS (c) 34.0 0.0 37.6 37.6 37.6Average number of group shares - FD (m) 1,447.4 1,418.2 1,378.6 1,378.6 1,389.6Average number of group shares (m) 1,443.1 1,414.6 1,375.1 1,375.1 1,383.5Total number of shares in issue (m) 1,447.1 1,376.6 1,383.5 1,383.5 1,383.5
Cash Flow 2013 2014 2015E 2016E 2017E Operating profit 718.2 658.6 1,028.6 1,156.2 1,313.7Depreciation & amortisation 329.6 351.8 372.0 439.4 473.7Other cash and non-cash movements 1.4 (0.1) 0.0 0.0 0.0Change in working capital 67.4 133.9 204.6 177.5 19.4Operating cash flow 1,116.6 1,144.2 1,605.2 1,773.1 1,806.8Interest (67.3) (67.2) (61.1) (53.0) (41.2)Tax paid (81.6) (68.6) (120.9) (137.9) (159.1)Dividends from associates and JVs 0.0 0.0 0.0 0.0 0.0Cash flow from operations 967.7 1,008.4 1,423.2 1,582.2 1,606.5Maintenance capex (310.7) (505.8) (600.0) (899.5) (631.5)Free cash flow 657.0 502.6 823.2 682.7 975.1Expansionary capex 0.0 0.0 0.0 0.0 0.0Exceptionals and discontinued operations 0.0 0.0 0.0 0.0 0.0Other financials (4.9) 23.9 0.0 0.0 0.0Acquisitions 0.0 0.0 0.0 0.0 0.0Disposals 0.0 0.0 0.0 0.0 0.0Net share issues (46.1) (465.3) (400.0) 0.0 0.0Dividends paid (491.5) 0.0 (520.0) (520.0) (520.0)Change in net cash 114.5 61.2 (96.8) 162.7 455.1Net cash/(debt) 60.7 158.1 61.3 224.1 679.1FCFPS - FD (c) 45.4 35.4 59.7 42.2 43.6
Balance Sheet 2013 2014 2015E 2016E 2017E Property plant and equipment 4,906.3 5,060.3 5,288.3 5,748.4 5,906.1Intangible assets 46.8 46.8 46.8 46.8 46.8Investments and other non current assets 226.3 260.7 366.6 366.6 366.6Cash and equivalents 3,559.0 3,241.7 3,241.7 3,241.7 3,241.7Other current assets 0.0 0.0 0.0 0.0 0.0Total assets 8,943.0 8,812.1 9,171.8 9,654.4 9,814.6Total debt (3,498.3) (3,083.6) (3,180.4) (3,017.6) (2,562.6)Preference shares 1.0 2.0 3.0 4.0 5.0Other long term liabilities (346.5) (368.6) (368.6) (368.6) (368.6)Provisions & other current liabilities (2,172.1) (2,442.7) (2,673.2) (2,873.1) (2,894.9)Pension deficit and other adjustments 0.0 0.0 0.0 0.0 0.0Total liabilities (5,670.4) (5,526.3) (5,853.5) (5,890.7) (5,457.5)Net assets 3,272.6 3,285.8 3,318.3 3,763.6 4,357.1Shareholder's equity 3,272.6 3,285.8 3,318.3 3,763.6 4,357.1Minority interests 0.0 0.0 0.0 0.0 0.0Total equity 3,272.6 3,285.8 3,318.3 3,763.6 4,357.1Net working capital (1,307.2) (1,604.0) (1,808.6) (1,986.1) (2,005.5)NAV per share (c) 22,615.6 23,869.8 23,985.0 27,203.8 31,493.3

Page 55 | 03 March 2015| Ryanair
Selection.Ta bles(1). Range.Fiel ds.Update
Calendarised Valuation Year end: 31 March
Source: Company accounts, Investec Securities estimates
Ratios and Metrics Year end: 31 March
Source: Company accounts, Investec Securities estimates
Target Price Basis
DCF
Key Risks
Global economic risk, oil price, competitive forces, currency , regulation
2013 2014 2015E 2016E
Calendar PE (x) 27.0 18.3 14.9 13.0Calendar Price/NAVPS (x) 0.0 0.0 0.0 0.0EV/sales (x) 2.8 2.5 2.3 2.2EV/EBITDA (x) 13.7 10.7 9.0 8.0FCF yield (%) 3.7 5.3 4.6 4.3Dividend yield (%) 0.8 2.8 3.7 3.7
Ratios and metrics 2013 2014 2015E 2016E 2017E Revenue growth (y-on-y) (%) 12.9 3.1 12.8 9.8 1.0EBITDA growth (y-on-y) (%) 13.0 (3.6) 38.6 13.9 12.0Net income (normalised) growth (yoy) 1.6 (8.2) 61.9 14.0 15.3EPS (normalised) growth (y-on-y) (%) 3.7 (6.3) 66.6 14.0 14.6FCFPS growth (y-on-y) (%) (8.1) (21.9) 68.5 (29.3) 3.3NAVPS growth (y-on-y) (%) (0.9) 5.5 0.5 13.4 15.8DPS growth (y-on-y) (%) 0.0 0.0Interest cover (x) 10.7 9.8 16.8 21.8 31.9Net debt/EBITDA (x) (0.1) (0.2) (0.0) (0.1) (0.4)Net debt/equity (%) (1.8) (4.8) (1.8) (5.9) (15.6)Net gearing (%) (1.9) (5.1) (1.9) (6.3) (18.5)Dividend cover (x) 1.2 n.m. 1.6 1.9 2.1EBITDA margin (%) 21.5 20.1 24.7 25.6 28.4Operating profit margin (%) 14.7 13.1 18.1 18.5 20.9ROE (%) 17.4 15.9 25.5 25.6 25.6ROCE (%) 11.3 11.0 16.9 18.1 20.2NWC/revenue (%) (26.8) (31.8) (31.8) (31.8) (31.8)Tax rate (normalised) (%) 4.0 5.5 12.5 12.5 12.5Tax rate (reported) (%) 4.0 5.5 12.5 12.5 12.5

Page 56 | 03 March 2015| Ryanair
Disclosures Third party research disclosures Research recommendations framework This report has been produced by a non-member affiliate of Investec Securities (US) LLC and is being distributed as third-party research by Investec Securities (US) LLC in the United States. This Report is not intended for use by or distribution to US corporations or businesses that do not meet the definition of a major institutional investor in the United States, or for use by or distribution to any individuals who are citizens or residents of the United States. Investec Securities (US) LLC accepts responsibility for the issuance of this report when distributed in the United States to entities who meet the definition of a US major institutional investor.
Investec Securities bases its investment ratings on a stock’s expected total return (ETR) over the next 12 months (with total return defined as the expected percentage change in price plus the projected dividend yield). Our rating bands take account of differences in costs of capital, risk premia and required rates of return in the various markets that we cover. Prior to 21st January 2013 our rating system for European stocks was: Sell ETR <-10%, Hold ETR -10% to 10%, Buy ETR >10%. From 21st January 2013 any research produced will be on the new framework set out in the tables below. Prior to 11th March 2013, our rating system for South African stocks was: Sell ETR <10%, Hold ETR 10% to 20%, Buy ETR >20%. From 11th March 2013, any research produced on South African stocks will be on the new framework set out in the table below.
Stock ratings for European/Hong Kong stocks Stock ratings for research produced by Investec Bank plc
Analyst certification Source: Investec Securities estimates
Each research analyst responsible for the content of this research report, in whole or in part, and who is named herein, attests that the views expressed in this research report accurately reflect his or her personal views about the subject securities or issuers. Furthermore, no part of his or her compensation was, is, or will be, directly or indirectly, related to the specific recommendations or views expressed by that research analyst in this research report.
Managing conflicts Investec Securities (Investec) has investment banking relationships with a number of companies covered by our Research department. In addition we may seek an investment banking relationship with companies referred to in this research. As a result investors should be aware that the firm may have a conflict of interest which could be considered to have the potential to affect the objectivity of this report. Investors should consider this report as only a single factor in making their investment decision.
Stock ratings for African* stocks Stock ratings for research produced by Investec Securities Limited
Source: Investec Securities estimates
*For African countries excluding South Africa, ratings are based on the 12m implied US dollar expected total return (ETR). This is derived from the expected local currency (LCY) ETR by making assumptions on the 12month forward exchange rates for the respective currencies. For South African stocks, ratings are based on the ETR in rand terms. For European and Hong Kong stocks, within the Hold banding, an Add rating may be (optionally) applied if the analyst is posit ive on the stock and the ETR is greater than 5%; a Reduce rating may be (optionally) applied if the analyst is negative on the stock and the ETR is less than 5%. Not rated (N/R) is applied to any stock where we have no formal rating and price target. Under Review (U/R) can be applied to an analyst’s rating, price target and/or forecasts for a limited time period and indicates that new information is available tha t has not yet been fully digested by the analyst. We review ratings across our coverage universe every month at which point we seek to ensure price targets and ratings, are aligned, other than during periods of extreme volatility. The subject company may have been given access to a pre-published version of this report (with recommendation and price target redacted) to verify factual information only. Investec Securities research contains target prices and recommendations which are prepared on a 12 month time horizon, and therefore may not reflect the different circumstances, objectives and investment time horizons of those who receive it. Investors should therefore independently evaluate whether the investment(s) discussed is (are) appropriate for their specific needs. In addition, the analysts named in this report may from time to time discuss with our clients, including Investec salespersons and traders, or may discuss in this report, trading strategies that reference near term catalysts or events which they believe may have an impact in the shorter term on the market price of securities discussed in this report. These trading strategies may be directionally counter to the analyst's published target price and recommendation for such stocks. For price target bases and risks to the achievement of our price targets, please contact the Key Global Contacts for the relevant issuing offices of Investec Securities listed on the last page of this research note. Investec may act as a liquidity provider in the securities of the subject company/companies included in this report. For full disclosures, please visit: http://researchpdf.investec.co.uk/Documents/WDisc.pdf Our policy on managing actual or potential conflicts of interest in the United Kingdom can be found at: https://images.investec.com/group/online/investment-banking/ConflictsPolicy.pdf Our policy on managing actual or potential conflicts of interest in South Africa can be found at: http://www.investec.co.za/legal/sa/conflicts-of-interest.html
Company disclosures
Ryanair
Key: Investec has received compensation from the company for investment banking services within the past 12 months, Investec expects to receive or intends to seek compensation from the company for investment banking services in the next 6 months, Investec has been involved in managing or co-managing a primary share issue for the company in the past 12 months, Investec has been involved in managing or co-managing a secondary share issue for the company in the past 12 months, Investec makes a market in the securities of the company, Investec holds/has held more than 1% of common equity securities in the company in the past 90 days, Investec is broker and/or advisor and/or sponsor to the company, The company holds/has held more than 5% of common equity securities in Investec in the past 90 days, The analyst (or connected persons) is a director or officer of the company, The analyst (or connected persons) has a holding in the subject company, The analyst (or connected persons) has traded in the securities of the company in the last 30 days. Investec Australia Limited holds 1% or more of a derivative referenced to the securities of the company
Expected total return
12m performance Count % of total Count % of total
Buy greater than 10% 161 54% 73 45%
Hold 0% to 10% 107 36% 18 17%
Sell less than 0% 29 10% 0 0%
All stocks Corporate stocks
Expected total return
12m performance Count % of total Count % of total
Buy greater than 15% 21 35% 3 14%
Hold 5% to 15% 22 37% 5 23%
Sell less than 5% 17 28% 4 24%
All stocks Corporate stocks

Page 57 | 03 March 2015| Ryanair
Recommendation history (for the last 3 years to previous day’s close) Ryanair (RYA.I) – Rating Plotter as at 03 Mar 2015
Source: Investec Securities / FactSet
0
1
2
3
4
5
6
7
8
9
10
Buy Hold Sell Not Rated
Price Target

Page 58 | 03 March 2015| Ryanair
Important Disclaimer – please read Investec Securities:
In the United Kingdom refers to Investec Securities a division of Investec Bank plc.
Investec Bank plc is authorised by the Prudential Regulation Authority and regulated by the Financial Conduct Authority and the Prudential Regulation Authority and is a member of the London Stock Exchange. Registered in England No. 489604
Registered Office Address: 2 Gresham Street London EC2V 7QP
In Ireland refers to Investec Bank plc (Irish Branch)
Investec Bank plc (Irish Branch) is authorised by the Prudential Regulation Authority in the United Kingdom and is regulated by the Central Bank of Ireland for conduct of business rules. Registered in Ireland No. 904428
Registered Office Address: The Harcourt Building, Harcourt Street, Dublin 2
In South Africa refers to Investec Securities (Pty) Ltd an authorised financial services provider and a member of the JSE Limited. Registered in South Africa Number 1972/008905/07
Registered Office Address: 100 Grayston Drive Sandown
In Australia refers to Investec Securities a division of Investec Australia Limited.
Investec Australia Limited is authorised and regulated by the Australian Securities & Investments Commission (Licence Number 342737, ABN 77 140 381 184)
Registered Office Address: Level 23 Chifley Tower 2 Chifley Square Sydney, NSW 2000
In Hong Kong refers to Investec Capital Asia Limited a Securities and Futures Commission licensed corporation (Central Entity Number AFT069).
Registered Office Address: Suite 3609, 36/F, Two International Finance Centre 8 Finance Street, Central Hong Kong
In the United States refers to Investec Securities (US) LLC.
Registered Office Address: 1270 Avenue of the Americas, 29th Floor New York, NY 10020
Further details of Investec office locations, including postal addresses and telephone/fax contact details:
www.investec.com/about-investec/contact-us
Key Global Contacts United Kingdom Andrew Fitchie +44 (0)20 7597 5084 [email protected] South Africa Leon van Heerden +27 11 286 7941 [email protected]
Analyst(s)
Robert Murphy +353 1 421 0465 [email protected]
For the purposes of this disclaimer, “Investec Securities” shall mean: (i) Investec Bank plc (“IBP”); (ii) Investec Bank plc (Irish Branch) (iii) Investec Securities (Pty) Ltd (“ISL”); (iv) Investec Australia Limited (“IAL”); (v) Investec Capital Asia Limited (“ICAL”) and (vi) from time to time, in relation to any of the forgoing entities, the ultimate holding company of that entity, a subsidiary (or a subsidiary of a subsidiary) of that entity, a holding company of that entity or any other subsidiary of that holding company, and any affiliated entity of any such entities. “Investec Affiliates” shall mean any directors, officers, representatives, employees, advisers or agents of any part of Investec Securities. This research report has been issued solely for general information and should not be considered as an offer or solicitation of an offer to sell, buy or subscribe to any securities or any derivative instrument or any other rights pertaining thereto. This research may have been issued to you by one entity within Investec Securities in the fulfilment of another Investec Securities entity’s agreement to do so. In doing so, the entity providing the research is in no way acting as agent of the entity with whom you have any such agreement and in no way is standing as principal or a party to that arrangement. The information in this report has been compiled by Investec Securities from sources believed to be reliable, but neither Investec Securities nor any Investec Affiliates accept liability for any loss arising from the use hereof or makes any representations as to its accuracy and completeness. Any opinions, forecasts or estimates herein constitute a judgement as at the date of this report. There can be no assurance that future results or events will be consistent with any such opinions, forecasts or estimates. Past performance should not be taken as an indication or guarantee of future performance, and no representation or warranty, express or implied is made regarding future performance. The information in this research report and the report itself is subject to change without notice. This research report as well as any other related documents or information may be incomplete, condensed and/or may not contain all material information concerning the subject of the research and/or its group companies (including subsidiaries): its accuracy cannot be guaranteed. There is no obligation of any kind on Investec Securities or any Investec Affiliates to update this research report or any of the information, opinions, forecasts or estimates contained herein. Investec Securities (or its directors, officers or employees) may, to the extent permitted by law, own or have a position in the securities or financial instruments (including derivative instruments or any other rights pertaining thereto) of any company or related company referred to herein, and may add to or dispose of any such position or may make a market or act as a principal in any transaction in such securities or financial instruments. Directors of Investec Securities may also be directors of any of the companies mentioned in this report. Investec Securities may from time to time provide or solicit investment banking, underwriting or other financial services to, for or from any company referred to herein. Investec Securities (or its directors, officers or employees) may, to the extent permitted by law, act upon or use the information or opinions presented herein, or research or analysis on which they are based prior to the material being published. Investec Securities may have issued other reports that are inconsistent with, and reach different conclusions from, the information presented in this report. Those reports reflect the different assumptions, views and analytical methods of the analysts who prepared them. The value of any securities or financial instruments mentioned in this report can fall as well as rise. Foreign currency denominated securities and financial instruments are subject to fluctuations in exchange rates that may have a positive or adverse effect on the value, price or income of such securities or financial instruments. Certain transactions, including those involving futures, options and other derivative instruments, can give rise to substantial risk and are not suitable for all investors. This report does not contain advice, except as defined by the Corporations Act 2001 (Australia). Specifically, it does not take into account the objectives, financial situation or needs of any particular person. Investors should not do anything or forebear to do anything on the basis of this report. Before entering into any arrangement or transaction, investors must consider whether it is appropriate to do so based on their personal objectives, financial situation and needs and seek financial advice where needed. No representation or warranty, express or implied, is or will be made in relation to, and no responsibility or liability is or will be accepted by Investec Securities or any Investec Affiliates as to, or in relation to, the accuracy, reliability, or completeness of the contents of this research report and each entity within Investec Securities (for itself and on behalf of all Investec Affiliates) hereby expressly disclaims any and all responsibility or liability for the accuracy, reliability and completeness of such information or this research report generally. The securities or financial instruments described herein may not have been registered under the US Securities Act of 1933, and may not be offered or sold in the United States of America or to US persons unless they have been registered under such Act, or except in compliance with an exemption from the registration requirements of such Act. US entities that are interested in trading securities listed in this report should contact a US registered broker dealer. This report and the distribution of this report do not constitute an offer or an invitation to offer to the Hong Kong or Singaporean public to acquire, dispose of, subscribe for or underwrite any securities or related financial instruments. Neither this research report nor the information contained in it is intended to be an offer to any person, or to induce or attempt to induce any person to enter into or to offer to enter into any agreement for or with a view to acquiring, disposing of, subscribing for or underwriting securities. The distribution of this document in other jurisdictions may be prohibited by rules, regulations and/or laws of such jurisdic tion. Any failure to comply with such restrictions may constitute a violation of United States securities laws or the laws of any such other jurisdiction. For readers of this report in: South Africa: this report is produced by ISL an authorised financial services provider and a member of the JSE Limited. United Kingdom and Europe: this report is produced by IBP and was prepared by the analyst named in this report. IBP is authorised by the Prudential Regulation Authority and regulated by the Financial Conduct Authority and the Prudential Regulation Authority. This report may only be issued to professional clients, eligible counterparties and investment professionals, as described in S19 of the Financial Services and Markets Act 2000 (Financial Promotions) Order 2005 and is not intended for retail clients. Ireland: this report is produced by Investec Bank plc (Irish Branch) and was prepared by the analyst named in this report. Investec Bank plc (Irish Branch) is authorised by the Prudential Regulation Authority in the United Kingdom and is regulated by the Central Bank of Ireland for conduct of business rules. Australia: this report is issued by IAL holder of Australian Financial Services License No. 342737 only to ‘Wholesale Clients’ as defined by S761G of the Corporations Act 2001 . Hong Kong: this report is distributed in Hong Kong by ICAL, a Securities and Futures Commission licensed corporation (Central Entity Number AFT069) and is intended for distribution to professional investors (as defined in the Securities and Futures Ordinace (Chapter 571 of the Laws of Hong Kong)) only. This report is personal to the recipient and any unauthorised use, redistribution, retransmission or reprinting of this report (whether by digital, mechanical or other means) is strictly prohibited. Singapore: this report is distributed by ICAL. This document may only be distributed in Singapore to institutional investors (within the meaning of the Financial Advisers Act, Cap 110), and is personal to the recipient and not for general circulation in Singapore. It may not be reproduced in any form. By accepting this report, you confirm that you are an "institutional investor" and agree to be bound by the foregoing limitations. Canada: this report is issued by IBP, and may only be issued to persons in Canada who are able to be categorised as a “permitted client” under National Instrument 31-103 Registration Requirements and Exemptions or to any other person to whom this report may be lawfully directed. This report may not be relied upon by any person other than the intended recipient. This publication is confidential for the information of the addressee only and may not be reproduced in whole or in part, copies circulated, or disclosed to another party, without the prior written consent of an entity within Investec Securities. Securit ies referred to in this research report may not be eligible for sale in those jurisdictions where an entity within Investec Securities is not authorised or permitted by local law to do so. In the event that you contact any representative of Investec Securities in connection with receipt of this research, including any analyst, you should be advised that this disclaimer applies to any conversation or correspondence that occurs as a result, which is also engaged in by Investec Securities and any relevant Investec Affiliate solely for the purposes of providing general information only. Any subsequent business you choose to transact shall be subject to the relevant terms thereof. We may monitor e-mail traffic data and the content of email. Calls may be monitored and recorded. Investec Securities does not allow the redistribution of this report to non-professional investors or persons outside the jurisdictions referred to above and Investec Securities cannot be held responsible in any way for third parties who effect such redistribution or recipients thereof. © 2015


![A Virtuous Task [English]](https://img.dokumen.tips/doc/110x75/577c7e671a28abe054a1011a/a-virtuous-task-english.jpg)