Embed Size (px)
Citation preview

An
nu
al
Re
po
rt A
na
lysi
s F
Y1
9
ARA FY19: Emerges as a leading performer in Mid-tier IT player Annual Report highlights several key achievements of Mphasis in FY19. Firstly, it has reported 13% growth in revenues in US$ terms (first double digit growth in 10 years) as it turned its weakness into opportunity (HP/DXC channel revenues grew 22.9% YoY in cc terms in FY19 despite concerns around MSA limitations and DXC’s acquisition of Luxoft). The profitability improved by 100bps as was guided and led to over 30% growth in EPS/FCF for the year. During the year the company rewarded its shareholder with dividend/buyback almost 8% of its market cap. Blackstone (Promoters) also did a share sale of about 8% of the company at Rs960 per share during the year. After concluding robust performance for the year, the commentary continues to remain healthy for FY20 backed by sustained momentum across segment as evident in robust TCV signings (US$ 631mn up 14% YoY). We continue to maintain Mphasis as our top pick among the mid-tier names with a Buy rating and TP of Rs1,220 (valued at 17x FY21e earnings). Strong performance across business segments MPHL’s direct core business (57% of revenue) has outperformed yearly with 16.3% CC growth, due to the acquisition of new clients and the increased contribution from the Blackstone portfolio (revenues doubled in FY19). The focus on strategic accounts helped. The management believes there is ample of headroom for more growth in the Blackstone portfolio, which will in turn lead to overall growth of MPHL. The HP/DXC business (28% of revenue) rose 22.9% YoY (in cc terms) in FY19. The management believes the HP business will grow in line with the industry despite concern on the street that the growth may moderate as DXC acquired outsourcing company Luxoft during the year and also that the Mphasis may see exhaustion of the 1bn$ odd minimum revenue commitment soon that was signed at the time of stake-sale to Blackstone. Healthy deal wins to support future growth MPHL reported healthy TCV wins during FY19, with 11.8% YoY growth in TCV worth USD 616mn. Most of the deal wins are in next gen services (81% in Q4FY19), with an average duration of 2-3 years, this implies quick conversion of deals into revenues and will aid overall profitability of the company. Deal wins continue to drive revenue growth visibility in FY20. MPHL added 18 new clients in FY19, as compared to 10 clients in FY18. Dividend increases and buyback continues The directors have recommended a final dividend of `27 per equity share of `10.0 each for the financial year ended March 31, 2019, which will lead to total cash outflow of approximately ` 5,028 million (including dividend distribution tax of ` 1,034 million). The shareholders of the company approved a buyback of up to 7,320,555 equity shares, representing 3.8% of its total paid-up equity share capital, at a price of ` 1,350 per equity share payable in cash for an aggregate amount up to ` 9,882.8 million, excluding any expenses incurred for the buyback, on a proportionate basis under the Tender Offer method under the SEBI (Buyback of Securities) Regulations, 2018. DART View Mphasis is the only mid-cap company whose operating metrics and order wins give us comfort about sustained growth performance in FY20e. The strong TCV and differentiated client relationships (HP and Blackstone offer large opportunities) are also the reasons for our higher-than-consensus growth estimates. We have a Buy rating on the stock, with a TP of ` 1,220, valuing it at 17x FY21E earnings.
CMP ` 943
Target / Upside ` 1,220 / 29%
BSE Sensex 38,796
NSE Nifty 11,583
Scrip Details
Equity / FV ` 1,862mn / ` 10
Market Cap ` 176bn
US$ 3bn
52-week High/Low ` 1,279/` 858
Avg. Volume (no) 1,87,496
NSE Symbol MPHASIS
Bloomberg Code MPHL IN
Shareholding Pattern Mar’19 (%)
Promoters 52.3
MF/Banks/FIs 8.0
FIIs 29.7
Public / Others 10.0
Mphasis Relative to Sensex
VP Research: Rahul Jain Tel: +9122 40969771
E-mail: [email protected]
Associate: Vinesh Vala Tel: +91 22 40969736
E-mail: [email protected]
70
80
90
100
110
120Ju
l-18
Aug-1
8
Sep-1
8
Oct-18
Nov-
18
Dec-
18
Jan-1
9
Feb
-19
Mar-
19
Apr-
19
May-
19
Jun-1
9
Jul-19
MPHL SENSEX
Mphasis
Buy
July 12, 2019

July 12, 2019 2
Annual Report Macro View
Key Management No change.
Board of Directors
The following person is appointed as an additional Director to the Board: Mr. Marshall Jan Lux, effective 7th August, 2018 - Mr. Lux has been a financial services consultant and practitioner for over 30 years. He started his career at McKinsey where he served all manner of financial service firms across a variety of sub-sectors and functional areas. He also led McKinsey’s and BCG’s private equity practice.
Auditors No change.
M/s B S R & Co LLP continues to be the auditor of the company.
Credit Ratings MPHASIS was assigned a long-term credit rating of [ICRA]AA+ (Stable) and a short-term rating of [ICRA]A1+ reaffirmed.
Macroeconomic Factors
Though the growth has been consistent in the past few years, global economic uncertainties like Brexit and increased protectionist policies among major countries are still being perceived as a significant risk to the IT industry. Several indicators of a recession have bene witnessed as major economies are slowing. This is a single factor that can lead to reduced spending by companies in IT investments which can impact the growth of the industry. Disruptive technologies, such as Robotic Process Automation and AI based solutions are growing causing a reduction in the need for human resources to deliver certain services.
Key Holders
Category of Shareholder (%) FY2018 FY2019
Promoters
i) Foreign 60.38 52.26
Public Shareholding
i) Mutual Funds 6.68 7.57
ii) Banks/Financial Institutions 0.9 0.39
iii) Alternative Investment Funds 0 0.05
iv) FIIs 0.1 0.4
Non-Institutions 31.94 39.33
Shares held by custodians for GDRs and ADRs 0 0
Total 100 100
Source: Company, DART

July 12, 2019 3
Industry
Global Economy
The global economy is facing turbulent times. There have been several indicators of a global recession as major economies are slowing. This is a single factor that can lead to reduced spending by companies in IT investments which can impact the growth of IT/ITES Industry.
The global legal and regulatory environment is now characterized by national interest on the one hand and protection of data privacy on the other. We have witnessed several countries and regional groups coming up with stringent privacy laws, trade sanctions, and compliance requirements for foreign and domestic companies which expose companies to risk of non-compliance, sanctions and penalties thereby increasing the cost of operations significantly.
Market Growth
Global IT spend is expected to grow by 5.0% to 6.0% in CY2019 and the spend on Digital/Next Gen technologies is also rising at an ever-increasing pace. As per NASSCOM, Indian IT industry is expected to grow at 9.2% in CY2019 with Digital revenues expected to be at approximately 24.0% of total revenue of $137.0 billion in the current year, representing a YoY growth of 30%.
Technological Disruptions
Driven by the continued digital business evolution, new technologies are emerging that are trying to merge the physical and digital worlds. New business models enabled by digital business platforms are rapidly evolving to keep pace with these technological changes.
Disruptive technologies, such as Robotic Process Automation and AI based solutions are growing while at the same time reducing the need for human resources to deliver certain services.
There is a high pressure on application maintenance, legacy maintenance work, testing services in the field of pricing and automation.
There has been a healthy environment for “New Gen” services due to the high appetite for adoption of consumption driven technology models. However, traditional IT services have witnessed a demand slowdown. Mphasis has continued to win more new gen services as compared to the traditional.
Segmental Outlook
It has been a fairly steady year from BFS portfolio perspective. There are segments of banking. investing more ahead of the digital investments scale, especially consumer-facing payments, wealth management, retail, mortgages.
Digital Risk business has also stabilized, and the Management has planned to bring it back to the revenue band of $28-30 million per quarter.
“We used the twin themes of Consistency and Transformation as we navigated this journey over the past two years. We are happy with our execution along the 4 vectors of Growth: Consistent, Competitive, Profitable and Responsible, through the year.”
Nitin Rakesh, CEO and Executive Director
“We are getting good pricing lift especially in New Gen areas, and that is actually reflecting in the revenue contribution going up from onsite which of course is a good news because it gives us the operating leverage we need to keep investing in those skills.”
Nitin Rakesh, CEO and Executive Director

July 12, 2019 4
Financial Analysis Revenue Segmentation:
By Market Segment
Direct International revenue grew 19.7% on a reported basis and 11.0% in constant currency terms from `44.6 billion in FY2018 to `53.3 billion in FY2018. Direct Core constituted 82% of Direct International revenue and grew 25.4% in FY2019 on a reported basis and 16.3% in constant currency basis. The growth has been broad based across existing key accounts, growth from Blackstone portfolio companies and other new accounts. In FY2019, revenue from DXC/HP business was `22.1 billion compared to `16.8 billion in FY2018. The continued success in strategic partnership with DXC helped Mphasis achieve a growth of 32.0% on a reported basis in FY2019 and 22.9% on a constant currency basis in FY2019. The Others segment grew 11.8%, from `2.4 billion in FY2018 to `2.7 billion in FY2019.
Market Segmentation(FY19)
Source: Company, DART
By Verticals
Banking and Insurance vertical which together comprises 57% of the revenue grew 15.5% (from `30.1 billion in FY2018 to `35.4 billion in FY2019) and 12.1% (from `8.1 billion in FY2018 to `9.1 billion in FY2019) respectively on a reported basis. Growth in the company’s DXC/HP and in certain key Direct Core customers enabled growth in other segments in FY2019. Information Technology, Communication & Entertainment segment grew from `9.3 billion in FY2018 to `13.4 billion in FY2019, displaying a growth of 44% YoY and Emerging Industries segment grew 29.4% YoY, from `15.7 billion in FY2018 to `20.3 billion in FY2019.
Direct International
68%
HP / DXC Business28%
Others4%
“The tremendous success of Direct Core is pivoted around three main pillars for growth -- Strategic Customers, Blackstone Portfolio, and Our New Client Acquisition Group.”
Nitin Rakesh, CEO and Executive Director
“The three themes of our Transformation as laid out at the beginning of FY’18 were: Move from a traditional outsourcing supplier to a strategic partner, expand geographical footprint, and be a growth partner by being in the path of revenue for DXC.
Nitin Rakesh, CEO and Executive Director

July 12, 2019 5
Revenue Segmentation (FY19)
Source: Company, DART
By Geography
America is Mphasis’ focus market and here the revenue grew 21.1% on a reported basis, from `50.8 billion in FY2019 to `61.6 billion in FY2018. Revenue in EMEA region clocked a growth rate of 37.3% to `8.8 billion in FY2019 to `6.4 billion in FY2018. Growth rates from India and ROW were 9.2% (from `4.1 billion in FY2018 to `4.5 billion in FY2019) and 37.3% (from `2.5 billion in FY2018 to `3.4 billion in FY2019) respectively.
Geographic Split (FY19)
Source: Company, DART
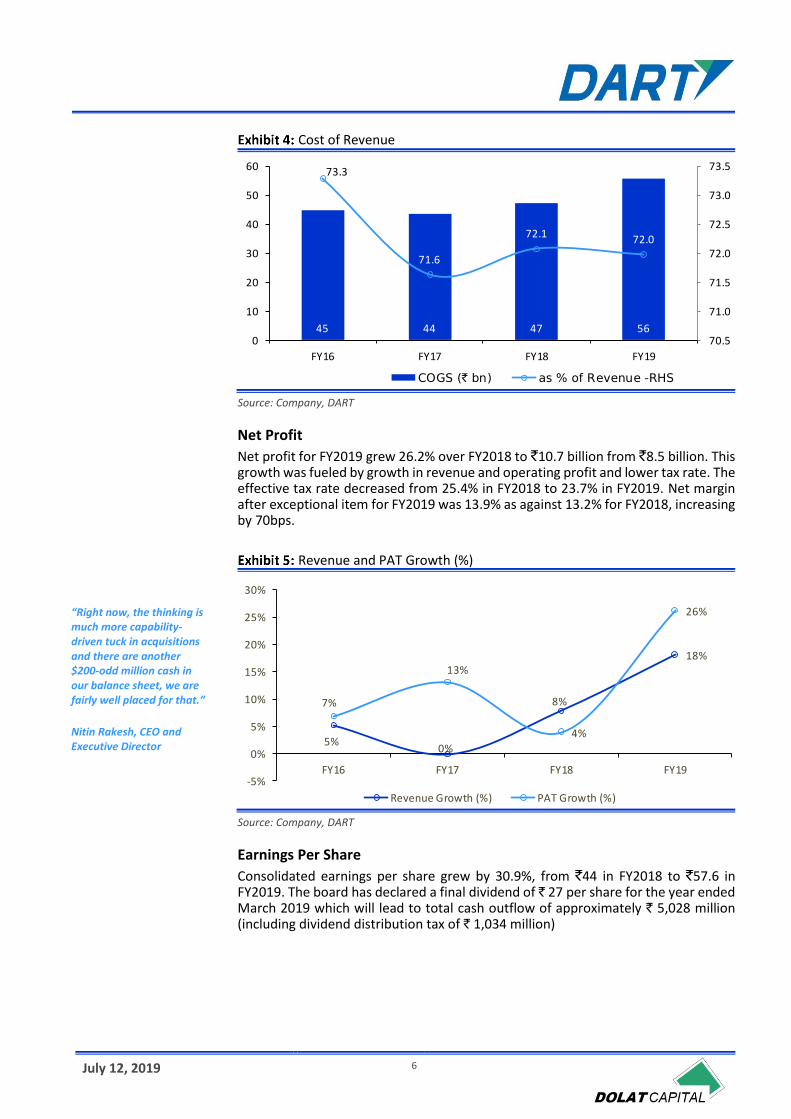
Cost of Revenue
Consolidated cost of revenues for FY2019 was at `55.6billion and for FY2018 at ̀ 47.2 billion, growing by 17.8%. Cost of revenues as a percentage of revenues decreased marginally from 72.1% in FY2018 to 72% in FY2019 as the operational improvements were partially offset by annual wage hike and higher onsite mix of revenue.
Banking and Capital Market
45%
Insurance12%
Information Technology, Communication &
Entertainment
17%
Emerging Industries
26%
America79%
EMEA11%
India6%
ROW4%
July 12, 2019 6
Cost of Revenue
Source: Company, DART
Net Profit
Net profit for FY2019 grew 26.2% over FY2018 to `10.7 billion from `8.5 billion. This growth was fueled by growth in revenue and operating profit and lower tax rate. The effective tax rate decreased from 25.4% in FY2018 to 23.7% in FY2019. Net margin after exceptional item for FY2019 was 13.9% as against 13.2% for FY2018, increasing by 70bps.
Revenue and PAT Growth (%)
Source: Company, DART
Earnings Per Share
Consolidated earnings per share grew by 30.9%, from `44 in FY2018 to `57.6 in FY2019. The board has declared a final dividend of ` 27 per share for the year ended March 2019 which will lead to total cash outflow of approximately ` 5,028 million (including dividend distribution tax of ` 1,034 million)
45 44 47 56
73.3
71.6
72.1 72.0
70.5
71.0
71.5
72.0
72.5
73.0
73.5
0
10
20
30
40
50
60
FY16 FY17 FY18 FY19
COGS (` bn) as % of Revenue -RHS
5%0%
8%
18%
7%
13%
4%
26%
-5%
0%
5%
10%
15%
20%
25%
30%
FY16 FY17 FY18 FY19
Revenue Growth (%) PAT Growth (%)
“Right now, the thinking is much more capability-driven tuck in acquisitions and there are another $200-odd million cash in our balance sheet, we are fairly well placed for that.”
Nitin Rakesh, CEO and Executive Director

July 12, 2019 7
EPS and DPS (`)
Source: Company, DART
Capital Expenditure
In FY2019, Capital Expenditure increased by 2.6 times, from `313 million to `815 million. The gross block of Tangible assets reached `2.8 billion in FY2019, from `2 billion in FY2018, showing a growth of 37%. This was mainly due to additions made in computer equipment, servers and networks and leasehold improvements during the year. The gross block of Intangible assets witnessed a growth of 13% primarily due to additions in software and business alliance partnership. Gross block of Intangible assets was `2.3 billion in FY2018 and `2.5 billion in FY2019. During the year, Mphasis completed buy back of 7.3 million shares for a total cash outlay of `9.9 billion as compared to buy back of 17.3 million shares for a total cash outlay of `11 billion in FY2018.
Capex (` Mn)
Source: Company, DART
Cash and Bank Balances
During FY2019, Cash and bank balances declined by 9.2%, from `7.1 billion in FY2018 to `6.4 billion in the current year. This was largely due to the fall in deposits with original maturity of less than 3 months. During the year, Mphasis completed buy back of 7.3 million shares for a total cash outlay of `9.9 billion as compared to buy back of 17.3 million shares for a total cash outlay of `11 billion in FY2018.
34
39
44
58
20 20 20
27
15
20
25
30
35
40
45
50
55
60
FY16 FY17 FY18 FY19
Basic Earnings per share (̀ ) Dividend per share (`)
12221150
313
815
200
400
600
800
1,000
1,200
1,400
FY16 FY17 FY18 FY19

July 12, 2019 8
Cash and Bank balance (` bn)
Source: Company, DART
Trade Payables and Trade Receivables
During the year, Trade receivables increased from ` 8.1 billion in FY2018, to ` 9.6 billion in FY2019, recording a growth of 17.7%. Debtors days remained flat at 45 days in FY2019. The rise in unbilled revenue was 64.4%, to ̀ 8.9 billion in FY2019 as against ` 5.4 billion in FY2018 which is alarming at current levels. Trade payables was ` 5.0 billion in FY2018 and ` 7.9 billion in FY2019. This growth of 56.3% in payables was primarily because of the outstanding dues to creditors other than micro and small enterprises.
Payables and Receivables (` bn)
Source: Company, DART
Cash Flow Conversion
The company’s cash from operations increased to `9.5 billion in FY2019, a growth of 31.3% as compared to `7.2 billion in FY2018. Operating Cash Flow to EBITDA ratio increased by 360bps, to 71.7% in FY2019 from 68.1% in FY2018 and free-cash-flow increased from `6.9 billion in FY2018 to `8.7 billion in FY2019, recording a growth of 25.5%.
8.6
6.1
7.1
6.4
6
7
8
9
10
FY16 FY17 FY18 FY19
4.53.9
5.0
7.9
6.5 6.3
8.1
9.6
5.4
8.9
2
3
4
5
6
7
8
9
10
FY16 FY17 FY18 FY19
Trade Payables Trade Receivables Unbilled Revenue

July 12, 2019 9
Return Ratios
In FY2019, Return on Net Worth recorded a growth of 520bps, from 14.8% in FY2018 to 20% in FY2019. Return on Capital Employed was 14.4% in FY2018 and 19.5% in FY2019, representing a growth of 510bps during the year. Return on Invested Capital clocked a growth of 680bps to 25.4% during FY2019 from 18.6% in FY2018.
RoACE, RoAIC and RoANW (%)
Source: Company, DART
DuPont Analysis
For FY2019, revenue recorded a growth of 18.1%, to `77.3 billion from `65.5 billion in FY2018 on account of healthy growth in Direct International and DXC/HP business. Net profit for the year increased by 26.2%, to `10.7 billion from `8.5 billion in FY2018. Since the growth in net profit was higher than the growth of revenue, net profit margin increased by 70bps. During the year, assets declined by 2.8%, from `56.7 billion to `55.1 billion in FY2019. Asset turnover ratio hence increased by 21.5% on account of higher growth rate of revenue than assets. The decline of 4.2% in Equity, to `52.5 billion in FY2019 from `54.8 billion in FY2018 led to the rise in equity multiplier by 1.6% during the year. The overall Return on Equity increased by 4.9% which was influenced by the dividend pay-out in respect of the FY2018 and the buyback of shares completed during the financial year.
DuPont Analysis
Source: Company, DART
12.4%13.4%
14.4%
19.5%16.6% 16.6%
18.6%
25.4%
11.8%
13.4%
14.8%
20.0%
10%
12%
14%
16%
18%
20%
22%
24%
26%
FY16 FY17 FY18 FY19
RoACE (%) RoAIC (%) RoANW (%)
0.990.97
1.15
1.40
1.051.02
1.03
1.05
11.9%
13.5%
13.0%
13.9%
12%
12%
13%
13%
14%
14%
15%
0.8
0.9
1.0
1.1
1.2
1.3
1.4
1.5
FY16 FY17 FY18 FY19
Sales/Assets Assets/Equity PAT/Sales (%) - RHS

July 12, 2019 10
4- Quarter ConCall Trend Analysis Q1 FY19 Q2 FY19 Q3 FY19 Q4 FY19
Revenue & Margin
Gross revenue grew 3.6% QoQ in Constant Currency excluding one-time revenue from
India Government business in Q4FY18.Operating margin improved 280 bps
YoY to 16.6% but declined 20 bps QoQ.
Consolidated gross revenue grew 6.9% QoQ. Operating margins improved 200bps YoY to
16.4%. Operating margin declined 20 bps QoQ due to initial transition phase expenses
of certain large deals won during the quarter.
Consolidated gross revenue grew 2.8% QoQ and 23.5% YoY on a reported basis.
Operating margins improved 30bps YoY to 15.8%. Unbilled revenues went up 35%
QoQ.
Consolidated revenue grew 2.2% on a reported basis and 2.9% in constant
currency terms. Operating margin grew 100 bps and operating profits grew 25.9% for FY19 in spite of headwinds from hedge
losses.
Expenses and Wage Hike
Investments being made in sales and marketing effort causing increased
expenses.
Operating margins had an impact of 60bps QoQ due to salary increments during the
quarter.
Operating margin for Q4 remained flat at 15.8% due to higher employee benefits and
related expenses.
Hedging & Forex Management Guidance & Strategy
Forward rates declined compared to Q4FY18 which impacted the margins by 60 bps both QoQ and YoY. Hedge loss incurred in the current quarter. Currency rose by 5%
in terms of dollar appreciating against rupee.
There is no impact of currency depreciation on the margins in FY2019 because a 4
quarter rolling fully hedged book is being run and for this year that hedge is at ` 67.5.
Expected for the hedge loss line going forward to be flat or marginally improving.
The average hedge rate for FY20 is 70. Expected to have tailwinds from hedge
realisation in FY20.
Management Guidance & Strategy
Margin guidance band of 15% to 17%. Performance of 16.5%, which is towards the
upper end.
Europe is growing fairly well. Benefits have begun coming out of investment outside of
the UK both in France as well as in the continent.
Management’s EBIT margin guidance is in the range of 15%-17% in FY19.
Confident of stabilizing Digital Risk business and bringing it back to the stated revenue
band of $28-30 mn in FY20.Expectated EBIT to be around 15%-17% in FY20.
Deal Pipeline, Client Performance & Geography wise performance
Deal wins of $153 mn of TCV in Direct International business. 78% of deal wins
were in New-Gen services. Europe witnessed a QoQ and YoY growth of 12% and 44% respectively on a reported basis.
TCV during the quarter improved 37% QoQ to USD 210mn
TCV at USD 122mn reported decline of 42% QOQ.
Total TCV for the year was $616 mn for the year. Won significant large transformational
deals with DXC/HP during the year. One-thirds of revenues were being
generated from non-America geographies within DXC.
New Initiatives & Acquisitions
Acquired Stelligent Systems which specializes in DevOps automation on
Amazon Web Services for $25 mn. DXC Technology announced the acquisition of
Luxoft Holding.
Made significant capability investment in TalentNext, NEXT labs etc. Built a strong
ecosystem of best-in-class partners, such as Amazon Web Services, Pivotal, Esgyn,
Camuda, etc.
Business Segments
Seeing traction in travel, logistics, healthcare, et al. Insurance segment has
been weak
Direct International grew 4.7% QoQ and 20.4% YoY on a reported basis. BCM had
healthy growth despite volatility in Digital Risk business. Transportation, logistics and health care grew 12.1% sequentially. New
Gen touched 46% of the revenue from direct core business.
The Direct core business, the QoQ revenue growth is highest ever at 6% QoQ and 16.9%
YoY in constant currency basis.
Direct Core and DXC/HP business had a margin improvement of 100bps. Direct core revenue grew 2.9%QoQ on a reported basis.
DXC/HP grew 0.4% in constant currency terms. DXC has grown at 20%.
Source: Company, DART

July 12, 2019 11
Profit and Loss Account
(` Mn) FY18A FY19A FY20E FY21E
Revenue 65,459 77,311 87,226 98,533
Total Expense 54,833 64,071 72,418 81,689
COGS 47,183 55,648 63,087 71,146
Employees Cost 0 0 0 0
Other expenses 7,650 8,423 9,331 10,543
EBIDTA 10,626 13,240 14,808 16,843
Depreciation 709 759 812 833
EBIT 9,917 12,481 13,996 16,010
Interest 130 155 236 73
Other Income 1,620 1,747 1,530 1,675
Exc. / E.O. items 131 0 0 0
EBT 11,538 14,073 15,290 17,613
Tax 2,900 3,339 3,670 4,289
RPAT 8,638 10,734 11,620 13,324
Minority Interest 0 0 0 0
Profit/Loss share of associates 0 0 0 0
APAT 8,507 10,734 11,620 13,324
Balance Sheet
(` Mn) FY18A FY19A FY20E FY21E
Sources of Funds
Equity Capital 1,933 1,862 1,862 1,862
Minority Interest 0 0 0 0
Reserves & Surplus 52,885 50,636 57,787 66,641
Net Worth 54,818 52,498 59,649 68,503
Total Debt 1,016 1,275 1,337 1,402
Net Deferred Tax Liability 872 1,366 1,502 1,653
Total Capital Employed 56,706 55,139 62,488 71,558
Applications of Funds
Net Block 18,844 21,711 22,149 22,691
CWIP 19 16 16 16
Investments 33,007 32,504 33,482 36,931
Current Assets, Loans & Advances 17,984 19,481 22,661 28,236
Inventories 0 0 0 0
Receivables 8,116 9,554 10,176 10,948
Cash and Bank Balances 7,067 6,416 8,904 13,636
Loans and Advances 0 0 0 0
Other Current Assets 2,800 3,511 3,581 3,653
Less: Current Liabilities & Provisions 13,148 18,572 15,820 16,316
Payables 5,024 7,850 5,085 5,501
Other Current Liabilities 8,124 10,721 10,734 10,814
Net Current Assets 4,836 909 6,841 11,921
Total Assets 56,706 55,139 62,488 71,558
E – Estimates

July 12, 2019 12
Important Ratios
Particulars FY18A FY19A FY20E FY21E
(A) Margins (%)
Gross Profit Margin 27.9 28.0 27.7 27.8
EBIDTA Margin 16.2 17.1 17.0 17.1
EBIT Margin 15.1 16.1 16.0 16.2
Tax rate 25.1 23.7 24.0 24.4
Net Profit Margin 13.2 13.9 13.3 13.5
(B) As Percentage of Net Sales (%)
COGS 72.1 72.0 72.3 72.2
Employee 0.0 0.0 0.0 0.0
Other 11.7 10.9 10.7 10.7
(C) Measure of Financial Status
Gross Debt / Equity 0.0 0.0 0.0 0.0
Interest Coverage 76.3 80.5 59.3 220.8
Inventory days 0 0 0 0
Debtors days 45 45 43 41
Average Cost of Debt 14.6 13.5 18.1 5.3
Payable days 28 37 21 20
Working Capital days 27 4 29 44
FA T/O 3.5 3.6 3.9 4.3
(D) Measures of Investment
AEPS (`) 44.0 57.6 62.4 71.5
CEPS (`) 47.7 61.7 66.8 76.0
DPS (`) 20.0 27.0 20.0 20.0
Dividend Payout (%) 45.4 46.8 32.1 28.0
BVPS (`) 283.6 281.9 320.3 367.9
RoANW (%) 14.8 20.0 20.7 20.8
RoACE (%) 14.4 19.5 20.2 20.0
RoAIC (%) 18.6 25.4 27.4 28.7
(E) Valuation Ratios
CMP (`) 943 943 943 943
P/E 21.4 16.4 15.1 13.2
Mcap (` Mn) 1,75,620 1,75,620 1,75,620 1,75,620
MCap/ Sales 2.7 2.3 2.0 1.8
EV 1,69,569 1,70,479 1,68,054 1,63,386
EV/Sales 2.6 2.2 1.9 1.7
EV/EBITDA 16.0 12.9 11.3 9.7
P/BV 3.3 3.3 2.9 2.6
Dividend Yield (%) 2.1 2.9 2.1 2.1
(F) Growth Rate (%)
Revenue 7.7 18.1 12.8 13.0
EBITDA 9.7 24.6 11.8 13.7
EBIT 9.0 25.9 12.1 14.4
PBT 3.1 22.0 8.6 15.2
APAT 3.9 26.2 8.3 14.7
EPS 13.1 30.9 8.3 14.7
Cash Flow
(` Mn) FY18A FY19A FY20E FY21E
CFO 7,233 9,497 8,586 12,852
CFI 4,925 2,893 (1,691) (3,715)
CFF (13,649) (13,512) (4,408) (4,405)
FCFF 6,920 8,682 7,336 11,477
Opening Cash 6,133 4,642 6,416 8,904
Closing Cash 4,642 3,520 8,904 13,636
E – Estimates

DART RATING MATRIX
Total Return Expectation (12 Months)
Buy > 20%
Accumulate 10 to 20%
Reduce 0 to 10%
Sell < 0%
Rating and Target Price History
Month Rating TP (`) Price (`)
Jan-18 Accumulate 900 824
Mar-18 Buy 980 876
May-18 Reduce 1,050 984
Jun-18 Accumulate 1,280 1,059
Aug-18 Accumulate 1,300 1,150
Jan-19 Buy 1,250 921
May-19 Buy 1,150 952
Jun-19 Buy 1,150 972
*Price as on recommendation date
DART Team
Purvag Shah Managing Director [email protected] +9122 4096 9747
Amit Khurana, CFA Head of Equities [email protected] +9122 4096 9745
CONTACT DETAILS
Equity Sales Designation E-mail Direct Lines
Dinesh Bajaj VP - Equity Sales [email protected] +9122 4096 9709
Kartik Sadagopan VP - Equity Sales [email protected] +9122 4096 9762
Kapil Yadav VP - Equity Sales [email protected] +9122 4096 9735
Ashwani Kandoi AVP – Equity Sales [email protected] +9122 4096 9725
Lekha Nahar Manager – Equity Sales [email protected] +9122 4096 9740
Equity Trading Designation E-mail
P. Sridhar SVP and Head of Sales Trading [email protected] +9122 4096 9728
Chandrakant Ware VP - Sales Trading [email protected] +9122 4096 9707
Shirish Thakkar VP - Head Domestic Derivatives Sales Trading [email protected] +9122 4096 9702
Kartik Mehta Asia Head Derivatives [email protected] +9122 4096 9715
Bhavin Mehta VP - Derivatives Strategist [email protected] +9122 4096 9705
690
820
950
1,080
1,210
1,340
Jan
-18
Fe
b-1
8
Ma
r-18
Ap
r-18
Ma
y-1
8
Jun
-18
Jul-1
8
Au
g-1
8
Se
p-1
8
Oct-
18
Nov-1
8
Dec-1
8
Jan
-19
Fe
b-1
9
Ma
r-19
Ap
r-19
Ma
y-1
9
Jun
-19
Jul-1
9
(`) MPHL Target Price
Dolat Capital Market Private Limited. Sunshine Tower, 28th Floor, Senapati Bapat Marg, Dadar (West), Mumbai 400013

Our Research reports are also available on Reuters, Thomson Publishers, DowJones and Bloomberg (DCML <GO>)
Analyst(s) Certification The research analyst(s), with respect to each issuer and its securities covered by them in this research report, certify that: All of the views expressed in this research report accurately reflect his or her or their personal views about all of the issuers and their securities; and No part of his or her or their compensation was, is, or will be directly or indirectly related to the specific recommendations or views expressed in this research report.
I. Analyst(s) and Associate (S) holding in the Stock(s): (Nil)
II. Disclaimer: This research report has been prepared by Dolat Capital Market Private Limited. to provide information about the company(ies) and sector(s), if any, covered in the report and may be distributed by it and/or its affiliated company(ies) solely for the purpose of information of the select recipient of this report. This report and/or any part thereof, may not be duplicated in any form and/or reproduced or redistributed without the prior written consent of Dolat Capital Market Private Limited. This report has been prepared independent of the companies covered herein. Dolat Capital Market Private Limited. and its affiliated companies are part of a multi-service, integrated investment banking, brokerage and financing group. Dolat Capital Market Private Limited. and/or its affiliated company(ies) might have provided or may provide services in respect of managing offerings of securities, corporate finance, investment banking, mergers & acquisitions, financing or any other advisory services to the company(ies) covered herein. Dolat Capital Market Private Limited. and/or its affiliated company(ies) might have received or may receive compensation from the company(ies) mentioned in this report for rendering any of the above services. Research analysts and sales persons of Dolat Capital Market Private Limited. may provide important inputs to its affiliated company(ies) associated with it. While reasonable care has been taken in the preparation of this report, it does not purport to be a complete description of the securities, markets or developments referred to herein, and Dolat Capital Market Private Limited. does not warrant its accuracy or completeness. Dolat Capital Market Private Limited. may not be in any way responsible for any loss or damage that may arise to any person from any inadvertent error in the information contained in this report. This report is provided for information only and is not an investment advice and must not alone be taken as the basis for an investment decision. The investment discussed or views expressed herein may not be suitable for all investors. The user assumes the entire risk of any use made of this information. The information contained herein may be changed without notice and Dolat Capital Market Private Limited. reserves the right to make modifications and alterations to this statement as they may deem fit from time to time. Dolat Capital Market Private Limited. and its affiliated company(ies), their directors and employees may; (a) from time to time, have a long or short position in, and buy or sell the securities of the company(ies) mentioned herein or (b) be engaged in any other transaction involving such securities and earn brokerage or other compensation or act as a market maker in the financial instruments of the company(ies) discussed herein or act as an advisor or lender/borrower to such company(ies) or may have any other potential conflict of interests with respect to any recommendation and other related information and opinions. This report is neither an offer nor solicitation of an offer to buy and/or sell any securities mentioned herein and/or not an official confirmation of any transaction. This report is not directed or intended for distribution to, or use by any person or entity who is a citizen or resident of or located in any locality, state, country or other jurisdiction, where such distribution, publication, availability or use would be contrary to law, regulation or which would subject Dolat Capital Market Private Limited. and/or its affiliated company(ies) to any registration or licensing requirement within such jurisdiction. The securities described herein may or may not be eligible for sale in all jurisdictions or to a certain category of investors. Persons in whose possession this report may come, are required to inform themselves of and to observe such restrictions.
For U.S. Entity/ persons only: This research report is a product of Dolat Capital Market Private Limited., which is the employer of the research analyst(s) who has prepared the research report. The research analyst(s) preparing the research report is/are resident outside the United States (U.S.) and are not associated persons of any U.S. regulated broker-dealer and therefore the analyst(s) is/are not subject to supervision by a U.S. broker-dealer, and is/are not required to satisfy the regulatory licensing requirements of FINRA or required to otherwise comply with U.S. rules or regulations regarding, among other things, communications with a subject company, public appearances and trading securities held by a research analyst account.
This report is intended for distribution by Dolat Capital Market Private Limited. only to "Major Institutional Investors" as defined by Rule 15a-6(b)(4) of the U.S. Securities and Exchange Act, 1934 (the Exchange Act) and interpretations thereof by U.S. Securities and Exchange Commission (SEC) in reliance on Rule 15a 6(a)(2). If the recipient of this report is not a Major Institutional Investor as specified above, then it should not act upon this report and return the same to the sender. Further, this report may not be copied, duplicated and/or transmitted onward to any U.S. person or entity.
In reliance on the exemption from registration provided by Rule 15a-6 of the Exchange Act and interpretations thereof by the SEC in order to conduct certain business with Major Institutional Investors, Dolat Capital Market Private Limited. has entered into an agreement with a U.S. registered broker-dealer Ltd Marco Polo Securities Inc. ("Marco Polo"). Transactions in securities discussed in this research report should be effected through Marco Polo or another U.S. registered broker dealer/Entity as informed by Dolat Capital Market Private Limited. from time to time.
Dolat Capital Market Private Limited.
Corporate Identity Number: U65990DD1993PTC009797 Member: BSE Limited and National Stock Exchange of India Limited.
SEBI Registration No: BSE - INB010710052 & INF010710052, NSE - INB230710031& INF230710031, Research: INH000000685 Registered office: Office No. 141, Centre Point, Somnath, Daman – 396 210, Daman & Diu
Board: +9122 40969700 | Fax: +9122 22651278 | Email: [email protected] | www.dolatresearch.com