Embed Size (px)
Citation preview
RESULTS REVIEW 2QFY18 15 NOV 2017
Idea Cellular BUY
HDFC securities Institutional Research is also available on Bloomberg HSLB <GO>& Thomson Reuters
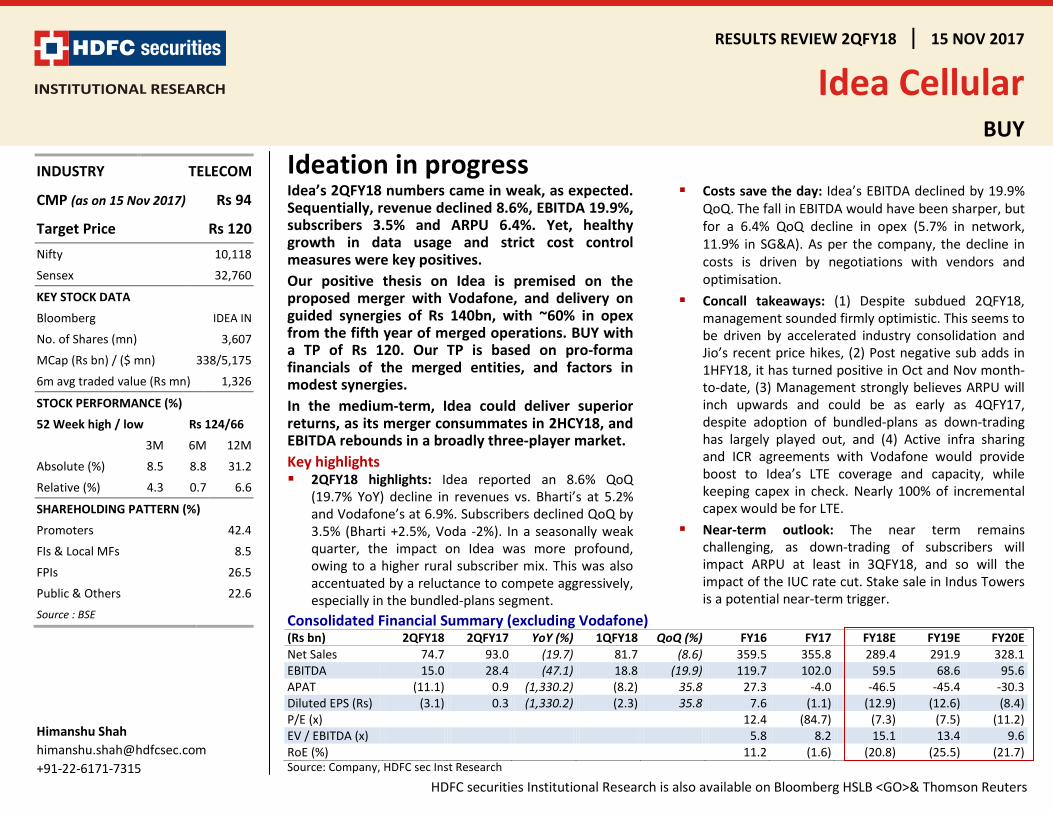
Ideation in progressIdea’s 2QFY18 numbers came in weak, as expected. Sequentially, revenue declined 8.6%, EBITDA 19.9%, subscribers 3.5% and ARPU 6.4%. Yet, healthy growth in data usage and strict cost control measures were key positives. Our positive thesis on Idea is premised on the proposed merger with Vodafone, and delivery on guided synergies of Rs 140bn, with ~60% in opex from the fifth year of merged operations. BUY with a TP of Rs 120. Our TP is based on pro-forma financials of the merged entities, and factors in modest synergies. In the medium-term, Idea could deliver superior returns, as its merger consummates in 2HCY18, and EBITDA rebounds in a broadly three-player market. Key highlights 2QFY18 highlights: Idea reported an 8.6% QoQ
(19.7% YoY) decline in revenues vs. Bharti’s at 5.2% and Vodafone’s at 6.9%. Subscribers declined QoQ by 3.5% (Bharti +2.5%, Voda -2%). In a seasonally weak quarter, the impact on Idea was more profound, owing to a higher rural subscriber mix. This was also accentuated by a reluctance to compete aggressively, especially in the bundled-plans segment.
Costs save the day: Idea’s EBITDA declined by 19.9% QoQ. The fall in EBITDA would have been sharper, but for a 6.4% QoQ decline in opex (5.7% in network, 11.9% in SG&A). As per the company, the decline in costs is driven by negotiations with vendors and optimisation.
Concall takeaways: (1) Despite subdued 2QFY18, management sounded firmly optimistic. This seems to be driven by accelerated industry consolidation and Jio’s recent price hikes, (2) Post negative sub adds in 1HFY18, it has turned positive in Oct and Nov month-to-date, (3) Management strongly believes ARPU will inch upwards and could be as early as 4QFY17, despite adoption of bundled-plans as down-trading has largely played out, and (4) Active infra sharing and ICR agreements with Vodafone would provide boost to Idea’s LTE coverage and capacity, while keeping capex in check. Nearly 100% of incremental capex would be for LTE.
Near-term outlook: The near term remains challenging, as down-trading of subscribers will impact ARPU at least in 3QFY18, and so will the impact of the IUC rate cut. Stake sale in Indus Towers is a potential near-term trigger.
Consolidated Financial Summary (excluding Vodafone) (Rs bn) 2QFY18 2QFY17 YoY (%) 1QFY18 QoQ (%) FY16 FY17 FY18E FY19E FY20E Net Sales 74.7 93.0 (19.7) 81.7 (8.6) 359.5 355.8 289.4 291.9 328.1 EBITDA 15.0 28.4 (47.1) 18.8 (19.9) 119.7 102.0 59.5 68.6 95.6 APAT (11.1) 0.9 (1,330.2) (8.2) 35.8 27.3 -4.0 -46.5 -45.4 -30.3 Diluted EPS (Rs) (3.1) 0.3 (1,330.2) (2.3) 35.8 7.6 (1.1) (12.9) (12.6) (8.4) P/E (x) 12.4 (84.7) (7.3) (7.5) (11.2) EV / EBITDA (x) 5.8 8.2 15.1 13.4 9.6 RoE (%) 11.2 (1.6) (20.8) (25.5) (21.7) Source: Company, HDFC sec Inst Research
INDUSTRY TELECOM
CMP (as on 15 Nov 2017) Rs 94
Target Price Rs 120 Nifty 10,118
Sensex 32,760
KEY STOCK DATA
Bloomberg IDEA IN
No. of Shares (mn) 3,607
MCap (Rs bn) / ($ mn) 338/5,175
6m avg traded value (Rs mn) 1,326
STOCK PERFORMANCE (%)
52 Week high / low Rs 124/66
3M 6M 12M
Absolute (%) 8.5 8.8 31.2
Relative (%) 4.3 0.7 6.6
SHAREHOLDING PATTERN (%)
Promoters 42.4
FIs & Local MFs 8.5
FPIs 26.5
Public & Others 22.6 Source : BSE
Himanshu Shah [email protected] +91-22-6171-7315

IDEA CELLULAR : RESULTS REVIEW 2QFY18
Page | 2
Quarterly Financial Snapshot: Consolidated Rs Bn 1QFY17 2QFY17 3QFY17 4QFY17 1QFY18 2QFY18 % chg YoY % chg QoQ Revenue 94,866 93,002 86,627 81,261 81,665 74,655 -19.7% -8.6% Acess costs 11,826 11,521 9,984 9,424 10,690 11,198 -2.8% 4.8% License Fee 10,974 10,792 9,814 8,935 8,666 7,689 -28.8% -11.3% Network & IT costs 25,995 26,202 27,942 25,380 26,883 25,361 -3.2% -5.7% Employee costs 4,334 4,788 4,487 4,367 4,195 4,398 -8.1% 4.8% Sales & Marketing 8,314 8,814 9,480 9,386 10,017 8,854 0.5% -11.6% Other Expenses 2,683 2,485 3,266 2,570 2,460 2,139 -13.9% -13.0% Operating Expenses 64,124 64,601 64,973 60,062 62,911 59,639 -7.7% -5.2% EBITDA 30,742 28,401 21,655 21,199 18,754 15,016 -47.1% -19.9% D&A 19,192 19,543 19,653 19,885 20,679 21,143 8.2% 2.2% Other Income 658 1,291 437 684 152 454 -64.8% 198.7% Finance Costs 9,882 10,044 9,669 10,050 11,691 12,283 22.3% 5.1% PBT before share in JV 2,327 105 (7,230) (8,052) (13,464) (17,956) -17225.4% 33.4% Share of Profit in JV 1,035 1,057 1,143 983 818 843 -20.2% 3.1% PBT after share in JV 3,362 1,162 (6,087) (7,069) (12,646) (17,113) -1572.8% 35.3% Tax 1,158 247 (2,248) (3,792) (4,497) (6,047) -2545.8% 34.5% OCI (net of tax) (33) (14) (17) 21 (10) (12) -15.4% 20.0% PAT 2,171 900 (3,856) (3,256) (8,159) (11,078) -1330.2% 35.8% Source: Company, HDFC sec Inst Research Margin Analysis (%) 1QFY17 2QFY17 3QFY17 4QFY17 1QFY18 2QFY18 chg YoY (bps) chg QoQ (bps) Access costs 12.5 12.4 11.5 11.6 13.1 15.0 261 191 License Fee 11.6 11.6 11.3 11.0 10.6 10.3 (130) (31) Network & IT costs 27.4 28.2 32.3 31.2 32.9 34.0 580 105 Employee costs 4.6 5.1 5.2 5.4 5.1 5.9 74 75 Sales & Marketing 8.8 9.5 10.9 11.6 12.3 11.9 238 (41) Other Expenses 2.8 2.7 3.8 3.2 3.0 2.9 19 (15) Operating Expenses 67.6 69.5 75.0 73.9 77.0 79.9 1,042 285 EBITDA 32.4 30.5 25.0 26.1 23.0 20.1 (1,042) (285) D&A 20.2 21.0 22.7 24.5 25.3 28.3 731 300 Other Income 0.7 1.4 0.5 0.8 0.2 0.6 (78) 42 Finance Costs 10.4 10.8 11.2 12.4 14.3 16.5 565 214 PBT after share in JV 3.5 1.2 (7.0) (8.7) (15.5) (22.9) (2,417) (744) PAT 2.3 1.0 (4.5) (4.0) (10.0) (14.8) (1,581) (485) Tax as % of PBT 34.4 21.3 36.9 53.6 35.6 35.3 1,406 (22) Source: Company, HDFC sec Inst Research
Weak performance, in the light of stiff competition from Jio and Bharti, and management’s reluctance to aggressively move to bundled plans in the past Stringent cost control in tough times led by negotiations with vendors especially on energy costs, and optimisation
IDEA CELLULAR : RESULTS REVIEW 2QFY18
Page | 3
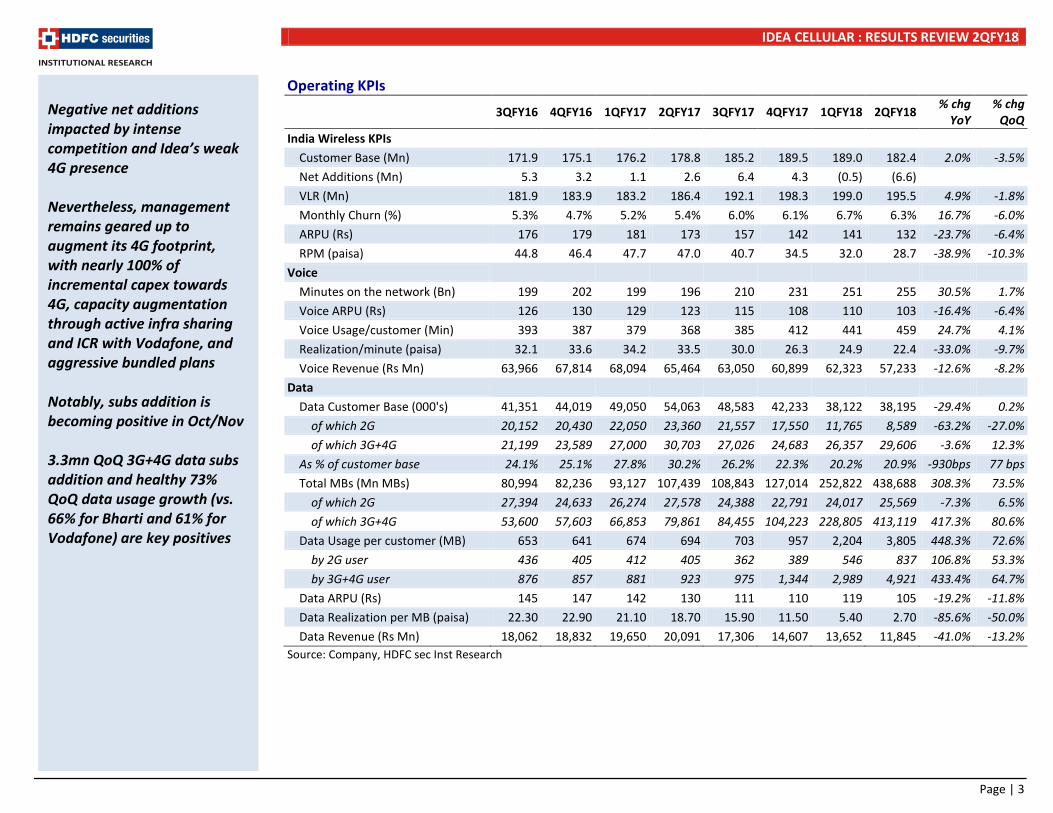
Operating KPIs
3QFY16 4QFY16 1QFY17 2QFY17 3QFY17 4QFY17 1QFY18 2QFY18 % chg YoY
% chg QoQ
India Wireless KPIs Customer Base (Mn) 171.9 175.1 176.2 178.8 185.2 189.5 189.0 182.4 2.0% -3.5% Net Additions (Mn) 5.3 3.2 1.1 2.6 6.4 4.3 (0.5) (6.6) VLR (Mn) 181.9 183.9 183.2 186.4 192.1 198.3 199.0 195.5 4.9% -1.8% Monthly Churn (%) 5.3% 4.7% 5.2% 5.4% 6.0% 6.1% 6.7% 6.3% 16.7% -6.0% ARPU (Rs) 176 179 181 173 157 142 141 132 -23.7% -6.4% RPM (paisa) 44.8 46.4 47.7 47.0 40.7 34.5 32.0 28.7 -38.9% -10.3%
Voice Minutes on the network (Bn) 199 202 199 196 210 231 251 255 30.5% 1.7% Voice ARPU (Rs) 126 130 129 123 115 108 110 103 -16.4% -6.4% Voice Usage/customer (Min) 393 387 379 368 385 412 441 459 24.7% 4.1% Realization/minute (paisa) 32.1 33.6 34.2 33.5 30.0 26.3 24.9 22.4 -33.0% -9.7% Voice Revenue (Rs Mn) 63,966 67,814 68,094 65,464 63,050 60,899 62,323 57,233 -12.6% -8.2%
Data Data Customer Base (000's) 41,351 44,019 49,050 54,063 48,583 42,233 38,122 38,195 -29.4% 0.2%
of which 2G 20,152 20,430 22,050 23,360 21,557 17,550 11,765 8,589 -63.2% -27.0% of which 3G+4G 21,199 23,589 27,000 30,703 27,026 24,683 26,357 29,606 -3.6% 12.3%
As % of customer base 24.1% 25.1% 27.8% 30.2% 26.2% 22.3% 20.2% 20.9% -930bps 77 bps Total MBs (Mn MBs) 80,994 82,236 93,127 107,439 108,843 127,014 252,822 438,688 308.3% 73.5%
of which 2G 27,394 24,633 26,274 27,578 24,388 22,791 24,017 25,569 -7.3% 6.5% of which 3G+4G 53,600 57,603 66,853 79,861 84,455 104,223 228,805 413,119 417.3% 80.6%
Data Usage per customer (MB) 653 641 674 694 703 957 2,204 3,805 448.3% 72.6% by 2G user 436 405 412 405 362 389 546 837 106.8% 53.3% by 3G+4G user 876 857 881 923 975 1,344 2,989 4,921 433.4% 64.7%
Data ARPU (Rs) 145 147 142 130 111 110 119 105 -19.2% -11.8% Data Realization per MB (paisa) 22.30 22.90 21.10 18.70 15.90 11.50 5.40 2.70 -85.6% -50.0% Data Revenue (Rs Mn) 18,062 18,832 19,650 20,091 17,306 14,607 13,652 11,845 -41.0% -13.2%
Source: Company, HDFC sec Inst Research
Negative net additions impacted by intense competition and Idea’s weak 4G presence Nevertheless, management remains geared up to augment its 4G footprint, with nearly 100% of incremental capex towards 4G, capacity augmentation through active infra sharing and ICR with Vodafone, and aggressive bundled plans Notably, subs addition is becoming positive in Oct/Nov 3.3mn QoQ 3G+4G data subs addition and healthy 73% QoQ data usage growth (vs. 66% for Bharti and 61% for Vodafone) are key positives

IDEA CELLULAR : RESULTS REVIEW 2QFY18
Page | 4
Key Assumptions (Pro-forma financials of Idea and Vodafone)
FY16 FY17 FY18E FY19E FY20E FY21E FY22E Subs (Mn) 373 399 398 424 446 465 484 - Idea 175 190 186 198 208 217 226 - Voda 198 209 212 226 237 248 258
ARPU (Rs)* 178 161 126 125 132 135 148 - Idea 178 161 126 124 132 137 148 - Voda 177 160 126 125 132 134 147
Revenue (Rs bn) 803 785 646 656 730 783 891 - Idea 359 356 289 292 328 355 400 - Voda 443 430 356 364 402 428 491
EBITDA (Rs bn) 249 218 130 148 196 250 320 - Idea 120 102 59 69 96 122 152 - Voda 129 116 70 79 100 128 168
EBITDA Margin % 31.0 27.8 20.1 22.5 26.8 31.9 35.9 - Idea 33.3 28.7 20.5 23.5 29.1 34.3 38.0 - Voda 29.2 27.1 19.7 21.7 25.0 29.9 34.2
Net Debt (Rs bn) 361 501 1,144 1,174 1,145 1,086 991 - Idea 361 501 558 573 564 531 470 - Voda 586 601 581 555 521
Multiple (X) 9.0 9.0 9.0 9.0 9.0 Enterprise Value (Rs bn) 1,167 1,330 1,764 2,248 2,878 - Idea 535 617 861 1,097 1,365 - Voda 632 713 903 1,151 1,513
Equity Value* 1,880 1,464 22 156 619 1,162 1,887 - Idea 716 417 (23) 44 296 566 895 - Voda 1,163 1,047 46 112 323 596 991
* Our ARPU is net of IUC rate cut impact in FY18 (effective1-Oct) from 14p to 6p per minute and nil from1-Jan - 2020 Stake sale in standalone towers by Idea and Vodafone to ATC for Rs 78.5bn, and potential stake sale in Indus Towers of Idea’s 11.15% (estimated at ~Rs 80-85bn) to deleverage the balance sheet and would be positive

IDEA CELLULAR : RESULTS REVIEW 2QFY18
Page | 5
FY16 FY17 FY18E FY19E FY20E FY21E FY22E Equity Value** - Idea's stake in Indus (refer table) 77 82 87 91 95 99 102 - Merger synergies (refer table) - - - 305 477 665 781
O/s shares 7.2 7.2 7.2 7.2 7.2 7.2 7.2 - Idea 3.6 3.6 3.6 3.6 3.6 3.6 3.6 - Voda 3.6 3.6 3.6 3.6 3.6 3.6 3.6
Value per share* (without merger) 261 203 3 22 86 161 262 - Idea 199 116 (6) 12 82 157 249 - Voda 323 291 13 31 90 166 275
Value per share** 272 215 15 77 165 267 385 - Value per share* (pre merger) 261 203 3 22 86 161 262 - Idea's stake in Indus (refer table) 11 11 12 13 13 14 14 - Merger synergies - - - 42 66 92 109 Source: Company, HDFC sec Inst Research
Idea’s share in Indus Towers
FY16 FY17 FY18E FY19E FY20E FY21E FY22E Indus EBITDA (Rs bn) 69.2 73.1 78.2 81.7 85.6 88.6 91.7 Multiple (X) 10.0 10.0 10.0 10.0 10.0 10.0 10.0 Enterprise Value (Rs bn) 692 731 782 817 856 886 917 Idea’s share @ 11.15% (Rs bn) 77 82 87 91 95 99 102
Our SoTP for Idea is Rs 120 based on (1) Rs 53 @ 9x Sep-19 EV/EBITDA multiple for business as-is for Idea plus Vodafone, (2) Rs 13 for combined entity’s 11% stake in Indus Towers, and (3) Rs 54 from synergy benefits towards merger

IDEA CELLULAR : RESULTS REVIEW 2QFY18
Page | 6
Idea-Vodafone synergy benefits from merger
FY16 FY17 FY18E FY19E FY20E FY21E FY22E Operating Cost* 333 367 353 355 373 391 412 - Idea 152 170 168 172 181 189 199 - Voda 181 197 185 183 192 202 213
Synergy % 2.5% 7.5% 12.5% 15.0% - Idea 2.5% 7.5% 12.5% 15.0% - Voda 2.5% 7.5% 12.5% 15.0% Synergy benefit p.a. (Rs bn) 34 53 74 87 - Idea 4 14 24 30 - Voda 5 14 25 32 - Capex synergies 25 25 25 25 Synergy value (Rs bn) @ 9x 305 477 665 781 - Idea 39 122 213 269 - Voda 41 130 227 288 - Capex 225 225 225 225 * Operating costs includes Network, Employees, Sales and marketing & General and Administration costs
Idea-Vodafone estimate the merger process to complete in 2HCY18 We estimate the synergy benefit to kick-in from FY19 on opex costs Idea and Vodafone incur capex of Rs 150-170bn p.a. We estimate the synergies on capex at Rs 25bn p.a. Idea and Vodafone estimate the synergy benefit at Rs 140bn p.a. after fourth year of operations with ~60% of synergies towards operating costs

IDEA CELLULAR : RESULTS REVIEW 2QFY18
Page | 7
Sale of towers to be largely value neutral, yet positive
We see stake sale in standalone towers by Voda/Idea and Indus towers by Idea as largely value neutral (opex replaces capex). However it is near-term positive as de-leverages balance sheet and provides ammunition to combat competition if the scenario deteriorates. Vodafone and Idea already announced sale of standalone towers to ATC for Rs 78.5bn. Stake sale in Indus could be a near-term potential trigger.
Impact of Standalone tower sales Number of towers 20,000 Tenancy 1.60 Number of tenants 32,000 Loss of tenants 6,300 Number of tenants 25,700 Rental/tenant/month 30,000 Loss of EBITDA (9,252) Savings in interest (@ 8%) 6,280 Savings in depreciation/capex (@ 5%) 3,925 Net impact on PBT/Cash flow 953 Tax impact (@ 30%) 286 Net impact on PAT/Cash flow 667 Multiple (X) 10 Value from stake sale in tower business 6,671 Value per share 1 Source: HDFC sec Inst Research
Sale of towers though neutral form value per share perspective, yet is positive from balance sheet stand-point

IDEA CELLULAR : RESULTS REVIEW 2QFY18
Page | 8
Consolidated Income Statement (excluding Vodafone) (Rs bn) FY16 FY17 FY18E FY19E FY20E Net Sales 359.5 355.8 289.4 291.9 328.1 Growth (%) 13.9 (1.0) (18.7) 0.9 12.4 Access Costs 46.7 42.8 30.6 17.3 13.3 Net revenue 312.8 313.0 258.8 274.6 314.8 Growth (%) 16.6 0.1 (17.3) 6.1 14.6 License fee 41.5 40.5 31.6 33.6 38.6 LF as % of NR 13.3 12.9 12.2 12.3 12.3 Network & IT costs 92.8 105.5 104.1 108.5 115.1 Employee costs 16.1 18.0 17.0 16.2 15.3 SG&A 33.5 36.0 37.0 37.9 40.2 Other Operating Expenses 9.2 11.0 9.7 9.8 9.9 Operating Expenditure 151.7 170.5 167.8 172.3 180.6 EBITDA 119.7 102.0 59.5 68.6 95.6 EBITDA (%) 33.3 28.7 20.5 23.5 29.1 EBITDA Growth (%) 10.6 (14.8) (41.7) 15.3 39.4 Depreciation 62.6 78.3 84.9 89.1 93.1 EBIT 57.1 23.7 (25.4) (20.5) 2.5 Other Income 2.1 3.1 1.5 2.0 2.2 Interest 21.0 39.6 48.3 50.1 52.1 Share in Profit of JV 4.2 4.2 3.4 3.7 4.0 PBT 42.5 (8.6) (68.7) (64.9) (43.4) Tax 15.2 (4.6) (22.2) (19.5) (13.0) APAT 27.3 (4.0) (46.5) (45.4) (30.3) APAT Growth (%) (14.6) (114.7) 1,063.2 (2.3) (33.2) EPS 7.6 (1.1) (12.9) (12.6) (8.4) EPS Growth (%) (14.6) (114.7) 1,063.2 (2.3) (33.2)
Source: Company, HDFC sec Inst Research
Consolidated Balance Sheet (Rs mn) FY16 FY17 FY18E FY19E FY20E SOURCES OF FUNDS Share Capital - Equity 36 36 36 36 36 Reserves 222 211 165 119 89 Total Shareholders’ Funds 258 247 201 155 125 Long term debt 366 550 567 579 590 Short term debt 16 0 14 19 24 Total Debt 382 551 581 598 615 Other non-current liabilities 70 33 35 43 52 TOTAL SOURCES OF FUNDS 710 831 817 796 791 APPLICATION OF FUNDS Net Block 744 843 823 804 781 Other non-current assets 36 48 46 49 53 Total Non-current Assets 780 891 869 854 834 Inventories 1 1 1 1 1 Debtors 12 13 11 12 13 Cash & Equivalents 22 50 23 20 38 Other Current Assets 12 13 13 12 12 Total Current Assets 46 76 47 45 64 Total Current Liabilities 117 136 99 103 107 Net Current Assets -70 -60 -52 -58 -43 TOTAL APPLICATION OF FUNDS 710 831 817 796 791
Source: Company, HDFC sec Inst Research

IDEA CELLULAR : RESULTS REVIEW 2QFY18
Page | 9
Consolidated Cash Flow Year ending March (Rs mn) FY16 FY17 FY18E FY19E FY20E Reported PAT 27 (4) (46) (45) (30) Net interest expense 21 40 48 50 52 Depreciation 63 78 85 89 93 Working Capital Change & others (56) 18 (36) 4 3 OPERATING CASH FLOW ( a ) 55 132 51 98 118 Capex (400) (177) (65) (70) (70) Free cash flow (FCF) (345) (45) (14) 28 48 Investments 43 (49) 4 4 5 INVESTING CASH FLOW ( b ) (357) (226) (61) (66) (65) Debt Issuance 214 168 31 16 17 Interest expenses (21) (40) (48) (50) (52) FCFE (109) 35 (27) (3) 18 Share capital Issuance - - (0) (0) (0) Dividends 0 (6) - - - FINANCING CASH FLOW ( c ) 193 122 (17) (34) (35) NET CASH FLOW (a+b+c) (109) 28 (27) (3) 18 Closing Cash & Equivalents 22 50 23 20 38 Source: Company, HDFC sec Inst Research
Key Ratios FY16 FY17 FY18E FY19E FY20E PROFITABILITY (%) EBITDA Margin 33.3 28.7 20.5 23.5 29.1 EBIT Margin 15.9 6.7 (8.8) (7.0) 0.8 APAT Margin 7.6 (1.1) (16.1) (15.6) (9.2) RoE 11.2 (1.6) (20.8) (25.5) (21.7) RoIC (or Core RoCE) 7.4 1.5 (2.2) (1.8) 0.2 RoCE 6.4 1.4 (2.1) (1.8) 0.2 EFFICIENCY Tax Rate (%) 35.8 53.7 32.4 30.0 30.0 Fixed Asset Turnover (x) 0.6 0.4 0.3 0.4 0.4 Inventory (days) 1 1 1 1 1 Debtors (days) 12 13 14 15 14 Other Current Assets (days) 12 13 16 15 14 CL & Provisions (days) 119 140 124 128 119 Cash Conversion Cycle (days) (93) (113) (94) (98) (90) Net D/E (x) 1.4 2.0 2.8 3.7 4.6 Net D/EBITDA (x) 3.0 4.9 9.4 8.4 6.0 Interest Coverage (x) 2.7 0.6 (0.5) (0.4) 0.0 PER SHARE DATA (Rs) EPS (Rs/sh) 7.6 (1.1) (12.9) (12.6) (8.4) CEPS (Rs/sh) 2.5 2.1 1.1 1.2 1.7 DPS (Rs/sh) 0.6 - - - - BV (Rs/sh) 71.6 68.6 55.7 43.1 34.6 VALUATION P/E (x) 12.4 (84.7) (7.3) (7.5) (11.2) P/BV (x) 1.3 1.4 1.7 2.2 2.7 EV/EBITDA (x) 5.8 8.2 15.1 13.4 9.6 EV/Revenues (x) 1.9 2.4 3.1 3.1 2.8 OCF/EV (%) 7.8 15.7 5.7 10.6 12.9 FCF/EV (%) (49.3) (5.4) (1.6) 3.0 5.3 FCFE/Mkt Cap (%) (15.6) 4.1 (3.0) (0.3) 2.0 Dividend Yield (%) 1 - - - - Source: Company, HDFC sec Inst Research

IDEA CELLULAR : RESULTS REVIEW 2QFY18
Page | 10
Rating Definitions BUY : Where the stock is expected to deliver more than 10% returns over the next 12 month period NEUTRAL : Where the stock is expected to deliver (-)10% to 10% returns over the next 12 month period SELL : Where the stock is expected to deliver less than (-)10% returns over the next 12 month period
Date CMP Reco Target 15-Nov-17 94 BUY 120
RECOMMENDATION HISTORY
50
70
90
110
130
Nov-
16
Dec-
16
Jan-
17
Feb-
17
Mar
-17
Apr-
17
May
-17
Jun-
17
Jul-1
7
Aug-
17
Sep-
17
Oct
-17
Nov-
17
IDEA Cellular TP

IDEA CELLULAR : RESULTS REVIEW 2QFY18
Page | 11
Disclosure: I, Himanshu Shah, CA, author and the name subscribed to this report, hereby certify that all of the views expressed in this research report accurately reflect our views about the subject issuer(s) or securities. HSL has no material adverse disciplinary history as on the date of publication of this report. We also certify that no part of our compensation was, is, or will be directly or indirectly related to the specific recommendation(s) or view(s) in this report. Research Analyst or his/her relative or HDFC Securities Ltd. does not have any financial interest in the subject company. Also Research Analyst or his relative or HDFC Securities Ltd. or its Associate may have beneficial ownership of 1% or more in the subject company at the end of the month immediately preceding the date of publication of the Research Report. Further Research Analyst or his relative or HDFC Securities Ltd. or its associate does not have any material conflict of interest. Any holding in stock –No HDFC Securities Limited (HSL) is a SEBI Registered Research Analyst having registration no. INH000002475. Disclaimer: This report has been prepared by HDFC Securities Ltd and is meant for sole use by the recipient and not for circulation. The information and opinions contained herein have been compiled or arrived at, based upon information obtained in good faith from sources believed to be reliable. Such information has not been independently verified and no guaranty, representation of warranty, express or implied, is made as to its accuracy, completeness or correctness. All such information and opinions are subject to change without notice. This document is for information purposes only. Descriptions of any company or companies or their securities mentioned herein are not intended to be complete and this document is not, and should not be construed as an offer or solicitation of an offer, to buy or sell any securities or other financial instruments. This report is not directed to, or intended for display, downloading, printing, reproducing or for distribution to or use by, any person or entity who is a citizen or resident or located in any locality, state, country or other jurisdiction where such distribution, publication, reproduction, availability or use would be contrary to law or regulation or what would subject HSL or its affiliates to any registration or licensing requirement within such jurisdiction. If this report is inadvertently send or has reached any individual in such country, especially, USA, the same may be ignored and brought to the attention of the sender. This document may not be reproduced, distributed or published for any purposes without prior written approval of HSL. Foreign currencies denominated securities, wherever mentioned, are subject to exchange rate fluctuations, which could have an adverse effect on their value or price, or the income derived from them. In addition, investors in securities such as ADRs, the values of which are influenced by foreign currencies effectively assume currency risk. It should not be considered to be taken as an offer to sell or a solicitation to buy any security. HSL may from time to time solicit from, or perform broking, or other services for, any company mentioned in this mail and/or its attachments. HSL and its affiliated company(ies), their directors and employees may; (a) from time to time, have a long or short position in, and buy or sell the securities of the company(ies) mentioned herein or (b) be engaged in any other transaction involving such securities and earn brokerage or other compensation or act as a market maker in the financial instruments of the company(ies) discussed herein or act as an advisor or lender/borrower to such company(ies) or may have any other potential conflict of interests with respect to any recommendation and other related information and opinions. HSL, its directors, analysts or employees do not take any responsibility, financial or otherwise, of the losses or the damages sustained due to the investments made or any action taken on basis of this report, including but not restricted to, fluctuation in the prices of shares and bonds, changes in the currency rates, diminution in the NAVs, reduction in the dividend or income, etc. HSL and other group companies, its directors, associates, employees may have various positions in any of the stocks, securities and financial instruments dealt in the report, or may make sell or purchase or other deals in these securities from time to time or may deal in other securities of the companies / organizations described in this report. HSL or its associates might have managed or co-managed public offering of securities for the subject company or might have been mandated by the subject company for any other assignment in the past twelve months. HSL or its associates might have received any compensation from the companies mentioned in the report during the period preceding twelve months from t date of this report for services in respect of managing or co-managing public offerings, corporate finance, investment banking or merchant banking, brokerage services or other advisory service in a merger or specific transaction in the normal course of business. HSL or its analysts did not receive any compensation or other benefits from the companies mentioned in the report or third party in connection with preparation of the research report. Accordingly, neither HSL nor Research Analysts have any material conflict of interest at the time of publication of this report. Compensation of our Research Analysts is not based on any specific merchant banking, investment banking or brokerage service transactions. HSL may have issued other reports that are inconsistent with and reach different conclusion from the information presented in this report. Research entity has not been engaged in market making activity for the subject company. Research analyst has not served as an officer, director or employee of the subject company. We have not received any compensation/benefits from the subject company or third party in connection with the Research Report. HDFC securities Limited, I Think Techno Campus, Building - B, "Alpha", Office Floor 8, Near Kanjurmarg Station, Opp. Crompton Greaves, Kanjurmarg (East), Mumbai 400 042 Phone: (022) 3075 3400 Fax: (022) 2496 5066 Compliance Officer: Binkle R. Oza Email: [email protected] Phone: (022) 3045 3600 HDFC Securities Limited, SEBI Reg. No.: NSE-INB/F/E 231109431, BSE-INB/F 011109437, AMFI Reg. No. ARN: 13549, PFRDA Reg. No. POP: 04102015, IRDA Corporate Agent License No.: HDF 2806925/HDF C000222657, SEBI Research Analyst Reg. No.: INH000002475, CIN - U67120MH2000PLC152193 Mutual Funds Investments are subject to market risk. Please read the offer and scheme related documents carefully before investing.

IDEA CELLULAR : RESULTS REVIEW 2QFY18
Page | 12
HDFC securities Institutional Equities Unit No. 1602, 16th Floor, Tower A, Peninsula Business Park, Senapati Bapat Marg, Lower Parel, Mumbai - 400 013 Board : +91-22-6171-7330 www.hdfcsec.com