Embed Size (px)
Citation preview

INTERNATIONAL CONFERENCE ON2nd
SOCIAL SCIENCES & LAW
11-12 MAY 2016 ICSSL - AFRICA
PROCEEDINGBOOK 2016
BUSSINESADMINISTRATION

SPONSORS & COLLABORATORS

Publisher
NILE UNIVERSITYOF NIGERIA
EditorsDr. Ibrahim KELES
Dr. Umar Abbas IbrahimDr. Selman Tetik
DesignerBilal KELES
May 11-12, 2016Abuja, Nigeria
PROCEEDING BOOK2nd International Conference on Social Sciences and Law ( ICSSL 2016 )
May 11-12, 2016, Abuja-NIGERIA
Copyright © Nile University of Nigeria, 2016icss.nileuniversity.edu.ng - [email protected]
Organizing Committee
Scientefic and Review Committee
Prof. Dr. Huseyin Sert, Nile University Vice Chancelor, Honorary ChairmanProf. Dr. Abdurrahman Isik, ChairmanProf. Dr. Onder Aytac, AdvisorProf. Dr. Kemal Ozden, Public Relations and MediaProf. Dr. Osman Sahin, Financial Commitee CoordinatorAssoc. Prof. Ibrahim Keles, Scientific Review CoordinatorDr. Murat Akyuz, Logistical Arrangements ManagerDr. Gylych Jelilov, Collobration and ExhibitionDr. James Ile, Language EditorMr. Yasar Aktekin, Nile University General Secretary
Prof. Dr. Naim Kapucu, University of Central Florida, USAProf. Dr. Faruk Gursoy, Nile University of NigeriaProf. Dr. Benedict Akanegbu, Nile University of NigeriaProf. Dr. G.C. Nzelibe Nasarawa State UniversityProf. Dr. Gungor Turan, Epoka University, ALBANIAProf. Dr. Huseyin Kalyoncu, Nile University of NigeriaProf. Dr. Idris SANI, Nile University of NigeriaProf. Dr. Joseph Obansa, Abuja UniversityProf. Dr. Recai Pecen, Northern American University, USAProf. Dr. Sarah Anyanwu, Abuja UniversityProf. Dr. Teoman Duman, Burc University, BOSNIA HERZOGONIVAProf. Dr. Ali Yurtsever, American Islamic College, USAProf. Dr. Abdurrahman Isik, Nile University of NigeriaProf. Dr. Kemal Ozden, Nile University of NigeriaProf. Dr. Sammas Salur, Nile University of NigeriaProf. Dr. Osman Sahin, Nile University of NigeriaProf. Dr. Olaoye Anthony Ayodele, Nile University of NigeriaAssoc. Prof. Dr. Adam Akparan, Abuja UniversityAssoc. Prof. Dr. Nika Chitadze , International Black Sea University, GEORGIAAssoc. Prof. Dr. Metin Mercan, International Black Sea University, GEORGIAAssoc. Prof. Dr. Seth Akutson, Kaduna State UniversityAssoc. Prof. Dr. Nurettin Can, Nile University of NigeriaAssoc. Prof. Dr. Erkan Demirbas, Nile University of NigeriaAssoc. Prof. Dr. Ibrahim Keles, Nile University of NigeriaAssoc. Prof. Dr. Alparslan Toker, Nile University of Nigeria
1
Table of Contents
FOREWORD ................................................................................................................................. 3
THE EFFECTS OF MANAGING WORKFORCE DIVERSITY FOR SUSTAINABLE EMPLOYEE’S PERFORMANCE IN THE NIGERIA’S OIL AND GAS INDUSTRY ........................................................... 4
THE VALUE RELEVANCE OF FINANCIAL STATEMENTS IN NIGERIA MONEY DEPOSIT BANKS ........... 14
IMPEDIMENTS TO THE SURVEY RESEARCH METHOD IN THE ADMINISTRATIVE AND SOCIAL SCIENCES ................................................................................................................................... 25
THE DETERMINANTS OF E-COMMERCE ADOPTION FOR EMPLOYMENT GENERATION IN THE NIGERIAN SMALL AND MEDIUM SIZED ENTERPRISES .................................................................. 35
IMPACT OF AGRO-ALLIED VALUE CHAIN ON SUSTAINABLE DEVELOPMENT OF SMALL AND MEDIUM ENTERPRISES IN NIGERIA ............................................................................................................ 45
IMPACT OF MODIFIED SNAKES AND LADDERS LUDO GAME IN TEACHING ENTREPRENEURIAL-RELATED PERSONAL QUALITIES IN MIDDLE BASIC LEVELS ............................................................ 59
CAPITAL ACCUMULATION AND UNEMPLOYMENT IN NIGERIA ..................................................... 72
TRAINING EMERGING NEEDS OF STUDENTS IN BUSINESS EDUCATION ON BASIC COMPUTER MAINTAINANCE AS WAY FOR SUSTAINABLE DEVELOPMENT IN FEDERAL COLLEGE OF EDUCATION ZARIA. ....................................................................................................................................... 98
FACTORS AFFECTING AUDIT EXPECTATIONS GAP IN NIGERIA .................................................... 110
EFFECTS OF WORKING CAPITAL MANAGEMENT ON CORPORATE PROFITABILITY OF NIGERIAN PENSION FUND ADMINISTRATIONS .......................................................................................... 125
INSURGENCY AND BUSINESS ACTIVITIES IN NIGERIA ................................................................. 138
INTERNATIONAL BUSINESS AS A CATALYST FOR GLOBAL INTEGRATION IN SUB-SAHARA AFRICA 158
THE IMPACT OF HUMAN RESOURCE PLANNING (HRP) ON ORGANIZATION PERFORMANCE ....... 173
THE IMPACT OF SMALL AND MEDIUM SCALE ENTERPRISES IN NIGERIA: A CASE STUDY OF ABUJA MUNICIPAL AREA COUNCIL (AMAC) .......................................................................................... 190
EFFECTS OF ELECTRONIC BANKING SERVICE QUALITY ON CUSTOMER SATISFACTION ................. 203
IMPACT OF LEADERSHIP STYLES ON EMPLOYEE BEHAVIOUR IN FEDERAL INLAND REVENUE SERVICES (FIRS), A TAX ADMINISTRATION AGENCY IN NIGERIA ................................................. 219
INSTITUTIONAL CONFLICT ON THE PROTECTION OF AIR PASSENGERS RIGHTS IN NIGERIA: THE WAY FORWARD ............................................................................................................................... 238
EFFECTS OF DIFFERENTIATION STRATEGY ON FIRM PERFORMANCE IN NIGERIA ......................... 249
MSMES: PANACEA FOR ECONOMIC GROWTH IN NIGERIA ......................................................... 260

2
3
FOREWORD
Nigerian Turkish Nile University (NTNU) established first conference on social science on May 2015
aim of the conference help to bring up the true scientists, who base their study and research on true
reports, correct exposition, and scientific experiments. As a result, they have peace of mind and
solve their problems with ease. However these who do not know the truth are buffeted constantly
by changing aims and methods, and so are always disillusioned.
The 2 nd International Conference on Social Science and Law-Africa (ICSSL-Africa) was held at NTNU
in Abuja, Nigeria from May 11to 12 2016. The international conference focused on new advance in
research in the field of social sciences especially Business Administration, Finance and Accounting,
Economics, Political Science and International Relations, Law, Mass Communication and Public
Administration disciplines, and included representatives from academia, industry and government.
The invited speakers presented new and original unpublished data as well as ongoing controversies.
In order to close the gap between gown and town, beside the conference an Entrepreneurs Trade
Fair was organized. With the help of this fair not only academic side also real sector side of life were
included to this discussion as well.
ICSSL-Africa is organized in corporation with partner universities, companies and governmental and
non-governmental institutions. As we multicultural, multilingual and multidisciplinary we pride
ourselves on advancing the scholarly study of various scientific disciplines by encouraging and
facilitating excellence in academic research worldwide.
On behalf of the ICSSL-Africa conference organizers, I want to thank to partner universities, Meliksah
University, Turgut Ozal University and Fatih University, collaborators Abuja Chamber of Commerce,
Association of Investors and Businessmen of Turkey and Nigeria (ABINAT) and sponsors Zeberced
Group and Nizamiye Hospital. We hope that you enjoy reflecting and discussing the proceedings
with your colleagues.
Finally, ICSSL-Africa organizing committee decided to organize 3 rd ICSSL-Africa on May 10- 11 2017.
We are very happy to invite you to our university again next year.
On the behalf of the organizing committee
Assoc.Prof.Dr.Abdurrahman IŞIK
4
THE EFFECTS OF MANAGING WORKFORCE DIVERSITY FOR SUSTAINABLE
EMPLOYEE’S PERFORMANCE IN THE NIGERIA’S OIL AND GAS INDUSTRY
Nathaniel C. Ozigbo Ph.D
Department of Business Administration
University of Abuja
Abuja – Nigeria
E-mail: [email protected]
Mobile: +2348034739720
Abstract
This study examines the effects of managing workforce diversity for sustainable employee’s
performance in the Nigeria’s Oil and Gas Industry. The study is unique because it presents
empirical evidence to show that increasing diversity is associated with employee’s
performance. A critical review of the existing literature on diversity practices was undertaken
and conceptual framework was developed. The framework was intended to assist other
researchers identify key areas for further study and to guide practitioners to formulate and
implement diversity appropriately. The study noted that the key to diversity management
hinges on strategic thinking and people centered polices. Survey method was adopted and
questionnaire was distributed to a sample size of one hundred and eighty respondents. The
sampling technique adopted was convenience sampling and data obtained was analyzed being
descriptive statistics and SPSS software, version 22. The study found that there were different
kinds of diversity that one encounter at the work place which include diversity of gender, age,
psychology, education, language and culture. The study also pointed out barriers encountered
by employees for accepting work place diversity and clearly pointed out that organization
should take measures to manage diversity to harness and leverage the potential of employees
for competitive advantage. The result of the study indicated that diversity effects on
employee’s performance. We concluded that successfully managing workforce diversity
could lead to more committed, better satisfied and better financial performance.
Keywords: Workforce Diversity and Sustainable Employee’s Performance.
Introduction:
With increased globalization, managing workforce diversity has emerged as an important
issue in many organizations. These organizations pay attention to diversity management as a
potential competitive resource. Diversity not only involves how people perceive themselves,
but how they perceive others. These perceptions affect their interactions. It is a valuable asset
for any business that seeks a competitive advantage in the global economy.
Managing workforce diversity refers to a comprehensive managerial process for developing
an environment that works for all employees. Ellis and Sonnenfield (1994) argued that the
challenge of meeting the needs of a culturally diverse workforce and sensitizing workers and
managers have made effective management of diversity to become a pre-requisite in Human
Resource Management. Carrel (2006) observed that the way a company defines diversity and
manages its diverse workforce determine its effectiveness. This is highly dependent on
organizational leadership. Adler (2005) found that interesting diversity expand the breadth of
perspectives and ideas available to organizations in making decisions and that culture
diversity influences the range and depth of information use.
5
The growth of the Nigeria’s oil and gas industry has posed several challenges as diversity
management has become a natural phenomenon that has both negative and positive impacts
on employees performance. It is in this context that this study examines the effects of
workforce diversity management on employee performance in the Nigeria’s oil and gas
industry.
Statement of the Problem:
Various researchers on diversity management have consistently found that organization that
emphasizes collectivism in the work environment see more benefits of workforce diversity
than organizations that emphasizes individualism (Dwyes et al 2001). Diversity management
practices enhance productivity, effectiveness and sustained competitiveness and that
organizations that promote diverse workplace attract and retain quality employees and
increase customer’s loyalty. This section of the study focuses that failure to manage diversity
in terms of race, gender, level of education, profession, ethnic affiliation, religious affiliation
often leads to difference in promotion, pay, training, turnover, mutual acceptance, job
satisfaction and other forms of inequality in the Nigeria’s oil and gas industry. Hence,
managing diversity in the workforce should be a part of the culture of the entire organization.
The challenges that oil and gas industry of Nigeria face in promoting teamwork with
employees from diverse cultural background shows that there is much to be done in terms of
the improvement of workforce diversity management strategies.
Objectives of the Study:
The main objective of this study is to examine empirically whether and to what extent firm’s
competitiveness asserts in the long-term depends significantly on equal opportunities
regardless of gender in the oil and gas industry of Nigeria. In particular, we explore the effect
that an increase in the diversity of a workforce has an organizations level performance and
whether or not such equal opportunity working environment could help improve the
industry’s performance.
Other specific objectives include:
- Find the most important strategies to enhance workforce diversity.
- Find out ways to increase awareness about workplace diversity.
- Identify most frequently encountered barriers for accepting workplace diversity.
- Fill knowledge gaps identified from the previous studies.
Research Hypothesis:
Based on the objectives of this study, the following hypotheses were formulated to guide the
study:
1. H0: There is a significant difference between the performance of male and female
employees in the Nigeria’s oil and gas industry.
2. H0: There is a significant difference in the performance of employees on the basis
of the level of education.
6
Significance of the Study:
The findings of this study might be of great significance in offering guidelines to address the
current challenges in workplace diversity and ultimately enhance employee performance. The
study might assist the managers by expanding the literature in the management of workforce
diversity to improve employee performance for competitive advantage. It might enable
practicing managers in the oil and gas industry to remain relevant amidst the contemporary
challenges by putting in place programmes for managing workforce diversity and employing
strategies to get better employees performance. This study will be of immense benefit to the
industry by improving the benefits from unity in diversity, be it in terms of knowledge,
cultural, gender, racial among others. Also, the study might benefit the employees in terms of
improved interpersonal relationship mutual understanding and mutual acceptance of each
other regardless of the various differences.
Scope and Limitations of the Study:
The study covered the Nigeria’s Oil and Gas Industry located at Port-Harcourt, River State,
Nigeria. The study tackled areas of workforce diversity effects on employees performance
and how diversity can be managed so as to maximize the positive outcomes and minimize the
negative outcomes.
There exist some limitations inherent in the study. The sample size used was small and not a
truly representative of the industry as a whole and therefore, the results cannot be generalized
across the entire industry. This suggest prospects for further research. Moreover, there were
resistance from some of the respondents to participate in the study. Some respondents failed
to return back the questionnaire in good time. Some managers had no time for attending to all
the items in the questionnaire due to their tight schedule or high work load. All these were
taken into consideration and alternative measures were taken to overcome these limitations.
Review of Related Literature
Most studies in the developing countries have concentrated on survey data to examine the
concept of workforce diversity and the dimension of culture. One of the study found that the
perception of cultural orientation changes according to the grades, gender status and rank.
The study noted that the grading structure and ranking coupled with gender type play a
pivotal role with respect to setting of cultural orientation, while other studies found that
significant disagreement exists with respect to culture orientation among management
representatives from different ethnicities. Abbasi et al (2011) studies found that employees
love to work where managers are just and unbiased while dealing with subordinates.
Workforce diversity refers to the variety of differences between people in an organization.
That sounds simple, but diversity encompasses race, gender, ethnic group, age, personality,
cognitive style, tenure, organizational function, educational background and more. Diversity
involves not only how people perceive themselves but also how they perceive others. The
perceptions affect their interaction. Owing to the increasing workforce diversity which is
mainly the result of the management’s acknowledge of the fact that diverse workforce results
in innovative ideas and higher overall organizational efficiency, more and more organizations
are considering the diversity management techniques to maintain harmony among the
workers. Torres and Bruxelles (2007) posits that managing diversity means enabling the
diverse workforce to perform its full potential in an equitable work environment where no
one group has an advantage or disadvantages. Following the same line of argument, Alserhan
7
et al (2010) asserted that for an organization to succeed, its strategies should consist of
managing change, establishment of appropriate diversity management policies and
procedures and target diversity related competencies.
Rosen et al (1991) contend that the strategic process for managing workforce diversity
involves the following steps;
- Diagnosis of the current situation in terms of statistics
- Policy and culture and looking at both issues and causes
- Identifying the critical role of commitment from the top of the organization.
Gilbert et al (1999) asserted that to effectively manage diversity that an organization should
value diversity and change the organization to accommodate diversity and make it an integral
part of the organization. Ditomaso etal (2007) noted that theories and techniques of diversity
management have been developed and enthusiastically supported by a growing number of
managers, diversity consultants and academics, and that diversity can improve organizational
effectiveness. Camel etal (2006) noted that organizations that develop experience in and
reputations for managing diversity likely to attract the best personnel. Golden (2011) asserted
that diversity refers to the co-existence of employees from various socio-cultural
backgrounds within the company and that it requires a type of organizational culture in which
each employee can pursue his/her career aspirations without being inhibited by gender, race,
nationality, religion or other factors that are irrelevant to performance.
The practice of workforce diversity acknowledges the reality that people differ in many ways,
visible or invisible, marital status, social status and sexual orientation (Kosset et al 2005).
Hence, workforce diversity recognizes that people from different background could bring
fresh ideas and perceptions which can make the way work is done more efficient and make
products and services better. Managing diversity successfully help organizations to nurture
creativity and innovation and thereby to tap hidden capacity for growth and improved
competitiveness.
There is wide recognition of the values of workforce diversity. Research by the Australian
Centre of International Business (ACIB 2000) asserted that diversity improves the quality of
management’s decisions and provides innovative ideas and superior solutions to
organizational problems. Empirical evidence shows that firms that have effective diversity
management stand to benefit through bottom line returns. Managing diversity is premised on
recognition of diversity and differences as positive attributes of an organization rather than as
problems to be solved (Thompson 1997). Wilson and Iles (1999) found that a diverse solution
to brainstorming tasks, displays more co-operative behavior relative to homogenous groups
and could raise organizational efficiency, effectiveness and profitability. In addition,
managing diversity effectively could contribute to organizational success by enabling access
to a changing market place by mirroring increasing diversity markets (Cox and Blake, 1991).
Therefore, valuing diversity may become a source of competitive advantage, increase the
quality of organization life and ultimately be good for business (Cassell, 1996). From the
above assertions, it follows that the key to diversity management hinges on strategic thinking
and people centred policies. While diversity management is an approach that revolves around
employees’ attitudes at the workplace.
This study is unique because it presents empirical evidence testing whether increasing work
force diversity is associated with improved employee performance. Diversity management
8
does not only recognize but also values and harnesses workforce differences, such as
individual characteristics, orientations and religious beliefs so that individual talents are being
fully utilized and organizational goals are met. Diversity therefore is a set of conscious
practices that involve understanding and appreciating interdependence of humanity, cultures
and the natural environment. It involves not only how people perceive themselves, but also
how they perceive others. These perceptions affect their interactions, to create a positive
work climate. The leaders of the organization should work with staff in order to manage
diversity, this fosters and sustains staff motivation.
Adler (2005) empirical study on the effects of diverse recruitment policies on employee
performance found that diversity can improve performance and recruiting from a wider range
of age and ethnicity gives the firm a larger talent pool. He also found that increasing diversity
expands the breadth of perspectives and ideas available to organizations in making decisions.
Carrel (2006) noted that the reason of moving beyond affirmative action failed to deal with
the root causes of prejudices and inequality suppress the full potential of most employees.
Some scholars agreed that workforce diversity goes beyond issues of legal compliance and
moral responsibility (Skaggs etal 2004). They stated that it is crystal clear that discussing
diversity solely in terms of gender and race discrimination can lead to employee anger that
can influence morale, turnover and performance. However, organizations with a diverse
workforce can provide superior services because they can better understand customers’
needs. It follows that managing workforce diversity is a process intended to create and
maintain a positive work environment where the similarities and differences of individuals
are valued, so that all can reach their potential and maximize their contributions to an
organization’s strategic goals and objectives.
Methodology:
A questionnaire was developed by the researcher based on the objectives of the study.
Convenience sampling technique was used in this study as the sampling frame was irrelevant.
Questionnaire were distributed to the valid respondents and were requested to answer the
questions. The population of the study was set to all the workforce in the industry, equivalent
to 350 and the sample size was determined using Yaro Yemaro Formula;
N 350
n = 1 + N (e)2 = 1 + 350 (0.05)2
n = 187
Out of 187 sampled that were distributed with the questionnaire only seven could not
completely return the questionnaire, so 180 respondents (96.3%) were used for the study and
were requested to provide their opinion on the scale of 1 to 5, where
1 Strongly disagree (SD)
2 Disagree (D)
3 Neutral (N)
4 Agree (A)
5 Strongly Agree (SA)
Pilot test was conducted with eighteen respondents and the data were analyzed using
Statistical Package for Social Science (SPSS) software. The data from the pilot test for shown
in table 1.
9
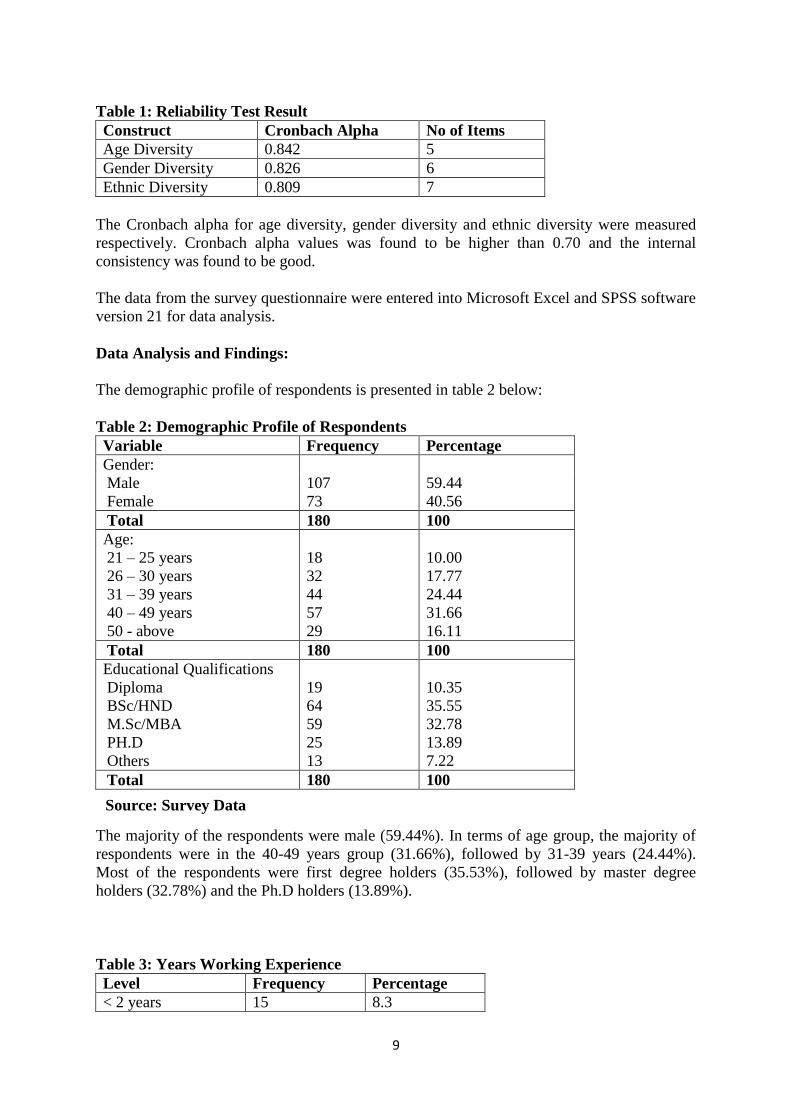
Table 1: Reliability Test Result
Construct Cronbach Alpha No of Items
Age Diversity 0.842 5
Gender Diversity 0.826 6
Ethnic Diversity 0.809 7
The Cronbach alpha for age diversity, gender diversity and ethnic diversity were measured
respectively. Cronbach alpha values was found to be higher than 0.70 and the internal
consistency was found to be good.
The data from the survey questionnaire were entered into Microsoft Excel and SPSS software
version 21 for data analysis.
Data Analysis and Findings:
The demographic profile of respondents is presented in table 2 below:
Table 2: Demographic Profile of Respondents
Variable Frequency Percentage
Gender:
Male 107 59.44
Female 73 40.56
Total 180 100
Age:
21 – 25 years
26 – 30 years
31 – 39 years
40 – 49 years
50 - above
18
32
44
57
29
10.00
17.77
24.44
31.66
16.11
Total 180 100
Educational Qualifications
Diploma
BSc/HND
M.Sc/MBA
PH.D
Others
19
64
59
25
13
10.35
35.55
32.78
13.89
7.22
Total 180 100
The majority of the respondents were male (59.44%). In terms of age group, the majority of
respondents were in the 40-49 years group (31.66%), followed by 31-39 years (24.44%).
Most of the respondents were first degree holders (35.53%), followed by master degree
holders (32.78%) and the Ph.D holders (13.89%).
Table 3: Years Working Experience
Level Frequency Percentage
< 2 years 15 8.3
Source: Survey Data
10
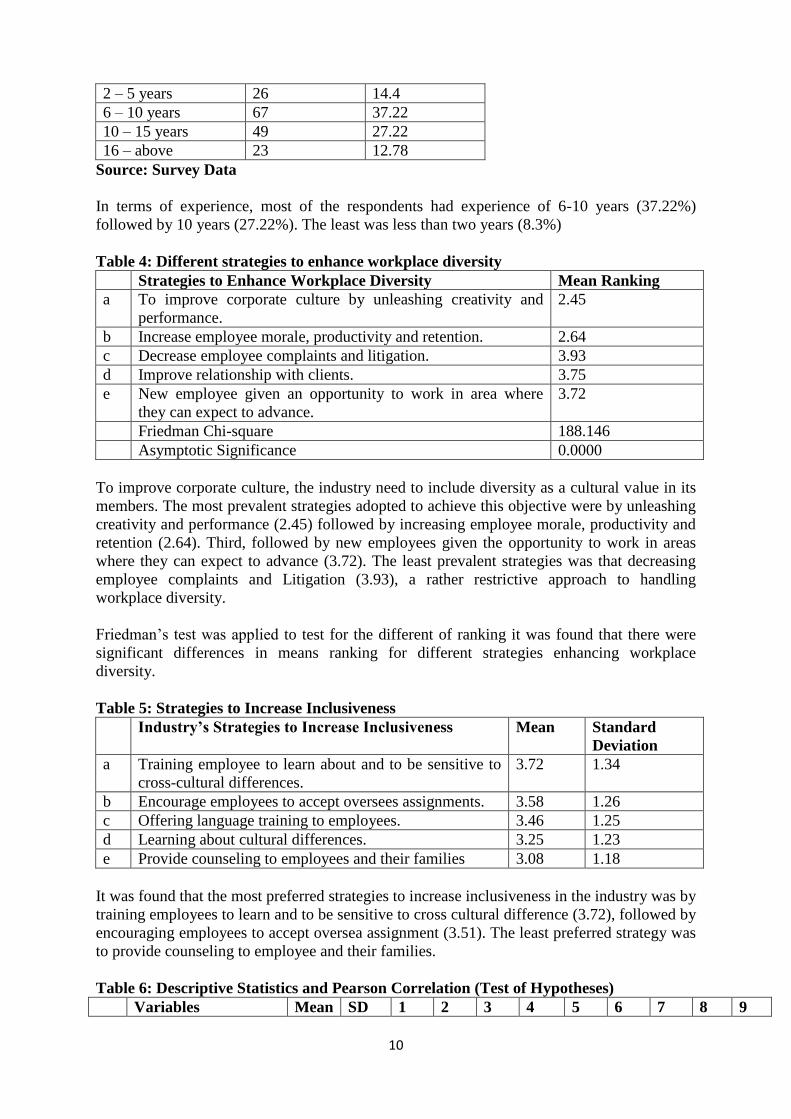
2 – 5 years 26 14.4
6 – 10 years 67 37.22
10 – 15 years 49 27.22
16 – above 23 12.78
Source: Survey Data
In terms of experience, most of the respondents had experience of 6-10 years (37.22%)
followed by 10 years (27.22%). The least was less than two years (8.3%)
Table 4: Different strategies to enhance workplace diversity
Strategies to Enhance Workplace Diversity Mean Ranking
a To improve corporate culture by unleashing creativity and
performance.
2.45
b Increase employee morale, productivity and retention. 2.64
c Decrease employee complaints and litigation. 3.93
d Improve relationship with clients. 3.75
e New employee given an opportunity to work in area where
they can expect to advance.
3.72
Friedman Chi-square 188.146
Asymptotic Significance 0.0000
To improve corporate culture, the industry need to include diversity as a cultural value in its
members. The most prevalent strategies adopted to achieve this objective were by unleashing
creativity and performance (2.45) followed by increasing employee morale, productivity and
retention (2.64). Third, followed by new employees given the opportunity to work in areas
where they can expect to advance (3.72). The least prevalent strategies was that decreasing
employee complaints and Litigation (3.93), a rather restrictive approach to handling
workplace diversity.
Friedman’s test was applied to test for the different of ranking it was found that there were
significant differences in means ranking for different strategies enhancing workplace
diversity.
Table 5: Strategies to Increase Inclusiveness
Industry’s Strategies to Increase Inclusiveness Mean Standard
Deviation
a Training employee to learn about and to be sensitive to
cross-cultural differences.
3.72 1.34
b Encourage employees to accept oversees assignments. 3.58 1.26
c Offering language training to employees. 3.46 1.25
d Learning about cultural differences. 3.25 1.23
e Provide counseling to employees and their families 3.08 1.18
It was found that the most preferred strategies to increase inclusiveness in the industry was by
training employees to learn and to be sensitive to cross cultural difference (3.72), followed by
encouraging employees to accept oversea assignment (3.51). The least preferred strategy was
to provide counseling to employee and their families.
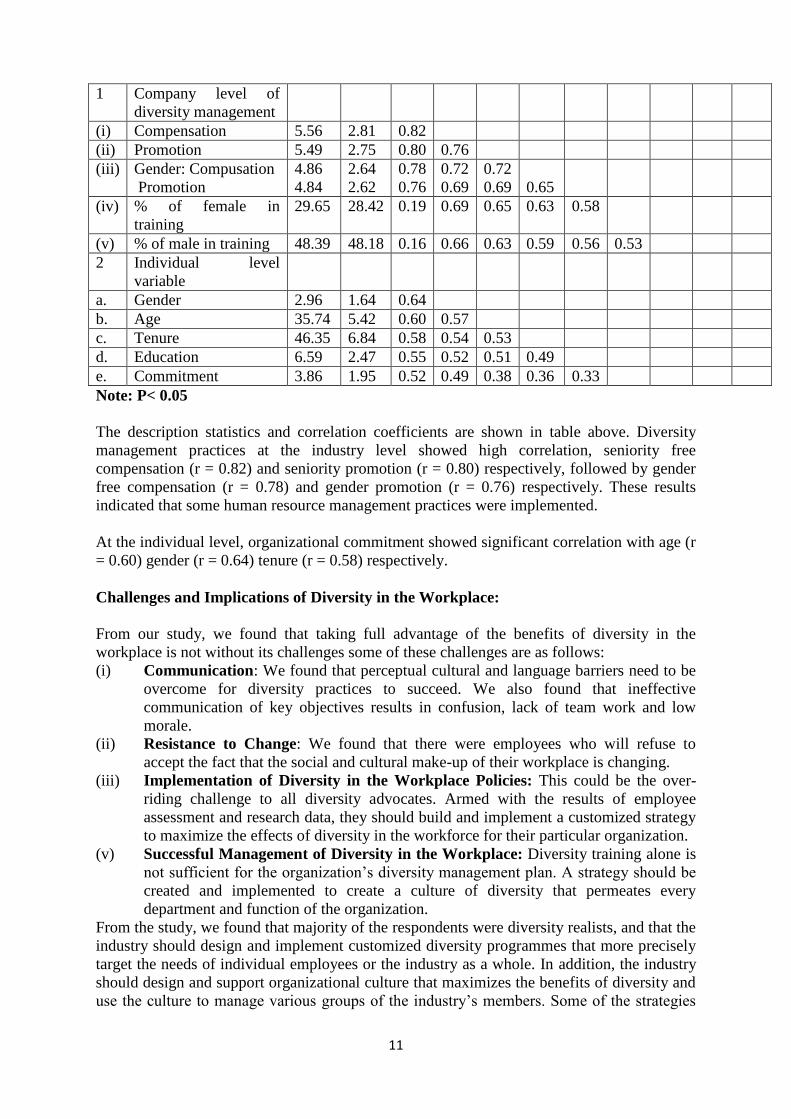
Table 6: Descriptive Statistics and Pearson Correlation (Test of Hypotheses)
Variables Mean SD 1 2 3 4 5 6 7 8 9
11
1 Company level of
diversity management
(i) Compensation 5.56 2.81 0.82
(ii) Promotion 5.49 2.75 0.80 0.76
(iii) Gender: Compusation
Promotion
4.86
4.84
2.64
2.62
0.78
0.76
0.72
0.69
0.72
0.69
0.65
(iv) % of female in
training
29.65 28.42 0.19 0.69 0.65 0.63 0.58
(v) % of male in training 48.39 48.18 0.16 0.66 0.63 0.59 0.56 0.53
2 Individual level
variable
a. Gender 2.96 1.64 0.64
b. Age 35.74 5.42 0.60 0.57
c. Tenure 46.35 6.84 0.58 0.54 0.53
d. Education 6.59 2.47 0.55 0.52 0.51 0.49
e. Commitment 3.86 1.95 0.52 0.49 0.38 0.36 0.33
Note: P< 0.05
The description statistics and correlation coefficients are shown in table above. Diversity
management practices at the industry level showed high correlation, seniority free
compensation (r = 0.82) and seniority promotion (r = 0.80) respectively, followed by gender
free compensation (r = 0.78) and gender promotion (r = 0.76) respectively. These results
indicated that some human resource management practices were implemented.
At the individual level, organizational commitment showed significant correlation with age (r
= 0.60) gender (r = 0.64) tenure (r = 0.58) respectively.
Challenges and Implications of Diversity in the Workplace:
From our study, we found that taking full advantage of the benefits of diversity in the
workplace is not without its challenges some of these challenges are as follows:
(i) Communication: We found that perceptual cultural and language barriers need to be
overcome for diversity practices to succeed. We also found that ineffective
communication of key objectives results in confusion, lack of team work and low
morale.
(ii) Resistance to Change: We found that there were employees who will refuse to
accept the fact that the social and cultural make-up of their workplace is changing.
(iii) Implementation of Diversity in the Workplace Policies: This could be the over-
riding challenge to all diversity advocates. Armed with the results of employee
assessment and research data, they should build and implement a customized strategy
to maximize the effects of diversity in the workforce for their particular organization.
(v) Successful Management of Diversity in the Workplace: Diversity training alone is
not sufficient for the organization’s diversity management plan. A strategy should be
created and implemented to create a culture of diversity that permeates every
department and function of the organization.
From the study, we found that majority of the respondents were diversity realists, and that the
industry should design and implement customized diversity programmes that more precisely
target the needs of individual employees or the industry as a whole. In addition, the industry
should design and support organizational culture that maximizes the benefits of diversity and
use the culture to manage various groups of the industry’s members. Some of the strategies
12
that lead to inclusiveness that could be practiced systematic learning about cultural
differences and the way business is conducted. By implementing these strategies, the industry
could improve employees ability to work with diverse others with cultural differences from
their own. This is likely to increase inclusiveness in the industry.
Conclusion:
The growth in the Nigeria’s oil and gas industry posed several challenges which has both
negative and positive effects on employee’s performance. Workforce diversity refers to the
way that people differ that can affect a task or relationship within an organization. It is about
understanding each other and moving beyond simple tolerance within each individual within
the organization. The results of the study provide considerable insight on diversity
management practices. Most of the employees were positive workplace diversity (diversity
optimists). The major strategies adopted by the industry to increase inclusiveness was by
training employees to be sensitive to cross-cultural differences, encouraging employees to
accept overseas assignments. The study clearly emphasizes that the industry should take
measures to manage diversity to harness and leverage the potential of employees for
competitive advantage.
In addition, we found that the organizations that adopt workforce diversity encourages better
employee retention, increased productivity, better moral, expanded market share and
improved customer service.
This study and other studies share the view that workforce diversity is very pivotal for the
organizations irrespective of their domain. There have been some good signs of improvement
in workforce diversity indicators in the Nigeria’s oil and gas industry. However, there is still
a lot to be done to be competitive in the comity of other oil and gas industries world wide.
References
1. Abbasi, Z. and Channer, Z.A (2011) Gender Discrimination in Workforce and Its Impact
on the Employee, Pakistan Journal of Commerce, Social Sciences 5 (1): 177-191.
2. Adler, N.J. (2005) Cultural Synergy: Managing the Impact of Cultural Diversity, London,
Saga Publications.
3. Al-Lamki, S.M (2002) Orientations: The essential ingredient in cross-cultural
management, International Journal of Management, 19, pp. 568.
4. Alserhan, B.A, Forstenlechner, I, and Al-Nakeeb, A. (2010) Employees attitudes towards
diversity in a non western context, Employee Relations Journal 32(1) Emerald Group
Publishing Limited.
5. Australian Centre for International Business (ACIB) (2000). The International Business
Case for Diversity Management Program for the Practice of Diversity Management, Dept.
of Immigration and Multi-Cultural Affairs in Cooperation with the Australian Centre for
International Business.
6. Carrel, M.R (2006) Defining Workforce Diversity Programs and Practices in
Organizations: A Longitudinal Study, Labour Law Journal, Spring, Retrieved from
http/www.emeraldinsight.com.
7. Cassell, C. (1996) “A Fatal Attraction? Strategic HRM and the Business Case for
Women’s Progression” Personnel Review, 25 (5): 51-66.
8. Chang, E. (2005) Employees overall perception of HRM effectiveness, Human Relation
58:523-544.
13
9. Cox, T. and Blake, S. (1991) “Managing Cultural Diversity: Implications for
Organizational Competitiveness” Academy of Management Executive. 5 (3): 45-56.
10. Di Tomaso, N. Corinne, P. and Rochelle, P. (2007) Workforce diversity and inequality:
Power status and numbers, Annual Review of Sociology 33:473-501.
11. Dwyer, S., Richard, O., and Chadwick K. (2001) Gender Diversity in Management and
Firm Performance: The Influence of Growth Orientation and Organizational Culture”,
Journal of Business Research, 55:1-11.
12. Ellis, C., and Sonnenfied, J.A. (1994) Diverse Approach to Managing Diversity, Human
Resources Management Journal, 33 (1) Emerald Publications Limited.
13. Graen, G.B (ed.) (2003) Dealing with Diversity, A Volume in Linx Leadership, The
Series, U.S.A Information Age Publishing.
14. Golden, Lonnie (2011) The Effects of Working Time on Productivity and Firm
Performance: A Research Synthesis Paper Conditions of Work and Employment Series,
No. 33 Geneva International Labour Office.
15. Greenberg, J. (2004) Workplace Diversity: Benefits, Challenges and Solutions. Alpha
Measure, INC Retrieved from http/www.alphameasure.com.
16. Kossek, E.E., Lobel, S.A, and Brown, A.J. (2005) “Human Resource Strategies to
Manage Workforce Diversity” In handbook of work place diversity (els) A.M. Konrad, P.
Prasad and J.M. Pringle Thousand Oaks, C.A. Sage, pp. 54-74.
17. Thompson, N. (1997) Anti-Discriminatory Practice, Basingstake, Macmillan.
18. Wilson, E.M and Iles, P.A (1999) “Managing Diversity: An Employment and Service
Delivery Challenge. The International Journal of Public Sector Management 12 (1) 27-49.
19. Skaggs, S.L and Di Tomaso, N. (2004) Understanding the Effects of Workforce Diversity
on Employment Outcomes: A Multi-disciplinary and Comprehensive Framework, Paper
presented at the annual meeting of the American Sociological Association, Hilton, San
Francisco, Retrieved from http//www.allacademic.com.
20. Torres, H. and Bruxelles, S.M (2007) Critical Review of Literature on Work Force
Diversity. In Gori Henry and Agolla, J., Evans University of Botswana, Botswana.
21. Rosen, B. and Lovelace, K. (1991) Piecing together the diversity puzzle, H.R Magazine
36 (9).
14
THE VALUE RELEVANCE OF FINANCIAL STATEMENTS IN NIGERIA MONEY
DEPOSIT BANKS
Atu, Gina Oghogho1, Dr. Atu, O. O. Kingsley2 Kasimu Abudu3
1Department of Accounting, Veritas University, Abuja 2 Department of Accounting, Igbinedion university, Okada 3Department of Banking and Finance, University of Benin
Presenting author: [email protected]
Abstract
Published Accounting Reports- statement of Financial Position, Statement of Comprehensive
Income and other statements are prepared for the use of investor, creditor and others whom
the business is not in direct contact with, it is therefore difficult for them to determine which
statement they find useful. Against this background, this research paper will take a critical
evaluation at the extent to which book value of equity, operating cash flow, earnings per
share and instrument disclosures in financial statements capture information needed by
investors for decision making. In order to provide solution to the above, a sample of fifteen
Deposit Money Banks quoted on the Nigeria Stock Exchange between 2009 and 2014 will be
used. Panel data analysis will be use and the hypotheses formulated for the study will be
tested using Pooled Least Squares estimation technique with the aid of the Statistical Package
for Social Sciences, (SPSS Version 16) and Eviews 8.0. The Aprori expectation will be that
the financial related variables such as book value, earnings as represented by earnings per
share, cash flows and instrument disclosures are all value relevant variable and that operating
cash flow and book value will be more significant than earnings per share and instrument
disclosure.
Keywords: Value relevance, Earnings and Instrument disclosure
1.0 INTRODUCTION
In recent times, the value relevance of financial information has been of significant concern
to researchers. Value relevance is one of the basic attribute of quality of the financial
statements. High quality accounting information is a pre-requisite for well functioning capital
markets and economy as a whole and as such should be of importance to investors,
companies and accounting standard setters (Hellstron, 2005).
Accordingly, Accounting Statements are the means of communicating to Investors who are
not in a position to directly access the performance of the company in which they are
intended to invest. They usually depend on the financial statements prepared by the
management of the company. Rational investors use those financial reports and disclosures,
among other publicly available information to assess the risk and the value of the firm.
Amongst these reports include the Balance Sheet, Income statement, Cast Flow statement,
and notes to the account amongst others. Therefore, if the preparers of accounting reports
embellish the truth, many unsuspecting investors may suffer. In today’s global market,
thousands of stakeholders knows little or nothing at all about the affairs of the company
except to depend on the information contained in the accounting statements issued
periodically by its management. (Ranjani & Karunarathne, 2006) This paper studies the
association between decision making and the quality disclosure of financial components,
timeliness of financial report and the fair value estimate of investment in financial security.
15
1.1 STATEMENT OF THE RESEARCH PROBLEM
Financial statements and mandatory financial reporting are prominent sources of information
for financial statement users in decision making. Financial statements must have certain
attributes to be useful: understandable, reliable, relevant, and comparable. The quality of data
that financial statements provide is usually checked in accordance with those attributes of
statements.(Rabia & Mahmut, 2011). High-quality information is essential to the proper
functioning of equity markets, financial markets, and financial decisions making (Shaw,
2003). In order to be functional, financial information gathered out of financial statements
must be of relevance to its users.
As mentioned in the Literature Review, there are a number of international studies on value
relevance of financial statements’ information that have been conducted and the most of them
are based on developed and efficient capital markets in the world, i.e. United States, U.K,
Tokyo, Hong- Kong, Singapore and others. However, the findings of those researchers are
different from each other as well as inconclusive .Among the available published researches,
the researcher is not aware of any that has examine the value relevance of financial
statements as it relates to book value of equity, operating cash flow, earnings per share and
instrument disclosures in Money Deposit Banks in Nigeria in particular. Therefore, this study
fills the gap in literature by investigating the value relevance of financial information in
relation to book value of equity, operating cash flow, earnings per share and instrument
disclosures in Nigeria Money Deposit Banks.
1.2. OBJECTIVES OF THE STUDY
The main objective of this study is to examine the value relevance of financial statements in
Nigeria. The specific objectives are to:
1. Examine the extent to which book value of equity in Nigeria money deposit banks
capture or summarize the necessary information needed by investors to base their
decision on whether to invest or not.
2. Examine the extent to which operating cash flow in Nigeria money deposit banks
capture or summarize the necessary information needed by investors to base their
decision on whether to invest or not
3. Examine the extent to which earnings per share in Nigeria money deposit banks
capture or summarize the necessary information needed by investors to base their
decision on whether to invest or not
4. Examine the extent to which instrument disclosures in Nigeria money deposit banks
capture or summarize the necessary information needed by investors to base their
decision on whether to invest or not
1.3. RESEARCH HYPOTHESES
In this study, four (4) hypotheses have been constructed to form pivot for which possible
answers are to be provided:-
H01: Book value of equity in Nigeria money deposit banks do not capture or summarize the
necessary information needed by investors to base their decision on whether to invest or not
H02: Operating cash flow in Nigeria money deposit banks do not capture or summarize the
necessary information needed by investors to base their decision on whether to invest or not
16
H03: Earnings per share in Nigeria money deposit banks do not capture or summarize the
necessary information needed by investors to base their decision on whether to invest or not
H04: Instrument disclosures in Nigeria money deposit banks capture or summarize the
necessary information needed by investors to base their decision on whether to invest or not
1.4 SCOPE OF THE STUDY
The study aims at ascertaining whether or not accounting statements have been able to
perform all functions they were intended for and the extent to which they have been able to
add value to users of accounting information in making informed decision. The assessment of
this study was limited to data collected from Fifteen (15) Money deposit Banks listed on the
Nigeria Stock.
LITERATURE REVIEW
2.1 THE CONCEPT OF VALUE RELEVANCE
Value relevance is the association between accounting amount and security market values,
Karunarathne, Wuhan & Rajapakse (2010). Basically, from the perspective of an
actual/potential equity investor, it is desirable that a firm’s financial statement information is
general and accounting information in particular is usable in generating indications of equity
value. Accrual accounting is designed to measure performance over past periods; however,
while accrual accounting mostly deals with history, valuation is about the future, Nilsson
(2003).
According to Traditional valuation theory based on economic theory, the value of a stock is
equal to the present value of the future net dividends. Hence, the principal purpose of
accounting is not to facilitate valuation. The trade off between the relevance and reliability
principles is also likely to influence the value relevance of accounting information. For
example, the historical cost basis of accounting is firmly reliable, but historical costs might
lack relevance, Scott (2003). Furthermore, the abandonment of the relevance-recognition
principles might increase the relevance of accounting information but it would surely result in
decreased reliability. Thus, the reliability principle is one of the main reasons why financial
statements lack forward looking information that influence market values, Kothari (2001)
2.2. THE INFORMATION VIEW OF VALUE RELEVANCE
This study will be based on the information view of value relevance propounded by Francis
and Shipper 1999. According to this view point of value relevance, Accounting information
is value relevant, if it is used by investors when setting prices, Francis et al (1999). Basically,
under the assumption of a efficient stock market, statistical association measures are used as
indicators as to whether investors actually utilize the information in question when making
investment decisions. In addition, this approach implies that value relevance is measured in
terms of market reactions to new information. In other works, accounting information has
value relevance if the stock market react upon the disclosure of it. It is worthy of note that
researchers that adopt this approach typically refer to the accounting figures as having
“information content”. Instead of using the term “Value Relevance.
2.3. REVIEW OF RELATED LITERATURE
17
The review of previous literature on value relevance can be summarized into the following
sub headings:-
2.3.1. VALUE RELEVANCE OF EARNINGS
The value relevance is one of dominated factor in the past studies. Previous studies that
reviled earning and cash flows in terms of their information content found that each measure
provided incremental information when used in the conjunction with other. According to the
Dechow (1994) earnings displayed a stronger association with returns than the cash flows.
Further Dechow proposed that when a firm is experiencing changes in working capital
requirement, investing and financing activities, cash flows may have severe matching and
timing problems and as such would be less able to reflect performance. Cheng, Liu &
Schaefer (1996) found that both earnings and earning changes are value relevant. They use
both levels and changes to investigate the effect of earnings performance on the information
content of cash flows. They suggest that market looks to cash flows as an alternative source
of information if inadequacies are provided in the earnings number.
2.3.2. VALUE RELEVANCE OF BOOK VALUE
Gee-Jung & Kwon (2009) conducted an empirical research to investigate the relative and
incremental value relevance of book value, earnings and cash flows in security prices in
Korean stock market using the period of 1994 to 2005. They states that book value is the
most value relevant variable and cash flows have more value relevance than earnings. Further
it states that combine value relevance of book value and cash flows is more value relevant
than that of book value and earnings. Collins, Maydew & Weiss (1997) suggest that using
book value of equity to evaluate firm with small size, intangible intensities and reporting
negative earnings is more appropriate than using earnings in the light of investors’ point of
view. Further they document the relative value tradeoff between earnings and book value
coefficients when earnings are negative. This relationship is found to persist even after size,
risk and earnings persistent are taken in to account. Chen, Chen & Su (2001) suggest that
earnings and that value relevance shifts to book value for firms with negative earnings.
2.3.3. VALUE RELEVANCE OF CASH FLOWS
Cash flows measures are expected to provide value relevant information about the firm’s
growth opportunities, or lack thereof. Operating cash flows provide information about the
firm’s ability to continue to cover cash needs internally. Investing cash flows provide
information about the liquidation value of a firm’s existing assets and about its capital
expenditure. Financial cash flows provide value relevant information about the firm’s
financing activities. Black (1998) studies the relative value relevance of earnings and cash
flow measure in different life cycle stages. They found that cash flows are expected to be
more value relevant in the stages characterized by growth and/ or uncertainty. Earnings are
predicted to be more value relevance in maturity stage.
2.3.4. VALUE RELEVANCE AND DISCLOSURE
Mohamat & Norman (2010) investigates the value relevance of financial instruments
disclosure in Malaysia based on MASB24 (Financial Instruments: Disclosure and
Presentation) standard. The study examines the association between disclosure quality of
financial instruments information and fair value information and the market price of firms.
18
Disclosure quality is measured based on disclosure index developed according to the
MASB24 disclosure requirements, and analyzed using the multiple regression. Results
indicate that disclosure quality of financial instruments information is value relevant to
investors. Barth (1994) is among the pioneer in the value relevance studies. Her study, Barth
(1994), investigates how disclosed fair value estimates of banks’ investment securities and
securities gains and losses (based on those estimates) are reflected in share prices in
comparison with historical costs. The sample comprises the US banks whose financial
statement data are available on the 1990 Compustat Annual Bank Tape. The data was
collected for the period 1971-1990. Using measurement error and earnings capitalization
models, Barth reports that i) fair value estimates of investment securities provide significant
explanatory power beyond that provided by historical costs, ii) historical costs provide no
significant explanatory power incremental to fair value, iii) fair values of investment
securities are found to have less measurement error than historical costs vis-a-vis the amount
reflected in share prices and iv) fair values securities gains or losses have no significant
incremental explanatory power.
Nasear, Yasser & Bayan (2009) investigate the perception of users regarding the availability,
adequacy, and usefulness of information disclosed in the financial reports of companies listed
on the Palestine Securities Exchange (PSE). A survey methodology was utilized involving a
selected sample of information users, i.e., individual and institutional investors, analysts,
academics, and intermediaries. Results of the study demonstrated that users perceive reported
information as neither adequate nor relevant to investment decisions. In particular, reported
information was insufficient, as listed companies did not comply with the minimum
disclosure requirements of international standards. This unfavorable perception, along with
poor credibility and bad timeliness of the disclosures, has prevented information from being
impounded into stock prices.
3.0. METHODOLOGY
3.1. SAMPLE AND DATA COLLECTION
The paper obtains all necessary data from the Colombo Stock exchange. These data sets span
the 5 year period from 2010 to 2014. The sample is consisting of 15 money Deposit Banks
listed on the Nigeria Stock exchange. Panel data analysis was used due to the fact that the
data span over a number of years and the hypotheses formulated for the study was tested
using Pooled Least Squares estimation technique with the aid of Eviews 8.0.
3.2. MODEL SPECIFICATION
The model used for the study is specified as follows:
VRFS = f(BVE, OCE, EPS, and IND) ........................................................ (1)
Where
VRFS = value relevance of financial statement.
BVE = book value of equity.
OCE = operating cash flow.
EPS = earnings per share.
IND = instrument disclosure.
Econometrically specified as follow
VRFSit = α0 + β1BVEit + β2OCEit + β3EPSit + β4INDit + ɛit.......................... (2)
Where
19
ɛ = the error term.
t = current period values
i = series from period one to period n.
The a priori expectations are as follows
α0, β1, β2, β3, β4 > 0.
That is there is a positive relationship between all the independent variables and the
dependent variable.
4.0. EMPIRICAL RESULTS
4.1. HYPOTHESIS TESTING
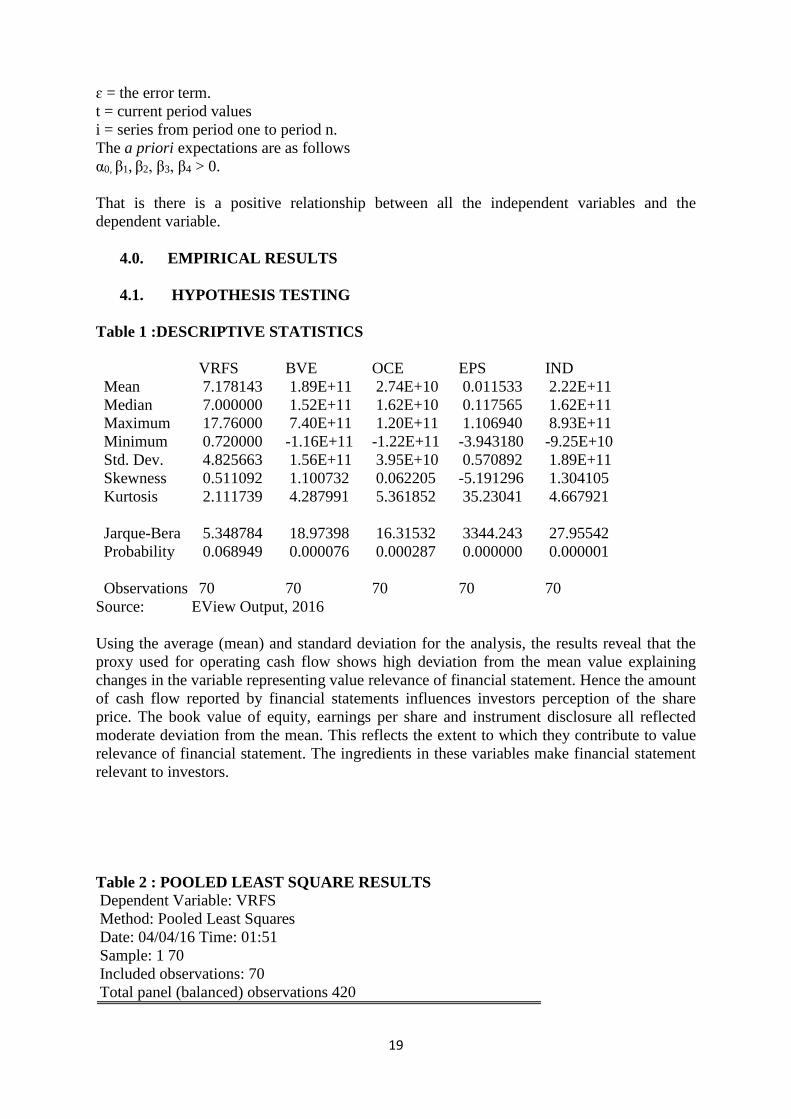
Table 1 :DESCRIPTIVE STATISTICS
VRFS BVE OCE EPS IND
Mean 7.178143 1.89E+11 2.74E+10 0.011533 2.22E+11
Median 7.000000 1.52E+11 1.62E+10 0.117565 1.62E+11
Maximum 17.76000 7.40E+11 1.20E+11 1.106940 8.93E+11
Minimum 0.720000 -1.16E+11 -1.22E+11 -3.943180 -9.25E+10
Std. Dev. 4.825663 1.56E+11 3.95E+10 0.570892 1.89E+11
Skewness 0.511092 1.100732 0.062205 -5.191296 1.304105
Kurtosis 2.111739 4.287991 5.361852 35.23041 4.667921
Jarque-Bera 5.348784 18.97398 16.31532 3344.243 27.95542
Probability 0.068949 0.000076 0.000287 0.000000 0.000001
Observations 70 70 70 70 70
Source: EView Output, 2016
Using the average (mean) and standard deviation for the analysis, the results reveal that the
proxy used for operating cash flow shows high deviation from the mean value explaining
changes in the variable representing value relevance of financial statement. Hence the amount
of cash flow reported by financial statements influences investors perception of the share
price. The book value of equity, earnings per share and instrument disclosure all reflected
moderate deviation from the mean. This reflects the extent to which they contribute to value
relevance of financial statement. The ingredients in these variables make financial statement
relevant to investors.
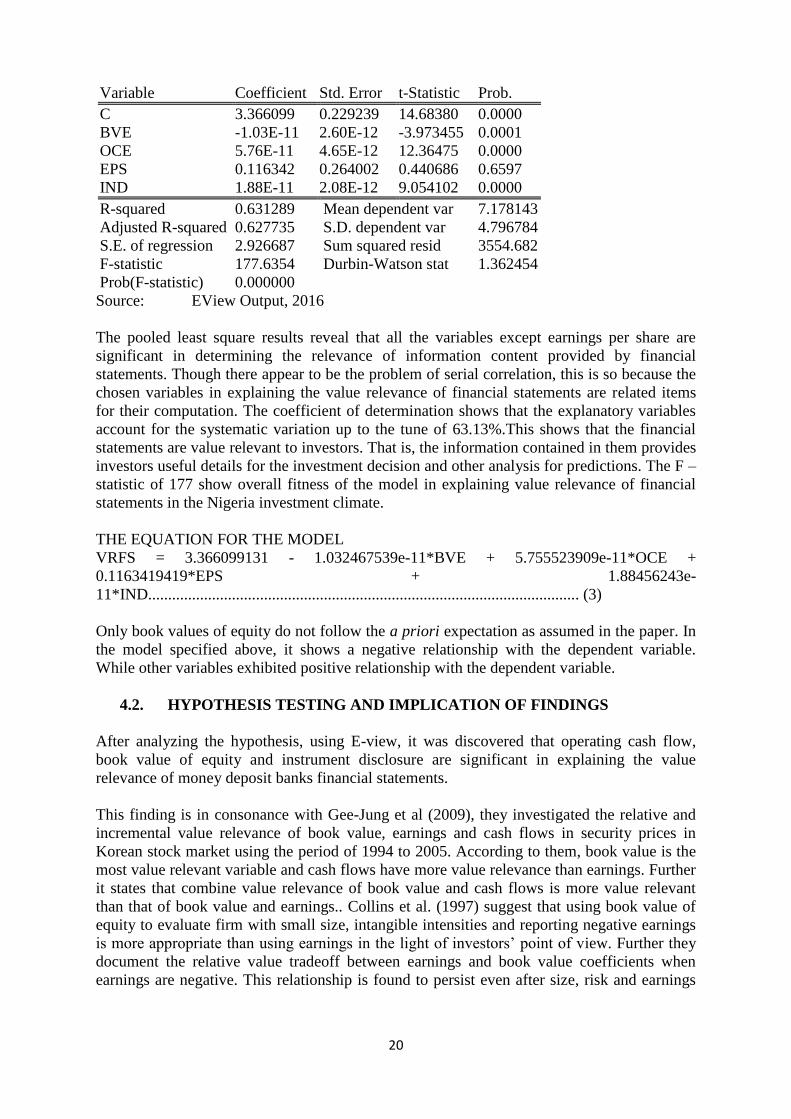
Table 2 : POOLED LEAST SQUARE RESULTS
Dependent Variable: VRFS
Method: Pooled Least Squares
Date: 04/04/16 Time: 01:51
Sample: 1 70
Included observations: 70
Total panel (balanced) observations 420
20
Variable Coefficient Std. Error t-Statistic Prob.
C 3.366099 0.229239 14.68380 0.0000
BVE -1.03E-11 2.60E-12 -3.973455 0.0001
OCE 5.76E-11 4.65E-12 12.36475 0.0000
EPS 0.116342 0.264002 0.440686 0.6597
IND 1.88E-11 2.08E-12 9.054102 0.0000
R-squared 0.631289 Mean dependent var 7.178143
Adjusted R-squared 0.627735 S.D. dependent var 4.796784
S.E. of regression 2.926687 Sum squared resid 3554.682
F-statistic 177.6354 Durbin-Watson stat 1.362454
Prob(F-statistic) 0.000000
Source: EView Output, 2016
The pooled least square results reveal that all the variables except earnings per share are
significant in determining the relevance of information content provided by financial
statements. Though there appear to be the problem of serial correlation, this is so because the
chosen variables in explaining the value relevance of financial statements are related items
for their computation. The coefficient of determination shows that the explanatory variables
account for the systematic variation up to the tune of 63.13%.This shows that the financial
statements are value relevant to investors. That is, the information contained in them provides
investors useful details for the investment decision and other analysis for predictions. The F –
statistic of 177 show overall fitness of the model in explaining value relevance of financial
statements in the Nigeria investment climate.
THE EQUATION FOR THE MODEL
VRFS = 3.366099131 - 1.032467539e-11*BVE + 5.755523909e-11*OCE +
0.1163419419*EPS + 1.88456243e-
11*IND............................................................................................................ (3)
Only book values of equity do not follow the a priori expectation as assumed in the paper. In
the model specified above, it shows a negative relationship with the dependent variable.
While other variables exhibited positive relationship with the dependent variable.
4.2. HYPOTHESIS TESTING AND IMPLICATION OF FINDINGS
After analyzing the hypothesis, using E-view, it was discovered that operating cash flow,
book value of equity and instrument disclosure are significant in explaining the value
relevance of money deposit banks financial statements.
This finding is in consonance with Gee-Jung et al (2009), they investigated the relative and
incremental value relevance of book value, earnings and cash flows in security prices in
Korean stock market using the period of 1994 to 2005. According to them, book value is the
most value relevant variable and cash flows have more value relevance than earnings. Further
it states that combine value relevance of book value and cash flows is more value relevant
than that of book value and earnings.. Collins et al. (1997) suggest that using book value of
equity to evaluate firm with small size, intangible intensities and reporting negative earnings
is more appropriate than using earnings in the light of investors’ point of view. Further they
document the relative value tradeoff between earnings and book value coefficients when
earnings are negative. This relationship is found to persist even after size, risk and earnings
21
persistent are taken in to account. Chen et al. (2001) suggest that earnings and that value
relevance shifts to book value for firms with negative earnings.
Also the findings from our research as earlier explained showed that instrument disclosure is
significant in explaining the value relevance of firms financial statements. This is in line with
the study of Mohamat et al (2010) who investigated the value relevance of financial
instruments disclosure in Malaysia based on MASB24 (Financial Instruments: Disclosure
and Presentation) standard. Results indicate that disclosure quality of financial instruments
information is value relevant to investors. But went contrary to that of Nasser, et al (2009)
who investigated the perception of users regarding the availability, adequacy, and usefulness
of information disclosed in the financial reports of companies listed on the Palestine
Securities Exchange (PSE). A survey methodology was utilized involving a selected sample
of information users, i.e., individual and institutional investors, analysts, academics, and
intermediaries. Results of the study demonstrated that users perceive reported information as
neither adequate nor relevant to investment decisions. In particular, reported information was
insufficient, as listed companies did not comply with the minimum disclosure requirements
of international standards. This unfavorable perception, along with poor credibility and bad
timeliness of the disclosures, has prevented information from being impounded into
1. Earnings per share appear not to be significant in explaining the value relevance of
financial statements of money deposit banks in Nigeria. This may be because the
information content of earnings per share may not reflect the financial viability of the
firm as some information may over shoot the true profit of the firm there by affecting
the actual value of earnings per share.
This is in consonance with Gee-Jung et al (2009), according to them, book value is the most
value relevant variable and cash flows have more value relevance than earnings in security
prices in Korean stock market from the period of 1994 to 2005. Also Charitou (1997) stated
that operating cash flow data has information content for stock returns and provide evidence
regarding the information content of cash flows beyond earnings. But the finding went
contrary to that of Ranjani, Wuhan & Karunarathne (2010), in their attempt to find out the
value relevant variables among the financial related variables such as book value, earnings,
cash flows and firm size in a company and also to identify the most significant value relevant
variables among the financial related variables by selecting 100 companies in the Colombo
stock exchange over a period of 5 years from 2004 to 2008 using pooled time regression
analysis to analyze the data, found out that Earnings per share , cash flow and net book value
are all value relevant variable. But when the data was run by stepwise regression to determine
the best model it was discovered that only earnings per share is of value relevant for
determining stock prices. While Nicolas & John (2012) in their research of how earnings and
book value, affect the share price of 167 Greek listed companies for the period 1995 - 2009
using the Ohlson 1995 model, found out that book value and the earnings are value relevant
and can explain the share price in the same degree.
In general, the variables reflected in financial statement of firms have information content
useful for many participants in the capital market and the economy at large. Hence, the value
relevance of financial statement of money deposit banks in Nigeria.
5.0. CONCLUSIONS AND RECOMMENDATIONS
5.1. CONCLUSION
22
Accounting regulators have placed value relevance as the primary attribute of financial
information. Despite several attempts, no specific conceptual framework has been established
which operationalises this aspiration. Empirical works to date has attempted to evaluate the
value relevance of the earnings, book value and cash flows and financial disclosure (Dechow,
1994; Collins et al 1997; Ranjani et al, 2006; Francis et al, 2002, e.t.c.) but little or non
related such accounting variables to money deposit banks as this research did. The results
shows that operating cash flow, book value of equity and instrument disclosure are significant
in explaining the value relevance of firms financial statements. The findings of this research
was in line with a number of other researcher like (Mohamat et al 2010; Naser, et al 2009;
Gee-Jung et al 2009; Ranjani et al 2006 and 2010 and Collins et al 1997 e. t.c ).
Therefore it can be inferred that effective decision making can be boost through reliable
financial information. Without confidence in financial information, investors will not invest
adequately on the shares of quoted companies in Nigeria. The accounting preparers and
standard setters should enhance the quality of financial statements because it received
attention of most investors.
5.2. RECOMMENDATIONS BASED ON THE STUDY
Generally, the main objective of financial statements according to the International
Accounting Standard Board is to provide information about the financial position,
performance and changes in financial position of an entity. Therefore, financial statements
are satisfactory only when they provide as much useful and unambiguous information as
possible. Based on the findings of this study, the following are some of the measures
recommended by the researchers:
1. Preparers and compliers of financial statements should ensure that financial
statements published should satisfy the needs of all class of users rather than
concentrating on a single or selected class.
2. If financial statements have to be prepared on historical cost basis (for enhanced
reliability), additional information should be provided on an estimate of the balance of
sheet figures (especially assets) using current values especially in periods of inflation
for enhanced relevance. This can be done through appraisals by outside experts.
3. International and Local Bodies governing the preparation of financial statements and
the accounting profession as a whole should enforce a law to early completion and
filing of companies financial statements just like the CBN Law on all Banking
Industries, in order for investors to have access to financial statements to make
informed decisions.
4. International and Local Bodies governing the preparation of financial statements and
the accounting profession as a whole should discourage as much as possible the use of
creative accounting to manipulate figures the financial statement by putting adequate
safety measures so that the relevance of the statements for decision making can be
enhanced.
5. Finally, a consistent change of auditors is recommended. Although it is a well known
fact that the standards have issued a policy that the audit firm should not audit a firm
for more than five years, this is not actually so in practice. Shareholders are therefore
advised to ensure that this rule is strictly adhered to because by so doing the incidence
of bias and familiarity due to long term business relationships would be reduced
which would further strengthen the independence and integrity of the auditor who
prepares these financial statements thereby enhancing the relevance of financial
statements.
23
References
1. Barth, M.E. (2002). The Relevance of the Value Relevance Literature for Financial
Accounting Standard Setting: Another View. Journal of Accounting and Economic,
39
2. Barth, M.E., Brawer, W.A., &Lands Man, E.R. (2001). The Relevance of Value
Relevance Literature for Financial Accounting Standard Setting: Another view.
Journal of Accounting and Economic, 39.
3. Black, E. L. (1998). Which is More Value Relevant: Earnings or Cash Flows? A Life
Cycle Examination, (Working Paper), University of Arkansas, Fayetteville, Arkansas.
4. Charitou, A. (1997). The Role of Cash Flows and Accruals in explaining Security
Returns: Evidence for the U.K, European Accounting Review,6(4).
5. Chen, J.P., Chen, S., & Su, X. (2001). Is Accounting Information value-Relevant in
the Emerging Chinese Stock Market? Journal of International Accounting Auditing &
Taxation, 10.
6. Cheng, C. S. A., Liu, C. S. & Schaefer, T. S. (1996). Earnings Permanence and the
Incremental Information Content of Cash Flows from Operations. Journal of
Accounting Research, (34) 2
7. Clubb C.(1995). An Empirical Study of the Information Content of Accounting
Earnings, Fund Flows and Cash Flows in the U.K. Journal of Business Finance and
Accounting, 22(1).
8. Collins, D, Maydew, E & Weiss, I (1997). Changes in the Value Relevance of
Earnings and Book Value Over the Past Forty Years. Journal of Accounting and
Economics, 24(1).
9. Dechow, P. (1994). Accounting Earnings and Cash Flows as Measure of Firms
Performance: The Role of Accounting Accruals. Journal of Accounting and
Economic, 18.
10. Francis, J. & Schipper. K. (1999). Have Financial Statements Lost their Relevance?
Journal of Accounting Research, 37.
11. Francis, J., Schipper, K., & Vincent, L. (2002). Expanded Disclosures and the
Increased Usefulness of Earnings Announcements. Journal of Accounting
Review, (77)) 3.
12. Gee-Jung & Kwon (2009). Value Relevance of Book Values, Earnings and Cash
Flows: Evidence from Korea. International Journal of Business and Management,
(14)10
13. Hellstron, K. (2005). The Value Relevance of Financial Accounting in a Transitional
Economy: The Case of Czech Republic. (Working paper) Seriesin Business
Administration.
14. International Accounting Standards Board (2001). Conceptual Framework for the
Preparation and Presentation of Financial Statements, IASC Board, (April).
15. Kothari, S.P. (2001), Capital Markets Research in Accounting. Journal of Accounting
and Economic,31.
16. Mohamat S. & Norman, M. (2010). The Value Relevance of Financial Instruments
Disclosure in Malaysian Firms Listed in the Main Board of Bursa Malaysia.
International Journal of Economics and Management, 4(2) Morris, S., & Shin, H. S.
(2001). Coordination Risk and the Price of Debt. (Working Paper), Available on the
Internet at http://www.nuff.ox.ac.uk/users/Shin/pdf/sys2.pdf
17. Nasear A., Yasser A. & Bayan M. (2009). Investors Perception of Information
Disclosed on Information Report of Palestine Securities Exchange Listed Companies.
Accounting and Taxation Journal. (1)1Palestine.
24
18. Nicolas B. & John S. (2012) Value Relevance of Earnings and Book Value for Greek
Listed Companies. (Unpublished Doctoral Dissertation) Department of Business
Administration. University of Piraeous.
19. Nilsson, A (2003), Essays on Value Relevance of Financial Statement Information
(Downloaded from: http://www.fekvv.se/forskming/bulletin/essay/SIO/1.pdf on
10/11/2012)
20. Rabia A.& Mahmut K (2011). Timeliness of Reporting and the Quality of Financial
Information. International Research Journal of Finance and Economics. ISSN1450-
2887, 63.
21. Ranjani R.P.C., Wuhan A.P.R.& Karunarathne W.V.A.D (2010). Value Relevance of
Financial Statements Information: with Special References to the Listed Companies in
Colombo Stock Exchange . PU Management Review. Journal of the University
Business School, Panjab University, Chandigarh.
22. Ranjani RPC & Karunarathne WVAD (2006). The Impact of Earnings and Cash
Flows on the Determination of Stock Returns, PU Management Review. Journal of
the University Business School, Panjab University, Chandigarh.
23. Scott H. (2003). Fair Value Accounting Significance of Financial Statements Journal
of Accountancy, 169.
24. Shaw, K.W., (2003). Corporate Disclosure Quality, Earnings Smoothing, and
Earnings’ Timeliness. Journal of Business Research,56.
25
IMPEDIMENTS TO THE SURVEY RESEARCH METHOD IN THE
ADMINISTRATIVE AND SOCIAL SCIENCES
Mallam Aminu Dorayi
+2348059364521
Department of Public Administration
Nasarawa State University Keffi
Dr IS.M Itodo
Department of Public Administration
Nasarawa State University, Keffi
Abstract
The objective of the research is to determine the level of misconception surrounding the
survey research method in administrative and social sciences in Nigeria. The research
therefore is based on a first hypothesis that it is the most commonly used research method in
the Administrative and Social Sciences and secondly it is mostly misconceived and referred to
as the questionnaire or interview or used synonymously. The method used was the content
analysis of existing data from the conference proceedings of the 2014 international
conference of the faculty of Administration Nassarawa State University keffi, Nigeria. A
purposeful sampling selected the first and second volumes which contain a total of 58 papers
in all. The number of literature that adopted the survey was found to be 22 and out of the 22
only 4 did not make the mistake of using it synonymously with the questionnaire or the
interview. The research found that the hypothesis was proven correct and recommended
academics in Nigeria clarify the concept of the survey research method before using it to
misguide future researchers in the Administrative and Social scence.
keywords: Research, survey research, research method, questionnaire
INTRODUCTION
“The survey research method is the most common research method used in Nigeria but
because of the ignorance surrounding it is treated as a synonym for the questionnaire or the
interview”.
-Professor Ibrahim Omale (2014)
Also according to Omale (2014) we do not fully reap the dividends of a world of science
because of the Nigerian factor which implies dishonesty or dishonest dealings, as well as
fakery and forgery of data. In the past 100 years now, increasing attention has been focused
on researchers in the areas of business and social sciences in order to meet these types of
challenges (Abdul Maliq 2006). Abdul Maliq (2006) also believed that students are not very
conversant with research because they do not understand it is a mixture of different
ingredients. Here it is the ingredients of the survey research method that are mostly referred
to as the survey method itself, as ascertained by Omale (2014) where he believed that it is
often used synonymously with the interview or questionnaire.
We adopted the above sentence as one hypothesis that guideded our research and secondly
we examne if t is the mostly used methodologyby . The research objective was to determine
the level of negligence towards the survey method of doing research in Nigeria. The research
26
question asked; what is the number of people that are aware of the principles and practice of
the survey as a method of doing research and apply it to research publications in the
administrative science. The significance of the research is that it will cause awareness in
conducting research generally. The scope of the research is the focus on survey research
method alone among other research methods that can be used in the administrative and social
scence. the research sampling was limited to two out of three conference proceedings of the
2014 international conference conducted by the faculty of administration, Nassarawa State
University Keffi, Nigeria.
LITERATURE REVIEW
The Concept of Research
While Omale (2014) defines research as to search for or to look for diligently, a combination
of re and search which implies to do again diligently. Some people will say that they
routinely research different online websites to find the best place to buy goods or services
they want and in other cases television news channels supposedly conduct research in the
form of viewer polls on topics of public interest such as forthcoming elections or
government-funded project (Bhattacherjee 2012). Undergraduate students research the
Internet to find the information they need to complete assigned projects or term papers.
Graduate students working on research projects for a professor may see research as collecting
or analyzing data related to their project. Businesses and consultants research different
potential solutions to remedy organizational problems such as a supply chain bottleneck or to
identify customer purchase patterns (Bhattacherjee 2012).
On a daily basis, we acquire new knowledge, validate or reject long-held ones, reaffirm old
beliefs, and get on with our lives. How do we do all this, given the mass of information (data)
that we do have to process from day to day? Although the process of validating or acquiring
or rejecting knowledge and our beliefs might appear to be random, there is an order, a
systematic dimension, to it (Adigun Agbaje and A. Isma’il Alarape 2006). Adigun Agbaje
and A. Isma’il Alarape (2006) believed the methods of knowing besides the scientific include
intuition tenacity and authority while Omale (2014) observed all the three and added 2 others.
Omale believed that the methods of knowing besides the scientific method are as follows:
1. the method of tenacity is the method of knowing in which information is accepted as
true because t has always been believed or because superstition supports t. t s based
on habit or superstition.
2. the method of intuition in which information is accepted based on a feeling which is
in the form of a gut or or a hunch .e where we have no information at all but use
rational justification
3. the method of faith or authority in which people have unquestioning trust in an
authority figure and therefore accept information from such a figure without question
4. The rational method which is based on logic and reasoning e.g all three year old
children are afraid of the dar. ths s a logical conclusion.
5. the empirical method uses observation or direct sensory experience to obtain
knowledge e.g the ol level in your car because you are used to driving it.
According to Bhattacherjee (2012) none of the above can be considered “scientific research”
unless it contributes to a body of science, and it follows the scientific method.
The Concept of Scientific Research
27
Science refers to a systematic and organized body of knowledge in any area of inquiry that is
acquired using “the scientific method” (Bhattacherjee 2012) scientific research can be
defined according to Abdul Maliq (2006) as a group or set of actions taken to change or
utilize the identified state of things depending on the objective of the research. Its advantages
according to Abdul Maliq (2006) over other methods of knowing include, objectivity,
reduction of bias, verifiability, replicability, empiricism, theory as foundation, precision, re-
assessment, creating a pool of knowledge, etc. again, research can be referred to as the
method of doing research that is scientific (Omale 2014).
The lectures presented at the National War College Abuja by Adigun Agbaje and A. Isma’il
Alarape (2006) highlights the nature of scientific research and why it is to be preferred to
non-scientific methods of acquiring, validating and updating knowledge and belief. for
example when one faced with answering a hypothesis such as “Trained, professional infantry
soldiers do better in battle than untrained, inexperienced conscripts” or“Trained, experienced
politicians do a better job of running democratic governance than ordinary citizens” Does it
not agree with reason, common sense, all that we know, our intuition, that soldiers, trained to
kill and experienced in battle, would do better on the battlefield than a rabble of conscripts
that are untrained, inexperienced and probably pressed to war against their wish? Does it not
agree with reason, common sense, history, and intuition that politicians have more skills in
running government than ordinary citizens, and would therefore do a better job in this regard?
The two authors explained this to be right. And Wrong. What the scientific method of
acquiring/validating knowledge and belief shows clearly is that what appears right to
common sense, reason, intuition and experience can in fact be wrong. Take this report that
touches on the first statement, for instance they further explained: A United States army
colonel, Colonel S.L. Marshall, conducted a scientific study of men in about 400 infantry
companies during the Second World War. The study’s objective was to investigate the men’s
reactions to battle. His finding: On average, only 15 percent of troops fired their guns at all in
battle, even when their positions were directly under attack and their lives in danger. The
study showed that the men tended to fire their weapons when others, especially officers, were
present, but not when more isolated. The research noted that the men’s “unwillingness to fire
had nothing to do with fear, but reflected a disinclination to kill when there was ‘no need’”.
Think also about the following, which touches on the second statement It is often forgotten
that the original, classical, definition and practice of democracy involved direct and physical
involvement in governance by all citizens. The modern day practice of democracy, involving
indirect participation of the people in government through their elected representatives (who
have over time become a more or less “professional” group called politicians) is, in fact a
relatively new development in human history. It is also at variance with the original meaning
of democracy. It does appear, therefore, that sense can disappear from “common sense”, our
beliefs can fail us or in fact reflect the level of our ignorance, while “received wisdom” can
reflect anything but wisdom, in our search for knowledge and its validation (Adigun Agbaje
and A. Isma’il Alarape 2006).
The first step is to formulate the Research Idea/Problem and this can emanate from the
researcher’s interest/experience/observation or the researcher’s ongoing work; or finally
matters arising from the work of others. The second step is to conduct a Literature Review i.e
go through libraries and other resource centers (including electronic ones) and review work
already done in the area under investigation. The third step is to identify and define your key
concepts. After that you formulate Research Questions, Objectives and Hypotheses as
appropriate. The next step is to collect your Data Analyse and Discuss your Data. After this
28
Step you draw Appropriate Conclusions and then finally you write the Research Report
(Adigun Agbaje and A. Isma’il Alarape 2006)
IMPORTANCE OF THE SCIENTIFIC METHOD
The scientific method produces/validates knowledge with reference to standards and
procedures that are largely external to the individual, which are more or less permanent, and
are not affected by human thinking. It is a critical method. It emphasizes openness in the
search for knowledge, insisting that all arguments and procedures be reported as fully and
publicly as possible. It is a systematic and controlled method. A scientific investigation must
follow a well-ordered, tightly disciplined procedure. It is empirical, grounded in observation
and experience. It leads to the collection of evidence and the testing of such evidence. In
other words, the method largely focuses on what is, rather than what ought to be, in terms of
the evidence from which it seeks to validate knowledge or belief. The scientific method
allows for replication. Because it insists on full disclosure and explicitness of procedures, the
method makes it possible for a particular study to be repeated by others across time and space
with a view to corroborating or refuting its findings. It thus leads to knowledge that can be
transmitted across time and space, since it is itself a social process. The scientific method is
self-correcting. It is provisional. There is no “final solution” under this method. It is open-
ended. It has no room for oracles or infallibility. In fact, the logical essence of the method
emphasizes that attempts be made to test the falsifiability of established “facts”, rather than
proving such “facts” to be true. Finally, the ultimate goal of the method is to seek
explanation, rather than mere description. It seeks to answer the “why” question.
Omale (2014) therefore believed that the scientific method s an approach to acquiring
knowledge that involves formulating specific questions and then systematically finding
answers. t s a method of acquiring knowledge for scientists to see answers to the questions
they device. t contains many elements of the methods previously discussed. t s based on
obtaining accuracy and the course that treats this is the research methodology as a course. the
reasons for knowing the course are that t helps in conducting a study t helps in reading and
evaluating other people's studies and helps n information based decision manging. t also helps
research studies in our daily lives.
THE DIFFERENCE OF RESEARCH IN SOCIAL AND NATURAL SCIENCE
According to Bhattacherjee (2012) sciences are classified based on their purpose. Basic
sciences, also called pure sciences, are those that explain the most basic objects and forces,
relationships between them, and laws governing them. Examples include physics,
mathematics, and biology. Applied sciences, also called practical sciences, are sciences that
apply scientific knowledge from basic sciences in a physical environment. For instance,
engineering is an applied science that applies the laws of physics and chemistry for practical
applications such as building stronger bridges or fuel efficient combustion engines, while
medicine is an applied science that applies the laws of biology for solving human ailments
(Bhattacherjee 2012). Both basic and applied sciences are required for human development
but the applied sciences cannot stand on their own and rely on basic sciences for its progress.
industry and private enterprises tend to focus more on applied sciences given their practical
value, while universities study both basic and applied sciences. in the Nassarawa State
University Keffi the department of geography is located in the faculty of social sciences but
in reality the natural sciences are different from the social sciences in several respects.
29
Natural sciences are very precise, accurate, deterministic, and independent of the person
making the scientific observations. For instance, a scientific experiment in physics, such as
measuring the speed of sound through a certain media or the refractive index of water, should
always yield the exact same results, irrespective of the time or place of the experiment, or the
person conducting the experiment. If two students conducting the same physics experiment
obtain two different values of these physical properties, then it generally means that one or
both of those students must be in error. However, the same cannot be said for the social
sciences, which tend to be less accurate, deterministic, or unambiguous (Bhattacherjee 2012).
For instance, if you measure a person’s happiness using a hypothetical instrument, you may
find that the same person is more happy or less happy (or sad) on different days and
sometimes, at different times on the same day. One’s happiness may vary depending on the
news that person received that day or on the events that transpired earlier during that day.
Furthermore, there is not a single instrument or metric that can accurately measure a person’s
happiness. Hence, one instrument may calibrate a person as being “more happy” while a
second instrument may find that the same person is “less happy” at the same instant in time.
In other words, there is a high degree of measurement error in the social sciences and there is
considerable uncertainty and little agreement on social science policy decisions. For instance,
you will not find many disagreements among natural scientists on the speed of light or the
speed of the earth around the sun, but you will find numerous disagreements among social
scientists on how to solve a social problem such as reduce global terrorism or rescue an
economy from a recession. Any student studying the social sciences must be cognizant of and
comfortable with handling higher levels of ambiguity, uncertainty, and error that come with
such sciences, which merely reflects the high variability of social objects (Bhattacherjee
2012). Omale (2014) believed that the use of two methodologies in one particular social
scence research is welcomed to justify errors.
THE SURVEY RESEARCH METHOD
The survey research method is the most commonly used method in the social sciences while
The survey research method as a method of doing research is the branch of science
investigation that studies large and small populations by selecting and studying samples
chosen from the population to discover the relative incidence, distribution and interrelations
of sociological and psychological variables should remove any doubts (Omale 2014) Survey
research is a specific type of field study that involves the collection of data from a sample of
elements (e.g., adult women) drawn from a well-defined population (e.g., all adult women
living in the United States) through the use of a questionnaire The advantages include that
once the correct techniques are used, e.g. a good questionnaire or sound interviews are used
significant samples is taken the choice random ensuring every member of the population has
the same chance of being selected it can handle large populations which may be impossible to
handle by other methods of doing research.
Survey research is one of the most important areas of measurement in applied social research.
The broad area of survey research encompasses any measurement procedures that involve
asking questions of respondents. A "survey" can be anything from a short paper-and-pencil
feedback form to an intensive one-on-one in-depth interview (www.socialresearch
methods.net)
EVOLUTION OF SURVEY RESEARCH METHOD
New techniques are emerging in survey research. The Internet has become a powerful method
of gathering information from consumers; voice recognition software allows businesses to
30
offer rewards to consumers who call in to respond to surveys throughout the day. The
applications of survey research will continue to change in step with communication networks.
Consumers are becoming resistant to cold calls in the evening as telemarketing increases its
pressure on the public. Researchers now sample respondents from company databases, and
survey information is collected in exchange for rewards or even cash payments. Market
research and opinion polling will survive; too many managers need the information.
Innovations will continue to modify the methods, but all changes will involve some
adjustment to the four basic innovations that created the modern survey.
Conducting surveys seems simple enough: ask people questions, record their answers, and
report the results. Even Roman Emperors polled their citizens in ancient times. The modern
survey depends on four scientific “leaps” made over the last 200 years. Without these
innovations, market research as we know it would not exist.
THE PROBLEMS OF SURVEY RESEARCH METHOD
Every method of scientific inquiry is subject to limitations and that choosing among research
methods inherently involves trade-offs eg experiments carried out in the lab may not be
widely generalized. The problems of survey method is that for example, In Nigeria many
researches do not issue out questionnaires but rather sit down at home and complete them by
themselves. Data is easy to fake and forge thus often manipulated.
Missing or invalid data are generally too common to ignore. Survey respondents may refuse
to answer certain questions, may not know the answer, or answer in a format not expected. If
you don't take steps to filter or identify this data, your analysis may not provide accurate
results. For numeric data, blank data fields or those containing invalid entries are handled by
converting those fields to system missing, which is identifiable by a single period.
Some solutions to survey method include that researchers can include statement pleading the
respondent fills the instrument himself/herself if a questionnaire; guideline on how the
instrument is to be returned to researcher/assistant if a questionnaire.
THEORETICAL FRAMEWORK
The fact (based on our hypothesis) that most researchers do not give regard to the term survey
but only mention questionnaire or interview in its place suggests a problem of
communication between authors and scientists that proposed the survey method and the
Nigerian Academic system. Communication can be attributed to supply of information. The
information theory according to Drucker (1999) suggested that every relay cuts the message
in half thus the problem can be attributed to information theory. This theoretical framework is
supported by the point raised by Omale (2014) in the his impediments to research in the
administrative and social science where he points out that one of the greatest problems facing
Nigeria is information.
METHODOLOGY
We used a purposeful sampling to select two out of three conference proceedings from the 4th
international conference of the faculty of administration Nassarawa State University, Keffi.
We present the stages from evaluation of the study which is the 1st and 2nd annual conference

31
proceedings of the 4th international conference carried out by the faculty of administration in
October 2014 as follows:
Table 1: Conference Proceeding Vol.1
Conference
proceeding
vol.1
mention and
reference to
survey
methodology in
abstract
mention or
reference to
survey as a
method in
introduction
section
mention of
survey or
reference to
survey in
methodology
sections
Reference or mention
of survey in Analysis
section
page 17 NO MENTON.
“primary data
was used to elicit
responses with
well structured
questionnaire
administered”
NO MENTON.
NO
REFERENCE
NO MENTON.
primary data
were obtained
through the use
of well
structured
questionnaires
administered to
the respondents
NO MENTON.
“40 questionnaires
were administered to
top level management
and middle level
management.
page 45 No mention or
reference to
survey in abstract
No mention or
reference to
survey in
introduction
“The study use
a survey to
evaluate the
impacts of
apprenticeship
”
“in the course of the
study 40
questionnaires were
distributed”
page 99-133 “some
questionnaires
were randomly
distributed to
respondents”
No mention or
reference to
survey in
introduction
“the study
employed the
use of
descriptive
research design
the study made use of
well structured
questionnaire
page 157-
166
NO MENTON.
“the researcher
designed and
distributed
questionnaire to
the respondents”
NO
MENTON.NO
REFERENCE
“The
descriptive
method was
employed”.
“The major
tool of the study
was a
questionnaire
NO MENTON NO
REFERENCE
page 192-
199
“The survey
technique was
adopted for the
study”
No mention or
reference to
survey in
introduction
Acknowledged:
“The survey
method was
adopted.”
No mention or
reference to survey in
Analysis.
page 200-
214
NO MENTON.
“the study
utilized primary
No mention or
reference to
survey
NO MENTON.
“the study
utilized primary
No mention or
reference to survey in
Results section

32
data collected
basically through
structured closed
ended
questionnaire”
introduction data collected
basically
through
structured
closed ended
page 215-
230
NO MENTON.
“primary data
was sourced and
analysed”
No mention or
reference to
survey in
introduction
NO MENTON.
“The main
instrument used
is the
questionnaire”
No mention or
reference to survey in
Results section
page 244-
250
NO MENTON
“52
questionnaires
were distributed
No mention or
reference to
survey in
introduction
“The
researcher
employed the
questionnaire
method as the
survey
instrument”
NO MENTON. “52
questionnaires were
disseminated.”
page 251-
260
NO MENTON.
Refers only to
sample frame of
respondents
No mention or
reference to
survey in
introduction
NO MENTON.
“they were
interviewed
with the aid of
a close ended
questionnaire”.
NO MENTON. Refers
to respondents
Table 2: Conference proceeding Vol 2.
Page number mention and
reference of
survey as a
method in
abstract
mention and
reference of
survey as a
method in
introduction
mention and
reference to
survey as a
method in
methodology
mention and
reference to
survey in
analysis and
presentation of
results
page 7-25 NO MENTON.
Data were
collected
through the use
of questionnaire
NO MENTON.
NO
REFERENCE.
NO MENTON.
“primary data
through the
administration of
questionnaire to
intended
respondents”
NO MENTON.
“The
composition of
respondents has
shown were..”
page 97-104 NO MENTON.
“96
questionnaires
were filled by the
banKers”
NO MENTON.
NO
REFERENCE.
NO MENTON.
“400
questionnaires
were
distributed”
NO
MENTON.make
s reference to
respondents
page 114-122 NO MENTON. NO MENTON. NO MENTON. NO MENTION.
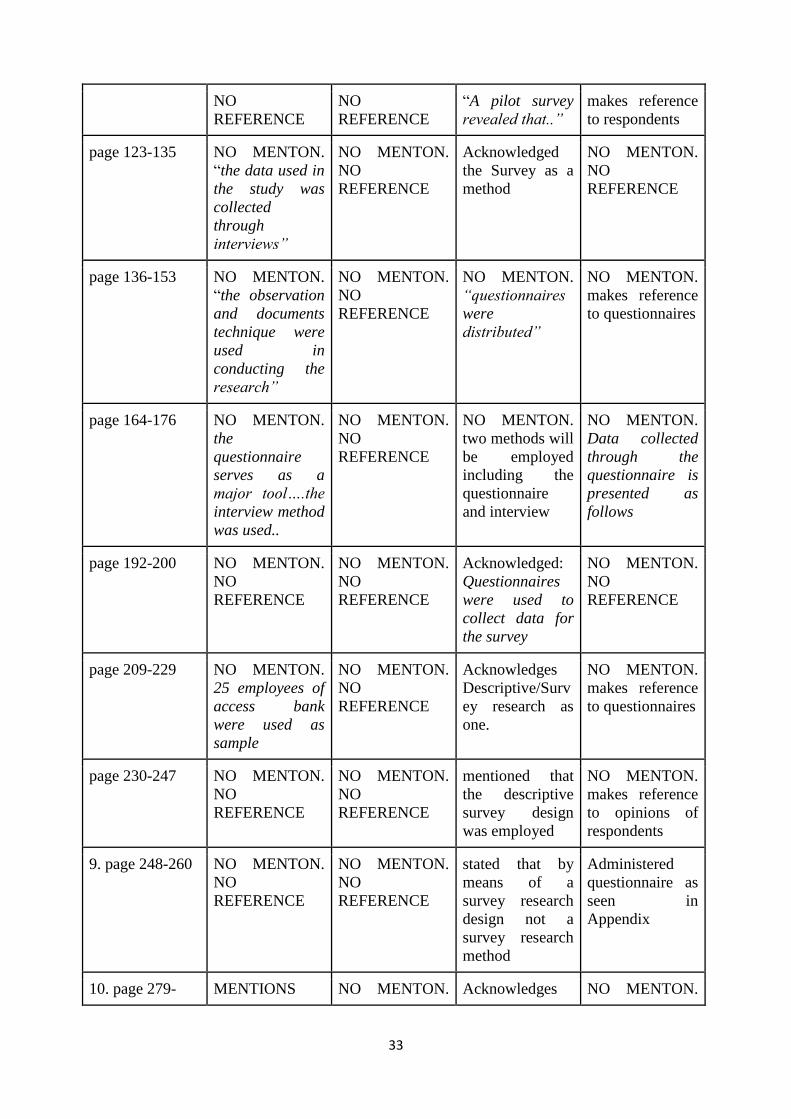
33
NO
REFERENCE
NO
REFERENCE
“A pilot survey
revealed that..”
makes reference
to respondents
page 123-135 NO MENTON.
“the data used in
the study was
collected
through
interviews”
NO MENTON.
NO
REFERENCE
Acknowledged
the Survey as a
method
NO MENTON.
NO
REFERENCE
page 136-153 NO MENTON.
“the observation
and documents
technique were
used in
conducting the
research”
NO MENTON.
NO
REFERENCE
NO MENTON.
“questionnaires
were
distributed”
NO MENTON.
makes reference
to questionnaires
page 164-176 NO MENTON.
the
questionnaire
serves as a
major tool….the
interview method
was used..
NO MENTON.
NO
REFERENCE
NO MENTON.
two methods will
be employed
including the
questionnaire
and interview
NO MENTON.
Data collected
through the
questionnaire is
presented as
follows
page 192-200 NO MENTON.
NO
REFERENCE
NO MENTON.
NO
REFERENCE
Acknowledged:
Questionnaires
were used to
collect data for
the survey
NO MENTON.
NO
REFERENCE
page 209-229 NO MENTON.
25 employees of
access bank
were used as
sample
NO MENTON.
NO
REFERENCE
Acknowledges
Descriptive/Surv
ey research as
one.
NO MENTON.
makes reference
to questionnaires
page 230-247 NO MENTON.
NO
REFERENCE
NO MENTON.
NO
REFERENCE
mentioned that
the descriptive
survey design
was employed
NO MENTON.
makes reference
to opinions of
respondents
9. page 248-260 NO MENTON.
NO
REFERENCE
NO MENTON.
NO
REFERENCE
stated that by
means of a
survey research
design not a
survey research
method
Administered
questionnaire as
seen in
Appendix
10. page 279- MENTIONS NO MENTON. Acknowledges NO MENTON.
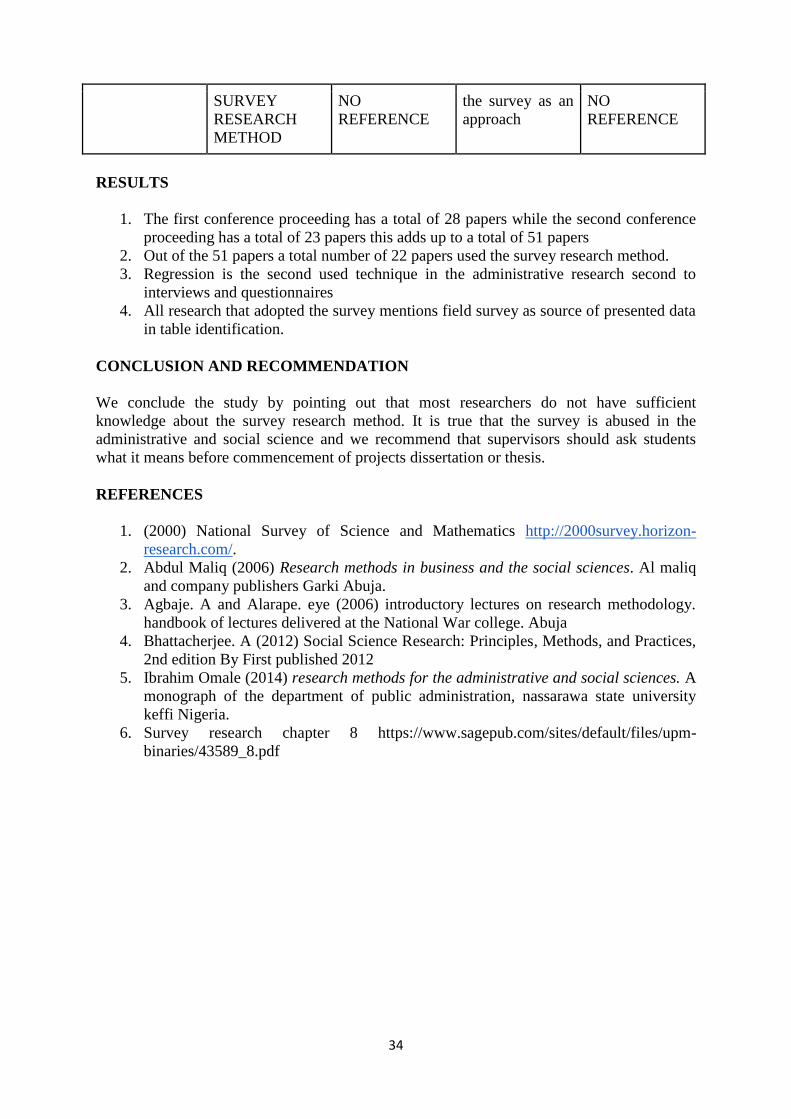
34
SURVEY
RESEARCH
METHOD
NO
REFERENCE
the survey as an
approach
NO
REFERENCE
RESULTS
1. The first conference proceeding has a total of 28 papers while the second conference
proceeding has a total of 23 papers this adds up to a total of 51 papers
2. Out of the 51 papers a total number of 22 papers used the survey research method.
3. Regression is the second used technique in the administrative research second to
interviews and questionnaires
4. All research that adopted the survey mentions field survey as source of presented data
in table identification.
CONCLUSION AND RECOMMENDATION
We conclude the study by pointing out that most researchers do not have sufficient
knowledge about the survey research method. It is true that the survey is abused in the
administrative and social science and we recommend that supervisors should ask students
what it means before commencement of projects dissertation or thesis.
REFERENCES
1. (2000) National Survey of Science and Mathematics http://2000survey.horizon-
research.com/.
2. Abdul Maliq (2006) Research methods in business and the social sciences. Al maliq
and company publishers Garki Abuja.
3. Agbaje. A and Alarape. eye (2006) introductory lectures on research methodology.
handbook of lectures delivered at the National War college. Abuja
4. Bhattacherjee. A (2012) Social Science Research: Principles, Methods, and Practices,
2nd edition By First published 2012
5. Ibrahim Omale (2014) research methods for the administrative and social sciences. A
monograph of the department of public administration, nassarawa state university
keffi Nigeria.
6. Survey research chapter 8 https://www.sagepub.com/sites/default/files/upm-
binaries/43589_8.pdf
35
THE DETERMINANTS OF E-COMMERCE ADOPTION FOR EMPLOYMENT
GENERATION IN THE NIGERIAN SMALL AND MEDIUM SIZED ENTERPRISES
Nathaniel C. Ozigbo Ph.D
Department of Business Administration
University of Abuja
Abuja – Nigeria
E-mail: [email protected]
Mobile: +2348034739720
ABSTRACT
This study empirically examines the determinants of e-commerce adoption level in Nigerian
small and medium sized enterprises located in Lagos State, Nigeria. Electronic commerce
has become one of the most important instruments for the development of Nigerian economy.
The study is important in a global context as SMEs are involved for exporting their produce
in the global market place. The study provided a clear understanding to management’s
perception about e-commerce adoption in their businesses. In this study, self-administered
questionnaire was distributed to randomly selected 150 employees from ten (100) SMEs
located in Lagos State, Nigeria, in which one hundred and thirty-three (133) usable
questionnaire were returned yielding a response rate of 88.67%. Data were analyzed by
using correlation and multiple regression analysis. All the independent variables used for the
study were found to be positively significant in affecting management decisions to adopt e-
commerce. Information sharing was found to have the strongest influence on the adoption
level of e-commerce, followed by organizational readiness. Despite some limitations, the
study made some notable contributions and provided an analysis for advancing the field of
knowledge in e-commence technology. The study recommended that efforts should be made
by the various stakeholders to encourage and promote the use of e-commerce and that the
government should take steps to regulate the telecommunication sector to improve efficiency
and productivity in the sector.
Keywords: Determinants of e-commerce Adoption for Economic Growth.
Introduction
With the emergency of the global economy, e-commerce has increasingly become a
necessary component of business strategy and a strong catalyst for economic development. E-
commerce is the use of the internet for marketing, identification, payment and delivery of
goods and services (Ayo et al 2011). The upsurge in the use of internet and
telecommunication facilities have considerably increased the use of e-commerce in the
business organizations. It is widely believed that e-commerce have contributed greatly to the
rapid development of the SMEs in Nigeria, because, it improves flow of information and
increases the co-ordination of action.
This study empirically examines the factors determining the adoption of e-commerce in
Nigeria’s SMEs. Research model for this study was drawn on the literature on information
and communication technology, information system and electronic data interchange.
Thompson and Ranganathan (2004) have shown that companies that have much greater
incentive to adopt e-commerce because, it offered many benefits to companies such as
massive cost saving in transaction costs, improved efficiency and strategic flexibility by
developing more dynamic and flexible relationships with key business partners.
36
E-commerce researchers have reported tremendous growth in e-commerce all over the globe
due to the enormous volume of goods and services traded between firms (Laudon and Traver
2001, Garicano and Kaplan 2001). Due to the global reach of e-commerce, many business
organizations have started adopting e-commerce in their business. In the study therefore, it
has become very important to identify the factors that influence e-commerce adoption in the
Nigeria’s SMEs. Understanding factors affecting the adoption process might assist the
managers of individual organizations to predict e-commerce usage rate and evaluate the
future growth of e-commerce. This study is organized in such a way to identify the
relationship between some important variables and intent to adopt e-commerce in the SMEs.
This study has extended previous researchers conducted in other countries and provide great
potential by advancing the understanding between the association of adoption factors and e-
commerce adoption level. The study also show that adoption studies could move beyond
studying the factors based on traditional adoption models. Organizations planning to adopt e-
commerce would also be able to apply strategies based on the findings from this study.
Research Problem:
Over the past years, the study of e-commerce adoption practices have expanded tremendously
due to the modern technological advancement. We found that many SMEs in Nigeria lack the
ability to adjust to new trends of the technological age and neglected to close the gaps
between the enterprises. The enterprises tended to respond negatively to an adoption process.
This study is intended to close the gap.
Objectives of the Study:
The main objective of this study is to examine the factors influencing the adoption of e-
commerce in the Nigeria’s small and medium sized enterprises. E-commerce services as a
catalyst for increasing innovation ideas. Other specific objectives include:
- Explore the readiness of the enterprise to implement e-commerce technology.
- Enhance the understanding of e-commerce practices and its importance.
- Provide direction for future research by identifying possible solutions to the business
organization.
Research Questions:
In an attempt to shed light on the objectives of this study, the following research questions
were propounded:
- Which adoption factors have greater association with e-commerce adoption
within the Nigeria’s SMEs?
- What should be done to initiate e-commerce processes in the Nigeria SMEs?
Research Hypotheses:
To achieve the objectives of this study the following hypotheses were stated to guide the
study:
1. HA: There is a positive and significant relationship between innovation and the
adoption level of e-commerce technology.

37
2. HA: There is a positive and significant relationship between external environment
and the adoption level of e-commerce technology.
3. HA: There is a positive and significant relationship between organization readiness
and the adoption level of e-commerce technology.
4. HA: There is a positive and significant relationship between information sharing
and the adoption level of e-commerce technology.
Literature Review:
Nigeria is a developing economy with a huge infrastructural gaps. E-commerce is largely
dependent on telecommunication infrastructure which has grown in leaps and bounds. As at
2015, Nigeria had more than 68.5 million people with internet access and the number is
growing largely due to the proliferation of smart phone and tablet computers. What this
means is that large pool of people are able to conduct transactions over the internet using
technology via laptops, smartphones, tablets and others. By implication, e-commerce
adoption has resulted in boosting productivity for each individual and by extension a boast in
the Nigeria’s small and medium sized enterprises and to the Nigeria’s Gross Domestic
Product (GDP). In essence, the proliferation of e-commerce throughout business
organizations are having profound effects on business strategies. The rules of competition are
being re-written and over-defined as the technological revolution continues particularly in the
area of world-wide commerce.
Electronic commerce has evolved from a high tech marvel to a corporate initiative and can no
longer be ignored or thought of only as an information technology project. For many
businesses, e-commerce means using the internet as a distribution channel to market and sell
goods and services to the consumers. According to Malcoln Frank (1997) V.P. marketing,
Cambridge technology partners said that e-commerce is the electronic exchange of
information goods, services and payments and includes the creation and maintenance of web-
based relations. Laudon and Laudon (2007) defines e-commerce as the process of buying and
selling goods and services electronically, involving transactions using the internet network
and other digital technologies. Rayport and Jaworski (2003) defines e-commerce as a
technology mediated exchanges between parties as well as the electronically based intra-or
inter organizational activities that facilities such exchange. According to Ayo etal (2011), e-
commerce has provided opportunities for business to reach consumers in a very direct way.
This is due to advancement in information and communication technology which offers
enormous opportunities such as storing, processing, retrieving, disseminating and sharing of
information (Appulu et al 2009). Electronic commerce in Nigeria’s SMEs are steadily
growing as a result of the vast improvement in telecommunication services which has
experienced exported growth. The widespread acceptance of the telecommunication services
was motivated by the individual need to survive in this information age. It is noticeable that
the advent of the Global System for Mobile Communication (GSM) and the increased use of
the internet have paved way for the continuous acceptance and appreciation of the variety of
opportunities that exist in e-commerce technologies.
E-commerce generally exists in two forms, namely business-to-business (B2B) and business-
to-customer (B2C). Business to Business (B2B) form entails electronic transactions between
two organizations. It improves communication among organizations, reduces transaction cost
and increases the efficiency of business processes. The Business-to-Customer (B2C) involves
business transactions between the organization and consumer over the electronic means.
According to Laudon etal (2007), the unique features of e-commerce technology include
Ubiquity, Global reach, Universal standards, Richness interactivity, Information diversity and
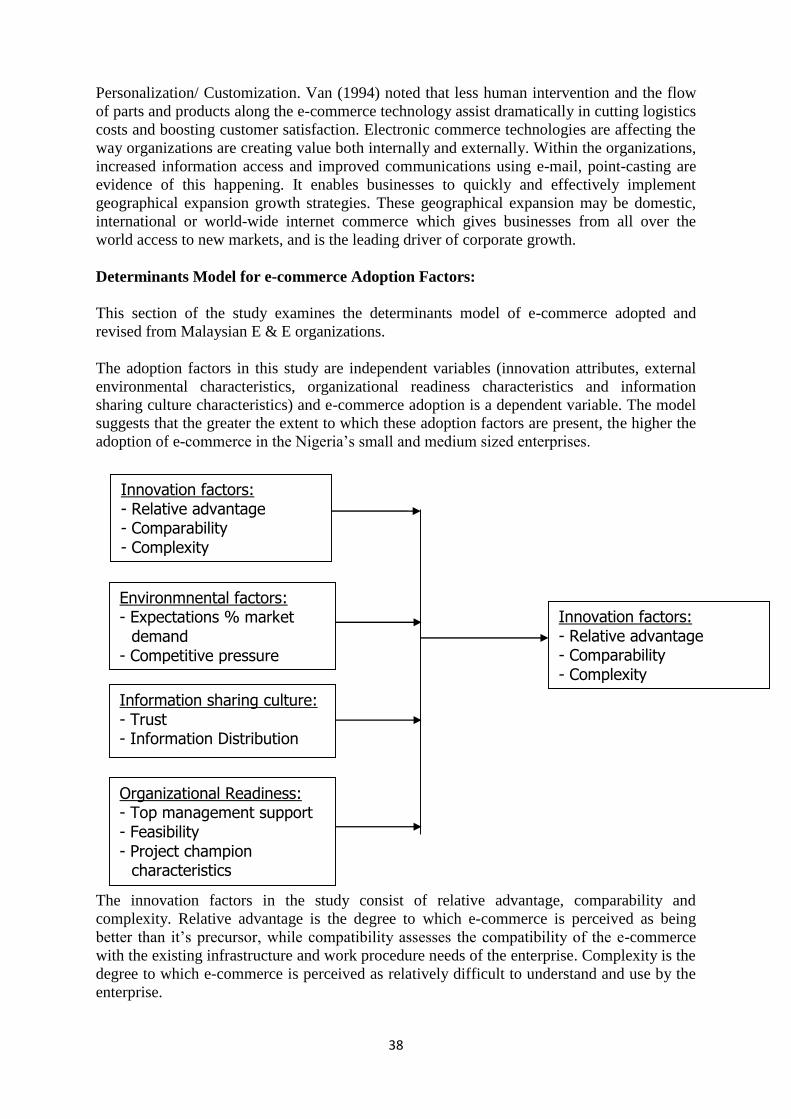
38
Personalization/ Customization. Van (1994) noted that less human intervention and the flow
of parts and products along the e-commerce technology assist dramatically in cutting logistics
costs and boosting customer satisfaction. Electronic commerce technologies are affecting the
way organizations are creating value both internally and externally. Within the organizations,
increased information access and improved communications using e-mail, point-casting are
evidence of this happening. It enables businesses to quickly and effectively implement
geographical expansion growth strategies. These geographical expansion may be domestic,
international or world-wide internet commerce which gives businesses from all over the
world access to new markets, and is the leading driver of corporate growth.
Determinants Model for e-commerce Adoption Factors:
This section of the study examines the determinants model of e-commerce adopted and
revised from Malaysian E & E organizations.
The adoption factors in this study are independent variables (innovation attributes, external
environmental characteristics, organizational readiness characteristics and information
sharing culture characteristics) and e-commerce adoption is a dependent variable. The model
suggests that the greater the extent to which these adoption factors are present, the higher the
adoption of e-commerce in the Nigeria’s small and medium sized enterprises.
The innovation factors in the study consist of relative advantage, comparability and
complexity. Relative advantage is the degree to which e-commerce is perceived as being
better than it’s precursor, while compatibility assesses the compatibility of the e-commerce
with the existing infrastructure and work procedure needs of the enterprise. Complexity is the
degree to which e-commerce is perceived as relatively difficult to understand and use by the
enterprise.
Innovation factors: - Relative advantage - Comparability - Complexity
Environmnental factors: - Expectations % market
demand - Competitive pressure
Information sharing culture: - Trust - Information Distribution
Organizational Readiness: - Top management support - Feasibility - Project champion
characteristics
Innovation factors: - Relative advantage - Comparability - Complexity
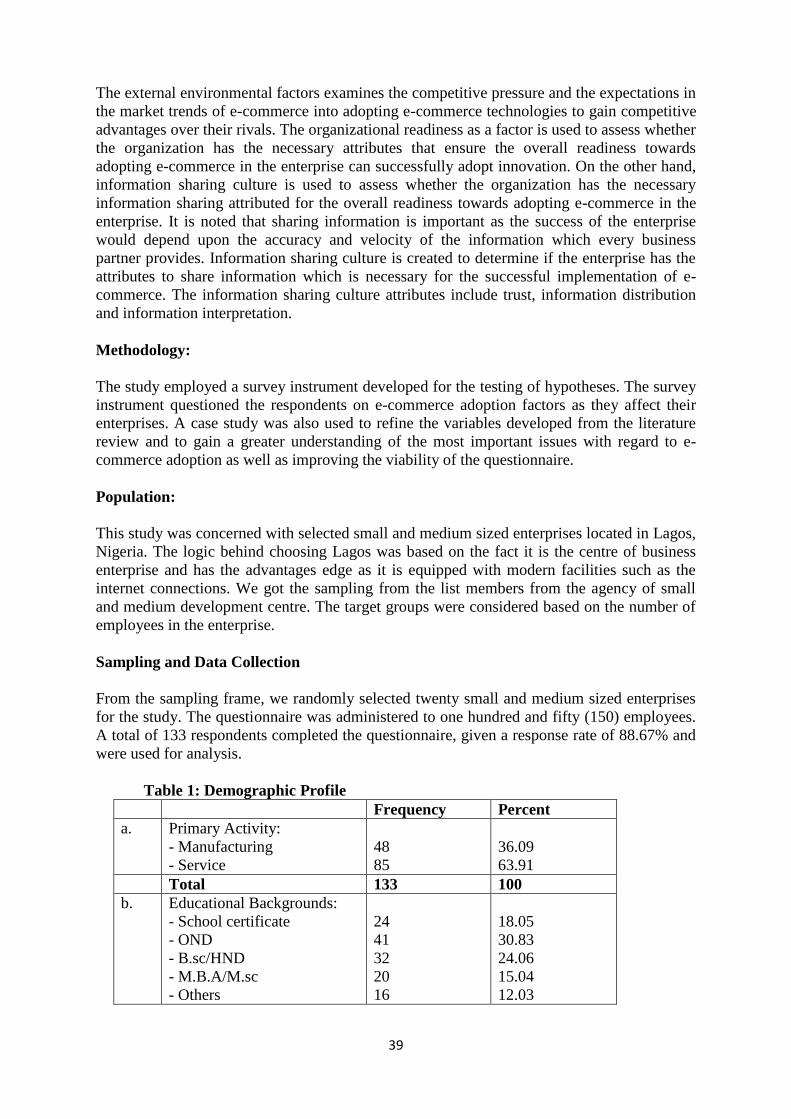
39
The external environmental factors examines the competitive pressure and the expectations in
the market trends of e-commerce into adopting e-commerce technologies to gain competitive
advantages over their rivals. The organizational readiness as a factor is used to assess whether
the organization has the necessary attributes that ensure the overall readiness towards
adopting e-commerce in the enterprise can successfully adopt innovation. On the other hand,
information sharing culture is used to assess whether the organization has the necessary
information sharing attributed for the overall readiness towards adopting e-commerce in the
enterprise. It is noted that sharing information is important as the success of the enterprise
would depend upon the accuracy and velocity of the information which every business
partner provides. Information sharing culture is created to determine if the enterprise has the
attributes to share information which is necessary for the successful implementation of e-
commerce. The information sharing culture attributes include trust, information distribution
and information interpretation.
Methodology:
The study employed a survey instrument developed for the testing of hypotheses. The survey
instrument questioned the respondents on e-commerce adoption factors as they affect their
enterprises. A case study was also used to refine the variables developed from the literature
review and to gain a greater understanding of the most important issues with regard to e-
commerce adoption as well as improving the viability of the questionnaire.
Population:
This study was concerned with selected small and medium sized enterprises located in Lagos,
Nigeria. The logic behind choosing Lagos was based on the fact it is the centre of business
enterprise and has the advantages edge as it is equipped with modern facilities such as the
internet connections. We got the sampling from the list members from the agency of small
and medium development centre. The target groups were considered based on the number of
employees in the enterprise.
Sampling and Data Collection
From the sampling frame, we randomly selected twenty small and medium sized enterprises
for the study. The questionnaire was administered to one hundred and fifty (150) employees.
A total of 133 respondents completed the questionnaire, given a response rate of 88.67% and
were used for analysis.
Table 1: Demographic Profile
Frequency Percent
a. Primary Activity:
- Manufacturing
- Service
48
85
36.09
63.91
Total 133 100
b. Educational Backgrounds:
- School certificate
- OND
- B.sc/HND
- M.B.A/M.sc
- Others
24
41
32
20
16
18.05
30.83
24.06
15.04
12.03
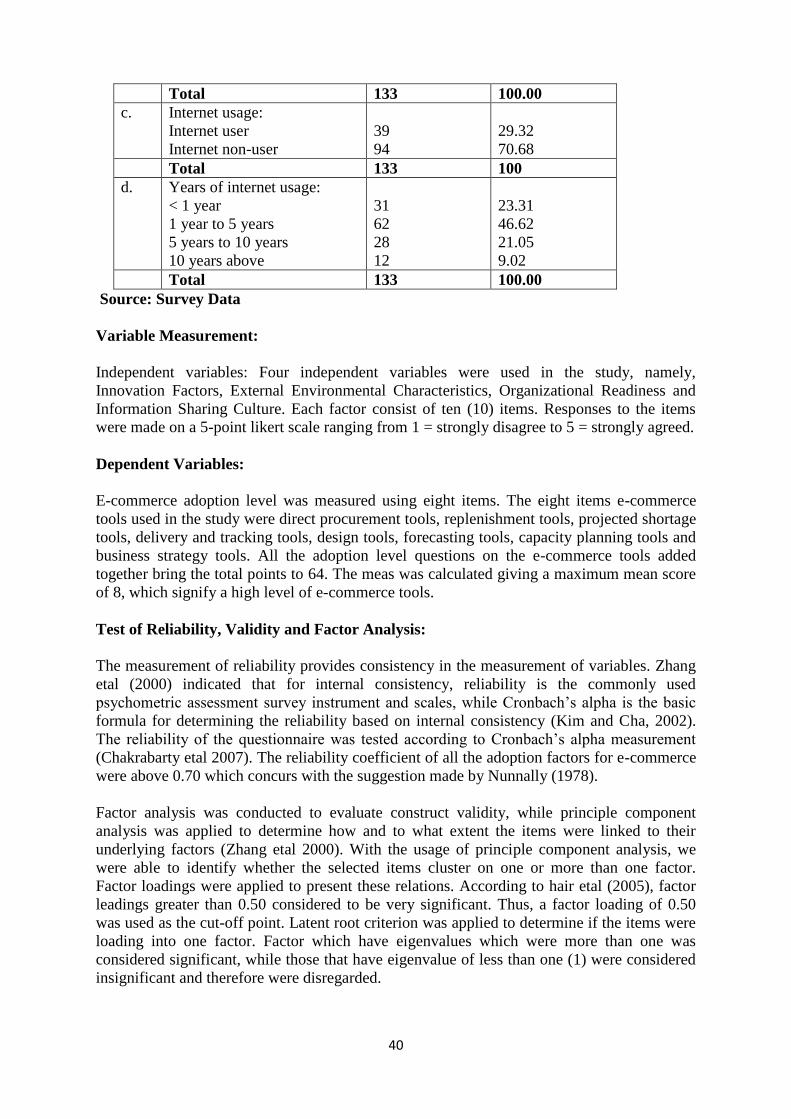
40
Total 133 100.00
c. Internet usage:
Internet user
Internet non-user
39
94
29.32
70.68
Total 133 100
d. Years of internet usage:
< 1 year
1 year to 5 years
5 years to 10 years
10 years above
31
62
28
12
23.31
46.62
21.05
9.02
Total 133 100.00
Source: Survey Data
Variable Measurement:
Independent variables: Four independent variables were used in the study, namely,
Innovation Factors, External Environmental Characteristics, Organizational Readiness and
Information Sharing Culture. Each factor consist of ten (10) items. Responses to the items
were made on a 5-point likert scale ranging from 1 = strongly disagree to 5 = strongly agreed.
Dependent Variables:
E-commerce adoption level was measured using eight items. The eight items e-commerce
tools used in the study were direct procurement tools, replenishment tools, projected shortage
tools, delivery and tracking tools, design tools, forecasting tools, capacity planning tools and
business strategy tools. All the adoption level questions on the e-commerce tools added
together bring the total points to 64. The meas was calculated giving a maximum mean score
of 8, which signify a high level of e-commerce tools.
Test of Reliability, Validity and Factor Analysis:
The measurement of reliability provides consistency in the measurement of variables. Zhang
etal (2000) indicated that for internal consistency, reliability is the commonly used
psychometric assessment survey instrument and scales, while Cronbach’s alpha is the basic
formula for determining the reliability based on internal consistency (Kim and Cha, 2002).
The reliability of the questionnaire was tested according to Cronbach’s alpha measurement
(Chakrabarty etal 2007). The reliability coefficient of all the adoption factors for e-commerce
were above 0.70 which concurs with the suggestion made by Nunnally (1978).
Factor analysis was conducted to evaluate construct validity, while principle component
analysis was applied to determine how and to what extent the items were linked to their
underlying factors (Zhang etal 2000). With the usage of principle component analysis, we
were able to identify whether the selected items cluster on one or more than one factor.
Factor loadings were applied to present these relations. According to hair etal (2005), factor
leadings greater than 0.50 considered to be very significant. Thus, a factor loading of 0.50
was used as the cut-off point. Latent root criterion was applied to determine if the items were
loading into one factor. Factor which have eigenvalues which were more than one was
considered significant, while those that have eigenvalue of less than one (1) were considered
insignificant and therefore were disregarded.
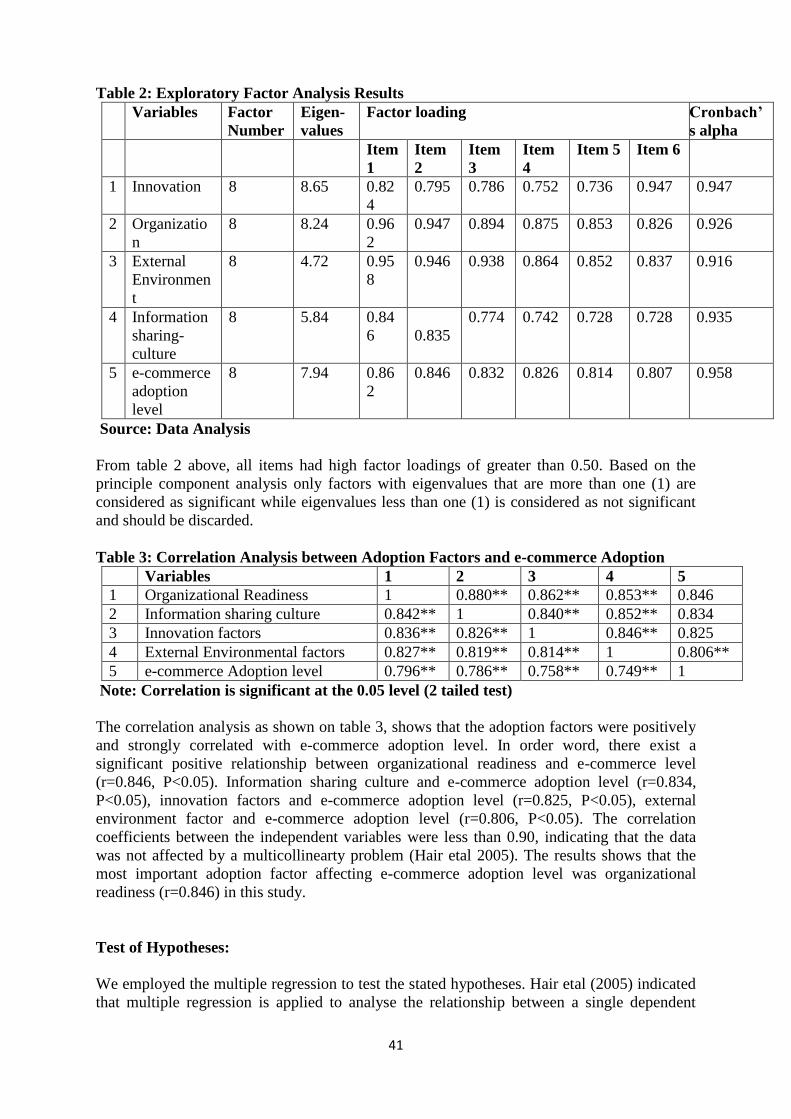
41
Table 2: Exploratory Factor Analysis Results
Variables Factor
Number
Eigen-
values
Factor loading Cronbach’
s alpha
Item
1
Item
2
Item
3
Item
4
Item 5 Item 6
1 Innovation 8 8.65 0.82
4
0.795 0.786 0.752 0.736 0.947 0.947
2 Organizatio
n
8 8.24 0.96
2
0.947 0.894 0.875 0.853 0.826 0.926
3 External
Environmen
t
8 4.72 0.95
8
0.946 0.938 0.864 0.852 0.837 0.916
4 Information
sharing-
culture
8 5.84 0.84
6
0.835
0.774 0.742 0.728 0.728 0.935
5 e-commerce
adoption
level
8 7.94 0.86
2
0.846 0.832 0.826 0.814 0.807 0.958
Source: Data Analysis
From table 2 above, all items had high factor loadings of greater than 0.50. Based on the
principle component analysis only factors with eigenvalues that are more than one (1) are
considered as significant while eigenvalues less than one (1) is considered as not significant
and should be discarded.
Table 3: Correlation Analysis between Adoption Factors and e-commerce Adoption
Variables 1 2 3 4 5
1 Organizational Readiness 1 0.880** 0.862** 0.853** 0.846
2 Information sharing culture 0.842** 1 0.840** 0.852** 0.834
3 Innovation factors 0.836** 0.826** 1 0.846** 0.825
4 External Environmental factors 0.827** 0.819** 0.814** 1 0.806**
5 e-commerce Adoption level 0.796** 0.786** 0.758** 0.749** 1
Note: Correlation is significant at the 0.05 level (2 tailed test)
The correlation analysis as shown on table 3, shows that the adoption factors were positively
and strongly correlated with e-commerce adoption level. In order word, there exist a
significant positive relationship between organizational readiness and e-commerce level
(r=0.846, P<0.05). Information sharing culture and e-commerce adoption level (r=0.834,
P<0.05), innovation factors and e-commerce adoption level (r=0.825, P<0.05), external
environment factor and e-commerce adoption level (r=0.806, P<0.05). The correlation
coefficients between the independent variables were less than 0.90, indicating that the data
was not affected by a multicollinearty problem (Hair etal 2005). The results shows that the
most important adoption factor affecting e-commerce adoption level was organizational
readiness (r=0.846) in this study.
Test of Hypotheses:
We employed the multiple regression to test the stated hypotheses. Hair etal (2005) indicated
that multiple regression is applied to analyse the relationship between a single dependent
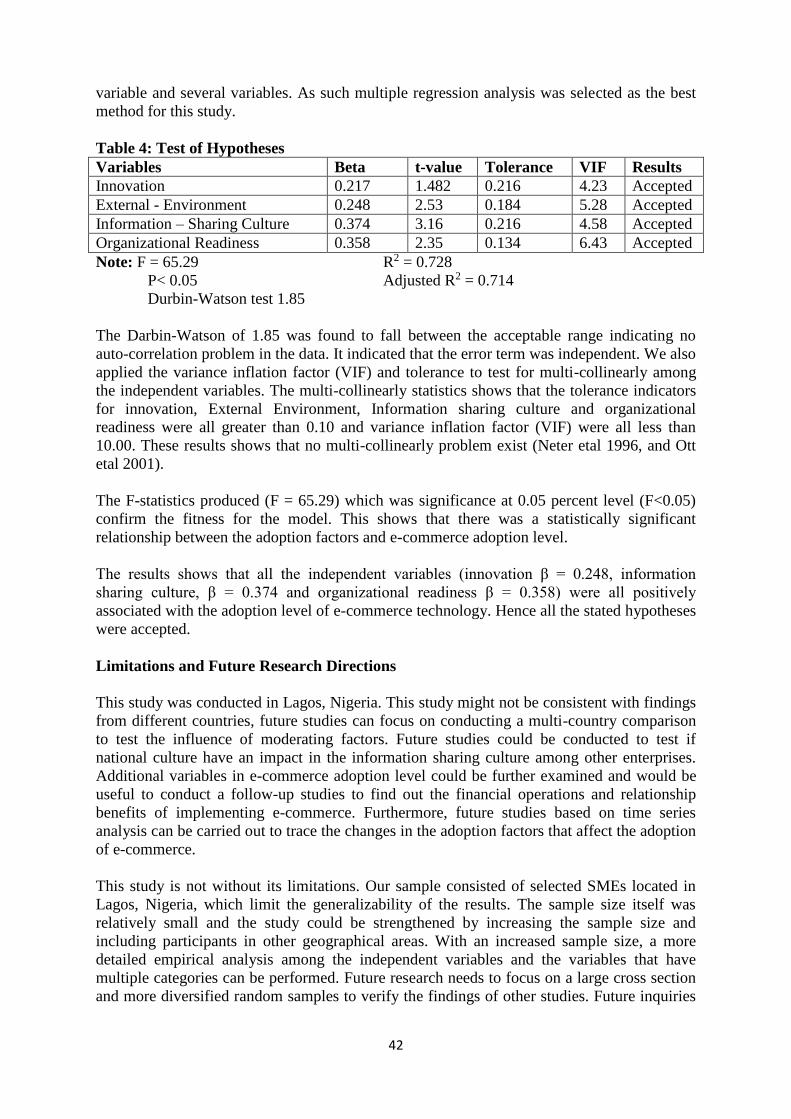
42
variable and several variables. As such multiple regression analysis was selected as the best
method for this study.
Table 4: Test of Hypotheses
Variables Beta t-value Tolerance VIF Results
Innovation 0.217 1.482 0.216 4.23 Accepted
External - Environment 0.248 2.53 0.184 5.28 Accepted
Information – Sharing Culture 0.374 3.16 0.216 4.58 Accepted
Organizational Readiness 0.358 2.35 0.134 6.43 Accepted
Note: F = 65.29 R2 = 0.728
P< 0.05 Adjusted R2 = 0.714
Durbin-Watson test 1.85
The Darbin-Watson of 1.85 was found to fall between the acceptable range indicating no
auto-correlation problem in the data. It indicated that the error term was independent. We also
applied the variance inflation factor (VIF) and tolerance to test for multi-collinearly among
the independent variables. The multi-collinearly statistics shows that the tolerance indicators
for innovation, External Environment, Information sharing culture and organizational
readiness were all greater than 0.10 and variance inflation factor (VIF) were all less than
10.00. These results shows that no multi-collinearly problem exist (Neter etal 1996, and Ott
etal 2001).
The F-statistics produced (F = 65.29) which was significance at 0.05 percent level (F<0.05)
confirm the fitness for the model. This shows that there was a statistically significant
relationship between the adoption factors and e-commerce adoption level.
The results shows that all the independent variables (innovation β = 0.248, information
sharing culture, β = 0.374 and organizational readiness β = 0.358) were all positively
associated with the adoption level of e-commerce technology. Hence all the stated hypotheses
were accepted.
Limitations and Future Research Directions
This study was conducted in Lagos, Nigeria. This study might not be consistent with findings
from different countries, future studies can focus on conducting a multi-country comparison
to test the influence of moderating factors. Future studies could be conducted to test if
national culture have an impact in the information sharing culture among other enterprises.
Additional variables in e-commerce adoption level could be further examined and would be
useful to conduct a follow-up studies to find out the financial operations and relationship
benefits of implementing e-commerce. Furthermore, future studies based on time series
analysis can be carried out to trace the changes in the adoption factors that affect the adoption
of e-commerce.
This study is not without its limitations. Our sample consisted of selected SMEs located in
Lagos, Nigeria, which limit the generalizability of the results. The sample size itself was
relatively small and the study could be strengthened by increasing the sample size and
including participants in other geographical areas. With an increased sample size, a more
detailed empirical analysis among the independent variables and the variables that have
multiple categories can be performed. Future research needs to focus on a large cross section
and more diversified random samples to verify the findings of other studies. Future inquiries
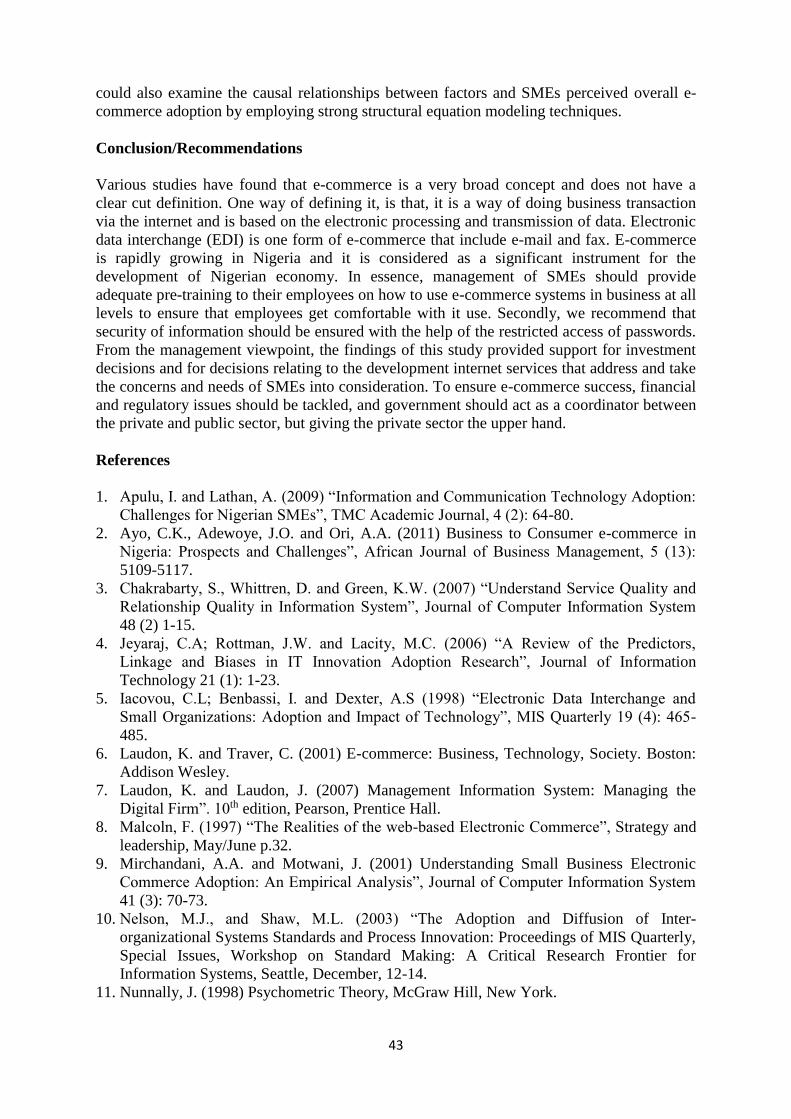
43
could also examine the causal relationships between factors and SMEs perceived overall e-
commerce adoption by employing strong structural equation modeling techniques.
Conclusion/Recommendations
Various studies have found that e-commerce is a very broad concept and does not have a
clear cut definition. One way of defining it, is that, it is a way of doing business transaction
via the internet and is based on the electronic processing and transmission of data. Electronic
data interchange (EDI) is one form of e-commerce that include e-mail and fax. E-commerce
is rapidly growing in Nigeria and it is considered as a significant instrument for the
development of Nigerian economy. In essence, management of SMEs should provide
adequate pre-training to their employees on how to use e-commerce systems in business at all
levels to ensure that employees get comfortable with it use. Secondly, we recommend that
security of information should be ensured with the help of the restricted access of passwords.
From the management viewpoint, the findings of this study provided support for investment
decisions and for decisions relating to the development internet services that address and take
the concerns and needs of SMEs into consideration. To ensure e-commerce success, financial
and regulatory issues should be tackled, and government should act as a coordinator between
the private and public sector, but giving the private sector the upper hand.
References
1. Apulu, I. and Lathan, A. (2009) “Information and Communication Technology Adoption:
Challenges for Nigerian SMEs”, TMC Academic Journal, 4 (2): 64-80.
2. Ayo, C.K., Adewoye, J.O. and Ori, A.A. (2011) Business to Consumer e-commerce in
Nigeria: Prospects and Challenges”, African Journal of Business Management, 5 (13):
5109-5117.
3. Chakrabarty, S., Whittren, D. and Green, K.W. (2007) “Understand Service Quality and
Relationship Quality in Information System”, Journal of Computer Information System
48 (2) 1-15.
4. Jeyaraj, C.A; Rottman, J.W. and Lacity, M.C. (2006) “A Review of the Predictors,
Linkage and Biases in IT Innovation Adoption Research”, Journal of Information
Technology 21 (1): 1-23.
5. Iacovou, C.L; Benbassi, I. and Dexter, A.S (1998) “Electronic Data Interchange and
Small Organizations: Adoption and Impact of Technology”, MIS Quarterly 19 (4): 465-
485.
6. Laudon, K. and Traver, C. (2001) E-commerce: Business, Technology, Society. Boston:
Addison Wesley.
7. Laudon, K. and Laudon, J. (2007) Management Information System: Managing the
Digital Firm”. 10th edition, Pearson, Prentice Hall.
8. Malcoln, F. (1997) “The Realities of the web-based Electronic Commerce”, Strategy and
leadership, May/June p.32.
9. Mirchandani, A.A. and Motwani, J. (2001) Understanding Small Business Electronic
Commerce Adoption: An Empirical Analysis”, Journal of Computer Information System
41 (3): 70-73.
10. Nelson, M.J., and Shaw, M.L. (2003) “The Adoption and Diffusion of Inter-
organizational Systems Standards and Process Innovation: Proceedings of MIS Quarterly,
Special Issues, Workshop on Standard Making: A Critical Research Frontier for
Information Systems, Seattle, December, 12-14.
11. Nunnally, J. (1998) Psychometric Theory, McGraw Hill, New York.

44
12. Hair, J.F; Black, W.C; Babin, R.J and Tathan, R.L. (2005) Multivariate Data Analysis
Prentice-Hall, Upper Saddle River, New Jersey.
13. Neter, J.; Kutner, M.H.; Nachtsheim, C.J and Wasserman, W. (1996) Applied Linear
Statistical Models, McGraw-Hill Boston, Massachusetts.
14. Ott, R.L and Longnecker, M. (2001) An Introduction to Statistical Methods and Data
Analysis, Thomson Learning, INC, Duxbury.
15. Kim, W.G. and Cha, Y. (2002) Antecedents and Consequences of Relationship quality in
Hotel Industry, Hospitality Management 321-338.
16. Kleinbaum, D.G. Kupper, L.L, Muller, K.E. (1988), Applied Regression Analysis and
other Multivariate Methods, Boston, P.W.S.
17. Rayport, J. and Jaworski, B. (2003) Introduction to e-commerce, 2nd ed., McGraw-Hill,
New York.
18. Rao, S.S. and Metts, G. (2003) Electronic Commerce Development in Small and Medium
Sized Enterprises: A Stage Model and Its Implications, Business Process Management
Journal, 9 (1): 11-32.
19. Thompson, T. and Ranganathan C. (2004) Adopters and Non-adopters of Business-to-
Business Electronic Commerce in Singapore, Information and Management, 42:89-102.
20. Van, O.M. (1994) Distribution Super-high way, International Business 13 (1): 37-56.
21. Zhang, Z.; Waszink, A. and Wijngaard, J. (2000) An Instrument for Measuring TQM
Implication for Chinese Manufacturing Companies, International Journal of Quality and
Reliability Management 17 (7): 730-755.
45
IMPACT OF AGRO-ALLIED VALUE CHAIN ON SUSTAINABLE DEVELOPMENT
OF SMALL AND MEDIUM ENTERPRISES IN NIGERIA
Elikwu, Michael Ikechukwu 1, Adio, Adebayo Isaac 2 1, 2Department of Entrepreneurship Studies
Michael Okpala University of Agriculture, Umudike
ABSTRACT
In recent times, there have been concerted efforts by the government to support Agriculture
through investments in river basins, seedlings, fertilizers and mechanization, various grants
and schemes to boost the sector; however, in spite of all these, participatory constraints in
agriculture remain persistent, costly and inequitably distributed, severely limiting SMEs’
ability to participate. Hence, there is a persistent problem of lack of adequate processing,
storage and preservative facilities resulting in continuous wastage of perishable agricultural
produce annually. Furthermore, the seeming reluctance by most SME owners to embrace
active participation in agricultural business as a result of the high investment risk involved
creates the problem of continuous annual wastage of agricultural produce, high
unemployment rate, stagnation in exploration of new technology, leading to possible food
insecurity as a result of the total ignorance of the viability of the value chain. Based on the
foregoing, the main objective of this study is to evaluate the impact of Agro-Allied Value
Chain on Sustainable Development of SMEs in Nigeria, a study of agro-allied SMEs in Delta
State, Nigeria. The research employed the descriptive research design, with a sample size of
327; the data for the study was collected through administration of questionnaire. The
Structural Equation Model (SEM) technique was used in the test of posited hypotheses. The
findings revealed that, there is a significant impact of agro-allied Value chain on
performance, and growth of SMEs in Delta State. It is therefore recommended that, in order
to achieve sustainable development, there is need for the government to put in place
infrastructures, policies and measures to encourage technological advancement, encourage
increased participation of SMEs in the Agro-Allied value chain processes, for increased
production of staple foods, export driven production and sustainable development of SMEs in
Nigeria.
Keywords: Agro-Allied Business, SME Development, Employment, Value-Chain
Introduction
In both developed and emerging economies, the involvement of entrepreneurs in the
agricultural value chain is seen as a panacea to the development of sustainable small and
medium scale enterprises (SMEs) in any economy. Agro-Allied SMEs are strategic to the
realization of value chain objectives which includes, increase in volume of input supply
(agricultural produce), design and production (Processing), marketing, distribution and
support services (storage, wholesale (including export) and retailing) and consumption
(Olagunju, 2013), geared towards the optimal use of agricultural resources for the creation of
a stable food market, the achievement of greater level of productivity (Aremu, 2004),
increase the competitiveness of agricultural products and implementation of integrated
agricultural and rural development (Robson & Gallagher, 1993). According to Ikwouria and
Gate (2008), value chain is the sequence of activities required to make a product or provide a
service. It is a linked set of value-creating activities all the way from basic raw materials
sources for components suppliers through to the ultimate end-use product or service delivered
46
to the customer (Akenbor & Okoye, 2011). Value chains shape market access since it
identifies key players and lead firms within the chain and enables “clear understanding of the
“rules of the game” (Porter, 1985).
Value chains are a crucial basis for understanding how inputs and services are brought
together and then used to grow, transmute, or manufacture a product; how the finished
product subsequently moves from the producer to the final consumer; and how value
increases along the way. The value chain perception according to Webber and Labaste (2010)
provides an important means to understand business-to-business relationships that connect
the chain, mechanisms for increasing efficiency, and ways to enable businesses to increase
productivity and add value. It also provides a reference point for improvements in supporting
services and the business environment. It can contribute to pro-poor initiatives and better
linking of small businesses with the market. Increasingly, the value chain approach is being
used to guide and drive high-impact and sustainable initiatives focused on improving
productivity, competitiveness, entrepreneurship, and the growth of small and medium
enterprises (SMEs).
SMEs according to Ogbo and Nwachukwu (2012), represent a veritable vehicle for the
achievement of national economic objectives of employment generation and poverty
reduction at low investment cost as well as the development of entrepreneurial capabilities
including indigenous technology. Other intrinsic benefits of vibrant SMEs include access to
the infrastructural facilities occasioned by the existence of such SMEs in their surroundings,
the stimulation of economic activities such as suppliers of various items and distributive
trades for items produced and or needed by the SMEs (Olagunju, 2013), stemming from rural
urban migration (Ajayi, 2000), enhancement of standard of living of the employees of the
SMEs and their dependents (Fabunmi, 2004) and contribute to economic diversification and
social stability (Knight, 1998).
In both developed and emerging economies, the participation of small and medium scale
enterprises (SMEs) in promoting agricultural value chain is seen as critical to the
development of any economy. Agro-Allied SMEs are strategic to the realization of value
chain objectives which includes, increase in volume of production, the optimal use of
agricultural resources, the creation of a stable food market, the achievement of greater level
of productivity (Aremu, 2004), increase the competitiveness of agricultural products and
implementation of integrated agricultural and rural development (Robson & Gallagher,
1993). From the foregoing, the need to involve the small and medium scale enterprises in
promoting the agricultural value chain cannot be over-emphasized; hence, this study
evaluates the Effect of Value Chain on growth of Agro-Allied SMEs in Delta State, an
assessment of the inherent challenges and prospects.
Statement of Problem
Nigeria being a mono-economy since the discovery of oil, agriculture in Nigeria has lost its
former glory in the face of so many challenges and constraints that have made its
development impossible. These challenges and constraints include; Lack of basic physical
infrastructure and essential services for production and lack of appropriate technology and
machinery for processing of agricultural produce, coupled with poor entrepreneurship
development; and challenges of weak linkages between Agriculture - Industry and poor
market access.
The advancement in global technological applications in businesses behoves on SMEs to tap
into the numerous advantages that comes with this evolution. As a result, most SMEs are
47
being left behind due to technological and infrastructural weaknesses, as well as insufficient
knowledge of the implications for sustainable development of SME’s and the economy. The
very few SMEs in agro-allied businesses struggle to operate, manage and improve their
businesses efficiently in order to consistently deliver quality products and services on time.
In spite of the fact that ‘Agriculture continues to be a fundamental instrument for sustainable
development and poverty reduction’ (World Bank, 2008); yet, ‘participatory constraints in
agriculture remain pervasive, costly and inequitably distributed, severely limiting SMEs’
ability to participate. Hence, there is a persistent problem of lack of adequate processing,
storage and preservative facilities resulting in continuous wastage of perishable agricultural
produce annually. The seeming reluctance in embracing participation in agro-business as a
result of the high investment risk involved creates the problem of looming food insecurity as
a result of the total ignorance of the viability of the value chain.
Furthermore, a critical review of extant literature revealed very scanty empirical studies on
agro-allied value chain analysis and sustainable development of SMEs in Nigeria. The few
available ones are of foreign origin and therefore their findings are not compatible to the
Nigerian situation. It is against this backdrop that the main objective of this study is to
investigate impact of Agro-Allied Value Chain on Sustainable Development of SMEs in
Nigeria, a study of agro-allied SMEs in Delta State, Nigeria. The specific objectives of the
study include:
i. To determine the impact of value chain process on employment generation in agro-
allied SMEs
ii. To determine the impact of value chain on technological advancement and production
capacity of agro-allied SMEs
To achieve the above set objectives, the following hypotheses are postulated to be tested;
H01: Value chain process has no significant impact on employment generation in agro-
allied SMEs
H02: There is no significant impact of Value Chain on technological production capacity of
agro-allied SMEs
Literature Review
The value chain approach traces the connections from buyers to the producers. As this is
done, gaps become evident and form the basis for establishing priorities for action. The
implication is that linkages are given closer attention since the quality of linkages and support
systems play a critical role in enabling firms and the industry sector to be more competitive
Akenbor & Okoye, 2011). Basically, “value chain” describes the full range of value-adding
activities required to bring a product or service through the different phases of production,
including procurement of raw materials and other inputs, assembly, physical transformation,
acquisition of required services such as transport or cooling, and ultimately response to
consumer demand (Kaplinsky and Morris 2002). As such, value chains include all of the
vertically linked, interdependent processes that generate value for the consumer, as well as
horizontal linkages to other value chains that provide intermediate goods and services. Value
chains focus on value creation—typically via innovation in products or processes, as well as
marketing—and also on the allocation of the incremental value. Value chain according to
Miller and Silva (2007) the set of actors (private, public, and including service providers) and
48
the sequence of value-adding activities involved in bringing a product from production to the
final consumer.
A value chain according to UNIDO, (2009) can be understood as a set of businesses,
activities and relationships engaged in creating a final product (or service). It builds on the
idea that a product is rarely consumed in its original form but becomes transformed,
combined with other products, transported, packaged and marketed (Lusby & Panlibuton,
2007), until it reaches its final consumer. In this sense, the value chain describes how
producers, processors, buyers, sellers, and consumers — separated by time and space —
gradually add value to products as they pass from one link in the chain to the next. The value
chain approach has been intensively used both by private sector agents as well as government
and development agencies to both identify options for industrial development and implement
development programmes (Altenburg, 2006). Its particular attractiveness draws from among
other things; its capacity to deal with a new business environment prevalent in industrial
development in the context of today’s globalized markets.
The agricultural value chain concept has been used since the beginning of the millennium,
primarily by those working in agricultural development in developing countries. Although
there is no universally accepted definition of the term, it normally refers to the whole range of
goods and services necessary for an agricultural product to move from the farm to the final
customer or consumer. In reality, Haggblade, Theriault, Staatz, Dembele and Diallo (2012)
asserts that, value chains tend to be more complex, to involve numerous interlinked activities
and industries with multiple types of firms operating in different regions of one country or in
different countries around the globe. For instance, agro-food value chains encompass
activities that take place at the farm as well as in rural settlements and urban areas. They
require input supplies (seeds, fertilizers, pesticides, etc.), agricultural machinery, irrigation
equipment and manufacturing facilities, and continue with handling, storage, processing, and
packaging and distribution activities. Other elements, such as power generation and logistics,
among others (Henriksen, Riisgaard, Ponte, Hartwich & Kormawa, 2004), which form the
chain environment, are also important factors affecting the performance of value chains.
At the heart of the agricultural value chain concept is the idea of actors connected along a
chain producing and delivering goods to consumers through a sequence of activities
(Henriksen, et al. 2004). However, this “vertical” chain cannot function in isolation and an
important aspect of the value chain approach is that it also considers “horizontal” impacts on
the chain, such as input and finance provision, extension support and the general enabling
environment (Sharma, et al., 2010; Olagunju, 2013
Value Chain Challenges of Agro-Allied SMEs
Low Productivity: One of the challenges faced by SMEs in promoting agricultural value
chain is low productivity. According to Aremu and Adeyemi, (2011), there is an inverse
relationship between growth in the area of cultivated land and yields for virtually all crops.
Crop yields in the country are lower than most other countries, both in food and cash crop
and animal husbandry. Many factors are responsible for the low productivity in the sector.
These according to Oboh, (2008); Olagunju and Ajiboye (2010) include, ineffective
extension and advisory services, low adoption of improved seeds, poor quality inputs and
inefficient weak input distribution system, low levels of mechanization and irrigation
facilities, poor access to credit, poorly managed soil fertility profile, ageing farming
population as a result of rural-urban migration by the youths, high drudgery (physical effort
per output), unattractive environment and poor morale among farmers.
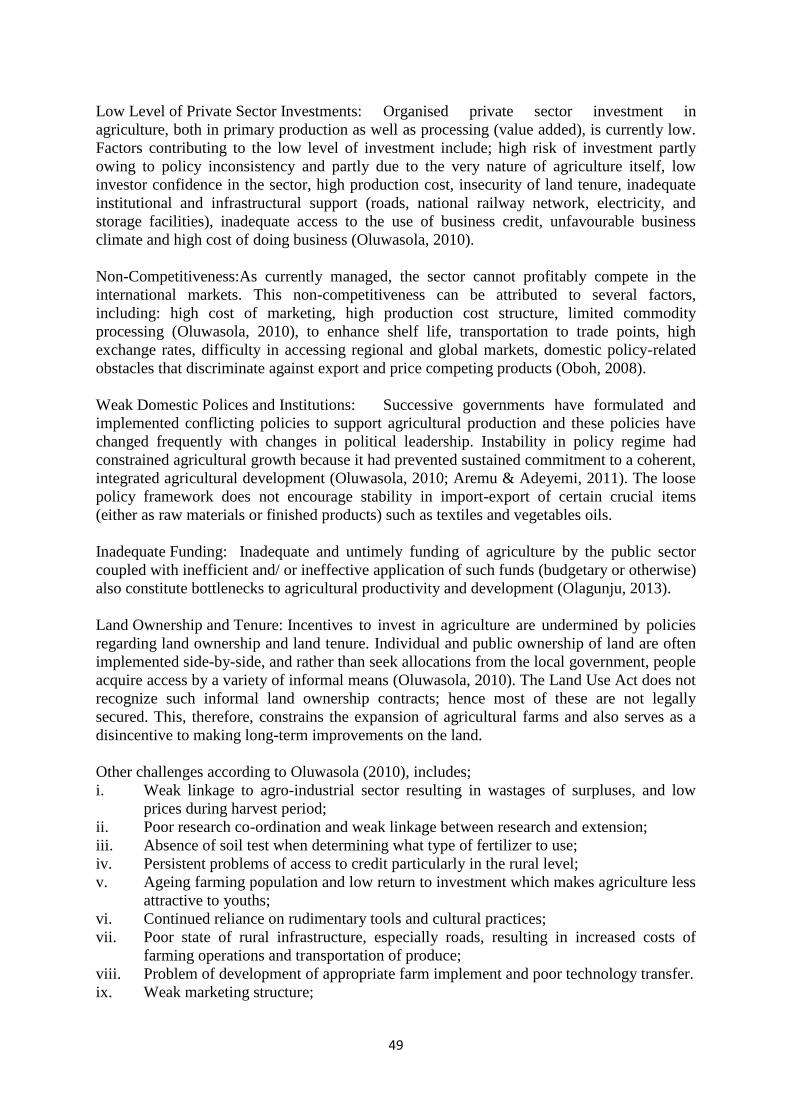
49
Low Level of Private Sector Investments: Organised private sector investment in
agriculture, both in primary production as well as processing (value added), is currently low.
Factors contributing to the low level of investment include; high risk of investment partly
owing to policy inconsistency and partly due to the very nature of agriculture itself, low
investor confidence in the sector, high production cost, insecurity of land tenure, inadequate
institutional and infrastructural support (roads, national railway network, electricity, and
storage facilities), inadequate access to the use of business credit, unfavourable business
climate and high cost of doing business (Oluwasola, 2010).
Non-Competitiveness:As currently managed, the sector cannot profitably compete in the
international markets. This non-competitiveness can be attributed to several factors,
including: high cost of marketing, high production cost structure, limited commodity
processing (Oluwasola, 2010), to enhance shelf life, transportation to trade points, high
exchange rates, difficulty in accessing regional and global markets, domestic policy-related
obstacles that discriminate against export and price competing products (Oboh, 2008).
Weak Domestic Polices and Institutions: Successive governments have formulated and
implemented conflicting policies to support agricultural production and these policies have
changed frequently with changes in political leadership. Instability in policy regime had
constrained agricultural growth because it had prevented sustained commitment to a coherent,
integrated agricultural development (Oluwasola, 2010; Aremu & Adeyemi, 2011). The loose
policy framework does not encourage stability in import-export of certain crucial items
(either as raw materials or finished products) such as textiles and vegetables oils.
Inadequate Funding: Inadequate and untimely funding of agriculture by the public sector
coupled with inefficient and/ or ineffective application of such funds (budgetary or otherwise)
also constitute bottlenecks to agricultural productivity and development (Olagunju, 2013).
Land Ownership and Tenure: Incentives to invest in agriculture are undermined by policies
regarding land ownership and land tenure. Individual and public ownership of land are often
implemented side-by-side, and rather than seek allocations from the local government, people
acquire access by a variety of informal means (Oluwasola, 2010). The Land Use Act does not
recognize such informal land ownership contracts; hence most of these are not legally
secured. This, therefore, constrains the expansion of agricultural farms and also serves as a
disincentive to making long-term improvements on the land.
Other challenges according to Oluwasola (2010), includes;
i. Weak linkage to agro-industrial sector resulting in wastages of surpluses, and low
prices during harvest period;
ii. Poor research co-ordination and weak linkage between research and extension;
iii. Absence of soil test when determining what type of fertilizer to use;
iv. Persistent problems of access to credit particularly in the rural level;
v. Ageing farming population and low return to investment which makes agriculture less
attractive to youths;
vi. Continued reliance on rudimentary tools and cultural practices;
vii. Poor state of rural infrastructure, especially roads, resulting in increased costs of
farming operations and transportation of produce;
viii. Problem of development of appropriate farm implement and poor technology transfer.
ix. Weak marketing structure;

50
x. Poor data for planning purposes arising from inadequate collaboration among the
Ministries of Agriculture and Water Resources, National Bureau of Statistics, and
other stakeholders.
Empirical Review
In a study on Agboje and Omonona, (2013) Growth in oil-palm value chain under Micro-
enterprises in Delta State, Nigeria. The survey used the primary data, obtained through a
structured questionnaire, while the sample was selected using multi-stage sampling
technique. The descriptive statistics such as percentages and charts were used to identify the
actors in the chain and their socioeconomic characteristics. The major actors in the chain
include the oil-palm producers/growers, processors (oil-extractors), marketers (wholesalers
and retailers) and consumers of palm oil, kernel oil and palm-wine. The value added by each
core actors in the chain were represented using charts and an ordinary least square model was
used to identify factors influencing growth among the core players in the chain by adopting
Evans Growth Model, using size and age as independent variables, while dependent variable
corresponds to the average annual sales growth rate.
The findings revealed that, among the processors, factors influencing sales growth include
years of operation and labour size of the firm, the number of working days and belonging to a
trade union/association and the sales growth are constrained by the high cost of inputs,
transportation cost, and social conflict. On the other hand, years of operation and labour size
are the factors influencing the sales growth of the marketers, and the need to increase labour
size is influenced by the need to increase working days. Nevertheless, the marketer’s sales
growth is constrained by inability to store produce for a preferred length of time.
Olagunju (2013) explored the structure, the financial viability of agro-processing industries
and the effect of credit access on value addition by different agro-processing units in Oyo
State, Nigeria. A multistage random sampling method was used to select a sample of 160
credit and non-credit agro-processors by using proportional allocation method. The data were
analyzed using descriptive statistics. The extent of value addition has been about 34% and
20% for credit and non-credit users in the cassava mill sector respectively. The maximum
value addition has been observed in fruits/vegetable processing (103%) followed by cashew
based units. The results obtained for the processors with credit indicated that they are
efficient than their counterparts producing without credit.
This result points to the positive impact of credit on value chain activities. There was under
capacity utilization in almost all types of processing industries in the state due to lack of
adequate supplies of raw material, bottlenecks in market penetration and marketing strategies,
inadequate credit. The break-even output is very low hence the agro industries in the state
were running into loss due to low capacity utilization. Improvement in basic infrastructure
like developing railway links, metallic roads, cool chains, adequate/ uninterrupted power
supply, disposal of sewage/ industrial effluents, housing, control of traffic congestion can
bring a positive change on resource utilization.
According to Akenbor and Okoye (2011) carried out a study on the impact of the Value-
Chain Analysis on Competitive Advantage of manufacturing firms in Nigeria. Financial
statements of One hundred (100) of companies were identified. In testing the hypothesis, the
multiple regression analysis was employed, the findings revealed that a multiple correlation
co-efficient of 0.87, which is close to one (1) from the positive side, that there is a strong
positive relationship between the dependent variable and the Independent Variables. The P-
51
Values associated with NPBT and INV, that is 0.0002 and 0.0387 indicate a significant
impact, the P-Value associated with OPEREF (0.8091), revealed an insignificant impact.
Therefore the result suggests that the Value-Chain Analysis has a positive impact on the
market share of a manufacturing firm though insignificant.
Theoretical Framework
According to Kaplinsky and Morris (2001) the value chain describes the full range of
activities that are required to bring a product from its conception to its end use and beyond.
This includes activities such as design, production, marketing, distribution and support to the
final consumer. These activities can take place within a firm or among different firms in one
or several geographical locations. This characteristic of physically transforming products
over time and their distribution over geographical locations is known as input-output
relations.
Early studies on chains were conducted already in the 1960s. The filière concept was
introduced after analyzing the value added process in U.S. agricultural research and the
processes of vertical integration and contract manufacturing in French agriculture (Raikes et
al. 2000). Although the filière approach was applied in the French colonial policy on the
agricultural sector at the time, it was the later work that gave the filière analysis an additional
political economy dimension, since it studied the role of public institutions. Nevertheless, the
filière was viewed as having a static character because it only reflected relations at a certain
point in time and generally stopped at national boundaries.
Upgrading refers to the acquisition of technological capabilities and market linkages that
enable firms to improve their competitiveness and move into higher-value activities
(Kaplinksy and Morris 2001). Upgrading in firms can take place in the form of:
i. Process upgrading - increasing the efficiency of internal processes such that these are
significantly better than those of rivals, both within individual links in the chain, and
between the links in the chain.
ii. Product upgrading - introducing new products or improving old products faster than
rivals. This involves changing new product development processes both within
individual links in the value chain and in the relationship between different chain links.
iii. Functional upgrading - increasing value added by changing the mix of activities
conducted within the firm or moving the locus of activities to different links in the value
chain.
Difficulties with this classification include that of distinguishing product and process
upgrading in specific instances (especially for agricultural products, where for example the
introduction of organic processes generates a new category of product) (Gibbon 2003).
Kaplinsky and Readman (2001) underline that there is a hierarchy or a trajectory that is
important for SMEs. It is one which begins with process upgrading, then moves to product
upgrading, to functional upgrading and last of all, to chain upgrading.
Gibbon (2003) suggests that a first step in understanding upgrading opportunities available to
producers in particular global value chains (in this case: producers in developing countries) is
to spell out the reward structures of these chains, and the nature of the roles that currently
trigger rewards. A second step is to outline preconditions or mechanisms for achieving these
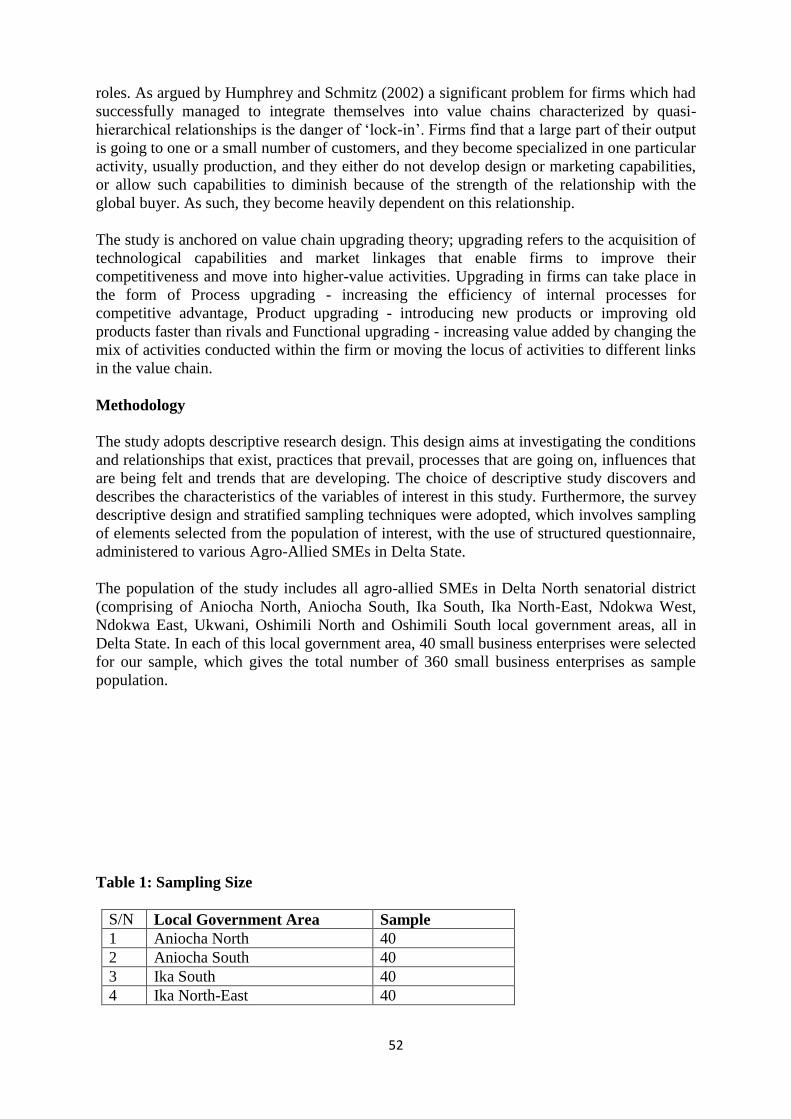
52
roles. As argued by Humphrey and Schmitz (2002) a significant problem for firms which had
successfully managed to integrate themselves into value chains characterized by quasi-
hierarchical relationships is the danger of ‘lock-in’. Firms find that a large part of their output
is going to one or a small number of customers, and they become specialized in one particular
activity, usually production, and they either do not develop design or marketing capabilities,
or allow such capabilities to diminish because of the strength of the relationship with the
global buyer. As such, they become heavily dependent on this relationship.
The study is anchored on value chain upgrading theory; upgrading refers to the acquisition of
technological capabilities and market linkages that enable firms to improve their
competitiveness and move into higher-value activities. Upgrading in firms can take place in
the form of Process upgrading - increasing the efficiency of internal processes for
competitive advantage, Product upgrading - introducing new products or improving old
products faster than rivals and Functional upgrading - increasing value added by changing the
mix of activities conducted within the firm or moving the locus of activities to different links
in the value chain.
Methodology
The study adopts descriptive research design. This design aims at investigating the conditions
and relationships that exist, practices that prevail, processes that are going on, influences that
are being felt and trends that are developing. The choice of descriptive study discovers and
describes the characteristics of the variables of interest in this study. Furthermore, the survey
descriptive design and stratified sampling techniques were adopted, which involves sampling
of elements selected from the population of interest, with the use of structured questionnaire,
administered to various Agro-Allied SMEs in Delta State.
The population of the study includes all agro-allied SMEs in Delta North senatorial district
(comprising of Aniocha North, Aniocha South, Ika South, Ika North-East, Ndokwa West,
Ndokwa East, Ukwani, Oshimili North and Oshimili South local government areas, all in
Delta State. In each of this local government area, 40 small business enterprises were selected
for our sample, which gives the total number of 360 small business enterprises as sample
population.
Table 1: Sampling Size
S/N Local Government Area Sample
1 Aniocha North 40
2 Aniocha South 40
3 Ika South 40
4 Ika North-East 40
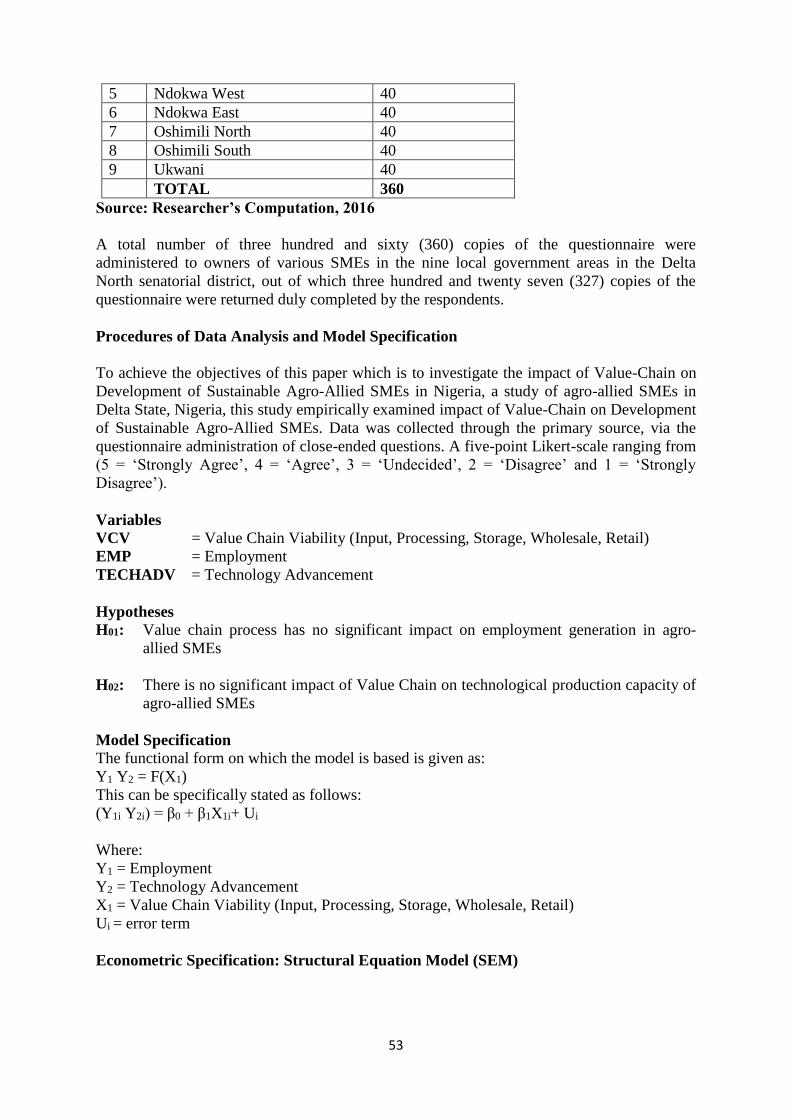
53
5 Ndokwa West 40
6 Ndokwa East 40
7 Oshimili North 40
8 Oshimili South 40
9 Ukwani 40
TOTAL 360
Source: Researcher’s Computation, 2016
A total number of three hundred and sixty (360) copies of the questionnaire were
administered to owners of various SMEs in the nine local government areas in the Delta
North senatorial district, out of which three hundred and twenty seven (327) copies of the
questionnaire were returned duly completed by the respondents.
Procedures of Data Analysis and Model Specification
To achieve the objectives of this paper which is to investigate the impact of Value-Chain on
Development of Sustainable Agro-Allied SMEs in Nigeria, a study of agro-allied SMEs in
Delta State, Nigeria, this study empirically examined impact of Value-Chain on Development
of Sustainable Agro-Allied SMEs. Data was collected through the primary source, via the
questionnaire administration of close-ended questions. A five-point Likert-scale ranging from
(5 = ‘Strongly Agree’, 4 = ‘Agree’, 3 = ‘Undecided’, 2 = ‘Disagree’ and 1 = ‘Strongly
Disagree’).
Variables VCV = Value Chain Viability (Input, Processing, Storage, Wholesale, Retail)
EMP = Employment
TECHADV = Technology Advancement
Hypotheses
H01: Value chain process has no significant impact on employment generation in agro-
allied SMEs
H02: There is no significant impact of Value Chain on technological production capacity of
agro-allied SMEs
Model Specification The functional form on which the model is based is given as:
Y1 Y2 = F(X1)
This can be specifically stated as follows:
(Y1i Y2i) = β0 + β1X1i+ Ui
Where:
Y1 = Employment
Y2 = Technology Advancement
X1 = Value Chain Viability (Input, Processing, Storage, Wholesale, Retail)
Ui = error term
Econometric Specification: Structural Equation Model (SEM)
54
The specified model for this study employed Structural Equation Model (SEM) technique.
Structural Equation Model is a path analysis which shows the relationship between multiple
dependent and multiple independent variables using diagrams to show the impact of the
independent variables on the dependent variable through arrows. A directional model is also
known as recursive model. A bi-directional model is known as a non-recursive model. This
research is directional (recursive) structural model because it has three dependent and one
independent variable, hence the justification for the adoption of the structural equation model.
Result and Interpretation
On the question if Agro-Allied SMEs in the Value chain process require more skilled and
unskilled manpower, the analysis shows that 105 respondents representing 32.1% strongly
agree, 129 respondents representing 39.5% agree that, Agro-Allied SMEs in the Value chain
process require more skilled and unskilled manpower for performance and growth, while 18
respondents representing 5.5% are undecided. However, 41 respondents representing 12.5%
disagree, while 34 respondents representing 10.4% strongly disagree. This indicates that for
agro-allied SMEs to perform and growth, there is need to have both skilled and unskilled
manpower.
Respondents were asked if Value chain process has a significant effect on employment
generation in agro-allied SMEs. The analysis revealed that, 104 respondents which represent
31.8% strongly, 167 respondents representing 51.1% agree that, Value chain process has a
significant effect on employment generation in agro-allied SMEs. 13 respondents
representing 4% are undecided, while a 25 and 18 respondents which represents 7.6% and
5.5% disagree and strongly disagree respectively. This shows that, Value chain process has a
significant effect on employment generation in agro-allied SMEs.
Respondents were asked if the Value Chain process encourages technological advancement
among agro-allied SMEs in Nigeria, 86 respondents representing 26.3% strongly agree, while
106 respondents representing 32.4% agree that, the Value Chain process encourages
technological advancement among agro-allied SMEs in Delta State. However, 53 respondents
representing 16.2% were undecided, 36 respondents representing 11% disagree, while 48
respondents representing 14.1% strongly disagreed. This shows that, majority of the
respondents representing 58.7% agree with the statement that, the Value Chain process
encourages technological advancement among agro-allied SMEs in Nigeria
The analysis further determined whether technological advancement via value chain
improves production capacity of agro-allied SMEs; 136 respondents representing 41.6%
strongly agree and 122 respondents representing 37.3% agree with the statement that,
technological advancement via value chain improves production capacity of agro-allied
SMEs. 27 respondents representing 8.3% are undecided, while 54 respondents representing
16.5% disagree and 61 respondents representing 18.7% strongly disagreed. This shows that,
majority of the respondents agree with the statement that, technological advancement via
value chain improves production capacity of agro-allied SMEs.
Finally, the respondents were asked if there is a significant impact of Value chain on
development of agro-allied SMEs in Delta State; of which 111 respondents representing
33.9% strongly agreed, 125 respondents representing 28.2% agreed with the statement that,
there is a significant impact of Value chain on development of agro-allied SMEs in Delta
State, while 29 respondents representing 8.9% of the total sample size are undecided.
However, 35 and 27 respondents representing 10.7% and 8.3% disagree and strongly disagree
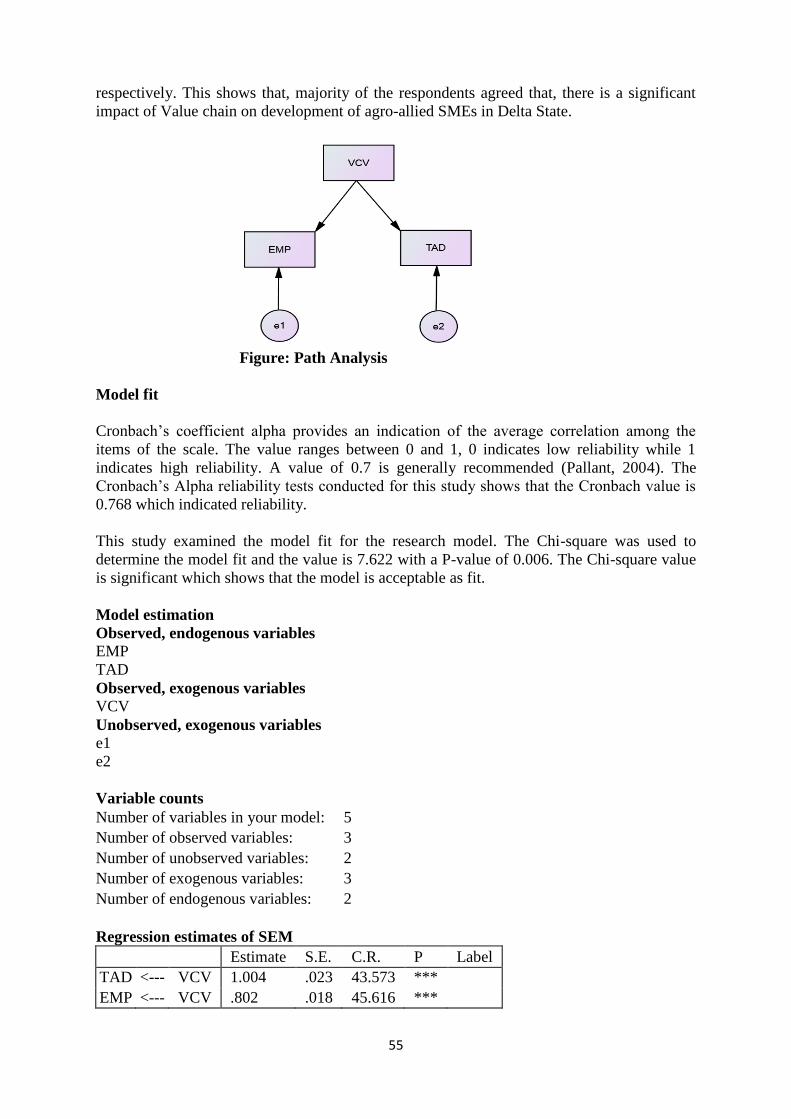
55
respectively. This shows that, majority of the respondents agreed that, there is a significant
impact of Value chain on development of agro-allied SMEs in Delta State.
Figure: Path Analysis
Model fit
Cronbach’s coefficient alpha provides an indication of the average correlation among the
items of the scale. The value ranges between 0 and 1, 0 indicates low reliability while 1
indicates high reliability. A value of 0.7 is generally recommended (Pallant, 2004). The
Cronbach’s Alpha reliability tests conducted for this study shows that the Cronbach value is
0.768 which indicated reliability.
This study examined the model fit for the research model. The Chi-square was used to
determine the model fit and the value is 7.622 with a P-value of 0.006. The Chi-square value
is significant which shows that the model is acceptable as fit.
Model estimation
Observed, endogenous variables
EMP
TAD
Observed, exogenous variables
VCV
Unobserved, exogenous variables
e1
e2
Variable counts
Number of variables in your model: 5
Number of observed variables: 3
Number of unobserved variables: 2
Number of exogenous variables: 3
Number of endogenous variables: 2
Regression estimates of SEM
Estimate S.E. C.R. P Label
TAD <--- VCV 1.004 .023 43.573 ***
EMP <--- VCV .802 .018 45.616 ***
56
The relationship between Value Chain Viability and employment shows a positive impact.
That is, Value Chain Viability impact on employment by 0.802. This means that there will be
increase in employment for a unit increase in Value Chain Viability this increase is about by
80.2%. The result also revealed that the P-value of the relationship is less than 0.05 (***)
indicated a significant relationship at 5%. This implies that there are enough reasons to reject
the null hypothesis and accept the alternate hypothesis that; Value chain process has a
significant impact on employment generation in agro-allied SMEs.
The coefficient of Technological advancement shows that there is a positive relationship
between value chain viability and technological advancement. The value of the coefficient
shows that a unit increase in the level of value chain viability will increase the level of
technological advancement by 1.004 units. The P-value also indicated a significant
relationship, i.e. there are no enough reasons to uphold the null hypothesis, hence accept the
alternate hypothesis, there is a significant impact of Value Chain on technological production
capacity of agro-allied SMEs.
Conclusion and Recommendations
In conclusion, performance and growth of Agro-Allied SMEs is a factor of increased
profitability, which is an effect of increased employment of individuals with technical
expertise, technological advancement in local production and increased output capacity in a
viable value chain process.
In view of the findings, the following recommendations are here suggested:
i. The government and Policy makers should create more awareness of the importance of
the value chain system, putting in place measures to adequately encourage more Small
and Medium Enterprises to participate in the agro-business.
ii. Since the value chain process creates avenues for employment generation, it is
recommended that the government should focus on the development of the agricultural
sector, in order to create more jobs for the increasing unemployed.
iii. Also, with the viability of the value chain process, there is need for the government to
encourage local manufacturing of the needed technology, as this will increase technical
expertise and help boost the processing and packaging of agricultural produce in Delta
State.
References
1. Agboje, I. A. & Omonona, B. T. (2013) Growth in Oil-palm Value Chain under Micro-
Enterprises in Delta State, Nigeria: International Journal of Research in Management,
Economics and Commerce: Volume3, Issue 5
2. Ajayi S (2000) Gender Roles in Subsistence Crop Production in Kwara State, Nigeria
Agrosearch: A J Agric Food Dev 1(2): 145– 151

57
3. Akenbor, C. O. & Okoye, E. I. (2011) An Empirical Investigation of Value-Chain
Analysis and Competitive Advantage in the Nigerian Manufacturing Industry: An
International Multidisciplinary Journal, Ethiopia; Vol. 5 (6), Serial No. 23, Pp. 188-198
4. Altenburg, T. (2006). Donor approaches to supporting pro-poor value chains. Donor
Committee for Enterprise Development. Working Group on Linkages and Value Chains.
http://www.enterprisedevelopment. org/page/linkages-value-chains
5. Aremu MA (2004) Small Scale Enterprises: Panacea to Poverty Problem in Nigeria;
Journal of Enterprises Development, International Research and Development Institute,
Uyo, Akwa Ibom, Nigeria, I(1): 1 -8
6. Aremu MA, & Adeyemi S.L. (2011) Small and Medium Scale Enterprises as a Survival
Strategy for Employment Generation in Nigeria; Journal of Sustainable Development
www.ccsenet.org/jsd 4(1): 200-206
7. Gibbon, P. (2003) Upgrading Primary Production: A Global Commodity Chain
Approach. World Development Vol.29, No.2 Global Agriculture Information Network,
2009
8. Haggblade, S., Theriault, V., Staatz, J., Dembele, N. & Diallo, B. (2012) A Conceptual
framework for promoting inclusive agricultural value chains; Michigan State University
9. Henriksen, L.; L. Riisgaard, S. Ponte, F. Hartwich & P. Kormawa. (2004) Agro –Food
Value Chain Interventions in Asia: A review and nalysis of case studies, Working Paper;
UNIDO
10. Humphrey, J., & Schmitz H. (2002a). How Does Insertion in Global Value Chains Affect
Upgrading Industrial Clusters? Regional Studies, Vol. 36, No.9.
11. Humphrey, J., & Schmitz, H. (2002b). Developing Country Firms in the World Economy:
Governance and Upgrading in Global Value Chains. INEF Report, No. 61. Duisburg:
University of Duisburg.
12. Ikwouria, G. A. and Gate, J. (2008) Contemporary Issues in Cost Management, New
York, The Free Press.
13. Kaplinsky, R. & Morris. M.L. (2002). A Handbook for Value Chain Research. Institute of
Development Studies, University of Sussex and School of Development Studies,
University of Natal, www.ids.ac.uk/global , and www.nu.ac.za/csds .
14. Kaplinsky, R., & Readman, J. (2001). How Can SME Producers Serve Global Markets
and Sustain Income Growth? Mimeo, Brighton: University of Brighton and University of
Sussex. http://www.ids.ac.uk/ids/global/valchn.html
15. Lusby, F. and H. Panlibuton (2007). Value Chain Program Design: Promoting market-
based solutions for MSME Industry Competitiveness. USAID/Action for Enterprise
(AFE), Washington D.C
16. Miller, C. and Silva, L. (2007) Agricultural Value Chain Finance: Tools and Lessons;
FAO And Practical Action
17. Oboh V.U. (2008) Farmer’s allocative behaviour in credit utilization: a case study of
arable crop farmers in Benue State, Nigeria. Ph.D. Thesis, Agricultural Economics,
Abubakar Tafawa Balewa University, Bauchi, Nigeria
18. Ogbo, A. & Nwachukwu, A.C (2012) The Role of Entrepreneurship in Economic
Development: The Nigerian Perspective: European Journal of Business and
Management; Vol 4, No.8,
19. Olagunju F.I. & Ajiboye, A. (2010) Agricultural Lending Decision: A Tobit Regression
Analysis. Agricultural Journal of Food and Nutrition; 10 (5): 2515-2541
20. Olagunju F.I. (2013) Impact of credit access on value chain activities of Agro-Processing
Industries in Oyo State, Nigeria: International Journal of AgriScience Vol. 3(8): 636-648,
21. Oluwasola O (2010) Stimulating Rrural Employment and Income for Cassava Processing
Farming Households in Oyo State, Nigeria through Policy Initiatives, Journal of
Development and Agricultural Economics. 2(2):18-25

58
22. Robson G, Gallagher C (1993) The Job Creation Effects of Small and Large Firm
Interaction International Small Business Journal. 12:23-37
23. Sharma KD, Pathania MS, Harbans Lal (2010) Value Chain Analysis and Financial
Viability of Agro-Processing Industries in Himachal Pradesh; Agricultural Economics
Research Review 23: 515-522
24. United Nation Industrial Development Organization (UNIDO) (2009) Value Chain
Diagnostics for Industrial Development: Building blocks for a holistic and rapid
analytical tool: UNIDO Working Paper, Vienna
25. Webber, C.M & Labaste, P (2010) Building Competitiveness in Africa’s Agriculture; A
Guide to Value Chain Concepts and Applications: Washington, the International Bank for
Reconstruction and Development / The World Bank
26. World Bank, (2008) World Development Report. Washington, Oxford University Press
for the World Bank
59
IMPACT OF MODIFIED SNAKES AND LADDERS LUDO GAME IN TEACHING
ENTREPRENEURIAL-RELATED PERSONAL QUALITIES IN MIDDLE BASIC
LEVELS
Muhammed, Aminu1, Salihu, Jamilu Ja’afar 2 & H.I.R Bayero (Ph.D) 3
1&2 Ph. D students, Department of Arts and Social Science Education, Ahmadu Bello
University, Zaria-Nigeria
3 Senior Lecturer, Department of Arts and Social Science Education, Ahmadu Bello
University, Zaria-Nigeria
Presenting Author: [email protected]
Abstract
The study was conducted to determine the Impact of Modified Snakes and Ladders Ludo
Game in Teaching Entrepreneurial-related Personal Qualities in Middle Basic Levels. The
research is specifically aimed at achieving two objectives which are; to ascertain the
cognition levels of Middle Basic Level Pupils taught entrepreneurial-related personal
qualities with Modified Snakes and Ladders Ludo Game and Pupils taught entrepreneurial-
related personal qualities using story telling method and to determine whether gender affects
the cognition levels of Pupils taught entrepreneurial-related personal qualities with Modified
Snakes and Ladders Ludo game. In the light of the above, two research questions and two
null hypotheses were stated. The non-equivalent comparison group design was used and the
Middle Basic Level III Pupils in Zaria Education Zone were the target population. The
purposive sampling technique was used in selecting 120 participants. The study used Middle
Basic Level Achievement Test (MIBLAT) as data collection instrument. The instrument was
duly validated. The Guttmann Split half procedure was used to determine the reliability
coefficient of the instrument and 0.82 was obtained. The arithmetic mean and standard
deviation were used to answer the questions raised by the study while independent sample t-
test and paired t-test were used to validate the null hypotheses at 0.05 level of significance.
The study discovered significant difference between the cognition levels of Pupils taught
entrepreneurial-related personal qualities by means of Modified Snakes and Ladders Ludo
game and their counterparts taught using storytelling method in favour of Pupils in the
experimental group. The findings also revealed no significant difference between the
cognition levels of Boys and Girls who were taught entrepreneurial-related personal qualities
using Modified Snakes and Ladders Ludo game. In view of the above, the study recommends
the adoption of Modified Snakes and Ladders Ludo game in teaching entrepreneurial-related
personal qualities as it enhances Middle Basic Pupils’ cognition levels and retention and for
the fact that it is gender-friendly approach to teaching.
Key words: Entrepreneurial, Ladder, Ludo, Snake, Personal Qualities, Middle Basic.
Introduction
The purpose of education is to develop knowledge, skills, values, attitudes, character and
competencies of learners to make them responsive and responsible citizens. Education is
very important for an individual’s life. Education is a major aspect of development of
any modern society. The importance of education is evident at every stage of education
whether at Primary, Junior Secondary, Senior Secondary and in Higher education. Therefore,
60
the choice of effective and relevant teaching techniques by a qualified teacher putting into
consideration the topic to be taught, the learning experience that need to be developed, the
learners’ level and ability is the starting point and a sound foundation for attaining effective
transaction and communication between teacher and learners.
One of the disturbing issue facing teachers today is that of engaging a wide and diverse group
of learners’. Learners as a result of entry behaviour and of course family background come to
the school with varying degrees of motivation, commitment, ability, and learning styles or
approaches. According to Azriel, Erthal, and Starr (2005), ‘regardless of age or economic,
ethnic, or social background, people understand the language of play’. Games offer a medium
for students to explore and interrogate information in a fun and interactive way. This type of
animated learning environment is critical for engaging students in the learning given the
prominence of iPods, game boys, play stations and a wide variety of highly entertaining and
Sci-fi television in young people’s lives today. A passive learning environment will not
stimulate them as they are used to greater pace and interactivity in life in general and so it is
natural that they will need excitement and interactivity to support their learning. In this
regard, Biggs (2003) states that active participation in teaching and learning process by the
students is better than being passive. Effective teaching methods stimulate students’ interest
which therefore forms a base for achieving desired objectives of teaching and learning.
According to Salen & Zimmerman (2003) “A game is a system in which players engage in an
artificial conflict, defined by rules that result in a quantifiable outcome.” In a related
development, Gredler (1992) defined games as any contest among adversaries (players)
operating under constraints (rules) for an objective (winning)”. Regardless of the format of
the game, students can simultaneously build their problem solving skills while having fun
throughout the process if an instructional game is well-designed (MacKenty, 2006; Harris,
2009). Apart from sharing the view that games are an important and powerful educational
tool, Evans (1979) adds that games can be used for a variety of specific purposes like as
icebreakers, for social activities or even therapy.
The main reason why games are considered effective learning resources is that "they spur
motivation and students get very absorbed in the competitive aspects of the games; moreover,
they try harder at games than in other courses" (Avedon, 1971) in Kirkland and O’Riordan
(2010). Naturally when playing games, students are trying to win or to beat other teams for
themselves or on the behalf of their team. They are so competitive while playing because they
want to have a turn to play, to score points and to win. In the class, students will definitely
participate in the activities. Therefore, it is possible for a teacher to introduce students to new
ideas, skills, values, attitudes, knowledge and so on. It can be clearly seen that games can
capture students' attention and participation. They can motivate students to want to learn
more. Moreover, they can transform a boring class into a challenging one (Kirkland and
O’Riordan (2010). Furthermore, Ruben (1999) also claims that games can motivate students
to learn from a social or affiliated need when the author claims that games offer an
opportunity to promote collaboration and fosters active learning. Gaining skills in a variety of
teaching methods are a fundamental part of the education of teachers. Different teaching
strategies develop different skills in the learners. Varieties of teaching strategies make the
teachers’ job more stimulating and enjoyable and less boredom.
The importance of entrepreneurship for economic development cannot be over emphasized.
Entrepreneurship is assumed to be a major source of innovation, job creation and growth
(Audretsch, Carree, Van Stel and Thurik, 2002). Indeed, entrepreneurial behavior in its
broader sense has become more important in our society (Gavron, Cowling, Holtham and
61
Westall, 1998) where people face a more uncertain work environment, with multiple job
shifts during a career, greater prospects of becoming self-employed, and where tasks
increasingly require qualities such as independence, initiative and creativity (Bridge, O’Neill
and Cromie, 1998). According to the National Bureau of Statistics (NBS), recent statistics
show that unemployment rate in Nigeria has increased to 23.9 percent during the first half of
the year 2014. In addition, to the already daunting statistics of over 43 million unemployed
youths, an additional 1.8 million people joined the long queue. This was attributed to fresh
entrants to the job market and worker layoffs across all sectors of the economy in the year. In
a related development, Agi and Arikawei (2011) state that over 200,000 graduates are
produced each year, only 25% are absorbed in the labour market. The remaining 75% are left
in the labour market perpetually looking for jobs. Hence, this alarming rate of youth
unemployment tell on the level of insecurity in the country whereby youths are involved in
terrorism, kidnapping, armed robbery, theft etc.
Youth unemployment is no doubt one of the biggest problems in Nigeria threatening its
national security, considering the inability of the government to adequately engage the
teeming youth population to be productive. In this regard, Salihu, Muhammed and Bayero
(2016) in a study discovered that inculcating entrepreneurial qualities and values to learners’
at initial education (Primary and Secondary Schools) will assist in mitigating graduate
unemployment in Nigeria. It has been observed that Nigerian graduates lack entrepreneurial
personal qualities necessary to succeed in the world of business and as a result it is suggested
that entrepreneurial qualities be taught early to learners at initial education. This necessitated
the need to inculcate entrepreneurial qualities in the Nigerian child-learners at the Lower and
Middle-Basic levels education so they will grow with it. These entrepreneurial personal
qualities like; determination, prudence, confidence, commitment, dedication, optimism,
passion, open-mindedness, resourcefulness, objectivity, interpersonal relation and risk-
taking etc. enable individuals to cope with and contribute to rapid social and economic
change (Gibb and Cotton, 1998) cited in van der Kuip & Verheul, (2003). It is against this
background that this study examines the Impact of Modified Snakes and Ladders Ludo game
in Teaching Entrepreneurial-related Personal Qualities at Middle-Basic level.
Objectives of the Study
The main objective of the study is to examine the Impact of Modified Snakes and Ladders
Ludo Game in Teaching Entrepreneurial-Related Personal Qualities in Middle Basic Levels.
The research is specifically aimed at achieving two objectives which are to:
1. ascertain the cognition levels of Middle Basic Level Pupils taught entrepreneurial-
related personal qualities with Modified Snakes and Ladders Ludo Game and Pupils
taught entrepreneurial-related personal qualities using Story-telling method;
2. determine whether gender affects the cognition levels of Pupils taught
entrepreneurial-related personal qualities using Modified Snakes and Ladders Ludo
game.
Research Questions
The study answered the following questions:
1. to what extent do cognition levels of Middle Basic Pupils taught entrepreneurial-
related personal qualities with Modified Snakes and Ladders Ludo Game and Pupils
taught using Story-telling method differ?
62
2. how does gender affects the cognition level of Middle Basic Pupils taught
entrepreneurial-related personal qualities using Modified Snakes and Ladders Ludo
game?
Null Hypotheses
In the light of the above, it is hypothesized thus:
H01: there is no significant difference in the cognition levels of Middle Basic Pupils taught
entrepreneurial-related personal qualities using Modified Snakes and Ladders Ludo
game and Pupils taught with Story-telling method;
H02: there is no significant difference in the cognition levels of Boys and Girls Middle
Basic Pupils taught entrepreneurial-related personal qualities using Modified Snakes
and Ladders Ludo game.
Scope of the Study
The study examined the Impact of Modified Snakes and Ladders Ludo game in teaching
entrepreneurial-related personal qualities in Middle-Basic level. The Middle-Basic III Pupils
from four (4) schools are used in the study. Social studies as a core course offered at the level
is used as it teaches Pupils basic personal qualities which ensure success in the world of
business.
Empirical Studies
This study made an attempt to review some empirical findings with regards to the use of
games on students’ cognition, academic performance and retention. However, special
consideration is given to Snakes and Ladders Ludo on its application to enhance effective
transaction and communication between teacher and the students (Pupils). The review is an
attempt to identify the gaps left unfilled by other researchers. Below are some of the studies
conducted in relation to Snake and Ladder Ludo game.
A study by Adoke (2015) investigated the “Effects of Simulation Games teaching strategy on
the academic performance of Upper Basic level students in Civic Education in Kaduna State,
Nigeria”. Participants were drawn from basic levels 8 and 9 of Demonstration Secondary
School, Federal College of Education, Zaria and Government Secondary School Tudun-Saibu
Zaria. The data for the study was collected using a teacher-made test. The design adopted for
the study was quasi- experiment. The total number of students used for the research was sixty
(60) in which simulation games and traditional teaching strategies were used to teach the
content after the pre-test in order to ascertain the significant difference between the two
teaching strategies. The data gathered for the study were analyzed via two-sample t-test
statistics at 0.05 level of significance. Three (3) research hypotheses were proposed for the
study. The data revealed that a simulation game teaching strategy increased students’
academic performance and it also has equal positive impact on all levels of the Upper Basics.
The fundamental difference between Adoke’s study and the current study is in the population.
The current study used Middle Basic III Pupils while Adoke’s work used Upper Basic
students in Civic Education classes. The current study centred on impact of Snakes and
Ladders Ludo game in teaching entrepreneurial-related personal qualities while that of Adoke
(2015) looked into the use of Snakes and Ladders game in teaching positive social attitudes
and values. This study is an attempt to ascertain whether Snakes and Ladders Ludo game can
63
be effective in teaching entrepreneurial-related personal qualities among Middle-Basic
Pupils.
In a related development, Obeka (2009) conducted a research using EPODEWALAD
Simulation, Power Simulation and Conventional Lecture method. In the study Obeka (2009)
made use of four Senior Secondary Schools in Otukpo Urban area of Benue State. The
population covered all SSII Geography students in the four Senior Secondary Schools in
Otukpo Local Government Area where 492 students were used. The study found out that
EPODEWALAD group scored significantly higher than POWER Simulation group and
POWER Simulation scored significantly higher than lecture group. The slight difference
between the two studies is that the reviewed study made use of Erosion, Pollution,
Deforestation, Waste Disposal, and Land Degradation (EPODEWALAD) Simulation Game
while the current study made use of Snakes and Ladders ‘Ludo’ game. This current study
compared Snakes and Ladders Ludo game with storytelling teaching strategy, while that of
Obeka (2009) study compared Simulation game (EPODEWALAD), with Power Simulation
and Lecture method. Another difference between the two studies is that the reviewed study
was conducted in Otukpo LGA while this current study was conducted in Zaria Education
Zone, Kaduna state, Nigeria. The Obeka’s study used four Senior Secondary schools in the
urban areas of Otukpo LGA while this study made use of four Middle Basic III Pupils in
Zaria Education Zone, Kaduna state, Nigeria. The sample size of Obeka’s study was 492
Senior Secondary school students while the current study covered 120 Middle Basic VI
Pupils.
Moreover, Mubaslat (2012) study attempts to determine the role of educational games on
learning a foreign language, and to compare games with more traditional practices as
effective learning tools on the basic educational stage students at governmental schools in
Jordan, an experimental research is conducted using three groups out of six randomly. To
determine the relationship between learning a foreign language and educational games among
the participants, a One Way Analysis of Variance (ANOVA) is performed based on
achievement levels. For the relation between educational games and learning a foreign
language a Pearson's Correlational analysis is used. The results of the post test for the
experimental group are so better than the controlled one which shows that games have a good
effect on improving the achievement for the primary stage and to create an interactive
environment. It is recommended to use games since they are very effective especially for the
primary stages in teaching a second language and games are helpful for the teacher as a
procedure for language acquisition. Moreover, Nuraeningsih (2016) conducted a research is
to find out whether traditional games are effective to be used in English teaching and
learning. The research was conducted at SDIT Lukman al Hakim of fourth grader students
with the number of 19 students. The design of the research was quasi-experimental with one
control group pre-test and post-test. The instruments are pre-test and post-test. The games
which are used in this research are gedrik and betengan. The findings show that traditional
games are effective for teaching English.
Furthermore, Kirkland and O‘Riordan (2008) conducted an experimental study to test the
effectiveness of the games at improving performance and enhancing the learning experience.
As noted, two different in-class games were employed. The first, Karaoke Jeopardy, ran in
the September 2007 semester. The second, Who Wants to Be a Sweetie ran during the
January 2008 semester. For comparison purposes, students in each case were enrolled in The
Fundamentals of Marketing class. To test whether students who participate in in-class games
demonstrate greater subject knowledge the study used end of term examination score. The
treatment samples were students enrolled in the Fundamentals of Marketing Course in
64
September 2007 (n=33) and February 2008 (n= 17). The first cohort played the Karaoke
Jeopardy game and the second played Who Wants to Be a Sweetie. The researchers
compared final exam scores of these two treatment groups with corresponding cohorts from
the previous year. In other words, a control sample of students who took the Fundamentals of
Marketing in September 06 was used to compare the effectiveness of Karaoke Jeopardy and a
control sample of students who took the Fundamentals of Marketing in January 07 was used
in the case of Who Wants to be a Sweetie.
Results of the study found that in both cases, the class that was exposed to the game out
performed those who did not. In the case of Karaoke Jeopardy, the average score for students
was 5% higher. In the case of “Who Wants to be a Sweetie” the gap was smaller but positive
nonetheless, with game players scoring on average 2% more than the control group. One of
the shortcomings of the research however was the small sample sizes, particularly in the case
of the January 08 cohort. The paired t tests found that while the results implied that the games
were effective, they were not proven to be statistically significant. The analysis provided
suggests that in-class games do have a positive impact on students. Students who participated
in the games did perform better on average in exams. In addition, students who participated
in the games appear to be more engaged in the learning process. This was supported by the
higher scores given in overall module ratings and also by the abundant positive comments
provided in the students evaluation forms. In addition, the games themselves each received
ratings of 80% and above adding further credibility to the findings.
The fundamental differences between the current study and authors reviewed above lies in
the areas of subject matter covered the objectives, scope and delimitation, the design of the
games, methodological approaches adopted (research design, population, sample and
sampling procedures, instrumentation, data collection procedures and statistical analysis
procedures). Moreover, the findings of the studies form another major difference. The studies
reviewed above have attested the fact that traditional games like Snakes and Ladders are
effective instructional strategies/techniques in the teaching and learning in schools.
METHODOLOGY
Research Design
The design of the study is quasi-experimental. Specifically, the non-equivalent comparison
group design with pre-test and post-test was used. It has been described as “one of the most
commonly used quasi-experimental designs in educational research” (Cohen, Manion &
Morrison, 2007). This assert Best and Kahn (2006) is often the case since students are
naturally organized in groups as classes within schools and are considered to share similar
characteristics. The non-equivalent groups in this study implied that participants (Middle
Basic III Pupils) characteristics may not be balanced equally among the control and
experiment groups. Also, non-equivalent groups mean that participants’ (Pupils’) experiences
during the study may differ as rightly asserts (Heiman, 1999). The non-equivalent control
group design with pretest and posttest in this study is represented as:
Experimental Group: NR O1 X O2
Control Group: NR O1 O2
The NR represents non-randomization, O1 represents pretests, X represents the treatment
implemented, and O2 represents posttests (Cohen et al., 2007).
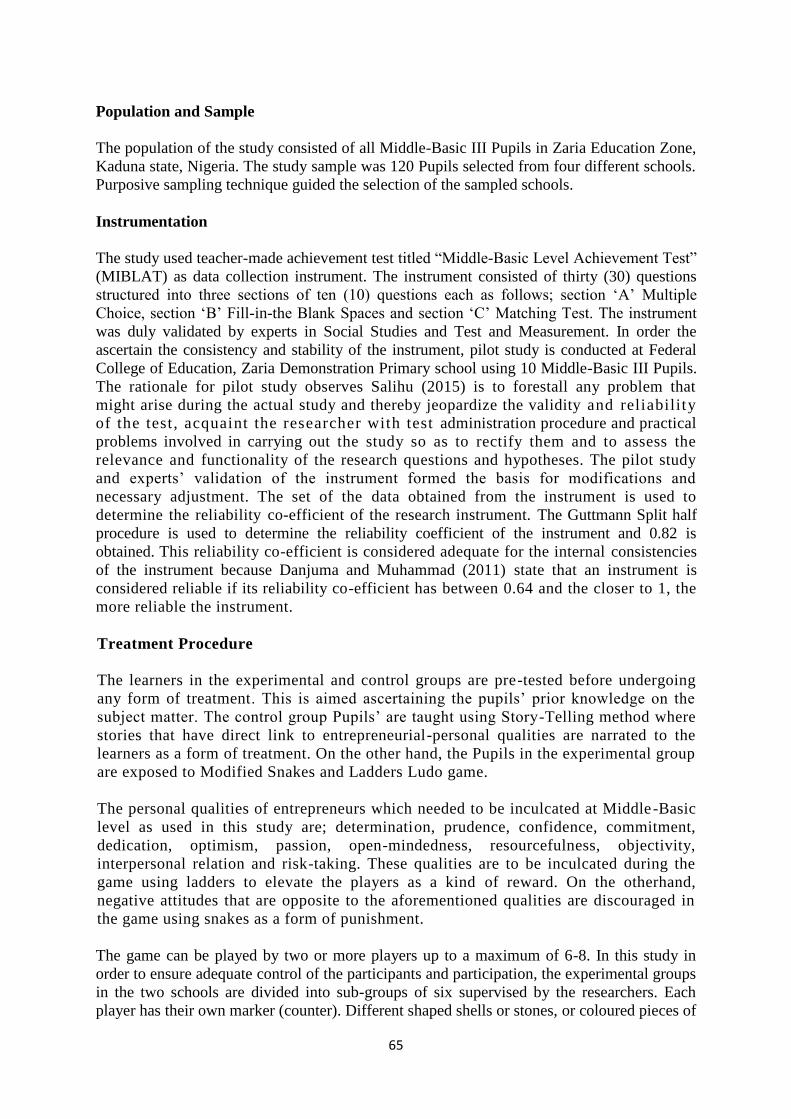
65
Population and Sample
The population of the study consisted of all Middle-Basic III Pupils in Zaria Education Zone,
Kaduna state, Nigeria. The study sample was 120 Pupils selected from four different schools.
Purposive sampling technique guided the selection of the sampled schools.
Instrumentation
The study used teacher-made achievement test titled “Middle-Basic Level Achievement Test”
(MIBLAT) as data collection instrument. The instrument consisted of thirty (30) questions
structured into three sections of ten (10) questions each as follows; section ‘A’ Multiple
Choice, section ‘B’ Fill-in-the Blank Spaces and section ‘C’ Matching Test. The instrument
was duly validated by experts in Social Studies and Test and Measurement. In order the
ascertain the consistency and stability of the instrument, pilot study is conducted at Federal
College of Education, Zaria Demonstration Primary school using 10 Middle-Basic III Pupils.
The rationale for pilot study observes Salihu (2015) is to forestall any problem that
might arise during the actual study and thereby jeopardize the validity and reliability
of the test , acquaint the researcher with test administration procedure and practical
problems involved in carrying out the study so as to rectify them and to assess the
relevance and functionality of the research questions and hypotheses. The pilot study
and experts’ validation of the instrument formed the basis for modifications and
necessary adjustment. The set of the data obtained from the instrument is used to
determine the reliability co-efficient of the research instrument. The Guttmann Split half
procedure is used to determine the reliability coefficient of the instrument and 0.82 is
obtained. This reliability co-efficient is considered adequate for the internal consistencies
of the instrument because Danjuma and Muhammad (2011) state that an instrument is
considered reliable if its reliability co-efficient has between 0.64 and the closer to 1, the
more reliable the instrument.
Treatment Procedure
The learners in the experimental and control groups are pre-tested before undergoing
any form of treatment. This is aimed ascertaining the pupils’ prior knowledge on the
subject matter. The control group Pupils’ are taught using Story-Telling method where
stories that have direct link to entrepreneurial-personal qualities are narrated to the
learners as a form of treatment. On the other hand, the Pupils in the experimental group
are exposed to Modified Snakes and Ladders Ludo game.
The personal qualities of entrepreneurs which needed to be inculcated at Middle-Basic
level as used in this study are; determination, prudence, confidence, commitment,
dedication, optimism, passion, open-mindedness, resourcefulness, objectivity,
interpersonal relation and risk-taking. These qualities are to be inculcated during the
game using ladders to elevate the players as a kind of reward. On the otherhand,
negative attitudes that are opposite to the aforementioned qualities are discouraged in
the game using snakes as a form of punishment.
The game can be played by two or more players up to a maximum of 6-8. In this study in
order to ensure adequate control of the participants and participation, the experimental groups
in the two schools are divided into sub-groups of six supervised by the researchers. Each
player has their own marker (counter). Different shaped shells or stones, or coloured pieces of
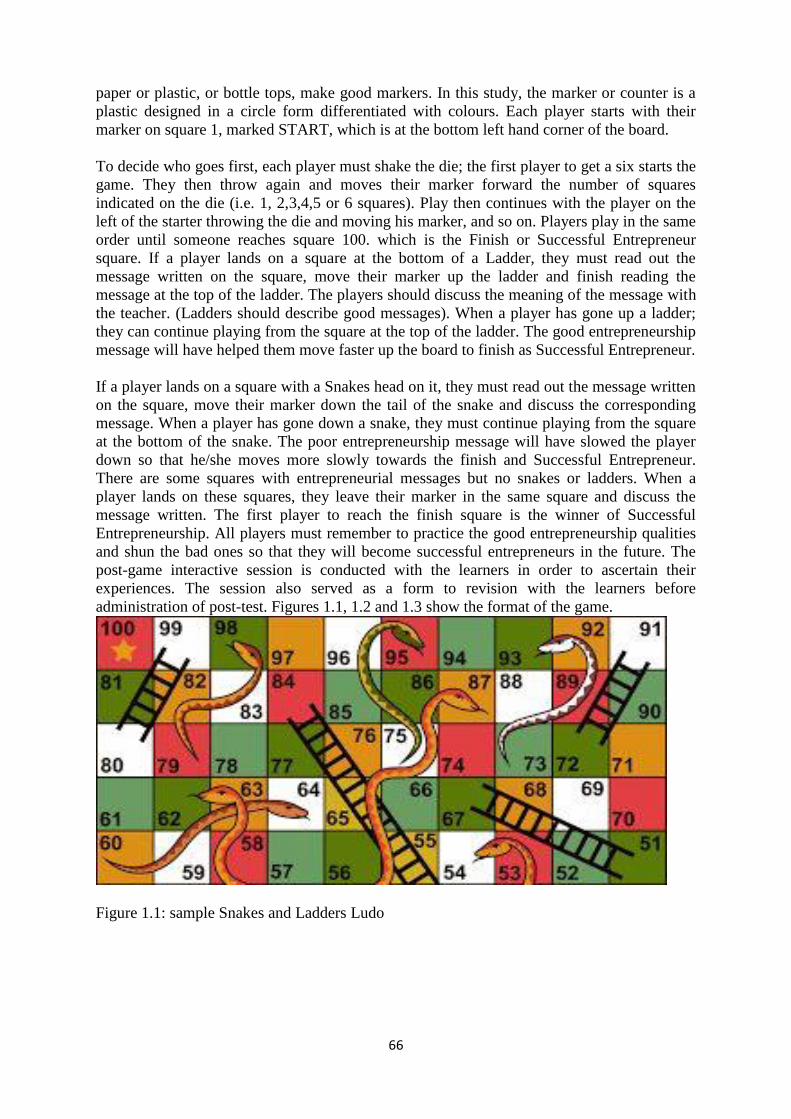
66
paper or plastic, or bottle tops, make good markers. In this study, the marker or counter is a
plastic designed in a circle form differentiated with colours. Each player starts with their
marker on square 1, marked START, which is at the bottom left hand corner of the board.
To decide who goes first, each player must shake the die; the first player to get a six starts the
game. They then throw again and moves their marker forward the number of squares
indicated on the die (i.e. 1, 2,3,4,5 or 6 squares). Play then continues with the player on the
left of the starter throwing the die and moving his marker, and so on. Players play in the same
order until someone reaches square 100. which is the Finish or Successful Entrepreneur
square. If a player lands on a square at the bottom of a Ladder, they must read out the
message written on the square, move their marker up the ladder and finish reading the
message at the top of the ladder. The players should discuss the meaning of the message with
the teacher. (Ladders should describe good messages). When a player has gone up a ladder;
they can continue playing from the square at the top of the ladder. The good entrepreneurship
message will have helped them move faster up the board to finish as Successful Entrepreneur.
If a player lands on a square with a Snakes head on it, they must read out the message written
on the square, move their marker down the tail of the snake and discuss the corresponding
message. When a player has gone down a snake, they must continue playing from the square
at the bottom of the snake. The poor entrepreneurship message will have slowed the player
down so that he/she moves more slowly towards the finish and Successful Entrepreneur.
There are some squares with entrepreneurial messages but no snakes or ladders. When a
player lands on these squares, they leave their marker in the same square and discuss the
message written. The first player to reach the finish square is the winner of Successful
Entrepreneurship. All players must remember to practice the good entrepreneurship qualities
and shun the bad ones so that they will become successful entrepreneurs in the future. The
post-game interactive session is conducted with the learners in order to ascertain their
experiences. The session also served as a form to revision with the learners before
administration of post-test. Figures 1.1, 1.2 and 1.3 show the format of the game.
Figure 1.1: sample Snakes and Ladders Ludo
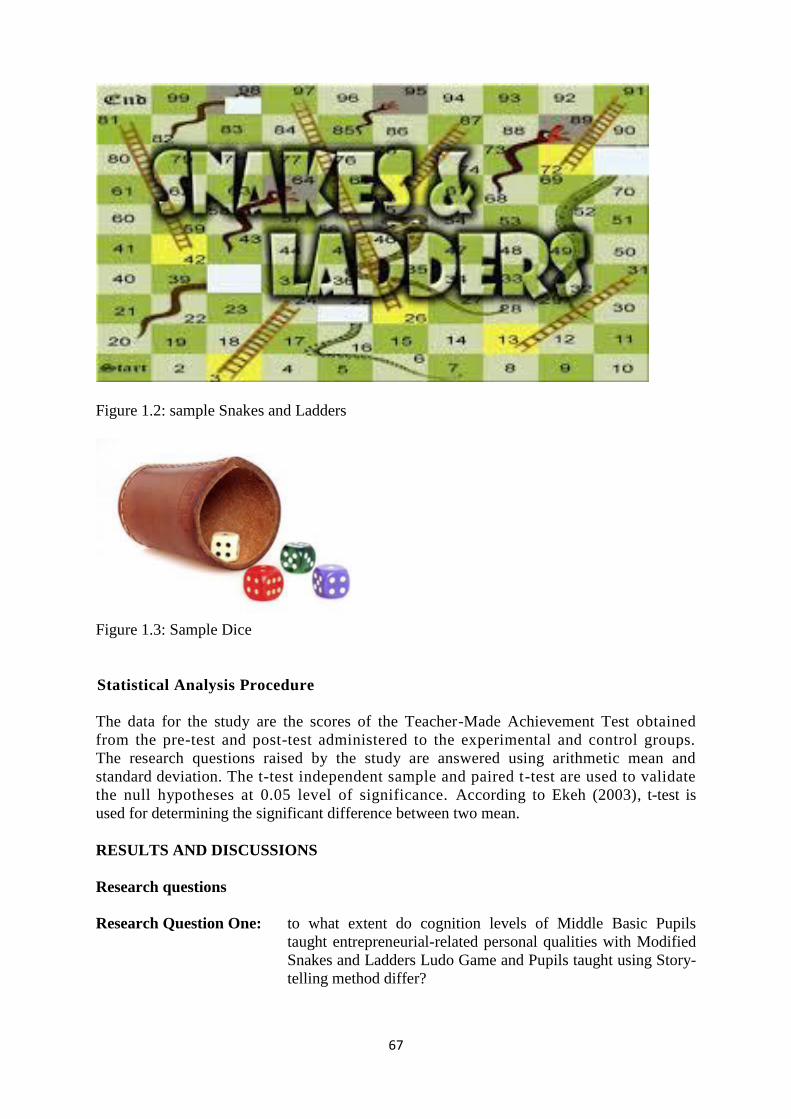
67
Figure 1.2: sample Snakes and Ladders
Figure 1.3: Sample Dice
Statistical Analysis Procedure
The data for the study are the scores of the Teacher-Made Achievement Test obtained
from the pre-test and post-test administered to the experimental and control groups.
The research questions raised by the study are answered using arithmetic mean and
standard deviation. The t-test independent sample and paired t-test are used to validate
the null hypotheses at 0.05 level of significance. According to Ekeh (2003), t-test is
used for determining the significant difference between two mean.
RESULTS AND DISCUSSIONS
Research questions
Research Question One: to what extent do cognition levels of Middle Basic Pupils
taught entrepreneurial-related personal qualities with Modified
Snakes and Ladders Ludo Game and Pupils taught using Story-
telling method differ?
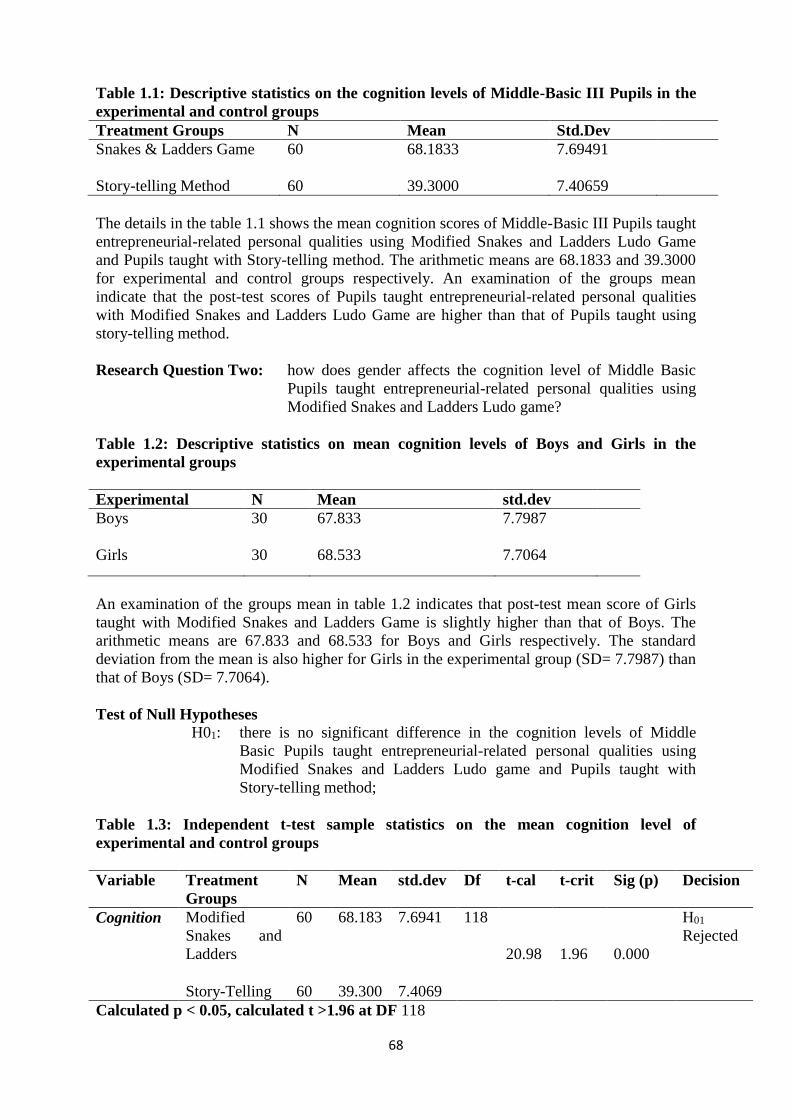
68
Table 1.1: Descriptive statistics on the cognition levels of Middle-Basic III Pupils in the
experimental and control groups
Treatment Groups N Mean Std.Dev
Snakes & Ladders Game
60 68.1833 7.69491
Story-telling Method 60 39.3000 7.40659
The details in the table 1.1 shows the mean cognition scores of Middle-Basic III Pupils taught
entrepreneurial-related personal qualities using Modified Snakes and Ladders Ludo Game
and Pupils taught with Story-telling method. The arithmetic means are 68.1833 and 39.3000
for experimental and control groups respectively. An examination of the groups mean
indicate that the post-test scores of Pupils taught entrepreneurial-related personal qualities
with Modified Snakes and Ladders Ludo Game are higher than that of Pupils taught using
story-telling method.
Research Question Two: how does gender affects the cognition level of Middle Basic
Pupils taught entrepreneurial-related personal qualities using
Modified Snakes and Ladders Ludo game?
Table 1.2: Descriptive statistics on mean cognition levels of Boys and Girls in the
experimental groups
Experimental N Mean std.dev
Boys
30 67.833 7.7987
Girls 30 68.533 7.7064
An examination of the groups mean in table 1.2 indicates that post-test mean score of Girls
taught with Modified Snakes and Ladders Game is slightly higher than that of Boys. The
arithmetic means are 67.833 and 68.533 for Boys and Girls respectively. The standard
deviation from the mean is also higher for Girls in the experimental group (SD= 7.7987) than
that of Boys (SD= 7.7064).
Test of Null Hypotheses
H01: there is no significant difference in the cognition levels of Middle
Basic Pupils taught entrepreneurial-related personal qualities using
Modified Snakes and Ladders Ludo game and Pupils taught with
Story-telling method;
Table 1.3: Independent t-test sample statistics on the mean cognition level of
experimental and control groups
Variable Treatment
Groups
N Mean std.dev Df t-cal t-crit Sig (p) Decision
Cognition Modified
Snakes and
Ladders
60 68.183 7.6941 118
20.98
1.96
0.000
H01
Rejected
Story-Telling 60 39.300 7.4069
Calculated p < 0.05, calculated t >1.96 at DF 118
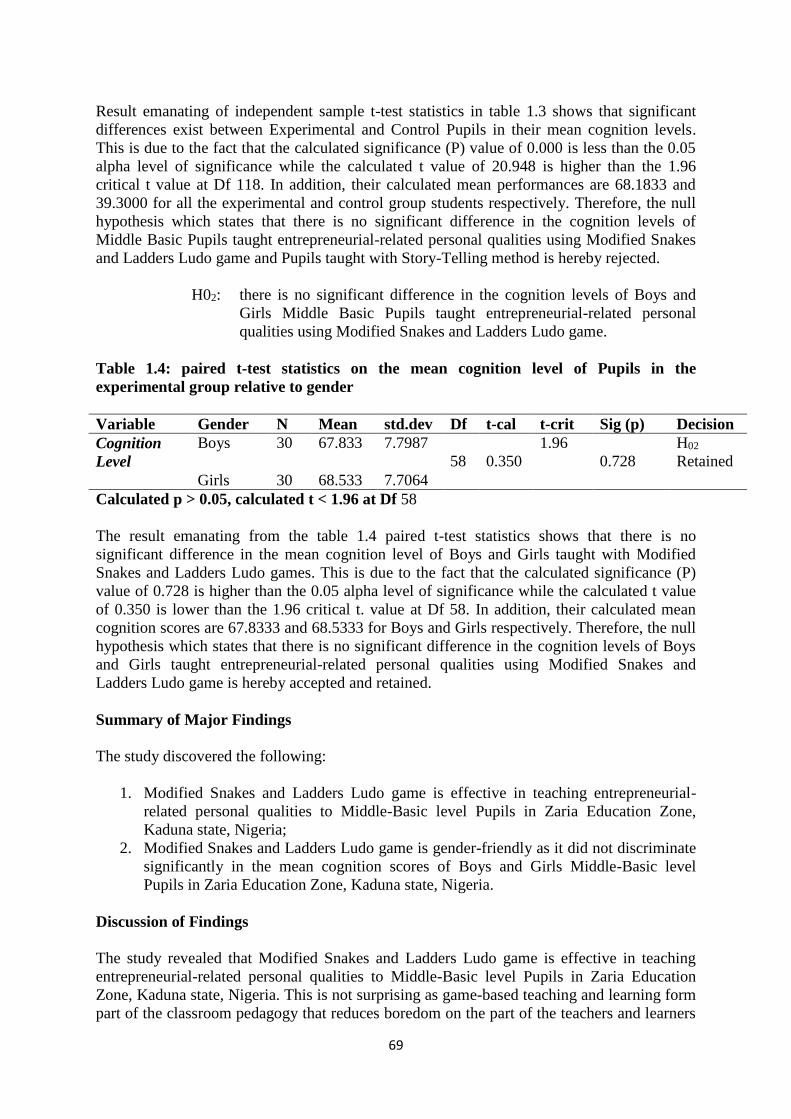
69
Result emanating of independent sample t-test statistics in table 1.3 shows that significant
differences exist between Experimental and Control Pupils in their mean cognition levels.
This is due to the fact that the calculated significance (P) value of 0.000 is less than the 0.05
alpha level of significance while the calculated t value of 20.948 is higher than the 1.96
critical t value at Df 118. In addition, their calculated mean performances are 68.1833 and
39.3000 for all the experimental and control group students respectively. Therefore, the null
hypothesis which states that there is no significant difference in the cognition levels of
Middle Basic Pupils taught entrepreneurial-related personal qualities using Modified Snakes
and Ladders Ludo game and Pupils taught with Story-Telling method is hereby rejected.
H02: there is no significant difference in the cognition levels of Boys and
Girls Middle Basic Pupils taught entrepreneurial-related personal
qualities using Modified Snakes and Ladders Ludo game.
Table 1.4: paired t-test statistics on the mean cognition level of Pupils in the
experimental group relative to gender
Variable Gender N Mean std.dev Df t-cal t-crit Sig (p) Decision
Cognition
Level
Boys
30 67.833 7.7987
58
0.350
1.96
0.728
H02
Retained
Girls 30 68.533 7.7064
Calculated p > 0.05, calculated t < 1.96 at Df 58
The result emanating from the table 1.4 paired t-test statistics shows that there is no
significant difference in the mean cognition level of Boys and Girls taught with Modified
Snakes and Ladders Ludo games. This is due to the fact that the calculated significance (P)
value of 0.728 is higher than the 0.05 alpha level of significance while the calculated t value
of 0.350 is lower than the 1.96 critical t. value at Df 58. In addition, their calculated mean
cognition scores are 67.8333 and 68.5333 for Boys and Girls respectively. Therefore, the null
hypothesis which states that there is no significant difference in the cognition levels of Boys
and Girls taught entrepreneurial-related personal qualities using Modified Snakes and
Ladders Ludo game is hereby accepted and retained.
Summary of Major Findings
The study discovered the following:
1. Modified Snakes and Ladders Ludo game is effective in teaching entrepreneurial-
related personal qualities to Middle-Basic level Pupils in Zaria Education Zone,
Kaduna state, Nigeria;
2. Modified Snakes and Ladders Ludo game is gender-friendly as it did not discriminate
significantly in the mean cognition scores of Boys and Girls Middle-Basic level
Pupils in Zaria Education Zone, Kaduna state, Nigeria.
Discussion of Findings
The study revealed that Modified Snakes and Ladders Ludo game is effective in teaching
entrepreneurial-related personal qualities to Middle-Basic level Pupils in Zaria Education
Zone, Kaduna state, Nigeria. This is not surprising as game-based teaching and learning form
part of the classroom pedagogy that reduces boredom on the part of the teachers and learners

70
alike. They also ensure the retention of what is taught in the classroom and a good way of
bringing excitement to teaching and learning. In addition, game-based teaching and learning
are good ways of inculcating certain attitudes and values to the learners both planned and
unplanned and a way of promoting inquiry skills in the learners. The findings of this study
corroborated that of Adoke (2015) which revealed that simulation game teaching strategy
increased students’ academic performance and it also has equal positive impact on all levels
of the Upper Basics in Kaduna state, Nigeria. In a related development, Obeka (2009) study
deserves noting. The study found out that EPODEWALAD group scored significantly higher
than POWER Simulation group and POWER Simulation scored significantly higher than
lecture group. Moreover, Mubaslat (2012) findings also concurred with that of the current
study. The results of the post test shows that games have a good effect on improving the
achievement for the primary stage. Furthermore, Kirkland and O‘Riordan (2008) study found
that class that were exposed to game out performed those who did not.
Modified Snakes and Ladders Ludo game is gender-friendly as it did not discriminate
significantly in the mean cognition scores of Boys and Girls Middle-Basic level Pupils in
Zaria Education Zone, Kaduna state, Nigeria. Although studies have shown that Boys enjoy
games-based teaching and learning more than Girls, this study discovered that both Boys and
Girls in the study area performed credibly well as indicated in the mean cognition scores. The
findings of this study concur with that of Adoke (2015) which discovered that gender has no
significant effect on the academic performance of Upper-Basic students who were taught
social attitudes and values using Snakes and Ladders game.
Conclusion
In the light of the above, this study concludes that Modified Snakes and Ladders Ludo Game
is effective in teaching entrepreneurial-related personal qualities to Middle Basic III Pupils in
Zaria Education Zone, Kaduna state, Nigeria. It is also concluded that Modified Snakes and
Ladders Ludo Game is gender-friendly as it enhances the cognition levels of Boys and Girls
in the study area.
Recommendations
This study in line with the above findings recommends as follows:
1. The need for the adoption of Modified Snakes and Ladders Ludo game in teaching
entrepreneurial-related personal qualities in Middle-Basic level as it enhances Pupils’
cognition level and retention;
2. the need for adequate utilization of Snakes and Ladders Ludo game in co-educational
and segregated school settings as the technique has proven to be gender-friendly;
3. the need to support teachers’ initiatives by Kaduna State Universal Basic Education
Board (SUBEB) and other relevant agencies both government and private morally and
financially as the design, production, organization, implementation and evaluation of
Snakes and Ladders Ludo game requires time, energy, perseverance and financial
resources to effectively execute it.
References
1. Adoke, I. M (2015). Effects of Simulation Games Teaching Strategy on academic
Performance of Upper Basic Level Students in Civic Education in Kaduna state. An

71
Unpublished M.Ed. Thesis submitted to Post-graduate School, Ahmadu Bello University,
Zaria.
2. Agih, A.A., & Arikawei, A.R., (2011). Aligning entrepreneurship Education with
available Endowments in Institutions of Higher Education in Nigeria for Sustainable
Development. Journal of Issues in Professional Teacher Education (maiden edition)
3. Audretsch, D.B., Carree, M.A., Stel, A.J. van and A.R. Thurik, (2002). Impeded
industrial structuring: the growth penalty, Kyklos 55 (1), 81-97
4. Azriel, J., Erthal, M., Starr, E., (2005). Answers, Questions, and Deceptions: What Is the
Role of Games in Business Education. Journal of Education for Business.
5. Biggs, J. (2003) Teaching for Quality Learning at University, Open University. Press,
Berkshire.
6. Danjuma, A.M. and Muhammad, I. (2011). Statistics in Educational Research .Zaria:
A.B.U Press Limited.
7. Ekeh, F.I. (2003). Research Methodology and statistics in Education. Abakaliki: Madol
Press Ltd.
8. Gavron, R., M. Cowling, G. Holtham and A. Westall,A. (1998). The Entrepreneurial
Society. London: Institute for Public Policy Research.
9. Harris, C. (2009). Meet the New School Board: Board games are back – and they’re
exactly what your curriculum needs. School Library Journal, 55, 24-26.
10. Kirkland, D. & O‘Riordan F. (2008). Games as an Engaging Teaching and Learning
Technique: Learning or playing ? http://icep.ie/wp-
content/uploads/2010/Kirkland_et_al.pdf
11. Kirkland, D. & O’Riordan, F. (2010). Games as an Engaging Teaching and Learning
Technique: Learning or playing?
12. MacKenty, B. (2006). All Play and No Work. School Library Journal, 52, 46-48.
13. Mubaslat, M.M. (2012). The Effect of Using Educational Games on the Students’
Achievement in English Language for the Primary Stage
14. Obeka, S.S. (2009). EPODEWALAD and Power Simulation Games of Geographical and
Environmental Education. Zaria: ABU Press Ltd.
15. Ruben, B. (1999) Simulation, Games and EXPERIENCE-based learning: The Quest for a
New Paradigm for Teaching and Learning. Simulation and Gaming, 30(4), p.8-12.
16. Salen, K. & Zimmerman E. (2003). Rules of Play: Game Design Fundamentals. The MIT
Press.
17. Salihu, J.J, (2015). Effects of educational field trips on academic performance of JSS
students in social studies in Kaduna state-Nigeria. A thesis submitted to the school of
post-graduate Studies, Ahmadu Bello University, Zaria.
18. Salihu, J.J., Muhammed, A. & Bayero, H.I.R. (2016). Teachers Perspective on Strategies
to mitigate Graduate Unemployment in Nigeria. A paper presented at 1st Umaru Musa
National Economic Development and Poverty Eradication Conference, may 2016.
19. Van der Kuip, I. & Verheul, I. (2003). Early Development of Entrepreneurial Qualities:
the Role of Initial Education. The Netherlands: EIM Business and Policy Research.
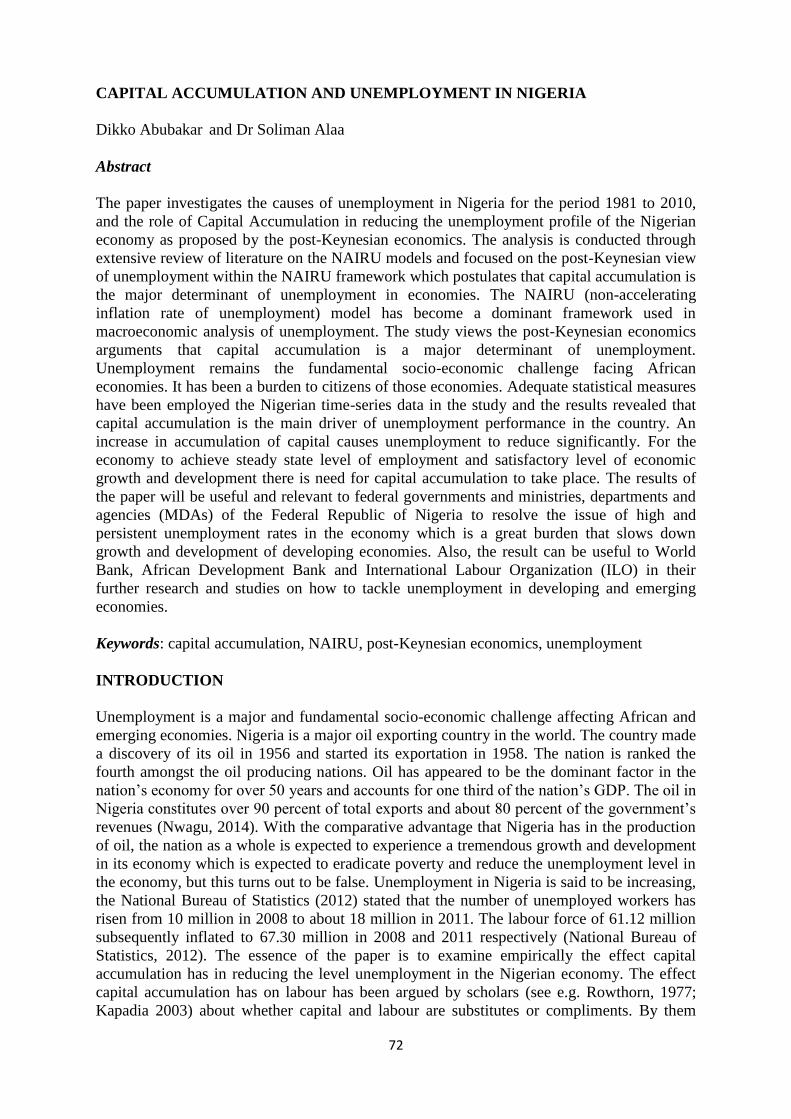
72
CAPITAL ACCUMULATION AND UNEMPLOYMENT IN NIGERIA
Dikko Abubakar and Dr Soliman Alaa
Abstract
The paper investigates the causes of unemployment in Nigeria for the period 1981 to 2010,
and the role of Capital Accumulation in reducing the unemployment profile of the Nigerian
economy as proposed by the post-Keynesian economics. The analysis is conducted through
extensive review of literature on the NAIRU models and focused on the post-Keynesian view
of unemployment within the NAIRU framework which postulates that capital accumulation is
the major determinant of unemployment in economies. The NAIRU (non-accelerating
inflation rate of unemployment) model has become a dominant framework used in
macroeconomic analysis of unemployment. The study views the post-Keynesian economics
arguments that capital accumulation is a major determinant of unemployment.
Unemployment remains the fundamental socio-economic challenge facing African
economies. It has been a burden to citizens of those economies. Adequate statistical measures
have been employed the Nigerian time-series data in the study and the results revealed that
capital accumulation is the main driver of unemployment performance in the country. An
increase in accumulation of capital causes unemployment to reduce significantly. For the
economy to achieve steady state level of employment and satisfactory level of economic
growth and development there is need for capital accumulation to take place. The results of
the paper will be useful and relevant to federal governments and ministries, departments and
agencies (MDAs) of the Federal Republic of Nigeria to resolve the issue of high and
persistent unemployment rates in the economy which is a great burden that slows down
growth and development of developing economies. Also, the result can be useful to World
Bank, African Development Bank and International Labour Organization (ILO) in their
further research and studies on how to tackle unemployment in developing and emerging
economies.
Keywords: capital accumulation, NAIRU, post-Keynesian economics, unemployment
INTRODUCTION
Unemployment is a major and fundamental socio-economic challenge affecting African and
emerging economies. Nigeria is a major oil exporting country in the world. The country made
a discovery of its oil in 1956 and started its exportation in 1958. The nation is ranked the
fourth amongst the oil producing nations. Oil has appeared to be the dominant factor in the
nation’s economy for over 50 years and accounts for one third of the nation’s GDP. The oil in
Nigeria constitutes over 90 percent of total exports and about 80 percent of the government’s
revenues (Nwagu, 2014). With the comparative advantage that Nigeria has in the production
of oil, the nation as a whole is expected to experience a tremendous growth and development
in its economy which is expected to eradicate poverty and reduce the unemployment level in
the economy, but this turns out to be false. Unemployment in Nigeria is said to be increasing,
the National Bureau of Statistics (2012) stated that the number of unemployed workers has
risen from 10 million in 2008 to about 18 million in 2011. The labour force of 61.12 million
subsequently inflated to 67.30 million in 2008 and 2011 respectively (National Bureau of
Statistics, 2012). The essence of the paper is to examine empirically the effect capital
accumulation has in reducing the level unemployment in the Nigerian economy. The effect
capital accumulation has on labour has been argued by scholars (see e.g. Rowthorn, 1977;
Kapadia 2003) about whether capital and labour are substitutes or compliments. By them
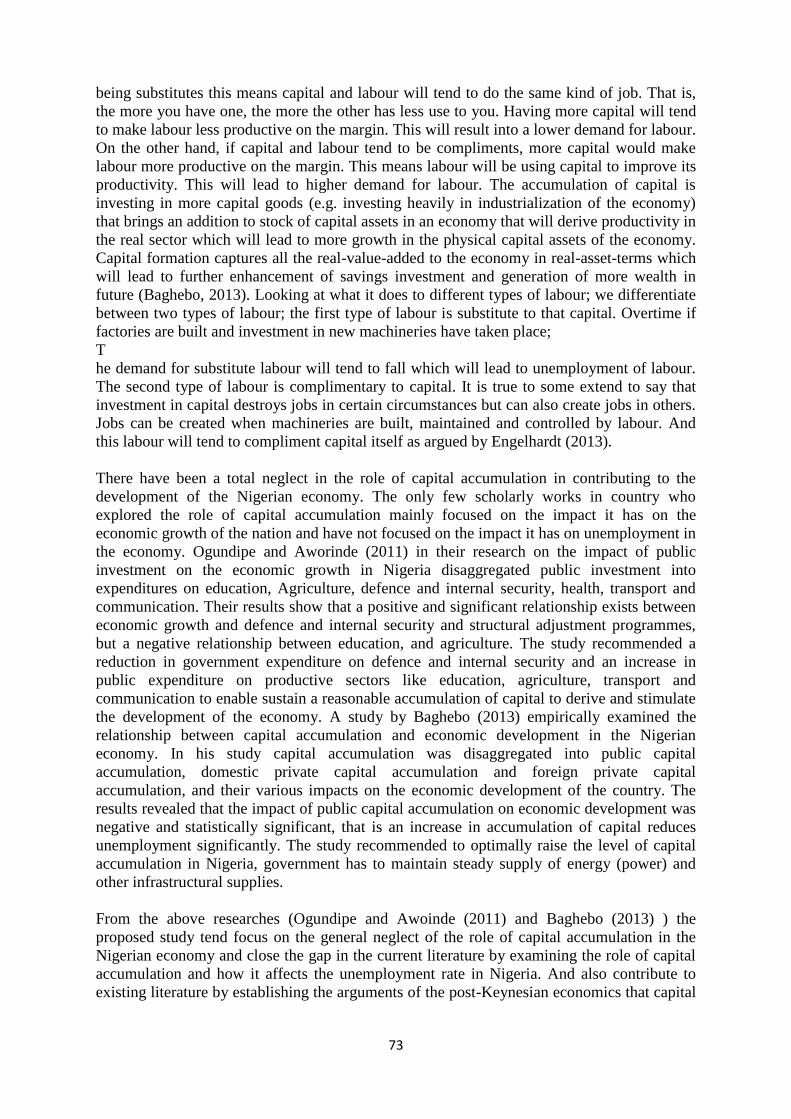
73
being substitutes this means capital and labour will tend to do the same kind of job. That is,
the more you have one, the more the other has less use to you. Having more capital will tend
to make labour less productive on the margin. This will result into a lower demand for labour.
On the other hand, if capital and labour tend to be compliments, more capital would make
labour more productive on the margin. This means labour will be using capital to improve its
productivity. This will lead to higher demand for labour. The accumulation of capital is
investing in more capital goods (e.g. investing heavily in industrialization of the economy)
that brings an addition to stock of capital assets in an economy that will derive productivity in
the real sector which will lead to more growth in the physical capital assets of the economy.
Capital formation captures all the real-value-added to the economy in real-asset-terms which
will lead to further enhancement of savings investment and generation of more wealth in
future (Baghebo, 2013). Looking at what it does to different types of labour; we differentiate
between two types of labour; the first type of labour is substitute to that capital. Overtime if
factories are built and investment in new machineries have taken place;
T
he demand for substitute labour will tend to fall which will lead to unemployment of labour.
The second type of labour is complimentary to capital. It is true to some extend to say that
investment in capital destroys jobs in certain circumstances but can also create jobs in others.
Jobs can be created when machineries are built, maintained and controlled by labour. And
this labour will tend to compliment capital itself as argued by Engelhardt (2013).
There have been a total neglect in the role of capital accumulation in contributing to the
development of the Nigerian economy. The only few scholarly works in country who
explored the role of capital accumulation mainly focused on the impact it has on the
economic growth of the nation and have not focused on the impact it has on unemployment in
the economy. Ogundipe and Aworinde (2011) in their research on the impact of public
investment on the economic growth in Nigeria disaggregated public investment into
expenditures on education, Agriculture, defence and internal security, health, transport and
communication. Their results show that a positive and significant relationship exists between
economic growth and defence and internal security and structural adjustment programmes,
but a negative relationship between education, and agriculture. The study recommended a
reduction in government expenditure on defence and internal security and an increase in
public expenditure on productive sectors like education, agriculture, transport and
communication to enable sustain a reasonable accumulation of capital to derive and stimulate
the development of the economy. A study by Baghebo (2013) empirically examined the
relationship between capital accumulation and economic development in the Nigerian
economy. In his study capital accumulation was disaggregated into public capital
accumulation, domestic private capital accumulation and foreign private capital
accumulation, and their various impacts on the economic development of the country. The
results revealed that the impact of public capital accumulation on economic development was
negative and statistically significant, that is an increase in accumulation of capital reduces
unemployment significantly. The study recommended to optimally raise the level of capital
accumulation in Nigeria, government has to maintain steady supply of energy (power) and
other infrastructural supplies.
From the above researches (Ogundipe and Awoinde (2011) and Baghebo (2013) ) the
proposed study tend focus on the general neglect of the role of capital accumulation in the
Nigerian economy and close the gap in the current literature by examining the role of capital
accumulation and how it affects the unemployment rate in Nigeria. And also contribute to
existing literature by establishing the arguments of the post-Keynesian economics that capital
74
accumulation is the main driver of unemployment in the economy within the non-accelerating
inflation rate of unemployment (NAIRU) framework which has never been explored.
The rest of the paper is structured as follows; the second part of the paper discusses the gap
and capital-unemployment relationship in Africa. The third part discusses the empirical
literature review on labour market institution, capital accumulation and unemployment. The
fourth section discusses the post-Keynesian NAIRU model. The fifth section presents the
estimated equation for the country. The sixth discusses the methodologies and the statistical
measures and techniques employed. The seventh presents the empirical results and findings.
The eight contains facts discussed about capital-unemployment relationship. Finally, the
conclusions and recommendations are given in the last part of the paper.
Capital-unemployment relationship in nigeria
The macro-labour literature in the 1990s was dominantly shaped by the NAIRU model and its
focus on wage-push factors as main driver of unemployment (see LNJ, 1991). The
mainstream economics account have been denying the influence of capital formation on
unemployment of economies as proposed by, among others, Dre`ze and Bean (1990).
However, the significant role of capital accumulation in the evolution of unemployment rates
across economies has gradually regained the interest of macro-labour economists and the
resulting literature is fast growing (see Karanassou, Sala and Salvador, 2007; Bande and
Karanassou, 2013; Arestis, Baddeley and Sawyer, 2007; Stockhammer, Guschanski &
Köhler, 2014; Karanassou and Sala, 2009; Koskela, Stenbacka and Juselius, 2009). Despite
the abundant resources in Nigeria, infrastructure appears to be a dismal factor that led
millions of its citizens into unemployment. The ability of the manufacturing sector in the
countries to absorb labour is affected by the decline in the sector due to shortage of capital. In
2009, 837 factories crumbled and closed down shops and units in the country. Half of the
remaining functioning firms have been identified as ailing (Okafor, 2011). Following a
survey conducted by the Manufacturers Association of Nigeria (MAN), the 837 figures
represent the total number of firms that stopped operating in 2009 across the nation. The
survey showed that 179 industries became deficient and collapsed in the northern part of the
country, 178 collapsed in the south-eastern part, 46 collapsed in the south, 225 in the south-
west and 214 in Lagos (Adebayo, 2013). Dunlop Plc is known to be a dominant tyre
manufacturing industry in the country has been shutting down shops and laying-off workers
due to poor electricity supply. Investigation shows that the company has been investing
$800,000 annually on electricity and yet not working in full capacity. As a result of this poor
electricity supply, the company shut down its $42 million tyre plant four years after re-
investing $32 million on the plant technology with a view of boosting its output. The
company had to laid-off its employees which resulted to a rise in unemployment rate in that
region. The Nigerian government lost revenue of $32 million annually due to misfortunes of
the key tyre manufacturing company in the country (Olusola-Obasa, 2012). Michelin also a
tyre manufacturing company followed the suit of Dunlop Plc which has laid-off a large
number of its employees because of the same factor. The United Nation Industrial
Development Organization (UNIDO) statistics revealed that approximately 170 textile
industries have closed down shops and about 120,000 employees are laid off all on the
account of poor infrastructure (power, road and water supply). (Asaju et al, 2014).
Away from the manufacturing sector to the petroleum sector of the economy, About 56 years
ago, Nigeria made its first entry into the global oil market when it discovered oil in the
nation. The country took a vault into the desirable realm of the dollar, petrodollar. With the
discovery of oil, the nation pushed itself into oil production neglecting the agricultural sector
75
and joined the oil producing economies. Crude oil in Nigeria is now the mainstay of the
economy. It accounts for total revenue of 83% in 2008, 65.5% in 2009, 73.8 % in 2012 and
80% in 2013 (see Nwagu, 2014; Sani and Kouly, 2014; CBN Statistical Bulletin, 2010).
Amongst all the oil producing economies, almost all have a well-functioning refinery except
for Nigeria. Venezuela which is a small country the same size as Lagos state in Nigeria and
the ninth in the exportation of crude oil has about 22 functioning refineries, whereas Nigeria
with a population of over 160 million people as well as the sixth largest economy in the
exportation of crude oil has four refineries which are all dilapidated. The refineries were put
to place but due to poor management and response to technology, poor maintenance and
corruption made them become epileptic. A great havoc was done due to the incapability of
these refineries because most of the workers were forcefully laid-off as a result of their
inefficiencies. The refineries have been allocated an expenditure of about $900 million on
turn-around maintenance but yet not working in full capacity due to poor management and
corruption. They have not been structured with full and adequate capital to make them
efficient (Aamor, 2014).
In 2003, eighteen companies were given the license to construct refineries, and the
government also granted license to four companies to construct private refineries. But neither
of these companies has started any construction of the refineries in their sites. The attempt to
establish refineries was held back by vested interest. Those companies given the license to
invest in these refineries knew the market and are benefiting from lack of refineries due to
fuel import business (Oketola, 2013). The government, the Nigerian National Petroleum
Corporation (NNPC) and other oil markers has found it lucrative to import refined oil than to
refine domestically which has now become the business of the nation. The country exports 2
million barrels of crude oil daily and later import the refined products which are derived from
the same crude it exported. Thereby creating employment outside the country and raising the
unemployment level in its economy. Bad management and inadequate capital has made these
four refineries cut down refining output below the installed capacity to as low as 32% and
produces 445,000 barrels per day in both the four refineries which is not enough to meet the
demands of the citizen in the country. The nation relies on 80% of petroleum import to meet
the nations demand (see Amor, 2014; Oketola, 2013). The Nigerian government spends over
$30 billion annually on the importation of this refined product it exported (Vanguard, 2013).
In reference to the work of Omadjohwoefe (2011), it is unfortunate that Nigeria is the richest
black nation with abundant crude oil and yet it imports fuel for consumption. The comatose
state of the nation’s refineries aggravates unemployment (Omadjohwoefe, 2011).
The richest business man in Nigeria and Africa, the president of Dangote Group, Aliko
Dangote has proposed to establish an oil refinery in Nigeria worth $8 billion with the
capacity to produce 400,000 barrels per day before the end of 2016. The president stated that
he will ensure the refinery operates to full capacity and when completed 8,000 engineers will
be employed and 85,000 jobs will be created in Nigeria, both direct and indirect jobs (see
Vanguard, 2013; Oketola, 2013).
Nevertheless, looking at the agricultural sector of the Nigerian economy, Nigeria is blessed
with a large area of arable land with a diverse climate that is suitable for variety of
agricultural products. Regardless of its dependence on oil sector for its revenue it is still an
agrarian economy. Agriculture is the main source of food for most of the economy. It
provides means of livelihood for over 70% of the populace and it is also a source of raw
materials for industries. The agricultural sector in Nigeria played an important role after the
country’s independence such that regional development was attributed to it. About 70% of
the country’s population were engaged in agricultural practices (Ayinde, 2014). In terms of
76
its contribution to GDP, the percentage dropped down enormously from 55% in 1996 to 17%
in 2004 which led to its decline in contributing to the national development of the economy.
The country was exporting a very large quantity of oil pam and cocoa, but now the nation
hardly produces enough. The agricultural sector in Nigeria has faced enormous challenges
which prevented the growth of the industry. Low investment has been the major problem
hindering the growth of the sector. For the past 20 years the country has fallen away below
the required budget allocation for the sector which was proposed by the African Union
(Adetimirin, 2014). As a result the growth of the sector is affected by poor infrastructure and
poor response to technology which led to poor returns on investments (see Manyong et al,
2005; Ayinde, 2014). These factors were attributed to the neglect of the sector by the
economy’s dependence on a mono-cultural (crude oil) based economy which has not yield a
good outcome for the nation by resulting into a high unemployment rate (Ogun, 2010). The
government has not put much effort in the development of the sector which can absorb a
large portion of the populace compared to the oil sector which has a cap on the number of
possible job creation. Following the work of Anga (2015), to reduce unemployment in
Nigeria using the agricultural sector the government has to ensure sufficient capital
accumulation by investing in modern agricultural technology that will make agriculture less
cumbersome, create multi agribusiness skills acquisition centres across the nation and
establish farm settlements in which labour will be employed and used in the production of
different commodities (to be consumed both domestically and exported) and raw materials to
be used in industries. The government also need to provide adequate electricity supply, road
and rail transport for the transportation of commodities and raw materials. And lastly, the
government should ensure the provision of storage and processing facilities for the farmers to
ensure they don’t incur losses due to damaged products (Anga, 2015). As revealed by
Toluwase (2010), improvement in the agricultural sector is a key to industrialization and
economic development which will generate employment, provide food security and eradicate
poverty out of the economy (Toluwase, 2010). Therefore, investing in the agricultural sector
can raise the chances of meeting the agricultural demands of the economy without
importation and bring an increase in manpower which can provide jobs, thus reducing the
unemployment level in the country as witnessed by Adetimirin (2014).
In reference to the argument of the post-Keynesians (see Arestis, Baddeley and Sawyer,
2007; Stockhammer, Guschanski & Köhler, 2014; Karanassou and Sala, 2009), Nigeria is
suffering from shortage of capital. Inadequate capital possess threat to businesses, industries,
agricultural sectors, petroleum sector and other economic activities that will help in
developing the country and reducing unemployment. Nigeria is a country blessed with natural
resources such as; petroleum, natural gas, solid minerals and agricultural products. All these
resources if well managed and utilized with the accumulation of sufficient capital could be
able to create jobs and reduce unemployment in the country as well as resulting to a
sustainable economic growth.
Great number of studies has been conducted linking capital accumulation and unemployment
worldwide but not for the case of Nigeria. The relationship between capital accumulation and
unemployment has not yet been established in Nigeria. The researchers (e.g. Ogundipe and
Awoinde, 2011; Baghebo 2013) who only looked at capital accumulation linked it with
economic growth and development in the country. This forms the basis for this paper to
empirically ascertain the role of capital accumulation in reducing unemployment level in
Nigeria.
The Empirical Literature on Labour Market Institutions, Capital Accumulation and
Unemployment

77
The arguments by the New Keynesians that labour market institution and their policies
influences unemployment has gone through further empirical investigations. Faccini and
Bondibene (2012) conducted a research and used data for 20 OECD countries to investigate
empirically if labour market institutions and their policies are responsible for the rise in
unemployment rate in the countries. The paper assessed the effects of labour market on the
cyclical volatility of unemployment using fixed-effect estimation in a panel of the 20 OECD
economies. The statistical result posit that institutions such as; Employment protection
legislation (EPL) and stronger unions tend to increase the volatility of unemployment. But the
duration of unemployment benefits and labour taxes were founded to decrease the volatility
of unemployment rates. The overall study affirmed that labour market institutions and their
policies tend to contribute to variations in unemployment rate in these economies
investigated. These findings are in line with the results of Babecký et al (2009) which found
that high collective bargaining coverage leads to increase in real wage rigidity which results
to a rise in unemployment rate. A paper also conducted by Serres and Martin (2013) as
regarding whether policies created by labour market institutions to reduce volatility of
unemployment may tend to increase its persistence found that higher duration of
unemployment benefit, employment protection legislation (EPL) and a tighter product market
regulations are responsible for a higher unemployment persistence over time. IMF (2003)
also found strong effects of employment protection, tax wedge and union density. Baccaro
and Rei (2007) in their study also found significant effects of union density. Flaig and
Rottman (2013) investigated 19 OECD countries and found significant effects of tax wedge,
benefit replacement ratio and employment protection. Nickell, Nunziata and Ochel (2005)
undertook an empirical investigation of the unemployment patterns in the OECD countries
from the period of 1960 to 1990. The study aimed at investigating if shifts in unemployment
in these countries can be explained by change in the labour market institutions and their
policies which is also expected to have impact on the NAIRU. The results posit that changes
in labour market institutions account for about 55% of the rise in the European
unemployment level within the time period estimated. EC (2012) conducted a research using
a panel analysis of 13 EU (European Economies) to ascertain the impact of labour market
institutions and macroeconomic shock on the NAIRU, the study also found a strong impact of
labour market institutions.
However, some studies found no significant effects of labour market institutions. Blanchard
and Wolfers (2000) investigated a panel of 20 OECD countries in which they pointed out the
interaction between institutions and shock. They arrived at a conclusion that labour market
institutions can explain cross country differences in unemployment but cannot explain the
persistent rise of unemployment overtime. Lehmann and Muravyev (2011) used a unique data
set that covered the labour market outcomes, labour market institutions and macroeconomic
controls from 1995 to 2008 for Eastern European and central Asian countries. The result
found negative relationship between institutions and unemployment. A research also by
Baker et al (2005) used 5-year averages of a panel of OECD economies in which the study
found no relationship between labour market institutions and changes in NAIRU.
On the other hand, econometric evidences supporting the argument of the post-Keynesians as
regarding the effects of capital accumulation has been found using different methodologies.
Karanassou, Sala and Salvador (2007) were motivated by investigating the role of capital
accumulation in shaping unemployment in Nordic countries (Denmark, Sweden and Finland)
from a period of 1973 to 2005 for Denmark, 1976- 2005 for Finland and 1966 to 2005 for
Sweden. The paper examined the effects of capital stock in the labour market by adopting the
chain reaction theory of unemployment and estimated a dynamic multi-equation labour

78
market model. The evidence provided by the statistical results is that the persistent shocks of
1978 to 1985 and 1989 to 1997 approximately accounts for about 30% and 15% of the rise in
unemployment rate in Denmark and Finland respectively. The results also showed that 1991
to 1997 slowdown in capital accumulation contributed to about 50% of unemployment rate
during that period in Sweden. Gonzalez and Sala (2011) also conducted a study on the impact
of financialisation on the United States unemployment through its effect on capital
accumulation using the chain reaction theory and also found a strong effect of capital stock as
a major cause of the U.S unemployment between the periods of 1991 to 1997. Bande and
Karanassou (2013) used the chain reaction theory as well to investigate the causes of regional
unemployment in Spain from the periods of 1985 to 2000. The study found strong
relationship between capital accumulation and unemployment during the period of the study.
The study found out that from 1985 to 1991 when the economy was in boom period,
investment which is the growth rate of capital stock and oil prices were the main factors that
led to the drop down in unemployment level. But the oil prices had a minor contribution. And
from 1994 to 2000, investment was the main factor that led to the reduction in
unemployment. The researchers opined that if the capital stock was to remain as it was in
1994, the unemployment rate would have been 26% instead of 10%. These finding are similar
to the results obtained by Karanassou and Sala (2009) in a study they conducted on the
Spanish economy as well from 1970 to 2005.
Studies conducted by the researchers (Karanassou, Sala and Salvador (2007), Gonzalez and
Sala (2011) , Bande and Karanassou (2013) and Karanassou and Sala (2009) ) using the chain
reaction theory has shown evidences that capital accumulation has appeared to be the main
driving force of the unemployment rates in all the studies conducted by the researchers.
However, there are other studies conducted using different methodologies which also
affirmed the role of capital accumulation in reducing unemployment. A research conducted
by Arestis, Baddeley and Sawyer (2007) to empirically ascertain the role of capital stock in
determination of wages and unemployment in Nine Economic and Monetary Union (EMU)
countries which are; Australia, Belgium, Spain, Finland, Ireland, Italy, Germany, France and
Netherlands using a time series and panel data analysis. The focus of the paper is to
investigate the role of capital stock whether it has an important role to play in determining
wages and unemployment in the EMU countries and to compare the results and findings
across the countries. The researchers derived a wage and unemployment relationship which
were estimated and test with comparable data sets for the countries. The statistical evidence
showed that there is a negative relationship between capital accumulation and unemployment.
And suggest that the degree of substutability between capital and labour is not as elastic as it
has been assumed to be. Alexious and Pitelis (2003) conducted a research to investigate the
causes of persistence rise of European unemployment using a panel data analysis. The
research focused on the role of capital stock on the European unemployment from the period
of 1961 to 1998. Based on the statistical findings, it asserts that one of the potential factors
responsible for persistence and high unemployment rate in the European region is the
insufficient growth of capital stock and inadequate aggregate demand. Koskela, Stenbacka
and Juselius (2009) explored the long term effects of capital stock on employment based on a
model of labour market imperfections. The research established a strategic effect of capital
investment by showing that higher capital-labour ratio had a wage increasing effect with
strong labour imperfections. The study was conducted based on a quarterly data for 28years
for 16 OECD countries. The study opined that there is a strong relationship between capital
stock and unemployment and stated that the relationship between capital and labour is not
monotonic. The rise in unemployment is as a result of inadequate capital as well as three
other factors which are; the bargaining power of unions, the capital-labour ratio and the
79
production function parameters. In a more recent study conducted by Stockhammer,
Guschanski & Köhler (2014) they estimated the NAIRU model which includes capital
accumulation, labour market institutions and housing bubbles for panel of 12 OECD
economies from 2007 to 2011. The study concluded that insufficient capital accumulation
rather than labour market institutions is the main factor affecting unemployment
performance.
All these findings are strong evidences which support the arguments of the post-Keynesians
that capital accumulation is a major and driving factor in determining the unemployment
level in economies.
However, there are empirical findings which contradict the role of capital accumulation and
consider interest rate as the cause of unemployment volatility. Bassani and Duval (2006)
estimated a panel analysis of 20 OECD countries from 1982 to 2003. The empirical findings
posit long term real interest rate has a strong effect on unemployment. Blanchard and wolfers
(2000) also in a panel of 20 OECD economies illustrated the relationship between institutions
and shocks and also found significant effects of real interest rate. Fitoussi et (2000) estimated
a regressing explaining changes and fluctuations of unemployment from 1980 to 1990 in 19
OECD countries. The statistical evidence provided show that changes in domestic interest
rate coincides with changes in average unemployment level.
The Post-Keynesian Nairu Model
The NAIRU (non-accelerating inflation rate of unemployment) model has become the most
common and a more dominant framework used in the macroeconomic analysis of
unemployment (see Alves and Correa, 2014;Blanchard, 2006; Nickell, Nunziata and Ochel,
2005; Stockhammer, 2008; Carlin and Soskice, 2005). The NAIRU model posits a short-run
trade-off between the level of inflation and unemployment. That is, a short-run Phillips curve.
Equilibrium can in principle be either unstable or stable based on the adjustment in the goods
market (Stockhammer, Guschanski & Köhler, 2014). The model is a general macroeconomic
theoretical framework that can be interpreted by the Monetarist, New Keynesian and the
Post-Keynesian interpretations based on the closures with respect to demand and the relying
assumptions regarding its exogeneity or endogeneity (Stockhammer, 2008).
Dated back to the 1950s, the relationship between inflation and unemployment has been a
main focal point for macroeconomic theory and policies. This relationship has been identified
as the deterministic law for macroeconomic theory which is the generally known Phillips
curve. The Phillips curve has undergone adjustments and augmented to be used for the
NAIRU model estimations (Bozani, 2011).
The dominance of the NAIRU framework in macroeconomics and its unexpected policy
implications seem to be the reason why the mainstream economists are unable to prevent
economies from subsequent recessions and unemployment expansions. The existence of any
unemployment can be mainly faced by changes in the labour market institutions and their
policies. These policies of labour market institutions which lead to unemployment expansions
can be represented by softening minimum wage restrictions, taxes on labour and strong
restrictions on hiring workers and also with the reduction or elimination of unemployment
benefits. Labour market institutions and their policies tend to create an unfriendly
environment for workers despite the existence of unemployment protection system or not. On
this regard, the post-Keynesian economists took a step beyond; they questioned the
fundamental concept of the NAIRU model and came up with a more realistic approach (eg

80
Bozani, 2011; Arestis and Biefang-Frisancho Mariscal, 2000; Alexious and Pitelis, 2003). In
their view, the only suggestion of reducing the unemployment level in an economy is by the
adoption of the traditional Keynesian theories and policies. Keynes has earlier pointed out the
role of insufficient capital accumulation as a cause of unemployment in an economy. He
stated that the level of output and investment as a whole in any particular economy depends
on the amount of investment in that economy (see Ditimi and Ifeakachukwu, 2013; Keynes
1937, 221).
The post-Keynesians agree with the inflation part of the NAIRU model but reject the labour
market part of the New Keynesian NAIRU model. The post-Keynesians argue that NAIRU is
endogenous and that capital accumulation is a major determinant of unemployment in the
short term (Stockhammer, 2011). That is, investment expenditure has an important role to
play in determining the unemployment level in an economy. The reason why the NAIRU will
be endogenous is because investment has a demand-side and supply-side effect. The demand-
side effects are the multiplier effects. While the supply-side effect is that a change in
investment expenditures will tend to affect the capital stock, which consequently has two
effects on the NAIRU. First, by assumption of a standard production function, it will affect
the marginal product of labour (Stockhammer, Guschanski & Köhler, 2014). As explained
(by Rowthorn, 1999; Arestis and Sawyer, 2005) the NAIRU will always depend on capital
stock unless the elasticity of substitution is exactly equal to unity, that is, unless if the
function is Cobb Douglas. The second effect is that a change in capital stock will lead to a
change in capacity utilization which will have an effect on the price setting power of firms
(Rowthorn, 1977).
In the post-Keynesian model the NAIRU is determined by macroeconomic shocks,
Institutions and capital accumulation. This is given by the following equation:
𝑈𝑁 = 𝑢(𝑀𝑆; 𝐿𝑀𝐼; 𝐾) (1)
where UN, MS, LMI and K are the NAIRU. 𝑈𝑁 stands for unemployment. MS represents a
vector of macroeconomic shocks, 𝐿𝑀𝐼 stands for Labour Market Institutions and 𝐾
represents capital accumulation.
The Model for Nigeria
In conducting the research a secondary method of data collection is adopted and applied in a
time series analysis. The data were sourced from the publications of the Bureau of National
statistics of the Federal Republic of Nigeria (NBS), the Central Bank of Nigeria (CBN)
Statistical Bulletin and the World Bank Statistical database. A sample period of 29 years will
be examined in the study. That is, from the period of 1981 quarter 1 to 2010:4. In order to
present a realistic result of this work, a multiple regression analysis will be employed to
determine the effect capital accumulation has on unemployment in the Nigerian economy
from 1981 to 2010.
The regression equations to be estimated will take the following form:
𝑈𝑛𝑒𝑚𝑡 = 𝛽1𝛥𝐼𝑁𝐹𝐿𝑡 + 𝛽2𝐼𝑁𝑇𝑡 + 𝛽3𝐴𝐶𝐶𝑈𝑡 + 휀𝑡 (2)
Where; 𝑈𝑛𝑒𝑚𝑡, 𝐼𝑁𝐹𝐿𝑡, 𝐼𝑁𝑇𝑡 and 𝐴𝐶𝐶𝑈𝑡 stand for unemployment rate, inflation rate , interest
rate and capital accumulation respectively. The change in the inflation rate (𝛥𝐼𝑁𝐹𝐿𝑡) is the
measure of the deviation of actual unemployment rate from the NAIRU. Capital
81
accumulation is the total accumulation of capital in the economy. 휀𝑡 represents the error term
(white noise) and 𝛽1, 𝛽2 and 𝛽3 are the parameter estimates. This equation is the reduced
form of the NAIRU.
Estimation Techniques
A time series data is assumed to be generated by a stochastic process. Therefore if the data
was to be used without investigating its stationarity process, the results derived would yield a
spurious result (Datta and Kumar, 2011). The aim of conducting a unit root test is to avoid
spurious results. Before the estimation of our statistical model in equation (4.1), it is very
necessary to investigate the stochastic properties of the variables to be estimated. This is done
by conducting a unit root test. From the generally known Wold’s theorem a single stationary
time series variable with no deterministic components has an infinite moving average
description that is approximated generally by a finite autoregressive moving average process.
Therefore, economic series should be assumed to be differenced before stationary can hold
(Engle and Granger, 1987). The non-stationarity test, thais a unit root test is dependent on the
value of t-statistics on the coefficient of first lag of a variable. The null hypothesis of a unit
root will be rejected (i.e. δ=0) if the t-statics value appears to be higher than the critical value
in the t-satistics table. If it is lower than the critical value, the null hypothesis will be accepted
and the variable is said to be non-stationary (i.e. δ≠0) (Gujarati, 1995). The analysis was
conducted using the Augmented Dickey-Fuller (ADF) test. The equation of the ADF test to
be estimated takes the following form:
𝛥𝑌𝑡 = 𝛼0 + 𝛼1𝑡 + 𝛼2𝑌𝑡−1 + 𝑙𝑎𝑔𝑠 𝑜𝑓 𝛥𝑌𝑡 + 휀𝑡 (3)
That is, the first difference of the variable 𝑌𝑡 is regressed against a constant, time trend
(t=1,2,3,…..T), the first lag of the variable 𝑌𝑡 and lags of 𝛥𝑌𝑡. Adequate lags of 𝛥𝑌𝑡 are
introduced in the estimation of the model to ensure error term 휀𝑡 are not correlated. If the
variable is stationary at this point then it is considered to have been integrated at order zero,
that is, 𝐼(0) variable. But If 𝑌𝑡 is found to be non-stationary, that is, have a unit root, then 𝛥𝑌𝑡
should be tested next for stationarity. This is done by estimating the following model:
𝛥2𝑌𝑡 = 𝛼0 + 𝛼1𝑡 + 𝛼2𝛥𝑌𝑡−1 + 𝑙𝑎𝑔𝑠 𝑜𝑓 𝛥2𝑌𝑡 + 휀𝑡 (4)
That is, regressing the first difference of 𝛥𝑌𝑡 against a constant, time trend (t=1,2,3,….T), the
first lag of 𝛥𝑌𝑡 and sufficient lags of 𝛥2𝑌𝑡 to ensure that errors are not correlated. If the
variable becomes stationary then it is integrated at order one. That is, 𝐼(1). This is repeated
until the variable becomes stationary (see Gujarti, 1995; Hamilton, 1994).
The test after the test for stationarity is the Cointegration is a statistical characteristic of
variables in a time series analysis. Variables are said to have a cointegration relationship if
there is a long-run equilibrium relationship between them. If the variables are tending to be
individually non-stationary but their residual is stationary, then they are said to be
cointegrated in the long-run (see Gujarati, 2004; Yang, 2000). Cointegration test is performed
to investigate the long-run economic relationship between time series variables. It can also be
used to obtain important economic information.
According to Thomas (1997) a unique long-run economic relationship between time series
variables occur if; the variables in the model are integrated at order one, 𝐼(1). That is, the
variables achieved stationary after being differenced once. And secondly, if there exist some
82
linear combination of the variables which are 𝐼(0). When these assumptions hold, then the
time series variables are cointegrated. That is, they have a cointegration relationship and a
long-run economic relationship exist between them (Thomas, 1997)
The cointegration test is performed by conducting an Augmented Dickey-Fuller (ADF) test
on the residuals from an Ordinary Least Square (OLS) regression of the statistical model.
That is, testing the residuals from an OLS regression of equation (4.1) for stationarity (i.e.
unit root). In the absence of a unit root, the residuals are considered to be stationary and there
is a cointegration relationship existing among the variables in the model. But if a unit root is
present, then hey variables have no long run relationship. The equation for ADF test on the
residuals takes the following form:
𝛥𝑒𝑡 = 𝛼1𝑒𝑡−1 + 𝛼2𝛥𝑒𝑡−1 + ɛ𝑡 (5)
That is the first difference of the residual (𝛥𝑒𝑡) is regressed against the first lag of the residual
(𝑒𝑡−1). Introducing sufficient lags of 𝛥𝑒𝑡 is important in the regression equation to avoid
autocorrelation in the error term ɛ𝑡. The unit root test is determined based on the t-statistics
coefficient on the lagged residual, 𝛼1. If the t-stat on 𝛼1 is higher than the critical value in the
ADF cointegration table, then the null hypothesis will therefore be rejected (δ=0) and the
residuals are stationary, that is, long run relationship exist amongst the variables in the model.
But when the t-statistics is less than the critical value, the null hypothesis will be accepted
(δ≠0). And thus no cointegration relationship between the variables, that is, they have no long
run economic relationship (Thomas, 1997).
The granger causality is also employed to find the relationship between variables. The test
was developed by Granger (1969) which aimed at finding the causal relationship between
two variables. An X variable can be said to granger cause a Y variable if the present Y can be
predicted with much greater accuracy by using the past values of the X variable rather than
not using the past values, with all other information being identical. There are basically two
best known tests for causality which are; the granger test and the Sims test (Thomas, 1997).
But for the purpose of this research the Granger test will be adopted. Granger causality test is
usually only relevant with time series data. For the basis of this study, the focus of this test is
to ascertain whether shortage of capital accumulation causes unemployment or
unemployment causes capital accumulation. That is, whether it is a one-way relationship or
two-way relationship and also to determine the short run relationship between the former and
the latter. In conducting the test the following models will be estimated:
𝑈𝑛𝑒𝑚𝑡 = ∑ 𝛼𝑖𝑛𝑖=1 𝐴𝐶𝐶𝑈𝑡−𝑖 + ∑ 𝛽𝑗
𝑛𝑗=1 𝑈𝑛𝑒𝑚𝑡−𝑗 + 휀1𝑡 (6)
𝐴𝐶𝐶𝑈𝑡 = ∑ 𝜆𝑖𝑚𝑖=1 𝐴𝐶𝐶𝑈𝑡−1 + ∑ 𝛿𝑗
𝑚𝑗=1 𝑈𝑛𝑒𝑚𝑡−𝑗 + 휀2𝑡 (7)
From the above, equation (6) states that current unemployment (𝑈𝑛𝑒𝑚𝑡) is related to the past
values of capital accumulation (𝐴𝐶𝐶𝑈𝑡−𝑖) as well as itself (𝑈𝑛𝑒𝑚𝑡−𝑗). While equation (7)
postulates that current capital accumulation (𝐴𝐶𝐶𝑈𝑡) is related to the past values of
unemployment (𝑈𝑛𝑒𝑚𝑡−𝑗) as well as itself (𝐴𝐶𝐶𝑈𝑡−1). Where 휀1𝑡 and 휀2𝑡 are assumed to be
uncorrelated.
Prior to the estimation of the above models (6 and 7), the number of lags must be determined
to assure the genuity of the models. In performing Granger causality test the number of lags
to be used is very necessary. An optimal lag order (p) needs to be selected. There are ways of
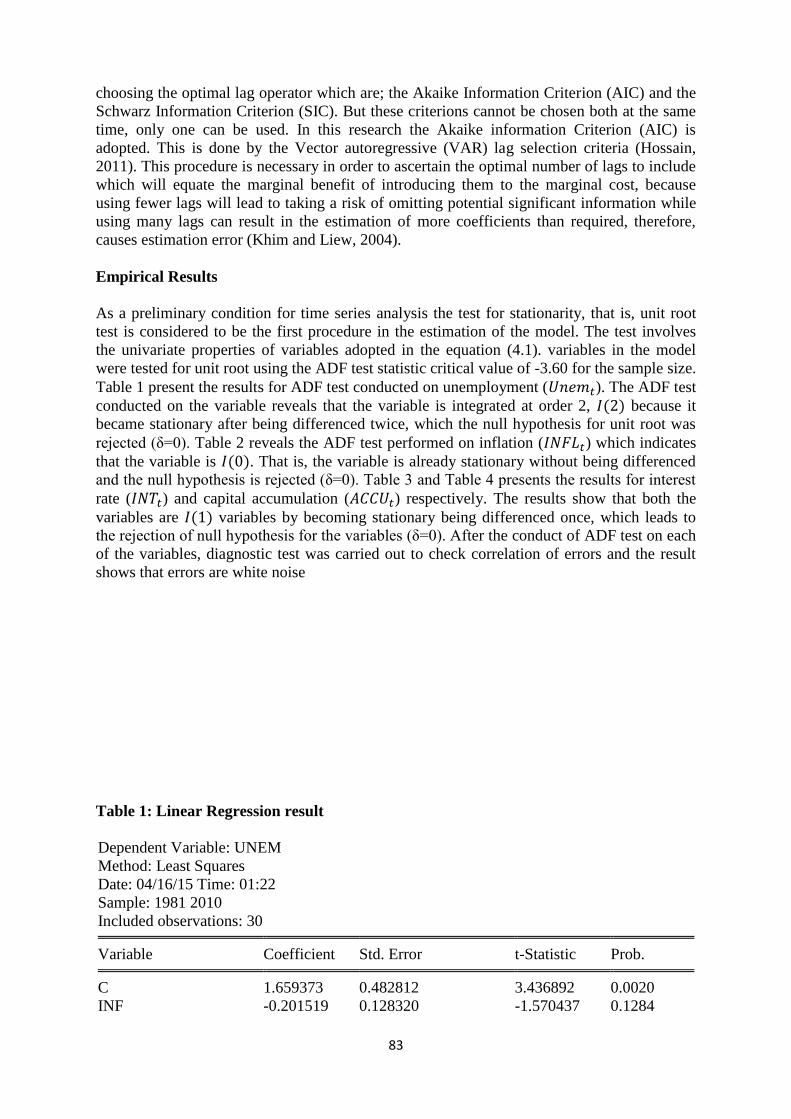
83
choosing the optimal lag operator which are; the Akaike Information Criterion (AIC) and the
Schwarz Information Criterion (SIC). But these criterions cannot be chosen both at the same
time, only one can be used. In this research the Akaike information Criterion (AIC) is
adopted. This is done by the Vector autoregressive (VAR) lag selection criteria (Hossain,
2011). This procedure is necessary in order to ascertain the optimal number of lags to include
which will equate the marginal benefit of introducing them to the marginal cost, because
using fewer lags will lead to taking a risk of omitting potential significant information while
using many lags can result in the estimation of more coefficients than required, therefore,
causes estimation error (Khim and Liew, 2004).
Empirical Results
As a preliminary condition for time series analysis the test for stationarity, that is, unit root
test is considered to be the first procedure in the estimation of the model. The test involves
the univariate properties of variables adopted in the equation (4.1). variables in the model
were tested for unit root using the ADF test statistic critical value of -3.60 for the sample size.
Table 1 present the results for ADF test conducted on unemployment (𝑈𝑛𝑒𝑚𝑡). The ADF test
conducted on the variable reveals that the variable is integrated at order 2, 𝐼(2) because it
became stationary after being differenced twice, which the null hypothesis for unit root was
rejected (δ=0). Table 2 reveals the ADF test performed on inflation (𝐼𝑁𝐹𝐿𝑡) which indicates
that the variable is 𝐼(0). That is, the variable is already stationary without being differenced
and the null hypothesis is rejected (δ=0). Table 3 and Table 4 presents the results for interest
rate (𝐼𝑁𝑇𝑡) and capital accumulation (𝐴𝐶𝐶𝑈𝑡) respectively. The results show that both the
variables are 𝐼(1) variables by becoming stationary being differenced once, which leads to
the rejection of null hypothesis for the variables (δ=0). After the conduct of ADF test on each
of the variables, diagnostic test was carried out to check correlation of errors and the result
shows that errors are white noise
Table 1: Linear Regression result
Dependent Variable: UNEM
Method: Least Squares
Date: 04/16/15 Time: 01:22
Sample: 1981 2010
Included observations: 30
Variable Coefficient Std. Error t-Statistic Prob.
C 1.659373 0.482812 3.436892 0.0020
INF -0.201519 0.128320 -1.570437 0.1284
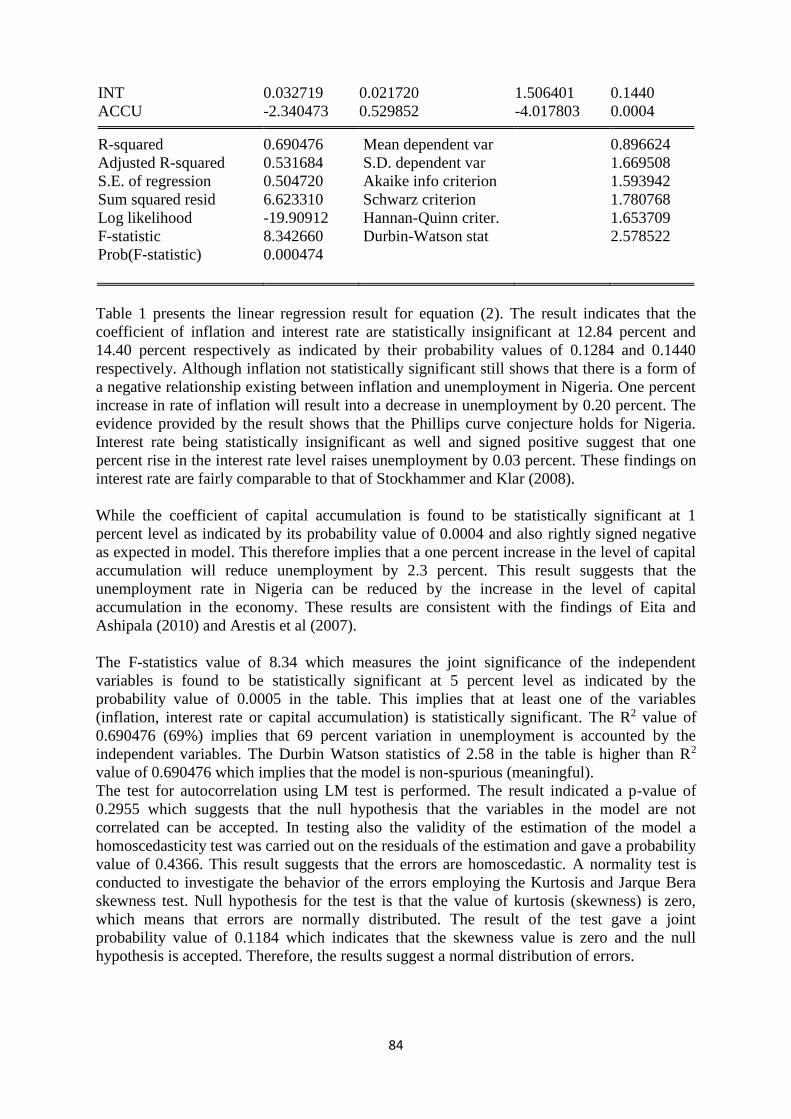
84
INT 0.032719 0.021720 1.506401 0.1440
ACCU -2.340473 0.529852 -4.017803 0.0004
R-squared 0.690476 Mean dependent var 0.896624
Adjusted R-squared 0.531684 S.D. dependent var 1.669508
S.E. of regression 0.504720 Akaike info criterion 1.593942
Sum squared resid 6.623310 Schwarz criterion 1.780768
Log likelihood -19.90912 Hannan-Quinn criter. 1.653709
F-statistic 8.342660 Durbin-Watson stat 2.578522
Prob(F-statistic) 0.000474
Table 1 presents the linear regression result for equation (2). The result indicates that the
coefficient of inflation and interest rate are statistically insignificant at 12.84 percent and
14.40 percent respectively as indicated by their probability values of 0.1284 and 0.1440
respectively. Although inflation not statistically significant still shows that there is a form of
a negative relationship existing between inflation and unemployment in Nigeria. One percent
increase in rate of inflation will result into a decrease in unemployment by 0.20 percent. The
evidence provided by the result shows that the Phillips curve conjecture holds for Nigeria.
Interest rate being statistically insignificant as well and signed positive suggest that one
percent rise in the interest rate level raises unemployment by 0.03 percent. These findings on
interest rate are fairly comparable to that of Stockhammer and Klar (2008).
While the coefficient of capital accumulation is found to be statistically significant at 1
percent level as indicated by its probability value of 0.0004 and also rightly signed negative
as expected in model. This therefore implies that a one percent increase in the level of capital
accumulation will reduce unemployment by 2.3 percent. This result suggests that the
unemployment rate in Nigeria can be reduced by the increase in the level of capital
accumulation in the economy. These results are consistent with the findings of Eita and
Ashipala (2010) and Arestis et al (2007).
The F-statistics value of 8.34 which measures the joint significance of the independent
variables is found to be statistically significant at 5 percent level as indicated by the
probability value of 0.0005 in the table. This implies that at least one of the variables
(inflation, interest rate or capital accumulation) is statistically significant. The R2 value of
0.690476 (69%) implies that 69 percent variation in unemployment is accounted by the
independent variables. The Durbin Watson statistics of 2.58 in the table is higher than R2
value of 0.690476 which implies that the model is non-spurious (meaningful).
The test for autocorrelation using LM test is performed. The result indicated a p-value of
0.2955 which suggests that the null hypothesis that the variables in the model are not
correlated can be accepted. In testing also the validity of the estimation of the model a
homoscedasticity test was carried out on the residuals of the estimation and gave a probability
value of 0.4366. This result suggests that the errors are homoscedastic. A normality test is
conducted to investigate the behavior of the errors employing the Kurtosis and Jarque Bera
skewness test. Null hypothesis for the test is that the value of kurtosis (skewness) is zero,
which means that errors are normally distributed. The result of the test gave a joint
probability value of 0.1184 which indicates that the skewness value is zero and the null
hypothesis is accepted. Therefore, the results suggest a normal distribution of errors.

85
The test for long-run economic relationship or co-integration among variables in the model
(5) was carried out by conducting an ADF test on the residuals of the estimated model
without including a constant and time trend. The test result is presented in table 2.
Table 2: Cointegration Result
ADF(1) results: Dependent variable 𝛥𝑒𝑡
Coefficients Standard Error t Stat P-value Lower 95% Upper 95%
Intercept 0 #N/A #N/A #N/A #N/A #N/A
𝑒𝑡−1 -0.239654011 0.152324972 -1.573307441 0.127738972 -0.552762475 0.073454452
𝛥𝑒𝑡−1 -0.191493523 0.195765595 -0.978177613 0.337001008 -0.593895467 0.210908421
From the above table of the cointegration test , the null hypothesis (δ≠0) of no cointegration
between the variables is accepted since the t-stat is less than the critical value -3.29 of ADF
(1) test table for cointegration test. This result indicates that there is no cointegration
relationship between the variables, which means the variables have no long-run economic
relationship. This result is however in line with the theory of the post-Keynesian economists
(Stockhammer, 2014). Appropriate diagnostic tests have been carried out after the estimation
of the co-integration test such as; autocorrelation and homoscedasticity test. The results of the
test reveal that errors are white noise and are also homoscedastic.
Lastly, The Granger causality test is conducted to determine if a causal as well as short run
relationship exist between the variables, particularly, if the causality runs from the
independent variables to unemployment or vice-versa. But on the basis of this study the
objective of the causality test is to determine the causal relationship between capital
accumulation (𝐴𝐶𝐶𝑈𝑡) and unemployment (𝑈𝑛𝑒𝑚𝑡) and investigate if there is a short-run
relationship existing between them. In conducting the test the VAR lag selection criteria was
estimated in which the Akaike Information Criterion (AIC) was used to determine the
optimal number of lags to be used in running the causality test. The test result revealed an
optimal number of four lags which has the lowest AIC value at -0.0214 (refer to appendix 8
for result). The result of the causality test is shown in table 3.
Table 3: Granger Causality test result
VAR Granger Causality/Block Exogeneity Wald Tests
Date: 05/01/15 Time: 13:08
Sample: 1981 2010
Included observations: 26
Dependent variable: UNEM
Excluded Chi-sq df Prob.
ACCU 13.23581 4 0.0102

86
All 13.23581 4 0.0102
Dependent variable: ACCU
Excluded Chi-sq df Prob.
UNEM 0.165274 4 0.9968
All 0.165274 4 0.9968
From the result above presented in table 7, the null hypothesis that capital accumulation does
not granger cause unemployment at 5% significance level can be rejected as indicated by a
probability value of 0.0102 and confirmed by the Chi-sq statistics value of 13.236 but accept
the null hypothesis that unemployment does not granger cause capital accumulation as
indicated by probability value of 0.9968 and confirmed by the Chi-sq statistics value of
0.165. These results however are consistent to the findings of Garcia-Clintalo et al (2015).
Therefore, the result indicates one-way causation relationship flowing from capital
accumulation to unemployment. That is, a unidirectional causality relationship. The results
also suggest that there is a short run relationship between the former and the latter.
And also, the test for autocorrelation using the LM test was conducted at four lags. The result
is presented in table 4.
Table 4: Test for Autocorrelation
VAR Residual Serial Correlation LM Tests
Null Hypothesis: no serial correlation at lag order h
Date: 05/01/15 Time: 13:15
Sample: 1981 2010
Included observations: 26
Lags LM-Stat Prob
1 7.466765 0.1200
2 7.528800 0.1104
3 3.777234 0.4370
4 3.470039 0.4504
Probs from chi-square with 4 df.
From the result above we can accept the null hypothesis that the variables in the model (6 and
7) are not correlated giving probability values of 0.1200, 0.1104, 0.4370 and 0.4504 at
various lags which are higher than significance level of 5% (0.05).
Normality test is also estimated adopting the Jarque Bera and Kurtosis skewness test on the
errors of the causality test. The null hypothesis of the tests is that the value of the kurtosis
(skewness) is zero. The results indicates a joint p-value of 0.4791 which suggest the null
hypothesis that the skewness value is zero can be accepted and normality distribution exist
amongst errors.
Capital Accumulation and Unemployment: Discussing the Facts
87
From the results obtained by the empirical analysis using adequate statistical measures and
procedures disclose that there is a strong relationship between capital accumulation and
unemployment in Nigeria. The data tested for the Nigerian economy from the period of 1981
to 2010 has shown that the shortage of capital in the economy is the main driving force of the
unemployment level in the economy. The estimation of the statistical model (2) reveals the
interaction between capital accumulation and unemployment. The estimation confirms that a
negative relationship exist between the former and the latter. The empirical findings depicts
that the coefficient of capital accumulation is statistically significant and that it explains the
variations of unemployment in the Nigerian economy. The findings revealed that a one
percent increase in the level of capital accumulation can reduce the unemployment level by
2.3 percent. This means that an increase in the level of accumulation of capital can improve
the unemployment profile of the country. These findings are consistent with the findings of
the post-Keynesian economics (e.g. Stockhammer et al, 2014; Koskela et al, 2009; Arestis et
al, 2007; Bande and Karnassou, 2013).
As to determine the interactive economic relationship between capital accumulation and
unemployment for the Nigerian context, a cointegration test was conducted. This test
revealed that there is no long-run economic relationship between the former and the latter.
This finding is again consistent with the argument of the post-Keynesian economics which
states that capital accumulation is a major determinant of unemployment in the short term
(Stockhammer, 2011; Stockhammer et al, 2014). The co-integration test proves this fact by
revealing that capital accumulation and unemployment are not co-integrated. That is, they
have no long-run relationship between them.
The estimation of a Granger Causality test discloses that there is a causal relationship
between capital accumulation and unemployment in the Nigerian economy. The causation
relationship is a unidirectional relationship. This means that the former tends to lead to the
latter but the latter doesn’t lead to the former. This result therefore suggests that the shortage
of capital in the Nigerian economy is the main driving force of the unemployment level in the
country. Although a two-way relationship is not expected because accumulation of capital in
an economy like Nigeria with a high unemployment rate is not expected to cause
unemployment, but rather the accumulation of capital should be able to reduce the
unemployment situation of the economy. The granger causality test also shows that capital
accumulation is a major determinant of unemployment in the short term in Nigeria economy
as revealed by the results which is in relationship with the arguments of the post-Keynesian
economics. These results are in line with results of Garcia-Clintalo et al (2015).
These findings so far are indeed consistent with the argument of the post-Keynesian
economics which highlighted the role of insufficient capital accumulation as a cause of
unemployment in economies as revealed by their various studies and findings. This argument
is true in the Nigerian context as revealed by the data and the statistical procedures explored
in the process of conducting the paper.
Summary, Policy Implication, Conclusion and Recommendations
The factor behind the conduct of the study was to investigate the proposition of the post-
Keynesian economists that capital accumulation has an important role to play in determining
unemployment in economies. The study examined the factors responsible for unemployment
in Nigeria. The investigations and analysis are conducted through a vast review of related
literature and theoretical models.
88
The paper presented empirical evidences acquired from the estimation of the statistical model
of unemployment which includes change in inflation, interest rate and capital accumulation
as the independent variables on the Nigerian time series data from the period of 1981 to 2010.
The empirical results of the estimation show that capital accumulation is statistically
significant and there is a negative relationship between capital accumulation and
unemployment. One percent increase in the level of capital accumulation will reduce the
unemployment rate of Nigeria by 2.3 percent. Investment must me ensured in other to create
jobs for the unemployed in the country (in line with findings of Arestis et al, 2007). The
results show that inflation and interest rates are statistically insignificant. The findings
suggest a negative relationship between unemployment and inflation in Nigeria which shows
that the Philips curve hypothesis holds for Nigeria. This shows that that unemployment can
also be reduced in the economy by stipulating spending which is responsible for high
inflation rate (in line with Eita and Ashipala, 2010). Interest rate on the other hand has a
positive relationship with unemployment as revealed by the data. An increase in interest rate
will raise the unemployment level of the economy (in line with Stockhammer and Klar,
2008). The study estimated the cointegration analysis to investigate the economic interaction
amongst the variables estimated. The null hypothesis of a cointegrationship relationship was
rejected. This means that there is no long-run relationship between capital accumulation and
unemployment. This result is not unusual to the theoretical model adopted in the study. The
post-Keynesians argue that capital accumulation is the main determinant of unemployment in
short run (Stockhammer, 2011). The study also estimated the Granger causality test to
investigate the interactions between capital accumulation and unemployment. The finding of
the test suggests a one-way causation relationship between the former and the latter. The
insufficiency of accumulation of capital in Nigeria causes a high and persistent
unemployment level in the economy (in line with Garcia-Clintalo et al, 2015).
The analysis and empirical findings however suggests that one of the potential and important
factors causing the persistent and high unemployment in Nigeria is the insufficient
accumulation of capital and inadequate aggregate demand in the economy.
The policy implication of the findings of the research conducted is that capital accumulation
should be stimulated by the Nigeria government. The study assigns Fiscal policy a major role
in tackling the high unemployment rate in the economy. Economic policies that will promote
a faster rate of accumulation of capital should be a priority of any policy collection which
aimed at reducing the unemployment rate of the economy. Policies should be set to ensure
investments are made attractive to both the private and public sectors of the economy.
Aggregate demand is widely regarded as the prime determinant of investment. Therefore,
economic policy should be focused on the role of stimulating aggregate demand and also
recognize that monetary policy is not seen as neutral with respect to unemployment in the
long run. The negative policy implication is that monetary policy should aim at reducing the
interest rate in the economy to attract investments to the citizens which will provide jobs for
the unemployed.
The paper has established the relationship between capital accumulation and unemployment
by application of adequate statistical measures. The study has met the objectives which it was
based upon in investigating the role of capital accumulation in reducing unemployment in
Nigeria. The results of the findings are line with the research hypothesis of the study that
insufficient capital accumulation is responsible for the high unemployment rate in Nigeria.
The study has also established that the argument of the post-Keynesian economists is true for
the Nigerian economy as revealed by the statistical measures explored. The study also found
89
a negative relationship between inflation and unemployment, although inflation is statistically
insignificant. This suggests that the Philips curve hypothesis holds for the Nigerian economy.
Based on the analysis and findings of this research the following policy recommendations are
made.
First, the Nigerian government needs to improve the manufacturing sector of the economy by
providing sufficient energy generation. The country has to increase its level of power
generation to maximum capacity which will sustain all the industries in the economy and to
attract others to invest in the sector without having fear of where to source for electricity.
This energy generation is the major obstacle affecting the manufacturing sector of the
economy. The increase in electricity output will increase the industrial capacity of the country
which will in turn increase productivity that will be supported by a high demand for
manpower. More companies and individuals will be attracted to invest into the sector and by
them investing there will be a very large amount of job creation in the economy.
Secondly, Nigeria needs to set up more refineries that will work to full capacity and also
ensure that those dilapidated refineries in the country that are working below capacity have
been put to place. If the government invest heavily in refineries and ensure the epileptic ones
are fixed and equipped with modernize technology and new ones are set up, it would generate
employment for millions of unemployed citizens, it will also enhance the generation of power
in the nation as well as boost the economy of Nigeria. The country will also be able to meet
up with local consumption and devoid from importing what it produces.
Thirdly, the government has to improve the agricultural sector of the economy which has
been the mainstay of the economy before the discovery of oil. The government has to invest
heavily in the sector by providing modern agricultural technology that will make agriculture
less cumbersome for the citizens. It has to create multi agribusiness centres across the nation
and establish farm settlements in which labour will be employed and used in the production
of different commodities. Agricultural machineries should be procured and at disposal for
young school leaver as well as graduates so that they can take part in the agricultural sector as
a profitable venture to improve the unemployment profile of the country. The improvement in
the sector should also include the government making land available for both private and
public organisations to set up agricultural industries. If the agricultural sector is well funded
and embraced in Nigeria can lead to a diversification of the economy from being an oil-
dependent economy. And this will however help in solving the problem of unemployment in
the economy.
Research Limitations and Recommendations for Future Research
The paper intended to as well base the New Keynesian model of the NAIRU which
emphasizes the causes of unemployment in economies to labour market institutions and their
policies, but due to the unavailability of data for labour market institutions in Nigeria this
argument was unable to be established for the Nigerian economy. This includes the
unavailability of data for minimum wages, employment protection legislation and union
density. And also, data on the level of accumulation of capital on different sectors is
unavailable. The study was interested in investigating the rate of growth of capital in the
individual sectors. That is, the manufacturing, petroleum and agricultural sectors. But due to
the unavailability of data this wasn’t achieved.

90
The future recommendation on this research is to base the arguments of the new Keynesian
economics by investigating the relationship between labour market institutions and
unemployment in Nigeria when the data is available. And also to investigate the level of
growth of capital stock in the individual sectors to empirically ascertain the sector that has the
lowest level of capital accumulation when the data for the individual sector are made
available.
References
1. Abbah, T. (2009) If I were President Yar’adua – Greek Ambassador. Sunday Trust
[Online]. 18 July. Available from: <http://www.dailytrust.com.ng/sunday/index.php/33-
sunday-people/sunday-people/5808-if-i-were-president-yaradua-greek-ambassador>
[Accessed 5 March 2015]
2. Adebayo, A. (2013) Youths’ Unemployment and Crime in Nigeria: A Nexus and
Implications for National Development. International Journal of Sociology and
Anthropology. 5(8). Pp. 350-357.
3. Adetimirin, O. (2014) Reducing Unemployment with Agriculture. Nigerian Tribune
[Online]. 21 April. Available from: < http://www.tribune.com.ng/letters/item/3697-
reducing-unemployment-with-agriculture/3697-reducing-unemployment-with-
agriculture>[ Accessed 9 March 2015].
4. Aiyedogbon, J. and Ohwofasa, B. (2012) Poverty and youth Unemployment in Nigeria,
1987-2011. International Journal of Business and Social Science. 3(20).
5. Ajufo, B. (2013) Challenges of Youth Unemployment in Nigeria: Effective Career
Guidance as a Panacea. African Research Review. 7(1).
6. Akande, S.O. and Okuwa, O. B. (2009) Empowering Nigerian Youths for the 21st
Century. NISER Occasional Paper. No.3, NISER, Ibadan, Nigeria.
7. Akande, T. (2014) Youth Unemployment in Nigeria: A Situation Analysis. Brookings, 23
September [online blog]. Available from:< http://www.brookings.edu/blogs/africa-in-
focus/posts/2014/09/23-youth-unemployment-nigeria-akande> [Accessed 2 March 2015].
8. Akinwale, A. (2010) The Menace of Inadequate Infrastructure in Nigeria. African Journal
of Science, Technology, Innovation and Development.2(3). Pp. 207-228.
9. Alexiou, Constantinos, Pitelis, Christos, 2003. On capital shortages and European
Unemployment: a panel investigation. Journal of Post Keynesian Economics, 25 (4), 613-
640.
10. Alves, S. and Correa, A. (2014) A Tale of Three Gaps: Unemployment, Capacity
Utilization and Output. Research Department Banco Central do Brasil.
11. Amor, D. (2014) Why Our Refineries Are Not Working. The Sun [Online]. 30 April.
Available from: <http://sunnewsonline.com/new/?p=61611> [ Accessed 11 March 2015].
12. Anga, S. (2015) Tackling Youth Unemployment in Nigeria Using Agriculture.
Community of Agricultural Stakeholders of Nigeria.
13. Arestis, P. and Biefang-Frisancho Mariscal, I. (2000). Capital shortages, unemployment
and wages in the UK and Germany. Scottish Journal of Political Economy. 47(5). pp.
487–503.
14. Arestis, P. and Sawyer, M. (2005) Aggregate Demand, Conflict and Capacity in the
Inflationary Process. Cambridge Journal of Economics. 29 (6). Pp. 959-974.
15. Arestis, P., Baddeley, M. and Sawyer, M. (2007). The Relationship between Capital
Stock, Unemployment and Wages in Nine EMU Countries. Bulletin of Economic
Research, 59(2), pp.125-148.
16. Asaju, K., Arome, S. and Anyio, S. (2014) The Rising Rate of Unemployment in Nigeria:
The Socio-Economic and Political Implications. Global Business and Economics
Research Journal. 3(2). Pp. 12-32.
91
17. Ayinde, O.E (2014) Effect of Agricultural Growth on Unemployment and Poverty in
Nigeria (1980-2011). Department of Agricultural Economics and Farm Management.
University of Ilorin, Nigera
18. Babecký, J, Du Caju, P, Kosma, T, Lawless, M, Messina, J and Rõõm, T (2010),
Downward nominal and real wage rigidity: survey evidence from European _rms.
Scandinavian Journal of Economics. Vol. 112. Pp. 884.910.
19. Baccaro, L. and Rei, D. (2007) Institutional Determinants of Unemployment in OECD
countries: Does the Deregulatory view hold water? International Organization pp. 527-
569.
20. Baghebo, M. (2013) Capital Accumulation And Economic Development In Nigeria 1970
-2010 (Disaggregated Approach). Journal of Economics and Sustainable Development,
4(4) pp. 1-90.
21. Baker, D., Glyn, A., Howell, D., and Schmitt, J. (2004) Unemployment and Labour
Market Institutions: The Failure of the Empirical Case for Deregulation. Policy
Integration Department Statistical Development and Analysis Unit International Labour
Office Geneva. Working Paper No. 43. pp. 1-35.
22. Baker, D., Glyn, A., Howell, D., Schmitt, J. (2005) Labor Market Institutions and
Unemployment: A Critical Assessment of the Cross-country Evidence. Fighting
Unemployment. The limits for Free Market Orthodoxy. Oxford University Press. pp. 72-
118
23. Ball, L. and Mankiw, N. (2002). The Nairu in Theory and Practice. Journal of Economic
Perspectives, 16(4), pp.115-136.
24. Bande, R. and Karanassou, M. (2013). Spanish Regional Unemployment Revisited: The
Role of Capital Accumulation. Regional Studies, 48(11), pp.1863-1883.
25. Barungi, B. (2014) Nigeria 2014. African Economic Outlook.
26. Bassanini, A. & Duval, R. (2006) Employment Patterns in OECD Countries: Reassessing
the role of policies and institutions. OECD Economics Department. Working Paper No.
35.
27. Blanchard, O. & Wolfers J. (2000) The Role of Shocks and Institutions in the Rise of
European Unemployment: The Aggregate Evidence. Economic Journal No. 110 pp. 1-33.
28. Blanchard, O. (2006) Macroeconomics. 4th Edition. Upper Saddle River. Prentice Hall
29. Blanchard, O. and Wolfers, J. (2000). The Role of Shocks and Institutions in the Rise of
European Unemployment: the Aggregate Evidence. Economic Journal, 110(462), pp.1-
33.
30. Bozani, V. (2011) Nairu, Unemployment and Post Keynesian Economics. Department of
Economics, University of Crete.
31. Carlin, W., and Soskice, D. (2005) Macroeconomics: Imperfections, Institutions and
Policies. Oxford: Oxford University Press
32. CBN (2010) Annual Statistical Bulletin. Central Bank of Nigeria.
33. Datta, K. and Kumar, C. (2011) Relationship between Inflation and Economic Growth in
Malaysia. International Conference on Economics and Finance Research. 4(2), pp. 415-
16.
34. Ditimi, A. and Ifeakachukwu, N. (2013) The Impact of Unemployment Rate on
Productivity Growth in Nigeria: An Error Correction Modelling Approach. International
Journal of Economics and Management Sciences. 2(8). Pp. 1-13.
35. Eita, J. and Ashipala, J. (2010). Determinants of Unemployment in Namibia. IJBM, 5(10).
36. Engelhardt, L. (2013) Labour and Capital Accumulation [Online video], 27 June.
Available from: < https://www.youtube.com/watch?v=Vm3lvFjUJNs> [Accessed 2
March 2015].

92
37. Engelhardt, L. (2013) Labour and Capital Accumulation [Online video], 27 June.
Available from: < https://www.youtube.com/watch?v=Vm3lvFjUJNs> [Accessed 2
March 2015].
38. Engle, R. and Granger, C. (1987). Co-Integration and Error Correction: Representation,
Estimation, and Testing. Econometrica, 55(2), p.251.
39. European Commission (2003) Wage flexibility and Wage Interdependencies in EMU.
European Economy: 2003 Report.
40. European Commission (2012) Structural Unemployment and its Determinants in the EU
Countries. European Commission. Economic Papers 455.
41. Faccini, R. and Bondibene, C. (2012) Labour Market Institutions and Unemployment
Volatility: Evidence from OECD Countries. The Bank of England. Working paper No.
461
42. Fitoussi, J. Jestaz, D. Phelps, E. & Zoega, G. (2000) Roots of the Recent Recoveries:
Labor Reforms or Private Sector Forces?. Brookings Papers on Economic Activity,
Economic Studies Program, 31(2000-1) pp. 237-311.
43. Flaig, G. and Rottmann, H. ( 2013) Labour Market Institutions and Unemployment: an
international panel data analysis. Empirica . 40, pp. 635–654.
44. Folabi, F. (2013) As Obasanjo Sustains Anxiety in PDP. Daily Independent [Online].
Available from: < http://dailyindependentnig.com/2013/03/as-obasanjo-sustains-anxiety-
in-pdp/>[Accessed 12 March 2015].
45. Friedman, M. (1968) The Role of Monetary Policy. American Economic Review 58: 1-
117
46. Friedman, M. (1977). Nobel Lecture: Inflation and Unemployment. Journal of Political
Economy, 85(3), p.451.
47. García-Cintado, A., Romero-Ávila, D. and Usabiaga, C. (2015) Can the hysteresis
hypothesis in Spanish regional unemployment be beaten? New evidence from unit root
tests with breaks. Economic Modelling, 47, pp.244-252.
48. Gonzalez, I. and Sala, H. (2011) Macroeconomic Consequences of the U.S.
Financialisation Process: Lower Capital Accumulation, Higher Unemployment.
Universitat Autònoma de Barcelona. Spain
49. Granger, C. (1969). Investigating Causal Relations by Econometric Models and Cross-
spectral Methods. Econometrica, 37(3), p.424.
50. Gujarati, D. (1995). Basic econometrics. New York: McGraw-Hill.
51. Gujarati, D. (2004). Basic econometrics. New Delhi: Tata McGraw-Hill.
52. Gujarati, D. and Porter, D. (2009). Basic econometrics. Boston: McGraw-Hill Irwin.
53. Hamilton, J. (1994). Time series analysis. Princeton, N.J.: Princeton University Press.
54. Hassan, H. (2010) The Country’s Unemployment challenges. All Africa [Online]. 30
September. Available from: <http://allafrica.com/stories/201009300594.html>[Accessed
12 March 2015].
55. Hossain, S. (2011) Lag selection. Model One. EVIEWS [online Video], 30 December.
Available from: < https://www.youtube.com/watch?v=kbUehCU9BLw>[Accessed 13
April 2015].
56. International Monetary Fund (2003) Unemployment and Labor Market Institutions: Why
reforms pay off. World Economic Outlook 2003. Washington D.C.
57. Kaeanassou, M. and Sala, H. (2009) The Rise and Fall of Spanish Unemployment: A
Chain Reaction Theory perspective. International Papers in Political Economy, pp. 209–
254.
58. Kapadia, S. (2003) The Capital Stock and Equilibrium Unemployment: A New
Theoretical Perspective. Economics Series University of Oxford. Working papers No. 181
93
59. Karanassou, M., Sala, H. and Salvador, P. (2008). Capital accumulation and
unemployment: new insights on the Nordic experience. Cambridge Journal of
Economics, 32(6), pp.977-1001.
60. Kehinde, D., Adeleye, S. and Edwards, S. (2009) Panic as Unilever, PZ threaten to leave
Nigeria. Nigeria Village Square [Online]. 5 February. Available from: <
http://nigeriavillagesquare.com/forum/main-square/29404-panic-unilever-pz-threaten-
leave-nigeria.html> [ Accessed 6 March 2015].
61. Keynes, J. (1937) The General Theory of Employment. Quarterly Journal of Economics
41(2) pp. 209-223.
62. Keynes, J. [1936] (1973) The General Theory of Employment, Interest and Money. The
collected writings of John Maynard Keynes volume VII. Cambridge: Macmillan.
63. Khim, V., and Liew, S. (2004) Which Lag Length Selection Criteria Should We Employ ?
Economics Bulletin. University of Putra Malaysia. 3(33)
64. Koskela, E., Stenbacka, R. and Juselius, M. (2009) Equilibrium Unemployment with
Capital Investments under Labour Market Imperfections. Helsinki Center of Economic
Research. University of Helsinki, FINLAND
65. Lamido, Sanusi (2013, July 23) Unemployment Fuelling Insecurity in Nigeria. Punch
Newspaper.
66. Layard, R. and Nickell, S. (1999) Labour Market Institutions and Economic Performance.
Hand book of Labour Economics. 3(C). Amsterdam, North Holland.
67. Layard, R. and Nickell, S. (1999) Labour Market Institutions and Economic Performance
in Ashenfelter, O. and D. Card. Handbook of Labour Economics. 3(c). Chapter 46.
Amsterdam. North-Holland. Cited in: Spielmann, C. (2006) Labour Market Institutions
and Unemployment in Europe and OECD – a Survey.
68. Layard, R., Nickell, S. J. and Jackman, R. (1991). Unemployment: Macroeconomic
Performance and the Labour Market. Oxford University Press, Oxford.
69. Lehmann, H. and Muravyev, A. (2011) Labour Market Institutions and Labour Market
Performance: What can we learn from transition countries? Department of Economics,
University of Bologna. Italy and IZA
70. Levine, L. (2013) The Increase in Unemployment Since 2007: Is It Cyclical or Structural?
Congressional Research Service.
71. Manyong, V., Ikpi, A., Olayemi, J., Yusuf, S., Omonona, B., Okoruwa, V. and Idachaba,
F. (2005) Agriculture in Nigeria: Identifying Opportunities for Increased
Commercialization and Investment. International Institute of Tropical Agriculture (IITA).
Ibadan, Nigeria.
72. Marxist theory?. Department of Economics Working Paper Series 96. Vienna University
of Economics & B.A.
73. Nickell, S., Nunziata, L. and Ochel, W. (2005). Unemployment in the OECD Since the
1960s. What Do We Know?*. Economic Journal, 115(500), pp.1-27.
74. Nnodim, O. (2013) Nigeria’s unemployment rate rises to 23.9% —NPC. The Punch
[Online]. 11 October. Available from: <http://www.punchng.com/business/business-
economy/nigerias-unemployment-rate-rises-to-23-9-npc/> [Accessed 3 March 2015].
75. Nnodim, O. (2014) 80% of Nigerian youths are unemployed – CBN. [Internet]. PUNCH.
Available from: <http://www.punchng.com/business/business-economy/80-of-nigerian-
youths-are-unemployed-cbn/ > [Accessed 12 December 2014].
76. Nwagu, E. (2014) Unemployment and Poverty in Nigeria; A Link to National Insecurity.
Global Journal of Politics and Law Research. 2(1). Pp. 19-35.
77. Odeh, M. and Okoye, C. (2014) Poverty Reduction Policy and Youth Unemployment in
Nigeria. Public Policy and Administration Research. 3(4).
78. OECD (2006) OECD Employment Outlook. Paris: OECD.
94
79. Ogun, T. (2010) Infrastructure and Poverty Reduction: Implications for Urban
Development in Nigeria. Urban Forum. 21(3). pp.249-266.
80. Ogundipe, M. A. & Aworinde, O. B. (2011) Sectoral analysis of the Impact of Public
Investment on Economic Growth in Nigeria 1970-2008. European Journal of Social
Sciences, 20 (2) pp. 259-266.
81. Okafor, E. (2011) Youth unemployment And Implications for Stability of Democracy in
Nigeria. Journal of Sustainable Development in Africa. 13(1).
82. Oketola, D. (2013) Dangote to site $8bn Refinery in Olokola FTZ. The Punch [Online]. 6
July. Available from: <http://www.punchng.com/news/dangote-to-site-8bn-refinery-in-
olokola-ftz/>[Accessed 11 March 2015].
83. Okuneye P.A. (2002) Rising Cost of Food Prices and Food Insecurities in Nigeria and its
Implication for Poverty Reduction. CBN Economic and Financial Review. (39)4.
84. Olusola-Obasa, B. (2012) Dunlop’s N8bn Plant Rots Away. The Punch [Online]. 11
August. Avalilable from: < http://www.punchng.com/feature/dunlops-n8bn-plant-rots-
away/> [Accessed 5 March 2015].
85. Omadjohwoefe, O. (2011) Education and the Paradox of Graduate Unemployment: The
Dilemma of Development in Nigeria. An International Multi-Disciplinary Journal,
Ethiopia. 5(1). Pp. 253-265.
86. Onimisi, T. (2014) The Politics of State Creation in Nigeria and the Economic Viability
of the Existing 36 States. Int J Soc Sci Mgt. 1(2).
87. Oye, N., Ibrahim, I. and Ahmad, M. (2011) UNEMPLOYMENT IN NIGERIA:
IMPLICATION ON THE GROSS DOMESTIC PRODUCT (GDP) OVER THE YEARS.
International Journal of Economic Research. 2(1). Pp. 66-71
88. Ross, M. (2003) Nigeria’s Oil Sector and the Poor. UCLA Department of Political
Science. Los Angeles.
89. Rowthorn R. (1999) Unemployment, Wage Bargaining and Capital-labour Substitution.
Cambridge Journal of Economics, 23 pp. 413-425.
90. Rowthorn, R. (1995) Capital Formation and Unemployment. Oxford Review of Economic
Policy, 11(1) pp. 26-39.
91. Rowthorn, R. (1995) Capital Formation and Unemployment. Oxford Review of Economic
Policy, 11(1) pp. 26-39.
92. Rowthorn, R. (1999) Unemployment, Capital-Labor Substitution, and Economic Growth.
IMF Working Paper 99(43).
93. Sani, S. and Kouhy, R. (2014) Effects of the Deregulation of Downstream Oil sector on
the Gross Domestic Product (GDP) and Employment in Nigeria. The Macrotheme
Review. 3(3)
94. Stockhammer, E. & Klär, E, (2008) Capital Accumulation, Labour Market Institutions,
and Unemployment in the Medium Run. DIW Berlin Discussion Paper No. 834.
95. Stockhammer, E. (2004) Explaining European Unemployment: Testing the NAIRU
Hypothesis and a Keynesian Approach. International Review of Applied Economics,
18(1) pp. 3-24.
96. Stockhammer, E. (2008). Is the Nairu Theory a Monetarist, New Keynesian, Post
Keynesian or a Marxist Theory?. Metroeconomica, 59(3), pp.479-510.
97. Stockhammer, E. and Klaer, E. (2008) Capital Accumulation, Labour Market Institutions,
and Unemployment in the Medium Run. DIW Berlin German Institute for Economic
Research. Working paper 834.
98. Stockhammer, E. Guschanski, A. & Köhler, K. (2014) Unemployment, capital
accumulation and labour market institutions in the Great Recession. Post Keynesian
Economics Study Group. Working Paper 1406.
99. Subair, G. (2013) Nigeria’s Unemployment rate hits 22%- World Bank. Nigeria Tribune
[Online]. 18 September. Available from:
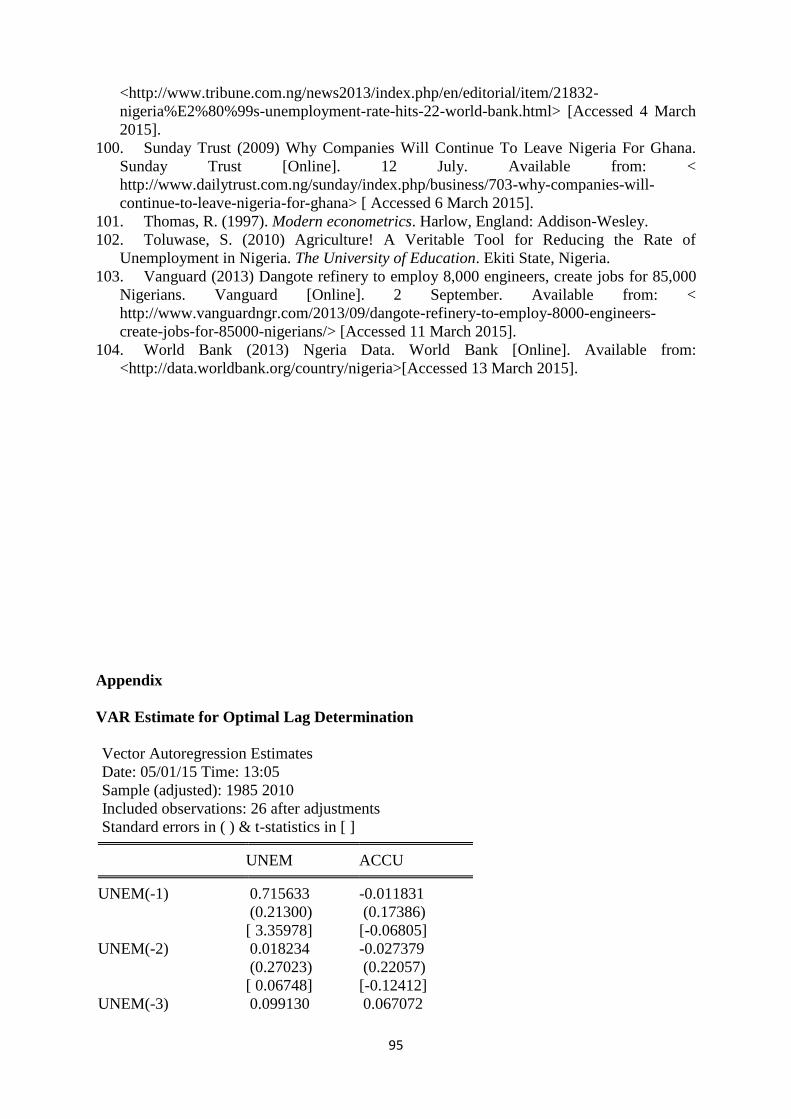
95
<http://www.tribune.com.ng/news2013/index.php/en/editorial/item/21832-
nigeria%E2%80%99s-unemployment-rate-hits-22-world-bank.html> [Accessed 4 March
2015].
100. Sunday Trust (2009) Why Companies Will Continue To Leave Nigeria For Ghana.
Sunday Trust [Online]. 12 July. Available from: <
http://www.dailytrust.com.ng/sunday/index.php/business/703-why-companies-will-
continue-to-leave-nigeria-for-ghana> [ Accessed 6 March 2015].
101. Thomas, R. (1997). Modern econometrics. Harlow, England: Addison-Wesley.
102. Toluwase, S. (2010) Agriculture! A Veritable Tool for Reducing the Rate of
Unemployment in Nigeria. The University of Education. Ekiti State, Nigeria.
103. Vanguard (2013) Dangote refinery to employ 8,000 engineers, create jobs for 85,000
Nigerians. Vanguard [Online]. 2 September. Available from: <
http://www.vanguardngr.com/2013/09/dangote-refinery-to-employ-8000-engineers-
create-jobs-for-85000-nigerians/> [Accessed 11 March 2015].
104. World Bank (2013) Ngeria Data. World Bank [Online]. Available from:
<http://data.worldbank.org/country/nigeria>[Accessed 13 March 2015].
Appendix
VAR Estimate for Optimal Lag Determination
Vector Autoregression Estimates
Date: 05/01/15 Time: 13:05
Sample (adjusted): 1985 2010
Included observations: 26 after adjustments
Standard errors in ( ) & t-statistics in [ ]
UNEM ACCU
UNEM(-1) 0.715633 -0.011831
(0.21300) (0.17386)
[ 3.35978] [-0.06805]
UNEM(-2) 0.018234 -0.027379
(0.27023) (0.22057)
[ 0.06748] [-0.12412]
UNEM(-3) 0.099130 0.067072
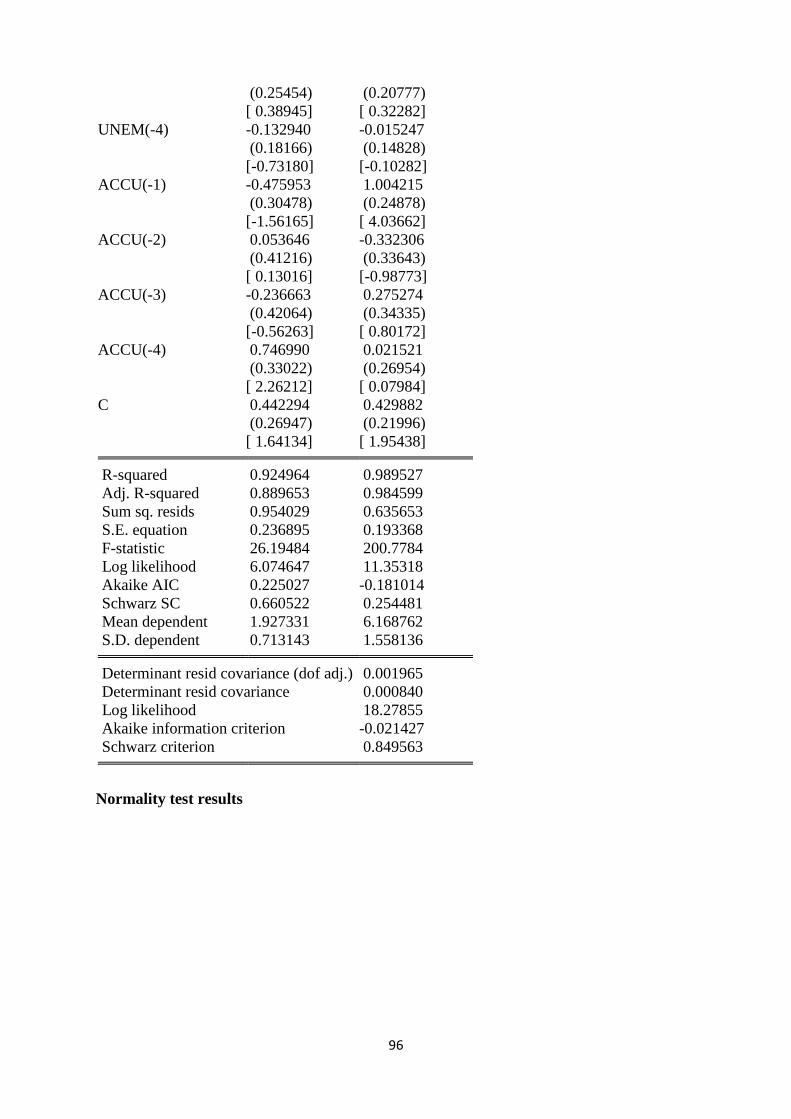
96
(0.25454) (0.20777)
[ 0.38945] [ 0.32282]
UNEM(-4) -0.132940 -0.015247
(0.18166) (0.14828)
[-0.73180] [-0.10282]
ACCU(-1) -0.475953 1.004215
(0.30478) (0.24878)
[-1.56165] [ 4.03662]
ACCU(-2) 0.053646 -0.332306
(0.41216) (0.33643)
[ 0.13016] [-0.98773]
ACCU(-3) -0.236663 0.275274
(0.42064) (0.34335)
[-0.56263] [ 0.80172]
ACCU(-4) 0.746990 0.021521
(0.33022) (0.26954)
[ 2.26212] [ 0.07984]
C 0.442294 0.429882
(0.26947) (0.21996)
[ 1.64134] [ 1.95438]
R-squared 0.924964 0.989527
Adj. R-squared 0.889653 0.984599
Sum sq. resids 0.954029 0.635653
S.E. equation 0.236895 0.193368
F-statistic 26.19484 200.7784
Log likelihood 6.074647 11.35318
Akaike AIC 0.225027 -0.181014
Schwarz SC 0.660522 0.254481
Mean dependent 1.927331 6.168762
S.D. dependent 0.713143 1.558136
Determinant resid covariance (dof adj.) 0.001965
Determinant resid covariance 0.000840
Log likelihood 18.27855
Akaike information criterion -0.021427
Schwarz criterion 0.849563
Normality test results
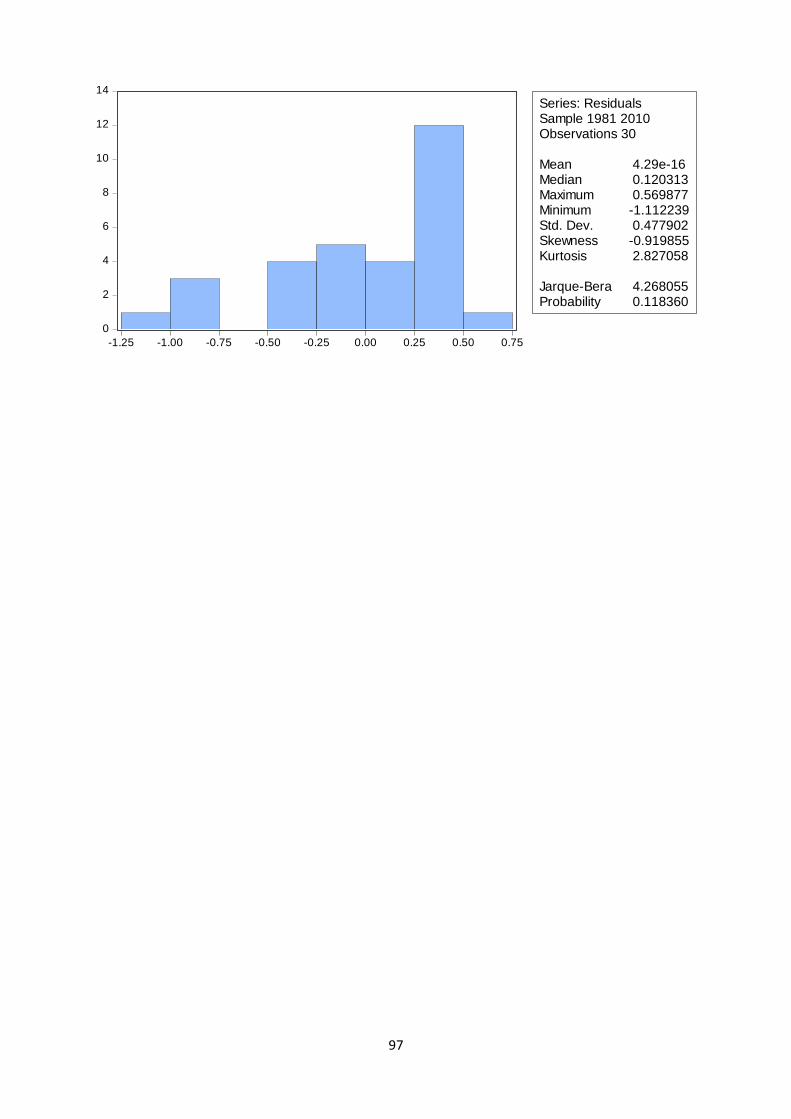
97
0
2
4
6
8
10
12
14
-1.25 -1.00 -0.75 -0.50 -0.25 0.00 0.25 0.50 0.75
Series: ResidualsSample 1981 2010Observations 30
Mean 4.29e-16Median 0.120313Maximum 0.569877Minimum -1.112239Std. Dev. 0.477902Skewness -0.919855Kurtosis 2.827058
Jarque-Bera 4.268055Probability 0.118360

98
TRAINING EMERGING NEEDS OF STUDENTS IN BUSINESS EDUCATION ON
BASIC COMPUTER MAINTAINANCE AS WAY FOR SUSTAINABLE
DEVELOPMENT IN FEDERAL COLLEGE OF EDUCATION ZARIA.
Abdullahi Daniel Uzoma Eze
08037752541
Business Education Department, School of Vocational & Technical Education Federal
College of Education Zaria, Nigeria
Abstract
This paper titled Training Emerging Needs of Students in Business Education on Basic
Computer Maintainance as way for Sustainable Development in Federal College of
Education Zaria. Business Education been part of vocation and technical education which
aims are to trian students that can be self relaint after school. Infusing this basic computer
maintainace in the curriculum becomes a problem challeging the employers of labours, who
to teach the cause, as emerging needs of the students.Two objective and two hypotheses was
adopted: firstly determine the userbility and teaching of basic computer maintainace skill
among teachers and students as way for Sustainable Development in Federal College of
Education Zaria, secondly, Evaluate the impact of infusing basic computer maintainace skill
on business education curriculum as way for Sustainable Development in Federal College of
Education Zaria, while the hypotheses are: firstly, There is no significant difference in the
opinion of students and teachers on the capacity to teach basic computer maintainace skill in
federal college of education zaria. Secondly, There is no significant difference between the
opinion of employers of labour, teachers and students on the infusing of basic computer
maintaince skill into business education curriculum in federal college of education zaria.
Descriptive survey design was adopted for the work. Discussion of Major Findings. The
result of this work revealed that, employers of labour and teachers have more needs than
students in federal college of education zaria. This was indicated by a mean score of 2.3
which was less than the 2.5 benchmark for agreement. This shows that, respondents are of
the view that, employers of labour and teachers have more emerging needs than students in
federal college of education zaria. The finding of this work further revealed a significant
difference with regards to the provision of qualified teachers to teach basic computer
maintainance between employer of labour, teachers and students. This was revealed by the
calculated t-value of 5.941 greater than the critical t-value of 1.96 which implies that, the
difference is statistically significant (p=0.005). Based on the findings conclusion and
recommendation was made: Both federal and state governments should provide relevant
instructional facilities needed for effective teaching and learning in federal colleges of
education zaria. authorities should also encourage teachers to always use the appropriate
instructional material for effective instruction delivery.
Key words: Training Emerging Needs, Business Education, Basic Compuer Maintenance,
Sustainable, Development.
Introduction
This paper forcast the needs of business education students, based on their curriculum such as
computer appreciation and computer application. this research came up with suggestions
where the students are lacking behind such as knowledge on basic computer maintenance
99
which will enable them to repair some basic needs of the computer without looking for a
specialist to fix it.
However, the fundamentals of this research is to introduce to students of business education
the basic needs in servicing and maintenance concept, basic repairs, fundamental trouble
shooting procedures. Methodologies on how to find fault location, service manuals, Test and
measuring instruments, special tools. Building knowledge on hardware and software faults.
The trouble shooting techniques: motherboard, confiqure and applying BIOS settings, Boot
sequence, expansion Slots, RAM types and features, install and confiqure expansion cards
install and confiqure storage device and appropriate media, differentiate among various CPU
types and its features, compare and contrast various connection interfaces and explain their
purpose to the students.
Furthermore, introducing to students in business education how to install an appropriate
power supply based on a given scenario, identifying connector types and associated cables,
how to install and configure various peripheral device, Networking, network cables and
connectors, explain common TPC and UDP ports, protocols and their purpose.
Thus, introducing wireless networking standards identify various type of networks, compare
and contrast network device their future and features. explaining the differences between the
various printer types and summarize the associated imaging process. Given a scenario, install,
and confiqures printers, print device sharing and maintenance. Explaining evironmental
impacts and purpose of environmental control. This research is also build on a scenario of
installing and confiquration of operating system using the most appropriate method. Given a
scenario in troubleshooting commom video and display isues. trouble shooting keyboard and
mouse on PS2 and USB ports.
Base on the aformentioned the researcher seek to introduce training emerging needs of
students in business education. The needs among others are infusing basic computer
maintenance into business education curriculum as way for sustainable development and self
reliance after school in vocational and technical education programmes. This students are
familiar to theoritical and practical aspects such as the computer appreciation and computer
application, the theoritical here is evolution of computer while the practical deals on
microsoft office such as mastering of microsoft word, excel , powerpoint publisher, and
Access. The needs of these students can not only be limited to evolution of computer and
microsoft office because information and communication technology (ICT) has come with lot
of packages in the sence that the needs of this students could be on desktop publishing,
computer maintenance , security, Java, Oracle , Cisco Network, Web site design, phone
maintenance and repair, etc.
Thus, Business education is course design for a students to teach in the classroom and also
for sustainable development either in the N.C.E level or Degree level. That is why the
researcher forsaw the need of infusing basic computer maintenance as training emerging
needs of students in business education because it will help the students in their place of
work, during the labour market that is, seeking for employment the employer will want those
job seekers that have this basic computer maintenance skill not only the person with
computer operating skill.
Inaddition, some of the problems and challeges encantered is during introducing or infusing
such courses into the curriculum, looking at the employers needs, teachers competence on the
skill to teach. lack of time frame or time apportioned for the course, lack of userbility and

100
maintenance of instructional material. lack of manpower and skill competence to teaching of
the course. The employers may feel of what need will be if emloyed, both for office job and
teaching. The students may not have interest of doing any maintenance job for his or her
employers.
Base on the aforementioned problems the researcher wish to investigate on Training
Emerging Needs of Students in business education on basic computer maintenance as way for
sustainable development in Federal College of Education Zaria.
Research Impact: This research will be of beneficiriay to the following ways: Students of
Business Education, Employers of Labour, Lecturers in Business Education, Federal and
State Ministry of Education.
Business Education students will benefit in this research work because is added advantage to
the new students, the old students were taught only computer appreciation and computer
application but with this new development of infusing basic computer maintenance in to the
currriculum is a welcome idea to the students of business education.
Employers of Labour both in teaching profession and other office job the employers of
business educator will benefit from this development of infusing basic computer maintenance
into business education curriculum because this students will not only have knowledge on
operating the computer but also do some basic computer repairs for the employers.
Lecturers of Business Education will be of benefit to this research work, it will develop the
lecturers on the skill of basic computer maintenance because those that does not have
knowledge on basic computer maintenance will be sent for studies to aquare this skills. this
research will also be of benefit to lecturers of business education because it will boost their
curriculum vatie.
The Mininstry of education both State and Federal level will use it for further development of
the curriculum in business education and releted programmes. This research work will be of
benefit to the federal and state ministry of education because it has highlighted the emerging
needs of students in business education.
Objective of the Study
The mejor objective of this research work is Training Emerging Needs of Students in
Business Education on Basic Computer Maintenance as way for Sustainable Development in
Federal College of Education Zaria while the specific objective are:
I. Determine the userbility and Teaching of basic computer maintenance skill
among teachers and students as way for sustainable development in Federal
College of Education Zaria.
II. Evaluate the impact of infusing basic computer maintenance skill on business
education curriculum as way for sustainable development in Federal Collge of
Education Zaria.
Hypothese
101
Base on the specific objective hypothese was formulated for this paper:
I. There is no significant difference in the opinion of students and teachers on the
capacity to teach basic computer maintenance skill in Federal College of Education
Zaria;
II. There is no significant difference between the opionion of employers of labour,
teachers and students on the infusing of basic computer maintenance skill into
business education curriculum in Federal College of Education Zaria;
Concept and Propose Currriculum Course Outline
The objective of basic computer maintenance curriculum is to give students the basic
computer skills needed to troubleshoot computer hardware and software problems and to
prepare them for an entry level of employment. This curriculum will provide instructions and
practical aspect of teaching:
Configure and apply BIOS Settings
1. This course will build students on Install firmware upgrades – flash BIOS, BIOS
component information, RAM, Hard drive, Optical drive, CPU
2. BIOS configurations, Boot sequence, Enabling and disabling devices, Date/time,
Clock speeds, Virtualization support, BIOS security (passwords, drive encryption:
TPM, lo-jack),
3. Use built-in diagnostics,Monitoring,Temperature monitoring, Fan speeds, Intrusion
detection/notification, Voltage, Clock, Bus speed (A+ Computer Maintenance, 2013).
Differentiate between motherboard components, their purposes, and properties.
1. Sizes, ATX,Micro –ATX, ITX
a. Expansion slots, PCI,PCI-X, PCIe, miniPCI, CNR, AGP2x, 4x, 8x, RAM slots, CPU
sockets
b. Chipsets, North Bridge,South Bridge, CMOS battery
2. Jumpers
3. Power connections and types
4. Fan connectors
5. Front panel connectors:USB, Audio, Power button, Power light, Drive activity
lights,Reset button Bus speeds(basic computer maintenance,2014)
Compare and contrast RAM types and features
1 Types
DDR
2. DDR2: SDRAM, SODIMM, DIMM,RAM configurations (Single channel vs dual channel vs
triple channel)
3. RAM compatibility and speed
Teaching students Installing and configuring expansion cards.

102
i. Sound cards, Video cards, Network cards,Serial and parallel cards,USB
cards,Firewire cards
Storage cards, Modem cards, Wireless/cellular cards,TV tuner cards,Video capture cards,
Riser cards
Building on Installing and configuring storage devices and use appropriate media.
1. Optical drives:CD-ROM, DVD-ROM, Blu-Ray
2. Combo drives and burners:CD-RW,DVD-RW,Dual Layer DVD-RW,BD-R, BD-RE
3. Connection types:External (USB, Firewire, eSATA, Ethernet),Internal SATA, IDE and
SCSI (IDE configuration and setup (Master, Slave, Cable,Select), SCSI IDs (0 – 15)),
Hot swappable drives
4. Hard drives:Magnetic, 5400 rpm,7200 rpm, 10,000 rpm, 15,000 rpm
5. Solid state/flash drives:Compact flash, SD, Micro-SD, Mini-SD, xD, SSD
Differentiate to students among various CPU types and features and select the appropriate
cooling method.
A. Socket types: Intel: LGA, 775, 1155, 1156, 1366, AMD: 940, AM2, AM2+, AM3,
AM3+, FM1, F
B. Characteristics: Speeds, Cores, Cache size/type, Hyperthreading, Architecture (32-bit
vs. 64-bit)
Integrated GPU
4. Cooling: Heat sink, Fans, Thermal paste (A+ Computer Maintenance, 2013).
Introducing to students how to evaluate and select appropriate components for a custom
configuration, to meet customer specifications or needs:
Graphic / CAD / CAM design workstation,
Audio/Video editing workstation, Virtualization workstation, Gaming PC, Home Theater PC,
Standard thick client,Thin client,Home Server PC
Given students a scenario to evaluate types and features of display devices.
Types: CRT, LCD, LED, Projector
Impacting to students how to Identify connector types and associated cables.
i. Display connector types:DVI-D, DVI-I, DVI-A, DisplayPort, miniHDMI,RJ-45
ii. Display cable types:HDMI, DVI, VGA,S-video
iii. Device connectors and pin arrangements:SATA,PATA, IDE, USB,PS/2, Audio,RJ-
45
iv. Device cable types:SATA, eSATA, IDE, Floppy, USB, Parallel, Serial
To Install and configure various peripheral devices.
a. Input devices: Mouse, Keyboard, Microphone
b. Output devices: Printers, Speakers, Display devices
To Identify types of network cables and connectors.

103
A. Twisted Pair: Connectors: RJ-11, RJ-45, Wiring standards: T568A, T568B
Explaining to students properties and characteristics of TCP and IP.
1. IP class:Class A, B, C
2. IPv4 vs. IPv6, Public vs. private vs. APIPA, Static vs. dynamic, Client-side DNS, DHCP,
Subnet mask
Gateway
Explain to students the common TCP and UDP ports, protocols, and their purpose.
a. Ports: 21 – FTP, 23 – TELNET,25 – SMTP, 53 – DNS, 80 – HTTP, 110 – POP3, 3389 –
RDP
b. Protocols: DHCP,DNS,LDAP,SNMP, SMB, SSH, SFTP, TCP vs. UDP
Identify various types of network:
LAN, WAN, PAN, MAN, Topologies:Ring, Bus, Star, Hybrid
Compare and contrast network devices their functions and features:
Hub, Switch, Router, Access point, Bridge, Modem, NAS, Firewall, VoIP phones, Internet
appliance
Given students a scenario to use appropriate networking tools:
Crimper, Multimeter, Toner probe
Cable tester, Loopback plug, Punchdown tool
Explain the differences between the various printer types and summarize the associated
imaging process to students
A. Laser: Imaging drum, fuser assembly, transfer belt, transfer roller, pickup rollers,
separate pads, duplexing assembly, Imaging process: processing, charging, exposing,
developing, transferring, fusing and cleaning
B. Inkjet: Ink cartridge, print head, roller, feeder, duplexing assembly, carriage and belt
Calibration
C. Thermal: Feed assembly, heating element, Special thermal paper
Compare and contrast the features and requirements of various Microsoft Operating
Systems.
i. Windows XP Home, Windows XP Professional, Windows XP Media Center,
Windows XP 64-bit, Professional
ii. Windows Vista Home Basic, Windows Vista Home Premium, Windows Vista
Business, Windows Vista Ultimate, Windows Vista Enterprise
iii. Windows 7 Starter, Windows 7 Home Premium, Windows 7 Professional,
Windows 7
iv. Ultimate, Windows 7 Enterprise
v. Features: 32-bit vs. 64-bit, Aero, gadgets, user account control, bit-locker,
shadow copy, system restore, ready, boost, sidebar, compatibility mode, XP mode,
104
easy transfer, administrative tools, defender, Windows firewall, security center,
event viewer, file structure and paths, category view vs. classic view
vi. Upgrade paths – differences between in place upgrades, compatibility tools,
Windows upgrade, OS advisor
Given a scenario, install, and configure the operating system using the most appropriate
method:
1. Boot methods: USB, CD-ROM, DVD, PXE (A+ Computer Maintenance, 2013).
The Concept of Sustainable Development
According to Emas, (n.d), reported that, In 1987, the Bruntland Commission published its
report, Our Common Future, in an effort to link the issues of economic development and
environmental stability. In doing so, this report provided the oft-cited definition of
sustainable development as “development that meets the needs of the present without
compromising the ability of future generations to meet their own needs” (United Nations
General Assembly, 1987, p. 43). Albeit somewhat vague, this concept of sustainable
development aims to maintain economic advancement and progress while protecting the
long-term value of the environment; it “provides a framework for the integration of
environment policies and development strategies” (United Nations General Assembly, 1987).
However, long before the late 20th century, scholars argued that there need not be a trade-off
between environmental sustainability and economic development. Thus, with this concept
business education has bring in an idea that stand for sustainable development in Nigeria to
its students at large.
Sustainable Development: Definition and Principles
Although many definitions abound, the most often used definition of sustainable development
is that proposed by the Brundtland Commission (Cerin, 2006; Dernbach J. C., 1998;
Dernbach J. C., 2003; Stoddart, 2011). This broad definition, which will be used in this
dissertation, does not limit the scope of sustainability. The explanation does, however, touch
on the importance of intergenerational equity. This concept of conserving resources for future
generations is one of the major features that distinguish sustainable development policy from
traditional environmental policy, which also seeks to internalize the externalities of
environmental degradation. The overall goal of sustainable development (SD) is the long-
term stability of the economy and environment; this is only achievable through the
integration and acknowledgement of economic, environmental, and social concerns
throughout the decision making process.(United Nations, 2008)
Concepts in Business Education
According to Ezeani(2012) Business Education is one of the aspects of vocational education
that focuses on skills and knowledge acquisition for the recipients. The goal of business
education according to Anao, (1986) is the production of manpower that possesses the
requisite knowledge, skill and attitude for harnessing other resources and brings them into co-
operative relationships yielding goods and services demanded by society for satisfaction of
other wants and needs. However, business education been skill acquiring discipline must
inculcate in the recipients to have knowledge and skill of ICT. The premise that ICT is
essential for bringing changes to classroom teaching and learning in educational systems
105
around the world are under increasing pressure to the society and the world at large. The
acronym for ICT means Information and Communication Technologies.
Training and Development
Year after year, students are admitted into the universities or other tertiary institutions. On
this ground, it is expected that the students are acquainted with the aim of education as
specified as specified in the National Policy, as well as fulfilling the goal for tertiary
institutions in Nigerian. According to FGN (2004), technical and vocational education
referred to those aspects of the educational process that involves the general education, the
study of technologies and related sciences and acquisition of practical skills, attitude, promote
national and international understanding and interaction, exposure to relevant future working
environment respectively. When all these objectives were achieved, one may agree that there
are possible ways of solving problems that are obvious in the economy of Nigerian and in the
world today.
Training Needs Assessment is the method of determining if a training need exists and, if it
does, what training is required to fill the gap. TNA seeks to identify accurately the levels of
the present situation in the target surveys, interview, observation, secondary data and/or
workshop. The gap between the present status and desired status may indicate problems that
in turn can be translated into a training need Training can reduce, if not eliminate, the gap, by
equipping the participants with knowledge and skills and by encouraging them to build and
enhance their capabilities. The data on the present status are vital to the evaluation or impact
survey in the latter part of the training cycle.
Why do we need training?
Because training is a means to ensure that government officials have the knowledge and right
skills to be able to do their work effectively and competently. Training may be needed when
there is a gap between the desired performance, and the current performance, and the reason
for that gap is lack of skill or knowledge. Training may only be able to resolve part of the
problem. Thus we need to analyze the problem and find out whether training will be able to
resolve it. If training is necessary, we also need to define the objective of the training and
how it will help the staff member(s) become more effective.
Research Methodology
Descriptive survey research design was used for the study. The most common descriptive
research method is the survey (Thomas and Nelson, 2001). The method involves systematic
collection of data from the entire population of people or sample drawn from the population
through the use of questionnaire, and oral interview or observation in order to find out the
opinions of indvivduals about some things.
Population of the Study
The population of the study is nine thousand nine hundred and sixty two (9962) consists of
8434 students and 1528 teachers and employers of laour from Zaria metropolis.
Sample Size and Sampling Procedure
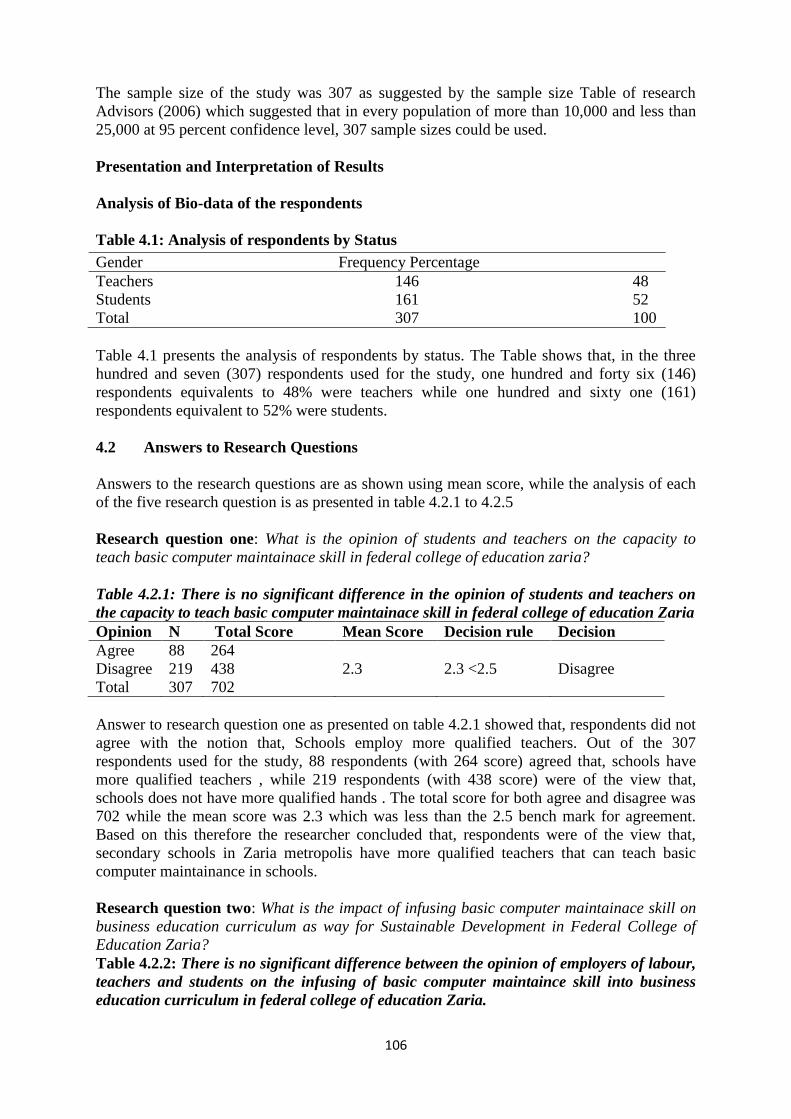
106
The sample size of the study was 307 as suggested by the sample size Table of research
Advisors (2006) which suggested that in every population of more than 10,000 and less than
25,000 at 95 percent confidence level, 307 sample sizes could be used.
Presentation and Interpretation of Results
Analysis of Bio-data of the respondents
Table 4.1: Analysis of respondents by Status
Table 4.1 presents the analysis of respondents by status. The Table shows that, in the three
hundred and seven (307) respondents used for the study, one hundred and forty six (146)
respondents equivalents to 48% were teachers while one hundred and sixty one (161)
respondents equivalent to 52% were students.
4.2 Answers to Research Questions
Answers to the research questions are as shown using mean score, while the analysis of each
of the five research question is as presented in table 4.2.1 to 4.2.5
Research question one: What is the opinion of students and teachers on the capacity to
teach basic computer maintainace skill in federal college of education zaria?
Table 4.2.1: There is no significant difference in the opinion of students and teachers on
the capacity to teach basic computer maintainace skill in federal college of education Zaria
Opinion N Total Score Mean Score Decision rule Decision
Agree 88 264
Disagree 219 438 2.3 2.3 <2.5 Disagree
Total 307 702
Answer to research question one as presented on table 4.2.1 showed that, respondents did not
agree with the notion that, Schools employ more qualified teachers. Out of the 307
respondents used for the study, 88 respondents (with 264 score) agreed that, schools have
more qualified teachers , while 219 respondents (with 438 score) were of the view that,
schools does not have more qualified hands . The total score for both agree and disagree was
702 while the mean score was 2.3 which was less than the 2.5 bench mark for agreement.
Based on this therefore the researcher concluded that, respondents were of the view that,
secondary schools in Zaria metropolis have more qualified teachers that can teach basic
computer maintainance in schools.
Research question two: What is the impact of infusing basic computer maintainace skill on
business education curriculum as way for Sustainable Development in Federal College of
Education Zaria?
Table 4.2.2: There is no significant difference between the opinion of employers of labour,
teachers and students on the infusing of basic computer maintaince skill into business
education curriculum in federal college of education Zaria.
Gender Frequency Percentage
Teachers 146 48
Students 161 52
Total 307 100
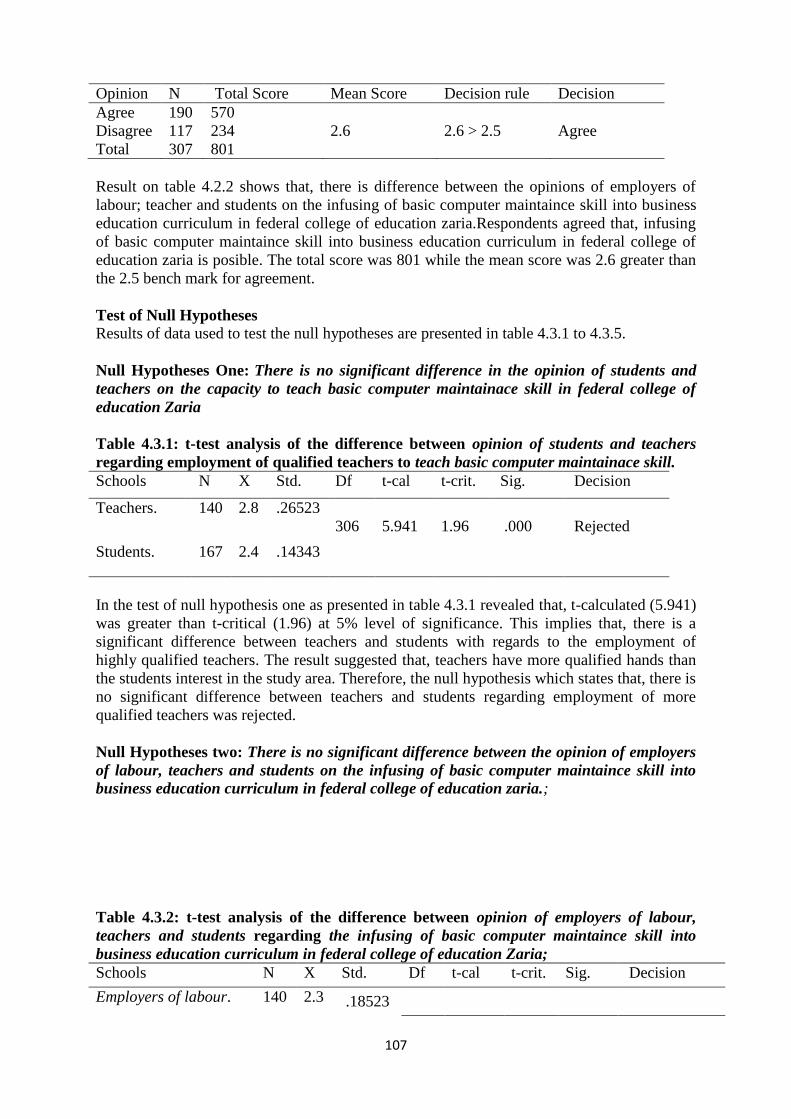
107
Opinion N Total Score Mean Score Decision rule Decision
Agree 190 570
Disagree 117 234 2.6 2.6 > 2.5 Agree
Total 307 801
Result on table 4.2.2 shows that, there is difference between the opinions of employers of
labour; teacher and students on the infusing of basic computer maintaince skill into business
education curriculum in federal college of education zaria.Respondents agreed that, infusing
of basic computer maintaince skill into business education curriculum in federal college of
education zaria is posible. The total score was 801 while the mean score was 2.6 greater than
the 2.5 bench mark for agreement.
Test of Null Hypotheses
Results of data used to test the null hypotheses are presented in table 4.3.1 to 4.3.5.
Null Hypotheses One: There is no significant difference in the opinion of students and
teachers on the capacity to teach basic computer maintainace skill in federal college of
education Zaria
Table 4.3.1: t-test analysis of the difference between opinion of students and teachers
regarding employment of qualified teachers to teach basic computer maintainace skill.
Schools N X Std. Df t-cal t-crit. Sig. Decision
Teachers. 140 2.8 .26523
306
5.941
1.96
.000
Rejected
Students.
167
2.4
.14343
In the test of null hypothesis one as presented in table 4.3.1 revealed that, t-calculated (5.941)
was greater than t-critical (1.96) at 5% level of significance. This implies that, there is a
significant difference between teachers and students with regards to the employment of
highly qualified teachers. The result suggested that, teachers have more qualified hands than
the students interest in the study area. Therefore, the null hypothesis which states that, there is
no significant difference between teachers and students regarding employment of more
qualified teachers was rejected.
Null Hypotheses two: There is no significant difference between the opinion of employers
of labour, teachers and students on the infusing of basic computer maintaince skill into
business education curriculum in federal college of education zaria.;
Table 4.3.2: t-test analysis of the difference between opinion of employers of labour,
teachers and students regarding the infusing of basic computer maintaince skill into
business education curriculum in federal college of education Zaria;
Schools N X Std. Df t-cal t-crit. Sig. Decision
Employers of labour. 140 2.3 .18523

108
Teachers and students.
167
2.7 .20343 305
3.101 1.96 .000 Rejected
Table 4.3.2 presents t-test analysis of the difference between Employers of labour and
Teachers and student regarding infusing of basic computer maintaince skill into business
education curriculum in federal college of education Zaria; The table revealed that,
Employers of labour are more effective in the provision and utilization of instructional
facilities for teaching and learning than the Teachers and students. This is because, the
calculated t-value (3.101) was greater than the critical t-value (1.96) at 5% level of
significance which means that, there is significant difference in the provision and utilization
of instructional facilities between Employers of labour and Teachers and students in the
study area. Therefore, null hypothesis two which states that, there is no significance
difference between Employers of labour and Teachers and students regarding the infusing of
basic computer maintaince skill into business education curriculum in federal college of
education Zaria. rejected.
Summary of Major Findings
The findings of this work which was carried out to determine Training Emerging Needs of
Students in Business Education on Basic Computer Maintainance as way for Sustainable
Development in Federal College of Education Zaria.were based on the results of descriptive
statistics (mean score) and t-test analysis. The major findings of this research work were
summarized as follow;
1. There is difference between teachers and students with regards to the employment of
qualified teachers. teachers were found to be more qualified than students interest basic
computer maintainance. The difference was also found to be statistically significant at 5%
level of significance.
2. Employers of labour were also found to be more effective in terms of provision and
utilization of instructional facilities than their Teachers and student. The difference was
found to be statistically significance (p=0.05).
Discussion of Major Findings
The result of this work revealed that, employers of labour and teachers have more needs than
students in federal college of education zaria. This was indicated by a mean score of 2.3
which was less than the 2.5 benchmark for agreement. This shows that, respondents are of the
view that, employers of labour and teachers have more emerging needs than students in
federal college of education zaria. The finding of this work further revealed a significant
difference with regards to the provision of qualified teachers to teach basic computer
maintainance between employer of labour, teachers and students. This was revealed by the
calculated t-value of 5.941 greater than the critical t-value of 1.96 which implies that, the
difference is statistically significant (p=0.005
CONCLUSION
Based on the findings of this work, the following conclusions were made:
Employers of Labour have more qualified teachers than students which have interest on basic
computer maintainance in Fderal College of Education Zaria.
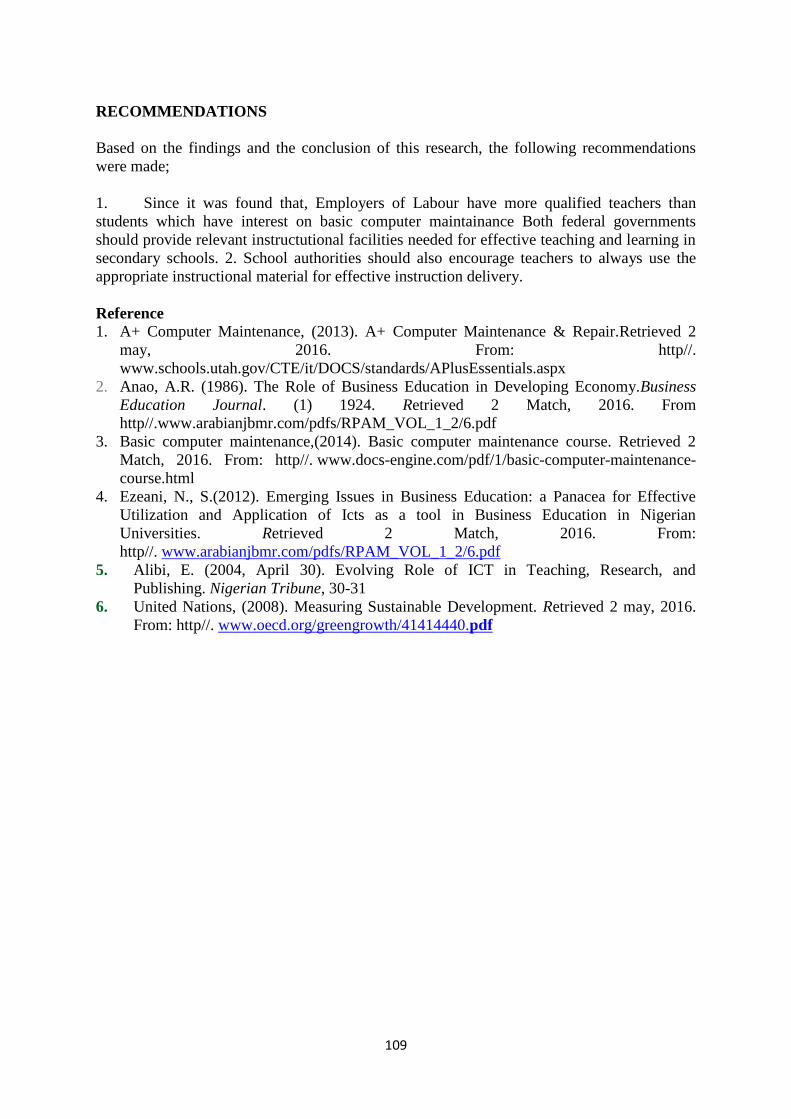
109
RECOMMENDATIONS
Based on the findings and the conclusion of this research, the following recommendations
were made;
1. Since it was found that, Employers of Labour have more qualified teachers than
students which have interest on basic computer maintainance Both federal governments
should provide relevant instructutional facilities needed for effective teaching and learning in
secondary schools. 2. School authorities should also encourage teachers to always use the
appropriate instructional material for effective instruction delivery.
Reference
1. A+ Computer Maintenance, (2013). A+ Computer Maintenance & Repair.Retrieved 2
may, 2016. From: http//.
www.schools.utah.gov/CTE/it/DOCS/standards/APlusEssentials.aspx
2. Anao, A.R. (1986). The Role of Business Education in Developing Economy.Business
Education Journal. (1) 1924. Retrieved 2 Match, 2016. From
http//.www.arabianjbmr.com/pdfs/RPAM_VOL_1_2/6.pdf
3. Basic computer maintenance,(2014). Basic computer maintenance course. Retrieved 2
Match, 2016. From: http//. www.docs-engine.com/pdf/1/basic-computer-maintenance-
course.html
4. Ezeani, N., S.(2012). Emerging Issues in Business Education: a Panacea for Effective
Utilization and Application of Icts as a tool in Business Education in Nigerian
Universities. Retrieved 2 Match, 2016. From:
http//. www.arabianjbmr.com/pdfs/RPAM_VOL_1_2/6.pdf
5. Alibi, E. (2004, April 30). Evolving Role of ICT in Teaching, Research, and
Publishing. Nigerian Tribune, 30-31
6. United Nations, (2008). Measuring Sustainable Development. Retrieved 2 may, 2016.
From: http//. www.oecd.org/greengrowth/41414440.pdf

110
FACTORS AFFECTING AUDIT EXPECTATIONS GAP IN NIGERIA
Dr. Atu, Omimi-Ejoor Osaretin Kingsley (FCA, FCTI, FCMA)1 , Dr. Raphael Igbinosa
Adeghe 2 Atu, Favour Osaro3 Atu, Efosa Collins4 1H.O.D- Department of Accounting, Mallam Sanusi Lamido Sanusi College of Business and
Management Studies Igbinedion University, Okada. 2Dean, Mallam Sanusi Lamido Sanusi College of Business and Management Studies
3 Staff Manager, Atu, Omimi-Ejoor Osaretin Co; (Chartered Accountants) and M.Sc Student
Igbinedion University, Okada 4 Audit Manager, Atu, Omimi-Ejoor Osaretin Co; (Chartered Accountants) and M.Sc Student
Igbinedion University, Okada
ABSTRACT
The broad objective of the study is to examine the Factor affecting audit expectations gap in
Nigeria. The specific objectives are to examine the effect of Auditor effort, Auditor skills,
public knowledge public expectation, Auditor independence and Audit scope on Audit
expectations gap. The survey research design was used in this study. Primary data retrieved
using well-structured research instrument was used for the study. A sample of 613
respondents was selected for the study using the simple random sampling technique. The
respondents comprises of auditors and users of audit reports. The Data collected from the
primary sources were analysed using ordered logistic regressionand both descriptive
statistics. In order to examine the relationship and test the study hypothesis, the ordered logit
regression is used. Ordered logit models require that the outcome falls in one and only one
category of a set of contiguous integers and this is the nature of the dependent variable for
this study. Our findings reveals that Auditor Effort is negative though not significant, Auditor
skills is negative and significant, public knowledge is negative and significant, public
expectation is negative and significant, Auditor Independence is negative and significant and
Audit scope is negative though not significant. The conclusion is that there is the need for
concerted efforts from all stakeholders in addressing the challenge of audit expectations gap
in Nigeria.
Key Words: Audit Independence, Public expectation, Audit expectation
1. INTRODUCTION
Historically, the public has relied upon audited financial statements when making financial
decisions for investments. They have leaned on the auditing profession to confirm the
accuracy and completeness of this financial information in order to make informed decisions.
The main objective of financial reporting is to provide financial information to current and
potential investors, creditors, and stakeholders. This information is intended to assist them in
making well-reasoned investment, credit, and financial decisions as well as accurately report
the economic resources and obligations of a company. As a result, auditors are perceived as
the “gatekeepers” in protection of the investing public.However, the misunderstanding
between the auditor’s perception of corporate financial reporting and what the public expects
such perception to be has been a recurring issue in the auditing literature and has often been
referred to as the expectation gap. Researchers (Porter 1993; Humphrey, 1997; Gray and
Manson 2000) have referred to the differences between the auditor’s perception of what
functions the audit role should play in the financial reporting process and the public’s perception
as the “audit expectation gap. Jedidi and Chrystelle (2009) reports that the basis for the
research on audit expectation gap in different part of the world can be found in the early
111
works of Lee, Beck,and Liggio (1974) who investigated the role and responsibilities of
auditors as perceived by users of audited financial statements. Over time, the financial crisis
and number of collapse resulted in the new wave of questions addressing the role and
responsibilities of auditors, especially to the stakeholders of the company. Auditors have been
criticized heavily on disclaiming responsibility for the detection of fraud (Humphrey,
Turley&Moizer, 1993)
The direction of most studies in evaluating the existence of expectations gap has focused on
the role of the external auditor. The reason for this is not far-fetched as auditors are expected
to ensure that financial reporting done by management is a true and fair representation of the
actual statement of affairs within the corporate entity. The argument has always been whether
there are justifications for an expectations gap to exist with regards to financial reporting and
then where should the expectations gap be situated. The objective of auditing and the role of
auditors have always been a dynamic rather than static one and this is because they are highly
influenced by contextual factors. Therefore, any major changes in these contextual factors are
likely to causea change in the audit function and the role of auditors. As a result, their role is
seen to be evolving at all times.
Studies on audit expectation gap have been conducted in several countries because of its
importance. For example, researchers (Porter and Gowthorpe, 2004), in the United Kingdom,
United States and Canada have done extensive works in the area of audit expectations gap in
Malaysia Fadzly and Ahmad (2004), in Nigeria Atu, Atu and Adeghe, Atu and Okoye in
China, for example, Lin and Chen (2004), In Thailand, Lee, (2010). However, an observation
from the findings of most studies is that the factors responsible for the persistence of the audit
expectations gap appeared to be different depending on the environmental context of the
research. Thus this study, we raise the argument that Auditor effort, Auditor skills, public
knowledge public expectation, Auditor independence and Audit scope have significant
relationship with the audit expectations gap.
1.2. Research Objectives
The research Objectives are to examine the effect of Auditor effort, Auditor skills, public
knowledge public expectation, Auditor independence and Audit scope on Audit expectations
gap.
2. LITERATURE REVIEW AND HYPOTHESES
2.1. Audit Expectation Gap
The term,”Expectation Gap”, came into existence in the accounting profession in the mid
1970 and it is defined by Liggio (1974) as the difference between the levels of expected
performance as perceived by both users of financial statements and the auditor. It can also be
defined as the difference in beliefs between auditors and the public about the duties and
responsibilities assumed by auditors and the message conveyed by the audit reports (Monroe
& Woodliff, 1994). While Jennings, Reckers, and Kneer (1993), in their opinion, defined
audit expectation gap as the difference between what the public expects from the auditing
profession and what the profession provides. The audit expectation gap refers to the
difference between what the public and other financial statement. Users perceive auditors’
responsibilities to be and what auditors believe their responsibilities entails (McEnroe &
Martens, 2001).
112
Adeyemi & Udiale (2011) sees audit expectation gap as a situation whereby there is the
difference in expectation between a group with a certain expertise and another group, which
relies on that expertise. Expectation gap comes about when the public at large fixed their
minds on what they expect from the auditors and what the auditor eventually does.
Ojo (2006) defined audit expectation gap as the difference between what users of financial
statements, the general public, perceive an audit to be and what auditors claims is expected of
them in conducting an audit. In this respect, it is important to distinguish between the audit
profession's expectations of an audit on the one hand, and the auditor's perception of the audit
on the another hand.
Audit expectation Gap can also be seen as what the users of Auditors knowledge believe
upon, without looking beyond the Auditor’s works as it relates to professional
pronouncement and or current or changes in the Accounting and Auditing profession.
According to Wyse (2004) expectation gap as perceived by the public involves three main
ideals, namely: reporting gap which exists between the accounting profession, and the public
view which involves what the auditors actually report and what the public wants them to
report. This responsibility lies in the hands of the regulatory bodies to resolve. Performance
gaps between a society’s expectation of auditors and auditors’ performance as perceived by
the society. The gap has two main elements: a gap between what society expects auditors to
achieve and what they can reasonably be expected to accomplish (designated the
reasonableness gap), and a gap between what society can reasonably expect auditors to
accomplish and what they are perceived to achieve which is designated as the performance
gap (Salehi, Mansoury & Azary, 2009).
2.2. Factor Affecting Audit Expectations Gap
2.2.1 Efforts and Expectation Gap
Theoretically, it is expected that that higher audit effort increases the likelihood of detected
errors and reduces the likelihood of undetected errors (Hillegeist 1999) which may help to
reduce expectations gap. Despite its importance for audit research, few empirical studies have
explicitly tested this theoretical prediction. Shibano (1990) develops a model that relates
audit quality to the likelihood of misstatements. His model demonstrates that the auditor can
decrease the probability of undetected misstatements through higher audit effort. The models
in Dye (1993) and Hillegeist (1999) predict that hard-working auditors are more likely to
detect earnings management and thus reduce the audit expectations gap.
Hian (2000) in Singapore studied audit expectation gap regarding a company's audit
objectives. The study’s objective was to examine if an audit expectation gap existed between
auditors and non-auditors in Singapore with respect to the objectives of a company’s audit.
He concluded that an audit expectation gap with respect to company audit objectives existed
between auditors and non-auditors. This was because the non-auditors placed a greater
demand on audits than what auditors themselves perceived as their roles and responsibilities.
Another related study in Singapore done by Martins, Kim & Amy (2000), examined the
extent to which auditor effort contributes to the existence of audit expectations gap and
perception and the extent of the gap with regard to expectations and perceptions about duties
and responsibilities of auditors, fraud prevention and detection. The extent of the audit
expectation gap was measured by comparing non-auditors' expectations and perceptions

113
regarding the role, objectives, and limitations of an audit with auditors' responses reflecting
audit reality as prescribed in the standards. The study showed that auditor effort, perceptions
about duties and responsibilities of auditors contributes to the extent of audit expectations
gap.
Dixon, Woodhead & Sohliman (2006) in Egypt investigated the expectation gap between
auditors and financial statements’ users. The data for the study were collected through
questionnaires, and the study participants were auditors, bankers and investors (general
public, financial analysts, and brokers). 100 questionnaires were distributed to each group,
and the overall response rate was 37%. The Mann- Whitney U-test was also applied. The
result of the study showed that there was a wider expectation gap on the issue of the auditor’s
effort and auditor's responsibility.
Consequently, the study hypothesizes that;
H1: There is no significant relationship between auditor effort and audit expectations gap.
2.2.2. Auditors Skills and Expectation Gap
Audit is playing an important role in developing and enhancing the global economy and
business firms. Auditors express an opinion on the fairness of financial statements. This is
important for the users of financial statements to gain assurance that the data are being
reported, properly measured, and fairly presented. Auditors must raise their skills in order to
increase the probability to rely more on the auditor's report and audited financial statements
which are more relevant, unbiased and accurate for the decision makers.
Adeyemi and Uadiale (2011) investigate the respondents’ perceptions of the existence of the
audit expectation gap in Nigeria. The study was limited to respondents of Lagos State,
Nigeria. A sample of 200 was used, and the hypotheses were tested using analysis of variance
(ANOVA). Analyses were carried out with the aid of the Statistical Package for Social
Sciences, (SPSS Version 15.0). The study revealed that that there were significant differences
in the perceptions of respondent groups of the existence of audit expectation gaps in Nigeria,
that there was a significant difference in the perception of respondent groups on whether the
auditor skills affects the audit expectations gap.
Consequently, the study hypothesizes that;
H2: There is no significant relationship between auditor skills and audit expectations gap.
2.2.3. Public Expectation and Expectation Gap
Humphrey, Moizer and Turley (1993) conducted a survey in the UK to investigate the
opinions of auditors, auditees and financial statement users about auditors and their work.
Like the earlier studies, Humphrey et al.’s survey found that the opinions of the auditor group
differed markedly from those of the financial directors and financial statement users. The
largest difference related to the assertion. Too much is expected of auditors by the investing
community” (Humphrey et al. 1993). Eighty two percent of the accountants and 73 per cent
of the auditors agreed with the assertion, the financial directors were almost equally divided
in their opinion but an average of 67 per cent of the financial statement users (investment
analysts, bankers and financial journalists) disagreed with it. Significant differences were also
evident in respect of the assertions: “
114
Lin and Chen (2004) investigated the audit expectation gap in China by means of a survey of
auditors and audit beneficiaries (investors, Account Payable, government officials, business
management and academics). They found that the auditors and audit beneficiaries agreed that
there is a need to increase auditors’ independence. However, the groups’ opinions differed in
respect of the objectives of a financial statement audit, auditors’ responsibility to detect fraud,
third-party liability of auditors. While the auditors strongly agreed that the objective of a
financial statement audit is to ensure the auditee’s financial statements are presented in a true
and fair manner, the audit beneficiaries indicated that they expect the objectives of an audit to
include detecting and reporting fraud, other corporate irregularities and management
inefficiencies. The audit beneficiaries also expressed the view that auditors should be liable
for third party losses caused by their negligence or failure to perform their responsibilities
properly. Perhaps not surprisingly, the auditors disagreed with this proposition.
Haniffa and Hudaih (2007) investigated the possible existence of an audit expectation gap in
Saudi Arabia. Using a questionnaire, they ascertained the opinions of 174 auditors and
members of various audit interest groups about the standard of auditors’ performance of their
duties that are (i) required by Saudi law and (ii) not legally prescribed but, nevertheless, are
expected of auditors. The survey participants were also asked whether they thought that
auditors’ performance is affected by environmental factors such as auditors’ licensing policy
and recruitment process, the political and legal structure, and societal values. The study found
significant differences of opinion between the auditors and the interest groups about auditors’
performance of their duties.
Consequently, the study hypothesizes that;
H3: There is no significant relationship between Public Expectation and audit expectations
gap.
2.2.4 Public Knowledge and Expectation Gap
Sikka, Puxty, Wilmot and Cooper (1998) in Salehi (2006) suggested that there are two
reasons for audit expectation gap. Firstly, it has resulted from the “clash between auditors and
the public over the preferred meanings of the nature, practice and/or outcomes of auditing
and secondly, it is due to the contradiction between minimal government regulation of the
profession and the profession’s right to self-regulation. (Haniffa and Hudaid, 2007), while
studying in Saudi Arabia, asserted that the causes of audit expectation in relation to auditors’
role and responsibilities are due to a deficiency in the standards; a gap may also emerge when
society expects auditors to perform duties beyond those prescribed but which can be
reasonably expected of them; an audit expectation gap may also arise due to factors in the
environment such as the licensing policy, recruitment process, political and legal structure,
and dominant societal values.
Best, Buckby and Tan, (2001) attributed the cause of the gap to the fact that users have high
expectations of the auditor's responsibility about fraud. Consequently, when a company faced
problems as a result of undiscovered illegal acts either perpetrated by management, other
insiders or third parties, the external auditor is blamed.
Lee, Ali & Gloeck (2009) suggested that the causes of an audit expectation gap in Malaysia
was as a result of unreasonable expectations which was a combination of factors such as
users’ misunderstanding and being unaware of the duties and responsibilities of auditors, the
115
misinterpretation of the objective of an audit and exaggerated expectations on the part of
users of auditors performance. Bogdanoviciute (2011) went further to explain that the gap is
related to issues such as responsibilities, independence, third party liability of the auditor,
reliance on the audit report by users, and the meaning of the audit report as perceived by
users.
Consequently, the study hypothesizes that;
H4: There is no significant relationship between Public knowledge and audit expectations
gap.
2.2.5. Auditor’s Independence and Expectation Gap
Auditor’s Independence has been defined as the conditional probability of reporting a
discovered breach .The International Federation of Accountants (IFAC) differentiates
between independence of mind and independence in appearance. It defines independence of
mind as the state of mind that permits the provision of an opinion without being affected by
influences that compromise professional judgment allowing an individual to act with
integrity, exercise objectivity and professional skepticism. According to (IFAC 2001),
independence in appearance is defined as the avoidance of facts and circumstances that are so
significant that a reasonable and informed third party, having knowledge of all relevant
information would reasonably conclude that a firm’s or a member of the assurance team’s
integrity, objectivity or professional skepticism had been compromised. Knapp (1985) opines
that auditor’s independence is the ability to withstand client pressure while Magill and
Previtts (1991), concluded that independence is a function of character with integrity and
trustworthiness being the key. Furthermore, the Independence Standard Board (2000) defines
auditor’s independence as the freedom from those pressures and other factors that
compromise, or can reasonably be expected to compromise an auditor’s ability to make
unbiased decisions.
Carey and Doherty (2006), sees auditor’s independence in three ways: firstly in the sense of
not being subordinate, secondly in the sense of avoidance of any situation which may even
subconsciously impair the auditor’s objectivity and lastly in the sense of avoidance of any
relationship which to a reasonable observer may suggest a conflict of interest. Other words
that have been used to describe auditor’s independence include “completely objective”,
“unprejudiced by previous involvement in the subject of audit”, “uncompromised by vested
interest in the outcome or its consequences” and “unbiased and uninfluenced by
considerations extraneous to the matter at issue”
Lin & Chen (2004), on the other hand, claimed that audit expectation gap is associated with
the independence of auditor which has significant implications for the development of
accounting standards and practices.
Consequently, the study hypothesizes that;
H5: There is no significant relationship between auditor’s independence and audit
expectations gap.
2.2.6. Audit scope and Expectation Gap
The audit scope can be defined as the processes and procedures undertaken in the audit that
help define the actual parameters and boundaries for the activities. The scope or "boundaries"

116
of the audit are initially defined at a high level and then become progressively clearer as the
focus of what is being examined is ultimately identified. Scope can be a major factor on the
duration, cost, and overall complexities of the audit. Theory predicts that higher audit scope
increases the likelihood of detected errors Hillegeist 1999 implying a negative relation
between audit scope and subsequent financial statement errors. Despite its importance for
audit research, few empirical studies have explicitly tested this theoretical prediction.
Coulton, Ruddock & Taylor (2007) Using aninitial sample consisting of Australian Stock
Exchange (ASX) listed firms from 1993 through 2000 sought to investigate whether auditor
independence is compromised by extending the auditors scope. Using the unexpected accrual
component of earnings as a proxy for the effect of impaired auditor independence, the authors
initially found that client firms with more audit scope display some evidence of aggressive
accounting. However, when possible endogenous nature of unexpected accruals and is
allowed for, this result no longer holds. The study thus suggests that that more audit scope by
creating tendencies for aggressive accounting could actually results in audit expectations gap.
Chen, Liu, Su & Wu (2009) argued that an increased economic bonding may develop
between an audit partner and the clients resulting from the pecuniary benefits following
increasing audit scope and this may also result in an audit expectations gap.
Consequently, the study hypothesizes that;
H6: There is no significant relationship between audit scope and audit expectations gap.
3. METHODOLOGY AND MODEL SPECIFICATION
The survey research design was used in this study. Primary data retrieved using well-
structured research instrument was used for the study. A sample of 613 respondents was
selected for the study using the simple random sampling technique. The respondents
comprises of auditors and users of audit reports. The Data collected from the primary sources
were analysed using the linear regression analysis and both descriptive and inferential
statistics. The data gathered was also analysed using ordered logistic regression. In order to
examine the relationship and test the study hypothesis, the ordered log it regression was used.
The ordered logit regression is a generalization of the popular logit analysis to the case of
more than two outcomes of an ordinal dependent variable. Ordered logit models require that
the outcome falls in one and only one category of a set of contiguous integers and this is the
nature of the dependent variable for this study. However, some preliminary analysis was first
conducted the results was presented. In investigating the factor affecting audit expectations
gap, the study adapted the model of Kamau (2013). The model for this study is presented
below;
AEG = β0 + β1 AUDITOR EFFORT + β2 AUDITOR SKILLS + β3 AUDITOR
INDEPENDENCE + β4 AUDIT SCOPE + β5 PUBLIC KNOWLEDGE + β6 PUBLIC
EXPECTATION + u
Measurement of Variables
Table 1:.Measurement of variables
Terms Measurement Apriori
Sign
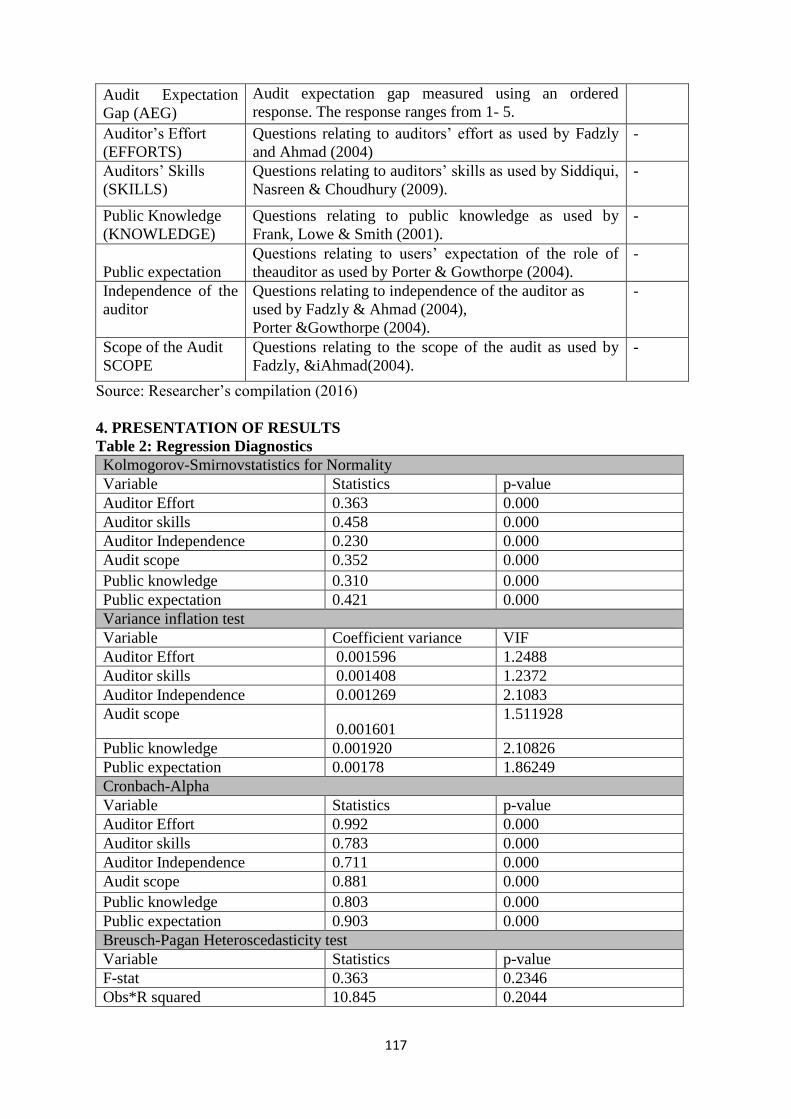
117
Audit Expectation
Gap (AEG)
Audit expectation gap measured using an ordered
response. The response ranges from 1- 5.
Auditor’s Effort
(EFFORTS)
Questions relating to auditors’ effort as used by Fadzly
and Ahmad (2004)
-
Auditors’ Skills
(SKILLS)
Questions relating to auditors’ skills as used by Siddiqui,
Nasreen & Choudhury (2009).
-
Public Knowledge
(KNOWLEDGE)
Questions relating to public knowledge as used by
Frank, Lowe & Smith (2001).
-
Public expectation
Questions relating to users’ expectation of the role of
theauditor as used by Porter & Gowthorpe (2004).
-
Independence of the
auditor
Questions relating to independence of the auditor as
used by Fadzly & Ahmad (2004),
Porter &Gowthorpe (2004).
-
Scope of the Audit
SCOPE
Questions relating to the scope of the audit as used by
Fadzly, &iAhmad(2004).
-
Source: Researcher’s compilation (2016)
4. PRESENTATION OF RESULTS
Table 2: Regression Diagnostics
Kolmogorov-Smirnovstatistics for Normality
Variable Statistics p-value
Auditor Effort 0.363 0.000
Auditor skills 0.458 0.000
Auditor Independence 0.230 0.000
Audit scope 0.352 0.000
Public knowledge 0.310 0.000
Public expectation 0.421 0.000
Variance inflation test
Variable Coefficient variance VIF
Auditor Effort 0.001596 1.2488
Auditor skills 0.001408 1.2372
Auditor Independence 0.001269 2.1083
Audit scope 0.001601
1.511928
Public knowledge 0.001920 2.10826
Public expectation 0.00178 1.86249
Cronbach-Alpha
Variable Statistics p-value
Auditor Effort 0.992 0.000
Auditor skills 0.783 0.000
Auditor Independence 0.711 0.000
Audit scope 0.881 0.000
Public knowledge 0.803 0.000
Public expectation 0.903 0.000
Breusch-Pagan Heteroscedasticity test
Variable Statistics p-value
F-stat 0.363 0.2346
Obs*R squared 10.845 0.2044
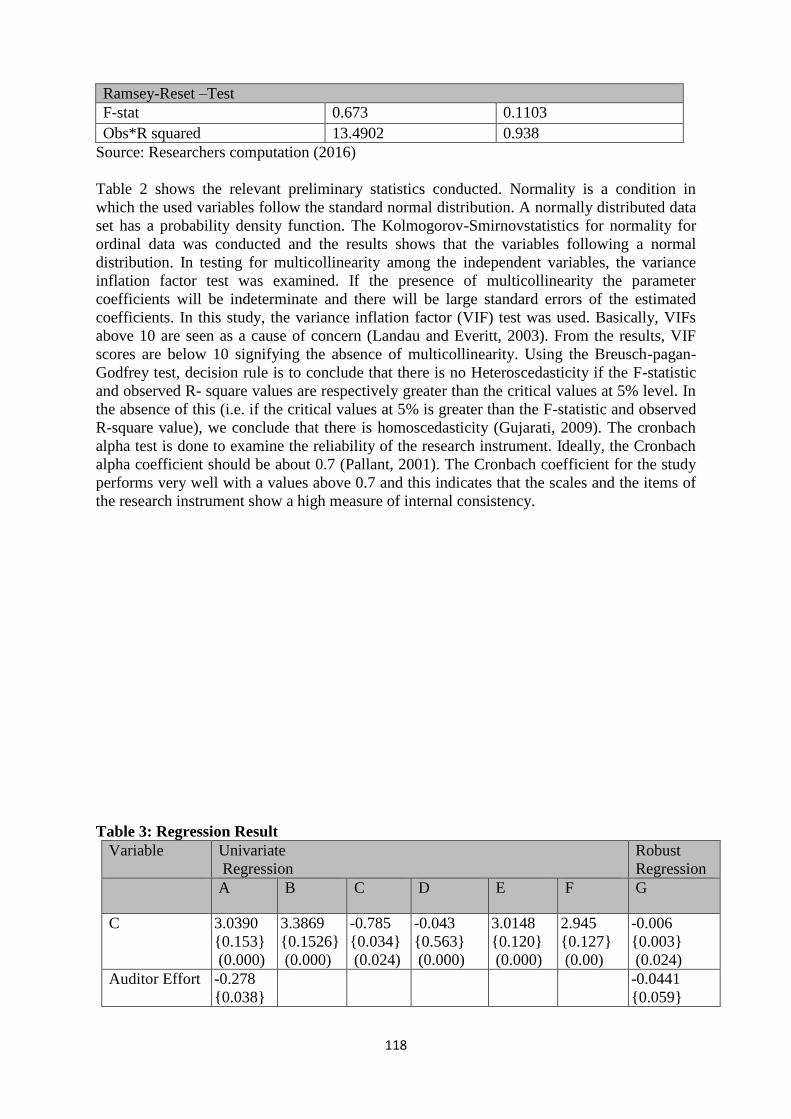
118
Ramsey-Reset –Test
F-stat 0.673 0.1103
Obs*R squared 13.4902 0.938
Source: Researchers computation (2016)
Table 2 shows the relevant preliminary statistics conducted. Normality is a condition in
which the used variables follow the standard normal distribution. A normally distributed data
set has a probability density function. The Kolmogorov-Smirnovstatistics for normality for
ordinal data was conducted and the results shows that the variables following a normal
distribution. In testing for multicollinearity among the independent variables, the variance
inflation factor test was examined. If the presence of multicollinearity the parameter
coefficients will be indeterminate and there will be large standard errors of the estimated
coefficients. In this study, the variance inflation factor (VIF) test was used. Basically, VIFs
above 10 are seen as a cause of concern (Landau and Everitt, 2003). From the results, VIF
scores are below 10 signifying the absence of multicollinearity. Using the Breusch-pagan-
Godfrey test, decision rule is to conclude that there is no Heteroscedasticity if the F-statistic
and observed R- square values are respectively greater than the critical values at 5% level. In
the absence of this (i.e. if the critical values at 5% is greater than the F-statistic and observed
R-square value), we conclude that there is homoscedasticity (Gujarati, 2009). The cronbach
alpha test is done to examine the reliability of the research instrument. Ideally, the Cronbach
alpha coefficient should be about 0.7 (Pallant, 2001). The Cronbach coefficient for the study
performs very well with a values above 0.7 and this indicates that the scales and the items of
the research instrument show a high measure of internal consistency.
Table 3: Regression Result
Variable Univariate
Regression
Robust
Regression
A B C D E F G
C 3.0390
{0.153}
(0.000)
3.3869
{0.1526}
(0.000)
-0.785
{0.034}
(0.024)
-0.043
{0.563}
(0.000)
3.0148
{0.120}
(0.000)
2.945
{0.127}
(0.00)
-0.006
{0.003}
(0.024)
Auditor Effort -0.278
{0.038}
-0.0441
{0.059}
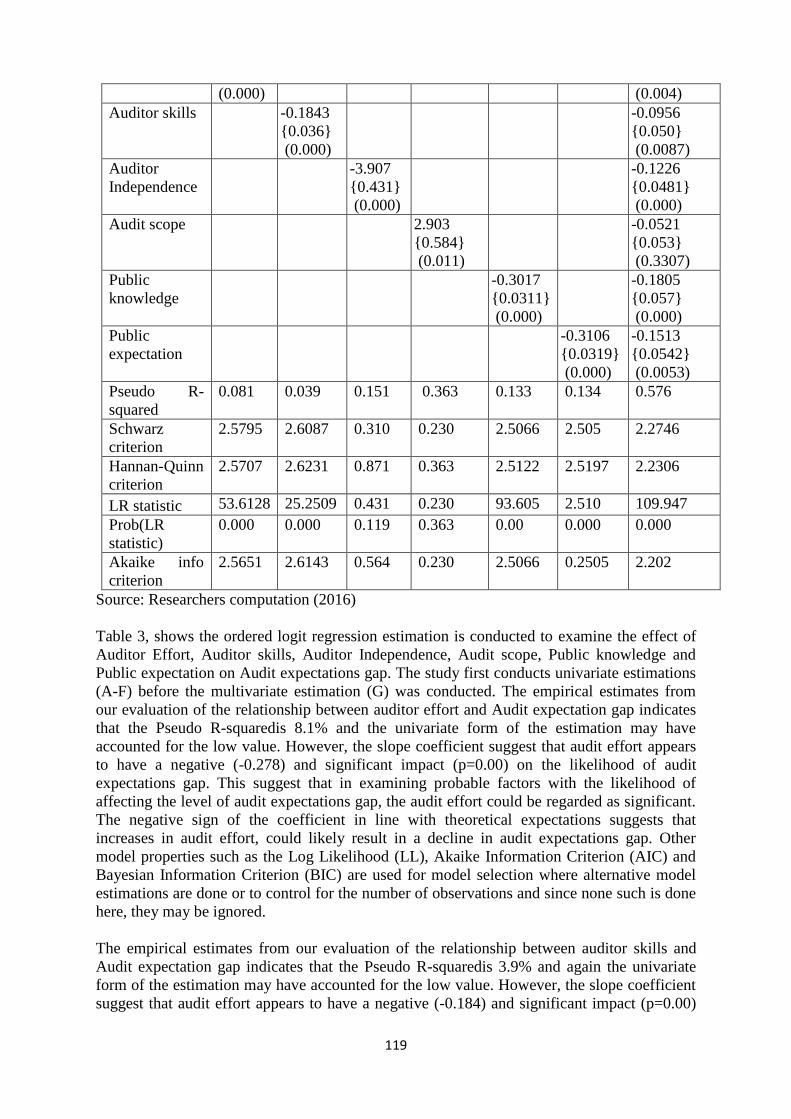
119
(0.000) (0.004)
Auditor skills -0.1843
{0.036}
(0.000)
-0.0956
{0.050}
(0.0087)
Auditor
Independence
-3.907
{0.431}
(0.000)
-0.1226
{0.0481}
(0.000)
Audit scope 2.903
{0.584}
(0.011)
-0.0521
{0.053}
(0.3307)
Public
knowledge
-0.3017
{0.0311}
(0.000)
-0.1805
{0.057}
(0.000)
Public
expectation
-0.3106
{0.0319}
(0.000)
-0.1513
{0.0542}
(0.0053)
Pseudo R-
squared
0.081 0.039 0.151 0.363 0.133 0.134 0.576
Schwarz
criterion
2.5795 2.6087 0.310 0.230 2.5066 2.505 2.2746
Hannan-Quinn
criterion
2.5707 2.6231 0.871 0.363 2.5122 2.5197 2.2306
LR statistic 53.6128 25.2509 0.431 0.230 93.605 2.510 109.947
Prob(LR
statistic)
0.000 0.000 0.119 0.363 0.00 0.000 0.000
Akaike info
criterion
2.5651 2.6143 0.564 0.230 2.5066 0.2505 2.202
Source: Researchers computation (2016)
Table 3, shows the ordered logit regression estimation is conducted to examine the effect of
Auditor Effort, Auditor skills, Auditor Independence, Audit scope, Public knowledge and
Public expectation on Audit expectations gap. The study first conducts univariate estimations
(A-F) before the multivariate estimation (G) was conducted. The empirical estimates from
our evaluation of the relationship between auditor effort and Audit expectation gap indicates
that the Pseudo R-squaredis 8.1% and the univariate form of the estimation may have
accounted for the low value. However, the slope coefficient suggest that audit effort appears
to have a negative (-0.278) and significant impact (p=0.00) on the likelihood of audit
expectations gap. This suggest that in examining probable factors with the likelihood of
affecting the level of audit expectations gap, the audit effort could be regarded as significant.
The negative sign of the coefficient in line with theoretical expectations suggests that
increases in audit effort, could likely result in a decline in audit expectations gap. Other
model properties such as the Log Likelihood (LL), Akaike Information Criterion (AIC) and
Bayesian Information Criterion (BIC) are used for model selection where alternative model
estimations are done or to control for the number of observations and since none such is done
here, they may be ignored.
The empirical estimates from our evaluation of the relationship between auditor skills and
Audit expectation gap indicates that the Pseudo R-squaredis 3.9% and again the univariate
form of the estimation may have accounted for the low value. However, the slope coefficient
suggest that audit effort appears to have a negative (-0.184) and significant impact (p=0.00)
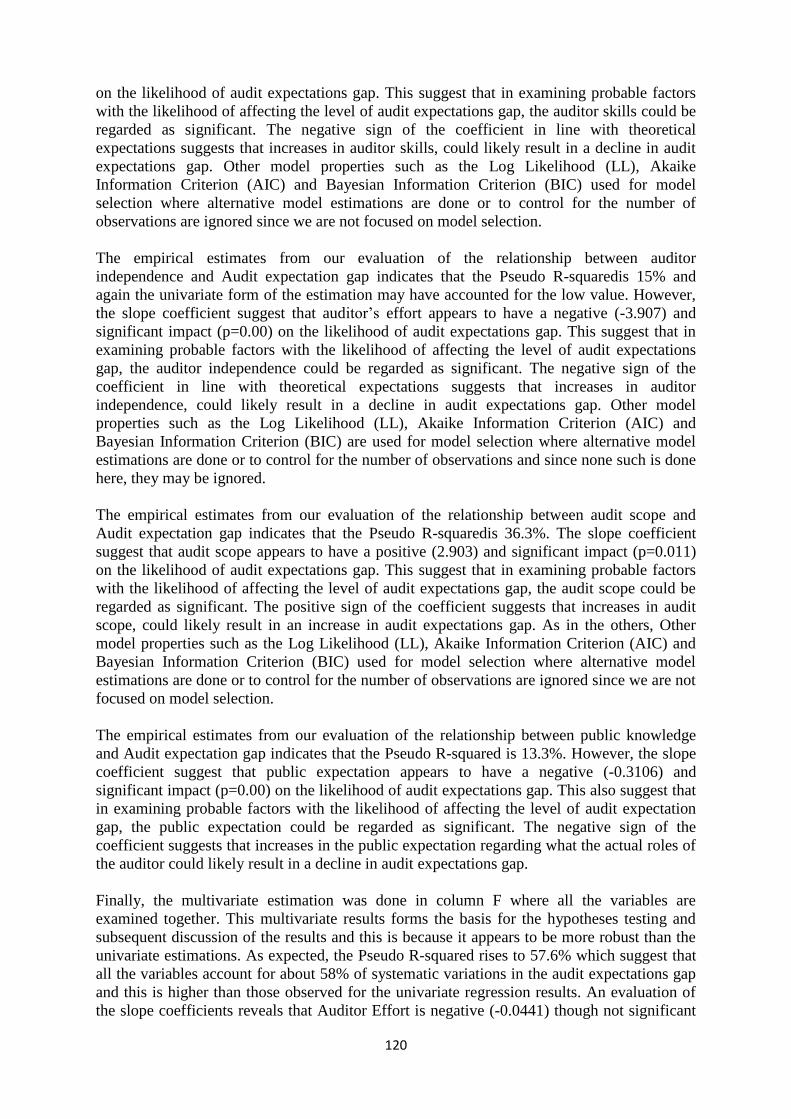
120
on the likelihood of audit expectations gap. This suggest that in examining probable factors
with the likelihood of affecting the level of audit expectations gap, the auditor skills could be
regarded as significant. The negative sign of the coefficient in line with theoretical
expectations suggests that increases in auditor skills, could likely result in a decline in audit
expectations gap. Other model properties such as the Log Likelihood (LL), Akaike
Information Criterion (AIC) and Bayesian Information Criterion (BIC) used for model
selection where alternative model estimations are done or to control for the number of
observations are ignored since we are not focused on model selection.
The empirical estimates from our evaluation of the relationship between auditor
independence and Audit expectation gap indicates that the Pseudo R-squaredis 15% and
again the univariate form of the estimation may have accounted for the low value. However,
the slope coefficient suggest that auditor’s effort appears to have a negative (-3.907) and
significant impact (p=0.00) on the likelihood of audit expectations gap. This suggest that in
examining probable factors with the likelihood of affecting the level of audit expectations
gap, the auditor independence could be regarded as significant. The negative sign of the
coefficient in line with theoretical expectations suggests that increases in auditor
independence, could likely result in a decline in audit expectations gap. Other model
properties such as the Log Likelihood (LL), Akaike Information Criterion (AIC) and
Bayesian Information Criterion (BIC) are used for model selection where alternative model
estimations are done or to control for the number of observations and since none such is done
here, they may be ignored.
The empirical estimates from our evaluation of the relationship between audit scope and
Audit expectation gap indicates that the Pseudo R-squaredis 36.3%. The slope coefficient
suggest that audit scope appears to have a positive (2.903) and significant impact (p=0.011)
on the likelihood of audit expectations gap. This suggest that in examining probable factors
with the likelihood of affecting the level of audit expectations gap, the audit scope could be
regarded as significant. The positive sign of the coefficient suggests that increases in audit
scope, could likely result in an increase in audit expectations gap. As in the others, Other
model properties such as the Log Likelihood (LL), Akaike Information Criterion (AIC) and
Bayesian Information Criterion (BIC) used for model selection where alternative model
estimations are done or to control for the number of observations are ignored since we are not
focused on model selection.
The empirical estimates from our evaluation of the relationship between public knowledge
and Audit expectation gap indicates that the Pseudo R-squared is 13.3%. However, the slope
coefficient suggest that public expectation appears to have a negative (-0.3106) and
significant impact (p=0.00) on the likelihood of audit expectations gap. This also suggest that
in examining probable factors with the likelihood of affecting the level of audit expectation
gap, the public expectation could be regarded as significant. The negative sign of the
coefficient suggests that increases in the public expectation regarding what the actual roles of
the auditor could likely result in a decline in audit expectations gap.
Finally, the multivariate estimation was done in column F where all the variables are
examined together. This multivariate results forms the basis for the hypotheses testing and
subsequent discussion of the results and this is because it appears to be more robust than the
univariate estimations. As expected, the Pseudo R-squared rises to 57.6% which suggest that
all the variables account for about 58% of systematic variations in the audit expectations gap
and this is higher than those observed for the univariate regression results. An evaluation of
the slope coefficients reveals that Auditor Effort is negative (-0.0441) though not significant
121
(0.004) and thus we fail to accept the hypothesis (H1) of no significant relationship between
Auditor effort and Audit expectations gap. Auditor skills is negative (-0.0956) and significant
(0.008) and thus we fail to accept the hypothesis (H2) of no significant relationship between
Auditor skills and Audit expectations gap. Public knowledge is negative (-0.1805) and
significant (0.000) and thus we fail to accept the hypothesis (H3) of no significant
relationship between public knowledge and Audit expectations gap. Public expectation is
negative (-0.1513) and significant (0.000) and thus we fail to accept the hypothesis (H4) of
no significant relationship between public expectation and Audit expectations gap.Auditor
Independence is negative (0.1226) and significant (0.000) and thus we fail to accept the
hypothesis (H5) of no significant relationship between Auditor independence and Audit
expectations gap. Furthermore, Audit scope is negative (-0.0521) though not significant
(0.3309) and thus we fail to reject the hypothesis (H6) of no significant relationship between
Audit scope and Audit expectations gap.
5. CONCLUSION
The role of external audit is crucial in today’s corporate world. This is due to the separation
of ownership from management as a result of numerous shareholders in companies. The
external auditors’ are usually perceived as independent and unbiased, thus, users of financial
statements rely on these audit reports for decision making. In essence, the auditors’ role is
carried out to add credibility to financial statements released after the end of a company’s
financial year.One major criticism by users of financial statements was that the auditors were
unable to detect and report frauds. Even though auditors insist that their roles are not
primarily fraud detection, somehow users of financial information expect the auditors
verification function over the financial reports to assure society that management’s prepared
financial statements is free of fraud and is of a high quality. This misunderstanding between
the auditors’ perception of financial reporting and what the public expects such perception to
be has been a recurring issue in the auditing literature and has often been referred to as the
audit expectation gap.In this study, we raise the argument that Personal interest of auditors,
standards deficiency, auditors independence and societal expectations about auditors roles
and auditor independence To assess our arguments, we utilize ordinal regression analysis.
Our findings reveals that Auditor Effort is negative though not significant, Auditor skills is
negative and significant, Public knowledge is negative and significant, Public expectation is
negative and significant, Auditor Independence is negative and significant and Audit scope is
negative though not significant. The major recommendation is for the regulatory bodies of the
accounting and auditing practice in Nigeria to set up appropriate regulatory frameworks and
guidelines as it is experienced in some developed countries like US and UK. Such issues of
auditor independence should be protected by the relevant regulatory bodies.
References
1. Adams, C.A. & Evans, R. (2004). Accountability, completeness, credibility and the
audit expectations gap. Journal of Completeness and Credibility, 14, 97-115.
2. Adeyemi S.B &Uadiale, O.M. (2011). An empirical investigation of the audit
expectation gap in Nigeria. African Journal of Business Management (5)19, 7964-
7971.
3. Agbonifoh, B.A. &Yomere, G.O. (1999). Research methodology in the social science
and education Center piece consultants Benin City Nig. Ltd.
4. Ajibolade, S. O. (2008). A Survey of the perception of ethical behaviour of future
Nigerian accounting professionals. The Nigerian Accountant, 41(3), 54-59.
5. Anderson, L.R. & Anger, J.W. (1978) Analysis of Variance in Small Group Research.
Personality and Social Psychology Bulletin, 4.
122
6. Atu, O.O.K and Atu E.R. (2010) Auditing the Journey So Far and Its Expectation in
Nigeria. The Official Journal the Institute of Chartered Accountants of Nigeria
(ICAN) (43)
7. Atu, O.O.K, Adeghe R. and Abusomwan E.R (2015) Empirical Study of Users View
in Relation to Audit and Its Expectation Gap. Department of Economic and
Management Studies, College of Social and Management Studies, Afe Babalola
University, Ado Ekiti-Nigeria promoting Finance of Micro, Small and Medium
Enterprises in Nigeria- Journal (Pg. 473-494)
8. Atu, O.O.K, Okoye, A.E. and Ekundayo, O.U () Determinants of Audit Expectation
Gap in Nigeria: An overview Accounting Frontier, The Official Journal of Nigerian
Accounting Association (NAA) V6(i) P 82-101.
9. Atu, Omimi-Ejoor Osaretin Kingsley (2016), Determinants of Audit Expectation Gap
in Nigeria: UP Published Ph.D Dissertation, Igbinedion University, Okada- Nigeria
10. Bailey, K.E., Bylinski, J.H.,& Shields, M.D. (1983).Effects of audit report wording
changes on the perceived message, Journal of Accounting Research, (21) Spring, 355-
370.
11. Beck, G.W. (1974).Public accountants in Australia –Their social role, Melbourne:
Australian Accounting Research Foundation
12. Best, P., Buckby, S., & Tan, C. (2001). Evidence of the audit expectation gap in
Singapore. Managerial Auditing Journal, 16(3), 134-144.
13. Bogdanoviciute, .V. (2011) An Empirical study of audit expectation gap: The Case of
Lithuania. Unpublished Master Thesis, Lithuania: University of Aarhus.
14. Boritz, J.E., Gabor, B.J. & Lemon, W.M. (1987).An experimental study of review of
preliminary audit strategies by external auditors, Canadian Academic Accounting
Association, Canada.
15. Cohen, J. (1988), Statistical power analysis for the behavioral sciences, Hillsdale, NJ,
Lawerence Erlbaum.
16. Dixon, R. &Woodhead, A.D., & Soliman, M. (2006). An investigation of the
expectation gap. Manage. Audit. J.,21(3), 293-302.
17. Dye, R. 1993. Auditing standards, legal liability, and auditor wealth. Journal of
Political Economy 101(5): 887-914.
18. Ellis, P., & Shelly, I., (1998). The quality of accruals and earnings: The Role of
Accrual Estimation Errors. The Accounting Review 77 (Supplement), 35-39
19. Fadzly, M.N. and Ahmad, Z. (2004). Audit Expectation Gap: The Case of Malaysia.
Managerial Auditing Journal, 19(7). p. 897-915.
20. Fazdly, M., & Ahmed, Z. (2004). Audit expectation gap: The case of Malaysia
Managerial Auditing Journal, 19(7), 897-915.
21. Frank, K.E., D.J. Lowe & J.K. Smith.(2001). The expectation gap: perceptual
differences between auditors, jurors and students. Managerial auditing Journal,
16(3), 145-149
22. Haniffa, R., &Hudaid, M. (2007). Locating audit expectations gap within a cultural
context: The case of Saudi Arabia. Journal of International Accounting, Auditing and
Taxation, 16, 179-206.
23. Hayes, R.S., Schilder, A., Dassen R., &Wallage, P. (1999). Principles of auditing: An
international perspective. London: McGraw-Hill Publishing Company
24. Hian, C.K. (2000). The audit expectation gap in Singapore: An empirical study of
company audit objectives. Asian Review of Accounting, (8)1 83-105.
25. Hillegeist, S. A. 1999. Financial Reporting and Auditing Under Alternative Damage
Appointment Rules. The Accounting Review 74(3): 347-369.
26. Humphrey, C. (1997). Debating audit expectations. Current issues in auditing,
London: Paul Chapman Publishing Ltd.

123
27. Humphrey, C.G, Moizer P.,& Turley, W.S. (1993). The audit expectation gap in
Britain: An empirical investigation. Account. Bus. Res., 23, 395- 411.
28. Jedidi, I. and Chrystelle R. (2009). The Social Construction of the Audit Expectation
Gap: The Market of Excuses. Author manuscript, Strasbourg: France .
29. Jennings, M.,Reckers, M.J., &Kneer, D.C.(1993). The significance of audit decision
aids and pre case jurists attitudes on perceptions of audit firm culpability and liability.
Contemp. Account. Res., 9,489-507.
30. Kamau, C.G. (2013). Determinants of audit expectation gap: Evidence from limited
companies in Kenya. International Journal of Science and Research(2)1, 480-491.
31. Kimutai, I. J (2012), The expectation gap in the statutory audits of quoted companies
in Kenya. Unpublished Master’s Thesis , Kenyatta University.
32. Koh, .H. C. & Woo, E.S. (1998).The expectation gap in auditing. Manage. Aud. J.,
13(3),147-154.
33. Lee, T., Palaniappan, A., (2006). Audit expectation gap: An empirical study in
Malaysia, paper presented in The Malaysian finance association’s 8th Annual
conference at University Malaysia Sabah, Kota Kinabalu.
34. Lee, T.A., (1970). The nature of auditing and its objectives, Accountancy, 81, 292-
296.
35. Lee, T.H., & Ali, A. Md. (2008a). The audit expectation gap: A review of
thecontributing factors. Journal of Modern Accounting and Auditing 4(8), 30-37.
36. Lee., T.H., Md Ali A., Gleock, J.D., Yap, C.S., Ng, Y.L., &Boonyanet W.,
(2009).The audit expectation gap in Thailand. South Afr. J. Account. Audit. Res.,
10,1-17
37. Liggio, C. (1974). The expectation gap: the accountant’s Waterloo. .J ContempBus.,3,
27-44.
38. Limperg, T, (1933).The social responsibility of the auditor reproduced in Limperg
Institute, (1985), Limperg Institute, the Netherlands.
39. Lin, Z. & Chen, J. (2004).Auditors responsibility and independence: Evidence from
China. Research in Accounting Regulation, (17).
40. Martinis De M., & Kim, E., &Amy A., (2000). An examination of the
auditexpectation gap in Singapore, Asian Review of Accounting, (8) 1 59-82.
41. McEnroe, J. E. &Martens, C. (2001). Auditors and investors’ perceptions of the
expectation gap. Accounting Horizons, 15 (4), 345 - 358.
42. Miranda, S.M Watson. R.T & Van Over, D (1990), Statistical Analysis of Group Data
Working Paper Athens, GA, University of Georgia.
43. Mohamed, S.,& Muhamad-Sori, Z., (2002). Audit expectation gap –The Malaysian
experience, Chartered Secretary Malaysia, January, 12-15.
44. Monroe, G. S. &Woodcliff, D. R. (1994). An empirical investigation on the audit
expectation gap: Australia Evidence. Accounting and Finance, 34 (1), 47 - 75.
45. Monroe, G.S., &Woodliff, D.R., (1993). The effect of education on the audit
expectation gap. Account. Finance, 33(5), 61-78.
46. Ojo, M. (2006).Eliminating the audit expectations gap: Myth or reality. Munich
personal RePeEc Archives. Retrieved on 2/7/2010 from http://mpra.ub.uni-
muenchen.de/232/mpra paper
47. Okafor, C.,& Otalor, .J. (2013) Narrowing the expectation gap in auditing: The role of
the auditing profession. Research Journal of Finance and Accounting, (4)2 43-52
48. Porter, B & C. Gowthorpe (2004). Audit expectation performance gap in the United
Kingdom in 1999 and Comparison with the Gap in New Zealand in 1989 and in1999;
The Institute of Chartered Accountants of Scotland Edinburgh
49. Porter., B. (1993). An empirical study of the audit expectation performance gap.
Account. Bus. Res., 24: 49-68.
124
50. Salehi, M., Mansoury, A. &Azary, Z. (2009). Audit independence and expectation
gap: Empirical evidences from Iran. International Journal of Economics and
Finance,1 (1), 165-174.
51. Shibano, T. 1990. Assessing Audit Risk from Errors and Irregularities. Journal of
Accounting Research 28(3): 110-140.
52. Sidani, Y.M. (2007).The audit expectations gap: evidence from Lebanon. Managerial
Auditing Journal, (22)3, 288-302.
53. Siddiqui, J. Nasreen, T & Choudhury-Lema, A. (2009).The audit expectations gap
and the role of audit education: the case of an emerging economy. Managerial
Auditing Journal, (24) 6, 564 – 583.
54. Sikka, P., Puxty, A., Wilmot, H. & Copper, C. (1998). The impossibility of
eliminating the expectation gap: Some theory and evidence. Critical Perspective on
Accounting, (9), 299-330.
55. Singleton D. (1998).Legal liability and the audit expectation gap. Singapore Account,
9, 25-28.
56. Steve, R. (1996). Financial reporting, problems and solution. USA: Goodway
publishers Limited.
57. Sweeney, B. (1997).Bridging the expectation –on shaky foundations, Accountancy
Ireland.18-19.
58. Swift, T. & Dando, N. (2002). From methods to ideologies: closing the assurance
expectations gap in social and ethical accounting, auditing and reporting. Journal of
Corporate Citizenship, 8, 81 – 90.
59. Tabachnick, G. Barbara & Fidell S. L (2007) Using Multivariate Statistics, (5th ed.),
New York, U.S.A., Pearson Education, Inc.
60. Usman, M.M. & Ogbada, E.L. (2010). A critical analysis of the true and fair view,
concept of the contemporary auditor in Nigeria corporate organization. The Nigeria
Accountant, 43 (1), 15-18.
61. Wyse., (2004). Auditing. Wyse Publication, Lagos- Nigeria
62. Zikmund, P. E. (2008). Reducing the expectation gap: Forensic audit Procedures. The
CPA Online Journal, available at,
http://www.nysscpa.org/cpajournal/2008/608/essential, accessed 22-11-2012.
125
EFFECTS OF WORKING CAPITAL MANAGEMENT ON CORPORATE
PROFITABILITY OF NIGERIAN PENSION FUND ADMINISTRATIONS
Osegbue, Ifeanyi Francis1, Nnoruem Timothy Onyekachukwu2, Nwoye Chizoba Mary3
1Accountancy department, Chukwuemeka Odumegwu Ojukwu University, Anambra, Nigeria 2Accountancy department, Chukwuemeka Odumegwu Ojukwu University, Anambra, Nigeria 3Accountancy department, Chukwuemeka Odumegwu Ojukwu University, Anambra, Nigeria
Abstract
The study investigates the effects of working capital management on corporate profitability of
Nigerian pension fund administrations. Unlike previous studies that was done on cement
firms; manufacturing firms; brewery firms food and beverages firms; pharmaceutical firms
and so on. The present study examines how working capital management and its interactions
with current ratio, quick ratio and total debt to total assets has impacted on corporate
profitability from 2012 to 2014. The study used a sample of 21 licensed pension fund
administrations in Nigeria. In analyzing the data, the study adopted panel multiple regression
to identify the possible effects of their working capital management on the corporate
profitability of licensed pension fund administrators while we interpreted fixed effect analysis
after using Hausman test. Preliminary analyses also conducted such as descriptive statistics
and correlation matrix. The result showed that working capital management had a significant
and positive influence on pension fund administrators’ corporate profitability. However,
when interacted with current ratio and quick ratio, it was revealed that working capital
management of pension fund administrators positively and significantly influences corporate
profitability at 10%. In the case of total debt to total assets interaction with corporate
profitability, the study also shows positive and significant impact on corporate profitability at
1%. The study therefore recommends that the pension fund administrators should continue to
utilize its working capital efficiently to increase profitability, pay its short-term and long-
term obligations while maintaining minimum risk with its assets.
Keywords: corporate profitability, working capital management, current ratio, quick ratio,
total debt to total assets
1. Introduction
Working capital management of corporate entities is most crucial in attaining optimal
liquidity position and in ensuring corporate going concern. It is one of the most important
decisions for companies when making a trade-off between liquidity and profitability, perhaps,
in a way that optimizes the amount and composition of their current assets and how they are
financed (Eljelly, 2004). The way a firm manages its working capital could significantly
affect its profitability (Deloof, 2003; Raheman and Nasr, 2007). Decisions relating to
working capital involve managing relationships between a firm’s short-term assets and
liabilities to ensure that a firm is able to continue its operations, and have sufficient cash
flows to satisfy both maturing short-term debts and upcoming operational expenses at
minimal costs, and consequently, increasing corporate profitability (Angahar and Agbo
2014).
Many studies have been done on the working capital management on corporate profitability
in Nigeria. For example Ajibolade and Sankay, 2013, Owolabi and Alu 2012, Ikpefan,
Ailemen and Owolabi 2014 on manufacturing firms; Angahar and Agbo, 2014 on cement
126
industry; Ani, Okwo and Ugwunta 2015 on brewery firms; Olufemi and Olubanjo 2009 on
selected quoted companies; Ojeani 2010 on pharmaceutical firms, Osundina 2014 on food
and beverages firms. While some like Zahra and Azam, (2012) studied Iran companies;
Abbasali and Milad (2012) studied Tehran companies; Kulkanya 2012 studied Thai
companies. However, most of these prior studies were done in Nigeria as well as in other
countries and none have been done in Nigeria pension industry to the best of our knowledge.
Uremadu et al. (2012) investigated on the effect of working capital management and liquidity
on corporate profits among Nigeria firms using 25 manufacturing companies for the period of
two years. The result shows that working capital management and liquidity had a significant
effect on corporate profitability, which the influences are either negative or positive. Owolabi
and Alayemi (2010) found that there is a strong effect of working capital (especially in terms
of whether the company adopted an aggressive or conservative approach in managing their
working capital) on profitability of a Nigerian manufacturing firm. Almazari (2013) in his
study on effects of working capital management and liquidity on profitability using Saudi
Arabia firms, reported positive and significant effect of working capital management on
profitability. Shin and Soenen (1998) worked on the effects of liquidity on profitability. The
result shows a negative and significant effect of liquidity on profitability.
In summary since working capital is the excess of current assets over current liabilities, it can
simply be put as the cash available at hand for the day-to-day running of the firm. Nigeria
pensions fund administrators has the obligation to pay retirees from investment asset while
maintaining optimal profitability for going concern. This resulting probability whether
working capital management affects corporate profitability of pensions fund administrators to
meet their daily functions especially paying retirees for life create gap for this research. The
study therefore intends to fill the gap using pensions fund administrators to see if the result of
the study will be the same with that of prior studies arising from different sectors and
countries. The main aim of the study is to determine the effects of working capital
management on corporate profitability among licensed pensions fund administrators in
Nigeria, while specific objectives are:
1. to determine the effects of current ratio on corporate profitability;
2. to ascertain the effects of quick ratio on corporate profitability; and
3. to find out the effects of total debt to total assets on corporate profitability
Research Hypotheses
A set of null hypotheses were formulated for the study as follows:
1. There is no significant effect of current ratio on corporate profitability of Nigeria
pensions fund administrators.
2. There is no significant effect of quick ratio on corporate profitability of Nigeria
pensions fund administrators.
3. There is no significant effect of total debts to total assets on corporate profitability of
Nigeria pension’s administrators.
Scope of the Study
The study covers 21 licensed pensions fund administrators by National pensions commission
in Nigeria from 2012 to 2014 using their published financial statements.
The remaining sections of the paper are organised as follows. Section 2 briefly reviews
empirical literature on corporate profitability. It discusses its effect on working capital
127
management. The research design is described in section 3. While section 4 presents and
discusses the empirical findings. Section 5 provides a summary of the results, conclusion and
recommendations.
2. Review of related literature
Conceptual framework
Every business is mostly concerned with its profitability; they defined profitability as the
ability to make profit from all the business activities of an organization, company, firm, or an
enterprise. Additionally, it shows how efficiently the management can make profit by using
all the resources available in the market. One of the most frequently used tools of financial
ratio analysis is profitability ratios, which are used to determine the company's bottom line
(Rahema et al., 2011)
Rahema et al., (2011) worked on sector-wise performance of working capital management
and reported that profitability ratios show a company's overall efficiency and performance
using measures and profitability ratio analysis. They added that profitability and management
efficiency are usually taken to be positively associated: poor corporate profitability affects
management efficiency and vice versa. The result shows that working capital capital
management has positive and significant effects on corporate profitability as wealth
maximization and investment in current assets is made only if an acceptable return is
obtained. While liquidity is needed for a company to continue business to meet its current
needs.
According to Pandey 2005 “companies with higher amounts of assets should be able to earn
higher levels of income. Return on assets expresses the net income earned by a company as a
percentage of the total assets available for use by that company. It measures management
ability to earn a return on the firm’s resources”.
Lazaridis and Tryfonidis (2006) worked on the effects of working capital management on
corporate profitability using listed companies in the Athens Stock Exchange of 131 firms for
the period 2001-2004. The results indicated a statistical significant positive effect of working
capital management on corporate profitability, meaning that managers could create value for
shareholders by handling correctly the cash conversion cycle and by keeping each different
component to an optimum level.
Owolabi and Alayemi (2010) in their study of working capital as a financial strategy using
Nestle Nigeria, their result shows a strong and negative relationship between the working
capital (especially in terms of whether the company adopted an aggressive or conservative
approach in managing their working capital) and the profitability of a Nigerian manufacturing
firm
The notion of performance has been approached over the years in numerous studies and
analyses, and in the academic writings, the concept of “performance” is associated with the
concepts of “profitability”. In most of the studies, profitability is expressed by three
representative indicators; namely return on assets, return on equity and net margin
(Tomuleasa and Cocris 2014). In this respect, we can observe the following papers, which
considered at least one of the mentioned variables: Bourke (1989), Staikouras and Wood
(2004), Park and Weber (2006), Pasiouras and Kosmidou (2007), Athanasoglou et al. (2008),
Albertazzi and Gambacorta (2009), Millon Cornett et al. (2010), Dietrich and Wanzenried
128
(2011), Kanas et al. (2012), among others. The study used return on assets to measure
profitability in other to ascertain pensions fund administrator return on their available funds.
Theoretical framework
The study is anchored on the portfolio theory, developed initially by Harry Markowitz in the
early 1950 on attempt to quantify the relationship between risk and return. It provides some
of the theoretical foundations for asset allocation and investing in index mutual funds.
Expected rates of return for various asset classes are evaluated and compared to the risk of
the asset classes. The goals and risk tolerance of the investor determine the trade-off between
the expected return and risk of the portfolio. The portfolio is constructed by combining
various lower-risk and higher-risk asset classes to achieve an efficient risk-return trade-off.
Determining risk tolerance is a critical step in designing a portfolio. A number of approaches
have been developed to aid the investor in assessing risk tolerance.
Both shorter-term risk and longer-term risk are characterized by the uncertainty of returns.
Shorter-term risk typically is characterized by the uncertainty of shorter-term returns; e.g.,
monthly or annual returns. Longer-term risk is better characterized by the uncertainty of the
cumulative portfolio value (terminal wealth) after many years of investing.
Therefore, pension fund administrators’ corporate profitability has a responsibility to protect
the interest of contributors, to enable administrators pay retiree for life. The goals and risk
tolerance of the administrators as to assets investment will be minimized in other to achieve a
portfolio of high investment return with the National pension’s commission investment
guidelines through efficient working capital management.
Empirical Review
Tomuleasa & Cocris, V. (2014) investigated the major determinants of bank performance in
the European banking sector, taking into consideration the most important financial groups
from this region.. They applied two fixed-effects regression models to a panel of European
banks that covers the period 2004-2012, where profitability was assessed through two
variables, namely return on average equity and net interest margin. Their results show that all
bank-specific determinants affect bank profitability significantly, but not always in the
anticipated way, reporting that the business cycle has a positive, albeit asymmetric impact on
bank profitability, suggesting that profitability is pro-cyclical.
The effect of current ratio on corporate profitability
Sing and Penny (2008) worked on the effects of working capital management on corporate
profitability using Hindalco Industries Ltd during the years 1990-2008. The result shows that
current ratio, acid test ratio had positive and significant effects on corporate profitability.
Binti and Mohd saads' (2010) in Pouraghajan and Emamgholipourarchi (2012) investigated
on the effects of working capital management on profitability and market evaluation. They
examined 65 companies in Pakistan between 2005 and 2009 using current ratio as measure to
working capital management criteria and return on invested capital ratio as a criterion of
company's profitability. The result showed significant correlation between working capital
and value of profitability of the company and concluded that Pakistani companies correlated
heavily on current assets to maximize profits.
129
Ikpefan, Ailemen and Owolabi (2014) focused on the effect of working capital management
on profitability using Nestle Nigeria Plc and Cadbury Nigeria Plc. They used correlation and
regression analysis to analyzed quick ratio as measure to liquidity. Current ratio, trade
receivable collection and trade payables payment periods were used as efficiency variables to
capture the working capital management policy adopted by these companies while return on
equity was used as the profitability variable. The result found a negative and significant effect
of working capital management on profitability of Nestle Nig. Plc, while it found a positive
and significant effect of working capital management on corporate profitability of Cadbury
Nig. Plc. They recommend that companies should manage their working capital efficiently by
upgrading the quality of their assets while obsolete inventories should be written off.
The effect of quick ratio on corporate profitability
Smith and Begemann (1997) investigated the effects of working capital management on
return on investment using industrial firms listed on the Johannesburg Stock Exchange. They
used multiple regression to test the effects of quick ratio on return on investment. The result
shows a positive significant effect of quick ratio on return on investment of firms listed on the
Johannesburg Stock Exchange.
Ajibolade & Sankay (2013) focused on the effect of working capital management on
financing decision: synergetic effect on corporate profitability using 35 manufacturing listed
companies in Nigeria. They examined working capital using quick ratio in contrast to studies
that used several proxy variables including current ratio, average collection period, inventory
turnover The result found a positive significant effect of working capital management on debt
structure and profitability, but insignificant effect on working capital composition on
corporate profitability of Nigeria manufacturing firms.
The effect of total debt to total assets on corporate profitability
Abbasali and Milda (2012) focused on the effects of working capital management on
profitability and market evaluation using companies listed on the Tehran Stock Exchange for
a period from 2006 to 2010. Return on assets and return on invested capital ratio were used to
measure the profitability of firms, while they Tobin Q ratio to measure the market value of
companies. They study measured working capital management criteria using total debt to
total assets ratio. Their result indicates that there is a significant effect of working capital
management on profitability criteria of company but insignificance effects with the criterion
of market value of company.
Gill, et al., (2011) worked on the effect of capital structure on profitability using 272
American firms listed on New York Stock Exchange for a period of 3 years from 2005 –
2007. The correlations and regression analyses used to estimate the functions relating to
profitability (measured by return on equity) with measures of capital structure. Their result
shows a positive effect of total debt to total assets on corporate profitability in the service
industry. However, they reported a positive effect of total debt to total assets on profitability
in the manufacturing industry.
Abdul (2010) on the effects of capital structure on firm’s performance using 36 engineering
sector firms in Pakistani during the period 2003-2009. The result shows that total debt to total
assets has a significantly negative effect with the firm performance on measured by return on
assets.

130
Based on these results done at different environment that this research is aims at feeling the
gap in Nigeria pensions industry. In summary, if working capital management influences firm
profitability, and through effective working capital management, organizations will meet its
current needs. We predict positive significant effect of working capital management on
corporate profitability.
3 Methodology
Research Design
The study is of an ex post facto design. We use secondary data by obtaining financial
information covering all licensed pensions fund administrators by National pension’s
commission from 2012 to 2014. Data were obtained from the annual reports of the sampled
administrators.
The selection of the variables (regressand and regressor) is primarily guided by the results of
previous empirical studies and the available data. The dependent and independent variables
are defined so that they are consistent with those previous empirical studies while the
uniqueness of the present study lies in its inclusion of all licensed pensions fund
administrators in Nigeria as part of its data.
Population of the study
The population of this study is made of all the Nigerian companies that are categorized under
financial sector. However, both quoted or not quoted in the Nigeria stock exchange market.
Sample size of the study
The population of this research is made up all 21 licensed pensions fund administrators by
National pension commission. We create an unbalanced panel for 2012, 2013 and 2014 for
licensed pensions fund administrators by National pension’s commission in Nigeria.
Estimation procedure
The assumption in panel data regression is that the dependent variable is a linear function of
the independent variables with consideration to heterogeneity in the pooled pension’s
administrators. This means that pooled regression assumed that there is no difference in the
pooled pension’s administrators while panel regression assumed cross-section heterogeneity
(cross section fixed effect) and period heterogeneity (time fixed effect).
Model Specification and Measurement of Variables
In specifying our panel regression model for the effects on corporate profitability, our major
variables are current ratio (CurRatio), quick ratio (QuickRatio) and total debt to total assets
(ToDebtAsst). Also included in the model are cross-section (Pensions fund administrator) and
years (2012 – 2014) in the panel regressions.
The panel multiple regression with an error term (µi) is expressed in equation
CorProfit = f (CurRatio + QuickRatio + ToDebtAsst)…………….(1)
CorProfit = αi + β1 CurRatio it + β2 QuickRatio it + β3 ToDebtAsst it + µit ……….(2)
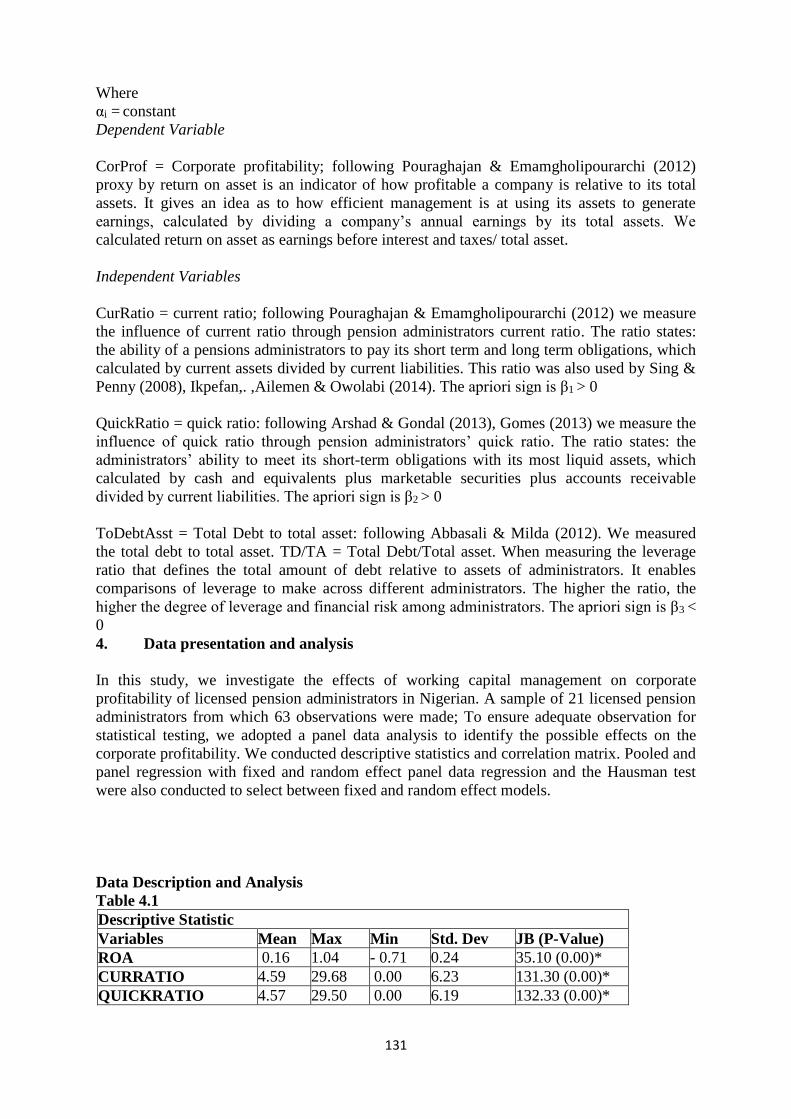
131
Where
αi = constant
Dependent Variable
CorProf = Corporate profitability; following Pouraghajan & Emamgholipourarchi (2012)
proxy by return on asset is an indicator of how profitable a company is relative to its total
assets. It gives an idea as to how efficient management is at using its assets to generate
earnings, calculated by dividing a company’s annual earnings by its total assets. We
calculated return on asset as earnings before interest and taxes/ total asset.
Independent Variables
CurRatio = current ratio; following Pouraghajan & Emamgholipourarchi (2012) we measure
the influence of current ratio through pension administrators current ratio. The ratio states:
the ability of a pensions administrators to pay its short term and long term obligations, which
calculated by current assets divided by current liabilities. This ratio was also used by Sing &
Penny (2008), Ikpefan,. ,Ailemen & Owolabi (2014). The apriori sign is β1 > 0
QuickRatio = quick ratio: following Arshad & Gondal (2013), Gomes (2013) we measure the
influence of quick ratio through pension administrators’ quick ratio. The ratio states: the
administrators’ ability to meet its short-term obligations with its most liquid assets, which
calculated by cash and equivalents plus marketable securities plus accounts receivable
divided by current liabilities. The apriori sign is β2 > 0
ToDebtAsst = Total Debt to total asset: following Abbasali & Milda (2012). We measured
the total debt to total asset. TD/TA = Total Debt/Total asset. When measuring the leverage
ratio that defines the total amount of debt relative to assets of administrators. It enables
comparisons of leverage to make across different administrators. The higher the ratio, the
higher the degree of leverage and financial risk among administrators. The apriori sign is β3 <
0
4. Data presentation and analysis
In this study, we investigate the effects of working capital management on corporate
profitability of licensed pension administrators in Nigerian. A sample of 21 licensed pension
administrators from which 63 observations were made; To ensure adequate observation for
statistical testing, we adopted a panel data analysis to identify the possible effects on the
corporate profitability. We conducted descriptive statistics and correlation matrix. Pooled and
panel regression with fixed and random effect panel data regression and the Hausman test
were also conducted to select between fixed and random effect models.
Data Description and Analysis
Table 4.1
Descriptive Statistic
Variables Mean Max Min Std. Dev JB (P-Value)
ROA 0.16 1.04 - 0.71 0.24 35.10 (0.00)*
CURRATIO 4.59 29.68 0.00 6.23 131.30 (0.00)*
QUICKRATIO 4.57 29.50 0.00 6.19 132.33 (0.00)*
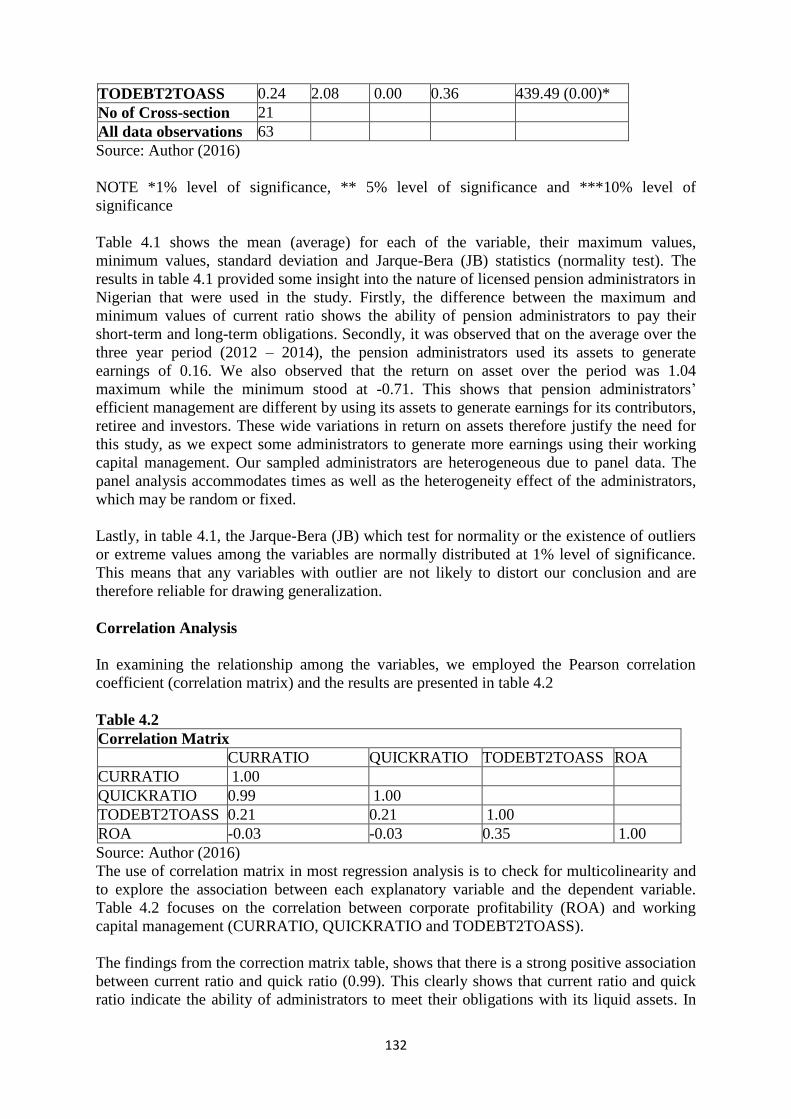
132
TODEBT2TOASS 0.24 2.08 0.00 0.36 439.49 (0.00)*
No of Cross-section 21
All data observations 63
Source: Author (2016)
NOTE *1% level of significance, ** 5% level of significance and ***10% level of
significance
Table 4.1 shows the mean (average) for each of the variable, their maximum values,
minimum values, standard deviation and Jarque-Bera (JB) statistics (normality test). The
results in table 4.1 provided some insight into the nature of licensed pension administrators in
Nigerian that were used in the study. Firstly, the difference between the maximum and
minimum values of current ratio shows the ability of pension administrators to pay their
short-term and long-term obligations. Secondly, it was observed that on the average over the
three year period (2012 – 2014), the pension administrators used its assets to generate
earnings of 0.16. We also observed that the return on asset over the period was 1.04
maximum while the minimum stood at -0.71. This shows that pension administrators’
efficient management are different by using its assets to generate earnings for its contributors,
retiree and investors. These wide variations in return on assets therefore justify the need for
this study, as we expect some administrators to generate more earnings using their working
capital management. Our sampled administrators are heterogeneous due to panel data. The
panel analysis accommodates times as well as the heterogeneity effect of the administrators,
which may be random or fixed.
Lastly, in table 4.1, the Jarque-Bera (JB) which test for normality or the existence of outliers
or extreme values among the variables are normally distributed at 1% level of significance.
This means that any variables with outlier are not likely to distort our conclusion and are
therefore reliable for drawing generalization.
Correlation Analysis
In examining the relationship among the variables, we employed the Pearson correlation
coefficient (correlation matrix) and the results are presented in table 4.2
Table 4.2
Correlation Matrix
CURRATIO QUICKRATIO TODEBT2TOASS ROA
CURRATIO 1.00
QUICKRATIO 0.99 1.00
TODEBT2TOASS 0.21 0.21 1.00
ROA -0.03 -0.03 0.35 1.00
Source: Author (2016)
The use of correlation matrix in most regression analysis is to check for multicolinearity and
to explore the association between each explanatory variable and the dependent variable.
Table 4.2 focuses on the correlation between corporate profitability (ROA) and working
capital management (CURRATIO, QUICKRATIO and TODEBT2TOASS).
The findings from the correction matrix table, shows that there is a strong positive association
between current ratio and quick ratio (0.99). This clearly shows that current ratio and quick
ratio indicate the ability of administrators to meet their obligations with its liquid assets. In
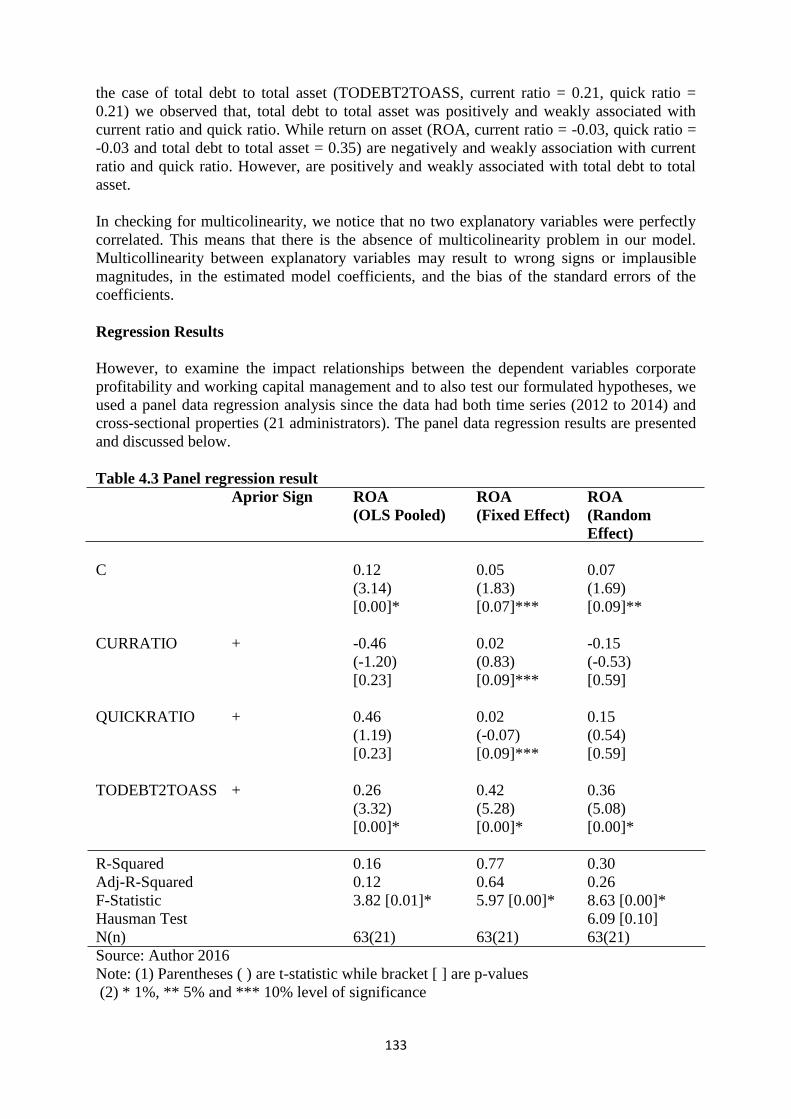
133
the case of total debt to total asset (TODEBT2TOASS, current ratio = 0.21, quick ratio =
0.21) we observed that, total debt to total asset was positively and weakly associated with
current ratio and quick ratio. While return on asset (ROA, current ratio = -0.03, quick ratio =
-0.03 and total debt to total asset = 0.35) are negatively and weakly association with current
ratio and quick ratio. However, are positively and weakly associated with total debt to total
asset.
In checking for multicolinearity, we notice that no two explanatory variables were perfectly
correlated. This means that there is the absence of multicolinearity problem in our model.
Multicollinearity between explanatory variables may result to wrong signs or implausible
magnitudes, in the estimated model coefficients, and the bias of the standard errors of the
coefficients.
Regression Results
However, to examine the impact relationships between the dependent variables corporate
profitability and working capital management and to also test our formulated hypotheses, we
used a panel data regression analysis since the data had both time series (2012 to 2014) and
cross-sectional properties (21 administrators). The panel data regression results are presented
and discussed below.
Table 4.3 Panel regression result
Aprior Sign ROA
(OLS Pooled)
ROA
(Fixed Effect)
ROA
(Random
Effect)
C 0.12 0.05 0.07
(3.14) (1.83) (1.69)
[0.00]* [0.07]*** [0.09]**
CURRATIO + -0.46 0.02 -0.15
(-1.20) (0.83) (-0.53)
[0.23] [0.09]*** [0.59]
QUICKRATIO + 0.46 0.02 0.15
(1.19) (-0.07) (0.54)
[0.23] [0.09]*** [0.59]
TODEBT2TOASS + 0.26 0.42 0.36
(3.32) (5.28) (5.08)
[0.00]* [0.00]* [0.00]*
R-Squared 0.16 0.77 0.30
Adj-R-Squared 0.12 0.64 0.26
F-Statistic 3.82 [0.01]* 5.97 [0.00]* 8.63 [0.00]*
Hausman Test 6.09 [0.10]
N(n) 63(21) 63(21) 63(21)
Source: Author 2016
Note: (1) Parentheses ( ) are t-statistic while bracket [ ] are p-values
(2) * 1%, ** 5% and *** 10% level of significance
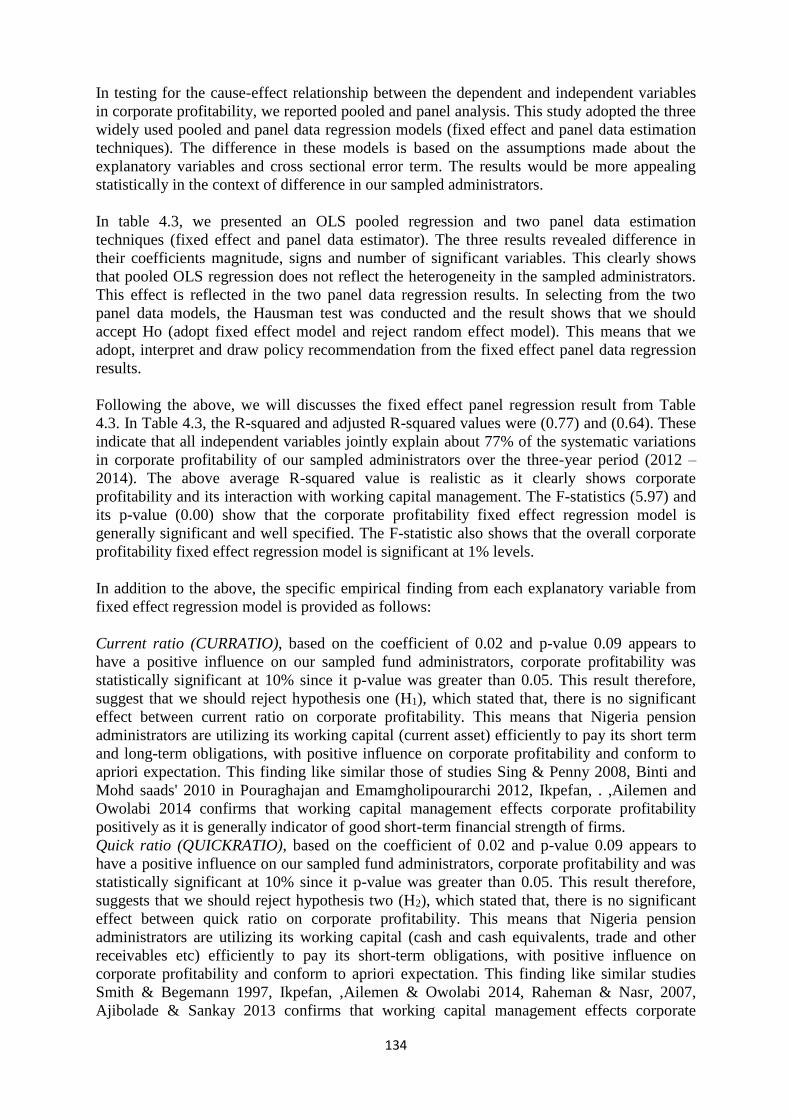
134
In testing for the cause-effect relationship between the dependent and independent variables
in corporate profitability, we reported pooled and panel analysis. This study adopted the three
widely used pooled and panel data regression models (fixed effect and panel data estimation
techniques). The difference in these models is based on the assumptions made about the
explanatory variables and cross sectional error term. The results would be more appealing
statistically in the context of difference in our sampled administrators.
In table 4.3, we presented an OLS pooled regression and two panel data estimation
techniques (fixed effect and panel data estimator). The three results revealed difference in
their coefficients magnitude, signs and number of significant variables. This clearly shows
that pooled OLS regression does not reflect the heterogeneity in the sampled administrators.
This effect is reflected in the two panel data regression results. In selecting from the two
panel data models, the Hausman test was conducted and the result shows that we should
accept Ho (adopt fixed effect model and reject random effect model). This means that we
adopt, interpret and draw policy recommendation from the fixed effect panel data regression
results.
Following the above, we will discusses the fixed effect panel regression result from Table
4.3. In Table 4.3, the R-squared and adjusted R-squared values were (0.77) and (0.64). These
indicate that all independent variables jointly explain about 77% of the systematic variations
in corporate profitability of our sampled administrators over the three-year period (2012 –
2014). The above average R-squared value is realistic as it clearly shows corporate
profitability and its interaction with working capital management. The F-statistics (5.97) and
its p-value (0.00) show that the corporate profitability fixed effect regression model is
generally significant and well specified. The F-statistic also shows that the overall corporate
profitability fixed effect regression model is significant at 1% levels.
In addition to the above, the specific empirical finding from each explanatory variable from
fixed effect regression model is provided as follows:
Current ratio (CURRATIO), based on the coefficient of 0.02 and p-value 0.09 appears to
have a positive influence on our sampled fund administrators, corporate profitability was
statistically significant at 10% since it p-value was greater than 0.05. This result therefore,
suggest that we should reject hypothesis one (H1), which stated that, there is no significant
effect between current ratio on corporate profitability. This means that Nigeria pension
administrators are utilizing its working capital (current asset) efficiently to pay its short term
and long-term obligations, with positive influence on corporate profitability and conform to
apriori expectation. This finding like similar those of studies Sing & Penny 2008, Binti and
Mohd saads' 2010 in Pouraghajan and Emamgholipourarchi 2012, Ikpefan, . ,Ailemen and
Owolabi 2014 confirms that working capital management effects corporate profitability
positively as it is generally indicator of good short-term financial strength of firms.
Quick ratio (QUICKRATIO), based on the coefficient of 0.02 and p-value 0.09 appears to
have a positive influence on our sampled fund administrators, corporate profitability and was
statistically significant at 10% since it p-value was greater than 0.05. This result therefore,
suggests that we should reject hypothesis two (H2), which stated that, there is no significant
effect between quick ratio on corporate profitability. This means that Nigeria pension
administrators are utilizing its working capital (cash and cash equivalents, trade and other
receivables etc) efficiently to pay its short-term obligations, with positive influence on
corporate profitability and conform to apriori expectation. This finding like similar studies
Smith & Begemann 1997, Ikpefan, ,Ailemen & Owolabi 2014, Raheman & Nasr, 2007,
Ajibolade & Sankay 2013 confirms that working capital management effects corporate
135
profitability positively as increasing quick ratio generally indicates that a company is
experiencing solid top-line growth, quickly converting receivables into cash, and easily able
to cover its financial obligations
Total debt to total assets (TODEBT2TOASS), based on the coefficient of 0.42 and p-value
0.00 appears to have a positive influence on our sampled fund administrators, corporate
profitability and was statistically significant at 1% since its p-value was 0.00. This result
therefore, suggests that we should reject hypothesis three (H3), which stated that, there is no
significant effect between total debt to total assets on corporate profitability. This means that
Nigeria pension administrators have a minimum risk as associated working capital
operations, with this minimum risk it shows that administrators have the ability to pay off its
liabilities with its assets. With positive influence on corporate profitability and conform to
apriori expectation, this finding like similar studies Gill, et al., 2011, Abbasali & Milda 2012
confirms that debt ratio effects corporate profitability positively showing a company's ability
to pay off its liabilities with its assets.
5. Conclusion and recommendations
Results from this study indicate that there is significant effect between working capital
management and corporate profitability. This is consistent with the findings of Lazaridis &
Tryfonidis 2006 that reported significant positive relationship between working capital
management and profitability, stating that managers could create value for shareholders by
handling correctly the cash conversion cycle and by keeping each different component to an
optimum level. Pouraghajan & Emamgholipourarchi 2012 that stated a significant
relationship between the working capital management and profitability, as Pakistani
companies correlated heavily on current assets to maximize profits. They provide evidence
that managers may enhance the profitability of their firms through proper working capital
management.
In addition, the study reveals a positive relationship between current ratio and quick ratio at
10% level of significant. The results imply that current and quick ratio affects profitability, as
Nigeria pension administrators are utilizing its working capital efficiently to pay its short-
term obligations. However, total debt to total assets has a positive relationship at 1% level of
significant; it means that Nigeria pension administrators have a minimum risk as associated
working capital operations, with the commission investment guidelines, the minimum risk
shows that administrators have the ability to pay off its liabilities with its assets.
Therefore, the study recommends that administrators should continue to utilize its working
capital efficiently to increase profitability, pay its short-term and long-term obligations while
maintaining minimum risk with its assets.
6. Acknowledgment
We thank our supervisors, Prof Austin Nweze, Prof Ben Osisioma and Dr Anichebe who
provided invaluable guidance, input and hard work to help make this paper possible. We are
indebted to Dr Nkechi Offor and Okereke Rowland for their meticulous proof reading during
which they spotted many errors and corrections. We extend our most sincere heartfelt thanks
to our parents and family for their love and encouragement. Our thanks to our friends and our
fellow classmates, whose insightful suggestions and comments were valuable.
Reference
136
1. Abbasali P. & Milad E. (2012) Impact of Working Capital Management on Profitability
and Market Evaluation: Evidence from Tehran Stock Exchange. International Journal of
Business and Social Science. 3(10) 311-318
2. Abdul G. K. (2010). The Relationship of Capital Structure Decisions with Firm
Performance: A Study of the Engineering Sector of Pakistan. COMSATS Institute of
Information Technology, Vehari
3. Ajibolade O. & Sankay C. (2013) Working Capital Management and Financing Decision:
Synergetic Effect on Corporate Profitability. International Journal of Management,
Economics and Social Sciences 2(4) 233 –251.
4. Albertazzi, U., & Gambacorta, L. (2009) Bank profitability and the business cycle.
Journal of Financial Stability. 5 393 - 409.
5. Angahar A. and Agbo A. (2014) Impact of working capital on the profitability of the
Nigerian cement industry. European Journal of Accounting Auditing and Finance
Research, 2(7),17-30
6. Ani, W., Okwo, I. & Ugwunta, D. (2015) Effects of working capital management on
profitability: evidence from the top five beer brewery firms in the world. Asian Economic
and Financial Review 2(8):966-982
7. Arshad Z. & Gondal M. Y. (2013) Impact of Working Capital Management on
Profitability. A Case of the Pakistan Cement Industry. Interdisciplinary Journal of
Contemporary Research 5(2) 384 -390
8. Athanasoglou, P., Brissimis, S., & Delis, M. (2008) Bank-Specific, Industry-Specific and
Macroeconomic Determinants of Bank Profitability. Journal of International Financial
Markets, Institutions and Money. 18(2) 121 - 136.
9. Bourke, P. (1989) Concentration and Other Determinants of bank Profitability in Europe,
North America and Australia. Journal of Banking and Finance, 13(1) 65 - 79
10. Deloof, M. (2003). Does Working Capital Management Affect Profitability of Belgian
Firms? Journal of Business Finance & Accounting, 30(3): 573-585.
11. Dietrich, A., & Wanzenried, G. (2011) Determinants of Bank Profitability before and
During the Crisis: Evidence from Switzerland. Journal of International Financial
Markets, Institutions and Money. 21(3) 307 - 327.
12. Eljelly, A. (2004). Liquidity – Profitability tradeoff: An empirical investigation in an
emergent market. International Journal of Commerce and Management, 14(2): 48-61.
13. Gill, A, Nahum B, & Neil M, (2011). The effect of capital structure on profitability:
Evidence from the United States”. International Journal of Management, 28(4)3-15.
14. Gomes D. F. (2013) How Does Working Capital Management Affect Firms´
Profitability? Evidence from Portugal. Maters thesis LISBOA School of Economics and
Management.
15. Ikpefan, O. Ailemen & Owolabi F. (2014) Working Capital Management and Profitability
of the Manufacturing Sector: An Empirical Investigation of Nestle Nigeria PLC and
Cadbury Nigeria PLC. Global Journal of Management and Business Research 14 (4) 21 -
27
16. Kanas, A., Vasiliou, D., & Eritios, N. (2012) Revisiting bank profitability: A semi-
parametric approach. Journal of International Markets, Institutions and Money. 22 990 -
1005.
17. Kulkanya N. (2012) Effects of Working Capital Management on the Profitability of Thai
Listed Firms. International Journal of Trade, Economics and Finance, 3(3) 227-232
18. Lazaridis, I. & Tryfonidis, D. (2006). “Relationship between Working Capital
Management and Profitability of Listed Companies in the Athens Stock Exchange”.
Journal of Financial Management and Analysis. 19 (1), 26 – 35.
19. Markowitz H. (1952) Portfolio Selection. The Journal of Finance 7 (1) 77–91

137
20. Millon Cornett, M., Guo, L., Khaksari, S., & Tehranian, H. (2010) The impact of state
ownership on performance differences in privately-owned versus state-owned banks: An
international comparison. Journal of Financial Intermediation. 19 74 – 94
21. Ojeani, N (2010) Working capital management and profitability of listed pharmaceutical
firms in Nigeria. A thesis submitted to the school of postgraduate studies, Ahmadu Bello
University Zaria
22. Olufemi I. & Olubanjo T. (2009) Working capital management and corporate
profitability: evidence from panel data analysis of selected quoted companies in Nigeria.
Research Journal of Business Management 3(3) 73-84
23. Osundina J. (2014) Working capital management and profitability of selected quoted food
and beverages manufacturing firms in Nigeria. European Journal of Accounting Auditing
and Finance Research 2(3) 10-21
24. Owolabi S. & Alu C. (2012) Effective working capital management and profitability.
Economics and Finance Review. 2(6) 55 – 67
25. Owolabi, S. A. & Alayemi, S. A. (2010):“The study of working capital management as a
financial strategy: A case study of Nestle Nigeria Plc”. Asian journal of Business and
Management Sciences, 2(4).
26. Pandey, I. M. (2005). Financial Management, (9th Ed). Vikas Publishing, New Delhi
27. Park, K., & Weber, W. (2006) Profitability of Korean banks: Test of market structure
versus efficient structure. Journal of Economics and Business, 58 222 - 239
28. Pasiouras, F. & Kosmidou, K. (2007) Factors influencing the profitability of domestic and
foreign commercial banks in the European Union. Research in International Business and
Finance. 21(2) 222 – 237
29. Pouraghajan A. & Emamgholipourarchi M. (2012) Impact of Working Capital
Management on Profitability and Market Evaluation: Evidence from Tehran Stock
Exchange. International Journal of Business and Social Science 3 (10)
30. Rahema, A., Qayyum, A. & Afza, T. (2011).Sector-wise Performance of Working Capital
Management Measures and Profitability Using Ratio Analysis Interdisciplinary Journal
of Contemporary Research in Business 3 (8)
31. Raheman, A. & Nasr, N. (2007). Working capital management and profitability: Case of
Pakistani firms. International Review of Business Research Papers, 3(1): 279 - 300.
32. Singh, J. P . & Shishir P., (2008). Impact of working capital management in the
profitability of Hindalco industries limited” ,ICFAI Journal of financial Economics 6 (4),
62-72 .
33. Smith, M. B., & Begemann E. (1997). Measuring association between working capital
and Return on Investment. South Africa Journal of Business Management, 28, (1), 1-5.
34. Staikouras, C. K., & Wood, G. E. (2004) The Determinants of European Bank
Profitability. International Business and Economics Research Journal, 3(6) 57 - 68
35. Tomuleasa I. & Cocris, V. (2014) Measuring the financial performance of the European
systemically important banks. Financial Studies 4 31-51
36. Zahra, M & Azam, J (2012) The Relationship between Working Capital Management and
Firm Performance: Evidence from Iran. International Journal of Humanities and Social
Science 2(2) 141-146
138
INSURGENCY AND BUSINESS ACTIVITIES IN NIGERIA
Onyeukwu Pauline Ph.D, Hindu Amin Phd and Benedict Akanegbu Phd
Nigerian Turkish Nile University
ABSTRACT
This paper examines insurgency and business activities in the northern part of Nigeria. The
main objective of the study among others was to identity the impact of an insurgency,(Boko-
Haram) in the Northern part of Nigeria.expecially the North East of the country. The
instrument used for data collection was the questionnaire, oral interview and the
documentary evidence The sample for the study consist of (200) two hundred respondents
randomly drawn from the politician, security agent, civil servants, traders, investors, self-
employees, farmers within the Northern zone. The findings reviewed that insurgency has
affected business activities in the northern Nigeria and has increased tensions between
various ethnics communities, interrupted development activities, frequented off investors, and
has generated concern among Nigerians. It also reviewed that the exodus of people from the
Northern parts of the country to other parts of Nigeria is on the increase; a lot of people have
been internally displaced, these have been causing hardship to many Nigerians and the
Nigerian government. In view of the findings, the paper recommends that: Each school in the
northern Nigeria should have security post, as killings are being noticed even in the schools.
The government must address the social and economic problems that have created the
environment in which Boko Haram thrives .The stick and carrot strategy could also be
adopted where necessary.
Key Words: Insurgency, Business, Activities
Introduction
Nigeria spent N4.4 Trillion between 2012 and 2014 and lost over thirteen thousand (13,000)
lives in the current insurgency bedeviling the country. The 36 state governors, under the aegis
of Nigeria Governors’ Forum (NGF), on May 10, 2012, described the insecurity situation in
the country as a national embarrassment and condemnable. This is beside other security
challenges such as kidnappings, arm robbery and militancy from Niger Delta region. While,
the Boko Haram insurgents in the name of religion are causing mayhem in the northern part,
their counterparts from the Niger Delta attacks the oil and gas facilities based on ideology of
political autonomy and a greater share of oil revenue derived from their region.
A recent report aired from Channel Television revealed that at least three hundred thousand
(300,000) people have been displaced from their homes and registered as Internally
Displaced Persons (IDP). Nigeria, Niger Republic, Chad and Cameroon and United Nations
are finding it tough in handling the situation.The violent insurgency being waged in northern
Nigeria by the Boko Haram has taken its toll in terms of lives lost and the economy
especially in the second largest city, Kano, Maiduguri, Yobe and Adamawa.
The insurgency is gaining ground because Northern Nigeria houses a narrow majority of the
country’s Muslim population, most of whom are Sunnis. With their majority, the Muslim
population has sought the introduction of Sharia Law, or Islamic Law, as the foundation of all
legislation in the region. In the process, as many as 12 of the states in Northern Nigeria have
relied on Sharia Law as the basis of their legislative, executive and judicial arrangements
since 1999.

139
The insurgency has succeeded in polarizing the country along ethnic and religious lines and is
eating deeply in to the political, social and economic stability.A report by Morgan Stanley,
one of the world’s leading investment banks, in 2011, indicates that a capital flow of $33
billion forecast for Nigeria is under threat by the bombings Additionally, the country’s image
and reputation is at stake in the eyes of international community and something very serious
has to be done urgently to reverse this negative trend.
The implication of these was that as the bombing creates fears, whosoever plans to come
must in the part of the country with, will draw back. This was why prospective investor
receiving news of the activities of Boko Haram and their bombing activities will not will not
come, because they thence the entire country is on fire. This account for why some business
men in the southern part of the country could not invest or set up their business branches up
north any longer. The same fear has affected the traders from Mali, Chad, and Niger republic
that usually flood the market on daily and weekly bases.
Beside, at the moment, most private and government construction work in the state are at a
stand still also affected by the activities of the insurgency is the multi-billion naira Kano
textile market, otherwise known as the Kanti-kwari market; which is one the oldest and
biggest textile market in the sub- Sahara Africa.
Therefore, evidences has shown that human capital/entrepreneurship drain cripples the
northern Nigeria economic, and there are concerns that, it is been transmitted to the Nigeria
macro- economic environment. This is because apart from attacks on churches the sect have
attacked commercial hot-spots like market, packs, government agencies and even bankers
one of which thy invested N41 million, as recently revealed by the sects top shot, Abu Gada,
currently in detention (Okereocha (2012:47)
With the increase intensity of bombing in the north, there was strategic mass movement of
individuals from the most affect the northern state, especially in early 201. The movements
were of a strange mind since both southerners and northerners simultaneously moved from
Boko Haram strong holds. While northerners moved from the south-east in hundreds, many
relocated either to safe affects the business activities within the region. The house reacts in
major metropolises in Kano, Borno and Yobe have reduced significantly, as the crisis
accelerated. Thought is normal as population depletes, but the situation is expected to be
different where forced.
Migrants flee to: and if the sect’s activities continued to be intensified, the fleeing families
are bound to put more pressure on infrastructure in the south-west, south-east and south-
south.
Therefore, the economic effects of militancy insurgency in Nigeria simply connote
consequential effect on people and government life militants by their nature are used to
cripple economic activities within the affected place due to restiveness. The insurgency of
Boko Haram, have not only led to closure and or abandonment of people’s business activities
within the affected region, but also led to migration of people leading to reduction of people’s
patron age of product from the northern region. This was why Mr. Umar Ibrahim Yoruba
(leadership newspaper, 2012) opined that, they discovered that 97 percent of businesses were
negatively affected by the security problem. Some of them had to close down; some had to
retrench their workers and others had to cut down in the number of hour of operations.The
insurgency of Boko Haram have reduced drastically, government deviation from the affected
140
states due to restiveness in these places as well as reduced in investments and growth of
business in the affected places, without excluding government executed project.
In the wake of this crisis, many international agencies and countries issued travels warnings
to their citizens about the danger involved in travelling and doing business in the same park
of the country in giving evidence to the warning, the government of President Goodluck
Jonathan on October 1, 2011, moved the national day celebration away from eagle, square to
Also villa, following a warning of possible bombing from terrorist elements from either the
Boko Haram group or Niger Delta militants.
Boko Haram has grow stronger and increasingly more sophisticated over the past three years,
and eliminating the Boko Haram problems will require a broad-based strategy that the
establishments of a comprehensive plan rather than the imposition of more martial law. This
is because Boko Haram capitalizes on popular frustration with leaders, poor government
service delivery, and the dismal living condition of many northerners. They serve to
humiliate and undermine the government, and exploit religions differences in the order to
create chaos and to make Nigeria ungovernable; hence the group bring funded by a handful
of resentful politicians nursing their wounds from the last election. However to fix the Boko
Haram problem, the government have to develop a new social compact with its northern
citizens and to develop an economic recovery strategy that complements its security strategy;
above all, to draw the support of the northern governors, traditional Hausa and Fulani leaders
the local officials and organization.
The Nigeria government should consider creating ministry of northern Affairs or a northern
development commission similar to what it did in response to the crisis in Niger Delta.
Therefore, resolving the problems in the northern Nigeria will require the government to act
more swiftly and to make strategy course corrections. In Borno state, for instance officials of
the Nigeria immigration and custom service have virtually deserted their post in the border
town of bank due to threats from Boko Haram franchise in the area. In Kaduna and Bank
public and private business are becoming much more Mary of when, where, are, how they
conduct their affairs. Some part of the extreme north have become no’ go areas because they
are perceived to be lush risk locations. Hotels, guest houses, and other tourist locations are
being given a wide berth by a clientele that has suddenly realized that discretion is better part
of flavour
1.2 THE STATEMENT OF THE PROBLEMS
The problems statement lies in offering better information or knowledge to the people about
what is happening in government, passing of wrong massages among religions leaders, and
followings that have aggravated the tension in Nigeria, particularly Northern parts of Nigeria
The following area
- The ideology
- Unemployment
- Corruption
- Fictitious facts and ignorance
- Failure of good governance and good leadership
- Social injustice, marginalization and neglect
- Frustration

141
All the mentioned factors negatively have reflected on the people and which later lead to
frustration on the people part to the extent of instigation militancy among other social vices,
particularly among the youths.
Thence are other challenges such as lacks of necessary materials, lack of proper orientation,
and conclusive environment needs attention by ways of practical reform.
Further statement of the problem is on how to redeem the hope of the investors to become
back to the troubled region to do business. The specific aspects of the general problems of the
study were.The under development that paused way for militancy as recourses that could
have been used to empower the people have been converted to private use and the reduces the
recourse available for development as well as provision for social service such as education
health and transport system.
Also the Boko Haram ideology, that emphasis that western secular education is Islamically
prohibited and thence should be another system of education base purely on teaching of
Quran and sunneh as understood by the earliest generation of Muslims without any attempt to
provide for alternative curriculum for this system of education.
Apart from these, are the incessant attacks and slarmishes of Boko Haram with the Nigeria
militancy and police force has so many implications for the security, not only of Nigerians,
but thee entire sub-Saharan Africa; because of trade and businesses. The psychology of the
army losing grounds in some battle to the Boko-Haram sects, makes some Nigerians living in
the North East to doubt the many promises of protection by the Nigerian government. Many
Nigerians are beginning to lose faith in the ability of the federal government to protect them
against terrorist attack; as the sects are seen applying superior weaponry than the Nigerian
army as a parallel government; hence a good number of people are seeing them as a new
opportunity for advancing their faith and belief systems.
The north East and indeed the entire nation has suffered untold loss of revenue. It is estimated
that it would take the north east part of Nigeria, at least another fifty to come back to where
they used to be economically. People were displaced from homes, loss of source of
livelihood, and capital fight. Those who are forced to relocate had to begin life anew. The
cost of food stuffs, staple and livestock and other sundry consumptions have gone up. While
the cost in terms of loss of human lives and properties can only be imagined.
1.3 The Objectives of the Study
The main objective of this study is to examine issues on insurgency and business activities in
Northern Nigeria and its cost implication on the Nigerian policy. Other objectives of the
study were –
Highlight the cost of fighting the boko haram current insurgency in North East
Nigeria
Identify root cause of the boko- haram insurgency in the Northern Nigeria
Identify the impact of ,boko-haram insurgency on business activities in the
North-East of Nigeria
1.6. Research Questions
What is the cost of fighting boko- haram insurgency in North East Nigeria?
What is the root cause of the boko- haram insurgency in the Northern Nigeria?
142
What is the impact of ,boko-haram insurgency on business activities in the
North-East of Nigeria?
Literature Review
Northern Nigeria is an autonomous division within Nigeria, distinctly different from the
southern part of the country; it had independent customs, foreign relations and security
structures. In 1962 it acquired the territory of the British Northern Cameroons, which voted to
become a Province within Northern Nigeria.
This study is being concentrated in North-East and parts of Northern Nigeria, where Boko-
Haram has created widespread insecurity across Northern Nigeria, increasing tensions
between various ethnic communities, interrupting development activities, and in frightening
of investors.However, the states where this study is being carried out are, Borno, Yobe,
Zamfara, Kano, Kaduna, Adamawa, Bauchi areas of the county.In essence, there is absence
of or inadequacy of the latest factors of production known as entrepreneur (human capital,
that contributes to the states economt, it has cripple the Northern economy as the insurgency
were able to attack commercial hot-spots like markets, parks, government agencies and even
banks. With the high rate of migration of the people due to insurgency, it has placed demands
on the cities public facilities, transportation and distribution net-works and the supply of
utilities that have been unable to keep pace with the people demand on Business).
The Boko-Haram Sect though has been in existence since 2001, did not become popular in
the country until 2009, when it participated actively in sectarian violence, which occurred
then in Jos, Plateau State. (The Nation, January 29, 2013) Mohammed Yusuf, who remained
the group’s leader until he was killed by solders in 2009, founded the Boko-Haram
Sect.However, the literature for the study will take cognizance of the purpose of the study.
Whereas the theoretical framework to be applied is on psychology approaches propounded by
(Dyke 1960:177).
Eme at-al (2012.45) said that over the last years, Boko Haram has create widespread
insecurity across northern Nigeria, increased tensions between various ethnic communities,
interrupted development activities, frightened off-investors, and generated concerns among
Nigeria ‘s northern neighbors. They have been responsible for near daily attacks in Borno and
Yobe states. They were behinds the January 20 attacks in Kano that killed nearly (200)
people and three major attacks in Abuja, including the bombing of the UN headquarter last
August.
The Boko Haram’s activities in Kano, Kaduna, Bornu, Yobe and Bauchi is gradually
changing economic structure of the whole of northern Nigeria. The evidence and the fast
changing indices (in form of changing migration patterns, cost of insurance in the worth,
mass repatriation of founds, death is skilled labour etc) speaks volumes. In economic terms,
there is systemic distortion of the existing economic pattern and structure in the northern
region, for a cause that is neither war nor natural disaster. The nation, according to a recent
report by the human right watch,(HRW), lost more than 935 of its human capital between
2009 and 2012. The united nation conference in trade and development (UNCTAD),
estimated that the domestic economy lost a whopping N1.33 trillion foreign direct investment
(DFI) owing to the activities of the terrorists going in the name Boko Haram (Okereocha,
2012)
2.1 THEORETICAL FRAMEWORK
143
The researcher adopted the psychology approach theoretical framework for this study.
Psychology as the study of human behaviour is of great relevance in the study. Although, the
main focus of psychology is on the individual, there is lack of consensus among psychologist
on the aspect of man that deserves emphasis. As a result, some focus of the way man
perceives his environment and motivations, and some of still other aspects of the individuals
or his experiences.(Dyke, 1960:127) All the above areas of emphasis of psychologists have
implications for political activity, the psychological approaches are predominantly
motivational due to the purposive character of political behaviour, and perception is also
significantly politically. Another important psychological approach to politics is the
personality trait approach. Igwe (2002:321) personality denotes “the unique totality of a
person from the stand point of others, the fundamental of which are developed early in life,
but possibility for change overtime. In the words of Smith, Buner and White (1956:31)
personality is acquired through interaction of people with each other.
The personality approach assumes that political behaviour is a product of deep-seated traits
that are usually developed at an early age. Therefore, to explain the political behaviour of a
leader or politicians, we must understand or probe into his personality. For example, Adorno
et al (1950) in their work demonstrated the effect of personality on the genesis of fascist-type
of political movements. They contend that “there is a particular personality syndrome, the
authoritarian, which makes people vulnerable to such ideologies.Isaak, (1985: 216) similar
conclusion was reached Christies and Johada (1954) in their study. The personality approach
originated from psychoanalyses made famous by Freud (cited in Brown 1961.) Applying
these theories to the study, the analysis means thus;It is that acute sense of separatism under
an ostensibly secular and united country fuelled by the same acute sense of religious
differences that forced same Northern Hegemonies-from time to time to play the religious
card in Nigeria politics.
Trends and Activities of Boko-Haram Insurgency in the Northern Nigeria
Ekereke (2013) said that the dreaded Boko-Haran sect changes tactics of operation at all time;
before now it was carried out using cars with improvised explosive device (IED) targeted
public places such as August 26th 2011, suicide bombing of the United Nations secretariat in
Abuja (Okpeega, Chijioke and Innocent (2012), Abuja police barracks on 16th June 2011,
army barracks in Bauchi state, bombing of Nigeria police Headquarters in Abuja (forest
2012). It was later dressed like Nigerian Army and Muslim women to void arrest by Nigerian
soldiers (premium times, August 2013).
The researcher agreed with the retreater, because since August 2011, there have been almost
weekly attacks by Boko-Haran, planting bombs in public or in churches in Nigeria’s
Northeast. The group has also broadened us targets, away from direct revenge attacks on the
state to include other representation of authority. This expansion includes setting fire to
schools and attacking newspaper officers. In March 2012, some twelve public schools in
Maiduguri were burned down during the night, with as many as 10,000 pupils force out of
school. Three village members of Boko-Haran were killed, while trying to set light to a
school in another area of the state.The group has told Journalists that these attacks are in
relation for the arrest of a number of Islamic teachers from traditional “Tsangaya” Quranic
School in Maiduguri – walker 2012.More than 29 students and a teacher were killed after
gunmen attacked boarding school of Baga Community in Bornu as well as 42 students and
other staff of Government secondary school in Mamudo, Yobe state leading to the closure of
all school in the state.
144
(Global post July 2013). The attacks systematically slaughtered students one after the other, a
former Malam Abdullahi, found the bodies of two of his sons, 10-years old shot in the back
as he apparently tied to runaway, and a 12-year old shot in the chest. More than 800
classrooms were touched by the attackers (punch 9th August 2013), in October 2012, over 40
students were murdered in cold blood in federal polytechnic Adamawa State, the North
Eastern state of Nigeria on style that is considered worst in the history of their operation .
Names of students were called one by one and slaughtered at will like goats, lecturers were
not spared as well as warders lecturers (The Nation October 2012).
In July 2013, a school dormitory was doused in petrol and set alight in North-Eastern Yobe.
Those trying to flee the flames were shot. The attack of 46 dead. Mostly students, the city of
Maiduguri; was full with Boko-Haran, as they were not hiding any longer, leading to their
participating in collecting taxes, stealing and kidnapping for ransoms to enable them found
their operations. Integrated Regional Information Network (RIN) based in Kano state that
around 15,000 children in Bornu state North East Nigeria have stopped attending classes
since February 2013, which they derived the information from Bornu ministry of education.
Most of the children are primary school. While more than 50 of 175 state school have been
destroyed (IRIN 2013).
On the 9th of September 2013, 142 people were ambushed and killed by Boko-Haran
insurgency along Bornu High way. (This day 20 September 2013). Latest of the attacks was
on 29th of September 2013, where over forty students of college of Agriculture, Gujba in
Yobe state were killed on campus, while more than 150 sustained injuries this day 29th
September 2013, due to restiveness in the places as well as reduced investment and growth of
business in the affected places without excluding government executed projects.The
insecurity in Adamawa, Bornu, Yobe, Kano etc. alone has cost the Nigerian economy N1.3
trillion ($6 billion) as a result of attacks by the Boko-Haran group. It was further reported that
the report monitored on the voice of Africa (VOA) also shows that the center for research and
Documentation in Kano attributed the development to a drop in earning for nearly all
business in the affected states. Politically and socially, Governments performance that ability
to deliver its objective to its citizens was reduce while social effect on the other hand
connotes its effect on society and people way of life. The insurgency of Boko-Haran in
Nigeria has drastically reduced government of the day’s performance in the affected area.
Although, Nigerians politicians are found of promising heaven and earth, for the purpose of
gaining people’s mandate. It is in the view that president Goodluck Jonathan has not been
able to fulfill the larger parts of his promise due to confusion created in the Nation by
insurgence of Boko-Haram.It must be noted, that insurgency of Boko-Haran have made
public forum caution able place to be in some northern part of Nigeria. The activities of
Boko-Haran have aggravates to the extent of developing negative impact in the mind of some
Christian that all Muslims are extremist without taking into cognizance that extremism is
applicable to both Christianity and Islam.Educationally, schools are not left out as parent are
rejecting their children schooling in volatile north, many schools have closed down Boko-
Haran activities. Talented lecturers, teachers have abandoned their schools for another school
in another peaceful state leading to brain drained.
EFFECTS OF BOKO-HARAM

145
Ekereke (2013) opined that analysts listed numerous effects of Boko-Haram Insurgency in
Nigeria, to include economical, political and social as well as Education in Northern States of
Nigeria.
The researcher uphold these views, because the states and individuals, particularly the
residents of Adamawa, Borno, Yobe and neighboring states are seriously affected by the
activities of Boko Haram insurgency. By their nature and operations in the area the economic
activities of the states are seriously affected by the activities of Boko Haram insurgency. By
their nature and operations in the area the economic activities to the states mentioned are
dead, which led to migration of people from the affected place due to restiveness.
Thousands of people have died in the sects bloody campaign leading to closure and or
abandonment of peoples business activities within the affected region and also led to
migration of people from the affected region leading to replacement of General Andrew
Owoeye Azazi as National Security Adviser with Colonel Sambo Dasuki by President
Jonathan. He also sacked O. Opetrin as Chief of Defence Staff and elevates Rear Admiral Ola
Sa-ad Ibrahim to his position.President also sacked Ogbonna Onovo as Inspector General of
Police and replaced him with Hafiz Ringim who was subsequently sacked and replaced with
Mohammed Dahiru Abubakar.Reduction of people’s patronage of product from Northern
Region is because of rumor that members of Boko-Haram are planning to send poisonous
product from their region to other parts of Nigeria. 97 percent of businesses were negatively
affected by the Security problem. Some of them had to close down, some of them had to
retrench their workers, and others had to cut-down in the number of hours of operation.Also
the insurgency of Boko-Haram have reduced drastically government derivation from the
affected region.
Costs of Boko Haram Activities in Nigeria
Table 2.2.1: Cost of Fighting Insurgency, 2010 to 2014
S/N Year Nb Loss (Estimate)
1 2010 826.3
2 2011 920.3
3 2012 864.8
4 2013 923.5
5 2014 920.9
Source: Daily Trust, Thursday 26, 2015
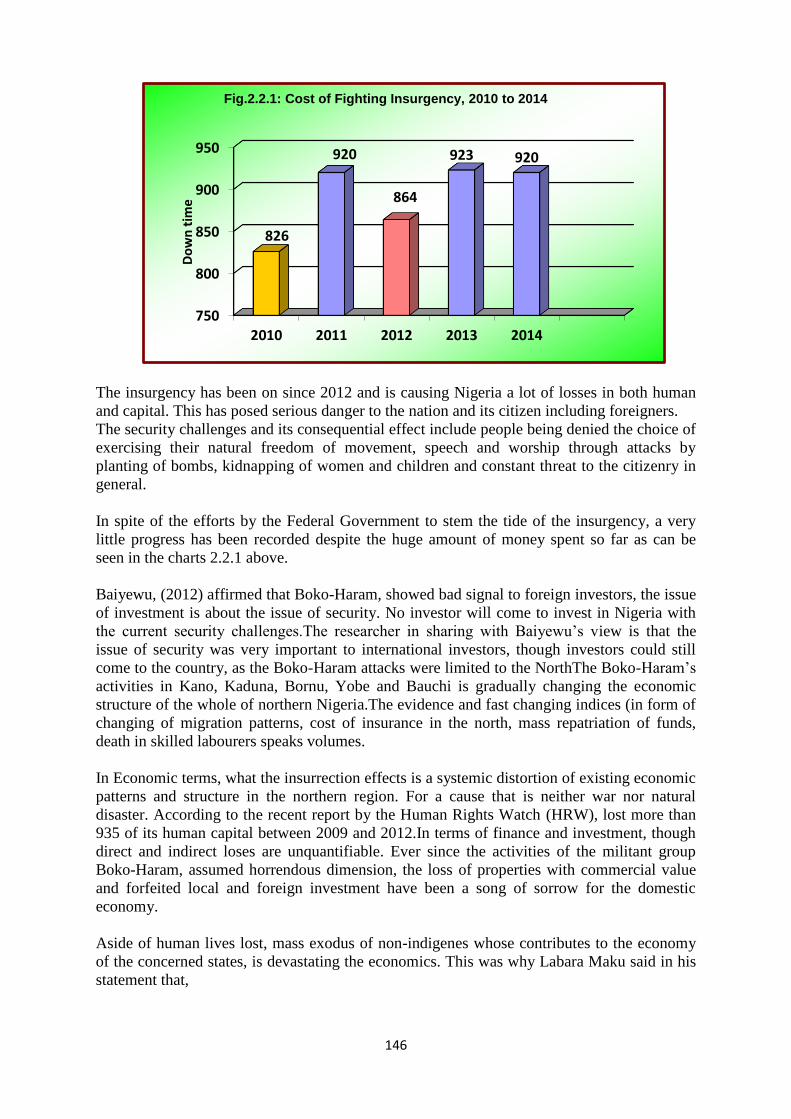
146
The insurgency has been on since 2012 and is causing Nigeria a lot of losses in both human
and capital. This has posed serious danger to the nation and its citizen including foreigners.
The security challenges and its consequential effect include people being denied the choice of
exercising their natural freedom of movement, speech and worship through attacks by
planting of bombs, kidnapping of women and children and constant threat to the citizenry in
general.
In spite of the efforts by the Federal Government to stem the tide of the insurgency, a very
little progress has been recorded despite the huge amount of money spent so far as can be
seen in the charts 2.2.1 above.
Baiyewu, (2012) affirmed that Boko-Haram, showed bad signal to foreign investors, the issue
of investment is about the issue of security. No investor will come to invest in Nigeria with
the current security challenges.The researcher in sharing with Baiyewu’s view is that the
issue of security was very important to international investors, though investors could still
come to the country, as the Boko-Haram attacks were limited to the NorthThe Boko-Haram’s
activities in Kano, Kaduna, Bornu, Yobe and Bauchi is gradually changing the economic
structure of the whole of northern Nigeria.The evidence and fast changing indices (in form of
changing of migration patterns, cost of insurance in the north, mass repatriation of funds,
death in skilled labourers speaks volumes.
In Economic terms, what the insurrection effects is a systemic distortion of existing economic
patterns and structure in the northern region. For a cause that is neither war nor natural
disaster. According to the recent report by the Human Rights Watch (HRW), lost more than
935 of its human capital between 2009 and 2012.In terms of finance and investment, though
direct and indirect loses are unquantifiable. Ever since the activities of the militant group
Boko-Haram, assumed horrendous dimension, the loss of properties with commercial value
and forfeited local and foreign investment have been a song of sorrow for the domestic
economy.
Aside of human lives lost, mass exodus of non-indigenes whose contributes to the economy
of the concerned states, is devastating the economics. This was why Labara Maku said in his
statement that,
750
800
850
900
950
2010 2011 2012 2013 2014
826
920
864
923 920
Do
wn
tim
e
Fig.2.2.1: Cost of Fighting Insurgency, 2010 to 2014
147
the attack on Kano is a significant because, the city has always been the commercial centre
of western Sudan for the past 500 years, ever before the evolution of Nigeria. So, when you
destabilize peace in Kano, you threaten the foundation of economic and social well-being of
the Northern region.
2.4. SUMMARY OF LITERATURE REVIEWED
The insurgency of Boko-Haram in Nigeria have posed serious security challenges to Nigeria
in the sense that people were been denied the choice of exercising their natural freedom of
movement due to fear of attack from members of Boko-Haram, particularly in some parts of
Northern Nigeria where Boko-Haram have taken over, through planting of bombs as well as
brutalized attack on innocent souls which history have shown that the attack is not from
Boko-Haram alone, but some group have been using the privilege to existence of Boko-
Haram to nurse their personal and ethnical agenda through brutalizing of people in support of
this assertion.
Sheikh Abu Mohammed Abdulazees Ibn Idris of Boko-Haram leader, stated that, Boko-
Haram group are aware of the fact that some criminals have infilterated their movement and
continued to attack and kill people, using their names. (The Nation Newspaper 2013:3). It
could be recalled that kidnapping have also been used by some group of people hiding under
Boko-Haram crisis, during the cause of which innocent souls were been kidnapped with
demands for ransom with fruitless effort in reserving some of the captives which have been
led to the death of members of the captives.
From all indications, it must be noted that Boko-Haram have not only led to closure and or
abandonment of peoples business activities within the affected region, but also led to
migration of people from the affected region as well as once led to reduction of people
patronage of products from Northern Region, because of rumour that members of Boko-
Haram are planning to send poisonous products from their region to other parts of Nigeria.
The consequences of which was according to Mr. Umar Ibrahim Yakubu (Leadership
Newspaper 2012) opined that 97 percent of business went negatively affected by the security
problems. Some of them had to close down, while some do retrench their
workers.Apparently, the insurgency of Boko-Haram in Nigeria has negatively affected the
relationship between regions and other nations of the world, with or without demand for
ransom particularly of the alien which have resulted to demised of some of them and have
greatly been an object of disturb not only to Nigeria but include international community.
In view of all the happening with Boko-Haram insurgency, government should put
machineries in motion to restore the people’s essential lacking, at the basic levels, so as to be
in position of acquiring the basics materials needed, such as foods and shelters, housing,
health services, safe drinking water, clothing, sanitation, facilities, education etc.
That will make the displaced people attain minimum standard of living. It is the belief that if
the basic needs are provided for the people, couple with employment; particularly, the youths,
it will surely minimize people’s desperation and frustration that made than to be available for
easy inducement for militancy and other social vices.
Methodology
The descriptive research was undertaken to describe how the issue of insurgency has affected
business activities in Northern Nigeria. The description was done in order to have a
comprehensive, convenient and workable result; with the use of questionnaire, which was

148
constructed and tested on a representative sample of the population from the dastard areas in
the Northeast of Nigeria. The questionnaire has an open and closed ended type of questions,
which also was structured for easy understanding and interpretation..The population of
2,321,339 was used as a representative population from the northern zone of the country. The
sample for the study were (300) respondents drawn from the politicians, civil servant, traders,
farmers, the self employed, investors, and the artisans, students at ages of 20-30years, 31-
36years, 37-45years, 46-50years and above. The sample population of (200) is expected to
cover the entire Northern Nigeria to ascertain the extent insurgency of Boko-Haram on
Business activities in the region.The data for the study was collected through the
instrumentality of the questionnaire techniques, oral interview, documentary evidence and
personal observations.
4.0 DATA PRESENTATION AND ANALYSIS
This section specifically presents the data generated from the structured questionnaire
complemented by the interview responses on Insurgency and Business Activities in the
Northern-Nigeria using frequency tables, charts and pictograms as well as simple percentages
with the aid of SPSS V.20.1 and Excel Spreadsheet.
Demographic Data Presentation of Respondents
Table 4.1 Sex Distribution of Respondents
Frequency Percent Valid Percent Cumulative Percent
Valid
Male 107 53.5 53.5 53.5
Female 93 46.5 46.5 100.0
Total 200 100.0 100.0
Source: Field Survey, 2016
Table 4.1 above depicts that out of 200respondents, 107 representing 53.5% are males; while
93 representing 46.5% are females. This is further shown below using pictogram.
Table 4.2 Age Distribution of Respondents
Frequency Percent Valid Percent Cumulative Percent
Valid Btw 20 to 30yrs 65 32.5 32.5 32.5
107
83
Fig. 4.1 Sex Distribution of Respodents
Male
Female
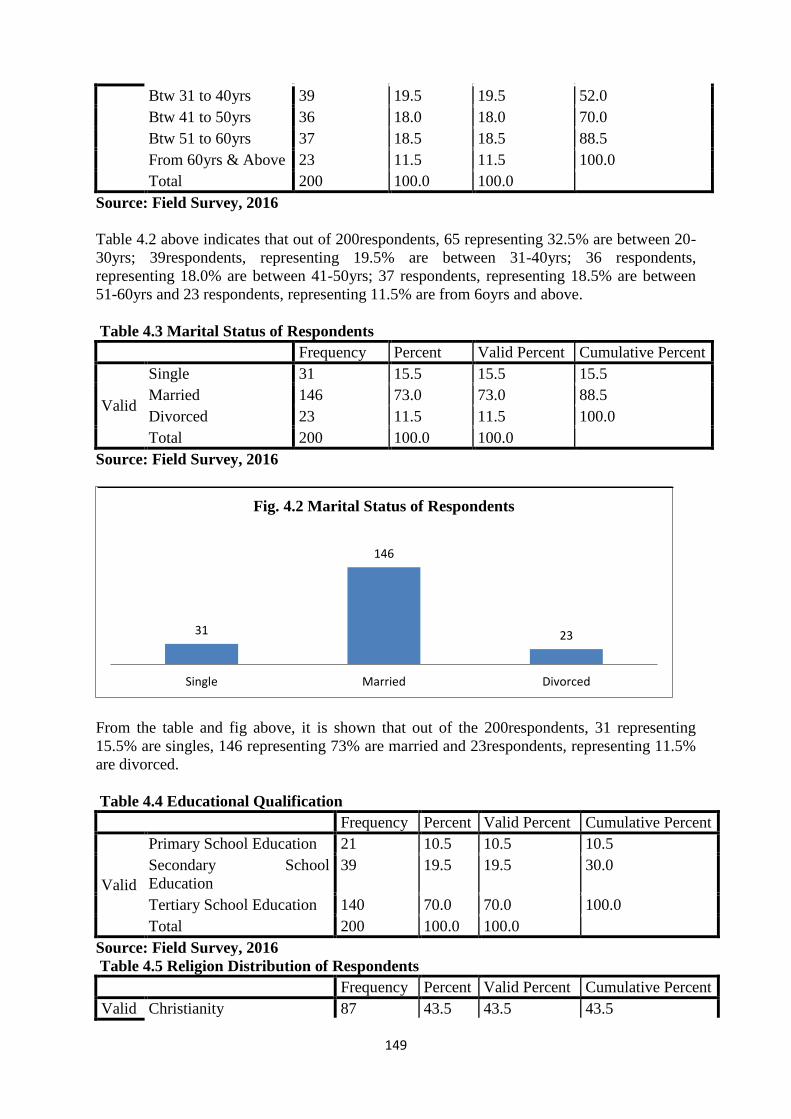
149
Btw 31 to 40yrs 39 19.5 19.5 52.0
Btw 41 to 50yrs 36 18.0 18.0 70.0
Btw 51 to 60yrs 37 18.5 18.5 88.5
From 60yrs & Above 23 11.5 11.5 100.0
Total 200 100.0 100.0
Source: Field Survey, 2016
Table 4.2 above indicates that out of 200respondents, 65 representing 32.5% are between 20-
30yrs; 39respondents, representing 19.5% are between 31-40yrs; 36 respondents,
representing 18.0% are between 41-50yrs; 37 respondents, representing 18.5% are between
51-60yrs and 23 respondents, representing 11.5% are from 6oyrs and above.
Table 4.3 Marital Status of Respondents
Frequency Percent Valid Percent Cumulative Percent
Valid
Single 31 15.5 15.5 15.5
Married 146 73.0 73.0 88.5
Divorced 23 11.5 11.5 100.0
Total 200 100.0 100.0
Source: Field Survey, 2016
From the table and fig above, it is shown that out of the 200respondents, 31 representing
15.5% are singles, 146 representing 73% are married and 23respondents, representing 11.5%
are divorced.
Table 4.4 Educational Qualification
Frequency Percent Valid Percent Cumulative Percent
Valid
Primary School Education 21 10.5 10.5 10.5
Secondary School
Education
39 19.5 19.5 30.0
Tertiary School Education 140 70.0 70.0 100.0
Total 200 100.0 100.0
Source: Field Survey, 2016
Table 4.5 Religion Distribution of Respondents
Frequency Percent Valid Percent Cumulative Percent
Valid Christianity 87 43.5 43.5 43.5
31
146
23
Single Married Divorced
Fig. 4.2 Marital Status of Respondents

150
Free-Thinker 21 10.5 10.5 54.0
Islam 78 39.0 39.0 93.0
Traditional 14 7.0 7.0 100.0
Total 200 100.0 100.0
Source: Field Survey, 2016
Table 4.6 displays the religion affiliations of respondents. It shows that out of
200respondents, 87 representing 43.5% are Christians, 21 representing 10.5% are Free-
Thinkers, 78 representing 39.0% are Muslims and 14 representing 7% are Traditionalists.
Table 4.6 Occupational Distribution of Respondents
Frequency Percent Valid Percent Cumulative Percent
Valid
Politician 17 8.5 8.5 8.5
Civil Servants 45 22.5 22.5 31.0
Traders 34 17.0 17.0 48.0
Investors 41 20.5 20.5 68.5
Security Agents 15 7.5 7.5 76.0
Farmers 35 17.5 17.5 93.5
Artisans 13 6.5 6.5 100.0
Total 200 100.0 100.0
Source: Field Survey, 2016
Table 4.7 and Fig. 4.3 (below) show that out of 200respondents, 17respondents, representing
8.5% are Politicians, 45 representing 22.5% are Civil Servants, 34 representing 17.0% are
Traders, 41 representing 20.5% are Investors, 15respondents representing 7.5% are Security
Agents, 35respondents representing 17.5% are Farmers and 13respodents representing 6.5%
are Artisans.
Table 4.7 Respondent's state
Frequency Percent Valid Percent Cumulative Percent
Valid Borno 64 32.0 32.0 32.0
17
45
3441
15
35
13
Fig. 4.3 Occupational Distribution of Respondents
Politicians
Civil Servants
Traders
Investors
Security Agents
Farmers
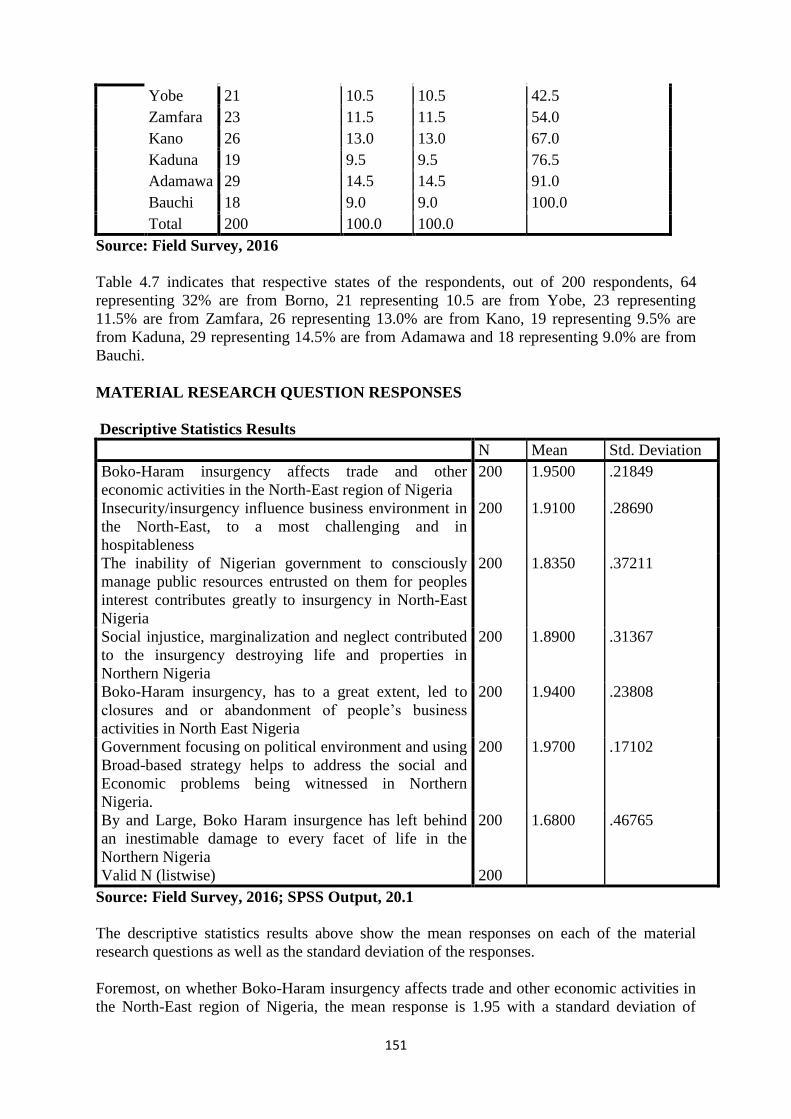
151
Yobe 21 10.5 10.5 42.5
Zamfara 23 11.5 11.5 54.0
Kano 26 13.0 13.0 67.0
Kaduna 19 9.5 9.5 76.5
Adamawa 29 14.5 14.5 91.0
Bauchi 18 9.0 9.0 100.0
Total 200 100.0 100.0
Source: Field Survey, 2016
Table 4.7 indicates that respective states of the respondents, out of 200 respondents, 64
representing 32% are from Borno, 21 representing 10.5 are from Yobe, 23 representing
11.5% are from Zamfara, 26 representing 13.0% are from Kano, 19 representing 9.5% are
from Kaduna, 29 representing 14.5% are from Adamawa and 18 representing 9.0% are from
Bauchi.
MATERIAL RESEARCH QUESTION RESPONSES
Descriptive Statistics Results
N Mean Std. Deviation
Boko-Haram insurgency affects trade and other
economic activities in the North-East region of Nigeria
200 1.9500 .21849
Insecurity/insurgency influence business environment in
the North-East, to a most challenging and in
hospitableness
200 1.9100 .28690
The inability of Nigerian government to consciously
manage public resources entrusted on them for peoples
interest contributes greatly to insurgency in North-East
Nigeria
200 1.8350 .37211
Social injustice, marginalization and neglect contributed
to the insurgency destroying life and properties in
Northern Nigeria
200 1.8900 .31367
Boko-Haram insurgency, has to a great extent, led to
closures and or abandonment of people’s business
activities in North East Nigeria
200 1.9400 .23808
Government focusing on political environment and using
Broad-based strategy helps to address the social and
Economic problems being witnessed in Northern
Nigeria.
200 1.9700 .17102
By and Large, Boko Haram insurgence has left behind
an inestimable damage to every facet of life in the
Northern Nigeria
200 1.6800 .46765
Valid N (listwise) 200
Source: Field Survey, 2016; SPSS Output, 20.1
The descriptive statistics results above show the mean responses on each of the material
research questions as well as the standard deviation of the responses.
Foremost, on whether Boko-Haram insurgency affects trade and other economic activities in
the North-East region of Nigeria, the mean response is 1.95 with a standard deviation of

152
0.21849. This implies that, virtually all the respondents agreed to the statement. The
respondents’ position agrees with the scholarly views of previous authors such as Awortu
(2015), Salisu et al. (2015) and Alao, Atere and Alao (2012) etc who asserted that Boko-
Haram activities have wrecked the existing and prospective businesses (through mass
destruction of lives and properties) and causing traders and investors to relocate to other parts
of the country or outside the country, thus, putting the economy in doldrums.
Similarly, the mean score of 1.91 with a standard deviation of 0.28690 indicates that the
respondents were virtually unanimous in their perspective that Insecurity/insurgency
influence business environment in the North-East, to a most challenging and in
hospitableness. Available literary evidence from Alao, Atere and Alao (2012), Ohiwerei
(2014) and Emeasoba and Iro (2015) that there is no gaining saying that no investors would
prefer to invest in a crisis ridden nation. It further compounded the problems associated with
the relocation of Multinational Companies to safer territories in Africa like Ghana due to
infrastructural decay.
More so, the respondents expressed unanimous view (as shown by the mean response of
1.8350 with a standard deviation of 0.372111) on the statement that the inability of Nigerian
government to consciously manage public resources entrusted on them for peoples interest
contributes greatly to insurgency in North-East Nigeria. This view have been earlier
expressed by authors such as Duru and Ogbonnaya (2010), Olaide (2013) and confirmed by
Imaji, Ranjit and Muhammad (2015) that the unbridled bribery and corruption cum
lackadaisical that have become institutionalized activity of all governmental functions
heralded the insurgency. According to Olaide (2013) if these entrusted resources have been
use for the benefit of the whole Nigerians, youth would not be available for easy inducement
for militancy and other social vices.
Furthermore, on whether Social injustice, marginalization and neglect contributed to the
insurgency destroying life and properties in Northern Nigeria, the mean score of 1.8900 with
a standards deviation of 0.31367, depicts that the respondents agreed wholly to the statement.
Literary evidence also has it that Boko Haram has deep roots in the social and economic
marginalization of a large section of the northern states’ population (Olaide, 2013,
Muhammad, 2014 and Imaji, 2015).
From the statement on whether Boko-Haram insurgency has to a great extent, led to closures
and or abandonment of people’s business activities in North East Nigeria, the mean response
is 1.9400 with a standard deviation of 0.23808. This implies that larger percentage of them
agreed. No wonder Mr Umar Ibrahim Yakubu (Leadership Newspaper: 2012) opined thus in
respect of Boko Haram: We discovered that 97 per cent of businesses were negatively
affected by the security problem. Some of them had to close down, some of them had to
retrench their workers, and others had to cut down in the number of hours of operation. This
view is also supported Chukwurah, Eme and Ogbeje (2015) and Awortu (2015).
Lastly, on whether the government focusing on political environment and using Broad-based
strategy helps to address the social and Economic problems being witnessed in Northern
Nigeria, the mean response of 1.68 with a standard deviation of 0.46765 indicates that the
respondents unanimously agreed to the statement. This view has been earlier expressed by
Eme and Ibietan (2012) and McQuaid and Asfura-Heim (2015) that Boko-Haram attacks
have increased tremendously and more sophisticated over the last few years and eliminating
the Boko Haram problem will require a broad-based strategy that employs the establishment
of a comprehensive plan rather than the imposition of more martial law.
153
4.1 THE RESULTS AND DISCUSSION OF FINDINGS
The results from the analysis of data based on the reactions received from the respondents
with the use of questionnaire methods and oral interviews, reveals that all the research
questions tested were accepted accordingly. It further revealed ;
(1) That, the table III of the study analysis on research I, indicated that the majority of the
sample population of 179 or 89.5% the respondents, as against 21 or 10.5% who
opposed the research, agreed that for government to develop a new social compact and
economic recovery strategy, with the traditional rulers and the citizenry in the North
East will obviously fix the insurgency Boko-Haram.
(2) That the table IV of the study analysis of research question II, indicated that 165 or
82.5% of the sample population agreed as against 17.5% that the persistences of Boko-
Haram insurgency has affected significantly trade/investments and other economic
activities in the Northern region.
(3) That the table X of the study analysis of research question III, depicts that 165 or 82%
of the respondents were of the view that the insecurity and insurgency influences
business environment in the North East to a most challenging and inhospitableness
whereas 18 or 9% of the sample study opposed the idea.
(4) The table XI of the analysis of research question IV, indicates that the sample
population of 168 or 84% admitted the fact that the inability of Nigerian government to
consciously manage public resources entrusted on them for peoples interest contributes
greatly to insurgencies activities in North East Nigerian whereas 32 or 16% disagreed,
with the majority view.
(5) The table XII of the study analysis of the research question V, indicates that the
respondents of 160 or 80% as against 40 or 20% admitted the idea that social injustice,
marginalization and neglect, contributed to the insurgency’s destroying life, and
properties in Northern Nigeria.
(6) The table XIII of the study analysis of research question VI shows that 170 or 85% of
the respondent agreed that to a every large extent, the Boko Haram insurgency leds to
closure and or abandonment of people’s business activities in the North East Nigeria,
and 30 or 15% disagreed, stressing that it is to a small extent.
(7) The table XIV of the study analysis of research question VII, equally reveals that the
sample population of 175 or 87.5% as against 25 or 12.5% were of the view that
government focusing on political environment and use Broad-Based Strategies will
help to address the social and economic problems being created and witnessed in
Northern Nigeria.
RECOMMENDATIONS
(1) Government should consider creating a Ministry of Northern Affairs or a Northern
Development Commission to what it did in response to the crisis in the Niger Delta.
(2) To resolve the problems in Northern Nigeria, government should act more stiffly and to
make a strategic course correction.

154
(3) The government needs to adopt a comprehensive strategy and remain discipline and
committed in its implementation.
(4) Nigeria needs to be defined by its promise and its enormous potentials, as well as
resourcefulness of its people.
(5) The government also need to develop and economic recovery strategy that complements
its security strategy.
(6) The government has to draw the support of the Northern governors, traditional Hausa and
Fulani leaders and local officials and organizations.
(7) The government must address the social and Economic problems that have created the
environment in which Boko-Haram thrives.
(8) The government must also improve its tactics; avoid excessive violence and human right
abuses.
(9) There should be involuntary re-education of basic beliefs and values, which is the root
cause of terrorism.
(10) The army should improve on the ability to gather information and dispense to appropriate
quarters in order to be able to protect the civil population.
(11) The security agents must be serious to man the borders and forestall every move and
attempts to smuggle in ammunitions.
(12) Nigeria should also co-ordinate between her soldiers and that of neighboring West Africa
nations bordering Nigeria, as a way of preventing the insurgents from launching attacks
from outside the Nigerian territory.
(13) There should be viable reorientation on the side of the Muslim extremists who have
seized to see Western Education as sin hence these attacks on schools.
(14) The government must carry out a proactive and pragmatic approach to and insurgency
menace and to employee the unemployed ones and offer education to these non educated
ones.
(15) Each school in the Northern Nigeria should have security present, as killings are being
noticed unabated.
CONCLUSIONS
It is of no doubt that different set of militants group have emerged in Nigeria, with Boko-
Haram leading for prawn. It has been established that insurgency of Boko-Haram have posed
serious challenges to this nation, which have briefly been highlighted-insurgency in Nigeria.
Thought the main drive behind formation of all these ethnic militant are social injustice,
marginalization, neglect, deprivation and the seemingly insecurity for the people.It is
therefore believed that Nigerian insurgency can be drastically be reduced if the issues of

155
poverty, alienated intelligentsia, in detonation, ethnocentrism, charities giving with different
motives, porosity of Nigeria borders, license of clerics, accreditation of religious schools,
joint border patrol, job creation, poverty and modernize military tactics and treated with
utmost importance, and addressed will the issue of insurgency will be a forgotten
issues.These will make Nigeria peaceful and there wouldn’t be any reason for any insurgents
group to come up again.The researcher is optimistic that if all the recommendations are
strictly adhered to, the issue of insurgent will be over; especially when exercising caution in
dealing with foreign interests. This is true, because since the end of the civil war, no calamity
of enormous proportion has befallen the fledging nation-state more than the harrow unleashed
by the dreadful sect, Boko-Haram. Many lives have been lost, property worth billions of naira
have been destroyed. Nobody is insulated from the attack. The government officials and
buildings, traditional rulers, police and military formations and church worshippers are
targets.Therefore,all Nigerians should be their brother’s keeper to stop this ugly menace.
REFERENCES
1. Abimbola, J.O. and Adesote, S.A. (2012): Domestic Terrorism and Boko-Haram
Insurgency in Nigeria: Issues and trends. A Historical Discourse. The Journal of Arts and
Contemporary Society: Vol. 4 September 2012.
2. Alao, D. O., Atere, C. O. and Alao, O. (2012).Boko-Haram Insurgency in Nigeria: The
Challenges and Lessons. Singaporean Journal of Business Economics, and management
studies Vol.1, No.4
3. Awortu, B. E. (2015). Boko Haram Insurgency and the Underdevelopment of Nigeria.
Research on Humanities and Social Sciences, vol. 5, No. 6
4. Baiyewu, L. (2012): Boko-Haram; Bad Signal to foreign investors. Sunday Punch
Newspaper, January 29th Page 9.
5. Chukwurah, D. C.; Eme, O. and Ogbeje E. N. (2015). Impications of Boko-Haram
Terrorism on Northern-Nigeria. Mediterranean Journal of Social Sciences, vol. 6, No. 3
6. Duru, E. J. C and Ogbonnaya, U. M. (2010), Globalization, International Security and
National Security Challenges, Kogi Journal of Politics, 1(1), 1 – 9.
7. Dyke, V.V. (1969): Political Science: A Philosophical Analysis. Stanford University
Press U.K.
8. Ekereke, Anieflok Silas (2013): The effect of Boko-Haram Insurgency and the school
system. A case study of selected states in Northern Nigeria. The science journal of
sociology and Anthropology.
9. Eme, O. I. and Ibietan, J. (2012). The Cost of Boko-Haram Activities in Nigeria. Arabian
Journal of Business and Management Review (OMAN Chapter) Vol. 2, No.2
10. EMe, O.I. et al (2012): Activities of Boko-Haram and insecurity question in Nigeria.
AJBMR Vol. 1. 9 April PP 77-99
11. Eme. OKechukwu Innocent Jide, Ibietan (2012): The cost of Boko-Haram activities in
Nigeria. The Arabian Journal of Business and Management Review (OMAN) Chapter 1
Vol. 2. No. 2 Sept.
12. Emeasoba, N. C. and Iro, D. M. (2015). Boko Haram Activities: A Threat To Business
Education In Northern Nigeria. International Educative Research Foundation and
Publisher
13. Imaji, Z.; Ranjit, S. D. S. and Muhammad, F. O. (2015). Governance and Boko Haram
Insurgents in Nigeria: An Analysis. Academic Journal of Interdisciplinary Studies, vol. 4.
No. 2
14. Itodo, Simon Ikoojo (2013): Effect of Boko-Haram and Profound Solution to Insurgency
in Nigeria, UN Mandated University of Peace, Costa Rica. http://www.bond.org.
uk/pages/charities and Terrorism. html.

156
15. McQuaid, J. and Asfura-Heim, P. (2015). Rethinking the U.S. Approach to Boko Haram:
The Case for a Regional Strategy. Retrieved from
https://www.cna.org/CNA_files/PDF/DRM-2014-U-009462-Final.pdf
16. Mohammed, D. (2014). The Effects of Boko-Haram Crisis on Socio-Economic Activities
in Yobe State. The International Journal of Social Sciences and Humanities Invention,
Volume 1 issue 4
17. New York Times (2014): Explaining Boko-Haram. Nigeria’s Islamist Insurgency.
NYTIMES.Com http://www.nytimes.com/2014/11/11/world/africa/boko-haram-in -
Nigeria. html? 1=0
18. Nwachukwu, I (2012): Boko-Haram Insurance, Security Challenges and the quest for
FO1S.O Business Day Thursday 29th March Page 47.
19. Ohiwerei, F. O. (2014). Effects of Boko Haram Insurgency/Terrorism in Business
Education in Nigerian Universities. Scholarly Journal of Education Vol. 3(9), pp. 163-171
20. Okereocha , C. (2012): Heartahe for the Economy. Tell Magazine, May 14th PP. 46-47
21. Olaide, I. A. (2013). Boko Haram Insurgency in Nigeria: Its Implication and Way
Forwards toward Avoidance of Future Insurgency. International Journal of Scientific and
Research Publications, Volume 3, Issue 11
22. Olaide, Ismail Aro (2013): Boko-Haram Insurgency in Nigeria: its implications and way
forward towards avoidance of future insurgency. The International Journal of Scientific
and Research Publicatioins VOl. 3 Issue 11, Nov.
23. Segun, Oshinowo (2015): Insecurity is shrinking Business activities in Nigeria. NECA
TELLS FG. The Punch Friday 26th March 2015 file:iiic:/users/FMWASD/w/
APPData/Loal/Temp/Low/1FPP7EPT.htm.
Appendix 1
RESPONDENT’S DEMOGRAPHIC PROFILE
1. Gender : Male [ ] Female [ ]
2. Age: 20-30yrs [ ] 31-40yrs [ ] 41-50yrs [ ] 50- 60yrs [ ] 60yrs & Above
[ ]
3. Marital Status: Single [ ] Married [ ] Divorced [ ]
4. Religion: Christianity [ ] Free-Thinker [ ] Islam [ ] Traditional [ ]
5. Educational Qualification: Primary School Education [ ] Secondary School Education [ ]
Tertiary School Education [ ]
6. Occupation: Politicians [ ] Civil servants [ ] Traders [ ] Investors [ ]
Security Agents [ ] Farmers [ ] Artisans [ ]
7. Respondent’s state: Borno [ ] Yobe [ ] Zamfara [ ] Kano [ ]
Kaduna [ ] Adamawa [ ] Bauchi [ ]
RESPONSES TO RESEARCH QUESTIONS
8. Boko-Haram insurgency affects trade and other economic activities in the North-East
region of Nigeria?
Agreed [ ] Disagreed [ ]
9. Insecurity/insurgency influence business environment in the North-East, to a most
challenging and in hospitableness?
Agreed [ ] Disagreed [ ]
10. The inability of Nigerian government to consciously manage public resources
entrusted on them for peoples interest contributes greatly to insurgency in North-East
Nigeria?
157
Agreed [ ] Disagreed [ ]
11. Social injustice, marginalization and neglect contributed to the insurgency destroying
life and properties in Northern Nigeria.
Agreed [ ] Disagreed [ ]
12. Boko-Haram insurgency, has to a great extent, led to closures and or abandonment of
people’s business activities in North East Nigeria?
13. Government focusing on political environment and using Broad-based strategy helps
to address the social and Economic problems being witnessed in Northern Nigeria.
Agreed [ ] Disagreed [ ]
14. By and Large, Boko Haram insurgence has left behind an inestimable damage to
every facet of life in the Northern Nigeria.
Agreed [ ] Disagreed [ ]
INTERVIEW QUESTIONS
1. Does the action of the Boko-Haram insurgency destabilize the business activities within
the Northern hemisphere in Nigeria? In what way(s) pls?
2. How could government develop a new social compact and economic recovery strategy
with the traditional rulers in the North to fix Boko-Haram insurgency
158
INTERNATIONAL BUSINESS AS A CATALYST FOR GLOBAL INTEGRATION IN
SUB-SAHARA AFRICA
Onyeukwu Pauline Ebere Phd, Aminu Amed Ph.D and Benedict N Akanegbu Phd
Nigerian Turkish Nile University
Abstract
The paper examines International business as a catalyst for integration in sub-Sahara Africa.
It verifies how the treaties which emphasis solidarity, self-reliance and
endogenousdevelopment strategy can enhance international business as a catalyst
forintegration in sub-SaharaAfrica. To alsoidentify the extent market integration, monetary
and fiscal matters promote economic union to help internal business as a catalyst for
integration in Africa.Data was collected via questionnaires, oral interview and documentary
evidence. Two hundred respondents was drawn randomly from the population of 800
business men and women from three African countries;Nigeria,Ghana and Cotonue.Some
challenges were discovered; like language barrier, poor road network, differences in
currency and so on. The study also discovered that African integration focus more on tariff
liberalization at the individual level. There is also increase in African regional integration
which if properly managed could create larger markets, improve economies of scale and
reduce transaction costs for local, regionaland globaltrade. This accounts for the reason why
African countries focus on presidential development, globalhealth, feed the future and
climate change initiatives. The study recommends that there should be new policy
instruments among the African countries to deal with the fear of economic polarization.
African countries should have a common currency to help them for easy exchange of goods
and services. The dispute settlement mechanisms need to be strengthened. There should also
be ways to ensure policy credibility among all the sub-Sahara Africa.
Key words: Africa, Business, Catalyst, International, Integration and Sub-Sahara
Introduction
International business could serve as a unifying variable for global integration in sub-Sahara-
Africa; observing that many of the recognized constraints to the growth of African economics
are on the supply-side of economic activity, that is, in building a business sector that can
respond to improved market access by investing in the production of tradable goods and
services having faced some challenges which relates to enhancing supply-side capacity
including improving the quality of governance, developing institutional capacity investing in
infrastructure and developing the associated regulatory infrastructure and to create a business
environment that would support domestic business to develop and in encouraging foreign
direct investment (McCarthy 2007).
Hartzenmberg J. (2011) reiterated that regional integration is a kind of rational response to
the difficulties faced by a continent with many small national markets and landlocked
countries, as such there is much support from the African governments for regional
integration as an important component of their development strategies. This was why a
deeper integration agenda such as service investment, completion policy and other behind the
border issues address the national level supply- side constraints far more effectively than an
agenda which focuses almost exclusively on boarder measures. Therefore, there is a large
body of empirical evidence that Global economic integration and trade liberalization, easy
tariff and other important restrictions as well as reduction or diminutions of domestic
159
supports and export subsidies, which tends to boost economic growth at least in the longer
term. This from all indications helps to reduce the number of persons living in absolute
poverty (dollar and kracy 2000), though (UNCTAD, 2007) pointed out that African country’s
engages at the periphery of the global economy as is evident from the continents declining
share in global production and trade, because the countries have low per capita income levels
and with small populations which results in small markets. In short, Africa is an increasingly
critical market that cannot be ignored by international business. Its major deficiencies in the
core enabling infrastructure are hampering its economic growth, with the unreliable power
supply and transmission networks, followed by inefficient ports, badly maintained and
congested high ways, lack of clean water and sanitation facilities together with the limited
regional connectivity. These problems create additional challenges for local and international
investors to do business in Africa.
1.2 The Statement of The Problem
There are some challenges of carrying out business activities in sub-Sahara Africa,like;means
of transportation, import duties, different currency and so on. Also to access the way to
provide economic integration by allowing members states to enter into an agreement to
liberalize trade in services subject to specific conditions. This is because the neglect of the
trade in service agenda is somewhat ironic in Africa where infrastructure service such as
transport and telecommunications adversely affect the costs of doing business and poses
obvious challenges to the regional and continental integration. In most African economics,
the provision of fixed line phone services is still exclusively in the hands of public
monopolies. Therefore, as information is essential to facilitate efficient market outcomes, the
lack of the readily available information at reasonable cost tends to hamper market efficiency
as a result of high or hidden trade transaction costs which now threatens the integration of the
international business-in Africa.
Objectives of the Study
To ascertain whether treaties emphazing solidarity, self-reliance and development
strategy are factors encouraging integration of international business in sub-Saharan
Africa.
To examine if lack of skills, education and capital to operate modern communication
system affects efforts to integrate international business in the sub-Saharan Africa.
To determine if regional integration characterized by small countries, small
economics, and small market enhances integration of the international business in
sub-Saharan Africa.
To access whether increase in prosperity on invocations, creativity, strong intellectual
property systems focusing on new, global markets elevates integration of
international business in sub-Saharan Africa.
To identify the extent market integration / monetary and fiscal matters promotes
economics union, encourage the integration of international business in sub-Saharan
Africa.
1.3 Research Questions
Does treaties which emphasizes solidity, self – reliance and endogenous development
strategy encourages integration of international business in sub-Saharan Africa?
Does lack of skills, education and capital to operate in modern communication
systems affects the integration of international business in sub-Saharan Africa?
160
Do regional integration characterized by small countries, small economics and small
market possible in international business in sub-Saharan Africa?
Does increase in prosperity on innovations, creativity, strong intellectual property
systems, focusing on new global markets enhances integrations in international
business in sub-Saharan Africa. ?
To what extent does integration / monetary and fiscal matters which promotes
economics union significantly leads to integrations of international business in sub-
Saharan Africa.?
Literature Review
The ultimate objective of the review is to enrich the writer’s knowledge on what other re-
iterators and professionals and academicians asserted in their books, journals and webs in
relations to international business integration in the sub-Saharan African. This is because
African continent is increasingly becoming the global common hub for doing business, the 55
states; the continent of Africa presents endless business opportunities, from new oil and gas
discoveries across the region, huge growth in mobile banking and mobile technology and
under-developed tourism potentials. These has given rise to an ever increasing pace of
urbanization and the opening of new consumer markets as Africans exploding middle class
comes into unprecedented disposable income.Economics commission for Africa (2004)
asserted that market integration initiative have traditionally been the hallmark of African
integration, with much focus on tariff liberalization at the individual RIA levels.
History of African Legal Framework
The study is being focused on African constituency. The sub-Saharan Africa is one of the
world’s fastest growing economic regions: and is showing signs of becoming a hub for
innovations. Many sub-Saharan implementations of various initiatives and programmes such
as Rwandan endowment fund aimed at furthering innovation in manufacturing and
agriculture. The African continent is increasingly becoming the global common hub for doing
business. This has created outstanding opportunity, across its 55 states, the continent of
Africa presents endless business opportunities from new oil and gas discoveries across the
region, huge growth is mobile banking and mobile technology and developed tourism
potentials, indicates that Africa is on a growth trajectory and not to be ignored by
international business. It was the Democratic Republic of the Congo’s accession that brought
the members of African state to share a common commercial legal framework to it. The
regional integration is a response to the marginalized economies. This accounts for why the
SSA regional integration agenda has less emphasis on tariff liberalization
Concepts on Integration of International Business
African countries have contributed to the proliferation of regional trade agreements, a
defining feature of global economic governance in recent decades. The market integration
initiatives have traditionally been the hallmark of African integration, with much focus on
tariff liberalization at the individual level. Infrastructure development, especially sector
development initiatives and the cross-border projects) has featured on the regional co-
operation agenda. Although, most of African countries have low per capita income levels and
small populations which results in small markets; the resultant of which is the small domestic
markets and continental fragmentation which was translated into lack of scale economics in
161
the production and distributions of goods and services. In spite of these, political motivation
for religion integration played on important role in African integration.
These was why the sub-Saharan African economics undertake structural changes towards
value addition and diversification which made market access and entry issues to affect their
products that remains important in their traditional market access conditions for SSA have
improved over the years through provisions of trade preferences by both developed and
emerging economies, and from tariff being reduced through multilateral and regional
agreements and the autonomous action.
African leaders to Integrate business in SSA
Hartzenberg (2011), reiterated that the ambition of African leaders to integrate African and to
develop the continent through import substitution industrialization was a key feature of the
immediate post-colonial period which provided the rationale for Lagos Plan of Action
(LPA).The proposed framework for African integration and continent into regional
integration areas that would constitute a united African economy. This strategic plan
articulates the roadmap for integration and provides for the establishment of a free trade area
by 2008, a customs union in 2010, a common market in 2015, monetary union market 2016,
and the introduction of a single currency in 2018. The essence of which was to transform the
African economic landscape and to establish over a period of just more than three decades a
strong united bloc of nations (Economic Commission for Africa, 2014).
Key Processes to sustain Economic Growth in SSA.
Sindzuirpre (2011), said that a change in trade composition coupled with industrialization and
improvement in infrastructure, and structural transformation, would be triggering sustainable
growth paths in sub Saharan Africa to ensure an international business integration.
The researcher equally upload the views of the writer because the developing economies are
witnessing a growing trend over time and has contributed 29.5 percent of economies to global
exports in 1980, which increased to 42 percent in 2010.
Global Economic Integration and Trade Liberalization
Dollar and Kraay (2000) opined that there is a large body of empirical evidence which
showed that global economic integration and trade liberalization are easing tariff and other
important restrictions as well as reducing or eliminating domestic growth and reductions in
member of persons living in absolute poverty. The researcher in her reactions, is optimistic
that with the trends of development, the economies of the sub-Saharan Africa are among the
world’s most rapidly growing due to their efforts in addressing issues about economic
integration by taking a leading role in addressing the security and the political challenges
within their borders and beyond and this act has influenced players in international force.
This was why the U.S president, Obama in his speech before the Ghanaian parliament in July
2009, that Africa is one of the fundamental part of the interconnected world, and appeal for
the partnership with Africa that are grounded in mutual responsibility and mutual respect.
It was in relationship to the economic integration in sub-Saharan Africa, that the united state
agrees to partner with the sub-Saharan African countries to pursue the following
interdependent and mutually reinforcing objective, such as strengthening democratic
institution, spurring economic growth, trade, and investment, advance peace and security, and
to promote opportunity and development because the sub-Saharan Africans due to the extent
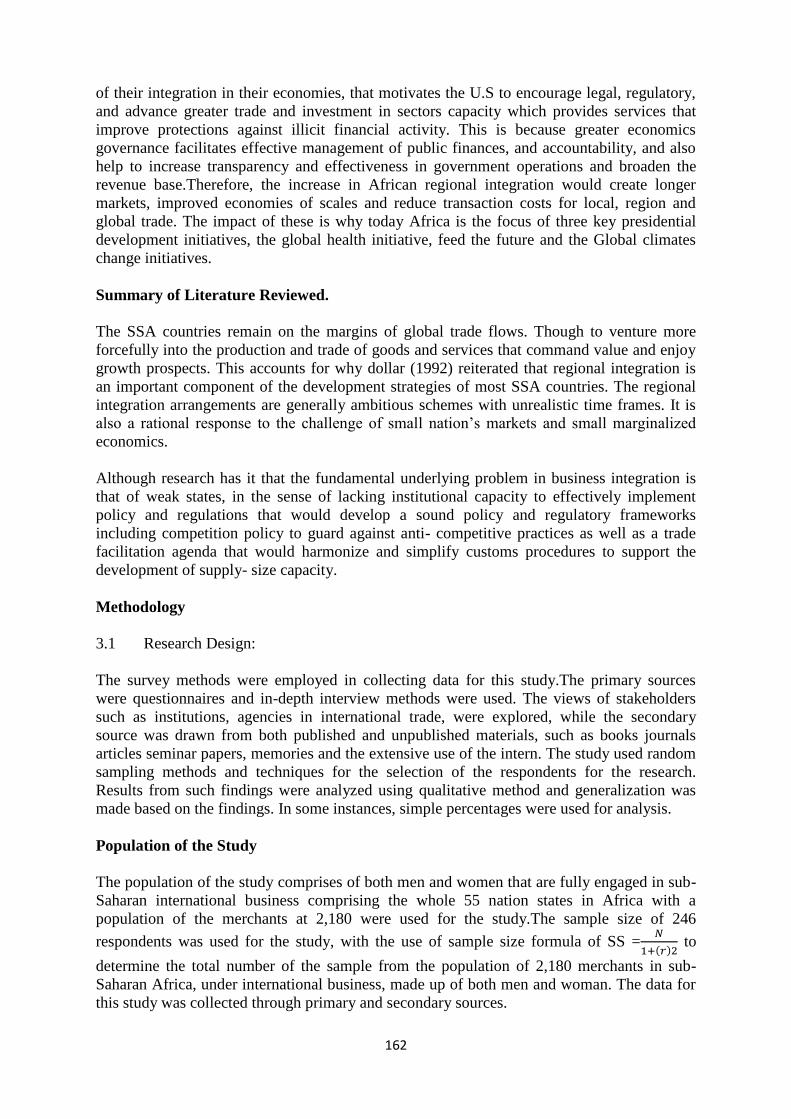
162
of their integration in their economies, that motivates the U.S to encourage legal, regulatory,
and advance greater trade and investment in sectors capacity which provides services that
improve protections against illicit financial activity. This is because greater economics
governance facilitates effective management of public finances, and accountability, and also
help to increase transparency and effectiveness in government operations and broaden the
revenue base.Therefore, the increase in African regional integration would create longer
markets, improved economies of scales and reduce transaction costs for local, region and
global trade. The impact of these is why today Africa is the focus of three key presidential
development initiatives, the global health initiative, feed the future and the Global climates
change initiatives.
Summary of Literature Reviewed.
The SSA countries remain on the margins of global trade flows. Though to venture more
forcefully into the production and trade of goods and services that command value and enjoy
growth prospects. This accounts for why dollar (1992) reiterated that regional integration is
an important component of the development strategies of most SSA countries. The regional
integration arrangements are generally ambitious schemes with unrealistic time frames. It is
also a rational response to the challenge of small nation’s markets and small marginalized
economics.
Although research has it that the fundamental underlying problem in business integration is
that of weak states, in the sense of lacking institutional capacity to effectively implement
policy and regulations that would develop a sound policy and regulatory frameworks
including competition policy to guard against anti- competitive practices as well as a trade
facilitation agenda that would harmonize and simplify customs procedures to support the
development of supply- size capacity.
Methodology
3.1 Research Design:
The survey methods were employed in collecting data for this study.The primary sources
were questionnaires and in-depth interview methods were used. The views of stakeholders
such as institutions, agencies in international trade, were explored, while the secondary
source was drawn from both published and unpublished materials, such as books journals
articles seminar papers, memories and the extensive use of the intern. The study used random
sampling methods and techniques for the selection of the respondents for the research.
Results from such findings were analyzed using qualitative method and generalization was
made based on the findings. In some instances, simple percentages were used for analysis.
Population of the Study
The population of the study comprises of both men and women that are fully engaged in sub-
Saharan international business comprising the whole 55 nation states in Africa with a
population of the merchants at 2,180 were used for the study.The sample size of 246
respondents was used for the study, with the use of sample size formula of SS =𝑁
1+(𝑟)2 to
determine the total number of the sample from the population of 2,180 merchants in sub-
Saharan Africa, under international business, made up of both men and woman. The data for
this study was collected through primary and secondary sources.

163
Data Analysis and Discussion of Findings
This section descriptively analyzed the data obtained from responses after its quantification
and subsequently discussed the results that emanates therefrom.
Demographic Characteristics of Respondents
Table 1 Sex Distribution of Respondents
Frequency Percent Valid Percent Cumulative Percent
Valid
Male 121 60.5 60.5 60.5
Female 79 39.5 39.5 100.0
Total 200 100.0 100.0
Source: Field Survey, 2016
From Table 1, 121 (or 60.5%) of the respondents are Males; while 79 (or 39.5%) of the
respondents are Females.
Table 2 Age Distribution of Respondents
Frequency Percent Valid Percent Cumulative Percent
Valid
Btw 30-40yrs 56 28.0 28.0 28.0
Btw 41-50yrs 50 25.0 25.0 53.0
Btw 51-60yrs 73 36.5 36.5 89.5
From 61yrs & Above 21 10.5 10.5 100.0
Total 200 100.0 100.0
Source: Field Survey, 2016
From Table 2, 56 (or 28.0%) of the respondents are between 30-40yrs; 50 (or 25.0%) are
between 41-50yrs, 73 (or 36.5%) of the respondents are 51-60yrs and 21 (or 10.5%) of the
respondents are from 61yrs and above.
0 20 40 60 80 100 120 140
Male
FemaleFig. 1 Respondents' Sex Distribution
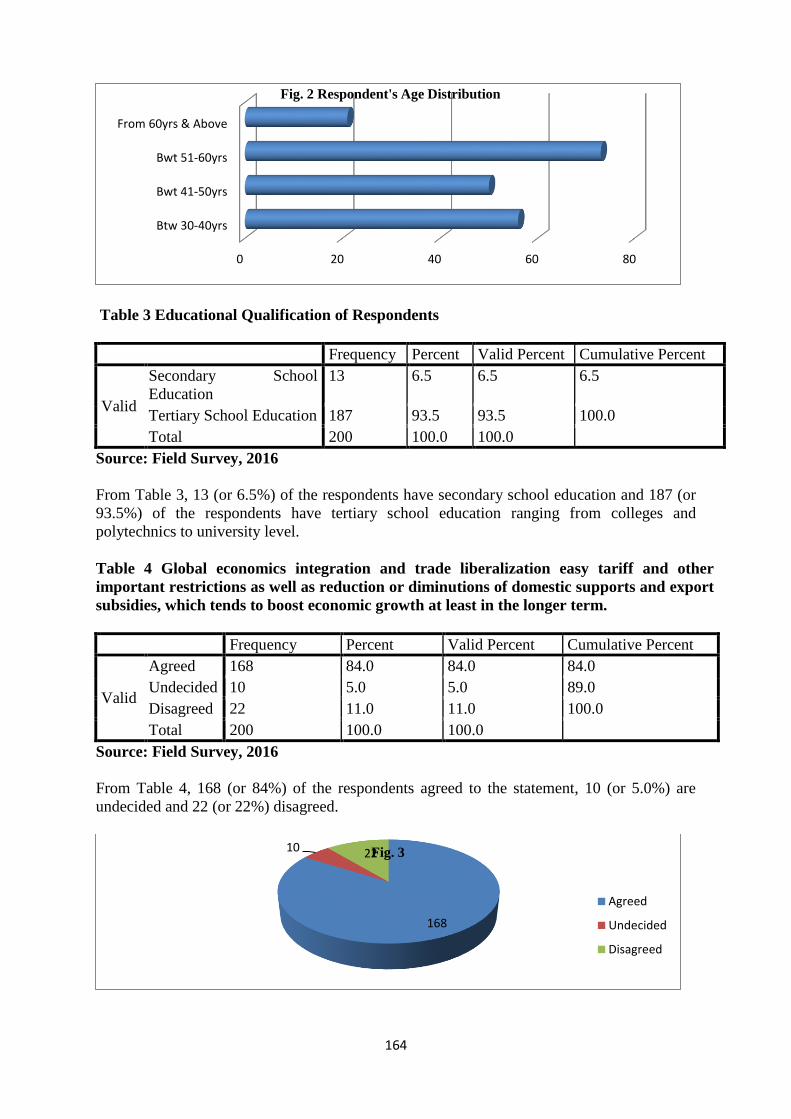
164
Table 3 Educational Qualification of Respondents
Frequency Percent Valid Percent Cumulative Percent
Valid
Secondary School
Education
13 6.5 6.5 6.5
Tertiary School Education 187 93.5 93.5 100.0
Total 200 100.0 100.0
Source: Field Survey, 2016
From Table 3, 13 (or 6.5%) of the respondents have secondary school education and 187 (or
93.5%) of the respondents have tertiary school education ranging from colleges and
polytechnics to university level.
Table 4 Global economics integration and trade liberalization easy tariff and other
important restrictions as well as reduction or diminutions of domestic supports and export
subsidies, which tends to boost economic growth at least in the longer term.
Frequency Percent Valid Percent Cumulative Percent
Valid
Agreed 168 84.0 84.0 84.0
Undecided 10 5.0 5.0 89.0
Disagreed 22 11.0 11.0 100.0
Total 200 100.0 100.0
Source: Field Survey, 2016
From Table 4, 168 (or 84%) of the respondents agreed to the statement, 10 (or 5.0%) are
undecided and 22 (or 22%) disagreed.
0 20 40 60 80
Btw 30-40yrs
Bwt 41-50yrs
Bwt 51-60yrs
From 60yrs & Above
Fig. 2 Respondent's Age Distribution
168
10 22Fig. 3
Agreed
Undecided
Disagreed

165
Table 5 Africa is an increasingly critical market that cannot be ignored by international
business
Frequency Percent Valid Percent Cumulative Percent
Valid
Agreed 154 77.0 77.0 77.0
Undecided 16 8.0 8.0 85.0
Disagreed 30 15.0 15.0 100.0
Total 200 100.0 100.0
Source: Field Survey, 2016
From Table 5, 154 (or 77.0%) of the respondents agreed to the statement, 16 (or 8.0%) are
undecided and 30 (or 15%) disagreed.
Table 6 Regional integration is a kind of rational response to the difficulties faced by a
continent
Frequency Percent Valid Percent Cumulative Percent
Valid
Agreed 147 73.5 73.5 73.5
Undecided 19 9.5 9.5 83.0
Disagreed 34 17.0 17.0 100.0
Total 200 100.0 100.0
Source: Field Survey, 2016
From Table 6, 147 (or 73.5%) of the respondents agreed to the statement, 19 (or 9.5%) are
undecided and 34 (or 17.0%) disagreed.
Table 7 Treaties which emphasizes solidity, self – reliance and endogenous development
strategy encourages integration of international business in sub-Saharan Africa
Frequency Percent Valid Percent Cumulative Percent
Valid
Agreed 82 41.0 41.0 41.0
Undecided 54 27.0 27.0 68.0
Disagreed 64 32.0 32.0 100.0
Total 200 100.0 100.0
From Table 7, 82 (or 41.0%) of the respondents agreed to the statement, 54 (or 27.0%) are
undecided and 64 (or 32.0%) disagreed.
Table 8 Lack of skills, education and capital to operate in modern communication systems
affects the integration of international business in sub-Saharan Africa
0 20 40 60 80 100 120 140 160
Agreed
Undecided
DisagreedFig. 4

166
Frequency Percent Valid Percent Cumulative Percent
Valid
Agreed 102 51.0 51.0 51.0
Undecided 42 21.0 21.0 72.0
Disagreed 56 28.0 28.0 100.0
Total 200 100.0 100.0
Source: Field Survey, 2016
From Table 8, 102 (or 51.0%) of the respondents agreed to the statement, 42 (or 21.0%) are
undecided and 56 (or 28.0%) disagreed.
Table 9 Regional integration characterized by small countries, small economics and small
market possible in international business in Sub-Saharan Africa
Frequency Percent Valid Percent Cumulative Percent
Valid
Agreed 108 54.0 54.0 54.0
Undecided 36 18.0 18.0 72.0
Disagreed 56 28.0 28.0 100.0
Total 200 100.0 100.0
Source: Field Survey, 2016
From Table 9, 108 (or 54.0%) of the respondents agreed to the statement, 36 (or 18.0%) are
undecided and 56 (or 28.0%) disagreed.
Table 10 Increase in prosperity on innovations, creativity strong intellectual property
systems, focusing on new global markets enhances integrations in international business
in sub-Saharan Africa
Frequency Percent Valid Percent Cumulative Percent
Valid
Agreed 113 56.5 56.5 56.5
Undecided 28 14.0 14.0 70.5
Disagreed 59 29.5 29.5 100.0
Total 200 100.0 100.0
Source: Field Survey, 2016
From Table 10, 113 (or 56.5%) of the respondents agreed to the statement, 28 (or 14.0%) are
undecided and 59 (or 29.5%) disagreed.
0 20 40 60 80 100 120
Agreed
Undecided
Disagreed
102
42
56
Fig. 5

167
Table 4.11 Integration / monetary and fiscal matters which promotes economics union
significantly leads to integrations of international business in a sub-Saharan Africa
Frequency Percent Valid Percent Cumulative Percent
Valid
Agreed 99 49.5 49.5 49.5
Undecided 61 30.5 30.5 80.0
Disagreed 40 20.0 20.0 100.0
Total 200 100.0 100.0
Source: Field Survey, 2016
From Table 11, 99 (or 49.5%) of the respondents agreed to the statement, 61 (or 30.5%) are
undecided and 40 (or 20.0%) disagreed.
Table 12 Infrastructure service such as transport and telecommunications adversely affect
the costs of doing business and poses obvious changes to the regional and continental
integration
Frequency Percent Valid Percent Cumulative Percent
Valid
Agreed 136 68.0 68.0 68.0
Undecided 40 20.0 20.0 88.0
Disagreed 24 12.0 12.0 100.0
Total 200 100.0 100.0
Source: Field Survey, 2016
From Table 12, 136 (or 68.0%) of the respondents agreed to the statement, 40 (or 20.0%) are
undecided and 24 (or 12.0%) disagreed.
113
28
59 Fig. 6
Agreed
Undecided
Disagreed
0 20 40 60 80 100
Agreed
Undecided
Disagreed
99
61
40
Fig. 7
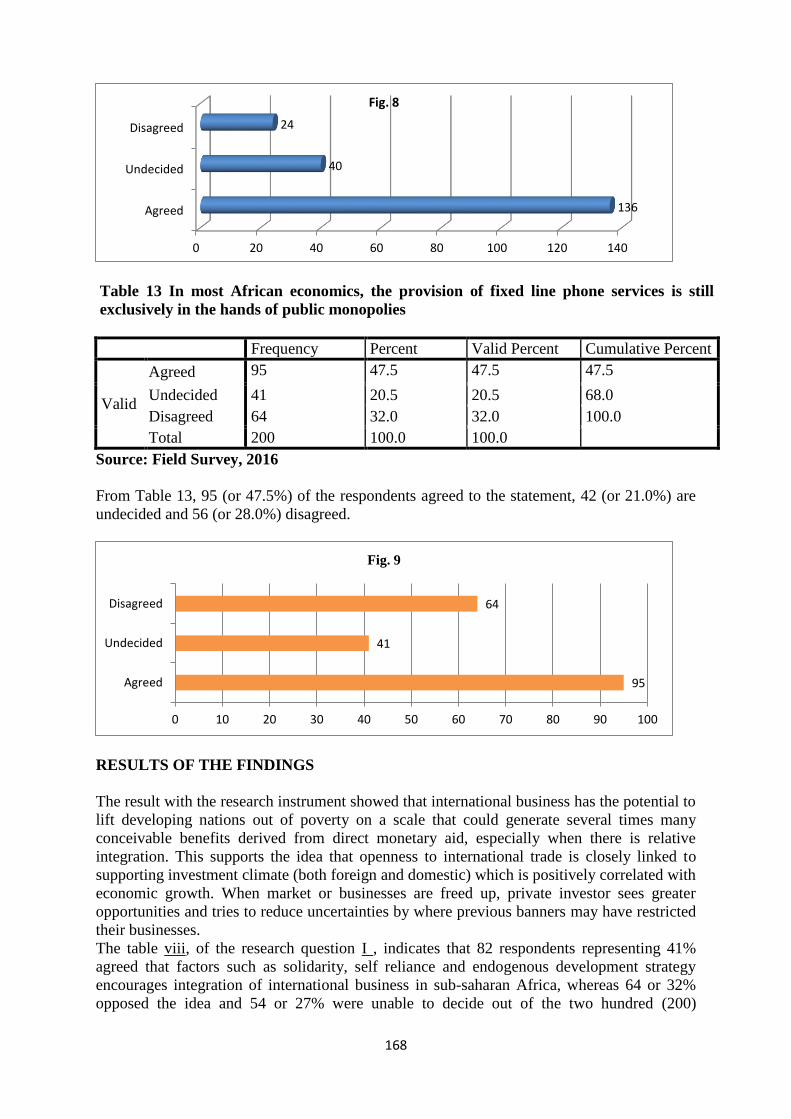
168
Table 13 In most African economics, the provision of fixed line phone services is still
exclusively in the hands of public monopolies
Frequency Percent Valid Percent Cumulative Percent
Valid
Agreed 95 47.5 47.5 47.5
Undecided 41 20.5 20.5 68.0
Disagreed 64 32.0 32.0 100.0
Total 200 100.0 100.0
Source: Field Survey, 2016
From Table 13, 95 (or 47.5%) of the respondents agreed to the statement, 42 (or 21.0%) are
undecided and 56 (or 28.0%) disagreed.
RESULTS OF THE FINDINGS
The result with the research instrument showed that international business has the potential to
lift developing nations out of poverty on a scale that could generate several times many
conceivable benefits derived from direct monetary aid, especially when there is relative
integration. This supports the idea that openness to international trade is closely linked to
supporting investment climate (both foreign and domestic) which is positively correlated with
economic growth. When market or businesses are freed up, private investor sees greater
opportunities and tries to reduce uncertainties by where previous banners may have restricted
their businesses.
The table viii, of the research question I , indicates that 82 respondents representing 41%
agreed that factors such as solidarity, self reliance and endogenous development strategy
encourages integration of international business in sub-saharan Africa, whereas 64 or 32%
opposed the idea and 54 or 27% were unable to decide out of the two hundred (200)
0 20 40 60 80 100 120 140
Agreed
Undecided
Disagreed
136
40
24
Fig. 8
95
41
64
Agreed
Undecided
Disagreed
0 10 20 30 40 50 60 70 80 90 100
Fig. 9
169
distributed questionnaires or respondents. This confirms that the sub-saharan African as a hub
for integration on international business has a very efficient labour markets by both regional
and international standards, and with the idea of integration, the sub-saharan Africans are
improving on business regulations to encourage more entrepreneurs to start business and
enter the formal sector rather than to remain in the informal sector.
The table II, of the research analysis on research questions II, indicates or reveals that out of
the (200) respondents, a total of 102 or 51% were of the view that lack of skills, education
and capital to operate in modern communication systems affects the integration of
international business in sub-Saharan Africa, while 56 or 28% of the respondents disagreed
and 42 or 21% of the sample population were undecided this means that business news and
information required for informed decision is a constraint to integration process, because
fixed-line telephone services are limited and unreliable, with notoriously high call changes,
especially for international calls in that contracts require information on comparatives to
reliable markets information, including information on the credit worthiness of potential
clients will be influenced. So information is always essential to facilitate efficient markets
outcomes and integration, otherwise its lack will hamper market efficiency as a result of high
or hidden trade transaction costs.
The table X of the study analysis of research question III, shows that out of the sample
population of (200) respondents the respondents of 108 or 54% agreed with the research
questions as against the sample population of 56 or 28% that opposed the idea and 36 or 18%
who could not decide that regional integration characterized by small, countries, small
economics and small market would motivate international business integration in the sub-
saharan Africa. These factors are why the economic commission for Africa, (ECA) became
the champion of regional integration for purposes of economic development. This
necessitated to the current African integration arrangements that were divided into two broad
groups; these that fit into the Lagos plan of action (LPA) adopted in April 1980 and those that
were either in existence or came about outside the (LPA). The Lagos plan was followed up in
1991, by Abuja treaty, re-affirming the commitment of the OAUS Heads of state to an
integrated African economy, mecarthy(1995). The table XI of the analysis of research
questions reveals that out of the sample population of (200) respondents, the respondents of
113 or 86% agreed as against 59 or 29% who opposed and 28 or 14% that were unable to
decide affirmed that increased in the prosperity on innovations, creativity, strong intellectual
property systems, which focuses on new global markets, tends to enhance integration of
international business in sub-saharan Africa. Because of good quality institutions, efficient
goods and labour markets; even when there is inefficient government bureaucracy,
inadequate educated workforce and a poor work ethics in the national labour force (world
economic forum. 2010).
Finally, table XIII of the study analysis on research questions V, indicates that from the
sample population of (200) respondents, 99 or 49.5% of the population admitted as against 61
or 30.5%, who were undecided stressed that to a very large extent market
integration/monetary and fiscal matters promotes economic union, which significantly leads
to an integration of international business in a sub-Saharan Africa. This is true, as many
economies have undertaken reforms to smooth the process of starting a business over the
years leading to greater servings and more registered businesses, financial resources and job
opportunities (World Bank, 20011a)
CONCLUSIONS
170
The integration in the international business is rational response to the difficulties faced by a
continent with many small national markets and landlocked countries. Today many sub-
Saharan Africans are embracing integration as an important component of their development
strategies; having concluded a very large number of regional integration arrangements
(RIAS), which though has unrealistic time frames towards deeper integration. This was why
integration records are not impressive although the objectives of the integration in Africa is to
reduce the transaction costs of trade, with the distinction between the border and behind the
border barriers; and this is why RIA focus very much on the import tariff, aiming to achieve
duty free in goods among member states. Apart from these, there is abundant anecdotal
evidence suggesting that time consuming and inefficient border procedures, as well as
corruption in some cases, tends to inhibits intra-regional trade or business (McCarthy 2007).
Despite these problems, the economic fundamentals are clearly in favor of Africa, in areas of
steadier exchange rates, robust commodity prices, with an increased private capital flows and
modest inflation to strengthen business integration in sub-Saharan Africans. These actions
from evidences, has give rise to an ever increasing pace of urbanization and the opening of
new consumer markets as Africa’s exploding middle class comes into the process of
integrated disposable incomes. It was in the process of integration that international business
in sub-Saharan Africans necessitated for the use of bilateral and multilateral agencies to co-
find and assist in mitigating credit risk. These bilateral organizations such as the international
development association (IDA), being a member of the World Bank group, helps to provide
assistance to government guiding the establishment of institutional frameworks that
encourages and stimulates development. They IDAS use finding to aid developing countries
(such as development funding institutions (DFIS) to demonstrate grater appetite for certain
risks on projects in Africa that would satisfy their development requirements. It is in line with
these developments that in his speech before the Ghanaian parliament in July 2009, the
United States president Obama asserted that; Africa is a fundamental part of our
interconnected world, and called for a partnership with Africa that is grounded in mutual
responsibility and mutual respect. To encourage the integration of internal business, the
national security strategy, released in May 2010, re-in forces this vision and calls for
partnership with African nations as they grow their economies and strength their democratic
institutions and governance.
RECOMMENDATIONS
As the African continent is increasingly becoming the global common hub for doing
business, as it presents endless business opportunities its international business integration in
sub-Saharan Africans will be enforced with the following recommendations.
1. For an international business integration to be achieved, wars and conflicts in a
numbers of African regions which have devastated transport networks,
communications and other basic infrastructures needs to be peacefully resolved
2. Strategies need to be designed by the sub-Saharan Africans to involve the private
sectors in the integration process.
3. The participation of consumer group and other NGOS should be encourage as the
groups can also gain from exploiting the opportunities for greater inter-regional trade
integrations.
4. Given the disparities in economics weight that exist between members of some
groupings, new policy instruments to deal with the fears of economics polarizations
must be found.
5. Dispute settlement mechanisms need to be strengthened and wage to ensure policy
credibility must be put in place.
171
6. Governments of Sub-Saharan Africa should adopt port free duties among all the
countries and the introduction of one currency should be implemented
7. There is need to have visible efforts to maintain or enhance the quality of human
resources through education and life – long learning; as better educated citizens are
more successful in higher income economies to leverage the favorable context for
driving innovations.
References
1. Ashford, C. Chea (2012): Sub-Saharan Africa and Global Trade: What sub-Saharan
African needs to do to maximize the benefits from Global Trade Integration, Increase
Economic Growth and Reduce Poverty?.International Journal of Academic Research
in Business and Social Sciences, April, 2012.No.4, ISSN: 2222-6990
2. Economic Commission for Africa (2004) : Assessing regional integration in
Africa.ECA-policy Research Report. Addis- Ababa.
3. Economic Commission for Africa (2010): Assessing regional integration in Africa .
Enhancing intra- African trade.Online: http:II www. Uneea.org/ aria 4 / index.Htm
4. Hartzenberg. T. (2011): Africa Needs Deeper Regional integration Agenda. World
Trade Organization Research and Analysis,(WTO) Research and Analysis July,2011
5. Mecarthy, C (2007) : Is African economic integration in need of a paradigm
change?Year book vol.6 2007 stellenbosh; Trade law centre for Southern Africa.
6. Mecarthy, C. (1999): Regional integration in sub-Saharan Africa: past, present and
future; in Oyejide, A. Ndulu, B., and Green away, D. (eds), Regional integration
and trade liberalization in sub-Saharan Africa. Volume 4, synthesis and Review;
Hound mills, Basingstock Macmillan press.
7. Obama, Barack (2012) USA strategy toward of sub-Saharan Africa. (The white House
Report). Washington D.C
8. Sindzingre, A.N (2011): The conditions for long term growth in sub-Saharan Africa.
China as a model constraint and on opportunity.
9. Technical co-operation Department (2015): Regional integration and fixed security in
developing countries. File: III e: /users/ FAWASDY
Appendix
RESPONDENT’S DEMOGRAPHIC PROFILE
15. Gender Male [ ] Female [ ]
16. Age: 30-40yrs [ ] 41-50yrs [ ] 51-60yrs [ ] 61yrs & Above [ ]
17. Educational Qualification: Primary School Education [ ] Secondary School Education [ ]
Tertiary School Education [ ]
RESPONSES TO RESEARCH QUESTIONS
18. Global economics integration and trade liberalization easy tariff and other important
restrictions as well as reduction or diminutions of domestic supports and export
subsidies, which tends to boost economic growth at least in the longer term.
Agreed [ ] Disagreed [ ] Undecided [ ]
19. Africa is an increasingly critical market that cannot be ignored by international
business.
Agreed [ ] Disagreed [ ] Undecided [ ]
20. Regional integration is a kind of rational response to the difficulties faced by a
continent.
Agreed [ ] Disagreed [ ] Undecided [ ]
21. Treaties which emphasizes solidity, self – reliance and endogenous development
strategy encourages integration of international business in sub-Saharan Africa
172
Agreed [ ] Disagreed [ ] Undecided [ ]
22. Lack of skills, education and capital to operate in modern communication systems
affects the integration of international business in sub-Saharan Africa.
Agreed [ ] Disagreed [ ]
23. Regional integration characterized by small countries, small economics and small
market possible in international business in sub-Saharan Africa.
Agreed [ ] Disagreed [ ] Undecided [ ]
24. Increase in prosperity on innovations, creativity strong intellectual property systems,
focusing on new global markets enhances integrations in international business in
sub-Saharan Africa.
Agreed [ ] Disagreed [ ] Undecided [ ]
25. Integration / monetary and fiscal matters which promotes economics union
significantly leads to integrations of international business in a sub-Saharan Africa.
Agreed [ ] Disagreed [ ] Undecided [ ]
26. Infrastructure service such as transport and telecommunications adversely affect the
costs of doing business and poses obvious changes to the regional and continental
integration.
Agreed [ ] Disagreed [ ] Undecided
27. In most African economics, the provision of fixed line phone services is still
exclusively in the hands of public monopolies.
Agreed [ ] Disagreed [ ] Undecided [ ]
173
THE IMPACT OF HUMAN RESOURCE PLANNING (HRP) ON
ORGANIZATION PERFORMANCE
(A Study of Osisiomangwa Local Government Area of Aba, Abia State Nigeria)
Joseph Onyi, Titus Onyi and Tawal Dauda
[email protected] , Michael Okpara University of Agriculture Umudike (MOUAU)
[email protected], Abubakar Tafawa Belawa University Bauchi (ATBU)
[email protected], University of Nigeria Nsukka (UNN)
1.0 INTRODUCTION
Man, one of the 5M’s (machine, man, money, material and management) of factors of
production, has a central and crucial role in any organization (Kehinde, 2012). People, the
human resource of any organization, are invariably the most important assets in any
enterprise.
Human Resource Management (HRM) is the understanding and application of the policies
and procedures that directly affect the people working within the project team and the overall
workforce (Kwasiri and Maina, 2015). Armstrong (2007) opined that the management of
workforce of a firm is important in ensuring sufficient staff levels with the right skills
properly rewarded and motivated (Kwasiri and Maina, 2015).
Human resource planning is related but not exactly human resource management. Human
resource planning is a link between the overall strategic plan of the organization and human
resource management. It enables an organization to estimate its demand for labour and
evaluates the size, nature and sources of supply in the demand for labour (Kwasiri and
Maina,2015).
Human resource planning involves the engagement of the right employees; engagement of
the desired skilled or talented employees; employee reward, incentives and motivation;
employee capacity building through trainings and employers brand, etc (Kwasiri and Maina,
2015; Inyang 2011).It has been a tool to ensure that the right person is in the right time
(Jackson et al 1990) in an organization. Human resource planning is part of a firm’s input –
based competences (Lado and Wilson 1995) and enhances labour productivity (Koch and
McGrath, 1996).
The impact of human resource planning on the organizational performance has been studied
directly or implicated in some related studies of HRM. For example, HRM was shown to
positively correlate with productivity and corporate performance (Huselid 1995) and in
ensuring good government (Hilderbrand et al 1997). Some studies conducted in Nigerian and
African region have shown some human planning practices. For instance the importance of
employee talents (skills) and employee retention. (Briggs 2014; Kwasiri and Maina 2015).
1.1 STATEMENT OF RESEARCH PROBLEM
However, despite the wealth of knowledge provided by researchers, there are gaps in the
human resource planning in government institutions including the local government councils
of Nigeria. This has brought about constraints in the performance at these local government
174
councils with poor service delivery, bureaucratic bottleneckness, inefficient time
management and undue employee rivalry, etc. Unfortunately, Osisiomangwa Local
Government area was plagued with poor human resource planning in the few years preceding
2011 (OSLGA quarterly Bulletin 2012).
For the past few years now, Osisiomangwa Local Government Area headquarters of Abia
State had poor organization performance due to poor planning shown by poor service
delivery and other vice. The problem can be attributed to poor human resource planning in
the organization headquarters. Hence there was poor management of the human resource
planning practices. In 2011 however, a new administrative regime came on board and
instituted changes in the management of the organization. The study therefore explores the
impacts of the instituted human resource planning (practices) on the organization’s
performance of the organization in the years 2011 to 2015. It is pertinent; therefore, to
explore the impact of human resource planning in the organizational performance in the years
2011 to 2015 following a new administrative order put in place by a new LGA council since
2011.
1.3 OBJECTIVES OF THE STUDY
The general objective is to explore the impacts of human resource planning on the
organisational performance (a case study of Osisiomangwa Local Government council
headquarters). The specific objectives include to:-
i. Evaluate the impacts of employment of skilled personnel on the organisational
performance.
ii. Evaluate the effects of staff training on the organisational performance.
iii. Identify the impacts of employee reward on the organisational performance.
iv. Evaluate the situation and make the necessary recommendations.
1.4 RESEARCH QUESTION
i. What are the impacts of employing skilled personnel on organizational performance?
ii. What are the effects of staff training on the organizational performance?
iii. What are the impacts of Employee reward on the organizational Performance?
iv. What are the impacts of human resource planning on the organisational performance
of Osisiomangwa Local Government council headquarters?
1.5 RESEARCH HYPOTHESES
i. Hypothesis One: Null Hypothesis (HO1)
There is no significant relationship between employment of skilled personnel and the
organization performance of Osisiomangwa L.G.A. of Abia State, Nigeria.
ii. Hypothesis Two: Null Hypothesis (HO2)
There is no significant relationship between Staff training and development and the
Organizational Performance of Osisiomangwa L.G.A. of Abia State, Nigeria.
iii. Hypothesis Three: Null Hypothesis (HO3)
There is no significant relationship between Employee rewards and the organization
Performance of Osisiomangwa L.G.A. of Abia State, Nigeria.
1.6 SIGNIFICANCE OF THE STUDY
175
The study explores useful information on impacts of human resource planning in the
organisational performance, with Osisiomangwa Local Government council Headquarters as
a case study. The area of study is significant with a history of change in human resource
planning following past years of poor performance. The findings and conclusion from the
study will bridge the gap in the knowledge of the impacts of human resource planning in the
organization performance of the organization. The study had enhances the researchers
experience and skills in empirical research study. The findings and recommendations from
this study may be basis for another study and could influence policy changes at the study area
and the wider community.
2.0 REVIEW OF RELATED LITERATURE
2.1 Planning
The management cycle is made up of four components-planning, implementation, monitoring
and evaluation. Because planning is the starting point of management, it is usually
underscored hence the saying: To fail to plan means to plan to fail. Planning in contemporary
context is systematically and analytically documented, hence the term strategic planning.
Strategy is a broad based formula for how business is going to compete and what policies will
be needed to carry out the goals in order to achieve success [Aremu (2010), Kazmi
(2008)].Hence Johnson et al (2008) opined that strategic planning is all about an enabling
environment to achieve and sustain superior overall performance and returns. The essential
task of strategic planning is to see that everybody understands the group purpose and
objectives and the methods of attaining them.
Various business analytic techniques may be used in strategic planning, some of which
include:
SWOT Analysis (Strengths, Weaknesses, Opportunities and Threats),
PEST Analysis (Political, Economic, Social and Technological),
STEER Analysis (Socio Cultural, Technological, Economic, Ecological and
Regulatory Factor) and
EPISTEL (Environment, Political, Informatics, Social, Technological, Economic
and Legal).
Oyedijo (2004) opined that strategic managers must determine the relevant macro
environmental factors- macroeconomic environment, technological and the socio-cultural
environments –to achieve the organizational goals.
2.2 The Concept Human Resource Planning (HRP)
One of the primary functions of human resource management is the scheduling of the human
resource capacity of the organization. The process of forecasting the human resource needs of
an organization and acting on the plan to achieve the objectives of the organization is human
resource planning. A message frequently found in corporate mission statements and annual
reports is that people (human resource) of an organization are the most valuable resource.
Having the right personnel at the right place and at the right time is of utmost importance to
the survival and success of any organization. This underscores the role of man, one of the
5M’s (machine, man, money, material and management) of factors of production (Kehinde,
2012).
176
Human resource planning(HRP) is that link between the overall strategic plan and HRM of an
organization that enables it to estimate its demand for labour , evaluates the size ,nature and
sources of supply of labour (Kwasiri and Maina, 2015). HRP identifies the present and future
human resource needs in order to achieve the goals of the organization. It is a technique
aimed at securing and improving an organization’s human resources to meet their present
needs. Three principal stages can be distinguished: evaluating of existing human resources,
forecast of future requirement and finally action plan (Cole,1993).
HRP is based on principles which include:
Planning and analysis based on clearly defined organizational objectives.
Planning and analysis of internal and external factors affecting human resources.
Simple and feasible plan.
Flexibility to adapt to organizational changes.
2.3 Human Resource Management (HRM)
Human Resource Management (HRM) is the understanding and application of the policies
and procedures that directly affect the people working within the project team and the overall
workforce (Kwasiri and Maina, 2015). HRM thinks through the overall mission of a business
by establishing what the business is all about (Akingbade et al. ,2010), and focuses on long
range objectives and short term priorities through the adoption of various business analytic
techniques and Implementation of the project or activities as planned.
The objectives of HRM include:
Directing an organization towards pre-determined objectives.
Enhance employee performance.
Providing skilled and competent employees for the organization.
Maintaining qualitative work force, e.tc. (Onyi,2014).
Human resource management strategy is an integral part of the corporate strategic planning.
HRM evolved at the end of twentieth century and has become popular because of:
Shift from union orientation to individual focus.
Shift from bureaucratic personnel department to business driven.
Shift to long term rather than short term effects.
Devolution of human resource management to line managers.
These features technically differentiate human personnel management and human resource
management (Onyi, 2014:81).
The seven pillars of human resource management practices as identified by Jeffrey Pfeffer
(1994) are: employment security, selective hiring of new personnel, self-managed teams and
decentralized decision making, comparatively high compensation/ reward, extensive training,
reduced status distinctions and extensive sharing of financial and performance information.
Oladipo and Abdulkadir (2011) concluded that line management devolvement, innovative
recruitment and selection system, regular training and development of personnel, equity
based compensation system, performance appraisal system, effective career planning system
and a robust employee participation in the organizations’ decisions and actions are the key
177
strategic HR practices that influence organizational performance in the Nigerian
manufacturing sector.
2.4 Organization Performance (OP)
Organizational performance is one of the most broadly and extensively used dependent
variables in organizational studies today. Organization Performance has been a source of
influence to the actions taking by companies and the degree to which an organization realizes
its goals as well as the stated objectives of the organization through the strategies and policies
of the organization (Folan and Browne, 2005). The idea of Organization Performance is
hanged on the position or premise that it is a combination of productive assets made up of
human, physical, and capital resources, for the major reason of fulfilling a dream, vision or
accomplishing a shared purpose, (Barney, 2002, Carton and Hofer, 2006) Campbell’s (1999)
theory defined performance as behaviour or action relevant to the attainment of an
organization’s goals that can be scaled (measured). However, there are inconsistencies in the
definition of specific and precise meaning for the organization performance construct.
Commonly, most firms measure organisational performance in terms of financial growth.
Some studies have used subjective measures to evaluate firms’ performance, such as
employee satisfaction, customer satisfaction, executives’ perceptions about the company’s
performance, absenteeism, employee commitment, and other behaviour aspects. Other studies
reference various objective measures for evaluating firms’ performance, such as financial and
market indicators. For this reason, there is also a call for a precise theory of organization
performance (Janssens and Steyaert (2009) and HRM researchers and professionals might
give crucial and special consideration to filling such a gap (Guest, 2011).
2.4.1 Classification of Performance Outcomes
Dyer and Reeves’ (1995) classifies performance outcomes as follows:-
i. HR-related outcomes, such as turnover, absenteeism, job satisfaction, commitment.
ii. Organizational outcomes, such as productivity, quality, service, efficiencies, customer
satisfaction.
iii. Financial accounting outcomes, such as profits, sales, return on assets, return on
investment.
iv. Capital market outcomes, such as market share, stock price, growth (Boxall, Purcell and
Wright, 2007).
2.6 Human Resource Planning (HRP) and Organizational Performance
The literature search found that many studies had HRM and organizational performance as
variables for the studies. Few other studies had HR practices and organizational performance
as the variables.
2.6.1 Empirical Evidence
It was only in the 1990s that the concept of bundling of human resource practices became
popular and attracted numerous studies. Ferris et al. (1990) made one of the first major
attempts to examine how effective management of human resources might contribute to
positive organizational performance. In their study of 2,236 firms from the U.S. construction
industry, the Ferris group addressed the roles played by three important organizational
functions and activities on firm performance: the status and importance of the HRM function,
178
the role of unions and strategic planning. They found that firms that had HRM departments
were generally high performers (i.e., larger total sales volume), firms that had a higher
percentage of their workforce unionized also performed better than firms with a lower
percentage and, finally, firms performed better when they engaged in more formalized
strategic planning.
Using descriptive statistics and regression to analyze their data, David et al. (2002) examined
the relationship between strategic HRM and organizational financial and human resource
performance in Singapore. They found out positive correlation of HR variable with
organisational performance. Other studies that concluded that there is a positive relationship
between strategic planning and corporate performance include McIlquham-Schmidt (2010),
Robbins et al (2008) and Pearce and Robinson (2007) etc.
2.6.2 The Nigerian Experience
In Nigeria, so far, studies on ‘HRM and organisational performances’ out number specific
studies on ‘HR planning and organisational performances,’ .But it is important to note that
these two groups of studies are related. Most of them share these key players - HRs and HR
practices. For example, the findings from the study conducted by Oladipo and Abdulkadir
(2011) indicate that line management devolvement, innovative recruitment and selection
system, regular training and development of personnel, equity based compensation system,
performance appraisal system, effective career planning system and a robust employee
participation in the organizations’ decisions and actions are the key strategic HR practices
that influence organizational performance in the Nigerian manufacturing sector. The research
underscores the importance of these variables (HR practices) in the performance of the
organization. HRM was shown to positively correlate with productivity and corporate
performance as studied by Huselid (1995). The impact of HRM in good government was
studied by Hilderbrand et al (1997). In Nigeria, Briggs (2014) and Kwasiri and Maina (2015)
explored the impact of employee talents (skills) and employee retention on organization
performance. Studies of McIlquham-Schmidt (2010), Robbins et al. (2008) and Pearce and
Robinson (2007) concluded that there is a positive relationship between strategic planning
and corporate performance
2.7 THEORETICAL FRAMEWORK
2.7.1 Human Capital Theory (Pfeiffer, 2004)
Human Capital Theory has long been argued as a critical resource in most firms (Pfeiffer,
2004). The search for sources of sustainable competitive advantage increasingly pointed
inward towards organizational capability and more specifically to the strategic management
of human resource, (Dyer, 2003) Human capital refers to the productive capabilities of people
skills, experience and knowledge have economic value to organizations because they enable
it to be productive and adaptable; thus people constitute the organizations human capital,
(Schuler, 2005). People possess knowledge, skills, and abilities (KSA) that are of economic
value to the firm and, therefore, firm investments to increase them, i.e. through training
programs. Therefore, the higher the potentials for employees to contribute to the firm, the
more likely it is that firm will invest in human resource management activities.
2.7.2 Abraham Maslow’s Hierarchy of Need Theory (1950)
179
This is a very popular theory as is sometimes called human need theory. It was developed in
the 1950 and described the motivational or psychological needs of man which fall into five
hierarchic classes in the order (from basic/lowest to highest:
i. Physiologic (hunger, thirst, sleep etc.)
ii. Safety/Security/shelter/health.
iii. Belongingness/love/friendship.
iv. Self-recognition /esteem/achievement.
v. Self-actualization.
The five needs are also drawn into a pyramid with the basic needs at the base and the highest
needs at the apex. The theory proposes that unsatisfied needs causes motivation and
influences behaviour. Satisfied needs do not cause motivation. One advances to the next
need- hierarchy only after getting the needs in the class before. The more an individual is at
higher classes, the more the individuality of the person will show.
Maslow developed this theory, it is estimated that about 85% of the working population have
their basic needs relatively well catered for by employers/management. Human resource
planning recognizes the different needs of the individual work force and analyses this in the
planning of human resources practices e.g. reward, appraisal system, selection system etc.
This enables workers to progress to higher levels of the need pyramid (Onyi, 2014:202).
3.0 RESEARCH METHODOLOGY
3.1 Research Design
Survey design was adopted in this study. It involved use of self-designed questionnaire in
collecting data from the respondents. This method was chosen in order to make reference to
phenomena as they exist in real life. It was adopted because of its economic advantage over
other research designs. Surveys allow the study of representative samples which permit
inferences from the population that would be too expensive to study as a whole. The use of
survey research method for the study is justified because it follows a correlation research
strategy and helps in predicting behaviour (Bordens & Abbott 2002).
3.2 Sources of Data Collection
The study had two sources of data-primary and secondary sources. Primary source of data
was self–designed, pre-tested questionnaire made up of twenty (20) items. The questionnaires
were hand delivered to the respondents during working hours and collected from respondents
after filling them. Research ethics were followed for primary data collection. First, clear
introduction and explanation of the research was done by the researcher to the prospective
respondents. This was accompanied by issuance of the research information to the
respondents. Primary data collection was done in the respondents’ place of work-
Osisiomangwa Local Government Council headquarters. Instructions on how to fill the
questionnaire were given. Confidential treatment of information was assured. After filling the
questions, the researcher collected back the questions
Secondary data was gotten from published books and peer reviewed journals including
electronic works.
3.3 Population of the Study
180
The Population of the study is the entire workers employed and who worked at the
Osisiomangwa Local Government council headquarters during the research period. The
population was 1006 people.
3.3.1 Sample Size Determination
Using the Taro Yamane formula for calculating sample size.
Using the formula,
n= N
3+ N (e)2
Where n=sample size
N=population = 1006
e= sampling error usually = 0.05 (level of precision)
3= constant
n = 1006
3+1006 x (0.05)2
= 1006 = 1006
3+1006 x 0.0025 5.515 = 182
3.4 Area of Study:
The study was conducted at the Osisiomangwa Local Government Council headquarters
office complex of Abia State. The office is rectangular in shaped and about 80,000 m2 at the
Southern area of Osisiomangwa Local Government. Osisiomangwa Local Government is
located at the Southern part of Abia State one of, South-Eastern states of Nigeria.
3.5 Instrument Validation
The questionnaire was subjected to face-validation by two professional. The professionals
screened the questionnaire and approved it as being valid for eliciting information. These
experts screened the questionnaire items in terms of clarity, wording, appropriateness and
adequacy of the items for the study. Their observations and recommendations were effected
in drafting the final copy of the questionnaire.
3.6 Reliability of the Instrument
The reliability of the data collected was determined by using Cronbach Alpha method. This
method was found more appropriate in that it takes care of the internal consistency of the
instrument. Furthermore A first draft of the questionnaire was made and pre-tested on twenty
(20) respondents. The value of the reliability obtained was 0.80.
Table 3.2 Descriptive Statistics (Cronbach’s Alpha)
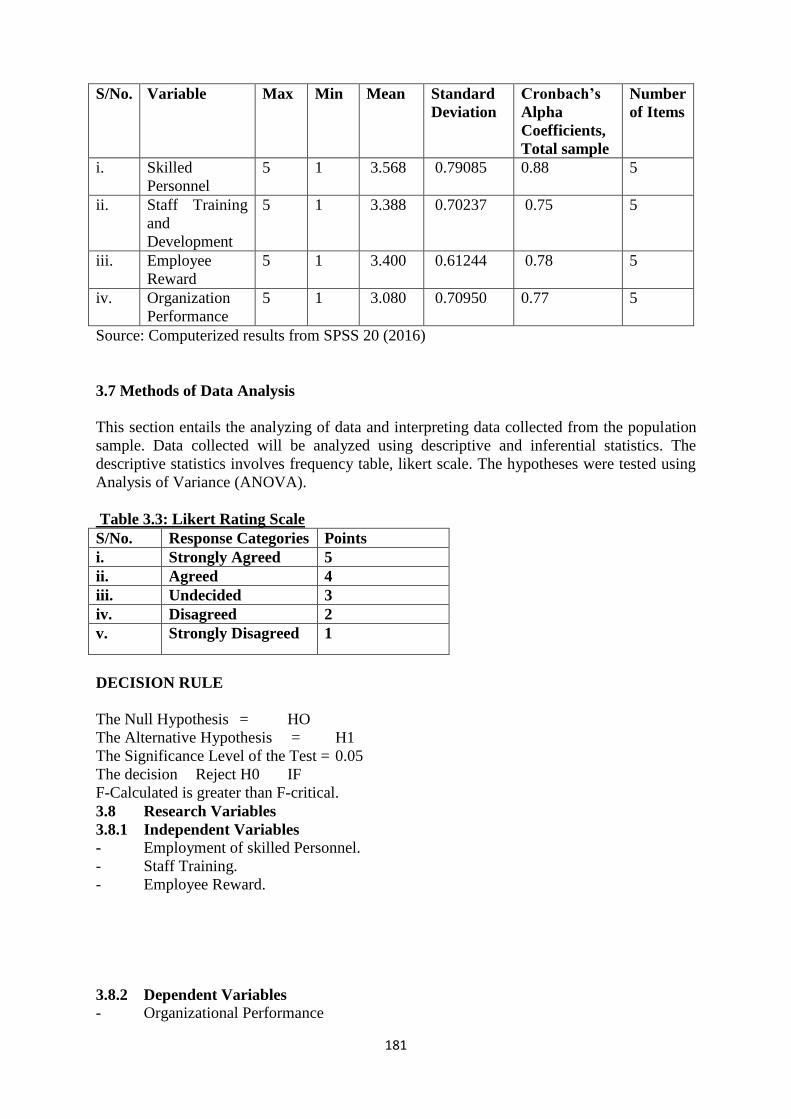
181
S/No. Variable Max Min Mean
Standard
Deviation
Cronbach’s
Alpha
Coefficients,
Total sample
Number
of Items
i. Skilled
Personnel
5 1 3.568 0.79085 0.88 5
ii. Staff Training
and
Development
5 1 3.388 0.70237 0.75 5
iii. Employee
Reward
5 1 3.400 0.61244 0.78 5
iv. Organization
Performance
5 1 3.080 0.70950 0.77 5
Source: Computerized results from SPSS 20 (2016)
3.7 Methods of Data Analysis
This section entails the analyzing of data and interpreting data collected from the population
sample. Data collected will be analyzed using descriptive and inferential statistics. The
descriptive statistics involves frequency table, likert scale. The hypotheses were tested using
Analysis of Variance (ANOVA).
Table 3.3: Likert Rating Scale
S/No. Response Categories Points
i. Strongly Agreed 5
ii. Agreed 4
iii. Undecided 3
iv. Disagreed 2
v. Strongly Disagreed 1
DECISION RULE
The Null Hypothesis = HO
The Alternative Hypothesis = H1
The Significance Level of the Test = 0.05
The decision Reject H0 IF
F-Calculated is greater than F-critical.
3.8 Research Variables
3.8.1 Independent Variables
- Employment of skilled Personnel.
- Staff Training.
- Employee Reward.
3.8.2 Dependent Variables
- Organizational Performance

182
Fig 3.1 Authors Research Model, 2016
4.0 DATA PRESENTATION AND ANALYSIS
182 questionnaires were distributed and 160 questionnaires was returned for analysis. It
shows encouraging results from the respondents in the sense that of as much as 160
representing 88.0% of the total questionnaire distributed were filled and returned before the
analysis. The remaining 22 (12.0%) questionnaires were not returned due to one reason or the
other.
4.1 Demographic Characteristics of Respondents:
4.1.1 Gender/Sex
From table (4.2) below it shows that 114 respondents representing 71.2.3% were male, 46
respondents representing 28.8% were female. This is due to the nature of the job. More men
are employed in the organization.
Table 4.2: Demographic Characteristic Of Respondents
S/NO. VARIABLE Frequency Percentage Cumulative
Percentage
1. Gender
Male 114 71.2 71.2
Female 46 28.8 100.0
TOTAL 160 100.0 100.0
2. Age Range
21-30 26 16.3 16.3
31- 40 68 42.5 70.0
40- Above 66 41.3 100.0
TOTAL 160 100.0 100.0
3 Educational
Qualification
SSCE 28 17.5 17.5
OND/NCE 52 32.5 50.0
HND 51 31.9 81.9
B.SC 19 11.9 93.8
MBA/MSC/PhD 10 6.3 100.0
Total 160 100.0 100.0
4. Employee level
Junior 28 17.5 17.5
Senior 103 64.4 81.9
Management 29 18.1 100.0
Employment of Skilled
Personnel
Staff training and
Development
Employee Reward
Organization
Performance
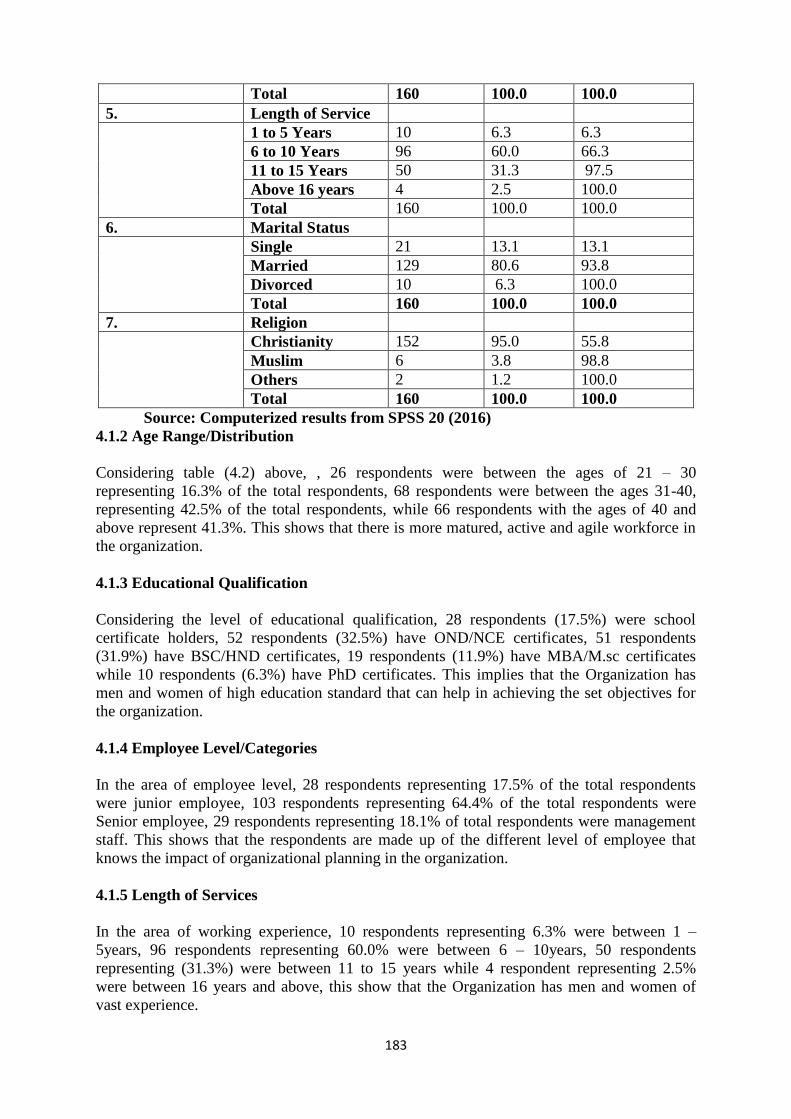
183
Source: Computerized results from SPSS 20 (2016)
4.1.2 Age Range/Distribution
Considering table (4.2) above, , 26 respondents were between the ages of 21 – 30
representing 16.3% of the total respondents, 68 respondents were between the ages 31-40,
representing 42.5% of the total respondents, while 66 respondents with the ages of 40 and
above represent 41.3%. This shows that there is more matured, active and agile workforce in
the organization.
4.1.3 Educational Qualification
Considering the level of educational qualification, 28 respondents (17.5%) were school
certificate holders, 52 respondents (32.5%) have OND/NCE certificates, 51 respondents
(31.9%) have BSC/HND certificates, 19 respondents (11.9%) have MBA/M.sc certificates
while 10 respondents (6.3%) have PhD certificates. This implies that the Organization has
men and women of high education standard that can help in achieving the set objectives for
the organization.
4.1.4 Employee Level/Categories
In the area of employee level, 28 respondents representing 17.5% of the total respondents
were junior employee, 103 respondents representing 64.4% of the total respondents were
Senior employee, 29 respondents representing 18.1% of total respondents were management
staff. This shows that the respondents are made up of the different level of employee that
knows the impact of organizational planning in the organization.
4.1.5 Length of Services
In the area of working experience, 10 respondents representing 6.3% were between 1 –
5years, 96 respondents representing 60.0% were between 6 – 10years, 50 respondents
representing (31.3%) were between 11 to 15 years while 4 respondent representing 2.5%
were between 16 years and above, this show that the Organization has men and women of
vast experience.
Total 160 100.0 100.0
5. Length of Service
1 to 5 Years 10 6.3 6.3
6 to 10 Years 96 60.0 66.3
11 to 15 Years 50 31.3 97.5
Above 16 years 4 2.5 100.0
Total 160 100.0 100.0
6. Marital Status
Single 21 13.1 13.1
Married 129 80.6 93.8
Divorced 10 6.3 100.0
Total 160 100.0 100.0
7. Religion
Christianity 152 95.0 55.8
Muslim 6 3.8 98.8
Others 2 1.2 100.0
Total 160 100.0 100.0

184
4.1.6 Marital Status
In the area of marital status, 21 respondents representing 13.1% were single, 129 respondents
representing 80.6% were married, 10 respondents representing 6.3 % were divorced This
implies that the organization has responsible workforce.
4.1.7 Religion
The religious of the respondents, showed that 152 respondents representing 95.0% were
Christians, 6 respondents representing 3.8% were Muslims, while 2 respondents representing
1.2% were other religion groups.
4.2 Correlation Analysis
Table 4.3: Correlation Analysis
VARIBLES Correlation Employee
Skill
Staff
Training &
Development
Employee
Reward
Organizational
Performance
Employee
Skill
Pearson
Correlation
Sig. (2-tailed)
N
1
160
.192*
.023
160
.099
.245
160
.167*
.048
160
Staff
Training &
Development
Pearson
Correlation
Sig. (2-tailed)
N
.192*
.023
160
1
160
.270**
.001
160
.295**
.000
160
Employee
Reward
Pearson
Correlation
Sig. (2-tailed)
N
.099
.245
160
.270**
.001
160
1
160
.274**
.001
160
* Correlation is significant at 0.05 level (2-tailed)
** Correlation is significant at 0.01 level (2-tailed)
Source: Computerized results from SPSS 20 (2016)
The table 4.3 above showed the correlation analysis of the variables Employee Skill, Staff
Training & Development, Employee Reward and Organizational Performance.
4.2.1 Employee Skill and Organizational Performance
The table 4.3 above shows a minor significant positive relationship between Employee Skill
and Organizational performance. It means that if there is an increase in Employee Skill, then
Organizational Performance will also have a minor increase. So there a direct positive
relationship between Employee Skill and Organizational Performance.
From the table 4.3 above, there was a minor positive correlation (0.295) between Employee
skill and organizational Performance. It means that as Employee Skill increases,
Organizational performance increase.
4.2.2 Staff Training & Development and Organizational Performance
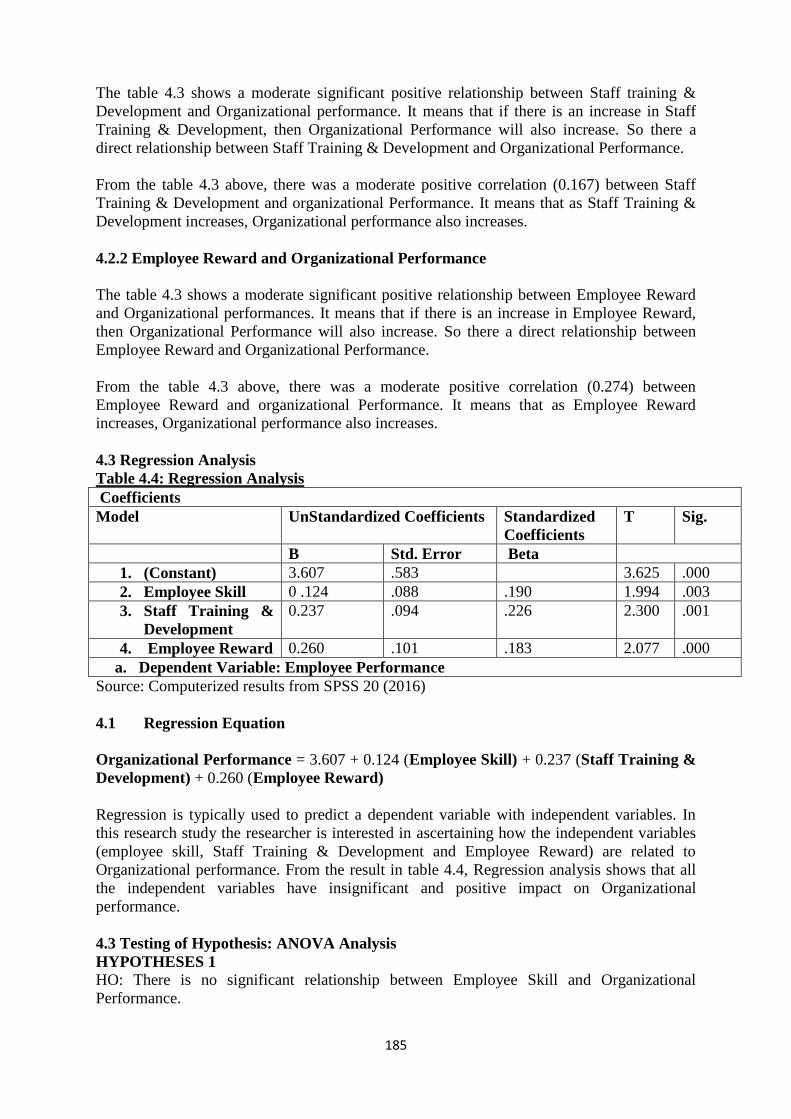
185
The table 4.3 shows a moderate significant positive relationship between Staff training &
Development and Organizational performance. It means that if there is an increase in Staff
Training & Development, then Organizational Performance will also increase. So there a
direct relationship between Staff Training & Development and Organizational Performance.
From the table 4.3 above, there was a moderate positive correlation (0.167) between Staff
Training & Development and organizational Performance. It means that as Staff Training &
Development increases, Organizational performance also increases.
4.2.2 Employee Reward and Organizational Performance
The table 4.3 shows a moderate significant positive relationship between Employee Reward
and Organizational performances. It means that if there is an increase in Employee Reward,
then Organizational Performance will also increase. So there a direct relationship between
Employee Reward and Organizational Performance.
From the table 4.3 above, there was a moderate positive correlation (0.274) between
Employee Reward and organizational Performance. It means that as Employee Reward
increases, Organizational performance also increases.
4.3 Regression Analysis
Table 4.4: Regression Analysis
Coefficients
Model UnStandardized Coefficients Standardized
Coefficients
T Sig.
B Std. Error Beta
1. (Constant) 3.607 .583 3.625 .000
2. Employee Skill 0 .124 .088 .190 1.994 .003
3. Staff Training &
Development
0.237 .094 .226 2.300 .001
4. Employee Reward 0.260 .101 .183 2.077 .000
a. Dependent Variable: Employee Performance
Source: Computerized results from SPSS 20 (2016)
4.1 Regression Equation
Organizational Performance = 3.607 + 0.124 (Employee Skill) + 0.237 (Staff Training &
Development) + 0.260 (Employee Reward)
Regression is typically used to predict a dependent variable with independent variables. In
this research study the researcher is interested in ascertaining how the independent variables
(employee skill, Staff Training & Development and Employee Reward) are related to
Organizational performance. From the result in table 4.4, Regression analysis shows that all
the independent variables have insignificant and positive impact on Organizational
performance.
4.3 Testing of Hypothesis: ANOVA Analysis
HYPOTHESES 1
HO: There is no significant relationship between Employee Skill and Organizational
Performance.

186
Employee Skill
ANOVA
Employee Skill
Model Sum of
Squares
Df Mean
Square
F Sig.
Regression 19.385 1 19.385 24.971 .003b
Residual 114.947 158 .802
Total 134.332 159
Source: Author’s Computation, 2016
a. Dependent Variable: Organizational Performance.
b. Predictors: (Constant), Employee Skill.
c. Interpretation of ANOVA Result :Reject HO because: Computed –F (24.971) is greater
than Critical –F (18.51). Sig. (0.003) is less than the significant Level (0.05) F-Cal. = 24.971.
The p-value is less than alpha therefore it is statistically significant. Thus we reject the null
hypothesis and conclude that there is a positive significant relationship between Employee
Skill and Organizational performance.
HYPOTHESES 2
HO: There is no significant relationship between Staff Training & Development and
Organizational Performance.
Staff Training and Development
ANOVA
Employee Skill
Model Sum of
Squares
Df Mean
Square
F Sig.
Regression 13.385 1 13.385 20.601 .001b
Residual 122.057 158 .802
Total 135.442 159
Source: Author’s Computation, 2016
d. Dependent Variable: Organizational Performance.
e. Predictors: (Constant), Staff Training and Development
f. Interpretation of ANOVA Result :Reject HO because: Computed –F (20.601) is greater
than Critical –F (18.51). Sig. (0.001) is less than the significant Level (0.05) F-Cal. = 20.601.
The p-value is less than alpha therefore it is statistically significant. Thus we reject the null
hypothesis and conclude that there is a positive significant relationship between Staff
Training & Development and Organizational performance.
HYPOTHESES 3
HO: There is no significant relationship between Employee Reward and Organizational
Performance.
Employee Reward
ANOVA
Employee Reward
Model Sum of
Squares
Df Mean
Square
F Sig.
Regression 20.385 1 20.385 26.782 .000b
Residual 112.607 158 .802
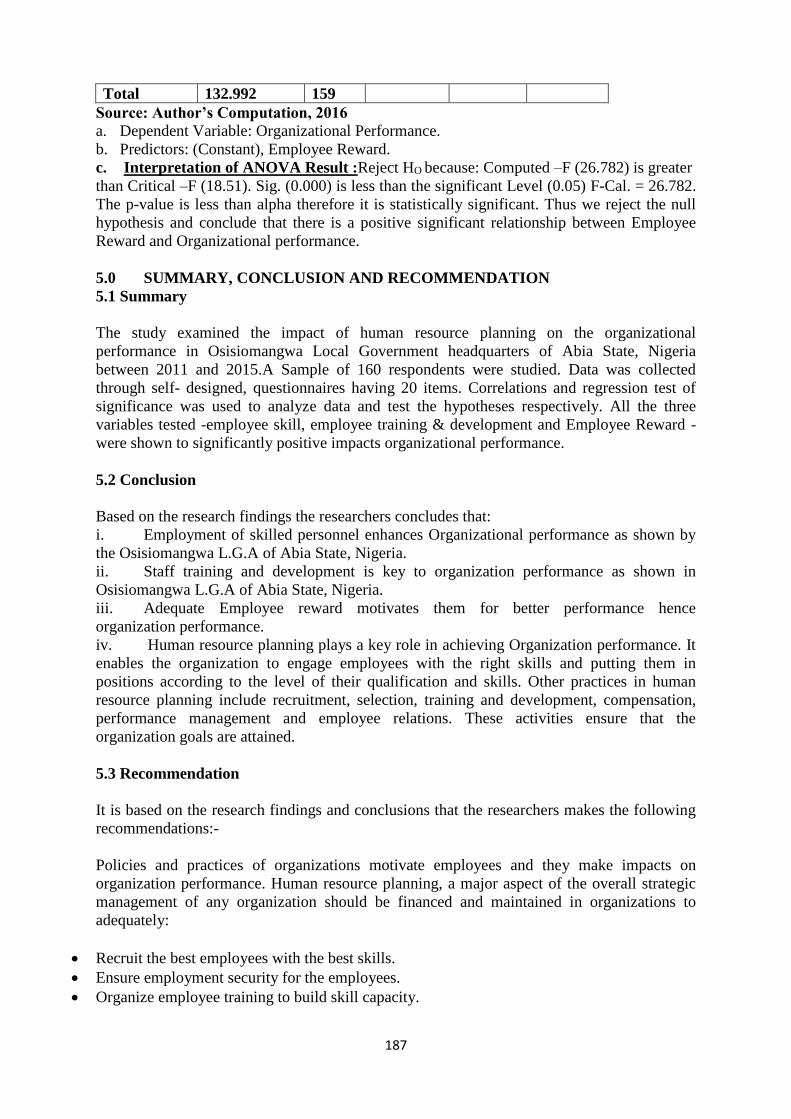
187
Total 132.992 159
Source: Author’s Computation, 2016
a. Dependent Variable: Organizational Performance.
b. Predictors: (Constant), Employee Reward.
c. Interpretation of ANOVA Result :Reject HO because: Computed –F (26.782) is greater
than Critical –F (18.51). Sig. (0.000) is less than the significant Level (0.05) F-Cal. = 26.782.
The p-value is less than alpha therefore it is statistically significant. Thus we reject the null
hypothesis and conclude that there is a positive significant relationship between Employee
Reward and Organizational performance.
5.0 SUMMARY, CONCLUSION AND RECOMMENDATION
5.1 Summary
The study examined the impact of human resource planning on the organizational
performance in Osisiomangwa Local Government headquarters of Abia State, Nigeria
between 2011 and 2015.A Sample of 160 respondents were studied. Data was collected
through self- designed, questionnaires having 20 items. Correlations and regression test of
significance was used to analyze data and test the hypotheses respectively. All the three
variables tested -employee skill, employee training & development and Employee Reward -
were shown to significantly positive impacts organizational performance.
5.2 Conclusion
Based on the research findings the researchers concludes that:
i. Employment of skilled personnel enhances Organizational performance as shown by
the Osisiomangwa L.G.A of Abia State, Nigeria.
ii. Staff training and development is key to organization performance as shown in
Osisiomangwa L.G.A of Abia State, Nigeria.
iii. Adequate Employee reward motivates them for better performance hence
organization performance.
iv. Human resource planning plays a key role in achieving Organization performance. It
enables the organization to engage employees with the right skills and putting them in
positions according to the level of their qualification and skills. Other practices in human
resource planning include recruitment, selection, training and development, compensation,
performance management and employee relations. These activities ensure that the
organization goals are attained.
5.3 Recommendation
It is based on the research findings and conclusions that the researchers makes the following
recommendations:-
Policies and practices of organizations motivate employees and they make impacts on
organization performance. Human resource planning, a major aspect of the overall strategic
management of any organization should be financed and maintained in organizations to
adequately:
Recruit the best employees with the best skills.
Ensure employment security for the employees.
Organize employee training to build skill capacity.
188
Compensate employees adequately.
Devolve some powers to employees to improve employee participation in decision making
and management.
Reduce staff status distinction by introducing common offices among the employee ranks,
uniform ID cards, etc.
These planning activities will ensure the achievement of the desired organizational goal.
REFERENCES
1. Ahmad S and Schroeder R.G (2003) The impact of Human Resource Management on
operational performance: recognizing country and industry differences. Journal of
operational management Vol. 21(1) pg 19-43
2. Akinyele S. T. and Fasogbon O. I. (2007).Impact of Strategic Planning on
Organizational Performance and Survival. Research Journal of Business Management
Vol 1: pg 62-71.
3. Alan A. and Maria K.(2014).Categorical data analysis. International encyclopedia for
statistical Science pg 206-208
4. Anakwe U.(2012)Human resource management practices in Nigeria: Challenges and
insight. The international journal of Human Resource Management Vol. 13(7).
5. Bordens, S.K, & Abbott, B.B. (2002). Research Design and Methods: A Process
Approach (5th ed.) New York: McGraw-Hill. from
www.hha.dk/man/cmsdocs/WP/2010/wp2010_03.pd
6. Boxall, P., Purcell, J. & Wright, P. (2007).The Oxford handbook of Human resource
management.
7. Briggs B.R.(2014)Causes and effects of pressure for appointment in the Nigerian federal
civil service. International Journal of Management.
8. Campbell, J. P. (1999). The definition and measurement of performance in the new age.
In D. R. Ilgen & E. D. Pulakos (Eds.), The changing nature of performance. Implications
for staffing, motivation, and development, (pp. 399–429). San Francisco: Jossey-Bass.
9. Dauda, Y. A., Akingbade, W. A. and Akinlabi, H. B. (2010) “Strategic Management
Practice and Corporate Performance of Selected Small Business Enterprises in Lagos
Metropolis”, International Journal of Business and Management 5(11): 97 - 105
November 2010.
10. David, W., Chin, H. O., and Victor, K. (2002). Strategic Human Resource Management
and Organizational Performance in Singapore. Compensation and Benefits Review, 34:
33-42.
doi:10.1177/0886368702034004006,http://dx.doi.org/10.1177/0886368702034004006.
11. David, W., Chin, H. O., and Victor, K. (2002). Strategic Human Resource Management
and Organizational Performance in Singapore. Compensation and Benefits Review, 34:
33-42.
doi:10.1177/0886368702034004006,http://dx.doi.org/10.1177/0886368702034004006.
12. Dyer, L., & Reeves, T., (1995). Human resource strategies and firm performance: What
do we know and where do we need to go? Paper presented at the 10th World Congress of
the International Industrial Relations Association, Washington, DC.
13. Ferris, G. R., Russ, G. S., Albanese, R., & Martocchio, J. J. (1990). Personnel/Human
Resources Management, Unionization, and Strategy Determinants of Organizational
Performance. Human Resource Planning, 13,215-227.
14. Guest, D. E. (2011). Human Resource Management and performance: still searching for
some answers. Human Resource Management Journal, 21 (1), 3-13.
189
15. Hilderbrand M.E.,Grindle M.S.,Trostle J.A.(1997)Getting good government: Capacity
building in the public sectors of developing countries.
16. Huselid M.A.(1995).The Impact of Human Resource management policies on turnover,
productivity and corporate financial performance. Academy of Management journal.
17. Inyang B.J.(2011).Creating value through people :Best Human Resource Practices in
Nigeria …….Vol 2(!)
18. Jackson, S. E. and Schuler, R. S. (1990) Human resource planning Challenges for
industrial organizational psychologist. American Psychologist Vol. 45()pg 223-239..
19. Jackson, S. E. and Schuler, R. S. (1995). “Understanding Human Resource Management
in the Context of Organizations and their Environments.” In M. R. Rosenszweig & L.W.
Porter(Eds.), Annual Review of Psychology, 46: 237-264.
20. Janssens, M., & Steyaert, C. (2009). HRM and Performance: A Plea for Reflexivity in
HRM Studies. Journal of Management Studies, 46 (1), 143-155.
21. Johnson, Scholes and Whittington (2008).Exploring Corporate Strategy. (8thed).
London: Pearson Education Limited.
22. Koch M.J. and McGrath R.G.(1996).Improving labour productivity. Human resource
management policies do matter. Strategic management journal.
23. Kwasira J and Maina D.K.(2015).Role of human resource planning practices on
employee performance in county government in Kenya: A case study of Nakuru county.
International Journal of Economics, Commerce and Management United Kingdom Vol.
3(5).
24. Lado A. A. and Wilson M. C.(1994).Human resource systems and sustained competitive
advantage: A competency based perspective. Academy of Management review.
25. Latham, G., Sulsky, L. M., and MacDonald, H., Performance Management, (pp. 364-
384). Oxford University press.
26. McIlquham-Schmidt, A. (2010). “Appraising the empirical evidence of the relationship
between Strategic planning and corporate performance”. Accessed September 15, 2011
from www.hha.dk/man/cmsdocs/WP/2010/wp2010_03.pdf.
27. Nmadu, T.M. (2007).Strategic Management in some Nigerian Businesses: A business
reality. Journal of Management Research and Development Vol. 1 pg 17-23.
28. Oladipo J. A. and Abdulkadir D. S.(2011).Strategic Human Resource Management and
Organizational Performance in the Nigerian Manufacturing Sector: An Empirical
Investigation. International Journal of Business and Management Vol. 6( 9).
29. Pearce II, J. A., Robinson, Jr. & Richard B. (2007).Strategic Management, Formulation,
Implementation, and Control Tenth Edition. Boston, MA. McGraw-Hill/Irwin.
30. Pfeiffer, J. (1994).“Competitive Advantage through People: Unleashing the Power of the
Workforce.”Boston: Harvard Business School Press.
31. Robbins, S, Bergman, R, Stagg, I & Coulter M, (2008).Management 4th Ed, Australia,
Pearson Prentice Hall
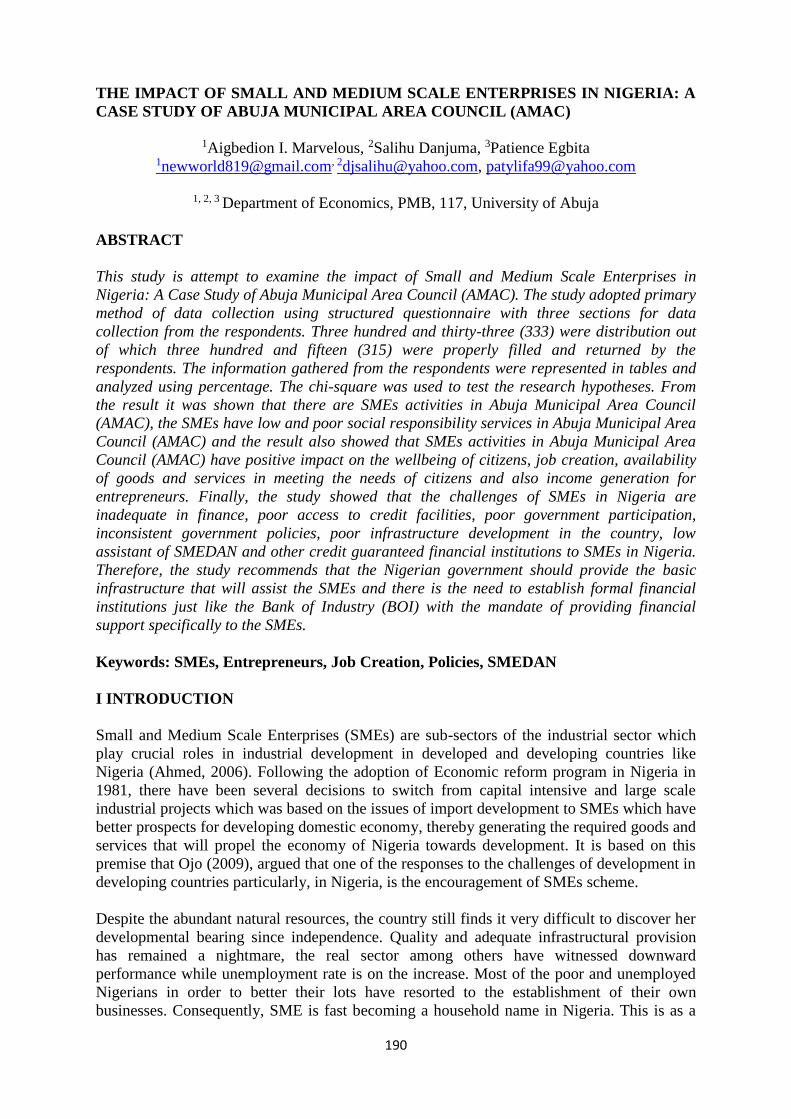
190
THE IMPACT OF SMALL AND MEDIUM SCALE ENTERPRISES IN NIGERIA: A
CASE STUDY OF ABUJA MUNICIPAL AREA COUNCIL (AMAC)
1Aigbedion I. Marvelous, 2Salihu Danjuma, 3Patience Egbita [email protected], [email protected], [email protected]
1, 2, 3 Department of Economics, PMB, 117, University of Abuja
ABSTRACT
This study is attempt to examine the impact of Small and Medium Scale Enterprises in
Nigeria: A Case Study of Abuja Municipal Area Council (AMAC). The study adopted primary
method of data collection using structured questionnaire with three sections for data
collection from the respondents. Three hundred and thirty-three (333) were distribution out
of which three hundred and fifteen (315) were properly filled and returned by the
respondents. The information gathered from the respondents were represented in tables and
analyzed using percentage. The chi-square was used to test the research hypotheses. From
the result it was shown that there are SMEs activities in Abuja Municipal Area Council
(AMAC), the SMEs have low and poor social responsibility services in Abuja Municipal Area
Council (AMAC) and the result also showed that SMEs activities in Abuja Municipal Area
Council (AMAC) have positive impact on the wellbeing of citizens, job creation, availability
of goods and services in meeting the needs of citizens and also income generation for
entrepreneurs. Finally, the study showed that the challenges of SMEs in Nigeria are
inadequate in finance, poor access to credit facilities, poor government participation,
inconsistent government policies, poor infrastructure development in the country, low
assistant of SMEDAN and other credit guaranteed financial institutions to SMEs in Nigeria.
Therefore, the study recommends that the Nigerian government should provide the basic
infrastructure that will assist the SMEs and there is the need to establish formal financial
institutions just like the Bank of Industry (BOI) with the mandate of providing financial
support specifically to the SMEs.
Keywords: SMEs, Entrepreneurs, Job Creation, Policies, SMEDAN
I INTRODUCTION
Small and Medium Scale Enterprises (SMEs) are sub-sectors of the industrial sector which
play crucial roles in industrial development in developed and developing countries like
Nigeria (Ahmed, 2006). Following the adoption of Economic reform program in Nigeria in
1981, there have been several decisions to switch from capital intensive and large scale
industrial projects which was based on the issues of import development to SMEs which have
better prospects for developing domestic economy, thereby generating the required goods and
services that will propel the economy of Nigeria towards development. It is based on this
premise that Ojo (2009), argued that one of the responses to the challenges of development in
developing countries particularly, in Nigeria, is the encouragement of SMEs scheme.
Despite the abundant natural resources, the country still finds it very difficult to discover her
developmental bearing since independence. Quality and adequate infrastructural provision
has remained a nightmare, the real sector among others have witnessed downward
performance while unemployment rate is on the increase. Most of the poor and unemployed
Nigerians in order to better their lots have resorted to the establishment of their own
businesses. Consequently, SME is fast becoming a household name in Nigeria. This is as a
191
result of the fact that the so called white collar jobs that people clamor for are no longer there.
Even, the touted sectors (Banks and companies) known to be the largest employer of labour
are on the down-turn following the consolidation crisis and fraudulent practice of the high
and mighty in the banking sector. The companies of course are folding up as a result of
erratic power supply, insecurity and persistent increase in interest rate which has led to high
cost of production and undermines profit making potentials of companies operating in
Nigeria. As a result of banking sector practices and continuous folding up of companies, a lot
of Nigerians are thrown into unemployment which inevitably detriment the economic
situation of the country (Ahmed, 2006).
Since the office jobs that people desire are no longer there for the teeming population, and
few ones that succeeded in getting the jobs are thrown out as a result of the factors identified
above, the need for the government and the people to have a rethink on the way-out of this
mess became imperative. Hence, the need for SMEs became a reality as a means of ensuring
self-independent, employment creation, import substitution, effective and efficient utilization
of local raw materials and contribution to the economic development of our dear nation
(Nigeria). All the so far stated benefits of Small and Medium Scale Enterprises cannot be
achieved without the direct intervention of the government and financial institutions. Over
the years, a number of policies have been formulated by the government with a view to
developing SMEs. Despite these government policies in Nigeria there has been stunted
growths and sluggish development in the SMEs regardless of increasing targeted government
assistance streamlined to benefit firms operating in this sector. There were several policies in
the past which gave priorities to SMEs development, indicating the trust in government
policy in support of SMEs. The government of Nigeria identified entrepreneurship
development as a major thrust to achieve economic development through SMEs growth and
development. Therefore, the main objective of the paper is to examine the impact of Small
and Medium Scale Enterprises in Nigeria: A Case Study of Abuja Municipal Area Council
(AMAC).
II LITERATURE REVIEW
There is also a statistical definition or conceptualization of SMEs, which tends to vary from
one country to another, and usually based on the number of employees or the value of the
assets of the enterprise. These is a lower limit for SMEs usually set at 5-10 workers and the
upper limit at 50-100 workers (Hallberg, 2000). Hallberg also notes that for medium
enterprises, the upper limit is set at between 100 and 250 workers. A weakness of this
definition is that it is difficult to compare size-distributions across countries. Further, it is
necessary to place the definition either based on assets or the number of workers side-by-side
with the level of development and sophistication of the economy. For instance, a small
enterprise in say the U.K. or USA could turn out to be a large company in say Nigeria, India,
Bolivia or Senegal.
In addition, Loveman & Sengenberger (1990) and Aremu (2010) all point to the fact that in
the definition and conceptualization of SMEs, the terms we referred to earlier are elusive
concepts. They contend that these definitions do hide a large heterogeneity in their types and
forms. Country studies undertaken by these scholars in the 1990s showed that the definitions
tend to vary. Depending on the institutional or historical contexts, major criteria for
structuring SMEs sector are legal status (as in France), the ownership status (Hungary), the
distribution between “craft” and “industrial” firms (Germany) or independent and subordinate
firms (Japan), or small firms in industries where large enterprises dominate or where there is

192
a mixed-size composition. Such structural variety within and across national boundaries will
have to be taken into account when analyzing SMEs.
In the case of Nigeria hardly do you see a clear-cut definition that distinguishes between
small and medium scale enterprises. However, the Central Bank of Nigeria in its monetary
policies view small scale industries are those enterprises which have annual turnover not
exceeding 500,000 naira.(CBN; 1992) Similarly in 1990 the Federal Government of Nigeria
defined small scale enterprises for the purpose of commercial bank loans as those enterprises
whose annual turnover does not exceed 500,000 thousand naira and for merchant bank loan
those enterprises with capital investment not exceeding 2 million naira (excluding the cost of
land) or a minimum of 5 million naira (Amadieu, 1999) .
Small and medium scale enterprises’, ‘small and medium enterprises’, ‘small and medium
industries’, are some of the terms that are used interchangeably to describe this group of
business organizations. They are a very heterogeneous group because they embrace a wide
variety and diverse forms ranging from village handcraft makers/outfits, small machine
shops, restaurants and computer software firms (Beyene, 1999).
Noticeable impacts of SMEs are its contribution to the development of indigenous
entrepreneurship. Mention is being made of the Dantatas, Fajemirokuns, Dangotes,
Igbinedions, Ekene Dili Chukwus, ilodibes, Dankabos and the Amazus. Its contribution to the
mobilization of domestic savings and utilization of local resources is also a noticeable factor.
They serve as good agents for disposal of industrial products and some services and have
contributed immensely to the production of raw materials in the form of semi-processed
goods for use by bigger industries. It is a base for the development of appropriate technology
and provides a veritable ground for skilled, unskilled and semi-skilled workers. It has
provided productive self-employment to a number of educated and less educated young men
and women coming out of schools, colleges, polytechnic, and universities.
Ayozie (2004) specifically mentioned the role in the accelerated industrial development by
enlarging the supply of entrepreneurs and the enlarging of small and medium enterprise
sector, which offers better potential for employment generation and wider dispersal of
industrial ownership. It has assorted in improving the performance of small industries by
enlarging the supply of carefully selected and trained well rounded entrepreneurs and
diversifying sources of entrepreneurship and business ownership.
Tijani (2004) enumerated that the entrepreneur viz a viz the small scale business person is the
most critical factors in the economic development of any Nation. Entrepreneur organizes, and
utilizes the various factors of production and finally sets productive machinery in action
towards overall economic development; consequently, the availability of the small scale
industry is therefore the undisputed precondition for economic growth.
III METHODOLOGY
A. Population and Sample Size of the study
The research population of this study covers SMEs in Abuja Municipal Area Council
(AMAC). This population of the study was considered because of the objective of the study
and the high rate of SMEs activities in recent years and access to research information. The
instrument of data collection for this study is questionnaire, the questionnaire contained two
sections; the first part is the classification, which includes respondents’ bio-data like sex, age,
193
occupation, qualification etc. the second part possesses the questions relating to the subject
matter of investigation. Sample size of study is three hundred and thirty-three (333) through
simple random sampling technique and three hundred and thirty-three (333) questionnaires
was also designed and administered out of which three hundred and fifteen (315) were
properly filled by the respondents and returned. Therefore, the total number of questionnaires
ready for the research analysis were three hundred and fifteen (315).
B. Validation of Research Instrument
The reliability of the instrument of SMEs data inventory was ascertained using the split-half
method. The score recorded was grouped into halves, positive and negative numbers. The
result was analyzed using product moment correlation coefficient to show if the coefficient is
high enough to accept the instrument for the study. From the result the product moment
correlation coefficient was 2.9 which shows that instrument was reliable.
C. Method of Data Analysis
The method of data analysis adopted by the researcher in this work is the disruptive analysis,
the simple percentage approach or the chi-square method was used to analyze the research
information and data gotten from the questionnaire or respondents. This information gathered
through questionnaire were represented in numerical figures and arranged in tabular form.
The percentages of the figures were used in order to serve as indicators of effectiveness. The
chi-square method was used for hypothesis testing value. It was used to judge the findings.
The tabular value at the chosen level of significant at (r-1) (c-1) degree of freedom will be
determined. Also, the sample value was computed using the chi-square formula
X2 = {(fo –fe)2
fe
Where:
Fo is the Observed frequency, Fe is the Expected frequency, is the Ho Null hypothesis and
H1 is the Alterative hypothesis. The two results will be compared and decision is taken as
follows. If the calculated value is greater than the tabular value, we reject the null hypothesis
(H0) and concluded in favour of the alternative ‘Hypothesis’ (H1) and vice-versa.
IV PRESENTATION AND DATA ANALYSIS
A. Data Presentation
The information gathered from the respondents through questionnaire were presented in this
chapter. The information were presented in tables and each table is analyzed and explained
using percentage. Total of three hundred and fifteen (315) questionnaire were properly filled
and returned by the respondents against the three hundred and thirty-three (333) distributed to
the respondents. Therefore, the discussion and judgement of this study is based on the
numbers. The test of hypotheses was done using chi-square method and each hypothesis was
tested and interpreted based on the result. Finally, discussion of the results were done.
B. Presentation of Data
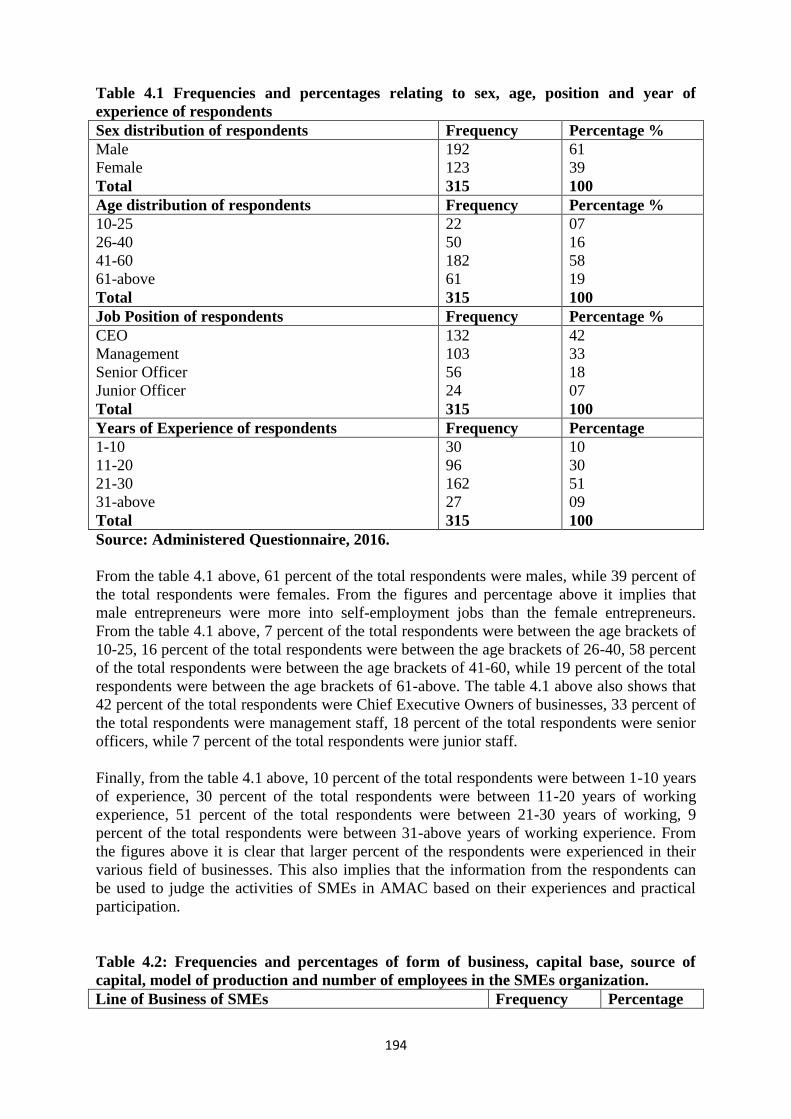
194
Table 4.1 Frequencies and percentages relating to sex, age, position and year of
experience of respondents
Sex distribution of respondents Frequency Percentage %
Male
Female
Total
192
123
315
61
39
100
Age distribution of respondents Frequency Percentage %
10-25
26-40
41-60
61-above
Total
22
50
182
61
315
07
16
58
19
100
Job Position of respondents Frequency Percentage %
CEO
Management
Senior Officer
Junior Officer
Total
132
103
56
24
315
42
33
18
07
100
Years of Experience of respondents Frequency Percentage
1-10
11-20
21-30
31-above
Total
30
96
162
27
315
10
30
51
09
100
Source: Administered Questionnaire, 2016.
From the table 4.1 above, 61 percent of the total respondents were males, while 39 percent of
the total respondents were females. From the figures and percentage above it implies that
male entrepreneurs were more into self-employment jobs than the female entrepreneurs.
From the table 4.1 above, 7 percent of the total respondents were between the age brackets of
10-25, 16 percent of the total respondents were between the age brackets of 26-40, 58 percent
of the total respondents were between the age brackets of 41-60, while 19 percent of the total
respondents were between the age brackets of 61-above. The table 4.1 above also shows that
42 percent of the total respondents were Chief Executive Owners of businesses, 33 percent of
the total respondents were management staff, 18 percent of the total respondents were senior
officers, while 7 percent of the total respondents were junior staff.
Finally, from the table 4.1 above, 10 percent of the total respondents were between 1-10 years
of experience, 30 percent of the total respondents were between 11-20 years of working
experience, 51 percent of the total respondents were between 21-30 years of working, 9
percent of the total respondents were between 31-above years of working experience. From
the figures above it is clear that larger percent of the respondents were experienced in their
various field of businesses. This also implies that the information from the respondents can
be used to judge the activities of SMEs in AMAC based on their experiences and practical
participation.
Table 4.2: Frequencies and percentages of form of business, capital base, source of
capital, model of production and number of employees in the SMEs organization.
Line of Business of SMEs Frequency Percentage
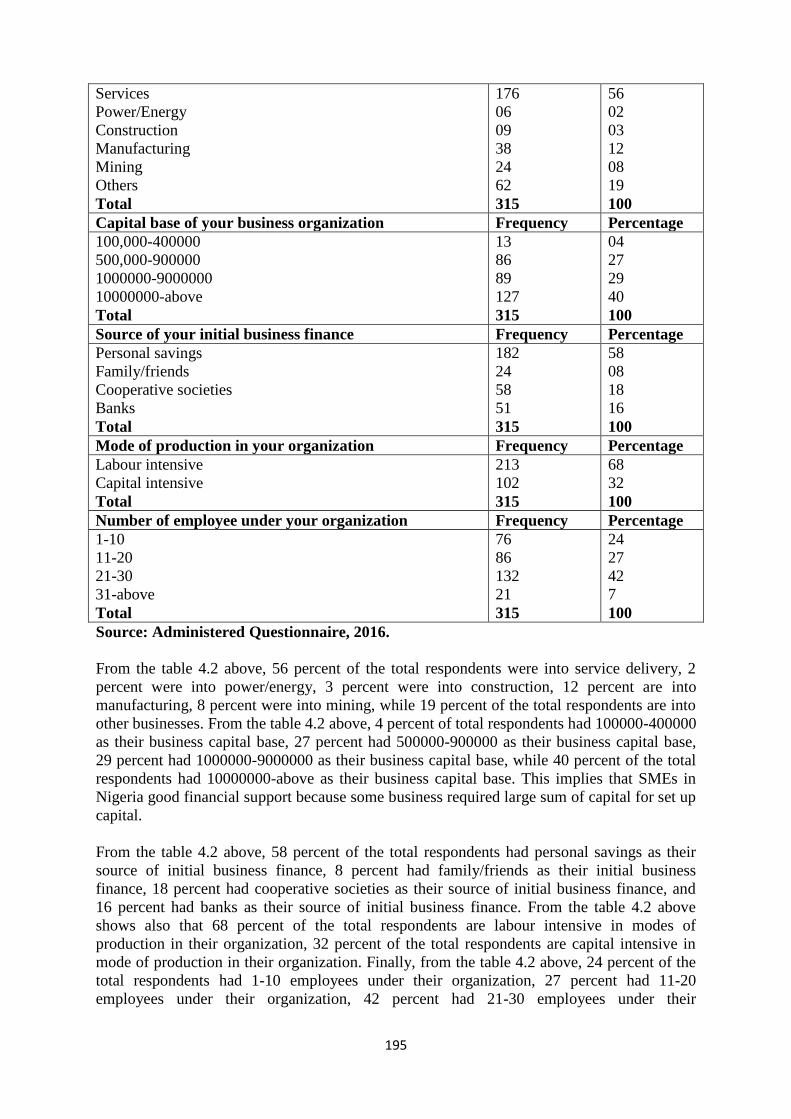
195
Services
Power/Energy
Construction
Manufacturing
Mining
Others
Total
176
06
09
38
24
62
315
56
02
03
12
08
19
100
Capital base of your business organization Frequency Percentage
100,000-400000
500,000-900000
1000000-9000000
10000000-above
Total
13
86
89
127
315
04
27
29
40
100
Source of your initial business finance Frequency Percentage
Personal savings
Family/friends
Cooperative societies
Banks
Total
182
24
58
51
315
58
08
18
16
100
Mode of production in your organization Frequency Percentage
Labour intensive
Capital intensive
Total
213
102
315
68
32
100
Number of employee under your organization Frequency Percentage
1-10
11-20
21-30
31-above
Total
76
86
132
21
315
24
27
42
7
100
Source: Administered Questionnaire, 2016.
From the table 4.2 above, 56 percent of the total respondents were into service delivery, 2
percent were into power/energy, 3 percent were into construction, 12 percent are into
manufacturing, 8 percent were into mining, while 19 percent of the total respondents are into
other businesses. From the table 4.2 above, 4 percent of total respondents had 100000-400000
as their business capital base, 27 percent had 500000-900000 as their business capital base,
29 percent had 1000000-9000000 as their business capital base, while 40 percent of the total
respondents had 10000000-above as their business capital base. This implies that SMEs in
Nigeria good financial support because some business required large sum of capital for set up
capital.
From the table 4.2 above, 58 percent of the total respondents had personal savings as their
source of initial business finance, 8 percent had family/friends as their initial business
finance, 18 percent had cooperative societies as their source of initial business finance, and
16 percent had banks as their source of initial business finance. From the table 4.2 above
shows also that 68 percent of the total respondents are labour intensive in modes of
production in their organization, 32 percent of the total respondents are capital intensive in
mode of production in their organization. Finally, from the table 4.2 above, 24 percent of the
total respondents had 1-10 employees under their organization, 27 percent had 11-20
employees under their organization, 42 percent had 21-30 employees under their
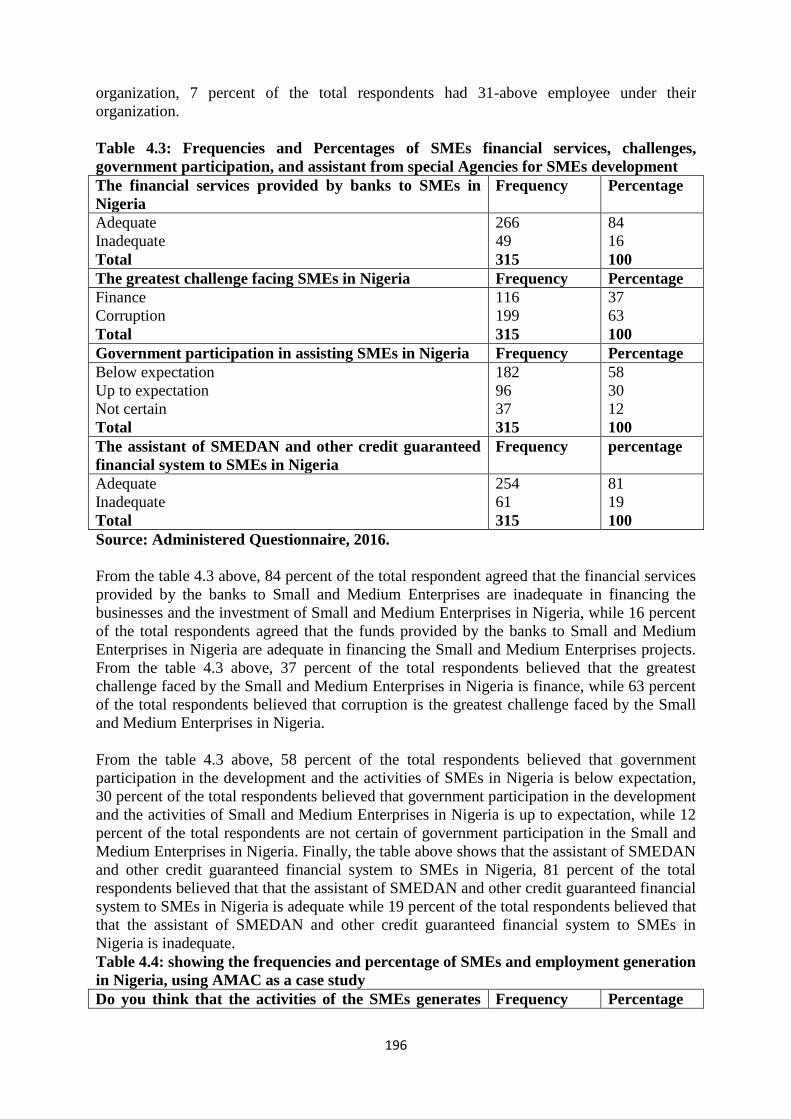
196
organization, 7 percent of the total respondents had 31-above employee under their
organization.
Table 4.3: Frequencies and Percentages of SMEs financial services, challenges,
government participation, and assistant from special Agencies for SMEs development
The financial services provided by banks to SMEs in
Nigeria
Frequency
Percentage
Adequate
Inadequate
Total
266
49
315
84
16
100
The greatest challenge facing SMEs in Nigeria Frequency Percentage
Finance
Corruption
Total
116
199
315
37
63
100
Government participation in assisting SMEs in Nigeria Frequency Percentage
Below expectation
Up to expectation
Not certain
Total
182
96
37
315
58
30
12
100
The assistant of SMEDAN and other credit guaranteed
financial system to SMEs in Nigeria
Frequency percentage
Adequate
Inadequate
Total
254
61
315
81
19
100
Source: Administered Questionnaire, 2016.
From the table 4.3 above, 84 percent of the total respondent agreed that the financial services
provided by the banks to Small and Medium Enterprises are inadequate in financing the
businesses and the investment of Small and Medium Enterprises in Nigeria, while 16 percent
of the total respondents agreed that the funds provided by the banks to Small and Medium
Enterprises in Nigeria are adequate in financing the Small and Medium Enterprises projects.
From the table 4.3 above, 37 percent of the total respondents believed that the greatest
challenge faced by the Small and Medium Enterprises in Nigeria is finance, while 63 percent
of the total respondents believed that corruption is the greatest challenge faced by the Small
and Medium Enterprises in Nigeria.
From the table 4.3 above, 58 percent of the total respondents believed that government
participation in the development and the activities of SMEs in Nigeria is below expectation,
30 percent of the total respondents believed that government participation in the development
and the activities of Small and Medium Enterprises in Nigeria is up to expectation, while 12
percent of the total respondents are not certain of government participation in the Small and
Medium Enterprises in Nigeria. Finally, the table above shows that the assistant of SMEDAN
and other credit guaranteed financial system to SMEs in Nigeria, 81 percent of the total
respondents believed that that the assistant of SMEDAN and other credit guaranteed financial
system to SMEs in Nigeria is adequate while 19 percent of the total respondents believed that
that the assistant of SMEDAN and other credit guaranteed financial system to SMEs in
Nigeria is inadequate.
Table 4.4: showing the frequencies and percentage of SMEs and employment generation
in Nigeria, using AMAC as a case study
Do you think that the activities of the SMEs generates Frequency Percentage
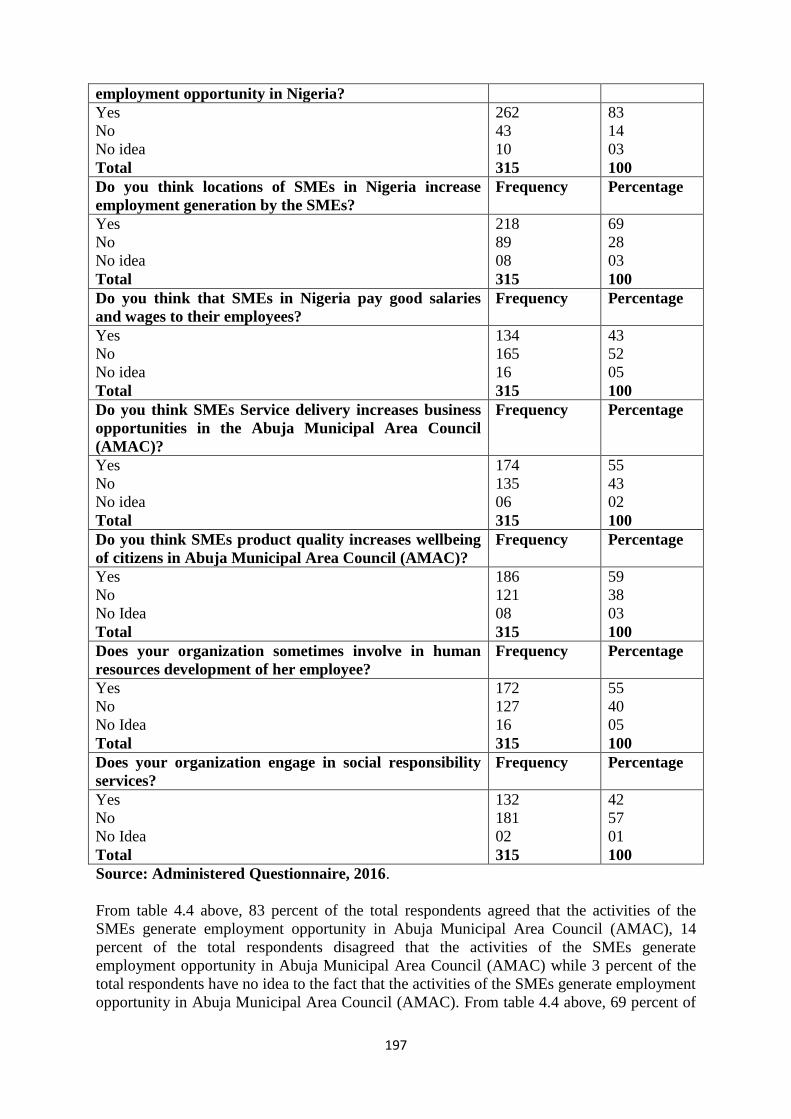
197
employment opportunity in Nigeria?
Yes
No
No idea
Total
262
43
10
315
83
14
03
100
Do you think locations of SMEs in Nigeria increase
employment generation by the SMEs?
Frequency Percentage
Yes
No
No idea
Total
218
89
08
315
69
28
03
100
Do you think that SMEs in Nigeria pay good salaries
and wages to their employees?
Frequency Percentage
Yes
No
No idea
Total
134
165
16
315
43
52
05
100
Do you think SMEs Service delivery increases business
opportunities in the Abuja Municipal Area Council
(AMAC)?
Frequency Percentage
Yes
No
No idea
Total
174
135
06
315
55
43
02
100
Do you think SMEs product quality increases wellbeing
of citizens in Abuja Municipal Area Council (AMAC)?
Frequency Percentage
Yes
No
No Idea
Total
186
121
08
315
59
38
03
100
Does your organization sometimes involve in human
resources development of her employee?
Frequency Percentage
Yes
No
No Idea
Total
172
127
16
315
55
40
05
100
Does your organization engage in social responsibility
services?
Frequency Percentage
Yes
No
No Idea
Total
132
181
02
315
42
57
01
100
Source: Administered Questionnaire, 2016.
From table 4.4 above, 83 percent of the total respondents agreed that the activities of the
SMEs generate employment opportunity in Abuja Municipal Area Council (AMAC), 14
percent of the total respondents disagreed that the activities of the SMEs generate
employment opportunity in Abuja Municipal Area Council (AMAC) while 3 percent of the
total respondents have no idea to the fact that the activities of the SMEs generate employment
opportunity in Abuja Municipal Area Council (AMAC). From table 4.4 above, 69 percent of

198
the total respondents agreed that locations of SMEs in Nigeria increase employment
generation by the SMEs, 28 percent of the total respondents disagreed that locations of SMEs
in Nigeria increase employment generation by the SMEs, while 3 percent of the total
respondents have no idea to the fact that locations of SMEs in Nigeria increase employment
generation by the SMEs.
From table 4.4 above, 43 percent of the total respondents agreed that SMEs in Nigeria pay
good salaries and wages to their employees, 52 percent of the total respondents disagreed that
SMEs in Nigeria pay good salaries and wages to their employees, while 5 percent of the total
respondents have no idea on the fact that SMEs in Nigeria pay good salaries and wages to
their employees. From table 4.4 above, 55 percent of the total respondents agreed that SMEs
Service delivery increases business opportunities in the Abuja Municipal Area Council
(AMAC), 43 percent of the total respondents disagreed that SMEs Service delivery increases
business opportunities in the Abuja Municipal Area Council (AMAC), while 2 percent of the
total respondents have no idea on the fact that SMEs Service delivery increases business
opportunities in the Abuja Municipal Area Council (AMAC).
From table 4.4 above, 59 percent of the total respondents agreed that SMEs product quality
increases wellbeing of citizens in Abuja Municipal Area Council (AMAC), 38 percent of the
total respondents disagreed that SMEs product quality increases wellbeing of citizens in
Abuja Municipal Area Council (AMAC), while 3 percent of the total respondents have no
idea on the fact that SMEs product quality increases wellbeing of citizens in Abuja Municipal
Area Council (AMAC). From table 4.4 above, 55 percent of the total respondents agreed that
their organization sometimes involve in human resources development of her employees, 40
percent of the total respondents disagreed that their organization sometimes involve in human
resources development of her employees and 5 percent of the total respondents have no idea
on the fact that their organization sometimes involve in human resources development of her
employees.
Finally, from table 4.4 above, 42 percent of the total respondents agreed that their
organization engage in social responsibility services, 57 percent of the total respondents
disagreed that their organization engage in social responsibility services and 1 percent of the
total respondents have no idea on the fact that their organization engage in social
responsibility services.
C. Test of Hypotheses
In this section, the hypotheses formulated in chapter one to ascertain the rejection or
acceptance of the null hypotheses is tested using chi-squares (x2) statistical techniques and
the table values.
Test of Hypothesis I
Table 4.5: Chi-square testing of hypothesis I
Options Observed Expected Residual Table Chi-
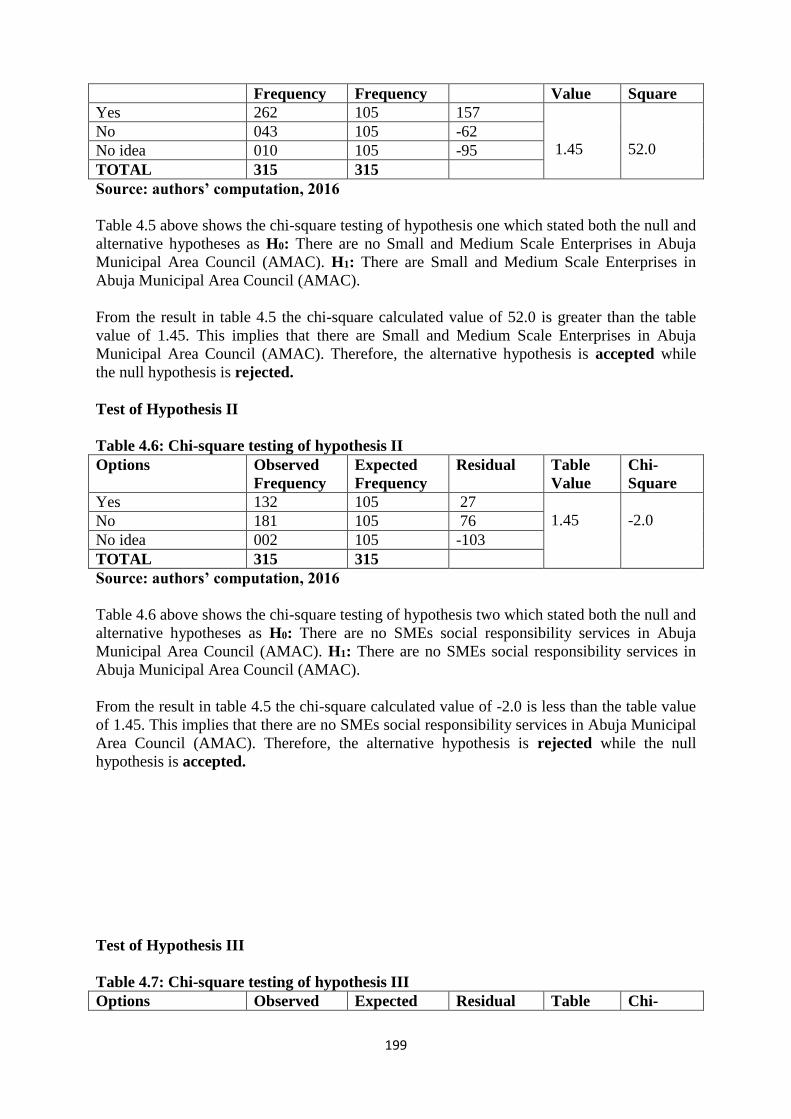
199
Frequency Frequency Value Square
Yes 262 105 157
1.45
52.0 No 043 105 -62
No idea 010 105 -95
TOTAL 315 315
Source: authors’ computation, 2016
Table 4.5 above shows the chi-square testing of hypothesis one which stated both the null and
alternative hypotheses as H0: There are no Small and Medium Scale Enterprises in Abuja
Municipal Area Council (AMAC). H1: There are Small and Medium Scale Enterprises in
Abuja Municipal Area Council (AMAC).
From the result in table 4.5 the chi-square calculated value of 52.0 is greater than the table
value of 1.45. This implies that there are Small and Medium Scale Enterprises in Abuja
Municipal Area Council (AMAC). Therefore, the alternative hypothesis is accepted while
the null hypothesis is rejected.
Test of Hypothesis II
Table 4.6: Chi-square testing of hypothesis II
Options Observed
Frequency
Expected
Frequency
Residual Table
Value
Chi-
Square
Yes 132 105 27
1.45
-2.0 No 181 105 76
No idea 002 105 -103
TOTAL 315 315
Source: authors’ computation, 2016
Table 4.6 above shows the chi-square testing of hypothesis two which stated both the null and
alternative hypotheses as H0: There are no SMEs social responsibility services in Abuja
Municipal Area Council (AMAC). H1: There are no SMEs social responsibility services in
Abuja Municipal Area Council (AMAC).
From the result in table 4.5 the chi-square calculated value of -2.0 is less than the table value
of 1.45. This implies that there are no SMEs social responsibility services in Abuja Municipal
Area Council (AMAC). Therefore, the alternative hypothesis is rejected while the null
hypothesis is accepted.
Test of Hypothesis III
Table 4.7: Chi-square testing of hypothesis III
Options Observed Expected Residual Table Chi-
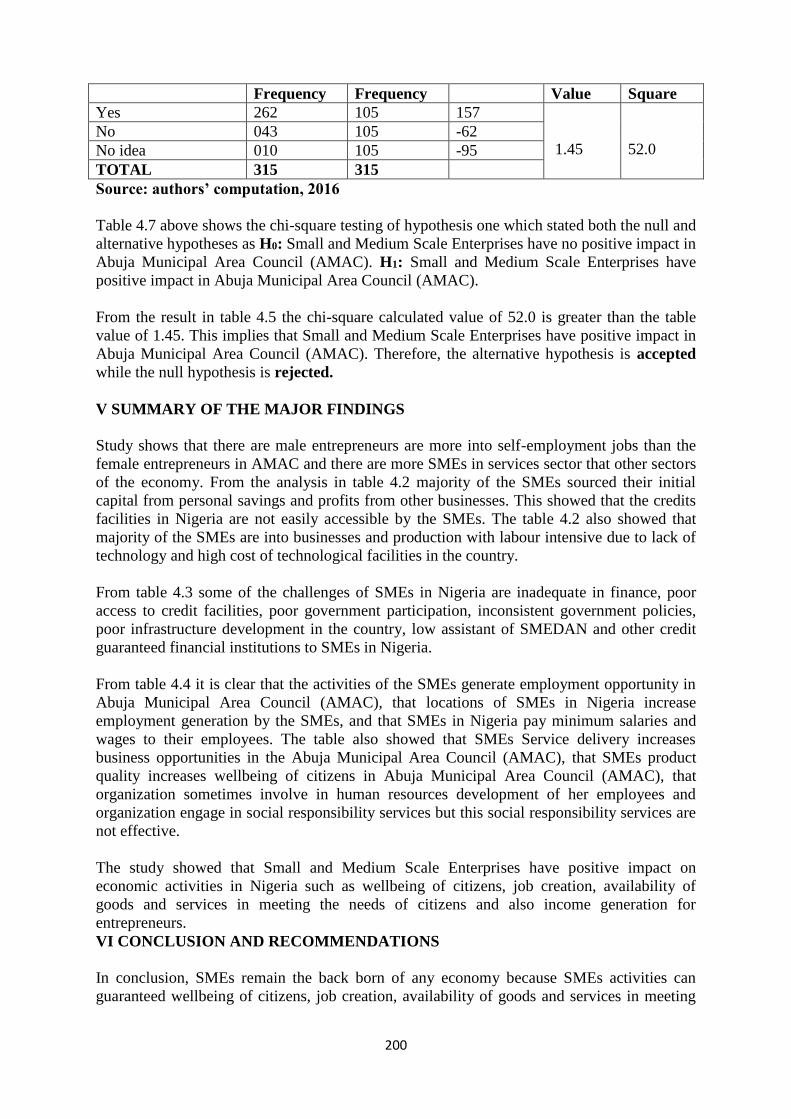
200
Frequency Frequency Value Square
Yes 262 105 157
1.45
52.0 No 043 105 -62
No idea 010 105 -95
TOTAL 315 315
Source: authors’ computation, 2016
Table 4.7 above shows the chi-square testing of hypothesis one which stated both the null and
alternative hypotheses as H0: Small and Medium Scale Enterprises have no positive impact in
Abuja Municipal Area Council (AMAC). H1: Small and Medium Scale Enterprises have
positive impact in Abuja Municipal Area Council (AMAC).
From the result in table 4.5 the chi-square calculated value of 52.0 is greater than the table
value of 1.45. This implies that Small and Medium Scale Enterprises have positive impact in
Abuja Municipal Area Council (AMAC). Therefore, the alternative hypothesis is accepted
while the null hypothesis is rejected.
V SUMMARY OF THE MAJOR FINDINGS
Study shows that there are male entrepreneurs are more into self-employment jobs than the
female entrepreneurs in AMAC and there are more SMEs in services sector that other sectors
of the economy. From the analysis in table 4.2 majority of the SMEs sourced their initial
capital from personal savings and profits from other businesses. This showed that the credits
facilities in Nigeria are not easily accessible by the SMEs. The table 4.2 also showed that
majority of the SMEs are into businesses and production with labour intensive due to lack of
technology and high cost of technological facilities in the country.
From table 4.3 some of the challenges of SMEs in Nigeria are inadequate in finance, poor
access to credit facilities, poor government participation, inconsistent government policies,
poor infrastructure development in the country, low assistant of SMEDAN and other credit
guaranteed financial institutions to SMEs in Nigeria.
From table 4.4 it is clear that the activities of the SMEs generate employment opportunity in
Abuja Municipal Area Council (AMAC), that locations of SMEs in Nigeria increase
employment generation by the SMEs, and that SMEs in Nigeria pay minimum salaries and
wages to their employees. The table also showed that SMEs Service delivery increases
business opportunities in the Abuja Municipal Area Council (AMAC), that SMEs product
quality increases wellbeing of citizens in Abuja Municipal Area Council (AMAC), that
organization sometimes involve in human resources development of her employees and
organization engage in social responsibility services but this social responsibility services are
not effective.
The study showed that Small and Medium Scale Enterprises have positive impact on
economic activities in Nigeria such as wellbeing of citizens, job creation, availability of
goods and services in meeting the needs of citizens and also income generation for
entrepreneurs.
VI CONCLUSION AND RECOMMENDATIONS
In conclusion, SMEs remain the back born of any economy because SMEs activities can
guaranteed wellbeing of citizens, job creation, availability of goods and services in meeting
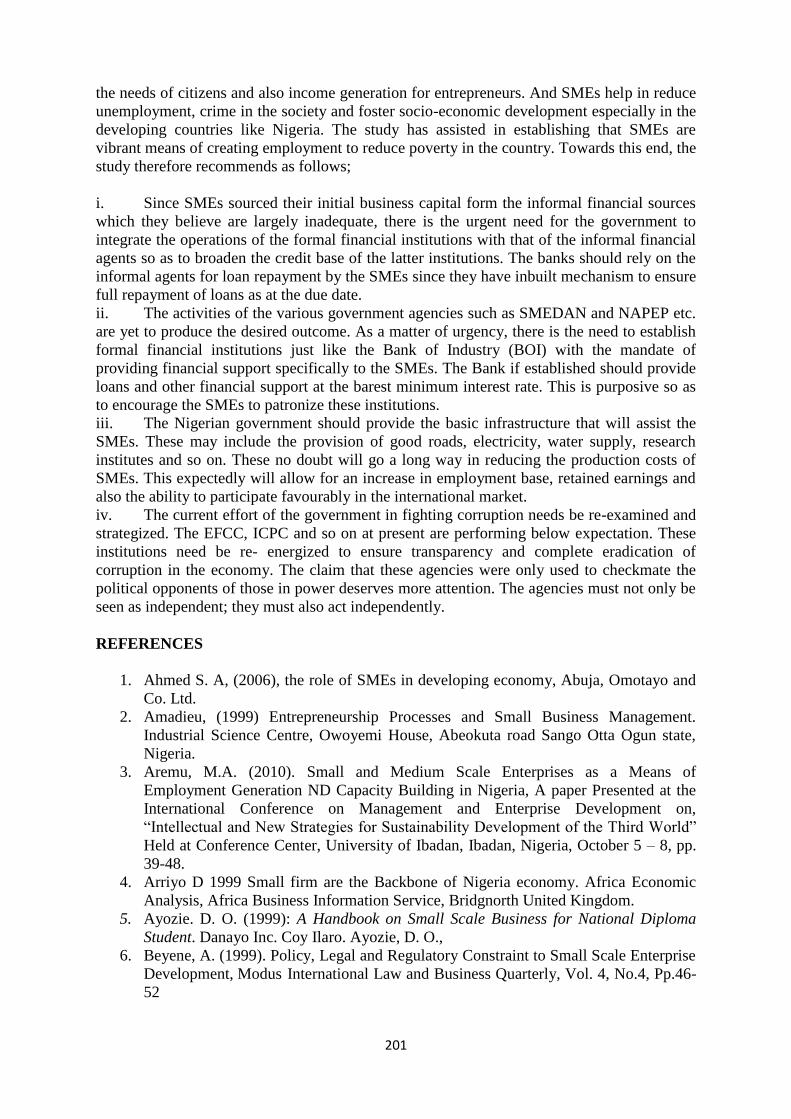
201
the needs of citizens and also income generation for entrepreneurs. And SMEs help in reduce
unemployment, crime in the society and foster socio-economic development especially in the
developing countries like Nigeria. The study has assisted in establishing that SMEs are
vibrant means of creating employment to reduce poverty in the country. Towards this end, the
study therefore recommends as follows;
i. Since SMEs sourced their initial business capital form the informal financial sources
which they believe are largely inadequate, there is the urgent need for the government to
integrate the operations of the formal financial institutions with that of the informal financial
agents so as to broaden the credit base of the latter institutions. The banks should rely on the
informal agents for loan repayment by the SMEs since they have inbuilt mechanism to ensure
full repayment of loans as at the due date.
ii. The activities of the various government agencies such as SMEDAN and NAPEP etc.
are yet to produce the desired outcome. As a matter of urgency, there is the need to establish
formal financial institutions just like the Bank of Industry (BOI) with the mandate of
providing financial support specifically to the SMEs. The Bank if established should provide
loans and other financial support at the barest minimum interest rate. This is purposive so as
to encourage the SMEs to patronize these institutions.
iii. The Nigerian government should provide the basic infrastructure that will assist the
SMEs. These may include the provision of good roads, electricity, water supply, research
institutes and so on. These no doubt will go a long way in reducing the production costs of
SMEs. This expectedly will allow for an increase in employment base, retained earnings and
also the ability to participate favourably in the international market.
iv. The current effort of the government in fighting corruption needs be re-examined and
strategized. The EFCC, ICPC and so on at present are performing below expectation. These
institutions need be re- energized to ensure transparency and complete eradication of
corruption in the economy. The claim that these agencies were only used to checkmate the
political opponents of those in power deserves more attention. The agencies must not only be
seen as independent; they must also act independently.
REFERENCES
1. Ahmed S. A, (2006), the role of SMEs in developing economy, Abuja, Omotayo and
Co. Ltd.
2. Amadieu, (1999) Entrepreneurship Processes and Small Business Management.
Industrial Science Centre, Owoyemi House, Abeokuta road Sango Otta Ogun state,
Nigeria.
3. Aremu, M.A. (2010). Small and Medium Scale Enterprises as a Means of
Employment Generation ND Capacity Building in Nigeria, A paper Presented at the
International Conference on Management and Enterprise Development on,
“Intellectual and New Strategies for Sustainability Development of the Third World”
Held at Conference Center, University of Ibadan, Ibadan, Nigeria, October 5 – 8, pp.
39-48.
4. Arriyo D 1999 Small firm are the Backbone of Nigeria economy. Africa Economic
Analysis, Africa Business Information Service, Bridgnorth United Kingdom.
5. Ayozie. D. O. (1999): A Handbook on Small Scale Business for National Diploma
Student. Danayo Inc. Coy Ilaro. Ayozie, D. O.,
6. Beyene, A. (1999). Policy, Legal and Regulatory Constraint to Small Scale Enterprise
Development, Modus International Law and Business Quarterly, Vol. 4, No.4, Pp.46-
52

202
7. CBN Bullion, (1992), Central Bank of Nigeria (CBN) Prudential guidelines for
commercial banks.
8. Hallberg, K. (2000). ‘A market oriented strategy for small and medium enterprises’
9. Loveman, G. and W. Sengenberger (1990), in Sengenberger, W. et al. (eds), The
Reemergence of Small Enterprises, (Geneva: ILO).
10. Ojo O. (2009), Impact of Micro Finance on Entrepreneurial Development: A case of
Nigeria. A paper presented at the International Conference on economic and
administration, organized by the faculty of Administration and Business, University
of Bucharest, Romania, 14th -15th November, 2009.
11. Tijani Alawe, (2004) Entrepreneurship Processes and Small Business Management.
Industrial Science Centre, Owoyemi House, Abeokuta road Sango Otta Ogun state,
Nigeria.
203
EFFECTS OF ELECTRONIC BANKING SERVICE QUALITY ON CUSTOMER
SATISFACTION
MUSA, Abdulqadir Sadiq 1, HASSAN Umar Umar2
1Department of Business Administration,
Federal Polytechnic, Nasarawa,
2Department of Business Administration,
Faculty of Administrations,
Nasarawa state university, Nigeria,
[email protected]/ [email protected]
Abstract
This study investigated effects of electronic banking service quality on customer satisfaction.
E-banking was introduced and adopted in Nigeria with the objectives of ensuring efficient
operations and customer satisfaction. This raises concerns as to whether these platforms are
achieving the objectives they are meant to achieve of efficient service delivery. The main
objective of this study is to examine the effects of electronic banking service quality on
customer satisfaction. The study is confined to a period of ten (10) years (2005-2014)
because this period witnessed an increase in the use of e-banking platforms especially in
Nigeria. The study used descriptive and specifically survey research method. The ordinary
least square (OLS) was used to analyze data by a software statistical package was utilized in
measuring effect of e-banking service quality on customer satisfaction. The study therefore
concludes that there is a significant relationship between electronic banking service quality
(internet banking: efficient operations, reliability needs and user friendliness) and customer
satisfaction.
It is therefore recommended that the bank should improve on their internet banking service
quality (efficient operations, reliability needs solution and user friendliness) by ensuring a
more dependable, reliable and efficient service since the proxies are all significant to
customer satisfaction. It study further recommended that the bank should try to encourage
more customers to use the automated teller machine by establishing more secured and
reliable automated teller machine centres and sensitizing customers on how to make use of
them, since its efficient operations, reliability needs solution and user friendliness contribute
to customer satisfaction in UBA, Nasarawa State. Lastly, the UBA mobile banking: efficient
operations, reliability needs and user friendliness standard should be maintained by
improving on mobile application packages since the proxies lead to customer satisfaction
(CS) in UBA, Nasarawa State.
KEYWORDS: Electronic banking, Service Quality, Customers Satisfaction.
Introduction
Universal banking practice in Nigeria and the adoption of electronic banking by Deposit
Money banks have offered increased services to customers with attendant increase in
customer risk exposure which improved bank performance in terms of service delivery and
customer satisfaction. Timothy (2012) posited that three or four decades ago, banking was a
simple business; consumers saved their money with and received their financial services from
banks. When customers open savings account, they received passbook from the bank with
which the account would be operated; and when it is a current accounts, they received cheque
books for the same purpose.

204
Today, the banking industry has moved into an era of menu-driven ultra-robust specialized
software programmes called banking applications. These applications can carry out virtually
all banking functions relying heavily on information collection, storage, transfer and
processing The application of electronic banking products to banking operations has become
a subject of fundamental importance and concerns to all banks operating within Nigeria and
indeed a condition for local and global competiveness (Ezeoha, 2006).
Technology is making a tremendous impact upon service companies in general and the
financial services sector is no exception. The application of information and communication
technology concepts, techniques, policies and implementation strategies to banking services
has become a subject of fundamental importance and concerns to all banks and indeed a
prerequisite for local and global competitiveness in banking industry. As a result of this
technological improvement, business environment in financial sector is extremely dynamic
and experience rapid changes and demands banks to serve their customer electronically.The
evolution of e-banking started from the use of Automatic Teller Machine (ATM) and Finland
is the first country in the world to have taken a lead in e-banking (Mishra & Kiranmai, 2009).
E-banking has been widely used in developed countries and in developing economies.
However, some challenges are pertinent to e- banking, as was reported in its recent annual
reports (2014) , The Nigeria Deposit Insurance Corporation (NDIC) stated in the report that
“the Deposit Money Banks reported 10,612 fraud cases in 2014 compared with 3,786 cases in
2013. The increase of 7.57% percent in expected/actual loss in fraud and forgeries was
mainly due to the astronomical increase in the incidence of web-based (internet banking),
Automated Teller Machine and fraudulent transfer/withdrawal of deposit funds”. (NDIC
2014). As you can see, platforms that are supposed to satisfy customers and increase bank
profitability, the reverse seems to be the case, and it’s the customer funds that are pilfered
electronically. The report served as the motivation for carrying out this research in order to
find out the effect of e-banking service quality on customer satisfaction.
Empirical studies carried out over the years in various countries, using various methodologies
and variables showed mixed, and/or inconclusive results. Thus giving room for further
research using different variables and methodologies. For example, Jannatul (2010) in
Bangladesh used variables (responsiveness, reliability, assurance, tangibles and empathy) and
primary data as his measures of satisfaction to examine impact of e-banking on customer
satisfaction. He found that reliability, responsiveness and assurance contribute more to
satisfaction of customers of e-banking in Bangladesh. In Nigeria, Ogunlowore and Oladele
(2014) used chi-square to measure impact of e-banking on customer satisfaction. The study
found that there is a significant relationship between electronic banking and customer
satisfaction.
There are little researches that have been conducted especially in Nigeria, in the aspect of
electronic banking with specific reference to the electronic platform variables: internet,
automated teller machine (ATM)and mobile banking. Most researchers have aggregated the
electronic banking platforms, they have mistakenly assumed online/internet banking services
as the sole/only electronic banking platform thereby isolating other essential sub divisional
platforms such as Automated Teller Machine and Mobile Banking quality as mentioned
above. Some studied the platforms as independent of one another. Other researchers actually
studied effects of service quality on customer satisfaction, using measures of service quality
(responsiveness, reliability, empathy etc.) as their independent variables. In addition, most
previous researchers used lower statistical tools such as percentages to analyse their

205
variables. It is against the aforementioned background that this research uses different
dimension to study the effects of three major e -banking platforms (internet, automated teller
machine and mobile banking service quality) on customer satisfaction.
The main objective of this is to examine the effects of electronic banking service quality on
customer satisfaction in UBA. Nig. Plc. The specific objectives of this study are to: examine
the effect of internet banking quality on customer satisfaction in UBA Nig. Plc., assess the
availability of automated teller machine quality on customer satisfaction in UBA Nig. Plc and
determine the effect of mobile banking quality on customer satisfaction in UBA Nig. Plc.
On the bases of the above objectives, the study formulates the following null research
hypotheses:
H01 Internet banking quality has no significant effect on customer satisfaction in UBA. Plc.
H02 Automated teller machine availability has no significant effect on customer satisfaction in
UBA. Plc.
H03 Mobile banking quality has no significant effect on customer satisfaction in UBA. Plc.
Review of Empirical Studies on Electronic Banking and Customer Satisfaction
Jannatul (2010) conducted a research to understand the effect of e-banking on customer
satisfaction in Bangladesh. Five service quality dimensions namely reliability,
responsiveness, assurance, empathy, and tangibles have been established based on the
servqual model. These variables were tested in e-banking to explore service quality and
customer satisfaction. The data were gathered through survey interview by a structured
questionnaire with 250 customers. The study shows that these factors are the core service
quality dimensions for customer satisfaction in e-banking. The study also shows that
reliability, responsiveness and assurance have make more contribution to satisfaction of
customers of e-banking in Bangladesh.The findings was limited to Bangladesh, primary data
were used to measure five service quality dimensions namely reliability, responsiveness,
assurance, empathy, and tangibles. It found that reliability, responsiveness and assurance
make more contribution to satisfaction of customers of e banking. Therefore, lower statistical
tools such as percentage were used.
Ahmed and Ajmad (2012) Studied current status of electronic banking in Pakistan and its
impact on usage and also its impression on satisfaction of customers of the banks. Further,
based on the outcomes from the data gathered on the primary scale, the study portrays the
results of survey conducted on the level of engagement of electronic banking in the minds of
the customers. From the study, it has been observed that customers who have availed
themselves of the services are enjoying the benefits yet they feel uncomfortable in terms of
Online Service Quality. Many of the customers have raised the objection that not all utility
services have been enlisted in the options of Internet Banking. They found that customers do
have awareness but not on a large scale. Awareness among the customers using electronic
banking services is quite high but use of Mobile Banking is a new trend and experience, and
customers are reluctant to work freely with the new environment.
In Australia, a study was conducted using primary data in order to look at e - retailing by
banks: e services and its importance to customer satisfaction, different servqual variables
were used. Had they use different variables, such as establishing a relationship between the e-
banking platforms, the result would have been different.
206
Manda, Bahran, and Maasomeh (2013). Studied the effects of electronic banking services on
customer satisfaction and loyalty among customers of six independent branches of Melli bank
in Tehran. The research was conducted using 358 e-service customers using a comprehensive
questionnaire. To examine their conceptual model, they used the structural equations
modeling (SEM) approach using LISREL software. According to the SEM approach, the
unknown model parameters are chosen to make, in general, the model-reproduced covariance
matrix as close as possible to the sample covariance matrix. They found that ease of service
use, website design, speed of connectivity and transactions, information security; information
content and support service have a significant effect on user’s satisfaction. Moreover, this
satisfaction has a significant effect on loyalty to bank and willingness to continue relations
with e-banking service. They used primary data on a different variables such as website
design, speed of connectivity, security etc. The finding was that it has significant impact on
customer satisfaction. The research is limited to Iran customers. LISREL software was used.
Babatunde and Olukemi (2012) Evaluated customers’ satisfaction and its implications for
bank performance in Nigeria using primary data analysis. The study adopted descriptive and
explanatory survey design methods. Findings from the study showed that customers enjoying
electronic banking services are still not satisfied with the quality and efficiency of the
services. This is expressed in the number of times customers physically visit banks and length
of time spent before such services are received. The research findings was only based on
number of visits by customers to the bank and time spent. Lower statistical tool such as
percentage was used.
Ogunlowore and Oladele (2014)have examined the impact of electronic banking on
satisfaction of corporate bank customers in Nigeria, Data was collected with a structured
questionnaire. Chi-square was used to test hypothesis. The study found that there is a
significant relationship between electronic banking and customers’ satisfaction. They
concluded that E-banking has become popular because of its convenience and flexibility, and
transaction related benefits like speed, efficiency and accessibility. They used inappropriate
tool such as chi- square which is not the best method of testing impact between variables.
Amanfo and Gloria (2012) examined the role of e-banking and its relation to customer
satisfaction in the banking industry in Ghana. The study addressed some issues that affect the
role of e-banking and its link to customer satisfaction in Ghana’s banking industry. Data were
obtained from bank staff and customers through a questionnaire using simple random
sampling as well as an interview with bank staff. 60 questionnaires sent out were responded.
Findings from the study indicated that e-banking has had a positive impact on the
productivity and profitability of the banking industry amid expansion. Also, customers are to
a large extent satisfied with services provided through electronic delivery channels by banks
in Ghana. There was also evidence that customers‟ age group contributed to the propensity to
use any of the electronic delivery channels used by banks. This study concludes by
highlighting the need for banks to understand customer needs, develop appropriate e-banking
marketing strategies that maximize value for customers and satisfaction in the long run. The
research was limited to Ghana, the e-banking platforms were not specified and primary data
was used.
Automated Teller Machine and Customer Satisfaction
Odusina and Ayokunle (2014) investigated automated teller machine (ATM) usage on
customers’ satisfaction in Nigeria. The study discovered that despite the increasing number of
ATM installations in Nigeria. Customers’ needs are not satisfactorily met as customers are
always seen on queue in large numbers at various ATM designated centers as well as poor
207
service delivery of some of these machine. The research carried out a comparative analysis of
three banks in Ogun State, Metropolis of Nigeria viz-aviz First Bank, Guaranty Trust Bank
and Skye Bank. Questionnaires were distributed to the respondents. A total of 200
respondents answered the questionnaire cutting across the three banks, the chi-square
statistical tool was used to analyze the data and the results showed a positive and significant
relationship between ATM Usage and Customers’ Satisfaction. Had they used regression
analysis, another statistical tool to measure the impact, better result would have been
ascertained for Chi-square measures only association, it does not measure the fitness of
variables used.
Luiz (2000) studied the effect of automated teller machine service on customer satisfaction,
he used discovered that the general proposition that the measurement of consumer prolonged
satisfaction can be a central element of evaluation and control of strategic marketing input.
Empirical findings related to automated teller machines (ATMs) have shown that different
types of consumer processes lead to the formation of expectations, introduces the
hypothesized model of a newly described consumer behavior measure (prolonged
satisfaction) which is determined and refined by incorporating consumer expectations and
product/service usage rate as predictor variables to the measurement of consumer satisfaction
over time.
Charles (2014) studied 325 ATM smart card users of selected banks in Malawi, he uses
percentages as his methodology where he found over half are satisfied with the service from
their banks, he found that service quality correlates significantly with customer satisfaction
with ATM services and that reliability is the most important dimension followed by
responsiveness empathy, assurance and tangibles. He used simple percentage as tool of
analysis. The findings cannot be generalized beyond Malawi.
Shamsher (2011) investigated the impact of ATM services on the customer satisfaction in
Indian urban banking sector. The study used primary data of customer satisfaction survey (N
= 400). The data was collected using a structured questionnaire designed to ascertain the
satisfaction levels. ANOVA and factor analysis was used to identify significant factors and
frequency analysis was used to analyse customer satisfaction. It was found that the ATM
services have a positive impact on the customer satisfaction. He suggested that if
improvement of service is made by the banks, there will be significantly higher customer
satisfaction. The research was carried out primarily in urban area and hence cannot be
generalized on entire India.
Theoretical framework
The study adopts the theory of hypothesis testing of customer satisfaction to underpin the
study. Deighton (1983) suggested a two-step model for satisfaction generation. First,
Deighton hypothesizes that pre-purchase information (advertising) plays a substantial role in
building up expectations. Customers use their experience with product/service to test their
expectations. Secondly, Deighton believes, customers will tend to attempt to confirm rather
than disconfirm their expectations. The theory suggests that customers are biased to
positively confirm their product/service experiences. It is an optimistic view, but it turns the
management of evidence into a very powerful marketing tool (Vavra, 1997, p.47)
Methodology

208
The study adopted descriptive and specifically survey research method in as it will rely
heavily on responses from primary data. The population of the study covers the entire
customers of United Bank for Africa PLC. In Nasarawa state who are up to one hundred and
ten thousand, five hundred (110,500) customers. Although the population size was gotten
from an insider (staff) in the bank, the source cannot be authoritatively quoted since the bank
refused officially disclose its exact customer base to the public as at time of this research.
Therefore, the population is assumed as infinity. Simple random sampling was used because
it allows for equal opportunity of selection. Of the thirteen (13) local government areas of
Nasarawa State, UBA has branches only in five 5 local governments’ areas (LGA’s).
Model specification
The ordinary least square (OLS) was used to analyze data by a software statistical package
called spss was utilized in measuring effect of e-banking service quality on customer
satisfaction. A simple model of regression shall be used to estimate the effect of electronic
banking service quality on customer satisfaction as follows:
CS = α + βIBE + βIBRN+ βIBU+ μ … …………….… (1)
CS = α + βATME +βATMRN + βATMU+ μ.…….….. (2)
CS = α + βMBE + βMBRN+ βMBU+ μ…………….... (3)
Results and Discussion
Hypothesis 1
OLS result Using SPSS version 20.0 statistical software Package
CS = α + βIBE + βIBRN+ βIBU+ μ
Model Summary
Mode
l
R R Square Adjusted R
Square
Std. Error of
the Estimate
1 .976a .952 .952 .324
a. Predictors: (Constant), IBU, IBE, IBRN
ANOVAa
Model Sum of
Squares
df Mean
Square
F Sig.
1
Regression 4417.505 3 1472.502 13997.833 .000b
Residual 222.172 2112 .105
Total 4639.676 2115
a. Dependent Variable: CS
b. Predictors: (Constant), IBU, IBE, IBRN
Coefficientsa
Model Unstandardized
Coefficients
Standardized
Coefficients
t Sig.
B Std. Error Beta
1 (Constant) -.203 .021 -9.600 .000
IBE .383 .017 .336 22.179 .000
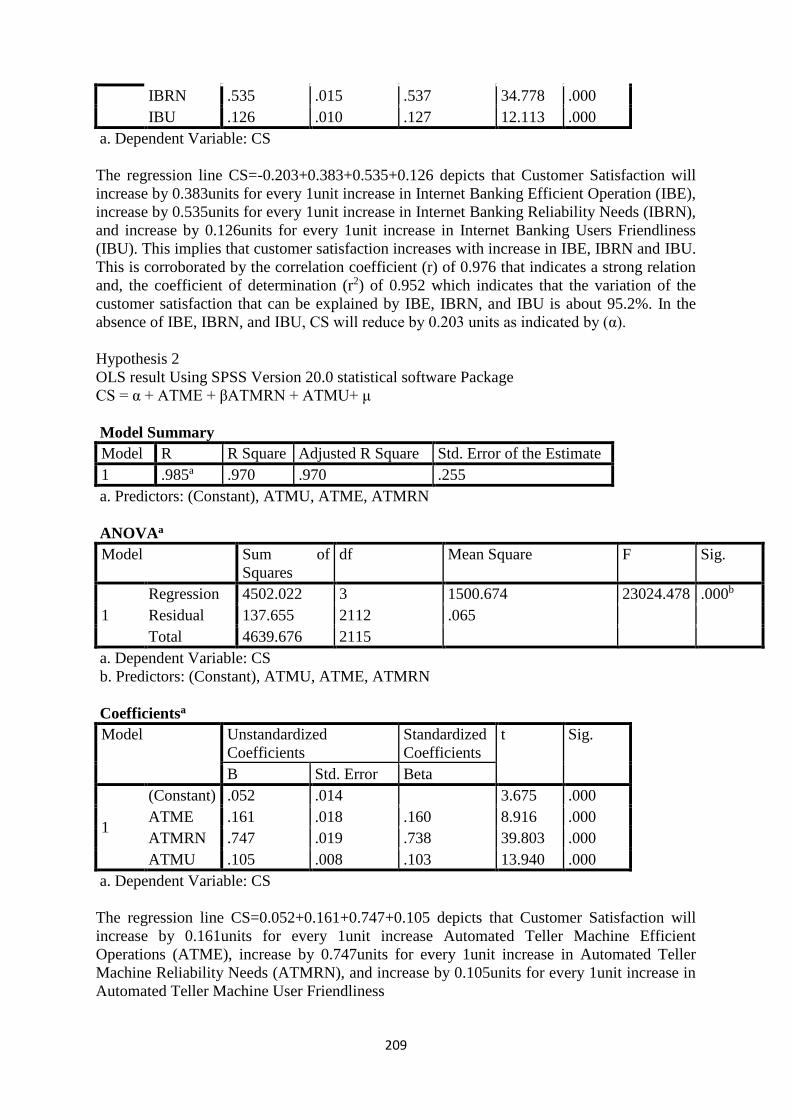
209
IBRN .535 .015 .537 34.778 .000
IBU .126 .010 .127 12.113 .000
a. Dependent Variable: CS
The regression line CS=-0.203+0.383+0.535+0.126 depicts that Customer Satisfaction will
increase by 0.383units for every 1unit increase in Internet Banking Efficient Operation (IBE),
increase by 0.535units for every 1unit increase in Internet Banking Reliability Needs (IBRN),
and increase by 0.126units for every 1unit increase in Internet Banking Users Friendliness
(IBU). This implies that customer satisfaction increases with increase in IBE, IBRN and IBU.
This is corroborated by the correlation coefficient (r) of 0.976 that indicates a strong relation
and, the coefficient of determination (r2) of 0.952 which indicates that the variation of the
customer satisfaction that can be explained by IBE, IBRN, and IBU is about 95.2%. In the
absence of IBE, IBRN, and IBU, CS will reduce by 0.203 units as indicated by (α).
Hypothesis 2
OLS result Using SPSS Version 20.0 statistical software Package
CS = α + ATME + βATMRN + ATMU+ μ
Model Summary
Model R R Square Adjusted R Square Std. Error of the Estimate
1 .985a .970 .970 .255
a. Predictors: (Constant), ATMU, ATME, ATMRN
ANOVAa
Model Sum of
Squares
df Mean Square F Sig.
1
Regression 4502.022 3 1500.674 23024.478 .000b
Residual 137.655 2112 .065
Total 4639.676 2115
a. Dependent Variable: CS
b. Predictors: (Constant), ATMU, ATME, ATMRN
Coefficientsa
Model Unstandardized
Coefficients
Standardized
Coefficients
t Sig.
B Std. Error Beta
1
(Constant) .052 .014 3.675 .000
ATME .161 .018 .160 8.916 .000
ATMRN .747 .019 .738 39.803 .000
ATMU .105 .008 .103 13.940 .000
a. Dependent Variable: CS
The regression line CS=0.052+0.161+0.747+0.105 depicts that Customer Satisfaction will
increase by 0.161units for every 1unit increase Automated Teller Machine Efficient
Operations (ATME), increase by 0.747units for every 1unit increase in Automated Teller
Machine Reliability Needs (ATMRN), and increase by 0.105units for every 1unit increase in
Automated Teller Machine User Friendliness
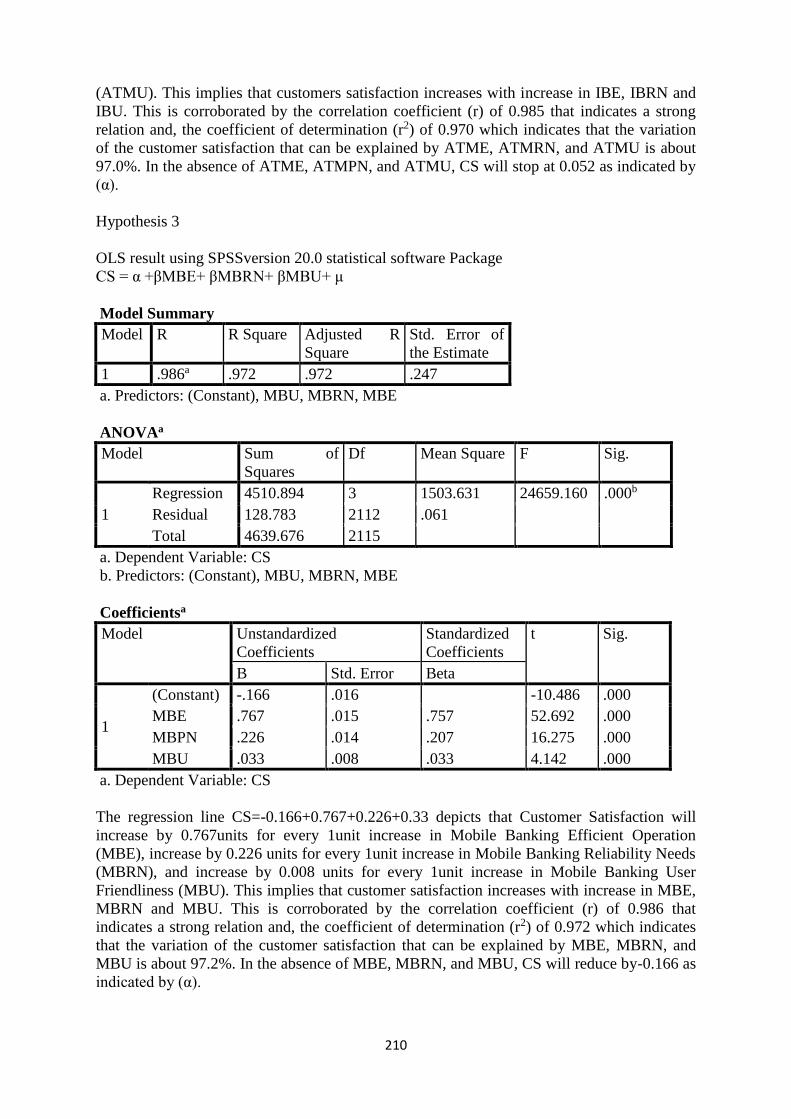
210
(ATMU). This implies that customers satisfaction increases with increase in IBE, IBRN and
IBU. This is corroborated by the correlation coefficient (r) of 0.985 that indicates a strong
relation and, the coefficient of determination (r2) of 0.970 which indicates that the variation
of the customer satisfaction that can be explained by ATME, ATMRN, and ATMU is about
97.0%. In the absence of ATME, ATMPN, and ATMU, CS will stop at 0.052 as indicated by
(α).
Hypothesis 3
OLS result using SPSSversion 20.0 statistical software Package
CS = α +βMBE+ βMBRN+ βMBU+ μ
Model Summary
Model R R Square Adjusted R
Square
Std. Error of
the Estimate
1 .986a .972 .972 .247
a. Predictors: (Constant), MBU, MBRN, MBE
ANOVAa
Model Sum of
Squares
Df Mean Square F Sig.
1
Regression 4510.894 3 1503.631 24659.160 .000b
Residual 128.783 2112 .061
Total 4639.676 2115
a. Dependent Variable: CS
b. Predictors: (Constant), MBU, MBRN, MBE
Coefficientsa
Model Unstandardized
Coefficients
Standardized
Coefficients
t Sig.
B Std. Error Beta
1
(Constant) -.166 .016 -10.486 .000
MBE .767 .015 .757 52.692 .000
MBPN .226 .014 .207 16.275 .000
MBU .033 .008 .033 4.142 .000
a. Dependent Variable: CS
The regression line CS=-0.166+0.767+0.226+0.33 depicts that Customer Satisfaction will
increase by 0.767units for every 1unit increase in Mobile Banking Efficient Operation
(MBE), increase by 0.226 units for every 1unit increase in Mobile Banking Reliability Needs
(MBRN), and increase by 0.008 units for every 1unit increase in Mobile Banking User
Friendliness (MBU). This implies that customer satisfaction increases with increase in MBE,
MBRN and MBU. This is corroborated by the correlation coefficient (r) of 0.986 that
indicates a strong relation and, the coefficient of determination (r2) of 0.972 which indicates
that the variation of the customer satisfaction that can be explained by MBE, MBRN, and
MBU is about 97.2%. In the absence of MBE, MBRN, and MBU, CS will reduce by-0.166 as
indicated by (α).
211
The analysis in hypothesis 1 reveals that there is a significant relationship between electronic
banking service quality (internet banking: efficient operation, reliability needs and user
friendliness). This findings is in line with findings of Rangsan and Titida (2013) who found
that there is a significant relationship between internet banking and customer satisfaction.
The finding also conforms to the assimilation theory which states that consumers are
motivated enough to adjust both their expectations and their product performance
perceptions. If the consumers adjust their expectations or product performance perceptions,
dissatisfaction would not be a result of the post-usage process. Consumers can reduce the
tension resulting from a discrepancy between expectations and product/service performance
either by distorting expectations so that they coincide with perceived product performance or
by raising the level of satisfaction by minimizing the relative importance of the
disconfirmation experienced (Olson & Dover, 1979)
The analysis in hypothesis 2 revealed that there is a significant relationship between
electronic banking service quality (Automated Teller Machine: efficient operations, reliability
needs and user friendliness) and customer satisfaction (CS). This findings is in line with
findings of Odusina and Ayokunle (2014) who found that there is a significant relationship
between automated teller machine and customer satisfaction. The finding also conformsto the
assimilation theory which states that consumers are motivated enough to adjust both their
expectations and their product performance perceptions. If the consumers adjust their
expectations or product performance perceptions, dissatisfaction would not be a result of the
post-usage process. Consumers can reduce the tension resulting from a discrepancy between
expectations and product/service performance either by distorting expectations so that they
coincide with perceived product performance or by raising the level of satisfaction by
minimizing the relative importance of the disconfirmation experienced (Olson & Dover,
1979)
The analysis in hypothesis 3 revealed that there is a significant relationship between
electronic banking service quality (Mobile Banking: efficient operations, reliability needs and
user friendliness) and customer satisfaction (CS). This findings is in line with findings of
Odusina and Ayokunle (2014) who found that there is a significant relationship between
mobile banking and customer satisfaction. The findings also conformed to the assimilation
theory which states that consumers are motivated enough to adjust both their expectations
and their product performance perceptions. If the consumers adjust their expectations or
product performance perceptions, dissatisfaction would not be a result of the post-usage
process. Consumers can reduce the tension resulting from a discrepancy between
expectations and product/service performance either by distorting expectations so that they
coincide with perceived product performance or by raising the level of satisfaction by
minimizing the relative importance of the disconfirmation experienced (Olson & Dover,
1979)
Conclusion and Recommendation
In this study, an attempt was made to examine the effect of electronic banking service quality
on customer satisfaction in UBA. Nig. Plc. The empirical research of this study is based on
the sample of ten thousand customers and within five local governments that has UBA
branches.
The conclusions were drawn from the results analysed. There is a significant relationship
between electronic banking service quality (internet banking: efficient operations, reliability
212
needs and user friendliness) and customer satisfaction in UBA, Nasarawa State. This
implies that electronic banking service qualit contributes significantly to customer satisfaction
in UBA, Nasarawa State. Furthermore, There is a significant relationship between electronic
banking service quality (Automated teller machinebanking: efficient operations, reliability
needs and user friendliness) this implies that electronic banking service quality contributes
significantly to customer satisfaction in UBA, Nasarawa State.in UBA. Also, for mobile
banking, there is a significant relationship between electronic banking service quality (mobile
banking: efficient operation, reliability needs and user friendliness) and customer satisfaction
(CS) in UBA, Nasarawa State. This indicates that mobile banking in UBA Nasarawa State
contribute significantly to customer satisfaction.
Recommendations given are based on the results of the tested hypotheses. The United Bank
for Africa should continue to improve on their internet banking service quality(efficient
operations, reliability needs solution and user friendliness) by ensuring a more dependable,
reliable and efficient service since the proxies are all significant to customer satisfaction in
UBA, Nasarawa State. The United Bank for Africa, Nasarawa State should try to encourage
more customers to use the automated teller machine by establishing more secured and
reliable automated teller machine centres and sensitizing customers on how to make use of
them, since its efficient operations, reliability needs solution and user friendliness contribute
to customer satisfaction in UBA, Nasarawa State. Lastly, the UBA mobile banking: efficient
operations, reliability needs and user friendliness standard should be maintained by
improving on mobile application packages since the proxies lead to customer satisfaction
(CS) in UBA, Nasarawa State.
REFERENCES
1. Abaenewe, Z. C., Ogbulu, O. M., & Ndugbu, M. O. (2013). Electronic Banking and Bank
Performance In Nigeria. West African Journal of Industrial & Academic Research, 6(1)
171-189.
2. Abigael, J., Sangoro, R., Phlemon, B. (2013).Effects of Mobile Banking on Customer
Satisfaction.International journal of Innovative Research in Management volume
3issue(2)
3. Adewuyi, I. D.(2011).Electronic banking in Nigeria: challenges of the regulatory
authorities and the way forward, International Journal of EconomicDevelopment
Research and Investment, Vol. 2 No. 1; April 2011
4. Agboola, A. A., & Salawu, R. O. (2008). Optimizing the Use of Information and
CommunicationTechnology (ICT) in Nigerian Banks. Journal of Internet Banking and
Commerce. Vol. 13(1).
5. Al-Abed, A.(2003). Electronic Banking, available at
http://www.bankersonline.com/technology/gurus_tech081803d.html .
6. Alex A. (2014). The Impact Of E-Banking On Customer Service And Profitability of
Banks In Ghana. Global journal of commerce & management perspective, published by
global institute for research & education issn 2319-7285 G.J.C.M.P., vol.3(1): 6165
7. Amanfo, A. T., & Gloria, T. (2012). Electronic Banking Services and customer
satisfaction in the Nigerian banking Industry. International Journal of Business and
Management Tomorrow 2(3) 1 – 8
8. Amanfo, Gloria O. (2012). A study on the role of e-banking and its relation to customer
satisfaction in the banking industry of Ghana, Asheshi Institutional Repository
Department.3(6)
9. Andrew, B. (2009). The Impact of internet banking on performance and risk. Journal of
Business and Economics 2009. 2(4): 43-62.

213
10. Andrew, S. S. (2010). Effects of ElectronicBanking Facilities, Employment Sector and
Age-group on customers’choice of banks in Nigeria. Journal of Internet Banking and
Commerce.15(1).
11. Auta, M. E. (2010). E-banking in Developing Economy: Empirical Evidence from
Nigeria. Journal of Applied Quantitative Methods. 5(2).
12. Babatunde A., and Olukemi L. (2012). Customers satisfaction and its implications for
bank performance in Nigeria. British Journal of Arts and Social Sciences, ISSN: 2046-
9578, Vol.5 No.1© BritishJournal Publishing, Inc. 2012
http://www.bjournal.co.uk/BJASS.aspx
13. Bankers online, (2010).What are the definition of e-banking. Available at
http://www.bankersonline.com/technology/gurus_tech081803d.htm(Accessed 08 May
2010).
14. Basel Committee on Banking Supervision, (1998). Risk Management for Electronic
Banking and Electronic Money Activities
15. Basel Committee on Banking Supervision,(2003). Risk Management Principles for
Electronic Banking. Bank for International Settlement.
16. Beans, K.M., (1999). Internet banking is the future of community banks. Journal of
Lending and Credit Risk Management,81(11), 47–49
17. Bellis, M. (2003). Inventors of the modern computer, from Available at
http:7inventors.about.com/library/inventors/bl-ERMA-cimputer.htm. (Retrieved. 05May
2010).
18. Berry, T. (1990): “Deploying Internet Banking and E-Commerce: Case Study of a Private
Sector Bank in India”, Information Technology for Development; 11(4); 363-379
19. Bitner, M.J., & Hubbert, A.R.(1994) “Encounter Satisfaction Versus Overall Satisfaction
Versus Quality.” In R.T. Rust & R.L. Oliver (eds.), Service Quality: New Directions in
Theory and Practice, 72-94. Thousand Oaks, California: Sage,
20. Boaten, A., & Molla, A. (2006): “Banking Practice and Satisfaction: Empirical Evidence
from Canada”, ACRM Journal of Business and Management Research, 3(2); 35-41
21. Burr, W., (1996): “Wie Informationstechnik Die Bankorganisation Verändern
22. Calomiris, C.W., & Nissim, D.(2007). Activity-based valuation of bank holding
companies,Working Paper 12918, National Bureau of Economic Research.
23. Carl, R. (2005). An experimental study of consumer effort, expectations and satisfaction,
Journal of Marketing Research, 2, 244-9.
24. Carlsmith, E. A., & Anderson, A. D. (1963). Evolution of Internet-Banking and Bank
Profitability: the Case, Turkey. Oxford Business & Economics Conference Program.
25. Carman, S. (1990): “The Emergence of internet banking in France: An Appraisal”,
Information Technology Journal;6 (4) 490-496.
26. Carmel H., Scot W. (2009).E‐retailing by banks: e‐service quality and its importance to
customer satisfaction European Journal of Marketing ISSN: 0309-0566 Online from:
1967.
27. Casalo, L ., Flaviam, C., and Guiraliu, M. (2008). The role of usability and satisfactionin
the consumers commitment to a financial services. Website. Int. J. Electronic finance. 2
(1) 2008 – 2031
28. Change, T. (2002). Understanding Users' Initial Trust in Mobile Banking: An Elaboration
Likelihood Perspective, Computers in Human Behavior, 28 (4),pp. 1518-1525.
29. Charity-Commission. (2003). Guidelines on Electronic Banking, available at
http/www.charity-commission.gov.uk
30. Charles, M., (2014). Customer satisfaction with ATM banking in Malawi. African
Journal of business vol (8)7. P. 218
31. Cracknell, D. (2004). Electronic banking for the poor—panacea, potential and Pitfalls
small Enterprise Development, 15(4), 8-24.
214
32. Daniel E. (1999). Provision of Electronic Banking in the UK and the Republic of Ireland,
paper presented to International Journal of Bank Marketing, vol. 17, pp. 72-82.
33. Davis, H. (1992): “Toward a Model for the Acceptance of Internet Banking in
Developing Countries”, Information Technology for Development, 11(4);.381-398
34. Dawe, S. O.(2014). Electronic Banking: The Risks. In The Insurance. A Paper Presented
at Centre for Insurance Research Luncheon, Leed, May 23.
35. Dawes, N. (1972). Internet Banking in the U.S, Japan and Europe. Multinational Business
Review.11(15) Pp 73:81.
36. Deighton, A. (1983). The emergence ofinternt in organizational transactions in
Ghana: An appraisal, Information Technology Journal.6(4):490-496.
37. Edverdsson, T. H.(2000). Saving IT's Soul, Business Value of IT. Boston: Harvard
Business School Publishing.
38. Erevelles, S. & Leavitt, C. (1992). A comparison of current models of consumer
satisfaction/ dissatisfaction. Journal of Consumer Satisfaction, Dissatisfaction and
Complaining Behavior, 5, 194-114,
39. Ezeoha, G. (2006). Enhancing the Performance of Banking Operations through
Appropriate Information Technology in Nigeria Banking Industry, Ibadan: Spectrum
Books
40. Festinger, L. (1957) A theory of Cognitive Dissonance, Stanford, CA: Stanford
University Press
41. Flannery, M.J. (1994). Debt maturity and the deadweight cost of leverage: optimally
financing banking firms, American Economic Review 84, 320-331
42. Flavian, I.S., and keating, N. (2003). Banking Efficiency and information Technology in
Canada: An Empirical Investigation. International Journal of Economics and
Development 8(1&2). 2345
43. Furst, K., Lang, W. W. & Nolle, D.E. (2000). Internet banking: Developments and
Prospects,http://www.occ.treas.gov/ftp/workpaper/wp2000-9.pdf.
44. Furst, K., Lang, W. W., and Nolle, D. E. (2000a). Who offers Internet banking? quarterly
Journal, Office of the Comptroller of the Currency. (19)2:27-46.
45. Gerrard, M., Cunningham, E. (2003): “An Alternative Approach in Service Quality: An
E-Banking Case Study”,Quality Management, 1(5); 41-48
46. Gonzalez, M. E. (2008). An Alternative Approach in Service Quality: An E-Banking
Case Study. Quality Manage. P. 43
47. Gronroos, C. (1984). Toward a third phase in service quality research: challenges and
directions. in Swart, et al. (Eds.) Advances in Service Marketing and Management, 2, JAI
Press, Greenwich, CT, 49-64
48. Guriting, G., & Ndubuisi, A. (2000). Enhancing the Performance of Banking Operations
through Appropriate Information Technology in Nigeria Banking Industry, Enugu:
Spectrum Books.
49. Hallowell, P. K. (1996): “Internet Banking in India: Consumer Concern and Bank
Strategies”, Global Journal of Business Research, Vol. 2(1) 43-51
50. Hong, S. K. & Goo, S. M. (2004): “Service Quality Evaluation in Internet Banking: An
Empirical Study in India”, International Journal of Indian Culture and Business
Management,2(1): 12-
51. Hoon, K.,Ronnie, D. C.(2011).A Review of Smartcard Security Issues, journal of security
engineering, 17(20), pp.75-77
52. Huang, S.M., Hung, Y.C., & Yen, D.C. (2005). A study on decision factors in adopting
an online stock trading system by brokers in Taiwan. Decis Support Syst, 40 (2), pp. 315–
328.
53. Hughes, T., Tim, J. (2003). Marketing challenges in E-Banking: standalone or integrated.
Journal of Marketing Management, 19, pp. 1067–1085
215
54. Hunjra, A. I., Ali, A. & Anwar, S. (2012). The Impact of E-Banking on Customer
Satisfaction: A Comparative Analysis on Pakistani Banking Sector. Bulletin of Business
and Economics, 1(1), 1-43.
55. Idowu. A. A. (2005). Automated Banking and the Nigerian Economy. Ede: Christatosh
Consults.
56. Investor words, (1999).
http://www.investorwords.com/3420/online_banking.html.(Accessed. 02 July 2015).
57. Ivatury, G., & Mas, I. (2008). The early experience with branchless banking. Washington,
DC:
58. Ivatury, G., & Pickens, M. (2006). Mobile phone banking and low-income customers:
Evidence from South Africa. Washington, DC: Consultative group to assist the poor
(CGAP) and the United Nations Foundation.
59. Jannatul, I., & Mawa, N. (2010).E-banking and customer satisfaction. International
Review of Business Research Papers Volume 6. Number 4. September. Pp. 145 – 156
60. John, I., Joby, T., (2003): “Issues of E-banking Transaction: An Empirical Investigation
on Malaysian Customers Perception”, Journal of Applied Sciences, 2(6) 29-42
61. Karjaluoto, H., Mattila, M., & Pento, T. (2002). Selection criteria for a mode of bill
payment: Empirical investigationamong Finnish bank customers. International Journal of
Retail &DistributionManagement, 30(6), 331-339.
62. Kirk, T. (2009). CARTA & Caribbean Group of Banking Supervisors. IT Workshop for
Regional Bank Examiners. June 23-25, 2009. Georgetown, Guyana.
63. Lee , E ., & Lee, J., (2000). Haven’t adopt electronic financial services yet? The
acceptance and diffusion of electronic banking technologies. Financial counseling and
Planning, 11(1), pp.49-61.
64. Lee, J., Cho, J.E. & Rehman, F.A. (2008).Handbook of consumer Finance Research.
Department of consumer science, OhiStateUniversity
65. Lee, M. (2009). Factors influencing the adoption of internet banking: An integration of
TAM and TPB with perceived risk and perceived benefit. Electronic Commerce Research
and Applications, 8(3), 130-141
66. Lee, M.C. (2008). Predicting behavioral intention to use online banking. In: Proceedings
of The 19th international conference on information management. Taiwan,
67. Luiz, M., (2000).Customer Satisfaction Measurement: Prolonged Satisfaction with
ATMs, International Journal of Bank Marketing, Vol. 10 Iss: 7, pp.30 - 37
68. Lutsik, O. (2004). Can e-banking services be profitable? (Working Paper No. 30). Faculty
of Business Administration, University of Tartu, Estonia.Finland. International journal of
bank Marketing, 20(6), pp.261-272.
69. Lynch, P., & Arly, B. (2000). Determinants of Internet Banking Adoption by Banks in
India”, Emerald Internet Research 17(3); 323-339
70. Madueme, I.S. (2009). Banking Efficiency and information Technology in Nigeria: An
Empirical Investigation. International Journal of Economics and Development 8 (1&2).
23-45
71. Mandan M., Bahran K., & Maasomeh, D. (2013) Analysis the effects of Electronic
Banking on Customer Satisfaction and Loyalty. Tehraninterdisciplinary journal of
contemporary research in business copy right © VOL 4, NO 12.
72. Michael, N. (2007).Consumer loyally, How to create advocacy. Retrieved on 1 July2010
from www.http//ababj: com, management/ customer loyally – how to create advocates
Feb. 07 html.
73. Mishra,M., & Kiranmi, S. M.(2009). Comparative Study of ElectronicandTraditional
Banking Preferences of User Behavior(Case study: Investigating the Use of Services
LikeSemnan E-banking Customers Bank). Journal ofManagement, 21, pp. 55-66.
216
74. Mohammad, K. M. (2011).The Impact of e-banking on the profitability of banks: A Study
of Pakistani banks. Journal of Public Administration and governance Vol. 1, No. 1 issn
2161-7104,2011,
75. Mohammad, O. A., & Saad A. A.(2011). The Impact of E- Banking on The Performance
of Jordanian Banks Journal of Internet Banking and Commerce, vol. 16, no.2
http://www.arraydev.com/commerce/jibc/)
76. National Consumers League (2002), Internet Fraud Statistics,retrivedfrom(
www.nclnet.org/shoppingonline )
77. Nigeria Deposit Insurance Corporation (2014). Annual Reports and Statement
ofAccounts. retrieved from. www.ndic.gov.ng. july 2015
78. Odusina, A., & Olumide, K. (2014).Automated teller machine usage and customers’
satisfactionin Nigeria. Global Journal of Management and Business Research: Finance
Volume 14 Issue 4 Version 1.0
79. Ogunlowore, A., & John, R. (2014).Analysis of electronic banking and customer
satisfaction in Nigeria. European Journal of Business and Social Sciences, Vol. 3, No.3 ,
pp 14-27, P.P. 14 – 27 URL: http://www.ejbss.com/recent.aspxISSN: 2235 -767X
80. Oldon, B. &Dover, L.(1979). Don't let technology pass you by. ABA Banking Journal,
73.(10), pp. 44-46
81. Oliver, R. (1997) Satisfaction: A Behavioral Perspective on the Consumer. Boston:
McGraw-Hill,
82. Oliver, R. (1997): A Behavioral Perspective on the Consumer. Boston: McGraw-Hill,
Advances in Consumer Research, 19, 570-578
83. Oliver, R. (1999) “Value as Excellence in the Consumption Experience.” In M. Holbrook
(Ed.), Consumer Value: A Framework for Analysis and Research, 43-62, New York:
Routledge
84. Oliver, S. D. & Sichel, D.E( 2000). The resurgence of growth in the late 1990s: Is
information technology the story? Journal of Economic Perspectives14, 3-22. Oxley.
85. Osuala,O. (2005). Computer Crimes and Counter Measures in the Nigerian banking
sector. Journal of Internet Banking andCommerce. Vol. 15(1).
86. Ovia, J. (2001), Internet banking: practices and potentials in Nigeria: A paper at the
conference organized by the Institute of Chartered Accountants of Nigeria (ICAN),
Lagos, September 5.
87. Ovidiu S., Seyed, M.,& Alina, S. (2015).The Impact of Internet banking on the
performance of Romanian Banks: DEA and PCA Approach. Procedia economics &
finance volume 20, 2015 pages 610-622.
88. Parasuraman, A., Zeithaml, A. V., &Berry, L. L. (1988) Servqual: A multiple Item scale
for measuring consumer perceptions of service quality. Journal of Retailing, 64, spring,
12-40
89. Parthasarathy, M., & Bhattacherjee, A. (1998). Understanding Post-Adoption Behavior in
the Context of Online Services, Information Systems Research 9, 362-379.
90. Pearce, P. L. (1980) A Favorability-satisfaction model of tourists’ evaluations. Journal of
Travel Research.(6)10 summer: 13-17
91. Peyton, R., Pitts, S., & Kamery, R.H.(2003).Consumer Satisfaction/Dissatisfaction: a
review of the literature prior to the 1990’s”, Proceedings of the Academy of
Organizational Culture, Communication and Conflict. Vol. 7(2)
92. Pooja, M., & Balwinder, S. (2009). The impact of internet banking on bank performance
and risk: the indian experience .Eurasian Journal of Business and Economics, 2 (4), 43-6
93. Porteous, D. (2007). Just how transformational is m-banking? Retrieved 10 January,
2008, from
http://www.finmarktrust.org.za/accessfrontier/Documents/transformational_mbanking.pd

217
94. Porteous, D., (2006). The enabling environment for mobile banking in Africa. London:
DFID.
http://www.finmarktrust.org.za/accessfrontier/Documents/transformational_mbanking.pd
95. Power, J. D., & Associates, R. (2009). Customer commitment to Retail BanksContinuous
Decline. Retrieved on june 17, 2015 fromwww.http/bankmarketingnews. org
96. Pyun, C. S., Scruggs, L., & Nam, N. (2002). Internet Banking in the U, Japan and Europe.
Multinational Business Review. Pp 73:81.
97. Raman, S. R. Alan, N. & Mphil, M. K. (2010). E-service quality and uptake of internet
Banking. Retrieved from www.http/.arrayder.com/commerce/JIBC/2015. 08/JIBC.
98. Rangsan, N., & Nochai, N. (2013).The impact of internet banking service on customer
satisfaction in Thailand. International Journal of Humanities and Management Sciences
(IJHMS) Volume 1, Issue 1 .ISSN 2320–4044 (Online)
99. Rangsan, N., & Titida, N. (2013). The Impact of Internet Banking Service on Customer
Satisfaction in Thailand: A Case Study in Bangkok. International Journal of Humanities
and Management Sciences (IJHMS) Volume 1, Issue 1 2355–5044 (Online)
100. Saha, P., & Zhao, Y. (2006) Relationship between online service Quality and
customer satisfaction. A study of internet Banking. Retrieved on April 2009 from
www:http/epubt.Itu. Se/ 1404 5508/ 2005/ 083/ LTU – SHU-EX 05083.
101. Sajuyigbe, A. S. (2012). International Journal of Economic Development Research
and Investment Vol. 3, No 67
102. Sathye, M. (1999) Adoptaion of internet banking by Australian consumer: An
empirical investigation. International journal of Bank Marketing, 17(7), pp.324-334
103. Sathye, M. (1999). 'Adoption of Internet Banking by Australian Consumers: An
Empirical Investigation', International Journal of Bank Marketing, v2 (16)
104. Sekran, M. (2009). Service Quality Evaluation in Internet Banking: An Empirical
Study in India”, International Journal of Indian Culture and Business
Management,2(1):12-19
105. Shamsher, S. (2011). The impact of ATM services on customer satisfaction in Indian
bank.Int. Journal of Financial Services Management,Vol.5, No.2, pp.177 - 196
106. Timothy, A. T. (2012). ElectronicBanking Services and Customer Satisfaction in the
Nigerian Banking IndustryInternational.Journal of Business and Management Tomorrow
2(3) 1 -8
107. Ubagroup, (2015). Annual financial report, retrieved from www.ubagroup.com.25
july,2015
108. Vanessa P.,(2012).Security of Mobile Banking and Payments, SANS Institute.
109. Vavra, N., Terry G., (1997). Improving Your measurement of customer satisfaction:
A guide to creating, conducting, analyzing, and reporting customer satisfaction
measurement programs. American Society for Quality. Vol. 2(16)
110. Wah, L. (1999). “Banking on the internet”. American Management Association vol.
88, No. 11, pp. 44-48.
111. Westbrook, M. E. (1998): “An Alternative Approach in Service Quality: An E-
Banking Case Study”, Quality Manage,1(5);41-48
112. Willard Hom, M An overview of Customer Satisfaction Model. Chancellor’s
OfficeCaliforniaCommunity College. CSv2 Vol 6 Part 2,
113. Wojuade, J. I., (2005). Impact of global system for mobile telecommunication on
NigerianEconomy: A case of some selected local government areas in Oyo State,
Nigeria:A Research Thesis. University of Ibadan, Nigeria.
114. Woodruff, F. &, Cordial, W. (1996): “A Logit analysis of electronic banking in New
Zealand”, International Journal of Bank Market, 24: 360-383
115. Yasir A., (2010). The delicate balance of internet banking and bricks and mortar
offices A study on bank services offered in Visby, gotland university

218
116. Yeung, P. (2001). E-commerce Readiness: Institutional Environment and
International Competitiveness, Journal of International Business Studies,32, 705-724
117. Zhengwei M., & Jinkun Z. (2012). Evidence on E-Banking Customer Satisfaction in
the China Commercial Bank Sector. Journal of software, vol. 7, no. 4,
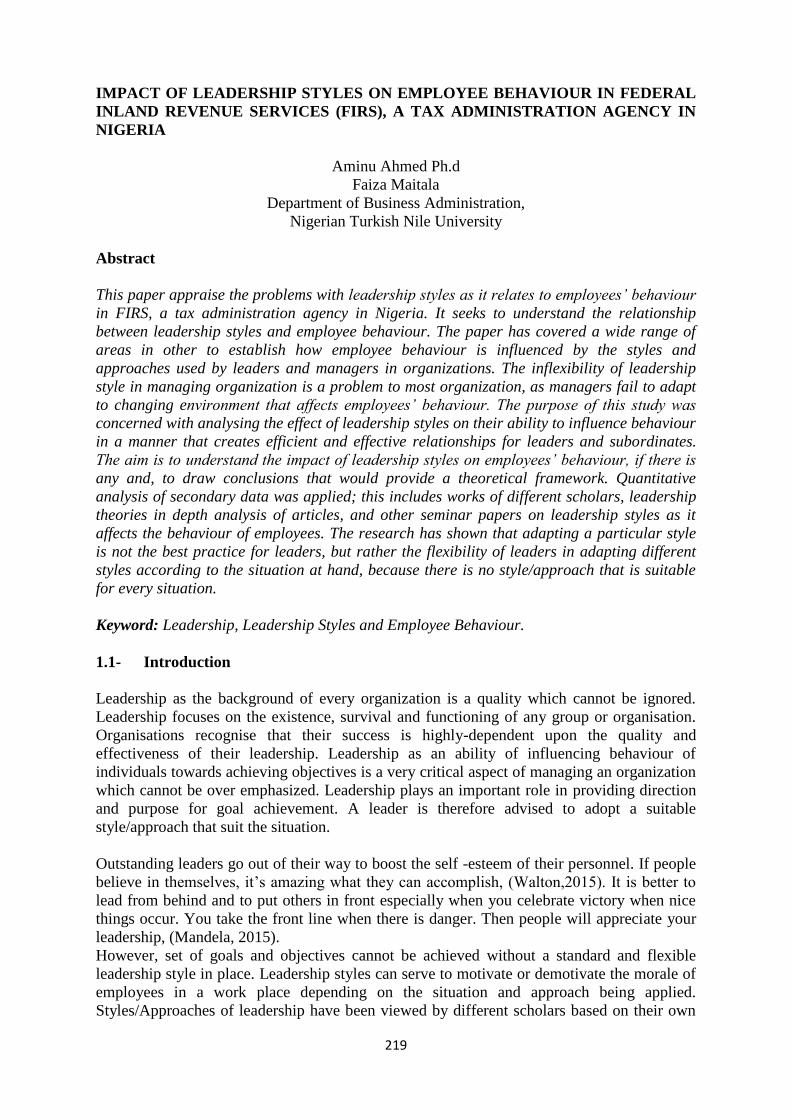
219
IMPACT OF LEADERSHIP STYLES ON EMPLOYEE BEHAVIOUR IN FEDERAL
INLAND REVENUE SERVICES (FIRS), A TAX ADMINISTRATION AGENCY IN
NIGERIA
Aminu Ahmed Ph.d
Faiza Maitala
Department of Business Administration,
Nigerian Turkish Nile University
Abstract
This paper appraise the problems with leadership styles as it relates to employees’ behaviour
in FIRS, a tax administration agency in Nigeria. It seeks to understand the relationship
between leadership styles and employee behaviour. The paper has covered a wide range of
areas in other to establish how employee behaviour is influenced by the styles and
approaches used by leaders and managers in organizations. The inflexibility of leadership
style in managing organization is a problem to most organization, as managers fail to adapt
to changing environment that affects employees’ behaviour. The purpose of this study was
concerned with analysing the effect of leadership styles on their ability to influence behaviour
in a manner that creates efficient and effective relationships for leaders and subordinates.
The aim is to understand the impact of leadership styles on employees’ behaviour, if there is
any and, to draw conclusions that would provide a theoretical framework. Quantitative
analysis of secondary data was applied; this includes works of different scholars, leadership
theories in depth analysis of articles, and other seminar papers on leadership styles as it
affects the behaviour of employees. The research has shown that adapting a particular style
is not the best practice for leaders, but rather the flexibility of leaders in adapting different
styles according to the situation at hand, because there is no style/approach that is suitable
for every situation.
Keyword: Leadership, Leadership Styles and Employee Behaviour.
1.1- Introduction
Leadership as the background of every organization is a quality which cannot be ignored.
Leadership focuses on the existence, survival and functioning of any group or organisation.
Organisations recognise that their success is highly-dependent upon the quality and
effectiveness of their leadership. Leadership as an ability of influencing behaviour of
individuals towards achieving objectives is a very critical aspect of managing an organization
which cannot be over emphasized. Leadership plays an important role in providing direction
and purpose for goal achievement. A leader is therefore advised to adopt a suitable
style/approach that suit the situation.
Outstanding leaders go out of their way to boost the self -esteem of their personnel. If people
believe in themselves, it’s amazing what they can accomplish, (Walton,2015). It is better to
lead from behind and to put others in front especially when you celebrate victory when nice
things occur. You take the front line when there is danger. Then people will appreciate your
leadership, (Mandela, 2015).
However, set of goals and objectives cannot be achieved without a standard and flexible
leadership style in place. Leadership styles can serve to motivate or demotivate the morale of
employees in a work place depending on the situation and approach being applied.
Styles/Approaches of leadership have been viewed by different scholars based on their own

220
perception, observation and research. Different studies will be reviewed relating to the styles
of leadership being practised and how it affects the behaviour of employees.
Employee behaviour is a critical aspect for achieving goals and objectives of the organization
but employees are the most difficult resource that can be managed due to diversities in
culture and background. Different people have their different believes, what is right for one
person might be totally wrong for another person. Therefore a leader needs to understand the
nature of behaviour in his employees. Federal Inland Revenue Service is a public
administration established to control and administer the different taxes and laws specified in
the First Schedule or other laws made from time to time by the National Assembly or other
regulations made thereunder by the Government of the Federation and to account for all taxes
collected.
1.2- Statement Of Problem
The inflexibility of leadership style by most managers is a major problem which has been
observed by different researchers. They fail to be dynamic in their leadership style to
changing situations in their environment which is as a result of lack of understanding that no
particular leadership style is suitable for all situations and must be flexible to provide room
for change. Different situations require different styles of leadership but some or most
managers fail to allow the situation to dictate the style to be adapted. They do not get a proper
understanding of the situation and not expected to know the styles to adapt.
Another problem is that some managers fail to move along with their employees. Leadership
is not about moving forward and letting your employees follow after but rather moving along
or pushing your employees forward to achieve result by influencing their behaviour.
A more threatening situation is the bridge in communication between the managers and
employees. Communication is very ineffective. There are no proper channels of
communication established for information and data to be communicated. You find that
employees just work without having any channel to report to.
Other problems include managers just sitting in their offices and awaiting formal report that
might lead them to getting favourable situation and just applying one leadership style which
might be inappropriate to the situation. Therefore, managers are expected to practice
Management By Walking About (MBWA) to help them get a clearer picture of the
organization. Also, managers fail or ignore to understand the behaviour of their employees
which is very crucial to their leadership.
1.3- Objectives Of Study
Leadership is considered as one of the most important aspect of every organization. Because
of the diversities in human nature, a leader tends to adapt a flexible style to accommodate and
influence all his employees towards achieving their objectives. Hence, the main objective of
this study is to understand the impact of leaders and their approaches/styles on employees’
behaviour. This study intends to appraise the problems associated with tax administration in
Nigeria affected by leadership styles in FIRS, with the view of enhancing tax, the process of
tax administration, the degree of accessibility, collecting and utilization which is a source of
worry by the researcher.
1) To identify the different leadership styles and determine their relationship with
employee behaviour.
221
2) To examine the leadership style and how it affects the behaviour of employees in the
organization.
3) To determine the best leadership style to suit the environment of diverse behaviours.
1.4- Research Question
1. What are the different leadership styles and their relationship with employee
behaviour?
2. Which is the leadership style perceived and how does it affect employees’ behaviour?
3. Which is the best leadership style suitable for a diverse environment?
1.5- Significance of the Study
This research work seeks to understand the relationship between leadership styles and
employee behaviour which will highlight on the importance of leadership styles on the
survival of an organization. Leadership as a motivator and demotivator of an organization,
this study will help leaders and managers to understand how their styles can motivate their
employees and know when they are not motivated. It will investigate the style in which
employees achieve their objectives best.
Also, to determine the significance leadership styles have on the survival of the organization,
the researcher will look into the impact it has on the organization itself. It will also serve as
reference documents for any further research, students, management and organizations in
understanding leadership, it styles and employee behaviour. This study is expected to be able
to benefit in upgrading the quality of leadership and nature of employee behaviour when the
relationship between the leadership of the management and employees are identified. The
study also draws conclusions and provides a standard practice on how leadership style is
likely to affect employees’ behaviour.
2.0- Overview on the Literature and theoretical Underpinnings.
The study focuses on reviewing relevant literature of different scholars and authors. Effort
was made in gathering data about previous researches, articles and works on the topic of this
study and related topic for review purposes. Appropriate journals, periodicals, newspapers,
articles, projects, write ups and seminar/conference papers on Impact of Leadership Styles on
organizational Behaviour with reference to Nigeria particularly FIRS were reviewed. Just as
different scholars like McGregor explained the theory of X and Y showing how one group
appreciate work whereas the order group dislike work, Blake and Mouton’s managerial grid
discussing five different approaches of leadership, and so many views of other scholars.
Moreover, the behaviours are influenced by both the internal and external factors that affect
the organization.
2.1- Historical Background on FIRS
In 1993, the Finance (Miscellaneous Taxation Provisions) Act No. 3 and Decree No. 104
established the Federal Inland Revenue Service (FIRS) as the operational arm of the Federal
Board of Inland Revenue (FBIR) and reviewed the functions of the Joint Tax Board (JTB),
respectively. In 2007, the history of tax administration in Nigeria changed with the granting
of financial and administrative autonomy to the Federal Inland Revenue Service through the
passage of the Federal Inland Revenue Service (Establishment) Act 2007. The
implementation of the critical changes in the laws and institutions governing taxation and tax

222
administration fell to the new board and management headed by Ifueko Omoigui Okauru,
who was appointed the Chairman and Chief Executive of the Federal Inland Revenue Service
by President Olusegun Obasanjo in May 2004. This marked a new era in the history of both
the legal and institutional processes of tax administration in Nigeria, bringing to place a scale
and gale of modernization and reform practices which, had never been attempted in the
history of taxation in Nigeria. The reforms include organisational restructuring of the Federal
and State authorities, the enactment of a National Tax Policy, reforms in funding, legislation,
taxpayer education, dispute resolution mechanism, taxpayer registration, human capacity
building, automation of key processes, refund mechanism and several other areas which are
recorded and explained in this documentation.
FIRS recognize that her staffs hold the key to the organizations ability to function efficiently,
effectively and to transform successfully. Staffs are given the chance to gain knowledge of
activities in a supportive environment. It provides challenging work load to enable the staffs
gain experience.
FIRS underlying principles on employees
1. FIRS recognize its staff as a fundamental to its success.
2. A strategic and fundamental approach to recruitment processes enable the service to
attract and appoint staff with necessary skills and attributes to fulfil its strategic aims and
support the organizations core value.
3. FIRS is committed to ensuring that the recruitment and selection of staff is conducted in a
manner that is systematic, efficient, effective and promotes equality of opportunity.
4. Recruitment shall be treated as a key public relations exercise as the way it is managed
affects FIRS image and consequently, its ability to attract and appoint high calibre staff.
5. The policy shall provide a flexible framework which promotes good practice, adopts a
proactive approach to equality and diverse issues and supports fully the FIRS core values.
6. Fair and consistent.
7. Non-discriminatory on the ground of gender, race religion or disability.
8. Conform to statutory regulations and agreed best practices.
9. Adopts both internal and external advertisements of vacancies for position.
10. Recognize the principles of testing all applicants for employment to institutionalize the
value of professionalism, integrity and efficiency.
11. Where women, the physically challenged or other such groups are underrepresented,
FIRS will set a goal to correct such situation.
2.2- Leadership and Behaviour
According to Mayowa (2009), leadership is the ability to evaluate and or forecast a long term
plan or policy and influence the followers towards the achievement of the said strategy. Also,
Bennis and Nanus (1997) viewed leadership like the abominable snowman whose foot prints
are everywhere but who is nowhere to be seen. He further suggested four visions of
leadership:
1) Attention through vision
2) Meaning through communication
3) Trust through positioning
4) The deployment of self.
223
According to Lawal, (1993) Leadership is the process of influencing others to work willingly
toward an organizational goal with confidence. Koontz, (1985) defined as “Leadership is
generally defined simply as the art of influencing people so that they will strive willingly
towards the achievement of group goals”. This concept can be enlarging to include not only
willingness to work but with zeal and confidence. Nwachukwu,.(2000), sees “Leadership
simply as an act that involves influencing others to act toward the attainment of a goal”.
Ubeku, (1975) define leadership as the act of motivating or causing people to perform certain
task intended to achieve specified objectives. Leadership is the act of making things happen
rather than letting things happen. This the leader does by exerting both intrinsic and extrinsic
influences on the group. Even though leadership is the most visible of’ the management
functions, largely because it deals so much with people. It has variedly been referred to as
directly, commanding, guiding, Inspiring, initiating, and activating. However, all stand for the
same purpose whatever denotation used. The user, as the striking feature of all suggests a
relationship through which one person influences the behaviour of other people.
Sikula,(1996).Leadership has different meanings to various authors. Some have interpreted
leaders in simple term such as the influence, the art or process of influencing people so that
they will strive willingly and enthusiastically towards achievement of group goals (Koontz,
1978).
The emphasis of this definition is that ideally, people should be encouraged to develop not
only willingness to Work but also willingness to work with zeal and confidence. Leadership
has also been interpreted more specifically as the use of authority in decision making
exercised as an attribute of position, personal knowledge or wisdom .Ejiofor,.(1989) defined
leadership as a social influence process in which the leader seeks voluntary participation of
subordinates in an effort to reach organizational objectives. Similarly, Tennenbaun, (I968)
defined leadership as interpersonal influence exercised in situations and directed through the
communication, towards the attainment of’ a specific goal(s). Adebakin and Gbadamosi
(1996) defined leadership as the process of influencing and directing the activities of an
organized group towards the achievement of the group of organization set objectives.
Good leaders develop through a never ending process of self-study, education, training and
experience, (Jago, 1982). Therefore, leaders are made not born. The desire and willingness an
individual has given him the ability to be a good leader. To inspire employees, there are
certain things you must be, know and do. This do not come naturally they are acquired
through gradual learning and hard work. To improve their leadership, they are constantly
learning and adopting skills not resting on their past laurels.
Base on the scholarly definitions, it shows that leadership depends on function of’ personality
and different behaviour, the role of’ a leader and their ability to influence behaviour towards
achieving results, the relationship among subordinates and managers and communications.
Despite these variations, there are at least three important implications of’ these definitions.
Firstly, the involvement of a leader or leaders and employees who by their willingness are
influenced by the leader.
Secondly, performing certain functions to that influences performance towards set goals.
Thirdly, attaining objectives and goals of the organization.
2.3- Styles of Leadership
Different scholars, authors and researchers have developed useful frameworks that describe
the main ways that people lead. In this study, we looked at some of the common
224
approaches/styles to leadership that you can use. These frameworks and styles of leadership
are based on several different approaches to leadership.
2.3.1- Lewin’s Leadership Style
Kurt Lewin, a psychologist developed his framework in the 1930s which provided the
foundation of many of the approaches that followed afterwards. He argued that there are three
major styles of leadership:
1) Autocratic Leadership
2) Democratic leadership
3) Laissez-Faire Leadership
Autocratic Leadership is a style whereby the leaders make decisions without consulting
their team members, even if their input would be useful. Employees do not participate in the
decision making process. This can be appropriate when you need to make decisions quickly,
when there's no need for team input, and when team agreement isn't necessary for a
successful outcome. However, this style can be demoralizing, and it can lead to high levels of
absenteeism and staff turnover. Also, there will be no creativity and innovation of ideas from
the staff.
Democratic leadership allows for employee participation but the leaders take the final
decision. They encourage creativity, and people are often highly engaged in projects and
decisions. As a result, team members tend to have high job satisfaction and high productivity.
This is not always an effective style to use, though, when you need to make a quick decision.
Laissez-faire leadership allow employees a lot of freedom in how they do their work, and
how they set their deadlines. They provide support with resources and advice if needed, but
otherwise they don't get involved. This autonomy can lead to high job satisfaction, but it can
be damaging if team members don't manage their time well, or if they don't have the
knowledge, skills, or self-motivation to do their work effectively. (Laissez-faire leadership
can also occur when managers don't have control over their work and their people).
2.3.3- Transactional Leadership Style
The approach emphasizes getting things done within the umbrella of the status quo; almost in
opposition to the goals of the transformational leadership. It’s considered to be a “by the
book” approach in which the person works within the rules. As such, it’s more commonly
seen in large, bureaucratic organizations where political considerations are part of daily life.
The leader member exchange is a transactional in nature.
The Leader Exchange Style
Sometimes known as leader-member exchange, the style involves the exchange of favors
between two individuals. An exchange can be hierarchical between the boss and subordinate
or occur between two individuals of equal status. For this leadership style to work, you need
to know how to develop, maintain and repair relationships.
2.3.4- The Participative Leadership Style
225
It’s hard to order and demand someone to be creative, perform as a team, solve complex
problems, improve quality, and provide outstanding customer service. The participative style
presents a happy medium between over controlling (micromanaging) and not being engaged
and tends to be seen in organizations that must innovate to prosper.
2.3.5- Situational Leadership Style
In the 1950s, management theorists from Ohio State University and the University of
Michigan published a series of studies to determine whether leaders should be more task or
relationship (people) oriented. The importance of the research cannot be overestimated since
leaders tend to have a dominant style; a leadership style they use in a wide variety of
situations.
Surprisingly, the research discovered that there is no one best style: leaders must adjust their
leadership style to the situation as well as to the people being led. Hershey and Blanchard’s
Model of Situational Leadership. Going back to the 1970s, the model primarily focuses on
the nature of the task as the major variable in choosing your style. In this model, there are
four options: telling, selling, participating and delegating.
Situational leadership theory (SLT) focuses on the followers. It says successful leadership
depends on selecting the right leadership style contingent on the followers’ readiness, or the
extent to which they are willing and able to accomplish a specific task. If followers are
unable and unwilling to do a task, the leader needs to give clear and specific directions; if
they are unable and willing, the leader needs to display high task orientation to compensate
for followers’ lack of ability and high relationship orientation to get them to “buy into” the
leader’s desires. Other discussions on situational leadership are:
1) Hersey and Blanchard’s- The Hersey-Blanchard Situational Leadership Theory is one
that is based around variable leadership, depending on a variety of circumstances.
When a leader is able to adapt to the situation as quickly as possible, everyone will
benefit in the end. Specifically, this theory has to do with the maturity of those who
are being led. To those who have worked as leaders in the past, it is no surprise that
maturity should be considered when working on finding the right leadership style.
2) Vroom and Yettons- The Vroom-Yetton-Jago Decision-making Model of Leadership
focuses upon decision making as how successful leadership emerges and progresses.
The parameters shaping a decision are quality, commitment of group or organization
members, and time restrictions. There are a number of leadership styles ranging from
authoritarian to highly participatory. In 1988, Vroom and Jago created a mathematical
expert system as a decision-making device in their work Leadership and Decision
Making. This addition of Jago renamed the original theory to the theory, with its
variants being Vroom-Yetton, Vroom-Jago, and Vroom-Yetton-Jago.
3) Path-Goal Theory- A theory that states that it is the leader’s job to assist followers in
attaining their goals and to provide the necessary direction and/or support to ensure
that their goals are compatible with the overall objectives of the group or organization
Other leadership theories include:
1) The servant leadership- This style rests on a set of assumptions (Greenleaf, 1983). In
this case, it is not the leader who benefits most, it is the followers. We have leaders
not acting selfishly, but socially. A second aspect to this is an orientation toward
226
service with a primary orientation toward using moral authority. Finally, the approach
emphasizes certain positive values such as trust, honestly, fairness and so on.
2) Leader Participation Model- A leadership theory that provides a set of rules to
determine the form and amount of participative decision making in different
situations.
3. The Coaching Style- A great coach is definitely a leader who also possess a unique gifts
ability to teach and train. They groom people to improve both knowledge and skill.
2.3.6- Transformational Leadership Style
It has been identified as the single most effective style. This style was first described during
the late 1970s and later expanded upon by researcher Bernard M. Bass. Some of the key
characteristics of his style of leadership are the abilities to motivate and inspire followers and
to direct positive changes in groups. Transformational leaders tend to be emotionally
intelligent, energetic, and passionate. They are not only committed to helping the
organization achieve its goals, but also to helping group members fulfil their potential.
Research has revealed that this style of leadership resulted in higher performance and
improved group satisfaction than other leadership styles. One study also found that
transformation leadership led to improved well-being among group members. Other
discussions on transformational leaderships are:
Bass Transformational Theory
In contrast to Burns, who sees transformational leadership as being inextricably linked with
higher order values, Bass originally saw it as a moral, and attributed transformational skills to
people such as Adolf Hitler and Jim Jones, although later changed his view after discussion
with Burns. As the word "transformation" suggests, Bass Transformational Leadership
Theory is one of a set of various Transformational Leadership Theories. More information of
a general nature about these can be found in the article Transformational Theories. Burns
originally said that leaders can transform the life of followers by altering their perceptions,
aspirations, expectations, values, and so forth. Qualities within the leader her or himself are
behind the changes. The leader demonstrates, communicates, and does whatever it takes to
get the audience see a vision and exhort them to do things.
Burns Transformational Theory
Burns Transformational leadership Theory, in other words, Burns focuses upon motivations
and values in assessing how a leader approaches power. This aspect of having that basic
ethical system sets leaders apart from those merely aspiring to power. The first, where ethics
is first, are people-centric and that latter are ego centric. Gandhi and Castro would be the ones
leading through morality and be transformational, while Hitler and Stalin would represent the
ego and be transactional. A transforming leadership is superseded by a transcendent
leadership, where the whole leadership process completely changes the character of an
individual from being a mere leader to one with a noble ethos, and that leader, accordingly
brings the led up into the same atmosphere.
2.3.7- Six Emotional Leadership Styles
1. Daniel Goleman, Richard Boyatzis, and Annie McKee suggested Six Emotional
Leadership Styles theory .The theory highlights the strengths and weaknesses of six common

227
styles – Visionary, Coaching, Affiliative, Democratic, Pacesetting, and Commanding. It also
shows how each style can affect the emotions of your team members.
2. The Visionary Leader moves people towards a shared vision, telling them where to go but
not how to get there - thus motivating them to struggle forwards. They openly share
information, hence giving knowledge power to others.
3. The Coaching Leader connects wants to organizational goals, holding long conversations
that reach beyond the workplace, helping people find strengths and weaknesses and tying
these to career aspirations and actions.
4. The Affiliative Leader creates people connections and thus harmony within the
organization. It is a very collaborative style which focuses on emotional needs over work
needs.
5. The Democratic Leader acts to value inputs and commitment via participation, listening to
both the bad and the good news.
6. The Pace-setting Leader builds challenge and exciting goals for people, expecting
excellence and often exemplifying it themselves. They identify poor performers and demand
more of them. If necessary, they will roll up their sleeves and rescue the situation themselves.
7. The Commanding Leader soothes fears and gives clear directions by his or her powerful
stance, commanding and expecting full compliance (agreement is not needed). They need
emotional self-control for success and can seem cold and distant.
2.3.8- Flamholtz and Randle's Leadership Style Matrix
Flamholtz and Randle's Leadership Style Matrix published in 2007 shows you the best style
to use, based on how capable people are of working autonomously, and how creative or
"programmable" the task is.
The matrix is divided into four quadrants – each quadrant identifies two possible styles that
will be effective for a given situation, ranging from "autocratic/benevolent autocratic" to
"consensus/laissez-faire."
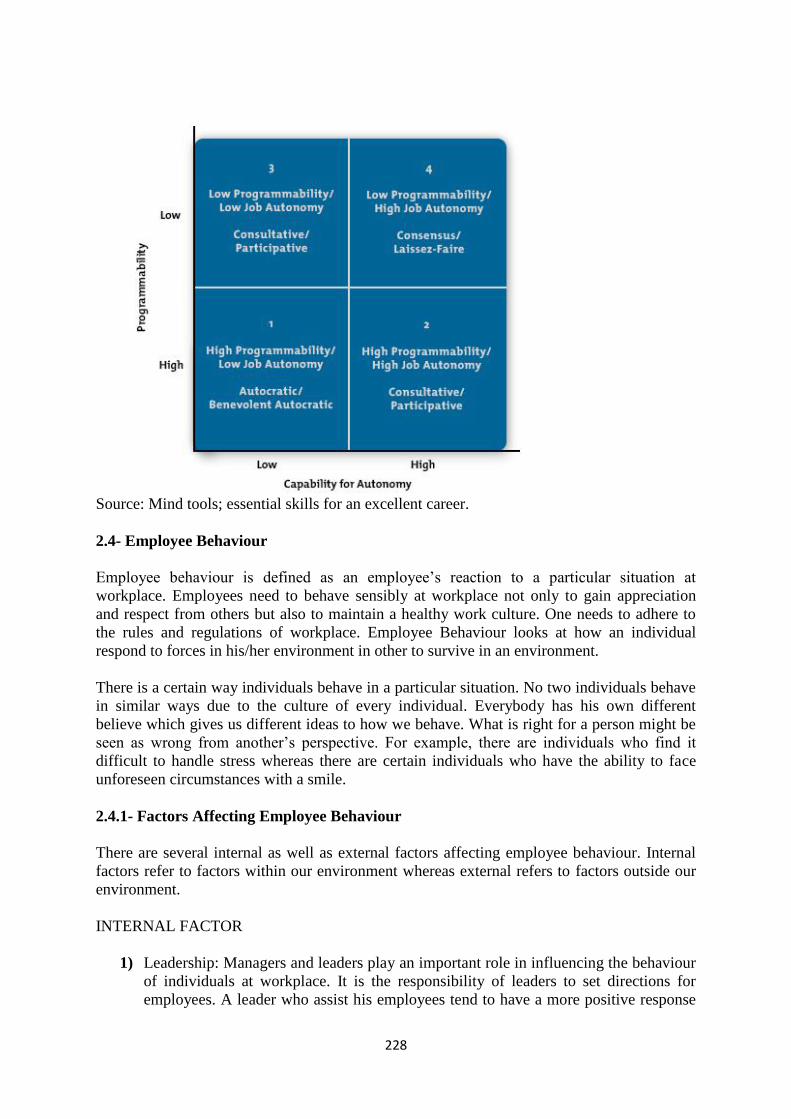
228
Source: Mind tools; essential skills for an excellent career.
2.4- Employee Behaviour
Employee behaviour is defined as an employee’s reaction to a particular situation at
workplace. Employees need to behave sensibly at workplace not only to gain appreciation
and respect from others but also to maintain a healthy work culture. One needs to adhere to
the rules and regulations of workplace. Employee Behaviour looks at how an individual
respond to forces in his/her environment in other to survive in an environment.
There is a certain way individuals behave in a particular situation. No two individuals behave
in similar ways due to the culture of every individual. Everybody has his own different
believe which gives us different ideas to how we behave. What is right for a person might be
seen as wrong from another’s perspective. For example, there are individuals who find it
difficult to handle stress whereas there are certain individuals who have the ability to face
unforeseen circumstances with a smile.
2.4.1- Factors Affecting Employee Behaviour
There are several internal as well as external factors affecting employee behaviour. Internal
factors refer to factors within our environment whereas external refers to factors outside our
environment.
INTERNAL FACTOR
1) Leadership: Managers and leaders play an important role in influencing the behaviour
of individuals at workplace. It is the responsibility of leaders to set directions for
employees. A leader who assist his employees tend to have a more positive response
229
from his subordinates. Therefore, when a leader stand by and support his employees
have a possible response where as a strict leader who does not provide support but
expect result might have a negative turn out. The way a leader relate with his
employees determines the behaviour of his subordinates.
2) Job Responsibilities: the task given to an employee determines his behaviour. When
given a task he/she can perform, a positive relationship is encouraged but when task
not familiar to the employee is given, a negative result might be expected. Employees
should be asked to do what best they can perform. Do not overburden employees.
Encourage them to upgrade their skills from time to time and training.
3) Communication: communication is a very vital tool in managing an organization. The
message subordinates receive determine their behaviour. Managers need to
communicate effectively with team members. Involving the employees in decision
making process should be communicated. Grievances and complains can be discussed
through he communication channels.
4) Work Culture: work culture refers to the way of life in the organization. The rules and
regulations of the institution. Employees need to feel comfortable at workplace for
them to stay positive and happy. Rules and regulations should be same for everyone.
Employees ought to be encouraged to respect their reporting bosses and follow the
code of ethics.
5) Organizational Policy: Policies are guidelines that links the formulation of strategy to
its implementation. The guidelines provided by the organization towards achieving
goals and objectives is a determinant of employee behaviour.
6) Relationship with co-workers/ team members: Interaction with co-workers provides
support and encourage participation. It is necessary to have friends at the workplace.
You need people around to talk to, discuss and share experiences.
Other related factors can be technology, informal groups, intranet.
EXTERNAL FACTORS
1) Competing Industries: the nature of environment in a competing industry is a
determinant of which behaviour employee will express. If the competing industry
have a more favourable environment, then it can influence the behaviour in a work
place.
2) Price of Labour: Price of labour affects behaviour. When the price is good and covers
the needs of the employee, it leads to satisfaction but when the price does not cover
the need, it will not be satisfactory which leads to frustration.
3) Family and Personal Life: It has been observed that individuals with a troubled
background or problematic family life tend to behave irrationally at workplace.
Employees who have strained relationships with family members like to sit till late at
work and spoil the entire work culture.
4) Unions: unions also affect the behaviour of employees. A union outside the
organization influences behaviour.
5) Government laws and regulations.
6) Organizational Bodies.
2.5-Employee Behaviour on Organizational Goals
Organizational goals are strategic objectives that a company’s management establishes to
outline expected outcomes and guide employees’ efforts. Most organization has the goal of
profit maximization through customer satisfaction. For organizations to survive and achieve
its goals, there must be a need and determination for competition through which the
230
management has to be flexible in its affair. Management needs their employees the most in
operating its business. The behaviour of employees determine the attainment of goals. When
employees are highly motivated, the goals and objectives of the organization are achieved but
when the employees are not motivated, the objectives are not likely to be achieved.
Therefore, the management needs to influence the behaviour of its employees to achieve
favourable result. Leaders need to make the employees’ environment favourable to be
motivated. As Frederick Herzberg has identified two motivational factors. He identified the
hygiene and motivational factors affecting employee behaviour. Herzberg's findings revealed
that certain characteristics of a job are consistently related to job satisfaction, while different
factors are associated with job dissatisfaction.
These are:
Factors for Satisfaction Factors for Dissatisfaction
Achievement
Recognition
The work itself
Responsibility
Advancement
Growth
Company policies
Supervision
Relationship with supervisor and peers
Work conditions
Salary
Status
Security
Source: Mind tools: essential skills for an excellent career.
2.5.1- Employee Behaviour and Other Construct
Relationship of employee behaviour can be distinguished from other related constructs.
2.5.1.1- Job Satisfaction and Employee Behaviour
Locke and Henne defined Job satisfaction as a pleasurable or positive emotional state
resulting from the appraisal of one’s job or experience (1986). It has been defined in many
different ways. Some believe it is simply how content an individual is with his or her job, in
other words, whether or not they like the job or individual aspects or facets of jobs, such as
nature of work or supervision. Others believe it is not so simplistic as this definition suggests
and instead that multidimensional psychological responses to one's job are involved.
Researchers have also noted that job satisfaction measures vary in the extent to which they
measure feelings about the job (affective job satisfaction) or cognitions about the job
(cognitive job satisfaction).
When people are satisfied with the work they are doing, then their job feels less like work and
is a more enjoyable experience. Those who are satisfied in their jobs usually do not find it
difficult to get up and go to work. Job satisfaction also reduces stress, which can affect job
performance, mental well-being, and physical health. Stress can also affect decision-
making—possibly leading to unethical or nonstrategic choices. Satisfied employees, on the
other hand, maintain a more positive and carefree perspective about work. This positive
outlook often spreads to co-workers and can have a positive experience on everyone's
performance. There are some indications that job satisfaction is directly tied to job
performance; nonetheless, feeling less stressed can positively affect a person's behavior.
The positive changes in behaviour shows that people learn from their environments and that
corporate culture plays a large part in creating job satisfaction. Managers are tasked with
managing this positive culture and understanding how each employee is affected by cultural
231
influences in the workplace. No two people are the same; this is where managers come into
play. Managers must be insightful and observant, identifying what motivates high levels of
job satisfaction in each individual and ensuring employees get what they need. In some ways,
a manager's customers are their subordinates. Understanding this dynamic is an important
component.
2.5.1.2- Organizational Commitment and Employee Behaviour
Organizational commitment can be contrasted with other work-related attitudes, such as job
satisfaction, defined as an employee's feelings about their job, and organizational
identification, defined as the degree to which an employee experiences a 'sense of oneness'
with their organization.
Employees contribute to the prosperity of their companies, when their labour efforts exceed
the duties assigned to their positions. his behaviour is spontaneous, occurring without
expecting reward later and is the result of a personal decision. Organizational commitment is
viewed as the employees’ loyalty to their employer, (Muchinsky). Davenport assert that
organizational commitment is established when the employee and the organization foster
greater interest on keeping their working relationship. According to Davis and Newstron, the
employee experiences a degree of loyalty related to his bonding with the organization, and
his willingness to continue participating or working with it. Organizational commitment is an
emotional connection that the employee feels with his job.
2.5.1.3- Psychological Empowerment and Employee Behaviour
According to Spreitzer (1995), psychological empowerment refers to an individual’s
experience of intrinsic motivation that is based on cognitions about himself or herself in
relation to his or her work role. These cognitions are related to the psychological states
identified by Hackman and Oldham (1980) and Kahn (1990) that impact on the intrinsic
motivation of employees. Greco, Laschinger and Wong (2006) state that it is reasonable to
expect that, if employees experience an empowering workplace that fosters a fit between their
expectations and their working conditions, they would be more engaged in their work.
As organisations focus on competition and profit margins, workers are confronted with
threats of real or anticipated job loss, causing many to feel insecure about their jobs and their
future work life (Holm & Hovland, 1999) which affects the behaviours of individuals.
2.6-Theories of Leadership
Theory is a body of knowledge developed through a method of science which consists of
principles and concepts that deducts management on how things are done in an organization,
Ebere (2012). Different views of what and how leadership is will be discussed. The earliest
literatures on leadership were concerned almost with theoretical issues. These theories sought
ti identify different types of leadership styles and relate them to functional demand on
employees’ behaviour.
2.6.1- Great Man Theory
232
Early research on leadership was based on the the study of people who were already great
leaders. These people were often from the aristocracy, as few from lower classes had the
opportunity to lead. This contributed to the notion that leadership had something to do with
breeding. The idea of the Great Man also strayed into the mythic domain, with notions that in
times of need, a Great Man would arise, almost by magic. This was easy to verify, by
pointing to people such as Eisenhower and Churchill, let alone those further back along the
timeline, even to Jesus, Moses, Mohammed and the Buddah.
The 'great man' theory was originally proposed by Thomas Carlyle. Gender issues were not
on the table when the 'Great Man' theory was proposed. Most leaders were male and the
thought of a Great Woman was generally in areas other than leadership. Most researchers
were also male, and concerns about androcentric bias were a long way from being realized. It
has been said that history is nothing but stories of great men. Certainly, much has this bias,
although there is of course also much about peoples and broader life.
2.6.2- Trait Theory
Trait theory, as the name gives away, is an approach to studying human personality that
identifies and measures the degree to which certain personality traits—recurring patterns of
thought and behavior, such as anxiousness, shyness, openness to new things—exist from
individual to individual. The study involves a set number of personality traits (although the
number of traits can vary wildly) and assigns the degree that a trait exists, which then
determines the individual’s personality.
2.6.3- Behavioural Theory
Behavioural theories of leadership are classified as such because they focus on the study of
specific behaviours of a leader. For behavioural theorists, a leader behaviour is the best
predictor of his leadership influences and as a result, is the best determinant of his or her
leadership success. Blake and Mouton’s Managerial Grid and Role Theory will be discussed.
Blake and Mouton’s Managerial Grid
Robert Blake and Jane Mouton developed a grid in 1964 identifying five different approaches
to leadership based on the concern for people and production.
Concern for People – This is the degree to which a leader considers the needs of team
members, their interests, and areas of personal development when deciding how best
to accomplish a task.
Concern for Results – This is the degree to which a leader emphasizes concrete
objectives, organizational efficiency and high productivity when deciding how best to
accomplish a task.
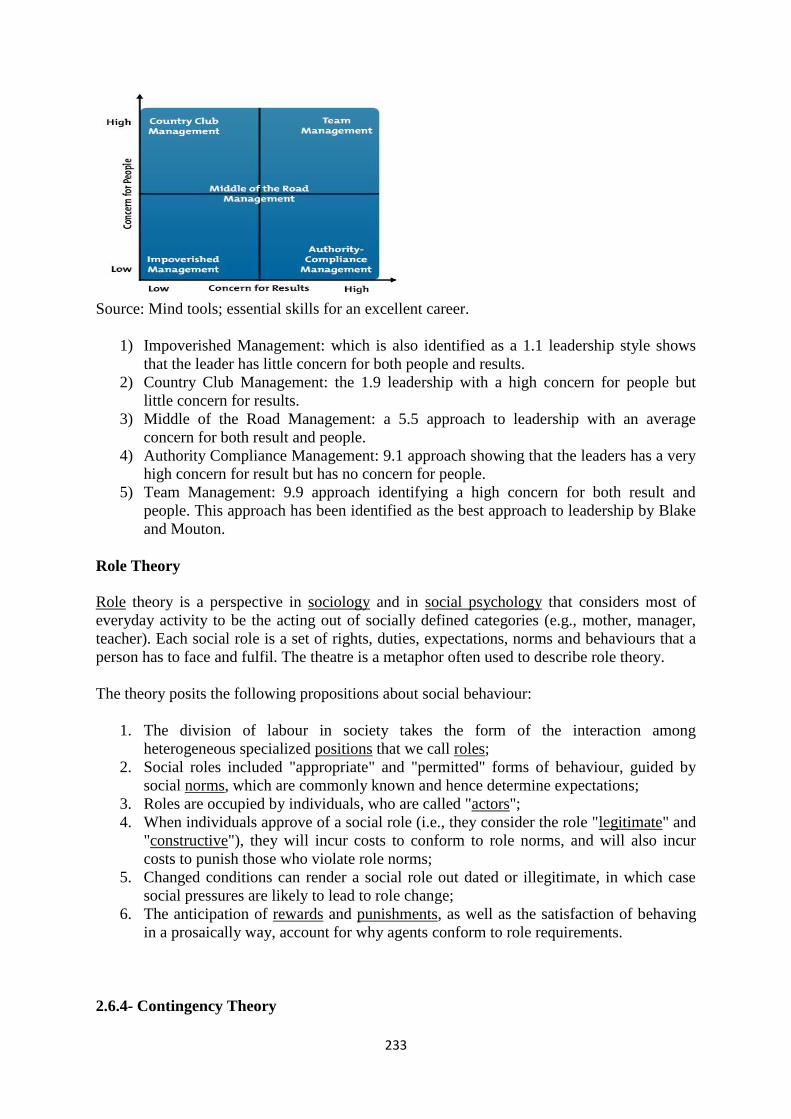
233
Source: Mind tools; essential skills for an excellent career.
1) Impoverished Management: which is also identified as a 1.1 leadership style shows
that the leader has little concern for both people and results.
2) Country Club Management: the 1.9 leadership with a high concern for people but
little concern for results.
3) Middle of the Road Management: a 5.5 approach to leadership with an average
concern for both result and people.
4) Authority Compliance Management: 9.1 approach showing that the leaders has a very
high concern for result but has no concern for people.
5) Team Management: 9.9 approach identifying a high concern for both result and
people. This approach has been identified as the best approach to leadership by Blake
and Mouton.
Role Theory
Role theory is a perspective in sociology and in social psychology that considers most of
everyday activity to be the acting out of socially defined categories (e.g., mother, manager,
teacher). Each social role is a set of rights, duties, expectations, norms and behaviours that a
person has to face and fulfil. The theatre is a metaphor often used to describe role theory.
The theory posits the following propositions about social behaviour:
1. The division of labour in society takes the form of the interaction among
heterogeneous specialized positions that we call roles;
2. Social roles included "appropriate" and "permitted" forms of behaviour, guided by
social norms, which are commonly known and hence determine expectations;
3. Roles are occupied by individuals, who are called "actors";
4. When individuals approve of a social role (i.e., they consider the role "legitimate" and
"constructive"), they will incur costs to conform to role norms, and will also incur
costs to punish those who violate role norms;
5. Changed conditions can render a social role out dated or illegitimate, in which case
social pressures are likely to lead to role change;
6. The anticipation of rewards and punishments, as well as the satisfaction of behaving
in a prosaically way, account for why agents conform to role requirements.
2.6.4- Contingency Theory
234
The contingency approach to leadership was influenced by two earlier research programs
endeavouring to pinpoint effective leadership behaviour. During the 1950s, researchers at
Ohio State University administered extensive questionnaires measuring a range of possible
leader behaviours in various organizational contexts. Although multiple sets of leadership
behaviours were originally identified based on these questionnaires, two types of behaviours
proved to be especially typical of effective leaders:
(1) Consideration leader behaviours that include building good rapport and interpersonal
relationships and showing support and concern for subordinates, and
(2) Initiating structure leader behaviours that provided structure (e.g., role assignment,
planning, scheduling) to ensure task completion and goal attainment. Other approaches to
contingency theory are:
1) Fielder’s Contingency Theory: Fiedler’s situational contingency theory holds that group
effectiveness depends on an appropriate match between a leader’s style (essentially a trait
measure) and the demands of the situation. Fiedler considers situational control the extent to
which a leader can determine what their group is going to do to be the primary contingency
factor in determining the effectiveness of leader behaviour.
Fiedler’s contingency model is a dynamic model where the personal characteristics and
motivation of the leader are said to interact with the current situation that the group faces.
Thus, the contingency model marks a shift away from the tendency to attribute leadership
effectiveness to personality alone (Forsyth).
2) Cognitive Resource: Formulated by Fred E. Fiedler and Joe Garcia from the former's
Contingency Model (1967) in 1987. The Cognitive Resource Theory main claim is that
various sources of stress are blocking the use of rationality in leadership. The more
cognitively acute and experienced a leader is, the more she or he is able to overcome the
effects of stress. Command, though, is the factor that overcomes the effects of stress. As for
experience is the main factor enabling leadership under stress. Intelligence is more effective
in less stressful situations. However, the leader's ability to think is more effective when her or
his style is more orderly, premeditated and authoritarian. If the leader is similar to the average
of a group, effective leadership will come from consensus-oriented approaches.
3) Strategic Contingencies: Theory was written by D. J. Hickson in 1971. With Strategic
Contingencies Theory, a leader depends on his problem solving skills and a projective
personality that is center stage. The leader his so because she or he is in demand and others
cannot solve the problems the leader faces. This gives the leader bargaining power. In that the
leader cannot be replaced easily, he or she is not easily displaced, especially by popular will
3.0- Methodology
For the purpose of the study, Fielder’s Contingency Theory was used as a guide in the
analysis of data. According to Fiedler’s contingency model, there is not only one type of
successful leadership style, but each style can thrive in the right group setting. Contingency
theory has broadened the scope of leadership from a focus on a single, best type of leadership
to emphasizing the importance of a leaders’ style and the demands of different situation.
In this study, secondary data was used and basically were from textbooks, journals,
magazines, internet and seminar papers.
235
4.0- Result for Findings
The study has derived relevant information in understanding the influence of leadership styles
on employee behaviour. Information has shown that the behaviour of the employees is greatly
affected by the nature of their leaders and sometimes the behaviour of employees affects the
approach of the leaders. It has also been observed that no style is suitable to be adapted but
rather flexibility in styles to the constant changes in our environment. Different styles and
approaches by different scholars have discussed different styles and the environment and
situations suitable to be adapted.
Also, FIRS has stated the importance of its staff. It has provided principles for the comfort of
its staff knowing that the employees hold the key to the organizations ability to function
effectively, efficiently and to transform successfully. The organization also understands the
importance of fairness and consistency. Looking at how women are challenged, FIRS has a
goal to correct such situation to enable the comfort and full participation of the female
employees.
5.0- Conclusions
Conclusively, the data acquired during this research has shown the relationship between
leadership styles and behaviour of individuals at work place. It suggest that employee
behaviour is determined by the style/approach the leader is practicing in the organization and
sometimes the behaviour can also determine the approach a leader should use.
The study confirmed that, though the style affects behaviour, it still identified that no style is
suitable for every situation because as the environment changes so does the decision making
procedure. For instance, in a situation where the leader and employees make decisions, when
the environment changes, a need will arise where the manager/leader needs to take immediate
decision in certain situations. Here, different styles will be practiced. The organization need
to be flexible for survival purposes. Therefore, the style of the leader depends on its
corresponding situation.
Also, it shows the importance of employee behaviour in every organization. Employees are
the most important resource in achieving goals and objectives. It has identified as much
factors affecting the behaviour apart leadership. It has discussed the need for leaders to
understand the behaviour of subordinates in other to create a favourable relationship towards
achieving results.
Lastly, this paper has provided as much information in an attempt to answer the above
mentioned questions and its objectives. It has provided information to the research problem
and other information required to understand the dependable relationship between leadership
and employee behaviour.
5.1- Recommendation
From the finding and the conclusions drawn, leadership Styles are seen as a determinant of
employee behaviour. For organizations to achieve their goals and objectives, there is the need
for an effective and efficient leader in place who is flexible to changing situations in order to
influence the behaviour of employees towards positive outcomes and results. Employee
Behaviour is complex because it deals with human diversities. Below are the
recommendations suggested after careful analysis of information gathered:
236
1) There is a need for leaders and managers to be flexible to their changing environment.
As Emery and Trist (1965) have identified a business environment as Turbulent Field
which is constantly changing, the manager needs to understand these changes both
internal and external in other to know the style of leadership to adapt in that particular
situation.
2) The leader/manager need to study and understand the behaviours of his/her employees
to know what motivates them for a positive response and what generates negativity of
behaviour. This will help in providing a suitable and favourable working
environment.
3) The leader/manager should study and understand the different styles and the situations
they are more suitable. This will help in understanding the advantages and
disadvantages of every style and also when applicable
4) The leader/manager should be flexible in their leadership styles. They should not
practice one particular style of leadership style because there is no one suitable style
for every situation. There is need for flexibility.
5) The physical challenge women face in most organizations should be corrected to
ensure full participation of all staff. This can encourage creative and innovative ideas.
6) Lastly, the study revealed several styles of leadership, so future studies should look
deep on this to further determine the extent to which leadership style effect on
performance.
References
1. Adeoye Mayowa (2009). Leadership definition by scholars, Nigeria.
2. Bennis w, G. (1997). Leaders: Strategies for taking charge. Harper and Row, New
York.
3. Boundless (2015). How Job Satisfaction Influences Behaviour.
4. Davis K and Newstron, J, W. (2001). Human Behaviour at Work. McGraw, Mexico
5. Davenport, T. (1999). Human Capital: What it is and Why People Invest It. Jossey
Bass, San Fransisco.
6. Ebere P. (2012) : unpublished notes
7. Ejiofor, P, (1989). Foundation of Business Administration. Onitsha Africa Publishing
Limited, Nigeria.
8. Emerald, (1980). Leadership and Organizational Development.
9. Federal Inland Revenue Service. Google Home Page.
10. Forsyth, D.R, (2006). Leadership: Group Dynamics. Belmont, California.
11. Gbadamosi, L, (2013). Teaching and Preaching Educational Planning and Policy:
Human Resource Planning and Development, Nigeria.
12. Goddy, O. I, (2014). Public Policy and Administration Research. Nigerian Police
Academy, Wudil, Kano.
13. Hackman, J. R. and Oldham, G.R. (1984). Work Design. Nursing Research.
14. Greco, P, Lachinger, H.K, and Wong, C.(1984). Leader Empowering Behaviour.
15. Holms, S. and Horland, J.(1999). Waiting for the Shoe to Drop. Journal of
Employment Counseling.
16. Hulin, C.L and Judge, T.A. (2003). Industrial and Organizational Psycology, Wiley.
17. Jago, A.G, (1982). Leadership: Perspective in Theory and Research, Management
Science.
18. Khan, W.A, (1990). Psycological Conditions of Personal Engagement and
Disengagement at Work. Academy of Management Journal.
19. Koontz H. et al (1978). Principles of Management. McGraw Hill, Tokyo.
237
20. Lawal A. A, (1993). Management in Focus. Abdul Industrial Enterprises, Lagos,
Nigeria.
21. Moorman, R.H. (1993). The Influence of Cognitive and Affective Based Job
Satisfaction Measures on the Relationship between Satisfaction and Organizational
Citizenship Behaviour.
22. Muchinsky, P.,(2007). Psychology Applied to Work. Thompson International,
BakersField, California.
23. Nelson Mandela (2015): Brainy Quotes.
24. Nwachukwu, C. C, (2003). Personnel Administration in Nigeria. University of Port-
Harcourt press, Nigeria.
25. Sam Walton (2015): Brainy Quotes.
26. Sikula, A.F (1996). Personnel Administration and Human Resource. Oluseyi Press,
Ibadan, Nigeria.
27. Specter, P.E. (1997). Job Satisfaction: Application, Assessment, Causes, and
Consequences. Thousand Oaks, California.
28. Spreitzer, G.M (1995). Psychlogical Empowerment in the Work Place.
29. Tennebaun, A.S, (1968). Control in Organization. McGraw Hill, New York.
30. Thomos, C. (1840). The Hero as Divinity: H
31. ero and Hero Worship
32. ThompSon, E.R. (2012): Group and Organizational Management.
33. Ubeku, A. A (1975). Personnel Management. Ethiope Publishing Corporation, Benin
City, Nigeria.

238
INSTITUTIONAL CONFLICT ON THE PROTECTION OF AIR PASSENGERS
RIGHTS IN NIGERIA: THE WAY FORWARD
Aliyu Mustapha
Faculty of Law, Bayero UniversitY, PMB 3011, Kano – Nigeria
Abstract:
The Consumer Protection Council (CPC) is saddled with the onus of protecting and providing
speedy redress to consumer complaints for both goods and services in Nigeria and air
passengers is no exception. Apparently air passenger rights and protection is a two way
traffic; the provision a black letter laws/regulations and the institutional implementation and
enforcement. The Nigerian Civil Aviation Authority (NCAA) recently came up with the Air
Passenger Bill of Rights. However there is an unresolved conflict between the CPC and the
NCAA on jurisdiction of receiving and enforcing air passenger’s complaints and rights
respectively. The paper in adopting doctrinal methodology investigates the roots of this
institutional conflict and analyzed the significant provisions of both the Consumer Protection
Council Act, 1992 and the Civil Aviation Regulations, 2015. The paper finds that air
passengers whose rights are breached may be deprived of such protection, rendered
disordered and placed at the receiving end while this conflict last. The paper thus
recommends for harmonization of the institutional framework either by a single or
cooperative policy or via outright amendment(s) of the applicable legal regime.
Key Words: Institutional Conflict, Air Passengers, Protection.
1.0 Introduction
Available data by the World Bank on Air passengers carried both domestic and international
registered in Nigeria as at the year 2014 is 4,289,094.1 Equally, the Nigerian Civil Aviation
of Nigeria (NCAA) in a report for the year 2015 disclosed that a total number of 15,383
flights operated on international routes while 62, 488 flights operated on domestic routes.2
However, air passengers still face challenges as delay, cancellation of flight and baggage
related issues. It is on record that the NCAA received more than 7,000 complaints from both
domestic and international air passengers in 2015.3 It was also revealed that more than 70
percent of air passengers experienced problems with their luggage either being “searched or
rummaged through” at a Nigerian airports4 and some airlines arriving at airports without
1 Air Transport, passengers carried. Published by the World Bank Data. Available at
http://data.worldbank.org/indicator/IS.AIR.PSGR. Accessed on 10th December, 2015.
2 Summary of Complaints handled in 2015. Available at http://ncaa.gov.ng/summary-of-complaints-handled-in-2015/.
Accessed on 10th January, 2016.
3 NCAA Receives 7,328 Passengers’ Complaints In 2015. Leadership newspaper. Available at
http://leadership.ng/business/497412/ncaa-receives-7328-passengers-complaints-2015. Accessed on 20 February, 2015.
According to the statement, Turkish Airlines recorded the highest number of complaints with 1,960 cases, while Air France
recorded 1,113 complaints. This was followed by British Airways and Etihad which recorded 988 and 677 complaints
respectively. It stated that 4,376 of such cases were successfully resolved with compensation paid by airlines to the affected
passengers during the period under review. But there is no evidence or record to show this progress.
4 Agabi C., Passengers rate Nigerian Airports experience low-survey. Daily Trust Online newspaper of 09/03/2016.
Available at http://www.dailytrust.com.ng/news/business/passengers-rate-nigeria-s-airports-experience-low-
survey/137160.html. Accessed 20th March, 2016.
239
passengers luggage. This in some occasions lead to the passengers invading the tarmac to
prevent the aircraft from taking off.5
On this premise, the article examines the role two institutions; Nigerian Civil Aviation
Authority (NCAA) and the Consumer Protection Council (CPC) in protecting and enforcing
the rights of air passengers with a view of revealing the inherent conflict between the two
regulatory institutions. The enabling laws of the two institutions with specific provisions
relating to consumer (air passenger) protection will be provided for analysis. Exploring the
conflict becomes necessary especially with the incessant breach of air passengers rights and
the negative effect of not offering aggrieved air passengers of the desired and speedy
protection which sometimes may be attributed to the lingering conflict.
The article argues that this development is not healthy and will render an air passengers
vulnerable and disordered in pursuing their rights. Therefore the need for an urgent resolution
of this conflict in order to provide an easy process of pursuing air passenger’s rights is timely.
The paper is divided into five parts. Part two of the paper which follows the introduction
deals with air passenger rights and protection regime in Nigeria, this is followed by part three
which explored the role of Nigerian Civil Aviation Authority and the role of the Consumer
Protection Directorate of the NCAA in protecting air passengers. Chapter four will highlight
the role of CPC in protecting air passengers in Nigeria. The implication of the conflict and
recommendations of the way forward will be addressed in part five while part six concludes
the paper.
2.0 Air Passenger Rights and Protection Regime in Nigeria
The rapid growth in air transportation over the years necessitated for a legal regime to be put
in place to regulate the air transportation sector. The international community and individual
states came up with regulatory frameworks for the aviation industry in general and for the
protection of air passenger rights in particular. Who then is an air passenger? According to
the 2015 Civil Aviation Regulations, an air passenger is a person in whose name a ticket and
a reservation is made and or confirmed and who is eligible to travel upon the stated flight
pursuant to that ticket whether the ticket is purchased by the person or not and whether the
ticket is zero fare ticket for which no fees or fare is paid.6 Air passenger in this context may
simply be described as a traveler by a commercial air flight who is not the pilot nor a crew
member. Both International Conventions and National laws apply to air transportation. This
is not just a design but a necessity because air transportation by its nature is not limited to one
state or country. The prominent International Conventions applicable to air transportation are
the Warsaw Convention, 19297 and the Montreal Convention, 1999.8 These conventions
provide for the principle of the air carrier’s liability for damage caused to passengers,
5“Turkish Airlines arrive Abuja without Passengers luggage.” Punch Newspaper of Jan, 10 2015 Available at
http://thecitizenng.com/business/again-turkish-airlines-arrives-abuja-without-passengers-luggage/. Accessed 20th March,
2016.
6 Section 19.1.1 (23) of the Civil Aviation Regulations, Vol. 102, S.I No. 36 (B2597) 2015.
7 The Warsaw Convention and the Montreal Conventions are referred as Convention for the Unification of Certain Rules
relating to International Carriage by Air. The Warsaw Convention was signed at Warsaw on 12 October, 1929 and was
ratified by Nigeria on 9/10/1963. The Convention applies to all International carriage of persons, luggage or goods
performed by aircraft for reward. It applies equally to gratuitous carriage by aircraft performed by an air transport
undertaking. Available at www.dot.gov/ost/ogc/Warsaw1929. Accessed on 28the July, 2015
8 The Montreal Convention was signed at Montreal in 1999 and is the successor of the Warsaw Convention, 1929. The
Convention in Article 55 provides that it shall prevail over any rules which apply to international carriage by Air (i.e. The
Warsaw Convention, 1929, Hague Protocol, 1955, Guadalajara Convention, 1961, Guatemala City Protocol, 1971 and the
Montreal Protocol of 1975.) The Convention was signed by Nigeria on 28/5/1999 and ratified on 10/5/2002. It is contained
in Schedule ii of the Civil Aviation Act, 2006.
240
baggage and goods, as well as for damage caused by delay. It also imposed liability on the
carrier for death and bodily injury of passengers as a result of an aircraft accident.9
In Nigeria the first indigenous attempt at legislating for Aviation was the Civil Aviation Act,
196410 and since then the Nigerian aviation industry continued to be administered mainly by
Nigerian legal institutions and instruments.11 The 1964 Civil Aviation Act primarily confers
powers on the Minister of Aviation to make such regulations as may appear to him as
necessary or expedient. The Minister in the discharge of his duties made subsidiary laws such
as the National Civil Aviation Policy, 199812 which recommended for the creation of
Nigerian Civil Aviation Authority (NCAA) and the Nigerian Airspace Management Agency
(NAMA). The civil aviation policy is aimed at ensuring that all civil laws and regulations in
Nigeria are in harmony with International law and regulations on the one hand and between
the Aviation ministry and its agencies on the other. These laws, albeit amended, are currently
in force and have immensely contributed to the development of air passenger rights and
safety of air transportation in Nigeria.
Besides the existence of these laws, efforts are being made at the international level to further
strengthen and protect the rights of air passengers both at the international and at individual
states level. The International Civil Aviation Organization (ICAO)13 among other measures
taken to manage air passenger protection issues held a High-Level Security Conference on
Aviation Security in 2012 where it was resolved that passenger satisfaction must be the basis
of any public policy in civil aviation matters.14 Pursuant to this move, member states of the
ICAO are obliged to take both legal and regulatory steps in promoting and protecting aviation
consumers (air passengers).
It is worthy to mention that the Civil Aviation Act (CAA) 200615 and the Nigerian Civil
Aviation Regulations (NCAR) 2015 are the most recent substantive domestic laws that caters
for air passenger rights. While the NCAA and its Consumer Protection Directorate (CPD) of
are the main regulatory bodies. Below are specific discussion on the laws and regulatory
institutions relating to air passenger rights and protection.
9 Article 17 of the Warsaw Convention 1926. See also Section 48 of the Civil Aviation Act, 2006.
10 Cap 51 Laws of the Federation of Nigeria (LFN) 1990. This Act was replaced by the Civil Aviation Act 2006, found
under Cap C13 LFN, 2010.
11 For instance the Federal Airports Authority of Nigeria (FAAN), the Nigeria Airspace Management Agency (NAMA). See
Ewakwe C. E, (Introduction to Civil Aviation Law in Nigeria) 1st edition., Aviation publishing and Consultancy Co. Ltd.
Lagos, 2006 p.2
12 The National Civil Aviation Policy, 1998. The policy was reviewed in 2011 and 2013 respectively to ensure that
developments in the International and domestic aviation are incorporated in the new policy.
13The International Civil Aviation Organization (ICAO) was created with the signing of the Convention on International
Civil Aviation at the “Chicago Convention” on 7 December 1944. The objective of ICAO, now a specialized agency of the
United Nations, is to promote the development of a safe, secure, regulated, efficient and economical international civil
aviation.
14 Working Paper presented at the High-Level Conference on Aviation Security (HLCAS), Refocusing Security Policies on
the Passenger. 12-14th September 2012.
15 The Civil Aviation (Repeal and Re-enactment) Act 2006 herein referred to the Act alongside the Federal Airports
Authority of Nigeria (FAAN) Act no.9, 1996, the Nigerian Airspace Management Agency (NAMA) Act No.48 1999, the
Nigerian Civil Aviation Authority (NCAA) Act No. 49 1999, Civil Aviation (Amendment) Act, 1999, Federal Airports
Authority of Nigeria (Amendment) Act No5 1999, Nigerian Civil Aviation Training Centre Act, 1965 and the Nigerian
Metrological Agency Act, 2003 regulate the Aviation industry. The Act has a total of 79 Sections and 15 Parts. Under
section 77 (1) (a-d) it repealed the Carriage by Air (Colonies, Territories and Protectorates) Colonial Order 1953, Civil
Aviation Act, Cap 51 of the laws of the federation of Nigeria (LFN) 1990, Civil Aviation (Amendment) Act, 1999 and the
Nigerian Civil Aviation Authority (Establishment) Act, No. 49 1999.

241
2.1 The Nigeria Civil Aviation Regulations 2015 and Air Passenger Rights
The Nigeria Civil Aviation Regulations, 2015 was first promulgated in 2006 to provide
national requirements in line with the provisions of the Civil Aviation Act, 2006 and for
standardized operational procedures, equipment and infrastructure including safety
management and training system in conformity with Standard and Recommended Practices
(SARPs) contained in the Annexes to the Chicago Convention.16 The regulation derives its
sustenance from section 71 of the Civil Aviation Act which provides:
(1) The Authority shall formulate schemes for suitable compensation of passengers and other
aviation and allied service consumers arising from different forms of grievances.
(2) The regulations under sub-section (1) of this section shall be formulated after holding
consultations with air carriers and other stake holders.
Relevant provisions of the regulations will be provided and analyzed alongside the provisions
of the Consumer Protection Council Act under 1.4 below.
3.0 The Nigerian Civil Aviation Authority (NCAA) and air passenger rights
Historically, the Nigerian Civil Aviation Authority17 came into being in 1998 pursuant to the
recommendation by the National Civil Aviation Policy (NCAP).18 Currently, the authority is
reestablished under section 2 of the CAA 2006. The scheme of the Act is such that there is a
clear distinction between the powers of the minister of aviation and the NCAA as a
regulatory agency.19 While the minister20 is in charge of control and supervision of civil
aviation, the NCAA is a parastatal of the ministry of aviation vested with the responsibility
for safety oversight of the aviation industry in accordance with all international conventions
and agreements, government policies and ICAO Standards and Recommended Practices
(SARPs).21 It is also important to mention that the minister is charged with the responsibility
of formulating policies and regulations for the aviation sector.22 Consequently the Civil
Aviation Regulations which aptly provides for air passenger protection was passed. Although
the regulations was made by the minister, its operation is discharged by the CPD of the
NCAA. Relevant provisions of the regulations will be provided and analyzed below.
3.1 The role of Consumer Protection Directorate of the NCAA in protecting air
passengers
The Consumer Protection Department (CPD) of the NCAA was launched in March 2001, to
ensure that all aviation consumers obtain the best services in air transportation.23 The
mission of the directorate is to serve as the eagle eye of the industry by being responsible for
informing, educating and protecting consumers as well as ensuring the provision of quality
16 Section 1 of the CAR, 2015 Government Notice No. 128, Part 1 Vol. 102 No. 175.
17 Herein referred to NCAA or the authority.
18 The National Civil Aviation Policy, 1998.
19 Ewakwe C. E, Op.cit, p.23.
20 Section 1 of the CAA 2006 which provides: The Minister shall be charged with the responsibility for the formulation of
policies and strategies for the promotion and encouragement of civil aviation in Nigeria and the fostering of sound economic
policies that assure the provision of efficient and safe services by air carriers and other aviation and allied service providers
as well as greater access to air transport in a sustainable manner and to assist with ensuring that Nigeria’s obligations under
international agreements are implemented and adhered to.
21 Nigerian Civil Aviation Policy, 2013. P. 8
22 Section 1 and 76 of the Civil Aviation Act 2006.
23 Nigerian Civil Aviation Authority, Consumer Protection. Available at http://www.ncaa.gov.ng/directorates/consumer-
protection/. Accessed 28th April, 2016.
242
services in the aviation industry. Some of the objectives and functions of the directorate as it
affects air passengers are enumerated below:
The main objective of the Directorate of Consumer Protection is to create efficient
and effective consumer protection machinery that will promote quality in service,
mutual confidence among stakeholders and patronage of the aviation industry in
Nigeria through the following measures, amongst others:
Enforcing compliance of airlines and other service providers with relevant
regulations.
Collecting, collating and following up on consumers’ complaints to satisfactory
conclusion;
Ensuring that appropriate compensations are paid to complainants.
Organizing and conducting public enlightenment programs on the rights and
responsibilities of both providers and users of air transport and allied services.
Publication of journals periodically showing number of complaints
resolved/unresolved and airlines performance assessment.
Guiding individual service providers in setting up Consumer Affairs Unit to promote
quality and consumer care in their respective operations;
Publication and circulation of enlightenment materials;
Collaborating with relevant government agencies NGOs, aviation media and industry
trade associations on consumer issues.24
Part 19 of the Civil Aviation Regulations 2015 provides for passengers' Rights and Airlines
Obligations to passengers. All airlines, foreign and domestic, are subject to the provisions of
the Regulations where:
(a) There is an incidence of "No-show" and Overbooking;
(b) Passengers are denied boarding against their will;
(c) A scheduled flight is delayed;
(d) A scheduled flight is cancelled.25
The scope of application of the Regulation is:
(i) to passengers departing from an airport located within the Nigerian territory to another
airport within Nigeria ;
(ii) to passengers departing from an airport located in another country to an airport situated
within Nigeria, unless they received benefits or compensation and were given assistance in
that other country, if the operating air carrier of the flight concerned is a Nigerian carrier ;
(iii) to foreign air transportation with respect to non-stop flight segments originating at a
point within Nigeria.26
The regulations also mandates that every airline shall establish a consumer protection desk at
every airport it operates into and shall appoint an officer to manage the desk for the purpose
24 Ibid.
25 Article 19.1 of the Nigerian CAR 2015.
26 See Article 19(1) (i) (ii) (iii) of the Nigerian CAR. The Regulations does not apply to passengers travelling free of charge
or at a reduced fare not available directly or indirectly to the public. However, it shall apply to passengers having tickets
issued under a frequent flyer programme or other commercial programme by an air carrier or tour operator.
243
of receiving, resolving and channeling difficult complaints to their Head offices, as well as
liaising with the Authority where necessary.27
It is quite worrisome that this important statutory duty that will assist in protecting air
passengers is not implemented by most airlines and little or no effort was made by the NCAA
and the CPD to enforce same. To this end, can the consumer protection council be seen to be
taken over the functions or usurping the powers of the CPD when it took steps to enforce air
passenger consumer rights? It appears that if the CPD was discharging her functions it will be
unlikely for an air passenger to proceed to the CPC to enforce their rights. Again is the CPC
mandated to even protect air passengers? The answer to this question will be appreciated
under the preceding section.
4.0 The Role Consumer Protection Council (CPC) in Protecting Air Passengers in
Nigeria
The Consumer Protection Council (CPC) is a Parastatal of the Federal Government of
Nigeria, supervised by the Federal Ministry of Trade and Investment. Though it was
established by Act No. 66 of 1992, it commenced operations only in 1999, when it’s
institutional framework; the Consumer Protection Act28 was put in place.29 By the provision
of section 32 of the act a "consumer" means an individual who purchases, uses, maintains or
disposes of product or services. Interestingly, the CAR in section 19.1.1(6) define a
consumer to mean “a consumer of civil aviation services.”30 Thus from the definition of the
CPC Act and the Regulations, an aviation consumer is an air passenger who is a consumer of
aviation service.
The distinction between a consumer of a product and a consumer of service is important
because the focus of this paper is “air passenger” who is a consumer of service (in the form of
work, or performance of a duty or supply of aids) as opposed to a consumer of product
(tangible goods, especially offered for sale). What then is the jurisdiction of consumer
protection council? It is clear that the council is mandated to protect consumers for both
products and services. In line with the Nigerian CPC Act, the functions of the Council is
provided under section 2 (1) (a) (a) (i) (j) and (k) as follows:
(a) provide speedy redress to consumers complaints through negotiations, mediation and
conciliations;
(d) cause an offending company, firm, trade, association or individual to protect, compensate,
provide relief and safeguards to injured consumers or communities from adverse effects of
technologies that are inherently harmful, injurious, violent or highly hazardous;
(i) ensure that consumers' interests receive due consideration at appropriate forum and to
provide redress to obnoxious practices or the unscrupulous exploitation of consumers by
companies, firms, trade association or individual;
(j) encourage the adoption of appropriate measures to ensure that products are safe for either
intended or normally safe use; and
27 Section 19.18.1 provides for the he procedure of lodging complaint by an aggrieved passenger.
28 Consumer Protection Council Act, Cap C 25 LFN, 2004 herein referred to as the CPC Act.
29 Overview of the Nigerian consumer protection council. Available at http://cpc.gov.ng/?page_id=865. Accessed on 5th
May, 2016.
30 Section19.1.1 (6) of the Civil Aviation Regulations, Vol. 102, S.I No. 36 (B2597) 2015
244
(k) perform such other functions as may be imposed on the Council pursuant to this
Decree.31
The above provision is exhaustive and is clear that the function and constituency of the
council is to protect all consumers of products and services in Nigeria; including but not
limited to air passengers. The conflict here is manifest. Both the Civil Aviation Regulations
and the Consumer Protection Act have elaborate provisions for the protection of consumers,
including how such functions should be discharged. For the CPC the modus operandi for the
discharge of her function is provided in section 3 of the CPC Act where it provides that the
council shall have power to:
(a) apply to court to prevent the circulation of any product which constitutes an imminent
public hazard;
(b) compel a manufacturer to certify that all safety standards are met in their products;
(c) cause as it deems necessary, quality tests to be conducted on a consumer product;
(d) demand production of label showing date and place of manufacture of a commodity as
well as certification of compliance;
(e) compel a manufacturer, dealer and service company where appropriate, to give public
notice of any health hazards inherent in their products;
(f) ban the sale, distribution, advertisement of products which do not comply with safety or
health regulations.
In the exercise of the functions of the council and in line with the modus operandi provided
above, council is mandated to take all necessary steps to ensure consumers are adequately
protected. Section 14 of the CPC Act provides room for collaboration to promote and
enhance consumer protection. Cases of collaboration may be necessary to give efficiency to
the council, as it may be impracticable for the council to operate in isolation. The section
provides:
In the discharge of its functions under this Decree, the Council may seek collaboration with
government agencies or other professional bodies in establishing laboratories or in joint use
of testing facilities, common procedures or in ensuring or enforcing standards of consumer
goods or in assessing the quantum of loss or damage.
From the wordings of section 14 above, the word services is omitted. It thus appears that the
provision’s target is the manufacturers of products. The problem with this provision, in the
opinion of this paper is limiting the operational powers of the council in areas of
collaboration to only manufacturers of products and relegating the providers of services
(where air passengers belong). Nevertheless, it can be deduced that the council may be
entitled to seek collaboration with any government agency or professional body in protecting
consumers of services since consumers of services are categorically mentioned in the
definition of a consumer. Thus collaboration with the NCAA or its directorate to enhance the
protection of air passengers will not be out of place.
This argument can further be buttressed by making reference to section 19.13.1 of the Civil
Aviation Regulations 2015. It provides that: This section shall apply without prejudice to a
passenger’s rights under any contract, statute or any other applicable law. Applicable law
may be interpreted to accommodate the Consumer Protection Council Act. The section gives
31 Section 2 (1) of the Consumer Protection Council Act. A bill to amend the CPC Act is before the National Assembly and
a public hearing was held on 18th July 2013.
245
a lee way to application of CPC Act. This means it is the business of the council by law to
protect and enforce the rights of air passengers within the spirit of both the CPC Act and the
Civil Aviation Regulations.
One of the recent attempt by the consumer protection council to enforce air passenger rights
was not free of challenges. The Council received complaints from passengers of Turkish
Airlines flight TK 623 of Sunday December 20 2015 and other subsequent flights which
arrived Abuja from Istanbul without the baggage of passengers. The said passengers, some of
who travelled with minors, including those whose destinations were outside Abuja, were
allegedly subjected to untold hardships, as they were forced to repeatedly check the Airport
in Abuja for their baggage, without any form of support by the airline. Consequently, the
council requested the airline to provide it with a full situation report of the said events,
including Turkish Airline’s policy on delayed baggage, particularly as regards the
compensation of affected passengers, the number of affected passengers, the number of
passengers who are yet to receive their baggage and when same is expected to arrive,
including steps, if any, that have been taken to provide appropriate redress to the affected
passengers.32
However, the airline in a belated response to CPC failed to give any useful information on the
issues raised by the Council, stating instead that it had attended several meetings with
different agencies of Government in connection with the matter. The airline also claimed that
it had resolved the situation completely, contrary to new complaints received by CPC. The
council continues to receive complaints that affected passengers are not being compensated
by Turkish Airlines. Worried by the lack-lustre approach of Turkish Airlines to the said
complaints, the Council in its last letter directed the airline to Section 18 of the CPC Act.33
For the purpose of clarity, the provision of the section is reproduced below:
Any person who without sufficient cause neglects or refuses to attend and testify before the
Council or the State Committee or to answer any lawful enquiry, or to produce any document
as may be required of him is guilty of an offence and be liable on conviction to a fine of not
less than N= 10,000 or five years imprisonment or to both such fine and imprisonment.34
The council had to formally request Attorney General of the Federation (AGF) to prosecute
the airline and its principal officers for its refusal to honor the order of the Council which
amounted to violation of the Council’s enabling Act. Consequently, the AGF upon receiving
the complaint, read a riot’s act to the Turkish Airlines to respond within 21 days to the
request of the Consumer Protection Council (CPC) for full situation report on its alleged
shoddy treatment of passengers of flight TK 623 of Sunday December 20, 2015 and other
subsequent flights during the yuletide or face prosecution.
In this scenario, it is interesting to observe that section 19.17.1 of the Regulations apples. The
section provides: A passenger shall have the right to his/her baggage carried on the same
flight that such passenger takes, subject to the considerations of safety, security, or any other
legal and valid cause. Similarly, section 19.17.2 provides that in case a checked-in baggage
32 Delayed baggage: CPC moves to sanction Turkish Airlines for failure to provide full situation report. Available at
http://cpc.gov.ng/?s=The+Council+received+complaints+from+passengers+of+Turkish+Airlines+flight+TK+623+.
Accessed 2nd May, 2016. See also Baggage Delay: Attorney General gives Turkish Airlines 21-Day ultimatum to comply
with CPC’s order. Available at http://cpc.gov.ng/?p=1625. Accessed 2nd May, 2016.
33 Ibid.
34 Section 18 of the Consumer Protection Council Act 2004.
246
has been off-loaded for operational, safety, or security reasons, the air carrier shall inform the
passenger at the soonest practicable time and in such manner that the passenger will readily
know of the off-loading. If the passenger’s baggage has been off-loaded, the air carrier should
notify the passenger, even if it had already announced that the baggage would be on the next
flight. As a remedy, the regulations provides that if the airline shall refund fees paid for
checked baggage if it is not delivered to the passenger within twenty-four (24) hours from the
arrival of flight.35
The regulations is clear on the right of a passenger to his baggage to be carried on the same
flight he boards. If for any justifiable reason such as safety reason a baggage could not
accompany a passenger, the carrier is under a duty to inform the passenger and make
necessary arrangements of its speedy delivery. Finally if after one day of a passenger’s arrival
his baggage is not delivered to him, he shall be entitled to a refund of the fees he paid for a
checked baggage. With the existence of these provisions one wonders what role did the CPD
played in protecting the aggrieved Turkish passengers. It appears that the directorate and
indeed the NCAA are not proactive in this instant case. The argument of this paper is that
manifest breach of right by an air carrier that affects so many passengers should be handled
by the directorate as a duty and as a matter of course. Thus the law is very clear but there is
challenge of enforcement. An average aggrieved air passenger is likely lay his grievances to
an agency he trust as the CPC.
The regulations is also clear on the process of a laying a complaint by a passenger against an
air carrier: A Passenger may make a complaint with the Authority against an airline in
relation to the breach of air passenger rights as provided in the Regulations by filling and
submitting a Complaint Form (available online and at all airports), after the consumer must
have notified the air carrier of such a breach and the complaint remains unresolved.36The
word “may” employed by the provision is a discretionary provision. So an aggrieved air
passenger may choose to complain to the authority or not.37
The Director General (DG) of the council insisted that in the present case (Turkish airlines),
regardless of whatever meetings Turkish Airlines claims it has attended, the onus is on the
airline to respond to CPC, showing clearly, with facts and figures, that it has satisfactorily
resolved the serious complaints of consumer rights abuse leveled against it. She said “apart
from extant laws and regulations in the country, the operations of Turkish Airlines are bound
by international standards and practices.38 In one of the interview with the DG CPC, the
question of air passenger protection in the aviation industry was asked and the DG responded
that with the aviation, it is still an area which is still work in progress. That there is still need
for that sector to recognize the importance of CPC in the protection of the aviation
customers.39 It goes without saying that there is disharmony between the two regulatory
institutions vis a vis protection of air passenger rights.
5.0 Implication of the Conflict and Suggestion for Reform
The CPC is the apex consumer protection agency of the Federal Government, responsible for
protecting and providing speedy redress to consumer complaints for both goods and services
35 Section 19.17.4 of the CAR, 2015.
36 Section 19.22.3 of the CAR, 2015
37 See section 53 (1) of the interpretation act provides that where in a written law the word "may" is used in conferring a
power, such word shall be interpreted to imply that the power so conferred may be exercised or not, at discretion.
38 Opcit, Note 32.
39 Atoki D., “All Consumer Protection Council’s intervention are backed by law.” This day, 9th April 2016

247
in Nigeria. The CPC argues that her constituency is the whole of Nigeria in as much
consumers of products and services are affected. With the coming up of the air passenger
rights regulations by the NCAA in 2015, there is an unresolved conflict between the CPC and
the NCAA on jurisdiction of receiving complaints on the one hand and the enforcement of air
passengers’ complaints on the other. There are instances where dissatisfied passengers have
reason to go to the CPC to lay a complaint and when the Commission attempts to act, it was
halted by the NCAA relying on the provisions of the extant aviation laws and regulations. As
manifested above, both institutions have the statutory power to protect and enforce air
passenger rights and a result this leads to institutional conflict. Consequently air passengers
whose rights are breached may be deprived protection, rendered disordered and placed at the
receiving end while the conflict last. This is why this problem needs urgent attention.
There is no doubt that the CPC predates the NCAA and its CPD. But it also obvious that
aviation is a developing industry. Thus, as laws and regulations are enacted, consideration
should be given to the existing legislations. It could be argued that the failure of the NCCA to
enforce air passenger rights could be a contributory factor to this clash. For instance, the
obligation of air carrier to inform air passengers of their rights and to establish air passenger
customer service desk40 in all airports they operate with trained personnel to attain to
passenger complaints is not complied by the carriers. This is an obvious laxity on the part of
the NCAA for not enforcing compliance by carriers. There is need to investigate why air
carriers are not complying with this provision. In the same token, the failure of NCAA to
protect and enforce the right of air passengers to a reasonable standard is the reason why
some Nigerian passengers have to source for solace from the CPC.
6.0 Conclusion
In the foregoing, the article explored the rights of a consumer (air passenger) to access basic
air services, including compensation for unsatisfactory services. The research found that there
is a conflict between The Nigerian Civil Aviation Authority and the Consumer Protection
Council in enforcing air passenger’s rights. As an implication of the conflict, it is found that
majority of the air passengers seem helpless in the face of exploitation or abuse by some
corrupt air carriers. This finding was reached after exploring the legal regime on air
passenger rights and protection in Nigeria, the role of Nigerian Civil Aviation Authority, the
Consumer Protection Directorate of the NCAA and the Consumer Protection Council. It is
recommended that Passengers should be correctly informed of their legal and contractual
rights, including where and how to pursue same. Strong measures are also necessary to
maintain harmony between the NCAA, CPC and the CPD in the enforcement of air passenger
rights. In other words, the efforts of enforcement/regulatory institutions should be
strengthened and harmonized either by way of cooperative policy by the affected ministries
or via outright amendment(s) of the applicable legal regime/regulations to come up with more
encompassing and conflict free air passenger protection and enforcement regime.
References
1. Agabi C., Passengers rate Nigerian Airports experience low-survey. Daily Trust Online
newspaper of 09/03/2016. Available at
40 Civil Aviation Regulations 2015
248
http://www.dailytrust.com.ng/news/business/passengers-rate-nigeria-s-airports-
experience-low-survey/137160.html. Accessed 20th March, 2016.
2. Air Transport, passengers carried. Published by the World Bank Data. Available at
http://data.worldbank.org/indicator/IS.AIR.PSGR. Accessed on 10th December, 2015.
3. Warsaw Convention 1926.
4. Civil Aviation Act, 2006.
5. Nigerian Civil Aviation Regulations 2015.
6. Atoki D., “All Consumer Protection Council’s intervention are backed by law.” This day,
9th April 2016
7. Cap 51 Laws of the Federation of Nigeria (LFN) 1990. This Act was replaced by the
Civil Aviation Act 2006, found under Cap C13 LFN, 2010.
8. Delayed baggage: CPC moves to sanction Turkish Airlines for failure to provide full
situation report. Available at
http://cpc.gov.ng/?s=The+Council+received+complaints+from+passengers+of+Turkish+
Airlines+flight+TK+623+. Accessed 2nd May, 2016.
9. Ewakwe C. E, (Introduction to Civil Aviation Law in Nigeria) 1st edition., Aviation
publishing and Consultancy Co. Ltd. Lagos, 2006 p.2
10. NCAA Receives 7,328 Passengers’ Complaints In 2015. Leadership newspaper.
Available at http://leadership.ng/business/497412/ncaa-receives-7328-passengers-
complaints-2015. Accessed on 20 February, 2015.
11. Nigerian Civil Aviation Authority, Consumer Protection. Available at
http://www.ncaa.gov.ng/directorates/consumer-protection/. Accessed 28th April, 2016.
12. Nigerian Civil Aviation Policy, 2013. P. 8
13. Overview of the Nigerian consumer protection council. Available at
http://cpc.gov.ng/?page_id=865. Accessed on 5th May, 2016.
14. Section 1 and 76 of the Civil Aviation Act 2006.
15. Civil Aviation Regulations, 2015 Government Notice No. 128, Part 1 Vol. 102 No. 175.
16. Consumer Protection Council Act 2004.
17. Civil Aviation Regulations, Vol. 102, S.I No. 36 (B2597) 2015.
18. Section 2 (1) of the Consumer Protection Council Act. A bill to amend the CPC Act is
before the National Assembly and a public hearing was held on 18th July 2013.
19. Section19.1.1 (6) of the Civil Aviation Regulations, Vol. 102, S.I No. 36 (B2597) 2015
20. Summary of Complaints handled in 2015. Available at http://ncaa.gov.ng/summary-of-
complaints-handled-in-2015/. Accessed on 10th January, 2016.
21. The Montreal Convention was signed at Montreal in 1999
22. The National Civil Aviation Policy, 1998
23. Working Paper presented at the High-Level Conference on Aviation Security (HLCAS),
Refocusing Security Policies on the Passenger. 12-14th September 2012.
24. Turkish Airlines arrive Abuja without Passengers luggage.” Punch Newspaper of Jan, 10
2015 Available at http://thecitizenng.com/business/again-turkish-airlines-arrives-abuja-
without-passengers-luggage/. Accessed 20th March, 2016.
25. The International Civil Aviation Organization (ICAO) Convention on International Civil
Aviation at the “Chicago Convention” on 7 December 1944.
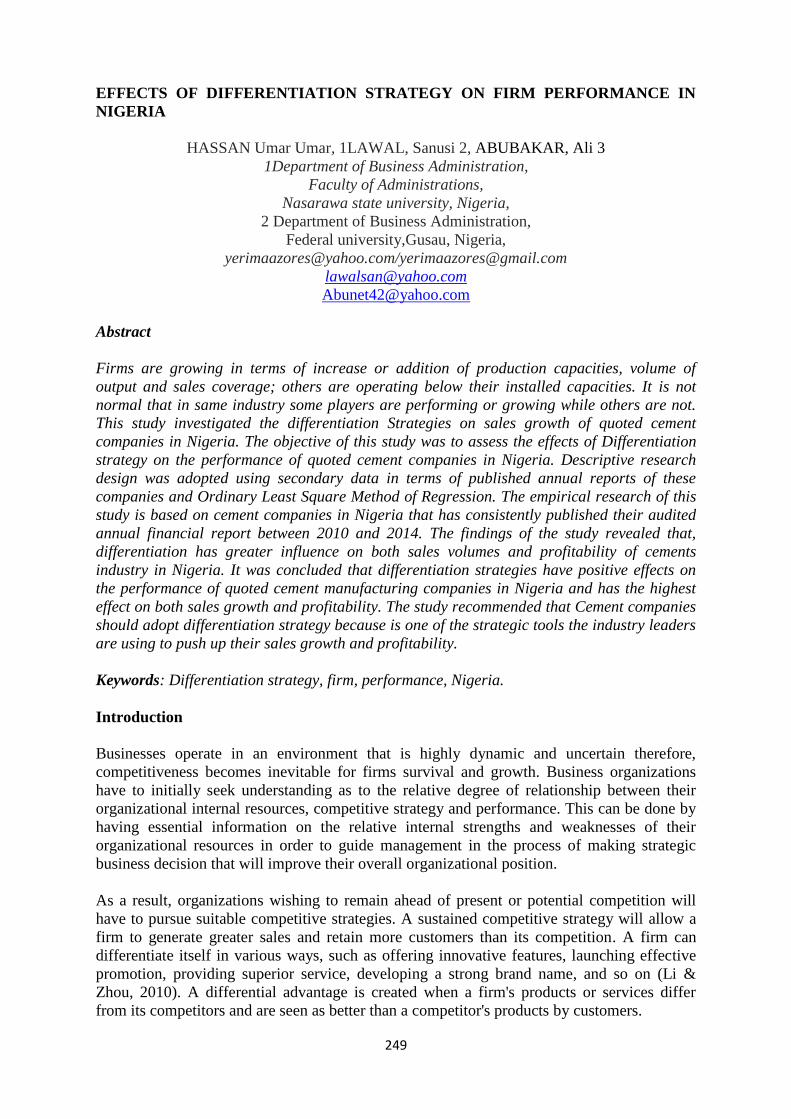
249
EFFECTS OF DIFFERENTIATION STRATEGY ON FIRM PERFORMANCE IN
NIGERIA
HASSAN Umar Umar, 1LAWAL, Sanusi 2, ABUBAKAR, Ali 3
1Department of Business Administration,
Faculty of Administrations,
Nasarawa state university, Nigeria,
2 Department of Business Administration,
Federal university,Gusau, Nigeria,
[email protected]/[email protected]
Abstract
Firms are growing in terms of increase or addition of production capacities, volume of
output and sales coverage; others are operating below their installed capacities. It is not
normal that in same industry some players are performing or growing while others are not.
This study investigated the differentiation Strategies on sales growth of quoted cement
companies in Nigeria. The objective of this study was to assess the effects of Differentiation
strategy on the performance of quoted cement companies in Nigeria. Descriptive research
design was adopted using secondary data in terms of published annual reports of these
companies and Ordinary Least Square Method of Regression. The empirical research of this
study is based on cement companies in Nigeria that has consistently published their audited
annual financial report between 2010 and 2014. The findings of the study revealed that,
differentiation has greater influence on both sales volumes and profitability of cements
industry in Nigeria. It was concluded that differentiation strategies have positive effects on
the performance of quoted cement manufacturing companies in Nigeria and has the highest
effect on both sales growth and profitability. The study recommended that Cement companies
should adopt differentiation strategy because is one of the strategic tools the industry leaders
are using to push up their sales growth and profitability.
Keywords: Differentiation strategy, firm, performance, Nigeria.
Introduction
Businesses operate in an environment that is highly dynamic and uncertain therefore,
competitiveness becomes inevitable for firms survival and growth. Business organizations
have to initially seek understanding as to the relative degree of relationship between their
organizational internal resources, competitive strategy and performance. This can be done by
having essential information on the relative internal strengths and weaknesses of their
organizational resources in order to guide management in the process of making strategic
business decision that will improve their overall organizational position.
As a result, organizations wishing to remain ahead of present or potential competition will
have to pursue suitable competitive strategies. A sustained competitive strategy will allow a
firm to generate greater sales and retain more customers than its competition. A firm can
differentiate itself in various ways, such as offering innovative features, launching effective
promotion, providing superior service, developing a strong brand name, and so on (Li &
Zhou, 2010). A differential advantage is created when a firm's products or services differ
from its competitors and are seen as better than a competitor's products by customers.

250
Porter (1985, 2008) defines competitive strategy along the three dimensions of cost,
differentiation and focus with competitors trying to set themselves apart from those perceived
as “stuck in the middle” without competitive advantage. He suggests that being able to
produce an event at a lower cost compared to the competitors is one-way to competitive
advantage.
Scholars investigated on competitive strategy in terms of cost leadership and differentiation
strategies investigated their effects on firm performance as a single strategy. Birjandi,
Honarbakhsh and Valipour, (2012) compared the effects of cost leadership and product
differentiation strategies on the performance of firms in Tehran security exchange and raised
the issue of lack of attention by scholars on the combined effects of cost leadership and
differentiation strategies on firm performance.
Among the quoted companies in Nigerian, it has been observed that while some cement
manufacturers are growing and expanding rapidly in terms of production capacity others are
finding it difficult to fully utilize their installed capacity. In spite of the fact that empirical
researchers concerning the effects of competitive strategy on performance of firm had gain
momentum and international relevance, however, to the best of our knowledge study on the
effects of cost strategy on firm performance in Nigeria but no on differentiation strategy on
firm performance . Therefore, this study therefore, focused on how product differentiation
strategies influences the performance of the organizations involved in the manufacturing of
cement in Nigeria.
The broad objective of this study is to assess the effects differentiation strategy on firm
performance in Nigeria. The specific objectives are: Differentiation on sales growth of quoted
cement companies in Nigeria. Differentiation on profitability of quoted cement companies in
Nigeria.
On the bases of the above objectives, the study formulates the following null hypotheses:
H01: Differentiation has no significant effects on sales growth of quoted cement
companies in Nigeria.
H02: Differentiation has no significant effects on profitability of quoted cement companies
in Nigeria.
The study contributes to drives profitability and sales growth of cement industry in Nigeria
and contributes to the literature designed to assess the effects of differentiation strategies on
the performance of cement companies in Nigeria.
Review of Empirical Studies on differentiation strategies on firm performance
Differentiation Strategy
This strategy is aimed at the broad market that involves the creation of a product or services
that is perceived throughout its industry as unique (Porter, 2008, 1985). He observed that the
company or business unit may then charge a premium for its product. Differentiation is a
viable strategy for earning above average returns in a specific business because the resulting
brand loyalty may lowers customers' sensitivity to price (Arthur et al 2010; Porter 1985). He
argued that increased costs can usually be passed on to the buyers and buyer’s loyalty can
also serve as entry barrier as new firms must develop their own distinctive competence to

251
differentiate their products in some way in order to compete successfully. Differentiation
strategy is appropriate where the target customer segment is not price-sensitive, the market is
becoming competitive and customers have very specific needs which are possibly under-
served, and the firm has unique resources and capabilities which enable it to satisfy these
needs in ways that are difficult to copy (Tanwaer, 2013,:13). These could be through unique
technical expertise or innovative processes. Cement users in Nigeria have very specific needs
because those that use cement for block making prefer cement type that can set faster apart
from strength, those that use cement for bridge prefer cement that provides strength and those
that use cement for plaster prefer cement that provides smooth finish.
A differentiation strategy therefore can be based on many dimensions such as brand image,
innovativeness and design features, product quality, reliability, durability, customer service
and firm reputation (Porter, 2008, 1996, 1985 & 1980). He posited that a successful
differentiation strategy must be based on features that are difficult for rivals to imitate. A firm
that pursues a differentiation strategy may attempt to create a unique image in the minds of
customers that the firm or its products are superior to those of its competitors (Miller, 1988).
He observed that firm creates these perceptions through advertising programs, marketing
techniques and methods, and charging premium prices.
Moreover, ‘a firm may pursue a differentiation strategy by creating a perception in the minds
of customers that its products possess characteristics that are unique from those of its
competitors in terms of differences in design, physical attributes/features, and durability’
(Arthur et al 2010,:149). They further argued that a firm focusing on these characteristics
performs innovative activities to constantly improve upon the design and physical attributes
and performance of its products. Tanwar (2013) supported this assertion when he suggested
that a firm may also offer superior customer service or create the perception that it pays
attention to and empathizes with customers’ needs and desires so as to differentiate it from
competitors. This enables a firm implementing a differentiation strategy to create a positive
reputation, brand image and customer loyalty. Thus, the pursuit of a differentiation strategy
helps firms to avoid potentially severe price competition because of their ability to offer
products with greater reliability, greater durability, greater features and aesthetics, superior
performance (Dean and Evans, 1994; Mintzberg, 1988), creating customer and brand loyalty
(Porter, 2008 &1980). Differentiators are thus able to generate competitive advantage over
their rivals and achieve superior performance.
Successful differentiation is displayed when a company accomplishes a premium price for the
product through increased revenue per unit, (Arthur et al 2010). They argued that
differentiation drives profitability when the added price of the product outweighed the added
expense to acquire the product but is ineffective when its uniqueness can be easily replicated
by its competitors. Successful brand management also results in perceived uniqueness even
when the physical product is the same as competitors.
Differentiation strategy is not suitable for small companies. It is more appropriate for big
companies. The '''unlimited resources model''' utilizes a large base of resources that allows an
organisation to outlast competitors by practicing a differentiation strategy (Arthur et al 2010;
Fruhan 1979). An organisation with greater resources can manage risk and sustain profits
more easily than one with fewer resources (Porter, 2008 & 1985). Differentiation provides a
short-term advantage only if a firm lacks the capacity for continual innovation; it will not
sustain its competitive position over time (Arthur et al 2010)

252
Aliqah (2012), investigated the relationship between differentiation strategy and
organizational performance in 33 industrial companies listed at Amman Stock Exchange at
the beginning of 2010 using multiple regression and Pearson correlation coefficient. He
found out that the differentiation strategy has no significant effect on organizational
performance of such companies. He concluded further that Jordanian companies have not
incorporated product differentiation strategy correctly to improve their performance. The
study used only 70 questionnaires to interview over 10 companies and the work did not look
at the effects of other competitive strategy like cost leadership.
Birjandi, Honarbakhsh and Valipour (2012), empirically investigated the effects of business
strategies (cost leadership and differentiation strategies) on the relationship between financial
leverage and the performance of firms. The research data was collected from 45 firms in the
Tehran Security Exchange (TSE) during 2003 to 2010. To test the assumptions, they used
multiple regressions and firms were divided into two groups: firms with cost leadership
strategy and firms with product differentiation strategy. Their findings indicated that in the
firms with cost leadership strategy, there were positive relationships between leverage; cost
leadership strategy and dividend payout with performance. The results also suggested that
there was positive relationship between leverage and firm's size with performance in the
firms with product differentiation strategy, but the relationship between product
differentiation strategy and dividend payout with performance was negative. In their study,
the 45 firms were divided into two groups as if they assumed that cost leadership and
differentiation strategies are mutually exclusive but this position was not reported in their
work.
Theoretical Framework
The study adopts the market-based view (mbv) to underpin the study. The Market-Based
View (MBV) of strategy argues that industry factors and external market orientation are the
primary determinants of firm performance (Peteraf & Bergen 2003; Porter 1996, 1985 1980;
Caves & Porter 1977; Bain 1968). Bain’s (1968) Structure-Conduct-Performance (SCP)
framework and Porter’s (1980) five forces model (which is based on the SCP framework) are
two of the best-known theories in this category. The sources of value for the firm are
embedded in the competitive situation characterizing its end-product strategic position. The
strategic position is a firm’s unique set of activities that are different from their rivals.
Alternatively, the strategic position of a firm is defined by how it performs similar activities
to other firms, but in very different ways. In this perspective, a firm’s profitability or
performance are determined solely by the structure and competitive dynamics of the industry
within which it operates (Schendel 1994).
The Market-Based View (MBV) includes the positioning school of theories of strategy and
theories developed in the industrial organisation economics phase of Hoskisson’s account of
the development of strategic thinking (of which Porter’s is one example) (Hoskisson et al.
1999; Mintzberg et al. 1998; Porter 1980). During this phase, the focus was on the firm’s
environment and external factors.
Methodology
This study adopted the descriptive research design which belongs to the generic family
research design type called survey design. The survey design presents an oriented

253
methodology used to investigate the population by selecting samples to analyze and discover
occurrences. Descriptive research design was used as a means of trying to assess the effect of
differentiation strategy on firm performance in Nigeria. (i.e. quoted cement companies in
Nigeria).
The population of the study and the selected sample for this study are the four quoted cement
companies in Nigeria as at 2014.
Model Specification
In the light of the methodological knowledge gathered and empirical literature, a panel data
multiple regression model is specified.
The models for the regression are:
PRFT=F (Differentiation)
SG=F (Differentiation)
Mathematically,
SG= α + βDifferentiation + µ ------------------------------------------------------- 1
PRFT= α + βDifferentiation + µ ---------------------------------------------------- 2
Where:
SG= Sales Growth
PRFT=Profitability
α =Intercept or Constant
β = Slope of the regression line with respect to the independent variables
µ=error term
Results and Discussion
H01: Differentiation has no significant effects on sales growth of quoted cement companies
in Nigeria. To test this hypothesis differentiation was represented with ratio of research and
development reserve on total assets while sales growth was represented with ratio of increase
in turnover.
Model Summary
Model R R square Adjusted R square Std Error of the Estimate
1 .510 .560 .560 .22162
a. Pridictors: (constant), Diffrentiation
ANOVAb
Model Sum of Squares Df Mean Square F Sig.

254
H02: Differentiation has no significant effects on profitability of quoted cement companies
in Nigeria. To test this hypothesis differentiation was represented by ratio of research and
development reserve to total asset while profitability was represented by ratio of EAT to
turnover.
ANOVAb
Model
Sum of
Squares Df Mean Square F Sig.
1 Regression
109.009
1 139.009 362.244 .000a
Residual 41.146 18 .441
Total
138.950
19
a. Predictors: (Constant), Differentiation
b. Dependent Variable: Profitability
Coefficientsa
Model
Unstandardized
Coefficients
Standardized
Coefficients
T Sig. B Std. Error Beta
1 (Constant) -0.795 .202 -2.186 .002
Differentiation 1.234 .021 .653 17.111 .000
1 Regression 174.7000 1 174.7000 336.339 .000a
Residual 46.100 18 0850
Total 802.5900 19
a. Predictors: (Constant), Differentiation
b. Dependent Variable: Sales Growth
Model Summary
Model R R Square
Adjusted R
Square
Std. Error of
the Estimate
1 .653a .664 .662 .56088
a. Predictors: (Constant), Differentiation
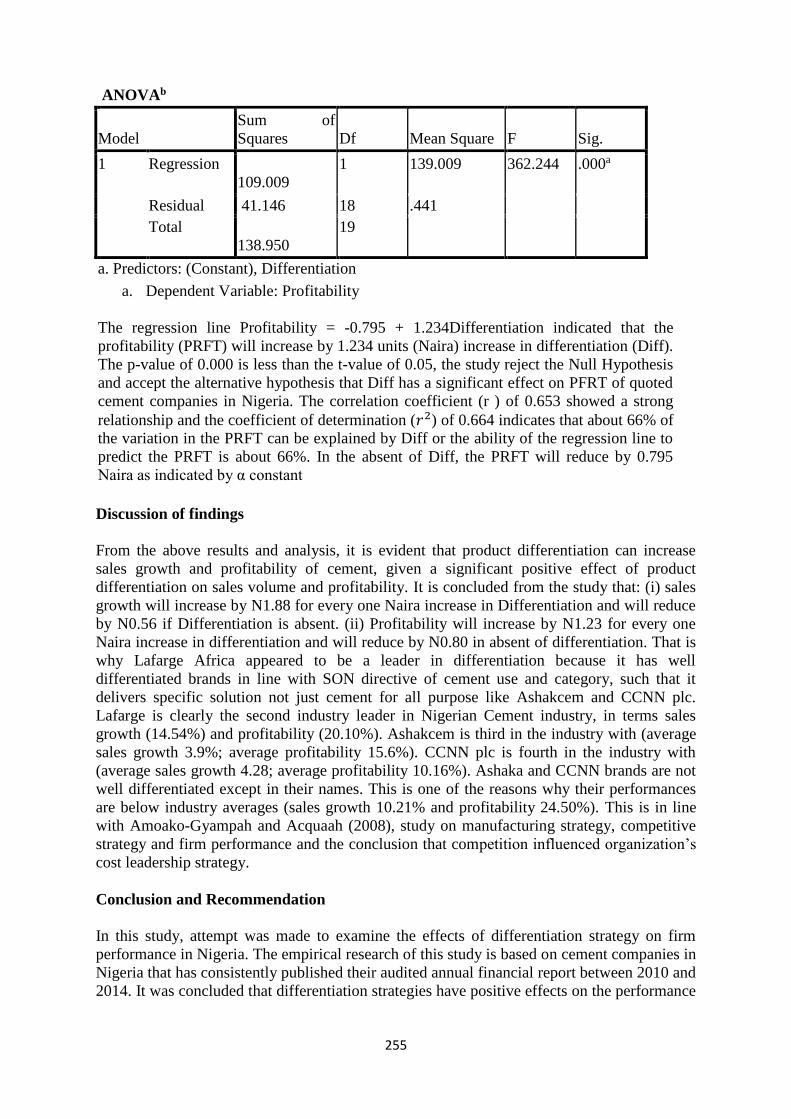
255
ANOVAb
Model
Sum of
Squares Df Mean Square F Sig.
1 Regression
109.009
1 139.009 362.244 .000a
Residual 41.146 18 .441
Total
138.950
19
a. Predictors: (Constant), Differentiation
a. Dependent Variable: Profitability
The regression line Profitability = -0.795 + 1.234Differentiation indicated that the
profitability (PRFT) will increase by 1.234 units (Naira) increase in differentiation (Diff).
The p-value of 0.000 is less than the t-value of 0.05, the study reject the Null Hypothesis
and accept the alternative hypothesis that Diff has a significant effect on PFRT of quoted
cement companies in Nigeria. The correlation coefficient (r ) of 0.653 showed a strong
relationship and the coefficient of determination (𝑟2) of 0.664 indicates that about 66% of
the variation in the PRFT can be explained by Diff or the ability of the regression line to
predict the PRFT is about 66%. In the absent of Diff, the PRFT will reduce by 0.795
Naira as indicated by α constant
Discussion of findings
From the above results and analysis, it is evident that product differentiation can increase
sales growth and profitability of cement, given a significant positive effect of product
differentiation on sales volume and profitability. It is concluded from the study that: (i) sales
growth will increase by N1.88 for every one Naira increase in Differentiation and will reduce
by N0.56 if Differentiation is absent. (ii) Profitability will increase by N1.23 for every one
Naira increase in differentiation and will reduce by N0.80 in absent of differentiation. That is
why Lafarge Africa appeared to be a leader in differentiation because it has well
differentiated brands in line with SON directive of cement use and category, such that it
delivers specific solution not just cement for all purpose like Ashakcem and CCNN plc.
Lafarge is clearly the second industry leader in Nigerian Cement industry, in terms sales
growth (14.54%) and profitability (20.10%). Ashakcem is third in the industry with (average
sales growth 3.9%; average profitability 15.6%). CCNN plc is fourth in the industry with
(average sales growth 4.28; average profitability 10.16%). Ashaka and CCNN brands are not
well differentiated except in their names. This is one of the reasons why their performances
are below industry averages (sales growth 10.21% and profitability 24.50%). This is in line
with Amoako-Gyampah and Acquaah (2008), study on manufacturing strategy, competitive
strategy and firm performance and the conclusion that competition influenced organization’s
cost leadership strategy.
Conclusion and Recommendation
In this study, attempt was made to examine the effects of differentiation strategy on firm
performance in Nigeria. The empirical research of this study is based on cement companies in
Nigeria that has consistently published their audited annual financial report between 2010 and
2014. It was concluded that differentiation strategies have positive effects on the performance
256
of quoted cement manufacturing companies in Nigeria and has the highest effect on both
sales growth and profitability. The following recommendations are made.
Cement companies like CCNN and Ashakcem that have not done serious
differentiation need to adopt it now because this study has shown that differentiation
is one of the strategic tools the industry leaders like DCP and Lafarge are using to
push up their sales growth and profitability.
They should take advantage of the opportunity provided by SON to differentiate their
products out of competition by producing to specific usage and quality in order to
improve their performance (sales growth and profitability) relative to that of the
industry leaders. Because when firms are faced by competition in an industry, they
maintain their competitive edge by largely adopting differentiation strategies (Ogutu
& Nyatichi, 2012). Meanwhile, Nthigah, Iravo and Kihoro (2014) warned that in most
industries, corporations are mutually dependent and any competitive move by one
firm can be expected to have a noticeable effect on its competitors.
It is also recommended that cement producers should produce cement for specific
purpose in terms of quality and other attributes like, cement for high rising building
should different from those for block making etc as directed by SON.
Reference
1. Acquaah, M. and Yasai-Ardekani, M, (2008), Does the implementation of a combination
strategy yield incremental performance benefits? A new perspective from a transition
economy in Sub-Saharan Africa. Journal of Business Research, vol.6, no. 2, pp.346-354.
2. Aliqah, A. k, (2012), Differentiation and organization performance. Empirical evidence
from Jordanian companies. Journal of Economics, vol.3, no.1, Pp.7-11.
3. Allen, R. and Helms, M, (2006), Liking strategic practices and organizational
performance to Porter’s Generic strategies. Journal of Business Process Management,
vol.12, no.4, pp.433-454.
4. Arthur, A, Gamble, J, John, E, Thompson, A. J. and Strickland, W, (2010), Crafting and
executing strategy : The Quest for Competitive Advantage Concepts and Cases, 17/ E:
Boston : MCGraw –Hill/Irwin.
5. Atikiya, R, Mukulu, E, Kihoro J. and Waiganjo, E, (2015), Effects of cost leadership
strategy on the performance of manufacturing firms in Kenya. Journal of Management,
vol.2, no.8, pp.134-143
6. Baker, W. E. and Sinkul, J. M, (2005), Market orientation and the new product paradox.
Journal of Product Innovation Management, vol. 22, no.6 pp. 483-502.
7. Barney, J .B, (2007), Gaining and sustaining competitive advantage (3rd ed.), Upper
Saddle River, NJ: Pearson Education.
8. Barney, J, (1991), Firm resources and sustained competitive advantage. Journal of
Management, vol. 17, no.1, pp. 99-120.
9. Boschman, G, (2006). Strategic responses of multinational organizations concerning
human rights dilemmas. (Masters Thesis), Tilburg University.
10. Chritopher, M, (2011), Logistics and supply chain management 4th ed. Great Britian,
Pearson Education.
11. Cousins, P.D, (2005), Alignment of appropriate Firm and supply strategies for
competitive advantage. International Journal of Operations and Production Management,
vol.25, no.5, pp. 403-428.

257
12. Da Silva, D, Gervasoni, C.V. and Rossi, B.G,(2013), Analysis of differentiation and
Profitability of business (auto parts industry in Brazil). Brazilian Journal of Marketing,
Opinion and Median Research, vol. 13, pp.33-45.
13. Dirisu, I.J, Ibidunni, O.S. and Iyiola, O, (2013), Product differentiation: A tool of
competitive advantage and optimal organizational performance ( A study of Unilever
Nig. Plc), European Scientific Journal, vol.9, no.34 ,pp.258-28.
14. Ebers, M, (1997), The Formation of Inter-Organizational Networks, Oxford University
Press, Oxford.
15. Evans, C, (2003), Managing for Knowledge: HR’s Strategic Role, Butterworth-
Heinemann, Amsterdam.
16. Franco-Santos, M, Kennerley, M, Michelli, P, Martinez, V, Mason, S, Marr, B, Gray, D.
and Neely, A, (2007). Towards a Definition of a Business Performance Measurement
System”, International Journal of Operations & Production Management, vol. 27,no.8, pp.
784-801.
17. Griffin, M, (2003), Organizational performance model. Available at: http://griffin-
oc.GOC.
18. Grant, R.M, (2005), Contemporary strategy analysis,5th ed, New York Blackwell
publishing.
19. Hahn, W and Powers, T.L, (2010), Strategic plan, quality, implementation, capability, and
firm performance. Academy of Strategic Management Journal,vol. 9, no.1,pp. 63-81.
20. Hambrick, D.C, (1983), Some tests of the effectiveness and functional attributes of Miles
and Snow’s strategic types. Academy of Management Journal vol.26, pp.5–26.
21. Hambrick, D.C, (1983), High profit strategies in mature capital goods industries. A
contingency approach. Academy of management Journal vol.26, pp.687-707.
22. Han, J. K., Kim, N, and Srivastava, R. K, (1998), Market orientation and organizational
performance: Is innovation a missing link? The Journal of Marketing, vol.62, no.4, pp.
30-45.
23. Ireland ,R, Hokisson, R ,and Hitt, M, (20011), The Management of strategy. International
edition, 9th ed, South-West Cengage Learnng.
24. Kotha, S. and Vadlami, B.L, (1995, Assessing generic strategies: an empirical
investigation of competing typologies in discrete manufacturing industries. Strategic
Management Journal, vol.16, no.1, pp. 75-83.
25. Kumar, V, Jones, E, Venkatesan, R, and Leone, R. P, (2011,. Is Market orientation a
source of sustainable competitive advantage or simply the cost of competing? Journal of
Marketing, vol.75 ,no1 pp., 16-30.
26. Liao, S. H., Chang, W. J., Wu, C. C., & Katrichis, J. M. (2011). A survey of market
orientation research (1995-2008). Industrial Marketing Management, 40(2011), 301-310.
27. McNamara, G, Aime, F. and Vaaler, M, (2005), Is Performance Driven by Industry or
Firm-specific Factors? A Response to Hawawini, Subramaniam and Verdin. Strategic
Management Journal, vol.26, pp.1075-1081.
28. Miles, R, and C. Snow. 1978. Organizational strategy, structure, and process. New York:
McGraw-Hill.
29. Minarik,M, (2007), Cost leadership and differentiation: An investigation of the
fundamental trade-off between Porter’s cost leadership and differentiation strategies. Msc
Thesis in International business, Institute of international business, Stokholm school of
economics
30. Mintzberg, H, (1988), Patterns in strategy formation. Journal of Management Science,
vol. 24 No.9, pp.934-948.
31. Narver, J. C. and Slater, S. F, (1990), The effect of a market orientation on business
profitability. The Journal of Marketing, vol.45, no.4, pp. 20-35.
258
32. Nthigah, P.M, Iravo, M. and Kihoro, J, (2014), Influence of competition intensity on
strategic response of Multinational Corporation. A study of Multinational Corporation in
Kenya. A Global Business and Economics Research Journal, Vol.3, no 5, pp.1-14.
33. O'Cass, A. and Ngo, L. V, (2007), Balancing external adaptation and internal
effectiveness: Achieving better brand performance. Journal of Business Research, vol. 60,
no.1, pp. 11-20.
34. Panigyrakis, G. G. and Theodoridis, P. K, (2007), Market orientation and performance:
An empirical investigation in the retail industry in Greece. Journal of Retailing and
Consumer Services, vol.14, no.2, pp.137-149.
35. Porter, M.E, (1996). What is Strategy? Harvard Business Review, vol. 74, no.6, pp. 61-
78.
36. Prahalad, C, K. and Hamel, G, (1990), The core competence of the corporation. Harvard
Business Review, vol. 68, no.3, pp.79-91.
37. Prahalad, C.K. and Hamel, G,(1994), Strategy as a field of study: Why search for a new
paradigm? Strategic Management Journal, vol.15, pp. 5-16.
38. Ramayah, T, Samat, N. and Lo, M. C, (2011), Market orientation, service quality and
organizational performance in service organizations in Malaysia. Asia-Pacific Journal of
Business Administration, vol.3, no.1, pp. 8-27.
39. Rauch, A, Johan, W, Lumpkin, G.T. and Michael, F, (2009, Entrepreneurial orientation
and business performance: An assessment of past research and suggestions for the future.
Journal of Entrepreneurship theory and practice, vol.33, no.3, pp.761-787.
40. Santos-Vijande, M. L, Sanzo-Perez, M. J, Alvarez-Gonzalez, L. I. and Vazquez-Casielles,
R, (2005), Organizational learning and market orientation: Interface and effects on
performance. Industrial Marketing Management, vol.34, no.3, pp.187-202.
41. Short, J.C, Ketchen, D.J. Jr. and Palmer, T.B,(2002), The Role of Sampling in Strategic
Management Research on Performance: A Two-study Analysis. Journal of Management,
vol.28, no.3, pp.363-385.
42. Slater, S. F. and Narver, J. C,(1994), Does competitive environment moderate the market
orientation-performance relationship? The Journal of Marketing, vol.58, no.1, pp. 46-55.
43. Spanos, Y, Zaralis, G. and Lioukas, S, (2004), Strategy and industry effects on
Profitability: Evidence from Greece. Strategic Management Journal, vol.25, no.2, pp.139-
165.
44. Stoelhorst, J. W. and Van- Raaij, E. M, (2004), On explaining performance differentials:
Marketing and the managerial theory of the firm. Journal of Business Research,vol. 57,
no.5, pp.462-477.
45. Tanwar ,R, (2013), Porter’s generi ccompetitive strategies an overview. Journal of
Business and Management. vol.15, no.1,pp. 11-17
46. Tsiotsou, R. H.and Vlachopoulou, M, (2011), Understanding the effects of market
orientation and e-marketing on service performance. Marketing Intelligence and
Planning, vol.29, no.2, pp.141-155.
47. Venkatraman, N. and Ramanujam, V, (1986), Measurement of business performance in
strategy research: A comparison of approaches Massachusetts Institute of Technology.
Academy of Management Review, vol.11no.4, pp.801-814.
48. Walter ,K, (2010), The lords of strategy. Harvard Busisness Press.
49. Wang, H.L, (200)4, A framework to support and understand strategic decision-making in
business to business electronic commerce, in The International Workshop on Business
and Information (BAI2004), Taipei.
50. Ward, P.T, Duray, R, (2000), Manufacturing strategy in context: environment,
competitive strategy and manufacturing strategy. Journal of Operations Management,
vol.18, no.3 pp.123–138.

259
51. Wheelwright, S. C, (1984), Restoring our competitive edge: Competing through
manufacturing. New York: John Wiley & Sons Inc.
52. Wright, P, Kroll, M, Kedia, B.and Pringle, C, (1990), Strategic profiles, market share and
business performance. Industrial management journal vol. 1, no.1, pp.23-28.
53. Zack, M,(1999), Developing a knowledge strategy. California Management Review, vol.
41, no. 3, pp.125-145.
54. Zhou, K. Z, Brown, J. R. and Dev, C. S, (2009), Market orientation, competitive
advantage and performance: A demand-based perspective. Journal of Business Research,
vol.62, no.11, pp.1063-1070.
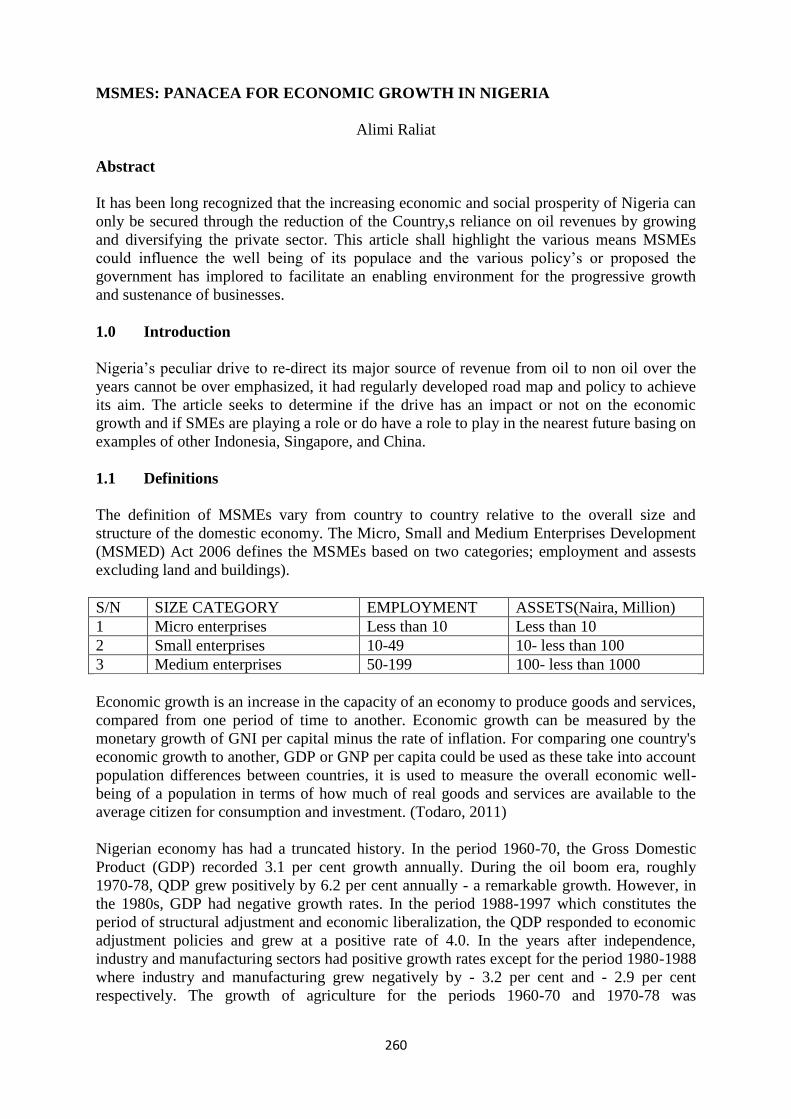
260
MSMES: PANACEA FOR ECONOMIC GROWTH IN NIGERIA
Alimi Raliat
Abstract
It has been long recognized that the increasing economic and social prosperity of Nigeria can
only be secured through the reduction of the Country,s reliance on oil revenues by growing
and diversifying the private sector. This article shall highlight the various means MSMEs
could influence the well being of its populace and the various policy’s or proposed the
government has implored to facilitate an enabling environment for the progressive growth
and sustenance of businesses.
1.0 Introduction
Nigeria’s peculiar drive to re-direct its major source of revenue from oil to non oil over the
years cannot be over emphasized, it had regularly developed road map and policy to achieve
its aim. The article seeks to determine if the drive has an impact or not on the economic
growth and if SMEs are playing a role or do have a role to play in the nearest future basing on
examples of other Indonesia, Singapore, and China.
1.1 Definitions
The definition of MSMEs vary from country to country relative to the overall size and
structure of the domestic economy. The Micro, Small and Medium Enterprises Development
(MSMED) Act 2006 defines the MSMEs based on two categories; employment and assests
excluding land and buildings).
S/N SIZE CATEGORY EMPLOYMENT ASSETS(Naira, Million)
1 Micro enterprises Less than 10 Less than 10
2 Small enterprises 10-49 10- less than 100
3 Medium enterprises 50-199 100- less than 1000
Economic growth is an increase in the capacity of an economy to produce goods and services,
compared from one period of time to another. Economic growth can be measured by the
monetary growth of GNI per capital minus the rate of inflation. For comparing one country's
economic growth to another, GDP or GNP per capita could be used as these take into account
population differences between countries, it is used to measure the overall economic well-
being of a population in terms of how much of real goods and services are available to the
average citizen for consumption and investment. (Todaro, 2011)
Nigerian economy has had a truncated history. In the period 1960-70, the Gross Domestic
Product (GDP) recorded 3.1 per cent growth annually. During the oil boom era, roughly
1970-78, QDP grew positively by 6.2 per cent annually - a remarkable growth. However, in
the 1980s, GDP had negative growth rates. In the period 1988-1997 which constitutes the
period of structural adjustment and economic liberalization, the QDP responded to economic
adjustment policies and grew at a positive rate of 4.0. In the years after independence,
industry and manufacturing sectors had positive growth rates except for the period 1980-1988
where industry and manufacturing grew negatively by - 3.2 per cent and - 2.9 per cent
respectively. The growth of agriculture for the periods 1960-70 and 1970-78 was

261
unsatisfactory. In the early 1960s, the agricultural sector suffered from low commodity prices
while the oil boom contributed to the negative growth of agriculture in the 1970s. The boom
in the oil sector lured labour away from the rural sector to urban centers.
Unemployment rates averaged almost 5 per cent for the period 1976-1998. However, the
statistics especially on unemployment, must be interpreted with caution. Most job seekers do
not use the labour exchanges, apart from the inherent distortions in the country's labour
market. Based on some basic indicators, it appears that the economy performed well during
the years immediately after independence and into the oil boom years. However, in the 1980s
the economy was in a recession. The on-going economic reform programme is an attempt to
put the economy on a recovery path with minimal inflation. The analysis that follows tries to
discuss the developments in the economy. (Umoh, 2016).
Over the years Government has enunciated a large number of national policies addressing
various sectors/areas of national development, the significance of micro, small and medium
enterprises (MSMEs) for the growth, productivity and competitiveness of the economies of
developing countries is universally recognized. Not only do they provide employment and
income for the bulk of the population, as well as the primary source of new jobs, they have
been acknowledged as critical breeding and nurturing grounds for domestic entrepreneurial
capacities, technical skills, technological innovativeness and managerial competencies for
private sector development. (Federal Republic of Nigeria, 2015)
Policy framework to support SMEs are as follows
Access to finance
Access to industrial enabling environment
Access to business development services
Access to ICT and innovative capable manpower
Entrepreneurship is essential for the sound and sustained economic development of a country
therefore entrepreneurship development is essential too since entrepreneurs contribute to the
national income. Entrepreneurs create upward social mobility, change, development and new
businesses. It is my opinion (and many others) therefor that these ‘national treasures’ must be
protected, promoted, supported and encouraged. As stated earlier, Nigeria is considered the
largest economy in Africa, until recently, this was not the case, but the Nigerian GDP now
includes previously uncounted industries like telecoms, information technology, music,
online sales, airlines and film production. Industries that were single handedly created,
nurtured and sustained by entrepreneurs without government support.
1.2 History of Nigeria Economic Development
On the economic development front, all the economic development policies are anchored on
the private sector as the engine of growth for wealth creation, employment generation and
poverty reduction. While the government is the enabler, facilitator and regulator, the private
sector is the direct investor and manager of business. Non-farm micro, small and medium
enterprises account for over 25 per cent of total employment and 20 percent of GDP. By
global standards large enterprises are few in Nigeria yet they account for a disproportionately
large share of the GDP. Attributes of the SMEs makes it imperative for economic planners
and other relevant policy makers to pay attention to the sector with a view to improving their
performance towards the realization of the transformation of the country’s economy.

262
This is more important now that there is need to strengthen the local currency through
production of goods and services locally for local consumption and export.
The literature review would be concerned with literatures linking up the success and failures
of SMEs impact on economic growth of Nations that have moved from developing Nations to
developed Nations in the second and third phase of development in international economics.
The data would basically use descriptive statistics and would be analyzed to establish a
relationship for SMEs and economic growth and prefer recommendation as it deems fit.
2.0 Literature Review
History of economic development tells us that promotion of infant industries is one of the
major drivers behind the success of industrialization in Europe (Rostow, 1960). To address
the various problems above, the Federal and State governments decided to try an alternative
industrialization strategy – development of Small-Scale Businesses (SSBs), especially in the
early 1970s.
Focus of SSBs is predicated on the belief that if given adequate encouragement SSBs can
perform their expected roles towards the development of the Nigerian economy. Such roles
are contributions of SSBs to a diversified productive base as well as their catalytic macro
objectives; such as employment generation, diffusion of economic power and promotion of
indigenous technology. The foregoing has been the genesis of Micro, Small and medium
Enterprises (MSMEs) in Nigeria, playing a vital role through several pathways that go
beyond job creation. They are growth supporting sectors, they do not only contribute
significantly to improve living standards, but also bring substantial local capital formation
and are responsible for driving innovation and competition in developing economies.
(Nigerian Institute of Social and Economic Research)
The general perspective is that MSMEs are seen as accelerating the attainment of broad
socio-economic objectives, including poverty reduction, employment generation, wealth
creation, among others.
Improvement in productivity and size of micro enterprise is also cited as a crucial phase in
the successful implementation of export led growth (ELG) strategy employed by East Asian
Tiger countries which resulted in a remarkable increase in economic growth in those
countries (Singh, 2003).
The Micro, Small and Medium Enterprises (MSMEs) have been known in both developed
and developing nations, to be incontrovertible contributors to employment generation, wealth
creation and poverty alleviation. As in many developing countries, MSMEs in Nigeria have
not achieved their full potential as a result of some critical inhibiting factors. (Federal
Republic of Nigeria, 2015).
Small and Medium sized businesses have traditionally played a significant role in the
economic growth of developed and developing nations alike. Researchers have continuously
emphasized the importance of the promotion of SMEs in order to provide primary and
secondary sources of income and alleviate high levels of poverty particularly in developing
regions. (Tambunan, 02/2008; Cunningham, 2010; Tambunan, 02/2008). It is widely agreed
that SMEs have a potentially crucial role to play in contributing to the GDP of nations in part
due to their huge growth potential (Upadhyah, 2009).
A number of studies exist that conclude that the formation and growth of smes in an economy
will have a positive impact on the GDP (Beck et al, 2005; Mocnik, 2010) and there are a
263
number of reasons as to why this is. First of all in many developing countries, SMEs play a
key role in terms of making a significant contribution to the GDP through export
development (Tambunan, 2009; Ogunsiji and Kayode, 2010). In addition to the development
and growth of import and export, SMEs also have the potential to contribute to a nation’s
GDP by providing government with additional revenue streams by expanding a country tax
base (Agyapong, 2010).
The importance of SMEs has been echoed outside the realms of academia where analysts and
funding bodies continue to advocate the development of the private sector using SMEs to
policy makers in an effort to address both social and economic deprivation (Agyapong,
2010).
As highlighted by Islam et al (2011) for many developing nations in particular, SMEs
account for the majority of employment in unskilled labour intensive sectors. Aside from the
provision of employment, SMEs also facilitate an environment where the unskilled workforce
can develop their skills to the advancement of society and the economy at large (Hassan and
Olaniran, 2011). In developed countries such as the USA, where big corporations are
dominant, SMEs still play enormous role in the country’s economy (Asmelah (2002).
Chinese and foreign experts estimate that MSMEs are now responsible for about 60% of
China’s industrial output and employ about 75% of the workforce in China’s cities and towns
(Schell, 2006). These MSMEs create jobs for workers who have been laid off from state-
owned enterprises due to the steady transition from communism to a market based economy.
More than 90 per cent of the industries in Indonesia, Philippines, Thailand, Hong Kong,
Japan, Korea, India and Sri Lanka are small entreprises (Fadahunsi and Daodu, 2007).
Oyeyinka-Oyelaran: approximately 96% of Nigerian businesses are SMEs and they represent
about 90% of the Manufacturing/Industrial sector in terms of numbers of enterprises. In
developed countries such as the USA, where big corporations are dominant, SMEs still play
enormous role in the country’s economy (Asmelah (2002).
Since the article seeks to understand the medium through which SMEs promotes growth, it
would be required to state that though we have a general consensus that SMEs have an
overall positive impact on the economic development and growth, a number of studies have
concluded differently.
Bhatti et al 2010 analysed business development in the Jacobabad district of Sindh and found
that despite the overwhelming number of SMEs, in relation to larger enterprises, they
employed approximately only half of the total employed in the city. This should perhaps not
be a surprising as the very nature of SMEs can at time be at conflict with the objectives they
are intended to meet (Catel Branco, 2003).
The problem of SMEs identification is more acute in developing countries because apart from
the fact that small and medium scale businesses are difficult to count, they are also difficult to
measure individually, hence statistics on the number, size, geographically distribution and
activities of enterprises and the SME sub sector are partial and highly unreliable. (USAID,
2004).
3.0 Methodology

264
This article is going to make use of descriptive statistics, which are used to describe the basic
features of the data obtained for the study, the statistics are obtained from previous studies
carried out in selected countries and research institutes in Nigeria., we will also make use of
graphics analysis which forms the basis of virtually every quantitative analysis of data.
4.0 Data and Data Analysis
TABLE 1
TABLE 2
Source is from NISER Study
TABLE 3
S/N Country Number of
MSMES
GDP
Growth
Unemployme
nt Levels (%)
Income Growth
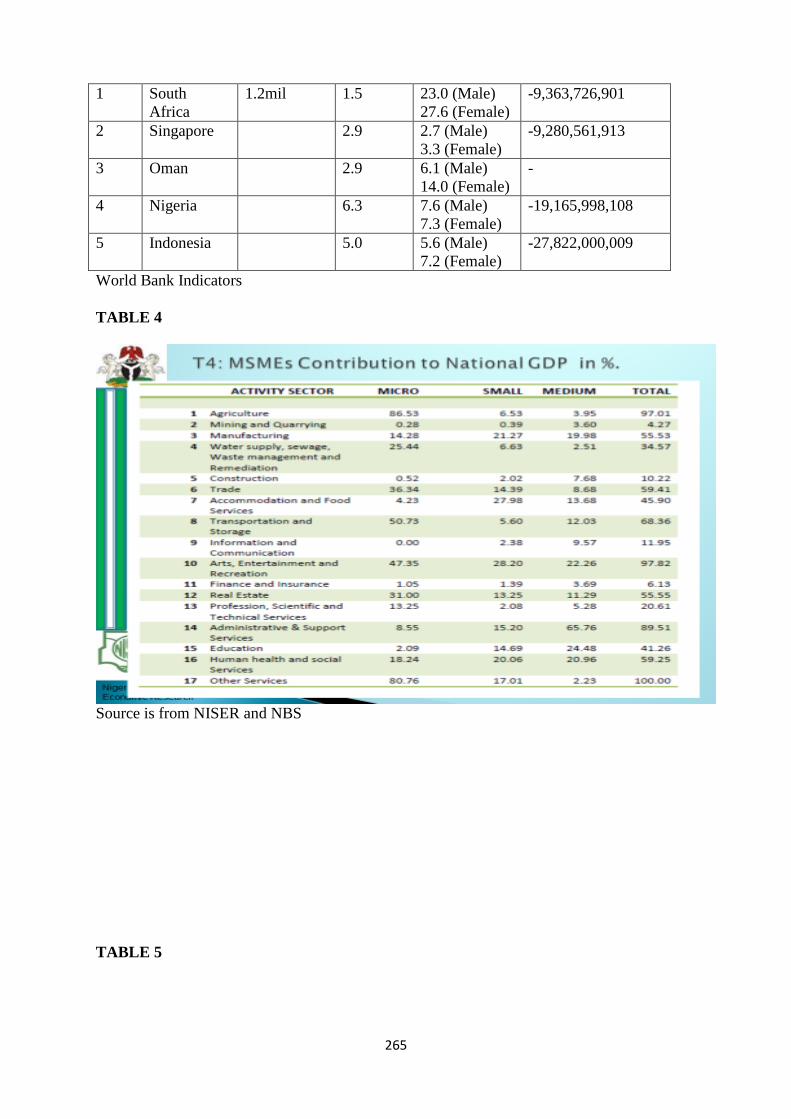
265
1 South
Africa
1.2mil 1.5 23.0 (Male)
27.6 (Female)
-9,363,726,901
2 Singapore 2.9 2.7 (Male)
3.3 (Female)
-9,280,561,913
3 Oman 2.9 6.1 (Male)
14.0 (Female)
-
4 Nigeria 6.3 7.6 (Male)
7.3 (Female)
-19,165,998,108
5 Indonesia 5.0 5.6 (Male)
7.2 (Female)
-27,822,000,009
World Bank Indicators
TABLE 4
Source is from NISER and NBS
TABLE 5
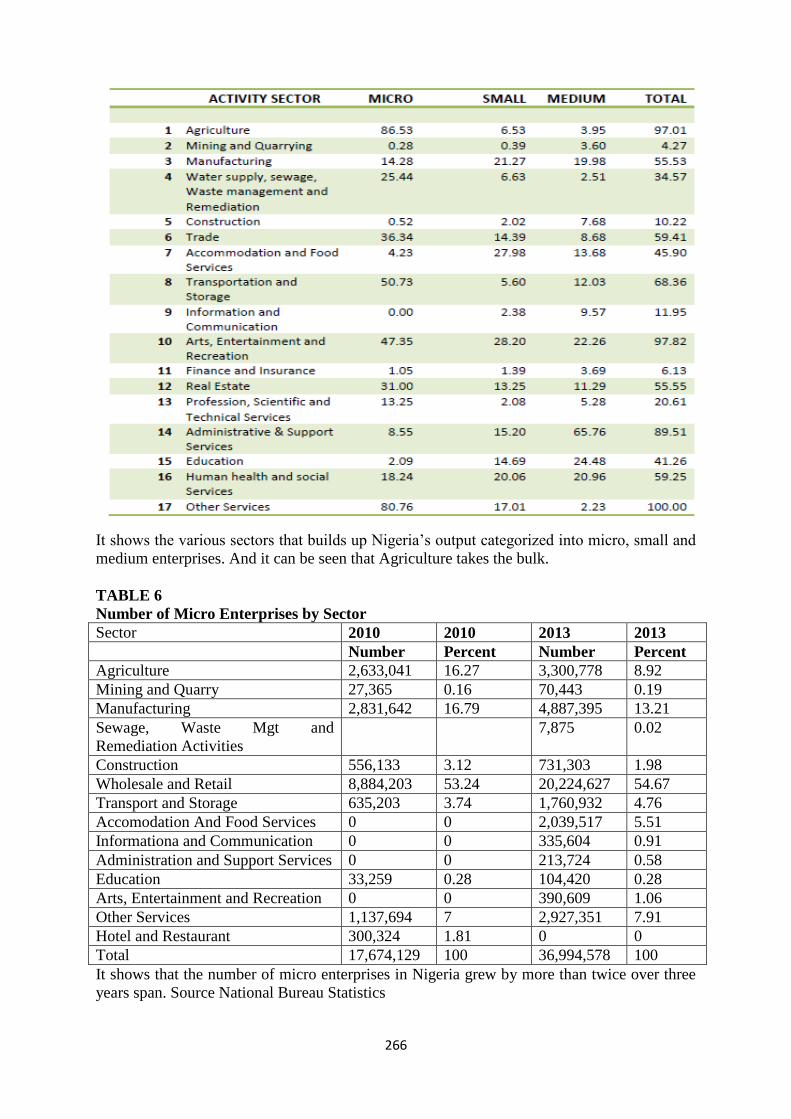
266
It shows the various sectors that builds up Nigeria’s output categorized into micro, small and
medium enterprises. And it can be seen that Agriculture takes the bulk.
TABLE 6
Number of Micro Enterprises by Sector
Sector 2010 2010 2013 2013
Number Percent Number Percent
Agriculture 2,633,041 16.27 3,300,778 8.92
Mining and Quarry 27,365 0.16 70,443 0.19
Manufacturing 2,831,642 16.79 4,887,395 13.21
Sewage, Waste Mgt and
Remediation Activities
7,875 0.02
Construction 556,133 3.12 731,303 1.98
Wholesale and Retail 8,884,203 53.24 20,224,627 54.67
Transport and Storage 635,203 3.74 1,760,932 4.76
Accomodation And Food Services 0 0 2,039,517 5.51
Informationa and Communication 0 0 335,604 0.91
Administration and Support Services 0 0 213,724 0.58
Education 33,259 0.28 104,420 0.28
Arts, Entertainment and Recreation 0 0 390,609 1.06
Other Services 1,137,694 7 2,927,351 7.91
Hotel and Restaurant 300,324 1.81 0 0
Total 17,674,129 100 36,994,578 100
It shows that the number of micro enterprises in Nigeria grew by more than twice over three
years span. Source National Bureau Statistics
267
TABLE 7
Contributions of SMEs to Economic Development (Developed Countries)
Country Economic Output Employment
USA 65% 80%
Japan 45% 80%
Western Europe 45% 55%
Source: Sabah Almogyed (20003)
TABLE 8
Descriptive statistics on SMEs and Economic Growth and Development
Response Number Percentage
Strongly Agreed 84 42
Agreed 67 33.5
Undecided 5 2.5
Disagreed 13 6.5
Strongly Disagreed 31 15.5
Total 200 1000
It shows responses on the relationship between SMEs, economic growth and development.
The coefficient size of the study suggests not only positive significant but has high coefficient
of 0.58, the result has confirmed the economic meaningful relationship between the SMEs
and the Economic Growth.
TABLE 9
Economic growth and SME shares in Taiwan 1961- 2006 (SMEs 1-99 persons) Share (%)
Year No of Firms Employees Production Value Economic Growth Rate (%)
1961 99.57 64.28 - 3.91
1966 99.28 57.30 - 7.78
1971 98.96 52.52 37.04 9.59
1976 98.90 53.00 32.27 5.09
1986 99.00 57.89 36.46 9.56
1991 99.24 63.82 41.23 8.21
1996 99.37 66.75 45.41 6.32
2001 99.38 62.29 36.82 3.50
2006 99.36 69.22 45.09 5.24
The economic growth rate is measured by the average annual change in rate in per capital real
GNP original data is provided by the Taiwan industrial and commercial census and annual
National.
TABLE 10
Sector 2010 2013
Agriculture 317.28 365.28
Mining and Quarry 2.65 3.78
Manufacturing 32.26 40.21
Sewage, Waste Mgt and Remediation Activities
Construction 15.45 22.36
Wholesale and Retail 145.07 193.15
Transport and Storage 20.75 25.29

268
Accomodation and Food Services
Informationa and Communication 35.34 77.72
Administration and Support Services 5.09 5.75
Education 1.58 2.09
Arts, Entertainment and Recreation
Other Services 6.1 8.17
Hotel and Restaurant 3.89 5.55
Total 776.33 950.11
It shows that the agricultural sector contributed most to the economic growth of the nation
and that the total GDP grew by 22.38% from 2010.
As can be inferenced from tables above, 58.35% of the total employment generated by states
were sole businesses, over half of the sole proprietorship had at least a first degree as in
graduates and postgraduates owned 57% of sole businesses. Males were 0.67% higher than
females as in for every three males employed, two females were employed.
5.0 Result
The result of the presented statistics shows that SMEs has a positive impact on the economic
growth of Nigeria, and other countries as observed. The impact is relatively low because of
the slow pace of growth to transform most of the micro, small scales to medium and
conglomerates as observed in other nations.
Nigeria drive to empower and grow the SMEs can be recognized in the various financing
policy it has initiated to date, though facing challenges because of poor database to capture
the real entrepreneurs requiring the funds.
6.0 Conclusion and Recommendation
Attributes of the SMEs makes it imperative for economic planners and other relevant policy
makers to pay attention to the sector with a view to improving their performance towards the
realization of the transformation of the country’s economy. It is imperative to state that SMEs
sector is very critical to the development of the economy. Efforts at improving the sector
cannot be misplaced in view of the present socio-economic situation of the country.
This is more important now that there is need to strengthen the local currency through
production of goods and services locally for local consumption and export. It is highly
recommended to encourage and fund adequately technological institutions to apply science
and tech to generate innovations, improve labour market and skilled workers by overhauling
School Curriculum to generate innovation and skilled workers, that will be capable of
enhancing productivity and performance. Thus there is need to ensure that the labour force
could provide skilled workers for the various SMEs’ firms. Another important policy vista is
financing by creating adequate funding of SMEs’ operations. There is need to ensure that
existing funding opportunities are sustained and improved upon while new windows of
opportunities should be opened. We often say government has more role in creating an
enabling environment for SMEs to grow, this can be achieved by improving Infrastructure,
basically SMEs need strong infrastructural base to perform effectively. There is need to
improve on power situation, road construction and maintenance and water supply among
others Regulatory Framework: SMEDAN, AEA should be strengthened to perform better by
269
adequate support for their activities; effective coordination of activities of relevant regulatory
bodies, contribution of the SMEs sector to the growth of the economy cannot be maximised if
the actors have obscured market orientation.
References
1. Agyapong. (2010).
2. Cunningham. (2010). SMEs as motor of growth: A review of China,s SMEs development
in thirty years (1978- 2008).
3. Federal Republic of Nigeria. (2015). National Policy on Micro, Small and Medium
Enterprises. ABUJA: SMEDAN.
4. Nigerian Institute of Social and Economic Research. (n.d.). Strengthening the Policy
Framework for SMES Development.
5. Rostow. (1960).
6. Singh. (2003).
7. Tambunan, T. (02/2008). SME Development, Economic Growth and Government
Intervention in a Developing Country: the Indonesian Story. Journal of International
Entrepreneurship, 147-167.
8. Todaro, M. (2011). EconomicDevelopment. Pearson.
9. Umoh, A. H. (2016, March 22). An overview of the Nigerian Economic Growth and
Development. Retrieved from Online Nigeria.
10. Upadhyah, P. &. (2009). ERP in Indian SMEs: A post implementation study of the
underlying critical success factors. International Journal of Management Innovation
Systems, 1-10.
11. USAID. (2004).