Embed Size (px)
Citation preview

NSW Innovation and Productivity Council
Business size report
June 2019
A profile of employing businesses in NSW and Australia by size
based on 2015 data from the ABS' BLADE
and Business Characteristics Survey

Foreword from the Chair
Businesses of all sizes have much to contribute to a
thriving and competitive NSW economy, especially new
ideas and innovations, job creation and productivity.
New data linking capabilities can provide insights into the characteristics and economic potential of different sized businesses. An example of where this data is available is through the Australian Bureau of Statistics’ (ABS) Business Longitudinal Analysis Data Environment (BLADE). BLADE is a methodology for linking comprehensive financial and business characteristics data sets, using Australian Business Numbers.
For example, BLADE combines data for active businesses in NSW from the Australian Taxation Office and ABS survey data, including the Business Characteristics Survey and Economic Activity Survey. This report tracks the performance of actively trading businesses in Australia between 2011 and 2015, including in turnover, employment and labour productivity.
This report contains an in-depth exploration of data from BLADE to provide aggregated information at five different business size levels, where possible, in NSW. It investigates the dominant industries of each business size, and drills down into the most prominent subsectors that exist in those size categories. In addition, the report looks at ABS survey data on business size characteristics relevant to innovation and productivity, such as internet presence, use of data analytics, use of key performance indicators, collaboration and so on.
We chose to use the FTE measure of jobs, rather than headcount, to get a more comprehensive picture of the employment contributions of the size categories.
This visual presentation of business data adds to the existing research and provides a different perspective into business size. We hope it stimulates discussions about the economic contribution and innovative potential of all business sizes in NSW.
Mr. Neville Stevens AOChair, NSW Innovation and Productivity Council
02Business size report: A profile of business sizes in NSW and AustraliaNSW Innovation and Productivity Council
This analysis has helped us understand about the diverse businesses in NSW, which come in all shapes and sizes** and each play a role in maintaining a strong economy, driving new innovations and boosting productivity.
This report illustrates the range and distribution of businesses in NSW and the Australian economy. It also looks at key characteristics of each business size from ABS survey data. The report provides a snapshot of business size and looks at trends over the last 5–10 years to build a clearer profile of each business size. This will help us develop a better picture of employing businesses and contribute to a greater understanding of NSW’s economic potential.
The report does not draw any policy conclusions or make any recommendations. Instead, the IPC encourages the business community and other interested stakeholders to use this report to stimulate discussions around the growth and contributions of all business sizes, their innovation activity and productivity in the NSW economy.
NSW businesses range from:
• Non-employing businesses made up primarily of sole traders and partnerships with no employees (not included in this report), to
• Employing businesses.
Executive summary
The NSW Innovation and Productivity Council (IPC) is an independent statutory
body of business and academic leaders that provides advice to the NSW
Government on the best ways to support innovation, productivity and job
creation. As part of our program to better understand the NSW innovation
economy, we’ve been analysing data from the Australian Bureau of Statistics’
(ABS) Business Longitudinal Analysis Data Environment (BLADE)* from 2015,
together with a range of published surveys, commentary and other data.
* BLADE links tax and administrative data from Australian businesses, which helps us to create clearer profiles of each business size in NSW. It includes information on turnover, number of employees, export revenue and profit.
** For this report, we define business size according to the number of full-time equivalent (FTE) staff employed. FTE employment is the total number of hours worked by staff divided by the average number of hours worked in full-time jobs. Note: we do not use the Australian Taxation Office definition, which categorises business size by turnover amount (for example, where a small business has less than $10 million in turnover).
03Business size report: A profile of business sizes in NSW and AustraliaNSW Innovation and Productivity Council

Source: Australian Bureau of Statistics 2018, Project 025 BLADE NSW DIIS_SW, Detailed Microdata, DataLab. Findings based on use of ABS Microdata.
* Australian Bureau of Statistics 2001, 1321.0 – Small Business in Australia, 2001, http://www.abs.gov.au/ausstats/[email protected]/mf/1321.0. ** The ABS often includes non-employing businesses in the micro size in their national business characteristic survey.
NSW business sizes
Non-employing businesses (0 employees)
• In NSW there are 904,000 non-employing businesses
• They include sole proprietors, partnerships and trusts, which vastly outnumber employing business sizes. There were 904,000 non-employing businesses in 2015, compared to 271,277 employing businesses (micro, remaining small businesses, medium and large combined).
• They are more common in some industries, such as financial services, health and construction. They are least common in industries needing large amounts of capital investment and assets, such as manufacturing, utilities and mining.
SMALL BUSINESSES
Micro businesses (between 1–4 FTE employees)**
• In NSW, micro businesses make up 77% of all employing businesses (209,003)
• Micros stand out for their contribution to jobs and their profitability
• Only 40% of micros had an internet presence with which to engage with customers, compared to 65% of remaining small businesses
• Over one-third of micro businesses were innovating
• 36% used predictive analytics in their business.
Other Small businesses (between 5–19 FTE employees)
• In NSW, small businesses make up 17% of all employing businesses (46,716)
• They hire 13% of all employees
• Over 50% of small businesses were innovating
• They have a relatively high internet presence (65%)
• Two-thirds used key performance indicators (KPIs) to measure their business performance.
The ABS definition of small business includes non-employing (0 employees), micro (1–4 employees) and remaining small businesses (5–19 employees).* In this report using 2015 BLADE data, we look at small businesses split into micro and remaining small businesses with a focus on employing businesses because of their contribution to jobs. Similarly, we have split medium businesses into medium(-) and medium(+) to better capture their diverse characteristics. This report also considers large businesses.
04Business size report: A profile of business sizes in NSW and AustraliaNSW Innovation and Productivity Council
Source: Australian Bureau of Statistics 2018, Project 025 BLADE NSW DIIS_SW, Detailed Microdata, DataLab. Findings based on use of ABS Microdata.
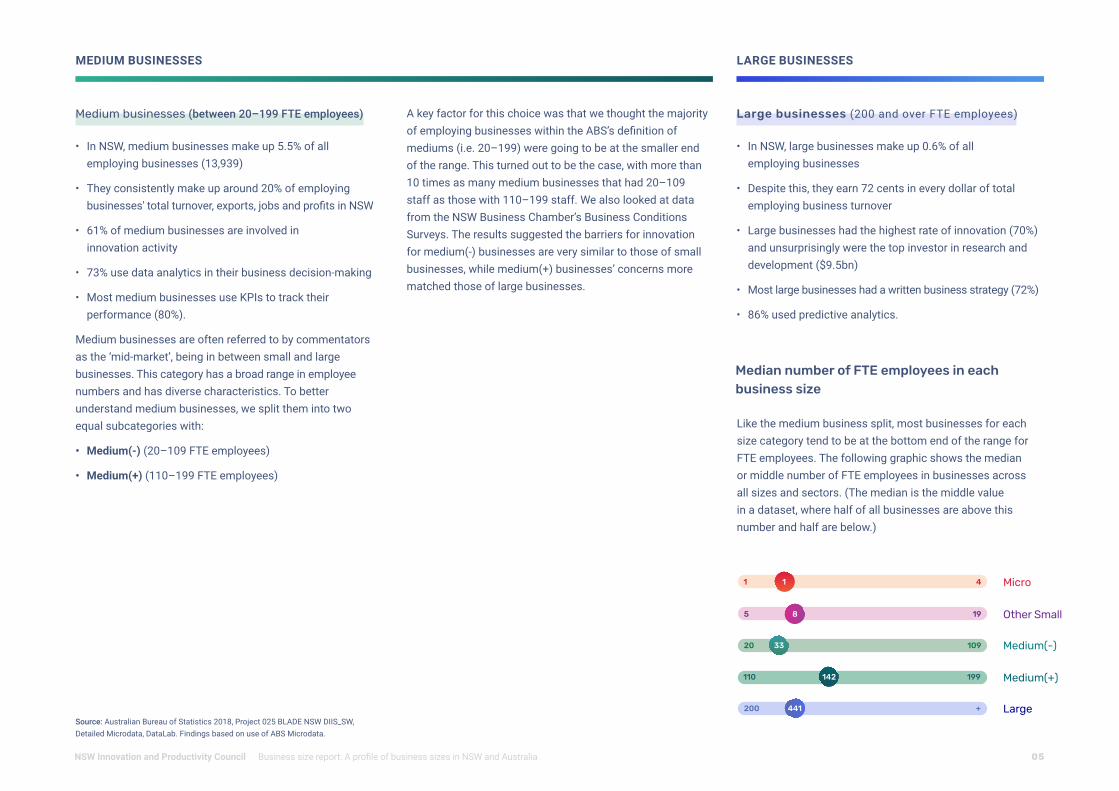
Like the medium business split, most businesses for each size category tend to be at the bottom end of the range for FTE employees. The following graphic shows the median or middle number of FTE employees in businesses across all sizes and sectors. (The median is the middle value in a dataset, where half of all businesses are above this number and half are below.)
Median number of FTE employees in each business size
Micro
Medium(-)
Medium(+)
Other Small
Large
411
5 198
20 10933
110 199142
200 +441
Medium businesses (between 20–199 FTE employees)
• In NSW, medium businesses make up 5.5% of all employing businesses (13,939)
• They consistently make up around 20% of employing businesses' total turnover, exports, jobs and profits in NSW
• 61% of medium businesses are involved in innovation activity
• 73% use data analytics in their business decision-making
• Most medium businesses use KPIs to track their performance (80%).
Medium businesses are often referred to by commentators as the ‘mid-market’, being in between small and large businesses. This category has a broad range in employee numbers and has diverse characteristics. To better understand medium businesses, we split them into two equal subcategories with:
• Medium(-) (20–109 FTE employees)
• Medium(+) (110–199 FTE employees)
A key factor for this choice was that we thought the majority of employing businesses within the ABS’s definition of mediums (i.e. 20–199) were going to be at the smaller end of the range. This turned out to be the case, with more than 10 times as many medium businesses that had 20–109 staff as those with 110–199 staff. We also looked at data from the NSW Business Chamber’s Business Conditions Surveys. The results suggested the barriers for innovation for medium(-) businesses are very similar to those of small businesses, while medium(+) businesses’ concerns more matched those of large businesses.
MEDIUM BUSINESSES LARGE BUSINESSES
Large businesses (200 and over FTE employees)
• In NSW, large businesses make up 0.6% of all employing businesses
• Despite this, they earn 72 cents in every dollar of total employing business turnover
• Large businesses had the highest rate of innovation (70%) and unsurprisingly were the top investor in research and development ($9.5bn)
• Most large businesses had a written business strategy (72%)
• 86% used predictive analytics.
05Business size report: A profile of business sizes in NSW and AustraliaNSW Innovation and Productivity Council
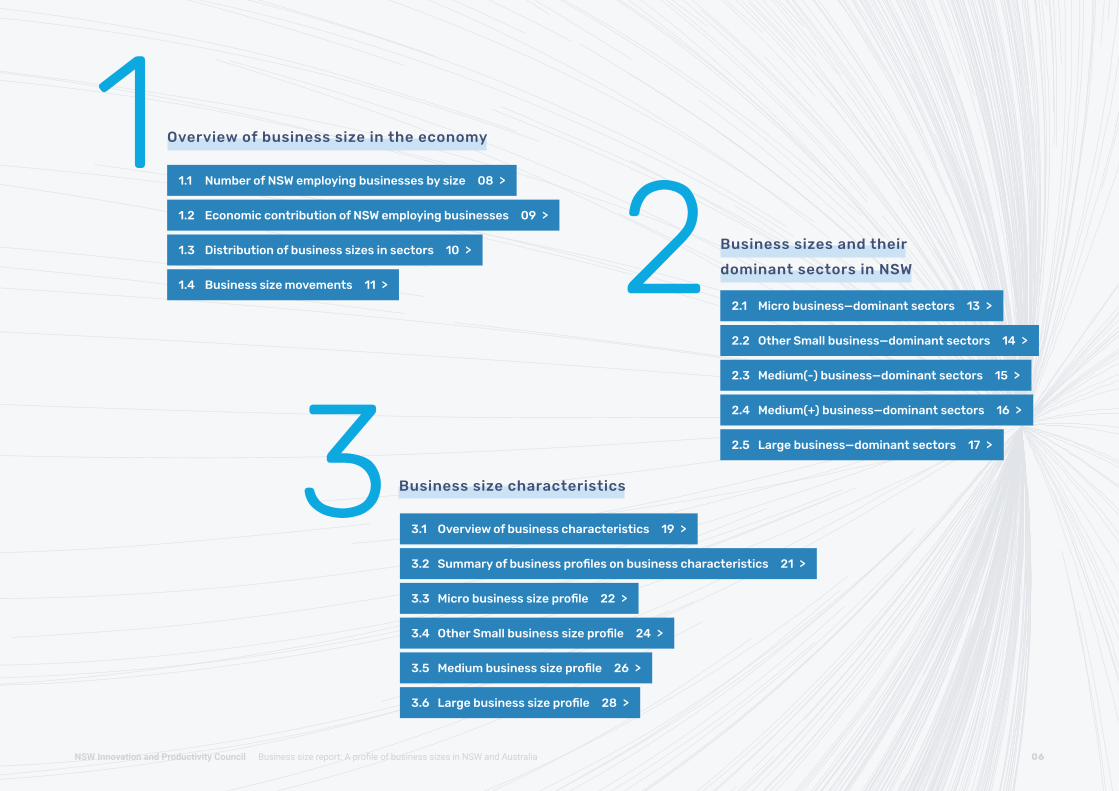
2.2 Other Small business—dominant sectors 14 >
2.3 Medium(-) business—dominant sectors 15 >
2.1 Micro business—dominant sectors 13 >
2.5 Large business—dominant sectors 17 >
2.4 Medium(+) business—dominant sectors 16 >
Overview of business size in the economy12
Business size characteristics31.4 Business size movements 11 >
1.1 Number of NSW employing businesses by size 08 >
1.3 Distribution of business sizes in sectors 10 >
1.2 Economic contribution of NSW employing businesses 09 >
3.1 Overview of business characteristics 19 >
3.3 Microbusinesssizeprofile 22 >
3.5 Mediumbusinesssizeprofile 26 >
3.4 OtherSmallbusinesssizeprofile 24 >
3.6 Largebusinesssizeprofile 28 >
3.2 Summaryofbusinessprofilesonbusinesscharacteristics 21 >
Business sizes and their
dominant sectors in NSW
06Business size report: A profile of business sizes in NSW and AustraliaNSW Innovation and Productivity Council

1Overview of business size in the economy
07Business size report: A profile of business sizes in NSW and AustraliaNSW Innovation and Productivity Council 07

• 10 years old* • 1 employee**
• 11 years old*
• 8 employees**
• 14 years old*
• 33 employees**
• 17 years old*
• 142 employees**
• 22 years old* • 441 employees**
Total employing businesses in the economy
Micro 1–4 FTE employees
209,003
Medium(-) 20–109 FTE employees
12,809
271,277
Other Small5–19 FTE employees
46,716
Medium(+) 110–199 FTE employees
1,130
Large200+ FTE employees
1,619
Micro businesses (1–4 FTE employees)
Micro businesses are run independently by owners who manage operations, make key decisions and provide capital.1 The majority of new businesses are small or micro due to the relative ease and fewer resources needed in setting them up compared to larger businesses. Their median age is 10 years old, and most micro businesses only have one employee.
Other Small businesses (5–19 FTE employees)
Other small businesses tend to have similar management structures to micros. Their median age is slightly older than micros at 11 years, and the median number of employees is eight people.
Medium(-) businesses (20–109 FTE employees)
This category of medium businesses has a median age of 14 years, and the median number of employees is 33 people (more than three times those of small).
Medium(+) businesses (110–199 FTE employees)
This category of medium has a much higher median of 142 employees, and has a median age of 17 years. To grow upwards, medium businesses may need to invest in research and development to build valuable knowledge, innovations and infrastructure. However, only 1% of medium businesses grow into large companies each year.
Large businesses (200+ FTE employees)
Large businesses tend to dominate industries with high barriers to entry or high capital density such as mining, electricity, gas, water and waste services, and information media and telecommunications. Larger businesses play an important role in the economy, given their competitive advantages through economies of scale (when their production is extremely efficient and cost-effective, for example in manufacturing).
1.1 Number of NSW employing businesses by size
* Median age of businesses for the size category ** Median number of full-time employees for the size category
Source: Australian Bureau of Statistics 2018, Project 025 BLADE NSW DIIS_SW, 2015, Detailed Microdata, DataLab. Findings based on the use of ABS Microdata.
SMA
LL B
USI
NES
SES
MED
IUM
BU
SIN
ESSE
SLA
RGE
BU
SIN
ESSE
S
08Business size report: A profile of business sizes in NSW and AustraliaNSW Innovation and Productivity Council
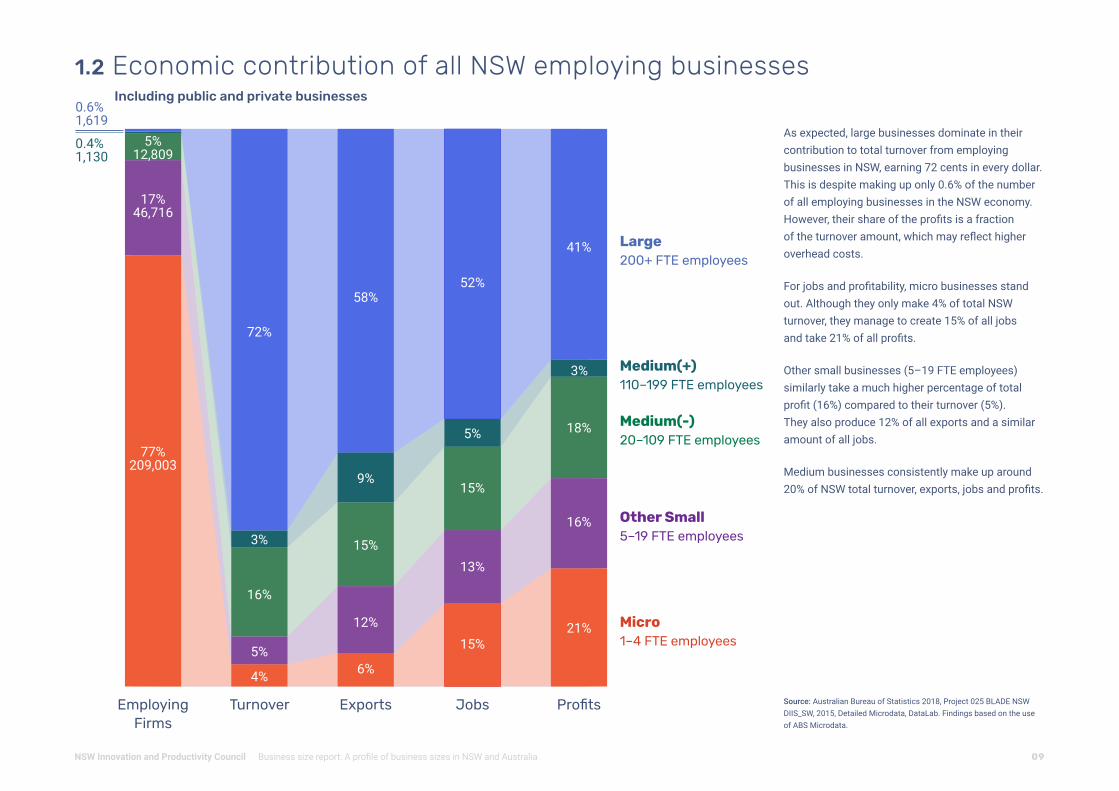
As expected, large businesses dominate in their contribution to total turnover from employing businesses in NSW, earning 72 cents in every dollar. This is despite making up only 0.6% of the number of all employing businesses in the NSW economy. However, their share of the profits is a fraction of the turnover amount, which may reflect higher overhead costs.
For jobs and profitability, micro businesses stand out. Although they only make 4% of total NSW turnover, they manage to create 15% of all jobs and take 21% of all profits.
Other small businesses (5–19 FTE employees) similarly take a much higher percentage of total profit (16%) compared to their turnover (5%). They also produce 12% of all exports and a similar amount of all jobs.
Medium businesses consistently make up around 20% of NSW total turnover, exports, jobs and profits.
Source: Australian Bureau of Statistics 2018, Project 025 BLADE NSW DIIS_SW, 2015, Detailed Microdata, DataLab. Findings based on the use of ABS Microdata.
0.6% 1,619
0.4%1,130
72%
3%
16%
5%
4%
58%
9%
15%
12%
6%
5%12,809
17% 46,716
77%209,003
41%
18%
16%
21%
52%
5%
15%
13%
15%Micro 1–4 FTE employees
Large200+ FTE employees
Medium(-) 20–109 FTE employees
Other Small 5–19 FTE employees
1.2 Economic contribution of all NSW employing businessesIncluding public and private businesses
Employing Firms
Turnover Exports Jobs Profits
Medium(+)110–199 FTE employees
3%
09Business size report: A profile of business sizes in NSW and AustraliaNSW Innovation and Productivity Council
Source: Australian Bureau of Statistics 2018, Project 025 BLADE NSW DIIS_SW, 2015, Detailed Microdata, DataLab. Findings based on the use of ABS Microdata.Public Administration & Safety
Manufacturing
Agriculture, Forestry & Fishing
Construction
Arts & Recreation
Transport, Postal & Warehousing
Other Services
Health Care & Social Assistance
Professional, Scientific & Technical
Finance & Insurance
Unclassified
Administrative & Support Services
Retail Trade
Rental Hiring & Real Estate
Accommodation & Food
Information Media & Telecommunications
Education & Training
Mining
Wholesale Trade
Electricity, Gas, Water & Waste
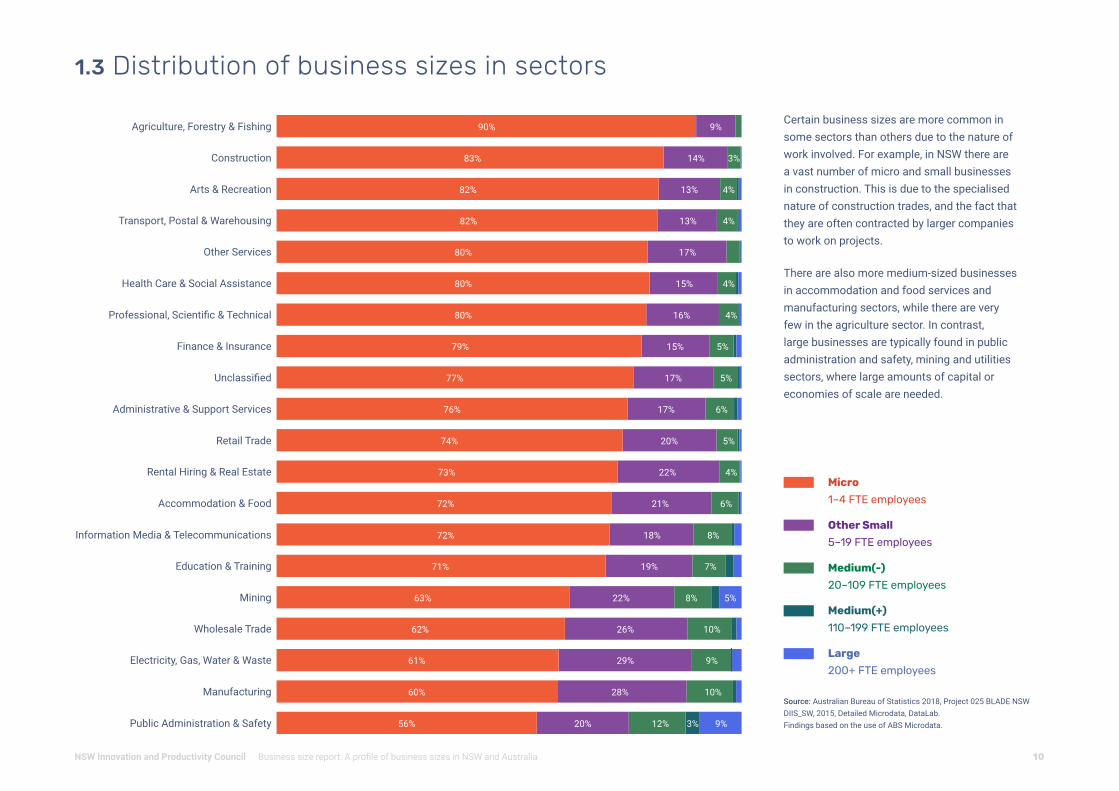
1.3 Distribution of business sizes in sectors
90%
80%
80%
80%
79%
82%
76%
83%
77%
9%
17%
15%
13%
16%
17%
14%
15%
17%
13%
5%
4%
4%
6%
3%
4%
5%
4%
74%
72%
72%
73%
20%
18%
21%
22%
5%
8%
6%
4%
63% 22% 8% 5%
62% 26% 10%
61% 29% 9%
60% 28% 10%
56%
71%
20%
19%
12% 3%
7%
9%
82%
Micro
1–4 FTE employees
Other Small
5–19 FTE employees
Medium(-)
20–109 FTE employees
Medium(+)
110–199 FTE employees
Large
200+ FTE employees
Certain business sizes are more common in some sectors than others due to the nature of work involved. For example, in NSW there are a vast number of micro and small businesses in construction. This is due to the specialised nature of construction trades, and the fact that they are often contracted by larger companies to work on projects.
There are also more medium-sized businesses in accommodation and food services and manufacturing sectors, while there are very few in the agriculture sector. In contrast, large businesses are typically found in public administration and safety, mining and utilities sectors, where large amounts of capital or economies of scale are needed.
10Business size report: A profile of business sizes in NSW and AustraliaNSW Innovation and Productivity Council
60%
70%
80%
90%
100%
Year 1 Year 2 Year 3
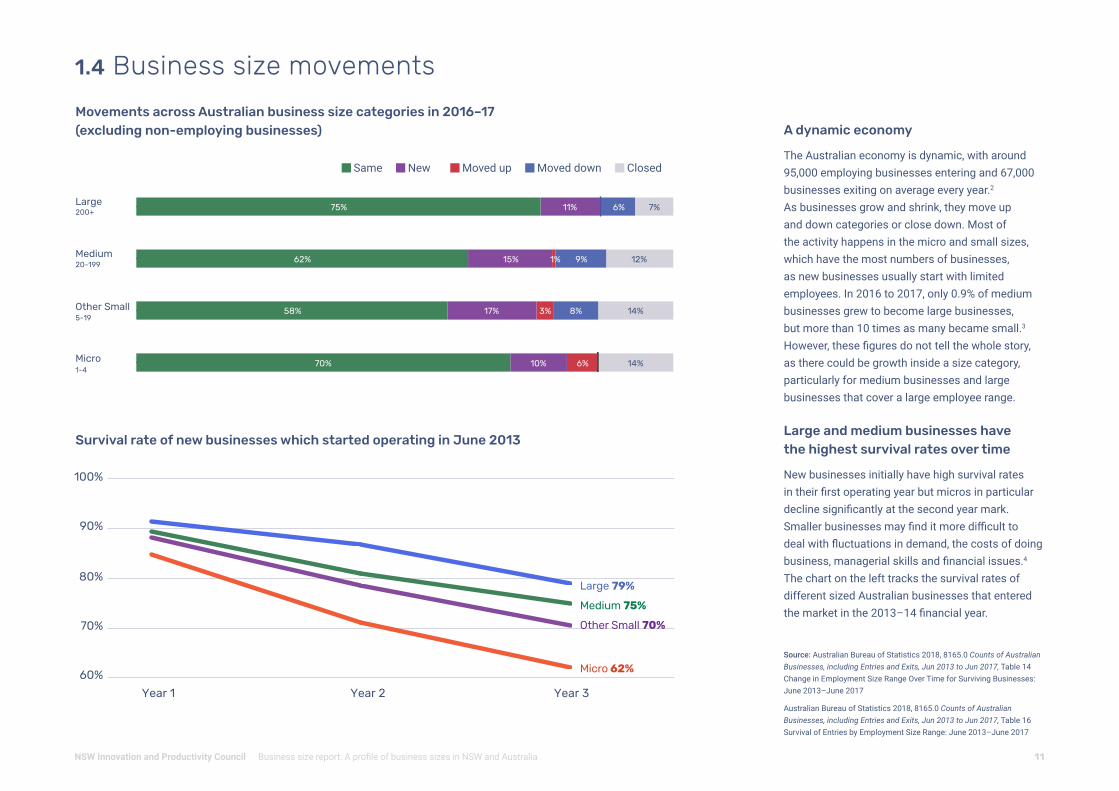
A dynamic economy
The Australian economy is dynamic, with around 95,000 employing businesses entering and 67,000 businesses exiting on average every year.2 As businesses grow and shrink, they move up and down categories or close down. Most of the activity happens in the micro and small sizes, which have the most numbers of businesses, as new businesses usually start with limited employees. In 2016 to 2017, only 0.9% of medium businesses grew to become large businesses, but more than 10 times as many became small.3 However, these figures do not tell the whole story, as there could be growth inside a size category, particularly for medium businesses and large businesses that cover a large employee range.
Large and medium businesses have the highest survival rates over time
New businesses initially have high survival rates in their first operating year but micros in particular decline significantly at the second year mark. Smaller businesses may find it more difficult to deal with fluctuations in demand, the costs of doing business, managerial skills and financial issues.4 The chart on the left tracks the survival rates of different sized Australian businesses that entered the market in the 2013–14 financial year.
Movements across Australian business size categories in 2016–17 (excluding non-employing businesses)
Survival rate of new businesses which started operating in June 2013
1.4 Business size movements
Micro 62%
Other Small 70%
Medium 75%
Large 79%
Large
1-4
5-19
20-199
200+
Medium
Other Small
Micro
7%6%11%75%
12%9%15%62% 1%
14%
14%
8%17%
10%70%
58% 3%
6%
Source: Australian Bureau of Statistics 2018, 8165.0 Counts of Australian Businesses, including Entries and Exits, Jun 2013 to Jun 2017, Table 14 Change in Employment Size Range Over Time for Surviving Businesses: June 2013–June 2017
Australian Bureau of Statistics 2018, 8165.0 Counts of Australian Businesses, including Entries and Exits, Jun 2013 to Jun 2017, Table 16 Survival of Entries by Employment Size Range: June 2013–June 2017
Same New Moved up Moved down Closed
11Business size report: A profile of business sizes in NSW and AustraliaNSW Innovation and Productivity Council
2Business sizes and their dominant sectors in NSW
Source: Australian Bureau of Statistics 2018, Project 025 BLADE NSW DIIS_SW, 2015, Detailed Microdata, DataLab. Findings based on the use of ABS Microdata.
These charts drill down into each business size and their dominant sectors, as well as their largest sub-sectors.
12Business size report: A profile of business sizes in NSW and AustraliaNSW Innovation and Productivity Council

Micro (1-4 FTE employees)
77% of all NSW businesses209,003 businesses
90% 2,939Agriculture, Forestry &Fishing
Sheep
Beef cattle
Grain farming
Electrical
Carpentry
House construction
Creative artists, musicians, writers & performers
Health & fitness centres & gyms
Sports clubs & sports professionals
83% 34,669Construction
82% 2,939
Arts & Recreation
Sectors that make the highest aggregate profit% of all micro / amount
Sectors with the highest aggregate export turnover sales% of micro export turnover / amount
Distribution of micro businesses in the economy% of all micro businesses / number of businesses
Sectors that employ the most staff in this size (FTE)% of all staff in micro businesses / number of FTE employees
11% 54,149 Construction
9% 47,073 Professional Services
16% $17.5B
Construction
41% $1.7B
Wholesale Trade 11% $476M
Mining 8% $360M
Manufacturing
Electrical
Carpentry
House construction
Management advice & consulting
Computer system design services
Accountants
13% $15B
Retail Trade
10% $11B
Wholesale Trade
19% $1.5B Health Care & Social
15% $1.2B Professional, Scientific & Technical
13% $1B Construction
5% 29,510Retail Trade
Pharmacies
Clothing retailers
Supermarket & grocery stores
17% 34,669Construction
15% 30,915Professional, Scientific & Technical
8% 16,841Retail Trade
Electrical Carpentry House construction
PharmaciesClothing retailersSupermarket and grocery stores
Management advice & consulting Computer system design Accountants
Sectors with highest aggregate turnover% of micro turnover / amount
Sectors with the highest proportion of micro businesses% of the sector / number of businesses
2.1 Micro business—dominant sectors (1–4 FTE employees)
Overview of business size in the economy
Micro
Other Small
Medium(-)Medium(+)
Large
13Business size report: A profile of business sizes in NSW and AustraliaNSW Innovation and Productivity Council

28% 265Electricity, Gas, Water & Waste
Solid waste collection
Waste remediation & materials
Recovery
Bakery product manufacturing
Printing
Wooden structural fitting & component manufacturing
Other hardwaregoods wholesaling
Other electrical & electronic goods wholesaling
Other grocerywholesaling
28% 3,875Manufacturing
26% 3,555Wholesale Trade
Distribution of small businesses in the economy% of all small businesses / number of businesses
Sectors that employ the most staff in this size (FTE)% of all staff in small businesses / number of FTE employees
16% $22.7B
Wholesale Trade
13% $18B
Retail Trade
12% $17B
Construction
10% 42,129Retail Trade
Pharmaceutical, cosmetic & toiletry goods retailing
Supermarket &grocery stores
Other store-based retailing
13% 6,082Professional, Scientific& Technical
12% 5,689 Construction
10% 4,567Retail Trade
Pharmaceutical, cosmetic & toiletry goods retailing
Supermarket and grocery stores
Other store-based retailing
Electrical House constructionPlumbing
13% 57,908Professional, Scientific & Technical
12% 53,089 Construction
Electrical
House construction
Plumbing
Sectors that make the highest aggregate profit% of all small / amount
18% $1.2B Finance & Insurance
16% $1B Professional, Scientific & Technical
10% $633M Wholesale Trade
38% $3B
Wholesale Trade 14% $1B
Mining 12% $992M
Professional, Scientific & Technical
Other Small (5-19 FTE employees)
17% of all NSW businesses46,716 businesses
Computer system design & related
Accounting services Management advice & related consulting
Sectors with highest aggregate turnover% of small turnover / amount
Sectors with the highest proportion of small businesses% of the sector / number of businesses
Computer system design &related
Accounting services
Management advice & related consulting
Sectors with the highest aggregate export turnover sales% of small export turnover / amount
2.2 Other Small business—dominant sectors (5–19 FTE employees)
Overview of business size in the economy
Medium(-)Medium(+)
Large
Micro
Other Small
14Business size report: A profile of business sizes in NSW and AustraliaNSW Innovation and Productivity Council

12% 191Public Administration & Safety
Investigation & security
Local government administration
Public order & safety
Printing
Bakery product manufacturing
Wooden structural fitting & component manufacturing
Other electrical & electronic goods wholesaling
Other hardwaregoods
Professional &scientific goodswholesaling
10% 1,385 Manufacturing
10% 1,297
Wholesale Trade
12% 64,249 Professional, Scientific & Technical
11% 56,975 Manufacturing
47% $221B
Finance & Insurance
Computer system design
Management advice & related consulting
Engineering design & consulting
Printing
Bakery product manufacturing
Wooden structural fitting & component manufacturing
10% $46B
Professional, Scientific & Technical
9% $43B
Wholesale Trade
10% 53,992Wholesale Trade
Other electrical & electronic goods Wholesaling
Other hardware goods wholesaling
Professional & scientific goods wholesaling
13% 1,604Professional, Scientific & Technical
11% 1,385 Manufacturing
10% 1,297Wholesale Trade
Computer system designManagement advice & related consultingEngineering design & consulting
Other electrical & electronic goods wholesaling
Other hardware goods wholesaling
Other professional & scientific goods wholesaling
Printing
Bakery product manufacturing
Wooden structural fitting &component manufacturing
Distribution of medium(-) businesses in the economy% of all medium(-) businesses / number of businesses
Sectors that employ the most staff in this size (FTE)% of all staff in medium(-) businesses / number of FTE employees
19% $1.3B Wholesale Trade
15% $1B Construction
14% $986M Professional, Scientific & Technical
33% $3B
Wholesale Trade 20% $2B
Manufacturing 10% $1B
Professional Services
Medium(-)(20-109 FTE employees)
5% of allNSW businesses
12,809businesses
Sectors that make the highest aggregate profit% of all medium(-) / amount
Sectors with the highest aggregate export turnover sales% of medium(-) export turnover / amount
Sectors with highest aggregate turnover% of medium(-) turnover / amount
Sectors with the highest proportion of medium(-) businesses% of the sector / number of businesses
2.3 Medium(-) business—dominant sectors (20–109 FTE employees)
Overview of business size in the economy
Micro
Medium(-)Medium(+)
Large Other Small
15Business size report: A profile of business sizes in NSW and AustraliaNSW Innovation and Productivity Council

3% 48Public Administration & Safety
Local government administration
Combined primary & secondary education
Secondary education
Technical & vocational education & training
2% 76Education & Training
2% 11Mining
12% 19,873 Professional Scientific & Technical
12% 19,500 Wholesale Trade
23% $19.8B
Finance & Insurance
Computer system designManagement advice & related consultingAdvertising
17% $14B
Wholesale Trade
10% $8.6B
Retail Trade
9% 14,241 Healthcare & Social
Aged care residential
Other social assistance
Other residential care
12% 136 Professional, Scientific & Technical
12% 134 Wholesale Trade
9% 99 Healthcare & Social
Computer system design & relatedManagement advice & related consultingAdvertising
Aged care residential
Other social assistance
Other residential care
Other electrical & electronic goods wholesaling
Pharmaceutical & toiletry goods wholesaling
Professional & scientific goods wholesaling
Distribution of medium(+) businesses in the economy% of all medium(+) businesses / number of businesses
Sectors that employ the most staff in this size (FTE)% of all staff in medium(+) businesses / number of FTE employees
61% $682M Finance & Insurance
29% $318M Professional, Scientific & Technical
26% $291M Manufacturing
46% $2B
Mining 13% $793M
Wholesale Trade 12% $735M
Professional, Scientific & Technical
Sectors that make the highest aggregate profit% of all medium(+) / amount
Sectors with highest aggregate turnover% of medium(+) turnover / amount
Sectors with the highest proportion of medium(+) businesses% of the sector / number of businesses
Other electrical &electronic goodswholesaling
Pharmaceutical & toiletry goods wholesaling
Professional & scientific goods wholesaling
Medium(+)(110-199 FTE)
0.4% 1,130
Sectors with the highest aggregate export turnover sales% of medium(+) export turnover / amount
2.4 Medium(+) business—dominant sectors (110–199 FTE employees)
Overview of business size in the economy
Micro
Medium(-)Medium(+)
Large Other Small
16Business size report: A profile of business sizes in NSW and AustraliaNSW Innovation and Productivity Council

9% 141Public Administration & Safety
Coal mining
5% 34Mining
13% 245,968 Retail Trade
13% 235,710 Healthcare & Social
67% $1.4T
Finance & Insurance
Clothing retailing Aged care residential services
Other social assistance
Hospitals (except psychiatric )
17% $132B
Retail Trade
10% $99B
Wholesale Trade
13% 189,809 Education & Training
Combined primary & secondary education
Technical & vocational education & training
Higher education
10% 166 Manufacturing
9% 153 Professional, Scientific & Technical
9% 147 Wholesale Trade
Meat processing
Other electrical & electronicgoods wholesaling
Pharmaceutical & toiletrygoods wholesaling
Professional & scientificgoods wholesaling
Computer system design
Management advice & consulting
Legal services
Distribution of large businesses in the economy% of all large businesses / number of businesses
Sectors that employ the most staff in this size (FTE)% of all staff in large businesses / number of FTE employees
29% $4.6B Retail Trade
28% $4.4B Manufacturing
20% $3B Wholesale Trade
Sectors that make the highest aggregate profit% of all large / amount
49% $19B
Mining 21% $8B
Manufacturing8% $3B
Wholesale Trade
Local government administration
State government administration
Investigation & security
2% 21Electricity, Gas, Water & Waste
Large0.6% 1,619
Sectors with the highest aggregate export turnover sales% of large export turnover / amount
Sectors with highest aggregate turnover% of large turnover / amount
Sectors with the highest proportion of large businesses% of the sector / number of businesses
2.5 Large business—dominant sectors (200+ FTE employees)
Overview of business size in the economy
Micro
Medium(-)Medium(+)
Large Other Small
17Business size report: A profile of business sizes in NSW and AustraliaNSW Innovation and Productivity Council

3Business size characteristics
18Business size report: A profile of business sizes in NSW and AustraliaNSW Innovation and Productivity Council
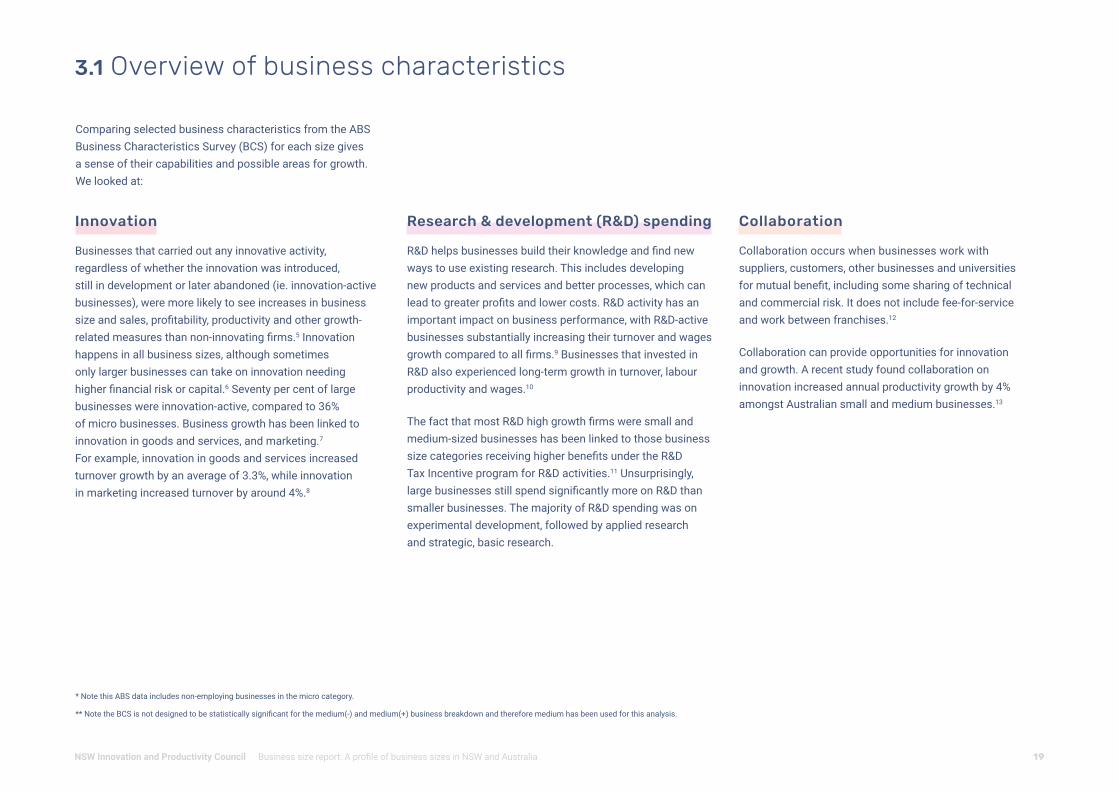
Comparing selected business characteristics from the ABS Business Characteristics Survey (BCS) for each size gives a sense of their capabilities and possible areas for growth. We looked at:
3.1 Overview of business characteristics
Innovation
Businesses that carried out any innovative activity, regardless of whether the innovation was introduced, still in development or later abandoned (ie. innovation-active businesses), were more likely to see increases in business size and sales, profitability, productivity and other growth-related measures than non-innovating firms.5 Innovation happens in all business sizes, although sometimes only larger businesses can take on innovation needing higher financial risk or capital.6 Seventy per cent of large businesses were innovation-active, compared to 36% of micro businesses. Business growth has been linked to innovation in goods and services, and marketing.7 For example, innovation in goods and services increased turnover growth by an average of 3.3%, while innovation in marketing increased turnover by around 4%.8
Research & development (R&D) spending
R&D helps businesses build their knowledge and find new ways to use existing research. This includes developing new products and services and better processes, which can lead to greater profits and lower costs. R&D activity has an important impact on business performance, with R&D-active businesses substantially increasing their turnover and wages growth compared to all firms.9 Businesses that invested in R&D also experienced long-term growth in turnover, labour productivity and wages.10
The fact that most R&D high growth firms were small and medium-sized businesses has been linked to those business size categories receiving higher benefits under the R&D Tax Incentive program for R&D activities.11 Unsurprisingly, large businesses still spend significantly more on R&D than smaller businesses. The majority of R&D spending was on experimental development, followed by applied research and strategic, basic research.
Collaboration
Collaboration occurs when businesses work with suppliers, customers, other businesses and universities for mutual benefit, including some sharing of technical and commercial risk. It does not include fee-for-service and work between franchises.12
Collaboration can provide opportunities for innovation and growth. A recent study found collaboration on innovation increased annual productivity growth by 4% amongst Australian small and medium businesses.13
* Note this ABS data includes non-employing businesses in the micro category.
** Note the BCS is not designed to be statistically significant for the medium(-) and medium(+) business breakdown and therefore medium has been used for this analysis.
19Business size report: A profile of business sizes in NSW and AustraliaNSW Innovation and Productivity Council
Digital capability
Having an internet presence helps businesses reach more potential customers and tap into international markets. Social media and websites also help businesses to build a brand and profile, engage with customers or suppliers and stand out. Micros are the least likely to have a digital platform to engage with customers or suppliers.
Data analytics
Companies can use big data and predictive analytics to identify value-adding insights to improve efficiencies in their processes and strategy. For example, using statistical models can increase the efficiency of supply chains and more accurately predict demand for products and services or human resources.14 Around 35% of micros relied on predictive analysis in their business, compared with 86% of large businesses. Over 40% of large businesses used predictive analysis monthly.
Strategic planning
A strategic plan or policy is the plan implemented by a business to achieve its goals and often takes a long-term view. It may include steps and processes that it will use to reach specific goals along the way, including strategic decision-making around investments, how to allocate resources and create revenue. Seventy-two per cent of large businesses have a written strategy, which is significantly more than other business size categories.
Use of key performance indicators (KPIs)
The ability to track business performance is an important capability for business growth. KPIs can measure performance on a wide range of business areas including profit, production levels, product and service quality, inventory, delivery distance and speed, energy consumption, environmental impact and social impact. Almost all large businesses use KPIs (98%).
Highly productive businesses
Highly productive businesses are in the 75th percentile of all businesses in each size category for employee productivity across NSW. Small and micro-sized firms have higher proportions of businesses in the high-productivity category compared to medium or large firms.
Overview of business characteristics Continued
20Business size report: A profile of business sizes in NSW and AustraliaNSW Innovation and Productivity Council

Micro* Other Small Medium Large
Is involved in innovation activity (%) 36 57 61 70
Total spending on R&D (% of large business amount) 11 22 42 100
Is involved in collaboration (any arrangements) (%) 13 16 19 28
Has an internet presence (%) 40 65 82 94
Uses predictive analysis (%) 36 57 73 86
Has a written business strategy (%) 6 13 32 72
Uses key performance indicators (KPIs) (%) 42 65 80 98
Is in the top 25% of highly productive businesses in NSW (%)** 29 27 17 16Productivity
3.2 Summary of business profiles on business characteristicsThe size of each ‘arm’ shows how each business size performs for the business characteristic.
Characteristics
* Note micro includes non-employing businesses.
** Note does not include non-employing businesses.
Micro Other Small Medium Large
Comparison across business size categories
Use of KPIs
Strategic planning
Data analytics
Digital capability
Collaboration
R&D spending
Innovation
21Business size report: A profile of business sizes in NSW and AustraliaNSW Innovation and Productivity Council
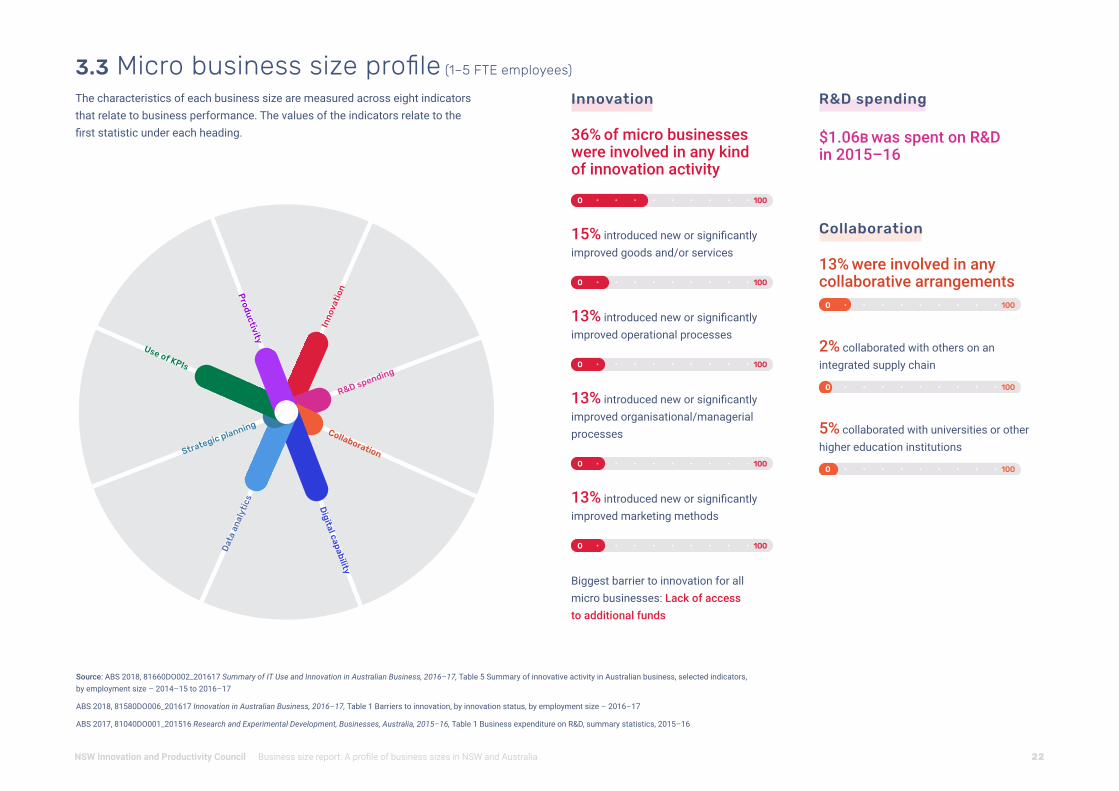
3.3 Micro business size profile (1–5 FTE employees)
Innovation
36% of micro businesses were involved in any kind of innovation activity
1000
15% introduced new or significantly improved goods and/or services
1000
13% introduced new or significantly improved operational processes
1000
13% introduced new or significantly improved organisational/managerial processes
1000
13% introduced new or significantly improved marketing methods
1000
Biggest barrier to innovation for all micro businesses: Lack of access to additional funds
R&D spending
$1.06B was spent on R&D in 2015–16
Collaboration
13% were involved in any collaborative arrangements
1000
2% collaborated with others on an integrated supply chain
1000
5% collaborated with universities or other higher education institutions
1000
Inno
vati
on
Dat
a an
alyt
ics
Collaboration
Use of KPIs
R&D spending
Strategic planning
Digital capability
Productivity
The characteristics of each business size are measured across eight indicators that relate to business performance. The values of the indicators relate to the first statistic under each heading.
Source: ABS 2018, 81660DO002_201617 Summary of IT Use and Innovation in Australian Business, 2016–17, Table 5 Summary of innovative activity in Australian business, selected indicators, by employment size – 2014–15 to 2016–17
ABS 2018, 81580DO006_201617 Innovation in Australian Business, 2016–17, Table 1 Barriers to innovation, by innovation status, by employment size – 2016–17
ABS 2017, 81040DO001_201516 Research and Experimental Development, Businesses, Australia, 2015–16, Table 1 Business expenditure on R&D, summary statistics, 2015–16
22Business size report: A profile of business sizes in NSW and AustraliaNSW Innovation and Productivity Council

Use of KPIs
48% of micro businesses monitor KPIs
1000
Digital capability
40% of micro businesses have an internet presence
1000
31% have a social media presence
1000
53% placed orders over the internet
1000
32% received orders over the internet
1000
$30B earned by micros online
Data analytics
36% of micro businesses rely on predictive analysis for business decision-making
1000
34% used data analysis in designing new goods or services
1000
25% used data analysis for supply chain management
1000
Strategic planning
6% of micro businesses have a written strategic plan or policy
1000
27% have an unwritten strategic plan or policy
1000
Productivity
29% are highly productive businesses
1000
Median labour productivity:
$75,930/FTE
Most productive sectors:
• Healthcare & Social Assistance
• Agriculture, Forestry & Fishing
• Professional, Scientific & Technical
36% productivity growth between 2004–05 and 2014–15
MicrobusinesssizeprofileContinued
Sources: ABS 2018, 81660DO001_201617 Summary of IT Use and Innovation in Australian Business, 2016–17, Table 1 Business Use of Information Technology, selected indicators, by employment size, by industry – 2016–17
ABS 2017, 81720DO002_201516 Management and Organisational Capabilities of Australian Business, 2015–16, Table 4 Frequency of reliance on predictive analysis, by innovation status, by employment size, by industry, 2015–16
ABS 2017, 81720DO003_201516 Management and Organisational Capabilities of Australian Business, 2015–16, Table 1 Strategic plan or policy in place, by innovation status, by employment size, by industry, 2015–16
ABS 2017, 81720DO001_201516 Management and Organisational Capabilities of Australian Businesses, 2015–16, Table 1 Proportion of businesses monitoring Key Performance Indicators (KPIs), by innovation status, by employment size, by industry, 2015–16.
Australian Bureau of Statistics 2018, Project 025 BLADE NSW DIIS_SW, 2015, Detailed Microdata, DataLab. Findings based on the use of ABS Microdata.
23Business size report: A profile of business sizes in NSW and AustraliaNSW Innovation and Productivity Council
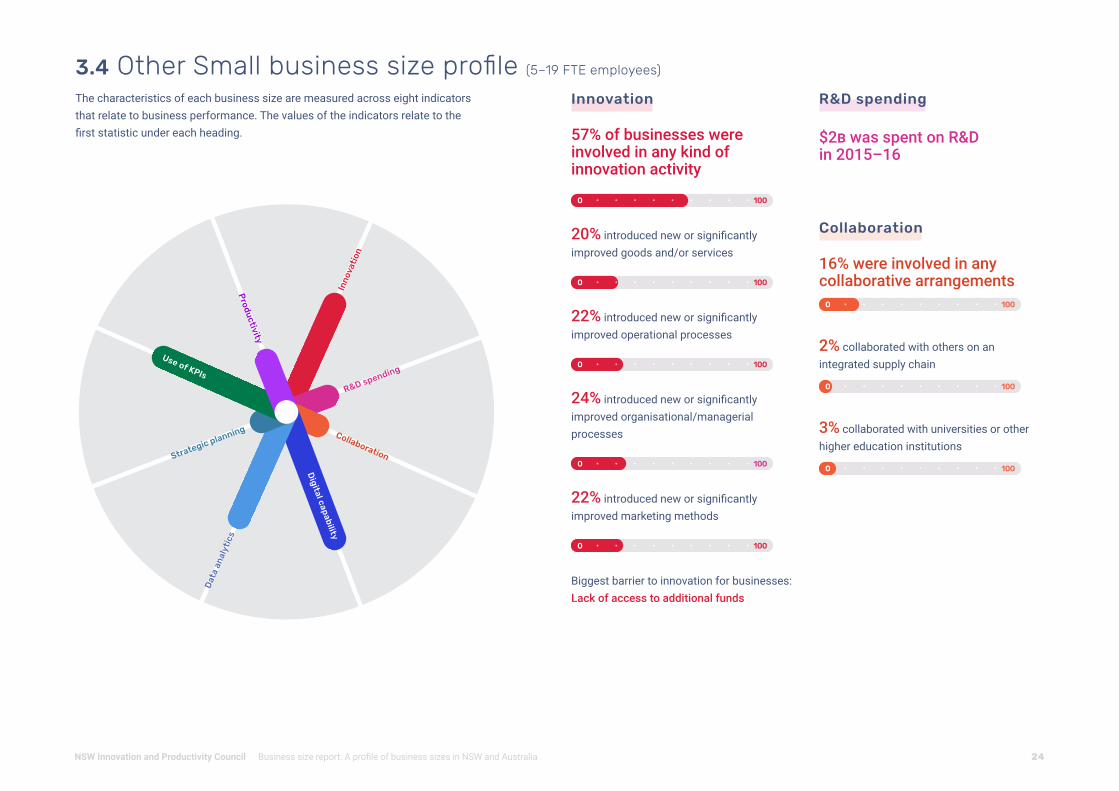
Innovation
57% of businesses were involved in any kind of innovation activity
1000
20% introduced new or significantly improved goods and/or services
1000
22% introduced new or significantly improved operational processes
1000
24% introduced new or significantly improved organisational/managerial processes
1000
22% introduced new or significantly improved marketing methods
1000
Biggest barrier to innovation for businesses: Lack of access to additional funds
R&D spending
$2B was spent on R&D in 2015–16
Collaboration
16% were involved in any collaborative arrangements
1000
2% collaborated with others on an integrated supply chain
1000
3% collaborated with universities or other higher education institutions
1000
Inno
vati
on
Dat
a an
alyt
ics
Collaboration
R&D spending
Strategic planning
Digital capability
Productivity
The characteristics of each business size are measured across eight indicators that relate to business performance. The values of the indicators relate to the first statistic under each heading.
Use of KPIs
3.4 Other Small business size profile (5–19 FTE employees)
24Business size report: A profile of business sizes in NSW and AustraliaNSW Innovation and Productivity Council
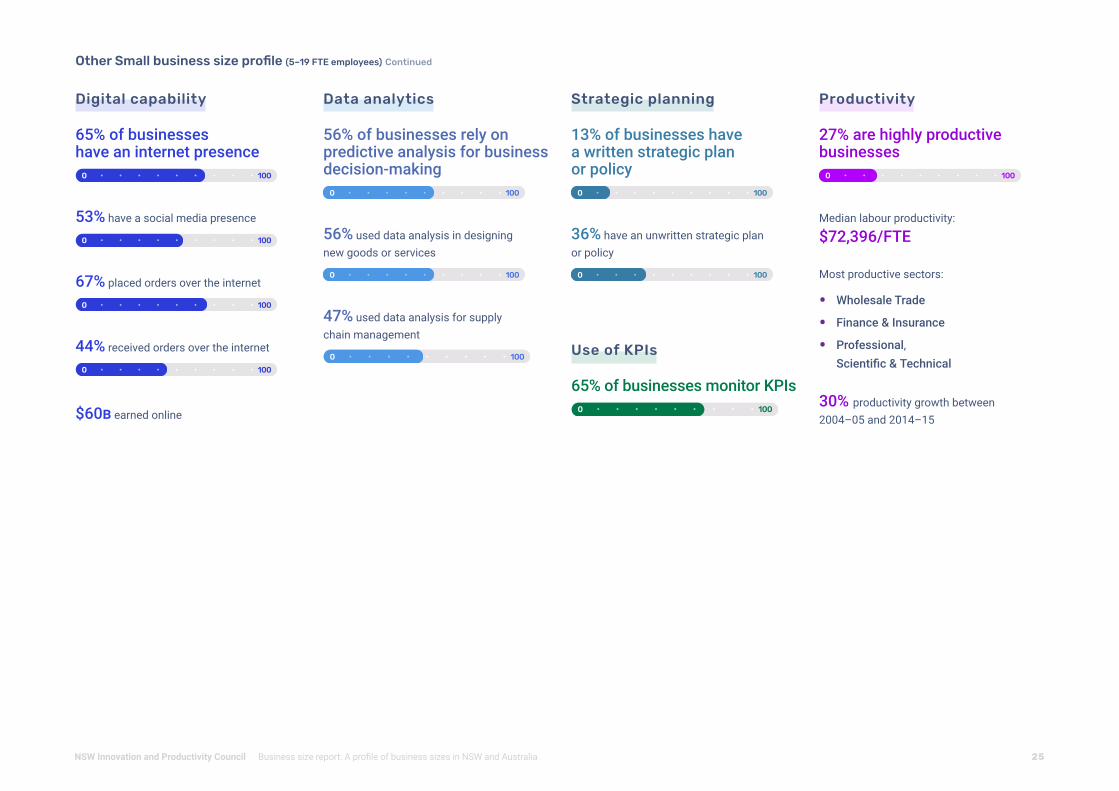
Use of KPIs
65% of businesses monitor KPIs 1000
Digital capability
65% of businesses have an internet presence
1000
53% have a social media presence
1000
67% placed orders over the internet
1000
44% received orders over the internet
1000
$60B earned online
Data analytics
56% of businesses rely on predictive analysis for business decision-making
1000
56% used data analysis in designing new goods or services
1000
47% used data analysis for supply chain management
1000
Strategic planning
13% of businesses have a written strategic plan or policy
1000
36% have an unwritten strategic plan or policy
1000
Productivity
27% are highly productive businesses
1000
Median labour productivity:
$72,396/FTE
Most productive sectors:
• Wholesale Trade
• Finance & Insurance
• Professional, Scientific & Technical
30% productivity growth between 2004–05 and 2014–15
OtherSmallbusinesssizeprofile(5–19 FTE employees) Continued
25Business size report: A profile of business sizes in NSW and AustraliaNSW Innovation and Productivity Council

Innovation
61% of medium businesses were involved in any kind of innovation activity
1000
22% introduced new or significantly improved goods and/or services
1000
26% introduced new or significantly improved operational processes
1000
27% introduced new or significantly improved organisational/managerial processes
1000
25% introduced new or significantly improved marketing methods
1000
Biggest barrier to innovation for all medium businesses: Lack of skilled persons
R&D spending
$4B was spent on R&D in 2015–16
Collaboration
19% were involved in any collaborative arrangements
1000
3% collaborated with others on an integrated supply chain
1000
9% collaborated with universities or other higher education institutions
1000
Inno
vati
on
Dat
a an
alyt
ics
Collaboration
Use of KPIsR&D spending
Strategic planning
Digital capability
The characteristics of each business size are measured across eight indicators that relate to business performance. The values of the indicators relate to the first statistic under each heading.
3.5 Medium business size profile (20–199 FTE employees)
Productivity
26Business size report: A profile of business sizes in NSW and AustraliaNSW Innovation and Productivity Council
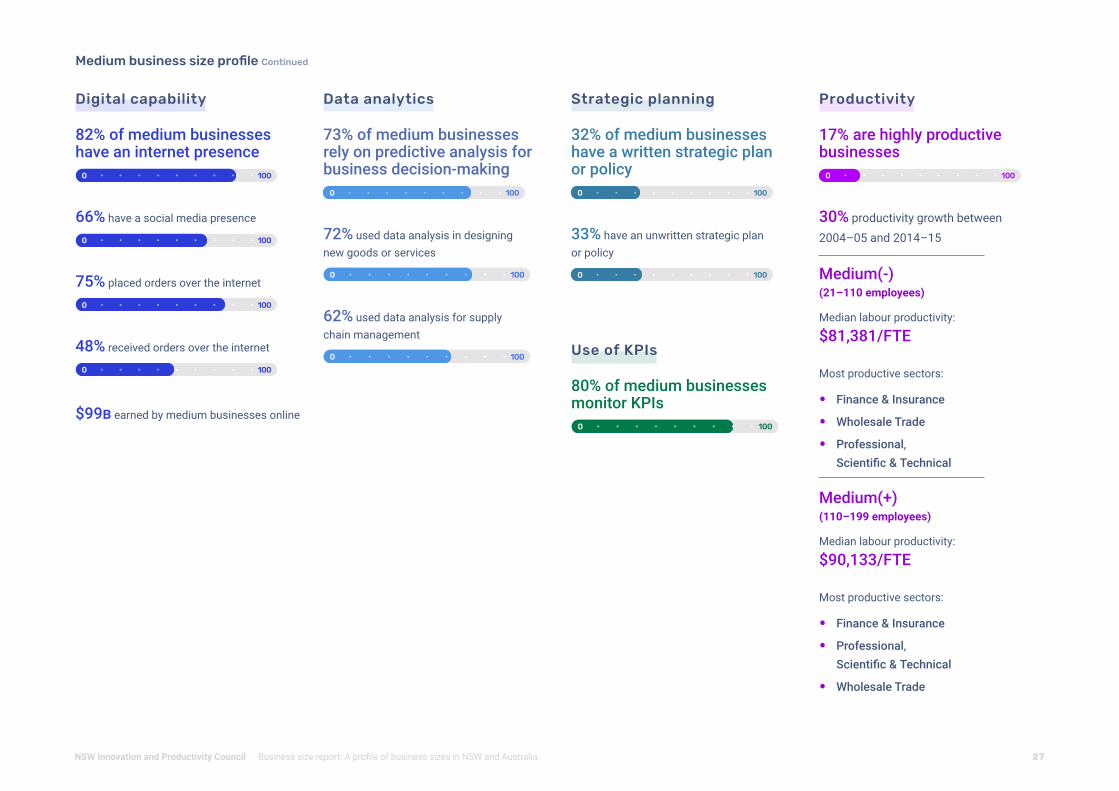
Use of KPIs
80% of medium businesses monitor KPIs
1000
Digital capability
82% of medium businesses have an internet presence
1000
66% have a social media presence
1000
75% placed orders over the internet
1000
48% received orders over the internet
1000
$99B earned by medium businesses online
Data analytics
73% of medium businesses rely on predictive analysis for business decision-making
1000
72% used data analysis in designing new goods or services
1000
62% used data analysis for supply chain management
1000
Strategic planning
32% of medium businesses have a written strategic plan or policy
1000
33% have an unwritten strategic plan or policy
1000
Productivity
17% are highly productive businesses
1000
30% productivity growth between
2004–05 and 2014–15 Medium(-) (21–110 employees)
Median labour productivity:
$81,381/FTE
Most productive sectors:
• Finance & Insurance
• Wholesale Trade
• Professional, Scientific & Technical
Medium(+) (110–199 employees)
Median labour productivity:
$90,133/FTE
Most productive sectors:
• Finance & Insurance
• Professional, Scientific & Technical
• Wholesale Trade
MediumbusinesssizeprofileContinued
27Business size report: A profile of business sizes in NSW and AustraliaNSW Innovation and Productivity Council
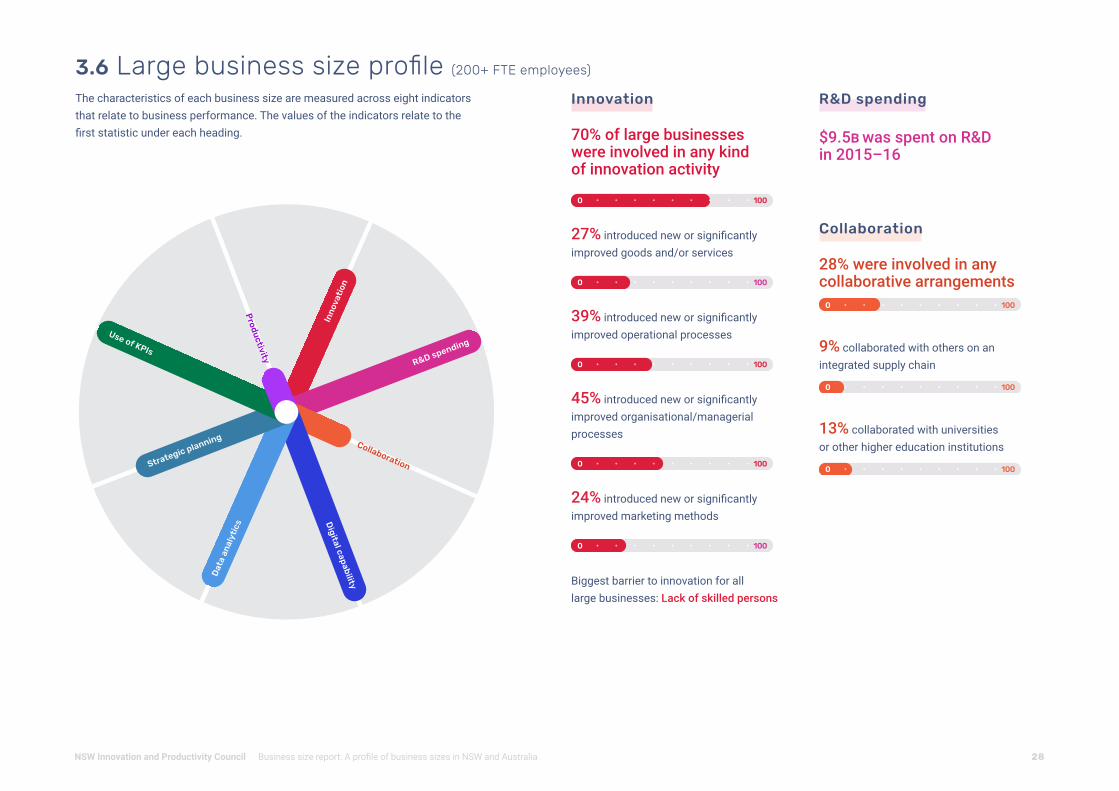
Innovation
70% of large businesses were involved in any kind of innovation activity
1000
27% introduced new or significantly improved goods and/or services
1000
39% introduced new or significantly improved operational processes
1000
45% introduced new or significantly improved organisational/managerial processes
1000
24% introduced new or significantly improved marketing methods
1000
Biggest barrier to innovation for all large businesses: Lack of skilled persons
R&D spending
$9.5B was spent on R&D in 2015–16
Collaboration
28% were involved in any collaborative arrangements
1000
9% collaborated with others on an integrated supply chain
1000
13% collaborated with universities or other higher education institutions
1000
Inno
vati
on
Dat
a an
alyt
ics
Collaboration
Use of KPIsR&D spending
Strategic planning
Digital capability
The characteristics of each business size are measured across eight indicators that relate to business performance. The values of the indicators relate to the first statistic under each heading.
3.6 Large business size profile (200+ FTE employees)
Productivity
28Business size report: A profile of business sizes in NSW and AustraliaNSW Innovation and Productivity Council
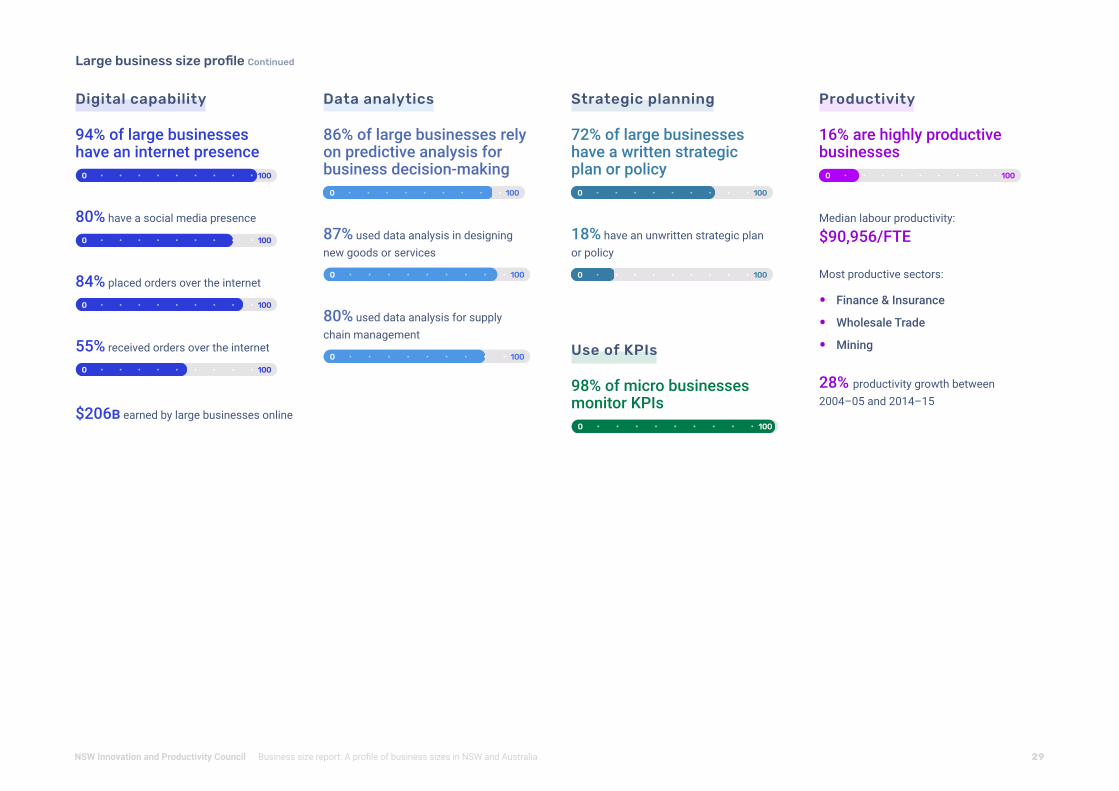
Use of KPIs
98% of micro businesses monitor KPIs
1000
LargebusinesssizeprofileContinued
Digital capability
94% of large businesses have an internet presence
1000
80% have a social media presence
1000
84% placed orders over the internet
1000
55% received orders over the internet
1000
$206B earned by large businesses online
Data analytics
86% of large businesses rely on predictive analysis for business decision-making
1000
87% used data analysis in designing new goods or services
1000
80% used data analysis for supply chain management
1000
Strategic planning
72% of large businesses have a written strategic plan or policy
1000
18% have an unwritten strategic plan or policy
1000
Productivity
16% are highly productive businesses
1000
Median labour productivity:
$90,956/FTE
Most productive sectors:
• Finance & Insurance
• Wholesale Trade
• Mining
28% productivity growth between 2004–05 and 2014–15
29Business size report: A profile of business sizes in NSW and AustraliaNSW Innovation and Productivity Council
INT19/77817
© State of New South Wales through Department of Industry 2019. The information contained in this publication is based on knowledge and understanding at the time of writing (May 2019). However, because of advances in knowledge, users are reminded of the need to ensure that the information upon which they rely is up to date and to check the currency of the information with the appropriate officer of the Department of Industry or the user’s independent adviser.
The following Disclaimer Notice refers to data and graphs sourced from the Australian Bureau of Statistics’ BLADE (Business Longitudinal Analysis Data Environment) database.
The results of these studies are based, in part, on ABR data supplied by the Registrar to the ABS under A New Tax System (Australian Business Number) Act 1999 and tax data supplied by the ATO to the ABS under the Taxation Administration Act 1953. These require that such data are only used to carry out functions of the ABS. No individual information collected under the Census and Statistics Act 1905 is provided back to the Registrar or ATO for administrative or regulatory purposes. Any discussion of data limitations or weaknesses is in the context of using the data for statistical purposes, and is not related to the ability of the data to support the ABR or ATO’s core operational requirements. Legislative requirements to ensure privacy and secrecy of this data have been followed. Only people authorised under the Australian Bureau of Statistics Act 1975 have been allowed to view data about any particular firm in conducting these analyses. In accordance with the Census and Statistics Act 1905, results have been confidentialised to ensure that they are not likely to enable identification of a particular person or organisation.
• The Australian Capital Territory region is excluded from NSW calculations.
• Employing businesses are defined as those with one or more FTE employees.
• Highly productive firm count is calculated using global 75th productivity percentile.
• Where a business is located is determined using the postcode of its headquarters. Firms that operate within NSW but are headquartered outside are excluded from this analysis, which may impact the business counts.
1 Parliament of Australia 2015, Definitions and data sources for small business in Australia: a quick guide, https://www.aph.gov.au/About_Parliament/Parliamentary_Departments/Parliamentary_Library/pubs/rp/rp1516/Quick_Guides/Data
2 Australian Bureau of Statistics 2018, 8165.0 Counts of Australian Businesses, including Entries and Exits, Jun 2013 to Jun 2017, Table 13 Businesses by Employment Size Range: June 2013–June 2017
3 Australian Bureau of Statistics 2017, 8165.0 Counts of Australian Businesses, including Entries and Exits, Jun 2013 to Jun 2017, Table 14 Change in Employment Size Range Over Time for Surviving Businesses: June 2013–June 2017
4 Nicholls S & Orsmond D 2015, The Economic Trends, Challenges and Behaviour of Small Businesses in Australia, Reserve Bank of Australia, https://www.rba.gov.au/publications/confs/2015/nicholls-orsmond.html
5 Office of the Chief Economist 2017, Executive summary, Innovation System Report 2017, https://archive.industry.gov.au/Office-of-the-Chief-Economist/Publications/AustralianInnovationSystemReport2017/index.html
6 Australian Bureau of Statistics 2011, Competition, Innovation and Productivity in Australian Businesses, p 6, http://www.ausstats.abs.gov.au/Ausstats/subscriber.nsf/0/896C28E59CC4B822CA2579050014C578/$File/1351055035_sep%202011.pdf
7 Office of the Chief Economist, Innovation System Report 2017, p 63, https://archive.industry.gov.au/Office-of-the-Chief-Economist/Publications/AustralianInnovationSystemReport2017/index.html
8 Office of the Chief Economist, Innovation System Report 2017, p 63, https://archive.industry.gov.au/Office-of-the-Chief-Economist/Publications/AustralianInnovationSystemReport2017/index.html
9 Office of the Chief Economist, Innovation System Report 2017, p 74, https://archive.industry.gov.au/Office-of-the-Chief-Economist/Publications/AustralianInnovationSystemReport2017/index.html
10 Office of the Chief Economist, Innovation System Report 2017, p 74, accessed 7 November 2018, https://archive.industry.gov.au/Office-of-the-Chief-Economist/Publications/AustralianInnovationSystemReport2017/index.html
11 Office of the Chief Economist, Innovation System Report 2017, p 65, accessed 7 November 2018,https://archive.industry.gov.au/Office-of-the-Chief-Economist/Publications/AustralianInnovationSystemReport2017/index.html
12 Australian Bureau of Statistics, 8158.0–Innovation in Australian Business, 2016-17, accessed 7 November 2018, http://www.abs.gov.au/ausstats/[email protected]/mf/8158.0
13 Belderbos R, Carree M and Lokshin B, 2004 Cooperative R&D and firm performance, Research Policy, 33(10), pp.1477–1492, cited in Office of the Chief Economist, Innovation System Report 2017, p 15, https://archive.industry.gov.au/Office-of-the-Chief-Economist/Publications/AustralianInnovationSystemReport2017/index.html
14 McKinsey & Company 2016, Big data and the supply chain: The big-supply-chain analytics landscape (Part 1), https://www.mckinsey.com/business-functions/operations/our-insights/big-data-and-the-supply-chain-the-big-supply-chain-analytics-landscape-part-1
Disclaimer
Notes References
30Business size report: A profile of business sizes in NSW and AustraliaNSW Innovation and Productivity Council