Embed Size (px)
Citation preview

Business Report2004
Year ended March 31, 2004
NIPPON SYSTEM DEVELOPMENT CO., LTD.

Profileプロフィール
日本システムディベロップメント(NSD)は、1969年の創業以来、
独立系ソフトウエアハウスとして、また国内でも有数のシステムイ
ンテグレーターとして成長してまいりました。現在、NSDでは、
情報システムの開発・設計からメンテナンス・システム運用までの
一貫したサービスを様々な業種のお客様に提供するとともに、電子
認証などのセキュリティ関連ソリューションを始めとする様々なソ
リューション・パッケージソフトの開発・販売を行っております。
1998年に大阪証券取引所市場第1部、1999年には東京証券
取引所市場第1部に上場を果たしました。
NSDは、これからも、最先端のテクノロジーを駆使し、顧客ニ
ーズに応える最適なサービスを提供するとともに、企業価値の最大
化に取り組んでまいります。
Since its inception in 1969, Nippon System Development (NSD) has
worked hard and established itself as an independent software house
and one of Japan’s foremost systems integrators. Now, NSD
provides integrated services from the development and design of
information systems to the operation of maintenance systems in a
wide range of industries. It also develops and sells various solution
packages, including security-related solutions such as electronic
authentication.
NSD was listed on the first section of the Osaka Securities Exchange
in 1998, followed by a listing on the first section of the Tokyo Stock
Exchange in 1999.
Taking full advantage of cutting edge technology, NSD will continue
its commitment to the delivery of optimal services that meet
customer needs and to the maximization of corporate value.
01 投資家の皆様へ To Our Investors
02 NSDの事業概要 NSD at a Glance
04 研究開発 Research and Development
05 トピックス Topics
06 連結主要財務データ Consolidated Selected Financial Data
07 連結財務分析 Management's Discussion and Analysis
14 連結貸借対照表 Consolidated Balance Sheets
16 連結損益計算書 Consolidated Statement of Income
及び剰余金計算書 Consolidated Statement of Retained Earnings
CONTENTS/目次
17 連結キャッシュ・フロー計算書 Consolidated Statement of Cash Flows
18 連結財務諸表に対する注記(抜粋) Notes to Consolidated Financial Statements
20 単独主要財務データ Non-Consolidated Selected Financial Data
22 単独貸借対照表 Non-Consolidated Balance Sheets
23 単独損益計算書 Non-Consolidated Statement of Income
及び利益処分計算書 Non-Consolidated Statement of Appropriations
24 事業所及び子会社一覧 NSD Group Directory
25 取締役及び監査役、会社概要 Board of Directors and Auditors, Corporate Data
取締役社長 小岸 勲Isao Ogishi, President & CEO

NIPPON SYSTEM DEVELOPMENT CO., LTD. Business Report 2004 1
株主並びに投資家の皆様におかれましては、ますますご清栄の
こととお慶び申しあげます。平素は格別のご支援を賜り厚くお礼
申しあげます。
情報サービス業界は、顧客ニーズがますます多様化し、それに
伴い必要とされるシステム開発もより高度化・複雑化しております。
当社はこれらのビジネス環境の変化に対応するために、ソリュー
ション・パッケージソフトの取扱い数を増やす等新分野の領域を
拡大するとともに提案力・技術力の強化を目指し社内体制の一層
の強化に努めてまいりました。
また、自己株式を取得するとともにバランスシートの見直し等
を進めることにより株主価値の増大を積極的に図ってまいりました。
しかしながら、上半期に発生したソフトウエア開発プロジェク
トの不採算案件の影響と新規事業の先行投資を拡大していること
から、売上高、営業利益及び経常利益は前年を下回ることになり
ました。尚、当期純利益につきましては、厚生年金基金の代行部
分について過去分返上が認可されたことに伴い23億37百万円
を特別利益として計上いたしましたので、前年に比べて大幅に増
益となっております。
本年は、当社創業35周年という節目であり、当期の株主各位
への利益還元につきましても日頃のご支援にお応えすべく、配当
を1株当たり4円増額し22円とさせていただきました。
3月には大阪にIDCセンター機能を備えた新社屋も竣工し、更
なる業績の向上と社業の発展に努める所存でございますので、株
主の皆様におかれましては、今後ともより一層のご支援、ご指導
を賜りますようお願い申しあげます。
平成16年6月
代表取締役社長 小 岸 勲
We would like to express our sincere gratitude to you for supporting
us.
In the information service industry, customer needs have been
increasingly diversified and systems development has become more
sophisticated and complicated. To respond to this changing busi-
ness environment, we are committed to expand into new business
areas, including increasing the usage of our packaged software
solutions, as well as strengthening the Company structure to
improve our technical expertise and develop proposals to fit
customer needs.
We have also been actively engaged in buying our own shares on
the market and reviewed the balance sheet to boost the shareholder
value.
However, our net sales, operating income and ordinary income fell
short of the previous term, mainly due to the negative effect of
unprofitable software development projects, which occurred in the
first half of the year, and the expansion of prior investments in new
businesses. Our net income has significantly increased, since we
posted 2,337 million yen as extraordinary gains, following the
approval for returning a substitutional portion of the Employees’
Pension Fund.
As we are celebrating the 35th anniversary of the Company this
year, we increased our shareholder dividend by 4 yen to 22 yen per
share to show our gratitude for your continuing support.
With the March 2004 completion of a new headquarters in Osaka,
which is equipped with Internet Data Center (IDC) functions, all of us
at Nippon System Development are committed to better business
results and further business growth. We thank you for your coopera-
tion and are looking forward to your continued support.
June 2004
Isao OgishiPresident & CEO
To Our Investors投資家の皆様へ
2 NIPPON SYSTEM DEVELOPMENT CO., LTD. Business Report 2004
当社グループは、NSDと子会社14社及び関連会社2社で構成され、情報サービス事業、ソフトウエアプロダクト事業及び人材派遣事業を行っております。
The NSD Group comprises 14 subsidiaries and two affiliated companies in addition to NipponSystem Development, and is engaged in information services, software products and staffingservices.
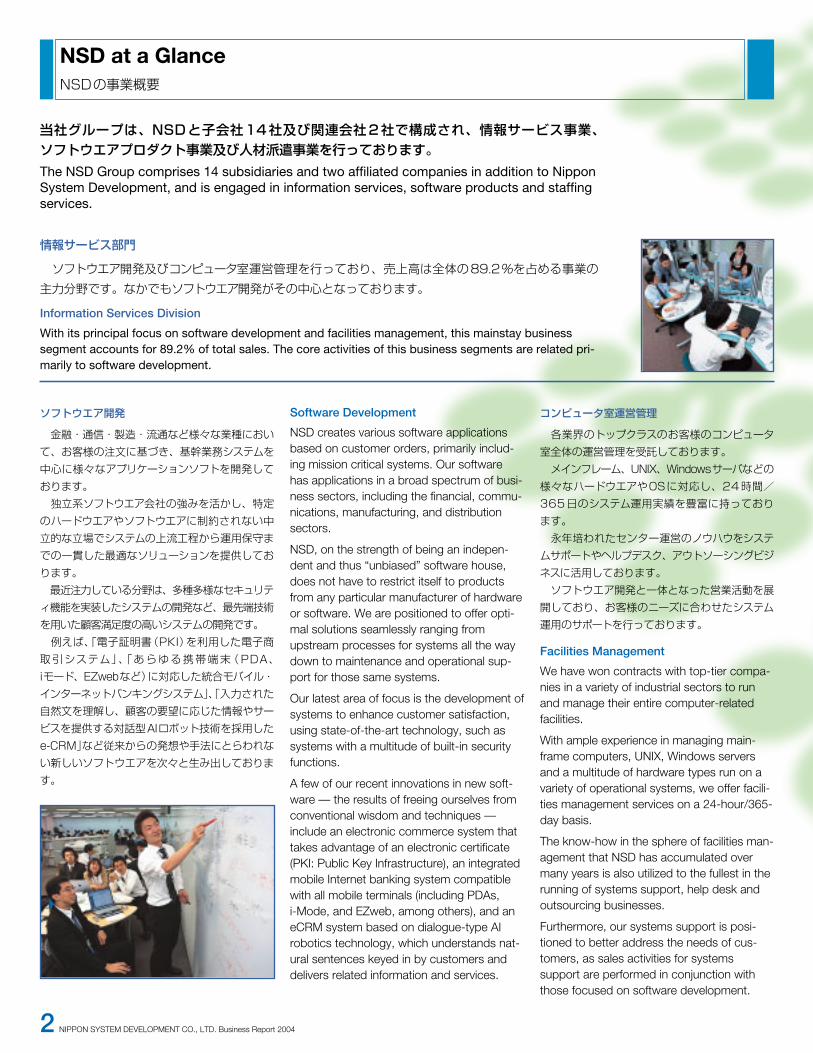
ソフトウエア開発
金融・通信・製造・流通など様々な業種におい
て、お客様の注文に基づき、基幹業務システムを
中心に様々なアプリケーションソフトを開発して
おります。
独立系ソフトウエア会社の強みを活かし、特定
のハードウエアやソフトウエアに制約されない中
立的な立場でシステムの上流工程から運用保守ま
での一貫した最適なソリューションを提供してお
ります。
最近注力している分野は、多種多様なセキュリテ
ィ機能を実装したシステムの開発など、最先端技術
を用いた顧客満足度の高いシステムの開発です。
例えば、「電子証明書(PKI)を利用した電子商
取引システム」、「あらゆる携帯端末(PDA、
iモード、EZwebなど)に対応した統合モバイル・
インターネットバンキングシステム」、「入力された
自然文を理解し、顧客の要望に応じた情報やサー
ビスを提供する対話型AIロボット技術を採用した
e-CRM」など従来からの発想や手法にとらわれな
い新しいソフトウエアを次々と生み出しておりま
す。
Software Development
NSD creates various software applicationsbased on customer orders, primarily includ-ing mission critical systems. Our softwarehas applications in a broad spectrum of busi-ness sectors, including the financial, commu-nications, manufacturing, and distributionsectors.
NSD, on the strength of being an indepen-dent and thus “unbiased” software house,does not have to restrict itself to productsfrom any particular manufacturer of hardwareor software. We are positioned to offer opti-mal solutions seamlessly ranging fromupstream processes for systems all the waydown to maintenance and operational sup-port for those same systems.
Our latest area of focus is the development ofsystems to enhance customer satisfaction,using state-of-the-art technology, such assystems with a multitude of built-in securityfunctions.
A few of our recent innovations in new soft-ware — the results of freeing ourselves fromconventional wisdom and techniques —include an electronic commerce system thattakes advantage of an electronic certificate(PKI: Public Key Infrastructure), an integratedmobile Internet banking system compatiblewith all mobile terminals (including PDAs, i-Mode, and EZweb, among others), and aneCRM system based on dialogue-type AIrobotics technology, which understands nat-ural sentences keyed in by customers anddelivers related information and services.
コンピュータ室運営管理
各業界のトップクラスのお客様のコンピュータ
室全体の運営管理を受託しております。
メインフレーム、UNIX、Windowsサーバなどの
様々なハードウエアやOSに対応し、24時間/
365日のシステム運用実績を豊富に持っており
ます。
永年培われたセンター運営のノウハウをシステ
ムサポートやヘルプデスク、アウトソーシングビジ
ネスに活用しております。
ソフトウエア開発と一体となった営業活動を展
開しており、お客様のニーズに合わせたシステム
運用のサポートを行っております。
Facilities Management
We have won contracts with top-tier compa-nies in a variety of industrial sectors to runand manage their entire computer-relatedfacilities.
With ample experience in managing main-frame computers, UNIX, Windows serversand a multitude of hardware types run on avariety of operational systems, we offer facili-ties management services on a 24-hour/365-day basis.
The know-how in the sphere of facilities man-agement that NSD has accumulated overmany years is also utilized to the fullest in therunning of systems support, help desk andoutsourcing businesses.
Furthermore, our systems support is posi-tioned to better address the needs of cus-tomers, as sales activities for systemssupport are performed in conjunction withthose focused on software development.
情報サービス部門
ソフトウエア開発及びコンピュータ室運営管理を行っており、売上高は全体の89.2%を占める事業の
主力分野です。なかでもソフトウエア開発がその中心となっております。
Information Services Division
With its principal focus on software development and facilities management, this mainstay businesssegment accounts for 89.2% of total sales. The core activities of this business segments are related pri-marily to software development.
NSD at a GlanceNSDの事業概要

NIPPON SYSTEM DEVELOPMENT CO., LTD. Business Report 2004 3
人材派遣部門
子会社である日本テクニカルサービス(株)によって運営されている人材派遣事業では、一般事業会社に
広く人材を派遣するとともに、当社も情報サービス部門を中心に人材を受け入れております。今後、派
遣社員に対するニーズは更に高まると考えられ、事業の育成を図っていく方針です。
Staffing Services Division
Our staffing services business, run by Nippon Technical Service Co., Ltd., one of our subsidiaries, involvesdispatching personnel to a wide range of companies outside the NSD Group, and also to NSD, especially inthe sections engaged in information services. Needs for personnel on a temporary basis are expected togrow further, and attempts will be made to maximize these opportunities by giving a stronger boost to thissegment.
部門別売上高 Net Sales by Division
(%)
: 89.2% ■
: 7.8% ■
: 3.0% ■
情報サービス Information Services
ソフトウエアプロダクト Software Products
人材派遣 Staffing Services
2004年3月期 Year ended March 31, 2004
ソフトウエアプロダクト部門
今後の育成分野として、NSD独自開発のソフトウエアや海外のアライアンス企業より輸入した最新の
ビジネスソフト等、利益率の高いパッケージソフトの販売に注力しております。また、ハードウエアの最適
な組み合わせ並びにソフトウエア開発と絡めたトータルシステムとしての販売活動を推進しております。
Software Products Division
NSD is focusing on highly profitable packaged software sales, including software applications developedexclusively by NSD and the latest business applications NSD imports from its overseas corporate alliances.In addition, the division will conduct sales activities designed to encourage sales of total systems, wheresoftware development is integrated with an optimized combination of hardware.
情報サービス Information services
ソフトウエア開発等の外注 Subcontract software development, etc.
連結子会社 湘南情報サービス(株) (株)リンク・コンセプト エヌ・エス・ディ九州(株) 日本アイデントラス(株) NSD SECURITY, INC. NSD AMERICA INC. Consolidated subsidiaries Shonan Information Service Co., Ltd. Link Concept Corporation NSD Kyushu Co., Ltd. Identrus Japan, Inc. NSD SECURITY, INC. NSD AMERICA INC.
連結子会社 エヌ・エス・ディシステムサービス(株)
Consolidated subsidiary NSD System Service Co., Ltd.
連結子会社 (株)エヌ・エス・ディシステム研究所 エヌ・アイ・コンサルティング(株)
Consolidated subsidiaries NSD System Institute Co., Ltd. NI Consulting Co., Ltd.
連結子会社 日本テクニカルサービス(株) (株)ディ・アクセス
Consolidated subsidiaries Nippon Technical Service Co., Ltd.
D• Access Co., Ltd.
連結子会社 日本インターワールド(株) Consolidated subsidiary InterWorld Corporation Japan K.K.
連結子会社 (株)福島総合計算センター 日本産業システム(株) Consolidated subsidiaries Fukushima Sougo Keisan Center Co., Ltd. Nippon Sangyo System Co., Ltd.
注: 関連会社(株)福島県中央計算センター及び関連会社NSD(SINGAPORE) PTE LTD.(休業中)は重要性がないため、系統図には含めておりません。 Note: NSD affiliates : Fukushimaken Chuo Keisan Center Co., Ltd. and NSD (SINGAPORE) PTE LTD. (operations suspended) are not included due to their insignificance.
情報サービス Information services
情報サービス Information services
人材派遣及び情報サービス Staffing and information services
ソフトウエアプロダクト Software products
コンピュータ室運営管理の外注 Subcontract computer room operation and management
ソフトウエア開発のコンサルティング Consultation software development
人材派遣及びコンピュータ室 運営管理等の外注 Subcontract staffing services, computer room operation and management, etc.
ソフトウエア開発の外注 Subcontract software development
情報サービス Information Services
当 社 N S D
得意先 Clients
ソフトウエアプロダクト Software Products
情報サービス及びソフトウエアプロダクト
Information services and softw
are products

4 NIPPON SYSTEM DEVELOPMENT CO., LTD. Business Report 2004
The NSD Group has promoted research and development activities mainly
to improve software development technologies and to provide new solutions
under the basic policy of continuing to search for and research the most
advanced technologies and create IT of the next generation.
An outline of this research and development is as follows.
(1) Research on object-oriented technologies
Because the development of Web applications rapidly became wide-
spread, we conducted research on object-oriented technologies using
frameworks and components to respond to new technologies such as
UML, Java and XML that are necessary for system design and develop-
ment.
To confirm whether or not object-oriented technologies are practical in
large main systems, we verified our object-oriented technologies using
our internal system, and conducted research for commercialization.
(2) Study and research of the most advanced technologies by NSD
AMERICA INC., our U.S. subsidiary
We studied solution packages of the most advanced technologies to
expand our business areas, and conducted development to commercial-
ize the following competitive products in the Japanese market.● MetaPASS, a single sign-on solution of MetaPASS, Inc.● SIA, a PKI appliance using 3-key technologies of SingleSignOn.Net, Inc.● NetSIA, secure single sign-on software using SIA
(3) Establishing technology bases for the improvement of quality and pro-
ductivity (N-BOK, NQR activities)
Project management has a significant influence over productivity of soft-
ware development, and results in improved revenues. Since there is a
limit to project management based on experience, formal and rational
methods must be established. Accordingly, we conducted research on
the latest project management methodologies.
In addition, we conducted research on quality management methods to
improve quality.
(4) Research and development of solution packages
We conducted research and development of LMS (Learning Management
System) as an e-learning platform.
In addition, Identrus Japan, Inc., a subsidiary of the Company, conducted
research and development of electronic signature and verification func-
tions for access control systems and e-mails and for PDF. As a result,
Identrus authentication is now an available product, and its electronic
authentication service is recognized as a global standard.
Research and Development研究開発
当社グループの研究開発活動は、最先端のテクノロジーを常に
模索、研究し、次世代のITを創造することを基本方針に、ソフト
ウエア開発技術力の向上と新たなソリューションを中心に研究開
発を推進してまいりました。
主な研究開発の概要は以下のとおりです。
(1)オブジェクト指向技術研究
Web系アプリケーションの開発が急速に普及し、システム
設計・開発時に必要な、UML、Java、XML等の新しい技術に
対応するためにフレームワーク、コンポーネント等を用いた
オブジェクト指向技術の研究を実施いたしました。
特に大規模な基幹システムの実用性を確認するために、
社内システムにて技術を実証し、商品化に向けた研究を実施
いたしました。
(2) 米国現地法人(NSD AMERICA INC.)による最先端技術
の調査・研究
事業領域の拡大のために最先端技術のソリューション・パ
ッケージを調査し、競争力のある以下の商品を日本市場に対
応させるための開発を実施いたしました。●MetaPASS社のシングルサインオン・ソリューションであ
るMetaPASS●SingleSignOn.Net社の3-key技術によるPKIアプライア
ンスであるSIA● SIAを用いたセキュアなシングルサインオンソフトである
NetSIA
(3) 品質向上・生産性向上に関する技術基盤整備(N-BOK、
NQR活動)
プロジェクト管理の巧拙でソフトウエア開発の生産性が大
きく左右され、収益に大きな影響を及ぼします。経験に基づ
いたプロジェクト管理には限界があるため、合理的な手法の
確立が急務となっております。そこで当グループは最新のプ
ロジェクト管理手法の研究を実施いたしました。
また、品質向上を目的とした品質マネージメント手法の研
究も実施いたしました。
(4) ソリューション・パッケージの研究・開発
e-ラーニング用のプラットフォームとしてLMS(ラーニン
グ・マネジメント・システム)の研究開発を実施いたしました。
また、子会社の日本アイデントラス株式会社にて、国際基
準として通用する電子認証サービスであるアイデントラス認
証の実用化と普及に向けアクセスコントロールシステムやメ
ールの電子署名・検証、PDFの電子署名・検証機能の研究開
発を実施いたしました。

NIPPON SYSTEM DEVELOPMENT CO., LTD. Business Report 2004 5
新日鉄ソリューションズ株式会社との業務提携
市場の多様化や競争激化が進む中で、グローバル化や企業グル
ープの競争力強化等、企業の直面する経営課題は複雑さを増して
きております。これに呼応しシステムニーズは高度化しており、
システムベンダーとしては大型化するシステム開発規模への対
応、システム間連携・統合等複雑化するシステム構成への対応、
更には開発期間の短工期化への対応等により、顧客企業への要請
に的確・迅速に応えていくことが生き残りのキーになってきてお
ります。
日本システムディベロップメントと新日鉄ソリューションズ
は、今回、業務提携により連携を強化し、共同してこうした市場
ニーズへの対応力を強化することといたしました。両者はいずれ
も独立系のシステムインテグレーターであり、日本システムディ
ベロップメントは3,300人、新日鉄ソリューションズが4,200
人、計7,500人の連結人員を全国規模で保有しており、今回の
連携の強化によって動員力の格段の強化を図ります。両社はこれ
まで主として金融分野で協業してまいりましたが、今回の提携に
よりコアアライアンスパートナーとして産業分野等へも協業を拡
大してまいります。今回の提携により、開発から保守・運用のシ
ステムライフサイクルの各フェーズで高度化・大規模化する顧客
ニーズへの対応力を一段と強化いたします。
また、日本システムディベロップメントは、新日鉄ソリューシ
ョンズより開発ツール・開発支援環境に関する開発成果を有償に
て開示・使用許諾を受けることになりました。本成果は、新日鉄
ソリューションズがシステム開発における開発効率の向上、開発
品質の安定、プロジェクト管理水準の高度化、遠隔地での開発連
携等のために開発してきたものです。両社は今後協業するプロジ
ェクト等においてこの開発成果を積極的に活用していく予定で
す。両社のSEが共通の開発手法、開発支援環境で開発を実行す
ることで、一層の開発効率と開発品質の向上を狙います。
社員向けの保育園を開園
2004年5月11日、本社社屋内(大阪市中央区高麗橋3-
3-7 NSDビル)に社員及び関連会社の社員向けの保育園を開
園いたしました。この「NSD保育園」は、男女がともに誇りを
もって職業に従事し、人間らしいゆとりある生活を享受し得るよ
うな雇用関係の確立と福祉の増進のために設立されました。
尚、「NSD保育園」は大阪府内の企業としては初めて、厚生労
働省所轄公益法人である21世紀職業財団の「事業所内託児施設」
として認定を受けております。
Business collaboration with NS Solutions Corporation
Management issues facing companies, such as globalization and the
strengthening of competitive positions of company groups, are increasingly
becoming complex while markets are diversifying, competition is becoming
fierce, and system requirements are becoming more sophisticated. In order
to survive in this environment, system vendors must respond quickly and
accurately to corporate customer requests with large-scale system develop-
ment, complex system configuration such as system coordination and inte-
gration and shorter development periods.
By means of business collaboration, Nippon System Development Co., Ltd.
and NS Solutions Corporation decided to strengthen cooperation and to
jointly respond to these market needs. Both companies are independent
system integrators. With a total of 7,500 employees, who are deployed
nationwide and consisting of 3,300 employees of Nippon System
Development Co., Ltd. and 4,200 employees of NS Solutions Corporation,
both companies will strengthen their deploying power further by solidifying
this cooperation. Both companies have so far cooperated mainly in financial
areas, and will expand their cooperation in industrial areas as well. With this
cooperation, both companies will be able to strengthen their ability to meet
customer needs, which are becoming more sophisticated and larger in scale
on each phase of system lifecycle, ranging from development to mainte-
nance and to operations.
In addition, we have a license agreement with NS Solutions Corporation to
disclose and use development results related to development tools and
development support environments. These results are the ones that NS
Solutions Corporation has developed for improved efficiency of system
development, stable development quality, advanced project management
levels and cooperative development at remote sites. Both companies are
scheduled to utilize these development results for projects, in which they will
cooperate in the future. System engineers of both companies will further
improve development efficiency and quality by using common development
methods and under a common environment for development support.
Opening a day-care center
We opened a day-care center at our head office (NSD Bldg., 3-3-7
Koraibashi, Chuo-ku, Osaka City) for our employees on May 11, 2004. This
“NSD Day-Care Center” was opened to establish a relationship in which all
employees can be proud of their work and have comfortable lives, and to
promote welfare.
Furthermore, the Japan Institute of Workers’ Evolution, a public corporation
of the Ministry of Health, Labour and Welfare acknowledged the “NSD Day-
Care Center” as a “day-care center inside an office.” We are the first compa-
ny in Osaka Prefecture to receive such acknowledgment.
Topicsトピックス
6 NIPPON SYSTEM DEVELOPMENT CO., LTD. Business Report 2004
2004 2003 2002 2001 2000
対売上高比率(%) Ratio to net sales (%)
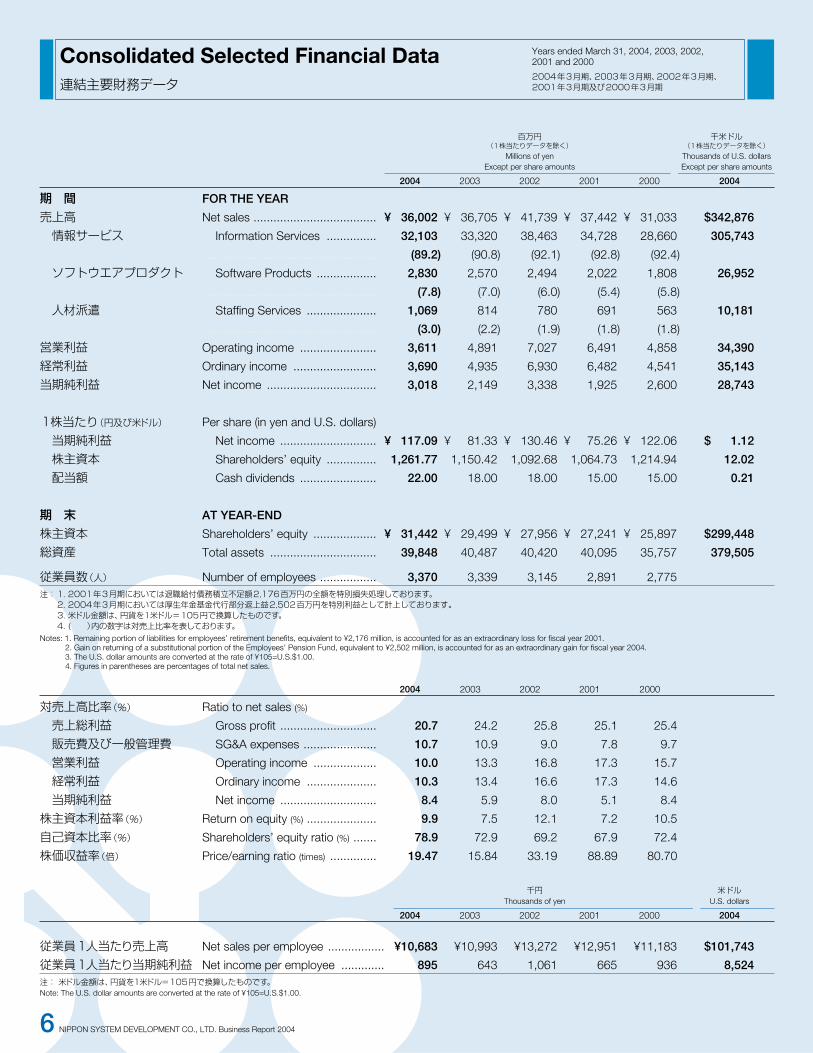
売上総利益 Gross profit ............................. 20.7 24.2 25.8 25.1 25.4
販売費及び一般管理費 SG&A expenses ...................... 10.7 10.9 9.0 7.8 9.7
営業利益 Operating income ................... 10.0 13.3 16.8 17.3 15.7
経常利益 Ordinary income ..................... 10.3 13.4 16.6 17.3 14.6
当期純利益 Net income ............................. 8.4 5.9 8.0 5.1 8.4
株主資本利益率(%) Return on equity (%) ..................... 9.9 7.5 12.1 7.2 10.5
自己資本比率(%) Shareholders’ equity ratio (%) ....... 78.9 72.9 69.2 67.9 72.4
株価収益率(倍) Price/earning ratio (times) .............. 19.47 15.84 33.19 88.89 80.70
千円 米ドルThousands of yen U.S. dollars
2004 2003 2002 2001 2000 2004
従業員1人当たり売上高 Net sales per employee ................. ¥10,683 ¥10,993 ¥13,272 ¥12,951 ¥11,183 $101,743
従業員1人当たり当期純利益 Net income per employee ............. 895 643 1,061 665 936 8,524注: 米ドル金額は、円貨を1米ドル=105円で換算したものです。Note: The U.S. dollar amounts are converted at the rate of ¥105=U.S.$1.00.
百万円 千米ドル(1株当たりデータを除く) (1株当たりデータを除く)
Millions of yen Thousands of U.S. dollarsExcept per share amounts Except per share amounts
2004 2003 2002 2001 2000 2004
期 間 FOR THE YEAR
売上高 Net sales ..................................... ¥ 36,002 ¥ 36,705 ¥ 41,739 ¥ 37,442 ¥ 31,033 $342,876
情報サービス Information Services ............... 32,103 33,320 38,463 34,728 28,660 305,743
.................................................... (89.2) (90.8) (92.1) (92.8) (92.4)
ソフトウエアプロダクト Software Products .................. 2,830 2,570 2,494 2,022 1,808 26,952
.................................................... (7.8) (7.0) (6.0) (5.4) (5.8)
人材派遣 Staffing Services ..................... 1,069 814 780 691 563 10,181
.................................................... (3.0) (2.2) (1.9) (1.8) (1.8)
営業利益 Operating income ....................... 3,611 4,891 7,027 6,491 4,858 34,390
経常利益 Ordinary income ......................... 3,690 4,935 6,930 6,482 4,541 35,143
当期純利益 Net income ................................. 3,018 2,149 3,338 1,925 2,600 28,743
1株当たり(円及び米ドル) Per share (in yen and U.S. dollars)
当期純利益 Net income ............................. ¥ 117.09 ¥ 81.33 ¥ 130.46 ¥ 75.26 ¥ 122.06 $ 1.12
株主資本 Shareholders’ equity ............... 1,261.77 1,150.42 1,092.68 1,064.73 1,214.94 12.02
配当額 Cash dividends ....................... 22.00 18.00 18.00 15.00 15.00 0.21
期 末 AT YEAR-END
株主資本 Shareholders’ equity ................... ¥ 31,442 ¥ 29,499 ¥ 27,956 ¥ 27,241 ¥ 25,897 $299,448
総資産 Total assets ................................ 39,848 40,487 40,420 40,095 35,757 379,505
従業員数(人) Number of employees ................. 3,370 3,339 3,145 2,891 2,775注:1. 2001年3月期においては退職給付債務積立不足額2,176百万円の全額を特別損失処理しております。
2. 2004年3月期においては厚生年金基金代行部分返上益2,502百万円を特別利益として計上しております。3. 米ドル金額は、円貨を1米ドル=105円で換算したものです。4. ( )内の数字は対売上比率を表しております。
Notes: 1. Remaining portion of liabilities for employees’ retirement benefits, equivalent to ¥2,176 million, is accounted for as an extraordinary loss for fiscal year 2001.2. Gain on returning of a substitutional portion of the Employees’ Pension Fund, equivalent to ¥2,502 million, is accounted for as an extraordinary gain for fiscal year 2004.3. The U.S. dollar amounts are converted at the rate of ¥105=U.S.$1.00.4. Figures in parentheses are percentages of total net sales.
Consolidated Selected Financial Data連結主要財務データ
Years ended March 31, 2004, 2003, 2002, 2001 and 2000
2004年3月期、2003年3月期、2002年3月期、2001年3月期及び2000年3月期

NIPPON SYSTEM DEVELOPMENT CO., LTD. Business Report 2004 7
業 績
今日の情報サービス業界は、顧客の業務や経営戦略に密着した
千差万別のソリューションが求められ、そのニーズに応えられる
企業のみが生き残れるという厳しい状況が続いています。このよ
うな状況において、当社は中長期の成長を見据えながら、顧客第
一主義を基本方針として、更なる成長をするための様々な施策を
実行してまいりました。
ソリューション本部及び新規事業開発本部を新設することによ
り、提案営業の推進と事業領域の拡大を図るための組織体制を整
備いたしました。
また、ソリューション事業の拡大のために海外企業とのアライア
ンスを積極的に推進し、ソリューションの品揃えを着実に増やして
おります。米国エブリパス社とは、モバイルソリューションの販売提
携を行い、インターネットバンキングや医薬品メーカ等への売上を
順調に拡大しております。また、国内有力企業との業務提携も積
極的に進め、本年3月には新日鉄ソリューションズ株式会社と業務
提携いたしました。大規模プロジェクトの開発を中心とした両社の
協業体制を確立することにより、高度化・大規模化する顧客ニーズ
への対応力を一段と強化することが可能となりました。
一方、製造原価のより一層の低減等により収益の確保を目指す
とともに価格競争力の強化を図ってまいりました。更にプロジェ
クト運営効率の向上を図るために当社独自のプロジェクト管理手
法(N-BOK)を確立するとともに品質管理体制を強化するため
に生産管理部を新設しております。
しかしながら、上半期に発生したソフトウエア開発プロジェク
トの不採算案件の影響と新規事業の先行投資を拡大していること
から、売上高、営業利益及び経常利益は前年を下回ることになり
ました。尚、当期純利益につきましては、厚生年金基金の代行部
分について過去分返上が認可されたことに伴い25億2百万円を
特別利益として計上いたしましたので、前年に比べて大幅に増益
となっております。
この結果、当期の連結売上高は前期比1.9%減の360億2百
万円、連結営業利益は26.2%減の36億11百万円、連結経常利
益は25.2%減の36億90百万円、連結当期純利益は40.4%増
の30億18百万円となりました。
OPERATING RESULTS
In the information service industry, the business environment remainssevere, as the only companies that can survive the competition arethose which can offer many different solutions that best fit customerbusiness or management strategies. Under these circumstances, wehave implemented various measures to ensure further growth basedon a customer-oriented principle as our basic policy, while closelywatching the medium- and long-term growth.
We recently created the Solution Business Division and New BusinessDevelopment Division and consolidated the system to offer better pro-posals to customers, to promote sales activities and to expand ourbusiness areas.
In order to expand the solution business, we are also steadily expand-ing our lineup of solutions by actively building business alliances withoverseas IT companies. The Company formed a marketing alliancewith Everypath, Inc. of the U.S. for mobile solutions and expanded itssales activities to the Internet Banking sector, pharmaceutical manufac-turers, etc. In addition, the Company successfully conducted businesscollaboration with major domestic companies and made an agreementwith NS Solutions Corporation in March this year. Cooperationbetween the companies mainly for the development of large projectshas strengthened our ability to meet customer needs, which arebecoming more refined and larger in scale.
Meanwhile, we have made efforts to further reduce production costs inorder to secure our profit, as well as to strengthen our price competi-tiveness. To improve the efficiency of our project management, wehave established a unique project management method (N-BOK) andhave set up a new Product Control Department to achieve a morestringent quality-control structure.
However, mainly due to the negative effect of the unprofitable softwaredevelopment projects which occurred in the first half and the expan-sion of prior investments in new businesses, Net sales, operatingincome and ordinary income decreased from the previous fiscal year.Net income increased significantly from the previous year because theCompany posted 2,502 million yen as an extraordinary gain, resultingfrom the approval for returning a substitutional portion of theEmployees’ Pension Fund.
As a result, the Company posted consolidated net sales of 36,002 mil-lion yen, a decrease of 1.9% from the previous fiscal year, consolidatedoperating income of 3,611 million yen, a decrease of 26.2%, consoli-dated ordinary income of 3,690 million yen, a decrease of 25.2%, andconsolidated net income of 3,018 million yen, an increase of 40.4%.
Management’s Discussion and Analysis連結財務分析
'00 '01 '02 '03 '04
当期純利益/Net income(百万円/Millions of yen)
2,600
1,925
3,338
2,149
3,018
'00 '01 '02 '03 '04
営業利益/Operating income(百万円/Millions of yen)
4,858
6,4917,027
4,891
3,611
'00 '01 '02 '03 '04
経常利益/Ordinary income(百万円/Millions of yen)
4,541
6,482 6,930
4,935
3,690

8 NIPPON SYSTEM DEVELOPMENT CO., LTD. Business Report 2004
部門別営業概況
■ 情報サービス部門
情報サービス部門につきましては、従来のシステム開発をより
高効率化する努力をするとともに、将来の顧客システムのあるべ
き姿を考えながら顧客ニーズに合った提案営業を積極的に推進い
たしました。その成果として、製薬業界の品質管理システムや運
輸業界の勤怠管理システム等をユーザーと共同で開発いたしまし
た。これらのシステムにつきましては、他企業への横展開による
拡販を目指し着々と準備を進めております。一方、価格競争力を
高めるために、ソフトウエアの開発にフレームワークの積極活用
を図るとともにプロジェクト管理手法の高度化と社内への浸透を
進めてまいりました。当部門の売上高は、不採算プロジェクトの
発生に伴い一部営業活動が停滞したことから前年を下回りました
が、今後、更に技術力と提案力を強化するとともにソフトウエア
プロダクト部門とのシナジーを高めることによって営業力の強化
を図ってまいります。
当部門の売上高は前期比3.7%減の321億3百万円となり、
全売上高に占める比率は前期比1.6%減の89.2%となりました。
■ソフトウエアプロダクト部門
ソフトウエアプロダクト部門につきましては、ソリューショ
ン・パッケージソフトの品揃えを拡充するために国内外の有力企
業とのアライアンスを引き続き積極的に進めております。また、
安定した顧客基盤と収益基盤を確立するために、新規大口顧客の
獲得に力点を置いた営業活動を推進してまいりました。その結果、
主力のウイルス対策ソフトであるVirus Scanなど既存商品の販
売が好調に推移したことと新規に投入している商品が徐々に売上
高に寄与し始めていることから、部門全体の売上高は前年を上回
ることができました。
当部門の売上高は前期比10.1%増の28億30百万円となり、
全売上高に占める比率は前期比0.8%増の7.8%となりました。
■人材派遣部門
人材派遣部門につきましては、競争が激化しておりますが、既
存顧客に対する積極的な営業努力と地道な新規ユーザーの開拓努
力が効を奏し、増収を確保することができました。
当部門の売上高は、前期比31.3%増の10億69百万円となり、
全売上高に占める比率は前期比0.8%増の3.0%となりました。
'00 '01 '02 '03 '04
部門別売上高/Net sales by division (百万円/Millions of yen)
人材派遣 Staffing services
ソフトウェアプロダクト Software products
情報サービス Information services
5631,808
28,660 34,728
2,022691
38,463
2,494780
33,320 32,103
2,570 2,830
814 1,069
BUSINESS OUTLOOK BY DIVISION
■ Information Services Division
The Information Services Division, along with the continuing efforts tomake the existing system development more efficient and effective, hasactively engaged in proposal and sales activities to fit customer needs.As a result of such efforts, the Company conducted joint developmentwith clients on quality management systems for the pharmaceuticalindustry, work management systems for the transportation industryand other systems. The Company extend sales of these systems toother companies following its success. Meanwhile, in order to improveour price competitiveness, we have utilized more frameworks in soft-ware development, and promoted a more sophisticated internal projectmanagement method. Sales in the division fell below the level achievedin the previous fiscal year because part of its business was delayeddue to unprofitable projects. We intend to strengthen our sales powerby improving our technical expertise, developing proposals to fit cus-tomer needs and enhancing synergies with the Software ProductsDivision.
Sales in the division dropped 3.7% from the previous fiscal year to32,103 million yen. This accounted for 89.2% of the company’s totalsales, down 1.6% from the previous fiscal year.
■ Software Products Division
Aiming to upgrade and expand the lineup of pre-packaged solutionsoftware products, the Software Products Division continues to beactive in promoting alliances with leading IT companies both in Japanand abroad. We have also promoted sales activities with a focus onexploring major customers to establish a stable customer base andprofit base. As a result, sales in the division were higher than that of theprevious fiscal year. Sales of existing products, such as our majorantivirus software, “Virus Scan,” have been doing well, and new prod-ucts have gradually started to increase overall sales.
Sales in the division increased 10.1% from the previous fiscal year to2,830 million yen, accounting for 7.8% of total sales, up 0.8% from theprevious fiscal year.
■ Staffing Services Division
Despite increased competition, the Staffing Services Division markedsales growth as its active sales activities toward existing customersand steady efforts to seek new customers proved successful.
Sales in the division grew 31.3% from the previous fiscal year to 1,069million yen, accounting for 3.0% of total sales, up 0.8% from the previ-ous fiscal year.

NIPPON SYSTEM DEVELOPMENT CO., LTD. Business Report 2004 9
財政状態
■ 資産
当期末の総資産は、前期末比1.6%減の398億48百万円とな
りました。内、流動資産は前期末比10.3%減の198億49百万
円、固定資産は前期末比9.0%増の199億98百万円となりまし
た。
流動資産減少の主な要因は、売上高減少による受取手形及び売
掛金の減少10億30百万円と、短期のCPの期日到来他による有
価証券の減少10億28百万円によるものです。固定資産の内、
有形固定資産は前期末比24.8%増の117億27百万円となりま
した。この主な要因は、当社のIDCセンター兼本社建物取得に係
る資産の増加によるものであります。
投資有価証券は、前期末比64.8%増の35億27百万円となり
ました。この増加の主な要因は上場株式の期末株価上昇によるも
のであります。また、退職給付会計において、厚生年金基金の代
行部分について過去分返上が認可されたこと等により、繰延税金
資産は73.6%減の4億89百万円となりました。
■ 負債
当期末の負債の合計は、前期末比23.9%減の82億76百万円
となりました。内、流動負債は8.4%減の64億65百万円、固定
負債は52.5%減の18億11百万円となりました。流動負債の減
少は、主に未払法人税等の減少(4億73百万円)によるもので、固
定負債の減少は、主に退職給付引当金が減少(21億56百万円)し
たことによるものであります。尚、退職給付引当金の減少は、厚生
年金基金の代行部分の過去分返上認可によるものであります。
■ 資本
当期末の資本は、前期末比6.6%増の314億42百万円となり
ました。自己株式取得による資本の減少(12億28百万円)等が
あったものの、利益剰余金の増加と、その他有価証券評価差額金
の増加により、資本の増加となりました。
FINANCIAL POSITION
■ Assets
The final balance of total current assets was 19,849 million yen,which was down 10.3% from the previous fiscal year-end. Fixedassets stood at 19,998 million yen, up 9.0%, while total assets wereat 39,848 million yen, down 1.6%.
The main reasons for this decrease in current assets are thedecrease of notes receivable and accounts receivable by 1,030 mil-lion yen due to reduced sales, and the decrease of securities by1,028 million yen due to maturation of short-term CPs. Tangiblefixed assets increased 24.8% from the previous fiscal year-end to11,727 million yen, due to the increase in assets related to theacquisition of the Company’s IDC Center/Head Office Building.
Investment securities increased 64.8% from the previous fiscal year-end to 3,527 million yen. The main reason for this increase is a riseof stock market prices at year-end. In addition, deferred tax assetsdecreased 73.6% from the previous fiscal year-end to 489 millionyen mainly because the return of a substitutional portion of theEmployees’ Pension Fund was approved under accounting forretirement benefits.
■ Liabilities
The balance of total liabilities resulted in 8,276 million yen, down23.9% from the previous fiscal year-end. Current liabilitiesdecreased 8.4% from the previous fiscal year-end to 6,465 millionyen. This is mainly attributable to the decrease of 473 million yen inaccrued income taxes from the previous fiscal year-end. Meanwhile,total long-term liabilities was 1,811 million yen, down 52.5% fromthe previous fiscal year-end. This is mainly attributable to thedecrease of 2,156 million yen in reserve for retirement benefits fromthe previous fiscal year-end, resulting from the approval for returninga substitutional portion of the Employees’ Pension Fund.
■ Shareholders’ equity
Shareholders’ equity at fiscal year-end increased 6.6% from the pre-vious year-end to 31,442 million yen. This increase is due to theincreases of retained earnings and net unrealized holding gain onmarketable securities, and due to the decrease of 1,228 million yenin the purchase of treasury stock.
'00 '01 '02 '03 '04
総資産/Total assets(百万円/Millions of yen)
35,75740,095 40,420 40,487 39,848
'00 '01 '02 '03 '04
有利子負債/Interest-bearing debt(百万円/Millions of yen)
2,7932,583
2,043 1,907 1,802
'00 '01 '02 '03 '04
株主資本利益率/Return on equity(%)
10.5
7.2
12.1
7.5
9.9

10 NIPPON SYSTEM DEVELOPMENT CO., LTD. Business Report 2004
利益剰余金は、当期純利益による増加等により前期末比
12.6%増の200億94百万円となりました。また、その他有価
証券評価差額金は7億77百万円増の6億19百万円となりまし
た。
この結果、当期末の自己資本比率は、前期末比6.0%増の
78.9%となりました。当期末の1株当たり純資産額は1,261円
77銭となり、前期末比111円35銭増加いたしました。
キャッシュ・フロー
当期末における現金及び現金同等物は、有形固定資産及び株式
の取得等による支出があったため、前期末に比べ6億91百万円
減少し、97億39百万円となりました。
■営業活動によるキャッシュ・フロー
当期における営業活動による資金の増加は、前期比39.9%増
の43億57百万円となりました。これは、主に法人税等の支払
(21億41百万円)等があったものの、税金等調整前当期純利益
(56億76百万円)及び売上債権の減少(10億23百万円)等が
あったことによるものであります。
■投資活動によるキャッシュ・フロー
当期における投資活動による資金の減少は、前期比117.3%
増の25億79百万円となりました。これは、主に投資有価証券
(4億57百万円)及び有形固定資産(3億45百万円)の売却等
があったものの、有形固定資産(25億89百万円)及び投資有価
証券(5億68百万円)の取得による支出等があったことによる
ものであります。
■財務活動によるキャッシュ・フロー
当期における財務活動による資金の減少は、前期比94.4%増
の23億93百万円となりました。これは、主に自己株式の取得
(12億28百万円)、配当金の支払(4億60百万円)及びファイ
ナンス・リース債務の返済による支出(5億98百万円)等によ
るものであります。
Retained earnings increased 12.6% from the previous year-end to20,094 million yen mainly due to an increase in net income. In addi-tion, net unrealized holding gains on marketable securities increased777 million yen to 619 million yen.
As a result, the capital adequacy rate at year-end increased 6.0%from the previous year-end to 78.9%. Net assets per share at year-end resulted in 1,261.77 yen, an increase of 111.35 yen from theprevious year-end.
CASH FLOWS
Cash and cash equivalents at the end of the year decreased 691million yen from the previous year-end to 9,739 million yen, mainlydue to the acquisition of fixed assets and shares.
■ Cash flows from operating activities
The cash increase resulting from operating activities during the cur-rent year was 4,357 million yen, up 39.9% from the previous year.This increase is mainly attributable to income before income taxesamounting to 5,676 million yen and a decrease of 1,023 million yenin trade receivables, despite income taxes totaling 2,141 million yen.
■ Cash flows from investing activities
The cash decrease resulting from investing activities during the cur-rent year was 2,579 million yen, up 117.3% from the previous year.This decrease is mainly attributable to the disbursement of 2,589million yen for fixed assets and 568 million yen for investment securi-ties, despite the proceeds from sale of investment securities totaling457 million yen and fixed assets totaling 345 million yen.
■ Cash flows from financing activities
The cash decrease resulting from financing activities during the cur-rent year was 2,393 million yen, up 94.4% from the previous year.This decrease is mainly attributable to the acquisition of treasurystock amounting to 1,228 million yen, the payment of cash divi-dends of 460 million yen and the payment for lease receivables of598 million yen.
営業活動による キャッシュ・フロー
投資活動による キャッシュ・フロー
財務活動による キャッシュ・フロー
現金及び現金 同等物の増加額
キャッシュ・フロー/Cash flows(百万円/Millions of yen)
Cash flows from
operating activities
Cash flows from
investing activities
Cash flows from
financing activities
Net increase in cash
and cash equivalents
4,357
(2,579) (2,393)
(691)
'00 '01 '02 '03 '04
株主資本及び比率/ Shareholders’ equity and ratio
(百万円 %/Millions of yen %)
25,897 27,241 27,956 29,499 31,442
72.4 67.9
69.272.9
78.9

NIPPON SYSTEM DEVELOPMENT CO., LTD. Business Report 2004 11
経営成績の分析
■売上高
当期の売上高は、前期比1.9%減の360億2百万円となりま
した。主な要因は、ソフトウエア開発プロジェクトに不採算案件
が発生したことに伴い、営業活動が停滞したことによるものであ
ります。事業部門別では、情報サービス部門の売上高は前期を下
回っていますが、ソフトウエアプロダクト部門及び人材派遣部門
の売上高は前期と比べて増加しております。また、連結子会社の
売上高の単純合計も、前期に比べて増加しております。
■営業利益
当期の営業利益は、前期比26.2%減の36億11百万円となり
ました。主な要因は、ソフトウエア開発プロジェクトに不採算案
件が発生したこと及び、新設子会社での先行投資コストが増大し
たためであります。尚、販売費及び一般管理費は、コストの削減
努力により前期に比べ減少しております。
■営業外損益
当期の営業外収益は、前期比12.6%増の1億23百万円とな
りました。主な要因は、受取配当金及び保険解約金が増加したた
めであります。当期の営業外費用は、前期比31.9%減の44百
万円でした。主な要因は、営業用のリース資産の契約終了に伴い
支払利息が減少したためであります。
■特別損益
当期の特別利益は、前期比25億69百万円増の25億70百万
円でした。主な要因は、厚生年金基金の代行部分について過去分
返上が認可されたことに伴い、25億2百万円を特別利益として
計上したためであります。
当期の特別損失は、前期比28.5%減の5億84百万円でした。
主な要因は、固定資産売却損が1億37百万円、本社移転に伴う
損失が1億34百万円と、たな卸資産処分損が1億8百万円増加
しておりますが、投資有価証券の評価損が6億12百万円と大幅
に減少したためであります。
■当期純利益
当期の当期純利益は、前期比40.4%増の30億18百万円とな
りました。不採算案件の影響等により、経常利益は前期比で12
億45百万円減少しておりますが、特別利益として厚生年金基金
代行部分返上益25億2百万円計上したことにより、当期純利益
は前期比で大幅な増加となっております。
ANALYSIS OF OPERATING RESULTS
■ Net sales
Net sales for the current fiscal year decreased 1.9% from the previ-ous year to 36,002 million yen, mainly because part of our businesswas delayed due to unprofitable projects. Net sales of theInformation Services Division decreased from the previous fiscalyear. Net sales of the Software Products Division and the StaffingServices Division increased from the previous fiscal year. In addition,the total sales of consolidated subsidiaries increased from the previ-ous fiscal year.
■ Operating income
Operating income for the current fiscal year decreased 26.2% fromthe previous year to 3,611 million yen, mainly because some soft-ware development projects were unprofitable and preliminary invest-ment costs for new subsidiaries increased. Selling, general andadministrative expenses decreased from the previous fiscal year asa result of cost reduction efforts.
■ Non-operating income or expenses
Non-operating income for the current fiscal year increased 12.6%from the previous year to 123 million yen, mainly because dividendincome and cancellation of insurance increased. Non-operatingexpenses for the current fiscal year decreased 31.9% from the pre-vious fiscal year to 44 million yen, mainly because interest expensesdecreased as a result of the termination of a finance lease.
■ Extraordinary gains or losses
Extraordinary gains for the current fiscal year increased 2,569 millionyen from the previous year to 2,570 million yen, mainly because anextraordinary gain of 2,502 million yen was posted due to anapproval of the return of a substitutional portion of the Employees’Pension Fund.
Extraordinary losses for the current fiscal year decreased 28.5%from the previous year to 584 million yen, mainly due to a loss fromthe devaluation of investment securities that decreased by 612 mil-lion yen. Losses on sales on fixed assets, the relocation of ourheadquarters office and on the disposal of inventories increased137 million yen, 134 million yen and 108 million yen, respectively.
■ Net income
Net income for the current fiscal year increased 40.4% from the pre-vious year to 3,018 million yen as a result of a gain of 2,502 millionyen on return of a substitutional portion of the Employees’ PensionFund. This was posted as an extraordinary gain, even though ordi-nary income decreased 1,245 million yen from the previous fiscalyear mainly due to the effects of unprofitable projects.

12 NIPPON SYSTEM DEVELOPMENT CO., LTD. Business Report 2004
対処すべき課題
当社グループは、多種多様な高度化・複雑化する顧客ニーズに
即応できる体制を築くことにより、市場を凌駕する成長力と収益
力を確保することが対処すべき課題と考えております。
当面の重点施策は次のとおりです。
(1) 事業領域の拡大
米国を中心とした海外の企業とのアライアンスを積極的に
推進することによって有力なソリューション・パッケージソ
フト並びにIT関連技術の導入を進め、これらを使った新しい
提案営業を推進し、事業領域の拡大を図ります。
(2) 営業力の強化・顧客基盤の拡大
各本部内にセールスプロモーションを行うSP部を新設し、
本部毎にきめ細かな顧客戦略を立案するとともに顧客の立場
に立った提案営業を推進いたします。また、システム基盤本
部を新設する等トータルシステムサービスを提供できる体制
を強化いたします。
(3) プロジェクトマネージメントの強化・品質向上
当社独自のプロジェクト管理手法(N-BOK)の運用強化を
図り、プロジェクトの運営効率と品質管理の向上を目指します。
(4) 人材育成
オブジェクト指向技術(UML、フレームワーク、コンポ
ーネント)の教育に力を入れる等、新技術に対応できるSE
の育成に努めるとともにPMP(国際的なプロジェクトマネ
ージメント資格認定制度)の資格取得を中心とした研修を強
化し管理水準の高いプロジェクトマネージャーの育成に努め
ます。
ISSUES TO BE SOLVED
The NSD Group is focused on securing growth ability and profitabili-ty by establishing a system that can respond rapidly to various kindsof customer needs, which are becoming more sophisticated andcomplex. Important measures are as follows.
(1) Expanding business areas
We will introduce major solution package software and IT-relatedtechnologies by positively promoting alliances with overseascompanies, mainly in the U.S. We will expand business areas bypromoting marketing with new proposals using these softwareand technologies.
(2) Strengthening marketing expertise and expanding customerbases
We will establish the Sales Promotion Department, which con-ducts sales promotion activities, inside each system divisions for-mulate detailed customer strategies for each system divisionsand promote marketing with proposals from the standpoint ofcustomers. In addition, we will strengthen the system which pro-vides total system services mainly by establishing the SystemInfrastracture Business Division.
(3) Strengthening project management and improving its quality
We will strengthen the operation of our own project managementmethod (N-BOK) and aim to improve operational efficiency andquality management of projects.
(4) Personnel training
We will strive to educate system engineers who can respond tonew technologies by focusing on training in object-oriented tech-nologies such as UML, frameworks and components. We willtrain project managers with better management skills by focusingon the training to acquire PMP certification (an accreditation sys-tem for global project management qualification).

NIPPON SYSTEM DEVELOPMENT CO., LTD. Business Report 2004 13
事業等のリスク
当ビジネスレポートに記載した事業の状況、経理の状況等に関
する事項の内、投資者の判断に重要な影響を及ぼす可能性のある
事項には、以下のようなものがあります。また、下記のリスク項
目は影響の程度が高いと判断した項目であり、当社グループに係
る全てのリスクを列挙したものではありません。
(1) 財政状態、経営成績及びキャッシュ・フローの状況の異常な
変動
財政状態、経営成績及びキャッシュ・フローの状況の異常
な変動はありません。但し、当社グループの売上高につきま
しては、顧客の検収が年度の節目である9月及び3月に集中
するため、四半期及び半期毎の経営成績が変動いたします。
また、プロジェクト管理につきましては、当社独自のプロジ
ェクト管理手法(N-BOK)の確立による運営効率の向上と、
生産管理部の新設等により管理体制の強化を図っております
が、大型プロジェクト案件契約の成否及び、個別プロジェク
トの進捗や採算性により、経営成績が変動する可能性があり
ます。
(2) 特有の法的規則・取引慣行・経営方針
①基幹システムの開発や運用を受託していることから、シス
テムトラブルや受託先の個人情報流出等により、受託先から
の損害賠償請求や、当社グループの信用失墜という事態を招
く可能性があります。尚、トラブル対策といたしまして、生
産管理部内に生産・品質管理室を設置するとともに、NQR
(NSD品質管理規定)の導入と定着化によりトラブルの発生
を防止してまいります。また、個人情報の取扱いにつきまし
ては、システム監査専門の子会社に監査を委託し、社内に於
ける個人情報の管理状況を監査しております。
②製品及び技術の複雑化に伴い、製品に対して第三者から知
的所有権の侵害を事由とする訴訟提起を受け、結果、損害賠
償を負担もしくは代替技術の開発等が必要となる可能性があ
りますが、当社では「NSDコンプライアンスマニュアル」
の中に、知的財産権や個人情報の適切な使用方法等について
定め、役員・社員に周知徹底することによりリスクの軽減を
図っております。
(3)新規事業への先行投資
当社グループは、連結子会社において国際基準として通用
する電子認証サービスの実用化等の新規事業を行なっており、
今後この分野の需要が増加するのに伴い業績は順調に拡大す
ると考えておりますが、事業計画の進捗状況等により経営成
績が変動する可能性があります。
BUSINESS AND OTHER RISKS
Matters that are related to business, accounting and other mattersdescribed in this business report and that may have a significantinfluence on investors’ decisions are as follows. Although the follow-ing risk items are considered to be highly influential, they do not rep-resent the all risks of the Company Group.
(1) Unusual changes of financial positions, operating resultsand cash flows
There are no unusual changes of financial positions, operatingresults or cash flow. However, with respect to the CompanyGroup’s sales, operating results change on a quarterly and semi-annual basis. September and March are the key periods in ourfiscal year when inspection is concentratedly conducted.
The Company has striven to improve operational efficiency byestablishing its own project management method (N-BOK). Wehave strengthened our management system by establishing theProduct Control Department. However, operating results maychange depending on the contractual results of large projects, aswell as the progress and profitability of individual projects.
(2) Unique legal restrictions, business customs and practices,and management policies
�The Company Group may receive claims for damages fromclient companies, or lose its credibility due to system trouble andoutflows of personal information of these client companiesbecause it conducts development and operations of main systems of these client companies. As measures against thisrisk, the Company Group will establish the Product QualityControl Unit in the Product Control Department, introduce NQR(NSD quality control regulations) and prevent the occurrence ofproblem by following NQR. The Company Group entrusts auditwork for internal management of personal information to its sub-sidiary specializing in system audits.
�As products and technologies become more complex, lawsuitsmay be brought against the Company Group by a third party onthe grounds that the Company Group has infringed on the intel-lectual property rights of such a third party products. And as aresult of these lawsuits, the Company Group may have to pay fordamages, or develop alternative technologies. However, theCompany Group has reduced risks by specifying proper ways touse intellectual property rights and personal information in the“NSD Compliance Manual,” and by making directors andemployees follow the Manual completely.
(3) Preliminary investments in new business areas
The Company Group’s consolidated subsidiary has conductednew business activities including practicability of electronicauthentication service recognized as a global standard. TheCompany Group expects its business performances to improvesteadily. Demand in this business area will increase in the future.However, operating results may vary depending on the progressof business plans.
14 NIPPON SYSTEM DEVELOPMENT CO., LTD. Business Report 2004
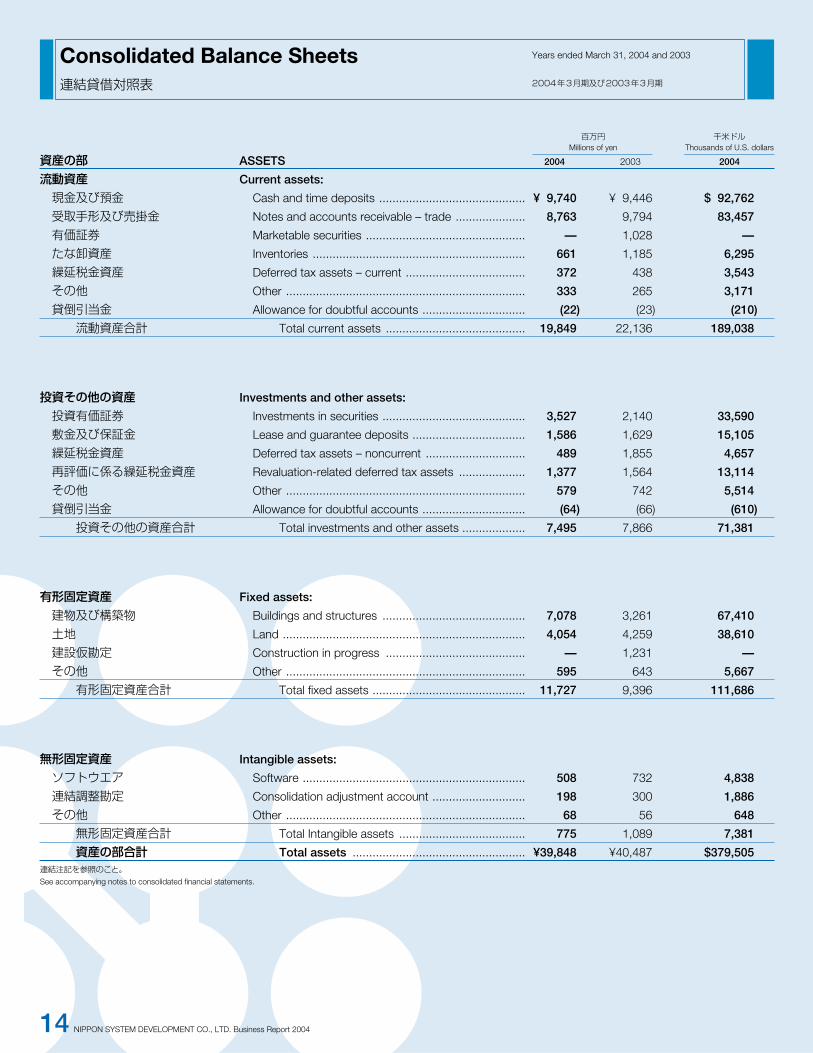
百万円 千米ドルMillions of yen Thousands of U.S. dollars
資産の部 ASSETS 2004 2003 2004
流動資産 Current assets:
現金及び預金 Cash and time deposits ............................................ ¥ 9,740 ¥ 9,446 $ 92,762
受取手形及び売掛金 Notes and accounts receivable – trade ..................... 8,763 9,794 83,457
有価証券 Marketable securities ................................................ — 1,028 —
たな卸資産 Inventories ................................................................ 661 1,185 6,295
繰延税金資産 Deferred tax assets – current .................................... 372 438 3,543
その他 Other ........................................................................ 333 265 3,171
貸倒引当金 Allowance for doubtful accounts ............................... (22) (23) (210)
流動資産合計 Total current assets .......................................... 19,849 22,136 189,038
投資その他の資産 Investments and other assets:
投資有価証券 Investments in securities ........................................... 3,527 2,140 33,590
敷金及び保証金 Lease and guarantee deposits .................................. 1,586 1,629 15,105
繰延税金資産 Deferred tax assets – noncurrent .............................. 489 1,855 4,657
再評価に係る繰延税金資産 Revaluation-related deferred tax assets .................... 1,377 1,564 13,114
その他 Other ........................................................................ 579 742 5,514
貸倒引当金 Allowance for doubtful accounts ............................... (64) (66) (610)
投資その他の資産合計 Total investments and other assets ................... 7,495 7,866 71,381
有形固定資産 Fixed assets:
建物及び構築物 Buildings and structures ........................................... 7,078 3,261 67,410
土地 Land ......................................................................... 4,054 4,259 38,610
建設仮勘定 Construction in progress .......................................... — 1,231 —
その他 Other ........................................................................ 595 643 5,667
有形固定資産合計 Total fixed assets .............................................. 11,727 9,396 111,686
無形固定資産 Intangible assets:
ソフトウエア Software ................................................................... 508 732 4,838
連結調整勘定 Consolidation adjustment account ............................ 198 300 1,886
その他 Other ........................................................................ 68 56 648
無形固定資産合計 Total Intangible assets ...................................... 775 1,089 7,381
資産の部合計 Total assets .................................................... ¥39,848 ¥40,487 $379,505連結注記を参照のこと。See accompanying notes to consolidated financial statements.
Consolidated Balance Sheets連結貸借対照表
Years ended March 31, 2004 and 2003
2004年3月期及び2003年3月期

NIPPON SYSTEM DEVELOPMENT CO., LTD. Business Report 2004 15
百万円 千米ドルMillions of yen Thousands of U.S. dollars
負債及び資本の部 LIABILITIES AND SHAREHOLDERS’ EQUITY 2004 2003 2004
流動負債 Current liabilities:
買掛金 Accounts payable ..................................................... ¥ 1,746 ¥ 1,775 $ 16,629
短期借入金 Short-term loans ...................................................... 1,557 1,835 14,829
未払法人税等 Accrued income and other taxes .............................. 792 1,265 7,543
賞与引当金 Accrued bonuses to employees ............................... 567 588 5,400
その他 Other ........................................................................ 1,801 1,595 17,152
流動負債合計 Total current liablities ........................................ 6,465 7,060 61,571
固定負債 Long-term liabilities:
長期借入金 Long-term debt ........................................................ 244 72 2,324
退職給付引当金 Reserve for retirement benefits ................................. 1,128 3,285 10,743
役員退職慰労引当金 Reserve for retirement benefits for directors and auditors ............................................. 436 452 4,152
繰延税金負債 Deferred tax liabilities ................................................ 0 — 0
固定負債合計 Total long-term liabilities ................................... 1,811 3,810 17,248
負債合計 Total liabilities ................................................... 8,276 10,870 78,819
少数株主持分 Minority interests
少数株主持分 Minority interests ...................................................... 129 118 1,229
資本の部 Shareholders’ equity:
資本金 Common stock
授権株式数—100,000,000株 Authorized — 100,000,000
発行済株式数—25,586,080株 Issued — 25,586,080 ........................................... 7,205 7,205 68,619
資本剰余金 Capital surplus .......................................................... 6,868 6,868 65,410
利益剰余金 Retained earnings ..................................................... 20,094 17,842 191,371
土地再評価差額金 Land revaluation difference ....................................... (2,006) (2,223) (19,105)
その他有価証券評価差額金 Net unrealized holding gain (loss) on marketable securities ......................................... 619 (158) 5,895
為替換算調整勘定 Foreign currency conversion adjustments ................. (99) (24) (943)
自己株式 Treasury stock .......................................................... (1,238) (10) (11,790)
資本合計 Total shareholders’ equity ................................. 31,442 29,499 299,448
負債、少数株主持分及び Total liabilities, minority interests資本合計 and shareholders’ equity ............................. ¥39,848 ¥40,487 $379,505
16 NIPPON SYSTEM DEVELOPMENT CO., LTD. Business Report 2004
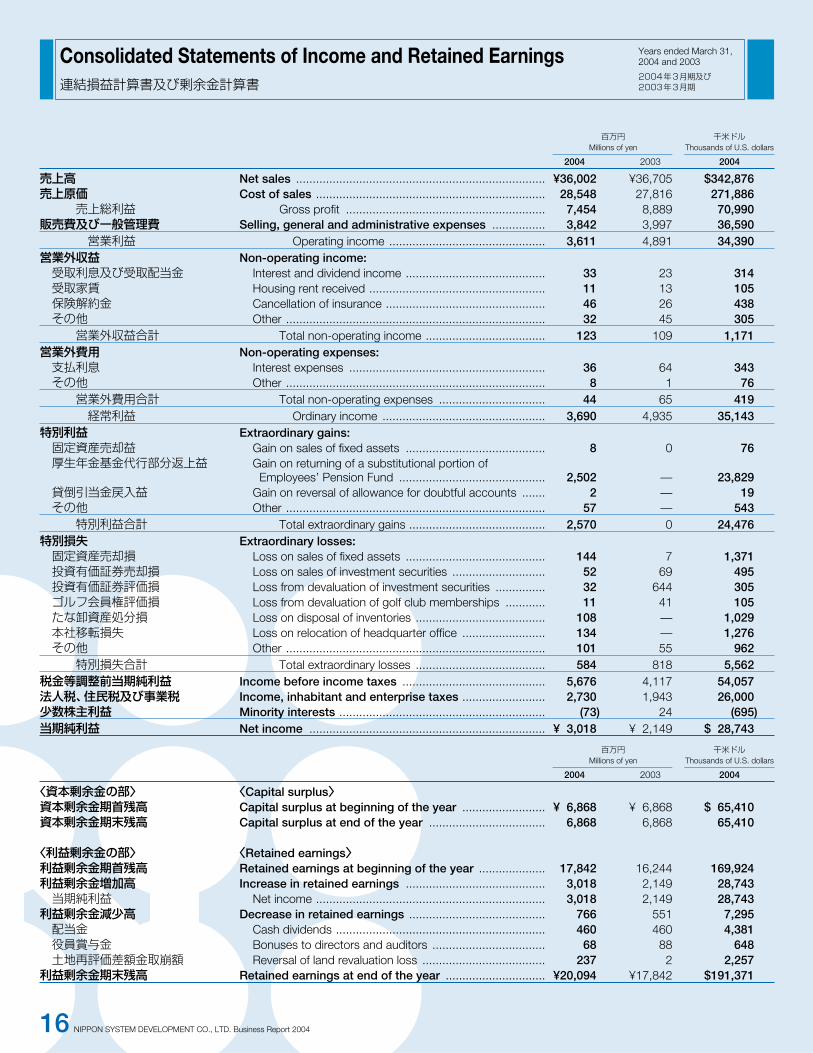
百万円 千米ドルMillions of yen Thousands of U.S. dollars
2004 2003 2004
売上高 Net sales ........................................................................... ¥36,002 ¥36,705 $342,876売上原価 Cost of sales ..................................................................... 28,548 27,816 271,886
売上総利益 Gross profit ............................................................ 7,454 8,889 70,990販売費及び一般管理費 Selling, general and administrative expenses ................ 3,842 3,997 36,590
営業利益 Operating income ............................................... 3,611 4,891 34,390営業外収益 Non-operating income:受取利息及び受取配当金 Interest and dividend income .......................................... 33 23 314受取家賃 Housing rent received ..................................................... 11 13 105保険解約金 Cancellation of insurance ................................................ 46 26 438その他 Other .............................................................................. 32 45 305営業外収益合計 Total non-operating income .................................... 123 109 1,171
営業外費用 Non-operating expenses:支払利息 Interest expenses ........................................................... 36 64 343その他 Other .............................................................................. 8 1 76営業外費用合計 Total non-operating expenses ................................ 44 65 419経常利益 Ordinary income ................................................. 3,690 4,935 35,143
特別利益 Extraordinary gains:固定資産売却益 Gain on sales of fixed assets .......................................... 8 0 76厚生年金基金代行部分返上益 Gain on returning of a substitutional portion of
Employees’ Pension Fund ............................................ 2,502 — 23,829貸倒引当金戻入益 Gain on reversal of allowance for doubtful accounts ....... 2 — 19その他 Other .............................................................................. 57 — 543特別利益合計 Total extraordinary gains ......................................... 2,570 0 24,476
特別損失 Extraordinary losses:固定資産売却損 Loss on sales of fixed assets .......................................... 144 7 1,371投資有価証券売却損 Loss on sales of investment securities ............................ 52 69 495投資有価証券評価損 Loss from devaluation of investment securities ............... 32 644 305ゴルフ会員権評価損 Loss from devaluation of golf club memberships ............ 11 41 105たな卸資産処分損 Loss on disposal of inventories ....................................... 108 — 1,029本社移転損失 Loss on relocation of headquarter office ......................... 134 — 1,276その他 Other .............................................................................. 101 55 962特別損失合計 Total extraordinary losses ....................................... 584 818 5,562
税金等調整前当期純利益 Income before income taxes ........................................... 5,676 4,117 54,057法人税、住民税及び事業税 Income, inhabitant and enterprise taxes ......................... 2,730 1,943 26,000少数株主利益 Minority interests .............................................................. (73) 24 (695)当期純利益 Net income ....................................................................... ¥ 3,018 ¥ 2,149 $ 28,743
百万円 千米ドルMillions of yen Thousands of U.S. dollars
2004 2003 2004
〈資本剰余金の部〉 〈Capital surplus〉資本剰余金期首残高 Capital surplus at beginning of the year ......................... ¥ 6,868 ¥ 6,868 $ 65,410資本剰余金期末残高 Capital surplus at end of the year ................................... 6,868 6,868 65,410
〈利益剰余金の部〉 〈Retained earnings〉利益剰余金期首残高 Retained earnings at beginning of the year .................... 17,842 16,244 169,924利益剰余金増加高 Increase in retained earnings .......................................... 3,018 2,149 28,743当期純利益 Net income ..................................................................... 3,018 2,149 28,743利益剰余金減少高 Decrease in retained earnings ......................................... 766 551 7,295配当金 Cash dividends ............................................................... 460 460 4,381役員賞与金 Bonuses to directors and auditors .................................. 68 88 648土地再評価差額金取崩額 Reversal of land revaluation loss ..................................... 237 2 2,257
利益剰余金期末残高 Retained earnings at end of the year .............................. ¥20,094 ¥17,842 $191,371
Consolidated Statements of Income and Retained Earnings連結損益計算書及び剰余金計算書
Years ended March 31,2004 and 2003
2004年3月期及び2003年3月期

NIPPON SYSTEM DEVELOPMENT CO., LTD. Business Report 2004 17
百万円 千米ドルMillions of yen Thousands of U.S. dollars
2004 2003 2004
営業活動によるキャッシュ・フロー Cash flows from operating activities:税金等調整前当期純利益 Income before income taxes ................................................... ¥ 5,676 ¥ 4,117 $ 54,057減価償却費 Depreciation and amortization ................................................. 1,048 983 9,981連結調整勘定償却額 Amortization of consolidation adjustment accounts ................. 101 104 962貸倒引当金の増加額 Increase in allowance for doubtful accounts ............................ 3 3 29賞与引当金の減少額 Decrease in accrued bonuses ................................................. (20) (65) (190)退職給付引当金の増加額 Increase in reserve for retirement benefits ................................ 346 345 3,295役員退職慰労引当金の減少額 Decrease in reserve for retirement benefits for directors and auditors ....... (15) (167) (143)たな卸資産処分損 Loss on disposal of inventory .................................................. 108 — 1,029 厚生年金基金代行部分返上益 Gain on returning of a substitutional portion of Employees’ Pension Fund.. (2,502) — (23,829)投資有価証券評価損 Loss from devaluation of investment securities ........................ 32 644 305 ゴルフ会員権評価損 Loss from devaluation of golf club memberships ..................... 8 34 76 投資有価証券売却損 Loss on sales of investment securities ..................................... 52 69 495 固定資産売却益 Gain on sale of fixed assets ..................................................... (8) (0) (76)固定資産売却損 Loss on sale of fixed assets ..................................................... 144 7 1,371固定資産除却損 Loss on disposal of fixed assets .............................................. 25 21 238受取利息及び受取配当金 Interest and dividend income ................................................... (33) (23) (314)支払利息 Interest expenses .................................................................... 36 64 343 売上債権の減少額 Decrease in trade receivables .................................................. 1,023 245 9,743たな卸資産の増減額 (Increase) decrease in inventories ............................................ 415 (151) 3,952その他流動資産の増加額 Increase in other current assets ............................................... (69) (63) (657)その他投資等の減少額 Decrease in other investments ................................................ 52 — 495 仕入債務の減少額 Decrease in trade payables ..................................................... (29) (389) (276)未払消費税等の減少額 Decrease in accrued consumption taxes ................................. (117) (123) (1,114)その他流動負債の増減額 Increase (decrease) in other current liabilities ........................... 268 (89) 2,552役員賞与の支払額 Bonuses to directors and auditors ........................................... (68) (88) (648)その他 Other ....................................................................................... 24 (5) 229 小計 Subtotal .............................................................................. 6,502 5,474 61,924 利息及び配当金の受取額 Interest and dividend received ................................................. 33 39 314 利息の支払額 Interest paid ............................................................................ (36) (64) (343)法人税等の支払額 Income taxes paid ................................................................... (2,141) (2,334) (20,390)営業活動によるキャッシュ・フロー Net cash flows provided by operating activities ................... 4,357 3,115 41,495
投資活動によるキャッシュ・フロー Cash flows from investing activities:定期預金の預入による支出 Increase in time deposits ......................................................... (1) (6) (10)定期預金の払戻による収入 Decrease in time deposits ....................................................... 15 489 143 有価証券の売却による収入 Proceeds from sales of marketable securities .......................... 28 103 267 有形固定資産の取得による支出 Purchase of fixed assets ......................................................... (2,589) (1,799) (24,657)有形固定資産の売却による収入 Proceeds from sales of fixed assets ........................................ 345 25 3,286 無形固定資産の取得による支出 Purchase of intangible assets .................................................. (503) (91) (4,790)投資有価証券の取得による支出 Purchase of investment securities ........................................... (568) (424) (5,410)投資有価証券の売却による収入 Proceeds from sales of investment securities .......................... 457 338 4,352関係会社株式の売却による収入 Proceeds from sales of stocks of affiliated companies ............. 82 — 781敷金及び保証金の払戻による収入 Repayment of lease and guarantee deposits ........................... 65 149 619 ゴルフ会員権の売却による収入 Proceeds from sales of golf club memberships ....................... 74 — 705 その他 Other ....................................................................................... 14 26 133 投資活動によるキャッシュ・フロー Net cash flows used in investing activities ............................ (2,579) (1,187) (24,562)
財務活動によるキャッシュ・フロー Cash flows from financing activities:短期借入金の純減少額 Net decrease in short-term loans ............................................ (275) (70) (2,619)長期借入金の借入による収入 Proceeds from long-term debt ................................................ 200 — 1,905長期借入金の返済による支出 Repayment of long-term debt .................................................. (30) (65) (286)ファイナンス・リース債務の返済による支出 Repayment of liabilities for finance leases ................................ (598) (626) (5,695)配当金の支払額 Cash dividends paid ................................................................ (460) (460) (4,381)自己株式の取得による支出 Payment to purchase treasury stock ....................................... (1,228) (6) (11,695)その他 Other ....................................................................................... (1) (1) (10)財務活動によるキャッシュ・フロー Net cash flows used in financing activities ........................... (2,393) (1,231) (22,790)
現金及び現金同等物に係る換算差額 Effects of exchange rate changes on cash and cash equivalents ......... (75) (17) (714)現金及び現金同等物の増減額 Net increase (decrease) in cash and cash equivalents ........... (691) 679 (6,581)現金及び現金同等物の期首残高 Cash and cash equivalents at beginning of the year .............. 10,431 9,751 99,343 現金及び現金同等物の期末残高 Cash and cash equivalents at end of the year ........................ ¥ 9,739 ¥10,431 $ 92,752
Consolidated Statement of Cash Flows連結キャッシュ・フロー計算書
Years ended March 31, 2004 and 2003
2004年3月期及び2003年3月期

Basis of Presenting Consolidated Financial Statements
Summary of Significant Accounting Policies
(1) Valuation standard and method for significant assets(a) Securities
Other securitiesSecurities with fair market value are stated at fair market value based onthe quoted market price as of the fiscal year end. (The related valuationdifferences are directly charged or credited to the shareholders’ equityand cost of securities sold is computed by the moving average method.)Securities without fair market value are stated at cost being determinedby the moving average method.
(b) InventoriesMerchandise is carried by specific cost method.Work in process is also carried by specific cost method.
(2) Depreciation method of significant depreciable assets
(a) Fixed assetsFixed assets are depreciated by declining balance method. However,buildings acquired on and after April 1, 1998 are depreciated by straight-line method, except for building attachments.The range of useful lives is from 3 to 60 years for buildings and structures.
(b) Intangible assetsSoftwareSoftware for sale is amortized based on the larger amount of amortizationamount based on the expected sales volume, or equally allocatedamount over the expected effective periods within three years.Software for internal use is amortized by straight-line method over theexpected available periods within five years.OthersOther intangible assets are amortized by straight-line method.
(c) Other investments are amortized by straight-line method.
(3) Accounting for significant allowances and reserves
(a) Allowance for doubtful accountsTo reserve for loss on doubtful accounts such as trade receivables andloans, etc., general allowances are provided using a rate determined bypast bad debts experience and also specific allowances are provided forthe estimated amounts considered to be uncollectible after reviewing indi-vidual collectibility of certain doubtful accounts.
(b) Accrued bonuses to employeesTo provide for payment of bonuses to employees, accrued bonuses arerecorded in an amount expected to paid.
(c) Reserve for retirement benefitsTo provide for the employees’ retirement benefits, reserve for retirementbenefits is recorded based on the projected retirement benefit obligationsand related pension assets of the current consolidated fiscal year end.Prior service cost is to be charged to expenses from the following consol-idation fiscal year using a straight-line method based on determined years(5-14 years) within average remaining service years of the employeeswhen incurred.
Actuarial differences are to be charged to expenses from the followingconsolidation fiscal year using a straight-line method based on deter-mined years (5-14 years) within average remaining service years of theemployees when incurred.
(Additional Information)
The Company and several of its domestic consolidated subsidiariesobtained the approval of the Minister of Health, Labour and Welfare onMarch 1, 2004 for returning the substitutional portion of the Employees’Pension Fund as a result of the enactment of the defined-contributionpension law.
Notes to Consolidated Financial Statements (Excerpts)連結財務諸表に対する注記(抜粋)
Year ended March 31, 2004
2004年3月期
連結財務諸表作成のための基本となる重要な事項
会計処理基準に関する事項
1.重要な資産の評価基準及び評価方法
(イ)有価証券その他有価証券時価のあるもの:期末日の市場価格等に基づく時価法(評価差額
は全部資本直入法により処理し、売却原価は移動平均法により算定しております)
時価のないもの:移動平均法による原価法
(ロ)たな卸資産商 品:個別法による原価法仕掛品:個別法による原価法
2.重要な減価償却資産の減価償却の方法
(イ)有形固定資産定率法:ただし、平成10年4月1日以降に取得した建物(建物
附属設備は除く)については、定額法によっております。なお、主な耐用年数は以下のとおりであります。
建物及び構築物:3~60年
(ロ)無形固定資産ソフトウエア:市販用ソフトウエアは、見込販売数量に基づく償
却額と見込有効期間(3年以内)の均等配分額のいずれか大きい金額自社利用ソフトウエアは、見込利用可能期間(5年以内)による定額法
その他:定額法
(ハ)その他の投資定額法
3.重要な引当金の計上基準
(イ)貸倒引当金売上債権、貸付金等の貸倒損失に備えるため、一般債権につ
いては貸倒実績率法により計上するほか、貸倒懸念債権等特定の債権については個別に回収可能性を検討し、回収不能見込額を計上しております。
(ロ)賞与引当金従業員に対する賞与支給に備えるため、支給見込額基準によ
り計上しております。
(ハ)退職給付引当金従業員の退職給付に備えるため、当連結会計年度末における
退職給付債務及び年金資産の見込額に基づき計上しております。過去勤務債務は、その発生時の従業員の平均残存勤務期間以
内の一定の年数(5~14年)による定額法により費用処理しております。数理計算上の差異は、その発生時の従業員の平均残存勤務期
間以内の一定の年数(5~14年)による定額法により翌連結会計年度から費用処理することとしております。(追加情報)当社及び一部の国内連結子会社は、確定給付企業年金法の施
行に伴い、厚生年金基金の代行部分について、平成16年3月1日に厚生労働大臣から過去分返上の認可を受けました。
18 NIPPON SYSTEM DEVELOPMENT CO., LTD. Business Report 2004

NIPPON SYSTEM DEVELOPMENT CO., LTD. Business Report 2004 19
当連結会計年度における損益に与える影響額は、特別利益として2,502,624千円計上しております。また、当社及び一部の国内連結子会社は、平成16年3月1日付けで厚生労働大臣より認可を受け、厚生年金基金制度から企業年金基金制度へ移行しております。この新制度への移行に伴い退職給付債務が296,087千円減少しております。当該減少額は過去勤務債務として処理しております。
(ニ)役員退職慰労引当金役員の退職慰労金の支出にあてるため内規に基づく期末要支
給額を計上しております。
連結調整勘定の償却に関する事項
連結調整勘定の償却については、5年間の均等償却を行っております。
〈注記事項〉連結貸借対照表に関する事項土地再評価
当社は、「土地の再評価に関する法律」(平成10年3月31日公布法律第34号)及び「土地の再評価に関する法律の一部を改正する法律」(平成11年3月31日公布法律第24号)に基づき、事業用の土地の再評価を行い、再評価差額から再評価に係る繰延税金資産を控除した金額を土地再評価差額金として資本の部に計上しております。再評価の方法
「土地の再評価に関する法律施行令」(平成10年3月31日公布政令第119号)第2条第5号に定める不動産鑑定士の鑑定評価額による方法及び第2条第3号に定める固定資産税評価額に合理的な調整を行って算定する方法。再評価を行った年月日:平成14年3月31日再評価を行った土地の当期末における時価と再評価後の帳簿価額との差額:△647,169千円連結損益計算書に関する事項固定資産売却益の内容は次のとおりであります。土地及び建物:8,452千円その他:153千円計:8,605千円固定資産売却損の内容は次のとおりであります。土地、建物及び構築物:108,091千円その他:36,725千円計:144,816千円販売費及び一般管理費に含まれる研究開発費は、171,909千円であります。ゴルフ会員権評価損の内容は次のとおりであります。直接評価減額:8,000千円貸倒引当金繰入額:3,000千円計:11,000千円
外貨換算に関する事項
米ドル額は便宜上記載したもので、平成16年3月31日の東京外国為替レート、1米ドル=105円で換算しております。
The effect of this return on income of the current consolidated fiscal yearwas 2,502,624 thousand yen, and this amount was posted as extraordi-nary gains.
In addition, the Company and some of its domestic consolidated sub-sidiaries obtained the approval of the Minister of Health, Labour andWelfare on March 1, 2004 to change from the Employees’ Pension Fundplan to the Corporate Pension Fund plan. As a result of this change to thenew plan, retirement benefit obligations decreased by 296,087 thousandyen. This decrease was posted as past service liabilities.
(d) Reserve for benefits for retired directors and auditorsTo provide for benefits for retired directors and auditors, reserve for bene-fits for retired directors and auditors are recorded in an actual amountneeded on the current fiscal year end based on the company’s regula-tions.
Amortization of Consolidation Adjustments Account
Consolidation adjustment account is amortized uniformly over a five-year period.
Notes to Consolidated Balance Sheets
Revaluation of Land:The Company revaluated its business-use land in accordance with the “LawConcerning Revaluation of Land” (Law No.34 enacted on March 31,1998) and the “Lawto Partially Modify the Law Concerning Revaluation of Land” (Law No.24 enacted onMarch 31,1999), and included in the shareholders’ equity as the land revaluation differ-ence, which is the amount of the revaluation difference minus the revaluation-relateddeferred tax.
Method of revaluation: Method based on the appraisal value by real estate appraisers as specified by Clause 5,Article 2 of the “Enforcement Regulations of the Law Concerning Revaluations of Land”(Ordinance No.119 enacted on March 31,1998), and computation by reasonableadjustment of the fixed asset valuation as specified by Clause 3, Article 2 of the sameOrdinance Date of revaluation: March 31, 2002Difference between market value on the current fiscal year end after revaluation of landand book value after revaluation: (647,169) thousand yen
Notes to Consolidated Statements of Income
The component of gain on sales of fixed assets is as follows.Land and buildings 8,452,000 yenOther 153,000 yenTotal 8,605,000 yen
The component of loss on sales of fixed assets is as follows.Land, buildings and structures 108,091,000 yenOther 36,725,000 yenTotal 144,816,000 yen
Research and development expenses included in the selling, general and administrativeexpenses are 171,909,000 yen.
The component of loss from devaluation of golf club memberships is as follows.Amount of direct devaluation 8,000,000 yenAllowance for doubtful accounts charged to expenses 3,000,000 yenTotal 11,000,000 yen
Foreign Currency Conversion
The U.S. dollar amounts are included solely for convenience and havebeen converted at the rate of ¥105=U.S.$1.00, the exchange rate pre-vailing in the Tokyo foreign exchange market at March 31, 2004.

20 NIPPON SYSTEM DEVELOPMENT CO., LTD. Business Report 2004
百万円 千米ドル(1株当たりデータを除く) (1株当たりデータを除く)
Millions of yen Thousands of U.S. dollarsExcept per share amounts Except per share amounts
2004 2003 2002 2001 2000 2004
期 間 FOR THE YEAR売上高 Net sales ........................................... ¥ 30,912 ¥ 32,567 ¥ 37,095 ¥ 35,196 ¥ 29,230 $294,400営業利益 Operating income .............................. 4,042 5,035 6,890 6,385 4,792 38,495経常利益 Ordinary income ................................ 4,138 5,106 6,785 6,394 4,203 39,410当期純利益 Net income ........................................ 3,342 2,436 3,349 1,905 2,413 31,829
1株当たり(円及び米ドル) Per share (in yen and U.S. dollars)当期純利益 Net income .................................... ¥ 130.61 ¥ 92.85 ¥ 130.91 ¥ 74.50 ¥ 113.29 $ 1.24株主資本 Shareholders’ equity ...................... 1,288.04 1,160.04 1,087.76 1,060.51 1,210.77 12.27配当額 Cash dividends .............................. 22.00 18.00 18.00 15.00 15.00 0.21
期 末 AT YEAR-END株主資本 Shareholders’ equity .......................... ¥ 32,079 ¥ 29,737 ¥ 27,830 ¥ 27,133 ¥ 25,808 $305,514総資産 Total assets ....................................... 38,364 39,417 38,823 39,391 35,296 365,371発行済株式総数(千株) Number of shares issued (in thousands) ... 25,586 25,586 25,586 25,584 21,315注:1. 2001年3月期においては退職給付債務積立不足額2,073百万円の全額を特別損失処理
しております。2. 2004年3月期においては厚生年金基金代行部分返上益2,337百万円を特別利益として計上しております。
3. 米ドル金額は、円貨を1米ドル=105円で換算したものです。
2004 2003 2002 2001 2000
対売上高比率(%) Ratio to net sales (%) 売上総利益 Gross profit .................................... 22.2 25.1 26.7 25.7 25.8 販売費及び一般管理費 SG&A expenses ............................. 9.1 9.6 8.1 7.6 9.4 営業利益 Operating income .......................... 13.1 15.5 18.6 18.1 16.4 経常利益 Ordinary income ............................ 13.4 15.7 18.3 18.2 14.4当期純利益 Net income .................................... 10.8 7.5 9.0 5.4 8.3
総資産利益率(%) Return on assets (%) ........................... 8.7 6.2 8.6 4.8 6.8 株主資本利益率(%) Return on equity (%) ............................ 10.8 8.5 12.2 7.2 9.8 配当性向(%) Payout ratio (%) ................................... 16.8 19.4 13.7 20.1 13.2 株主資本配当率(%) Dividends to equity (%) ........................ 1.7 1.5 1.7 1.4 1.2 インタレストカバレッジ(倍) Interest coverage ratio (times) ............... 159.8 89.7 78.4 54.4 38.1
千円 米ドルThousands of yen U.S. dollars
2004 2003 2002 2001 2000 2004
従業員1人当たり売上高 Net sales per employee ..................... ¥13,769 ¥15,176 ¥17,174 ¥14,882 ¥12,502 $131,133従業員1人当たり当期純利益 Net income per employee .................. 1,489 1,135 1,550 805 1,032 14,181注:米ドル金額は、円貨を1米ドル=105円で換算したものです。 Note: The U.S. dollar amounts are converted at the rate of ¥105=U.S.$1.00.
Notes: 1. The remaining portion of liabilities for employees’ retirement benefits, equivalent to ¥2,073 million, is accounted for as an extraordinary loss as of fiscal 2001.
2. Gain on returning of a substitutional portion of the Employees' Pension Fund, equivalent to¥2,337 million, is accounted for as an extraordinary gain for fiscal year 2004.
3. The U.S. dollar amounts are converted at the rate of ¥105=U.S.$1.00.
(百万円/Millions of yen)
'00 '01 '02 '03 '04
営業利益、経常利益、当期純利益/Operating income, Ordinary income and Net income
4,203
6,394 6,785
5,106 4,138
2,4131,905
3,3492,436 3,342
4,792
6,3856,890
5,035
4,042
営業利益/Operating income
経常利益/Ordinary income
当期純利益/Net income
'00 '01 '02 '03 '04
部門別売上高/Net sales by division (百万円/Millions of yen)
ソフトウエアプロダクト Software products
コンピュータ室運営管理 Facilities management
ソフトウエア開発 Software development
24,855
2,6791,695
1,9252,813
30,457
2,0872,940
32,067
2,052
2,792
27,722
2,713
25,985
2,212
'00 '01 '02 '03 '04
業種別売上高/Net sales by user industry (百万円/Millions of yen) (除くソフトウエアプロダクト売上/Except sales of Software products)
その他/Others商業/Commercials官公庁/Public Services製造/Manufacturingサービス/Services運輸・通信/Transportation &
Telecommunication金融/Financial Institutions
'00 '01 '02 '03 '04
売上高/Net sales (百万円/Millions of yen)
29,230
35,196 37,09532,567 30,912
Non-Consolidated Selected Financial Data単独主要財務データ
Years ended March 31, 2004, 2003, 2002, 2001 and 2000
2004年3月期、2003年3月期、2002年3月期、2001年3月期及び2000年3月期

NIPPON SYSTEM DEVELOPMENT CO., LTD. Business Report 2004 21
百万円 千米ドルMillions of yen Thousands of U.S. dollars
2004 2003 2002 2001 2000 2004
期 間 FOR THE YEAR部門別売上高 Net sales by division:ソフトウエア開発 Software development ................... ¥25,985 ¥27,722 ¥32,067 ¥30,457 ¥24,855 $247,476
....................................................... (84.1) (85.1) (86.5) (86.5) (85.0)コンピュータ室運営管理 Facilities management ................... 2,713 2,792 2,940 2,813 2,679 25,838
....................................................... (8.8) (8.6) (7.9) (8.0) (9.2)ソフトウエアプロダクト Software products ......................... 2,212 2,052 2,087 1,925 1,695 21,067
....................................................... (7.1) (6.3) (5.6) (5.5) (5.8)合計 Total .......................................... 30,912 32,567 37,095 35,196 29,230 294,400
........................................................... (100.0) (100.0) (100.0) (100.0) (100.0)業種別売上構成(%) Net sales by user industry (%):金融 Financial Institutions ....................... 39.7 39.5 42.0 38.9 31.8製造 Manufacturing ................................ 18.6 16.7 17.2 18.6 14.1サービス Services ......................................... 18.1 20.3 16.5 15.5 17.0運輸・通信 Transportation & Telecommunication ..... 13.4 13.0 13.5 14.7 18.2官公庁 Public Services ............................... 5.1 5.4 4.8 6.4 10.7商業 Commercials ................................. 3.0 2.7 4.2 3.7 4.1その他 Others ........................................... 2.1 2.4 1.8 2.2 4.1合計 Total .......................................... 100.0 100.0 100.0 100.0 100.0
期末従業員数 Number of employees at year-end ..... 2,245 2,146 2,160 2,365 2,338次期新規採用者数 Number of recruits for the next year ... 187 297 195 207 185注:1. 米ドル金額は、円貨を1米ドル=105円で換算したものです。
2. ( )内の数値は対売上比率を表しております。3. 業績別売上構成はソフトウエアプロダクトを除いた売上高の割合を表しております。
百万円 千米ドルMillions of yen Thousands of U.S. dollars
2004 2003 2002 2001 2000 2004
期 間 FOR THE YEAR売上原価 Cost of sales:労務費 Personnel costs ............................. ¥13,590 ¥13,058 ¥13,955 ¥14,645 ¥13,395 $129,429
....................................................... (62.0) (57.0) (54.4) (59.6) (64.7)外注費 Subcontracting costs:ソフトウエア開発 Software development ............... 4,099 5,507 7,055 6,285 3,967 39,038
............................................... [15.8] [19.9] [22.0] [20.6] [16.0]コンピュータ室運営管理 Facilities management ............... 2,042 1,988 2,068 857 658 19,448
................................................... [75.3] [71.2] [70.3] [30.5] [24.6]合計 Total ...................................... 6,142 7,495 9,123 7,143 4,625 58,495
........................................................... (28.0) (32.7) (35.6) (29.1) (22.3)賃借料 Rental costs .................................. 763 869 929 1,065 977 7,267
........................................................... (3.5) (3.8) (3.6) (4.3) (4.7)情報サービス売上原価 Cost of information services ........... 22,328 22,771 25,517 24,588 20,330 212,648商品売上原価 Cost of products sold .................... 1,723 1,622 1,656 1,572 1,363 16,410
合計 Total ...................................... 24,051 24,393 27,174 26,161 21,694 229,057販売費及び一般管理費 Selling, general and administrative
expenses:労務費 Personnel costs ............................. ¥ 1,466 ¥ 1,639 ¥ 1,505 ¥ 1,398 ¥ 1,411 $ 13,962採用教育費 Educational costs ...................... 41 94 86 56 54 390賃借料 Rental costs .................................. 430 496 553 422 429 4,095
合計 Total ...................................... 2,818 3,138 3,030 2,649 2,744 26,838設備投資額 Capital expenditure ............................ ¥ 3,357 ¥ 1,794 ¥ 2,645 ¥ 1,168 ¥ 1,253 $ 31,971減価償却費 Depreciation and amortization ........... 947 951 949 942 964 9,019注:1. 米ドル金額は、円貨を1米ドル=105円で換算したものです。
2. ( )内の数値は、情報サービス当期発生原価に対する比率を表しております。3. [ ]内の数値は、部門別売上原価に対する比率を表しております。
Notes: 1. The U.S. dollar amounts are converted at the rate of ¥105=U.S.$1.00.2. Figures in parentheses are percentages of costs incurred from information services for the current year.3. Figures in square brackets are percentages of divisional costs incurred.
Notes: 1. The U.S. dollar amounts are converted at the rate of ¥105=U.S.$1.00.2. Figures in parentheses are percentages of total net sales.3. Figures of net sales by user industry are percentages of sales exclusive of Software products.

22 NIPPON SYSTEM DEVELOPMENT CO., LTD. Business Report 2004
百万円 千米ドルMillions of yen Thousands of U.S. dollars
資産の部 ASSETS 2004 2003 2004流動資産 Current assets:現金及び預金 Cash and time deposits ........................................................ ¥ 8,351 ¥ 7,655 $ 79,533 受取手形 Notes receivable — trade ..................................................... 66 58 629売掛金 Accounts receivable — trade ................................................ 7,410 8,813 70,571有価証券 Marketable securities ............................................................ — 1,028 —商品 Merchandise ......................................................................... 56 145 533仕掛品 Work in process ................................................................... 523 995 4,981 繰延税金資産 Deferred tax assets — current .............................................. 306 393 2,914その他 Other .................................................................................... 355 438 3,381貸倒引当金 Allowance for doubtful accounts ........................................... (15) (17) (143)流動資産合計 Total current assets ...................................................... 17,055 19,509 162,429
投資及びその他の資産 Investments and other assets:関係会社株式 Investments in equity of affiliated companies ......................... 2,323 2,505 22,124 投資有価証券 Investments in securities ....................................................... 3,401 2,033 32,390関係会社長期貸付金 Long-term loan for affiliated companies ................................ 525 — 5,000入会金 Admission fees ..................................................................... 204 301 1,943 敷金及び保証金 Lease and guarantee deposits .............................................. 1,500 1,558 14,286保険積立金 Insurance reserve ................................................................. 310 346 2,952繰延税金資産 Deferred tax assets — noncurrent ........................................ 593 1,880 5,648再評価に係る繰延税金資産 Revaluation-related deferred tax assets ................................ 1,377 1,564 13,114 その他 Other .................................................................................... 37 44 352 貸倒引当金 Allowance for doubtful accounts ........................................... (559) (46) (5,324)投資及びその他の資産合計 Total investments and other assets ............................... 9,715 10,190 92,524
有形固定資産 Fixed assets:建物 Buildings ............................................................................... 6,854 3,057 65,276 構築物 Structures ............................................................................. 114 46 1,086 車両運搬具 Vehicles and carriers ............................................................. 6 10 57 工具器具及び備品 Tools, furniture and fixtures ................................................... 551 592 5,248 土地 Land ..................................................................................... 3,885 4,054 37,000建設仮勘定 Construction in progress ...................................................... — 1,231 —有形固定資産合計 Total fixed assets .......................................................... 11,411 8,991 108,676
無形固定資産 Intangible assets:借地権 Land lease rights .................................................................. — 34 —ソフトウエア Software ............................................................................... 164 673 1,562 その他 Other .................................................................................... 16 17 152無形固定資産合計 Total intangible assets .................................................. 181 725 1,724資産の部合計 Total assets ................................................................ ¥38,364 ¥39,417 $365,371
負債及び資本の部 LIABILITIES AND SHAREHOLDERS’ EQUITY
流動負債 Current liabilities:買掛金 Accounts payable–trade ....................................................... ¥ 1,425 ¥ 1,728 $ 13,571短期借入金 Short-term loans ................................................................... 1,080 1,080 10,286未払金 Accounts payable–other ....................................................... 1,188 953 11,314未払費用 Accrued expenses ................................................................ 49 50 467未払法人税等 Accrued income taxes .......................................................... 592 1,198 5,638 未払消費税等 Accrued consumption taxes ................................................. 40 176 381前受金 Advance received ................................................................. 17 17 162預り金 Deposits received ................................................................. 96 77 914 賞与引当金 Accrued bonuses to employees ............................................ 454 464 4,324その他 Other .................................................................................... 39 39 371流動負債合計 Total current liablities .................................................... 4,985 5,787 47,476
固定負債 Long-term liabilities:退職給付引当金 Reserve for retirement benefits ............................................. 902 3,098 8,590役員退職慰労引当金 Reserve for retirement benefits for directors and auditors ..... 395 416 3,762 債務保証損失引当金 Allowance for losses from acceptances and guarantees ....... — 378 —固定負債合計 Total long-term liabilities ............................................... 1,298 3,893 12,362負債合計 Total liabilities ............................................................... 6,284 9,680 59,848
資本の部 Shareholders’ equity:資本金 Common stock ..................................................................... 7,205 7,205 68,619 資本剰余金 Capital surplus ...................................................................... 6,868 6,868 65,410 資本準備金 Additional paid-in capital ................................................... 6,868 6,868 65,410その他資本剰余金 Other additional surplus .................................................... 0 — 0自己株式処分差益 Earnings from disposal of treasury stock ....................... 0 — 0
利益剰余金 Retained earnings ................................................................. 20,627 18,043 196,448 利益準備金 Earned reserve ................................................................. 409 409 3,895 プログラム等準備金 Voluntary reserve for software programming ..................... 31 44 295固定資産圧縮積立金 Reserve for compression of fixed assets ........................... 78 79 743 別途積立金 Contingent reserve ........................................................... 8,250 6,250 78,571当期未処分利益 Unappropriated retained earnings ..................................... 11,857 11,259 112,924 土地再評価差額金 Land revaluation difference ................................................... (2,006) (2,223) (19,105)その他有価証券評価差額金 Net unrealized holding gain (loss) on marketable securities ... 623 (145) 5,933 自己株式 Treasury stock ...................................................................... (1,238) (10) (11,790)資本合計 Total shareholders’ equity ............................................. 32,079 29,737 305,514負債及び資本合計 Total liabilities, and shareholders’ equity .................. ¥38,364 ¥39,417 $365,371
Non-Consolidated Balance Sheets単独貸借対照表
Years ended March 31, 2004 and 2003
2004年3月期及び2003年3月期

NIPPON SYSTEM DEVELOPMENT CO., LTD. Business Report 2004 23
百万円 千米ドルMillions of yen Thousands of U.S. dollars
2004 2003 2004
売上高 Net sales ........................................................................... ¥30,912 ¥32,567 $294,400売上原価 Cost of sales ..................................................................... 24,051 24,393 229,057
売上総利益 Gross profit ............................................................ 6,860 8,173 65,333 販売費及び一般管理費 Selling, general and administrative expenses ................ 2,818 3,138 26,838
営業利益 Operating income ............................................... 4,042 5,035 38,495 営業外収益 Non-operating income:受取利息及び受取配当金 Interest and dividend income .......................................... 40 27 381受取家賃 Housing rent received ..................................................... 15 27 143保険解約金 Cancellation of insurance ................................................ 46 26 438雑収入 Other .............................................................................. 27 46 257営業外収益合計 Total non-operating income .................................... 130 127 1,238
営業外費用 Non-operating expenses:支払利息 Interest expenses ........................................................... 25 56 238 雑損失 Other .............................................................................. 8 0 76 営業外費用合計 Total non-operating expenses ................................ 33 56 314 経常利益 Ordinary income ................................................. 4,138 5,106 39,410
特別利益 Extraordinary gains:固定資産売却益 Gain on sales of fixed assets .......................................... 8 0 76 貸倒引当金戻入益 Gain on reversal of allowance for doubtful accounts ......... 2 0 19 厚生年金基金代行部分返上益 Gain on returing of a substitutional portion of
Employees’ Pension Fund ............................................ 2,337 — 22,257 その他 Other .............................................................................. 57 — 543 特別利益合計 Total extraordinary gains ......................................... 2,406 1 22,914
特別損失 Extraordinary losses:固定資産売却損 Loss on sales of fixed assets .......................................... 85 7 810 固定資産除却損 Loss on disposal of fixed assets ..................................... 24 21 229 投資有価証券売却損 Loss on sales of investment securities ............................ 58 69 552 投資有価証券評価損 Loss from devaluation of investment securities ............... 32 644 305 ゴルフ会員権評価損 Loss from devaluation of golf club memberships ............ 7 41 67 たな卸資産処分損 Loss on disposal of inventories ....................................... 108 — 1,029関係会社整理損 Loss on dissolution of affiliated company ........................ 228 — 2,171 本社移転損失 Loss on relocation of headquarter office ......................... 134 — 1,276 その他 Other .............................................................................. 65 19 619特別損失合計 Total extraordinary losses ....................................... 746 803 7,105
税引前当期純利益 Income before income taxes ........................................... 5,798 4,303 55,219法人税、住民税及び事業税 Income, inhabitant and enterprise taxes ......................... 2,455 1,867 23,381当期純利益 Net income ....................................................................... 3,342 2,436 31,829 前期繰越利益 Retained earnings brought forward ................................ 8,752 8,825 83,352 土地再評価差額金取崩額 Reversal of revaluation of surplus of land ....................... (237) (2) (2,257)当期未処分利益 Unappropriated retained earnings .................................. ¥11,857 ¥11,259 $112,924
百万円 千米ドルMillions of yen Thousands of U.S. dollars
2004 2003 2004
当期未処分利益 Unappropriated retained earnings .................................. ¥11,857 ¥11,259 $112,924プログラム等準備金取崩額 Transfer from voluntary reserve for software programming .... 13 13 124固定資産圧縮積立金取崩額 Transfer from reserve for compression of fixed assets .. 1 1 10合計 Total ............................................................................... 11,873 11,275 113,076利益処分額 Appropriations:配当金 Cash dividends ............................................................... 547 460 5,210役員賞与金 Bonuses to directors and auditors .................................. 54 61 514任意積立金 Voluntary reserve プログラム等準備金 Voluntary reserve for software programming ............... 0 0 0固定資産圧縮積立金 Reserve for compression of fixed assets ..................... 0 0 0別途積立金 Special reserve ........................................................... 2,000 2,000 19,048
次期繰越利益 Unappropriated retained earnings carried forward ................. ¥ 9,271 ¥ 8,752 $ 88,295
Non-Consolidated Statements of Income and Appropriations単独損益計算書及び利益処分計算書
Years ended March 31,2004 and 2003
2004年3月期及び2003年3月期

HEAD OFFICES
Osaka
3-3-7 Koraibashi, Chuo-ku, Osaka 541-0043TEL: (06) 7731-4600FAX: (06) 7731-0228
Tokyo
2-7-1 Nishi-shinjuku, Shinjuku-ku, Tokyo 163-0777TEL: (03) 3342-2981FAX: (03) 3342-2987
BRANCH OFFICES
Mito
1-3-35 Minami-machi, Mito, Ibaraki 310-0021TEL: (029) 227-6588FAX: (029) 227-6578
Nagoya
3-1-1 Sakae, Naka-ku, Nagoya,Aichi 460-0008TEL: (052) 261-0111FAX: (052) 261-0113
Fukuoka
1-4-1 Hakataekimae, Hakata-ku,Fukuoka-shi 812-0011TEL: (092) 481-2320FAX: (092) 475-3723
SALES OFFICES
Fujisawa
2-6-1 Kugenumaishigami, Fujisawa, Kanagawa 251-0025TEL: (0466) 28-6211FAX: (0466) 28-6266
Hamamatsu
110-5 Itaya-cho, Hamamatsu, Shizuoka 430-0928TEL: (053) 455-3151
CONSOLIDATED DOMESTIC
SUBSIDIARIES
Nippon Technical Service Co., Ltd.3-3-7 Koraibashi, Chuo-ku, Osaka 541-0043
Shonan Information Service Co., Ltd.2-6-1 Kugenumaishigami, Fujisawa,Kanagawa 251-0025
Link Concept Corporation4-8 Kouji-machi, Chiyoda-ku, Tokyo 102-0083
Identrus Japan, Inc.2-7-1 Nishi-shinjuku, Shinjuku-ku, Tokyo 163-0716
NSD System Service Co., Ltd.3-3-7 Koraibashi, Chuo-ku, Osaka 541-0043
Nippon Sangyo System Co., Ltd.3-1-15 Kousei-cho, Okayama 700-0985
Fukushima Sougo Keisan Center Co., Ltd.3-168 Uchigomimaya-machi, Iwaki, Fukushima 973-8402
D•Access Co., Ltd.54-6 Oh-machi, Uchigotakasaka-machi, Iwaki,Fukushima 973-8408
NI Consulting Co., Ltd.5-2-1 Momoyamadai, Suita, Osaka 565-0854
InterWorld Corporation Japan K.K.2-7-1 Nishi-shinjuku, Shinjuku-ku, Tokyo 163-0716
NSD Kyushu Co., Ltd.1-4-1 Hakataekimae, Hakata-ku, Fukuoka 812-0011
NSD System Institute Co., Ltd.2-7-1 Nishi-shinjuku, Shinjuku-ku, Tokyo 163-0716
CONSOLIDATED OVERSEAS
SUBSIDIARIES
NSD AMERICA INC.1500 Fashion Island Boulevard. Suite 201, San Mateo, California 94404 U.S.A.URL: http://www.nsdamerica.com
NSD SECURITY, INC.
1500 Fashion Island Boulevard. Suite 201, San Mateo, California 94404 U.S.A.URL: http://www.nsdsecurity.com
本 社
〒541-0043大阪市中央区高麗橋3-3-7TEL:(06)7731-4600FAX:(06)7731-0228
東京本社
〒163-0777東京都新宿区西新宿2-7-1TEL:(03)3342-2981FAX:(03)3342-2987
支 店
水戸支店
〒310-0021茨城県水戸市南町1-3-35TEL:(029)227-6588FAX:(029)227-6578
名古屋支店
〒460-0008愛知県名古屋市中区栄3-1-1TEL:(052)261-0111FAX:(052)261-0113
福岡支店
〒812-0011福岡市博多区博多駅前1-4-1TEL:(092)481-2320FAX:(092)475-3723
事業所
藤沢事業所
〒251-0025神奈川県藤沢市鵠沼石上2-6-1TEL:(0466)28-6211FAX:(0466)28-6266
浜松事業所
〒430-0928
静岡県浜松市板屋町110-5
TEL:(053)455-3151
国内連結子会社
日本テクニカルサービス株式会社
〒541-0043大阪市中央区高麗橋3-3-7
湘南情報サービス株式会社
〒251-0025神奈川県藤沢市鵠沼石上2-6-1
株式会社リンク・コンセプト
〒102-0083東京都千代田区麹町4-8
日本アイデントラス株式会社
〒163-0716東京都新宿区西新宿2-7-1
エヌ・エス・ディシステムサービス株式会社
〒541-0043大阪市中央区高麗橋3-3-7
日本産業システム株式会社
〒700-0985岡山市厚生町3-1-15
株式会社福島総合計算センター
〒973-8402福島県いわき市内郷御厩町3-168
株式会社ディ・アクセス
〒973-8408福島県いわき市内郷高坂町大町54-6
エヌ・アイ・コンサルティング株式会社
〒565-0854大阪府吹田市桃山台5-2-1
日本インターワールド株式会社
〒163-0716東京都新宿区西新宿2-7-1
エヌ・エス・ディ九州株式会社
〒812-0011福岡市博多区博多駅前1-4-1
株式会社エヌ・エス・ディシステム研究所
〒163-0716東京都新宿区西新宿2-7-1
海外連結子会社
NSD AMERICA INC.
1500 Fashion Island Boulevard. Suite 201,
San Mateo, California 94404 U.S.A.
NSD SECURITY, INC.
1500 Fashion Island Boulevard. Suite 201,
San Mateo, California 94404 U.S.A.
24 NIPPON SYSTEM DEVELOPMENT CO., LTD. Business Report 2004
NSD Group Directory事業所及び子会社一覧
As of March 31, 2004
2004年3月31日現在

NIPPON SYSTEM DEVELOPMENT CO., LTD. Business Report 2004 25
代表取締役社長小岸 勲
取締役副社長木田 祐巨
専務取締役橋田 昌彦冲中 一郎
常務取締役増田 宏韶
取締役橋本 弘坂井 裕大澤 康宏江口 信也梅原 幸雄森 隆宏竹井 一茂
監査役山田 哲夫綿貫 尚紅山 壽西垣 良三
注)山田、綿貫は常勤監査役
President and Chief Executive Officer: Isao Ogishi
Deputy President: Yukyo Kida
Senior Managing Directors: Masahiko HashidaIchiro Okinaka
Managing Director: Hiroaki Masuda
Directors: Hiromu HashimotoHiroshi SakaiYasuhiro OsawaShinya EguchiYukio UmeharaTakahiro MoriKazumo Takei
Corporate Auditors: Tetsuo Yamada*Hisashi Watanuki*Hisashi BeniyamaRyozo Nishigaki
*Full-time corporate auditors
Board of Directors and Auditors取締役及び監査役
As of June 29, 2004
2004年6月29日現在
Corporate Data会社概要
As of March 31, 2004
2004年3月31日現在
会社名
株式会社 日本システムディベロップメント
設 立
昭和44年4月8日
資本金
7,205,864,914円
株式数
会社が発行する株式の総数:100,000,000株
発 行 済 株 式 総 数: 25,586,080株
大株主(2004年3月31日現在)
日本マスタートラスト信託銀行株式会社
大同生命保険株式会社
アイ・ピー・シー株式会社
大東 和子
日本トラスティ・サービス信託銀行株式会社
株主数(2004年3月31日現在)
8,495名
上場証券取引所名
東京証券取引所 市場第一部
大阪証券取引所 市場第一部
従業員数(2004年3月31日現在)
2,245名
Name of Company: NIPPON SYSTEM DEVELOPMENT CO., LTD.
Foundation: April 8, 1969
Capital: 7,205,864,914 yen
Number of Shares: Authorized: 100,000,000Outstanding: 025,586,080
Major Shareholders (as of March 31, 2004):The Master Trust Bank of Japan, Ltd.Daido Life Insurance CompanyI.P.C. Co., Ltd.Kazuko DaitohJapan Trustee Services Bank, Ltd.
Number of Shareholders (as of March 31, 2004):8,495
Stock Listing: Tokyo Stock Exchange, 1st SectionOsaka Stock Exchange, 1st Section
Number of Employees (as of March 31, 2004):2,245
取締役社長 小岸 勲Isao Ogishi, President & CEO
免責事項
本ビジネスレポートは、当社の業績及びグループ事業戦略に関する情報の提供を目的としたものであり、当社及び当グループ会社の株式の購入や売却を勧誘するものではありません。本レポートの内容には、将来の業績に関する意見や予測等の情報を掲載することがありますが、これらの情報は、現時点の当社の判断に基づいて作成されております。よって、その実現・達成を約束するものではなく、また今後、予告なしに変更されることがあります。本レポート利用の結果生じたいかなる損害についても、当社は一切責任を負いません。また、本レポートの無断での複製、転送等を行わないようにお願い致します。
Disclaimer
This Business Report is intended to provide information about thebusiness performance and strategy of Nippon SystemDevelopment Co., Ltd. (NSD) and the NSD Group. It is not intend-ed and should not be construed as an inducement to purchase orsell stock in NSD or NSD Group companies. Statements in thispresentation that are not historical facts are forward-looking state-ments, based on the current beliefs, estimates and expectations ofmanagement. As these beliefs, estimates and expectations aresubject to a number of risks, uncertainties, and assumptions, actu-al results may be materially different. NSD undertakes no obligationto update any forward-looking statements, and shall in no event beliable for any damages arising out of the use or interpretation of thismaterial. Please refrain from copying, disseminating or distributingthis material without the prior consent of NSD.

Printed in Japan
Osaka Head Office3-3-7 Koraibashi, Chuo-ku, Osaka 541-0043, JapanPhone: 81-6-7731-4600F a x : 81-6-7731-0228URL: http://www.nsd.co.jp/
Tokyo Head OfficeDaiichi Seimei Bldg.16F 2-7-1 Nishishinjuku, Shinjuku-ku, Tokyo 163-0777, JapanPhone: 81-3-3342-2981F a x : 81-3-3342-2987