Embed Size (px)
Citation preview
Bus
ines
s Pr
oces
s M
anag
emen
t -
Qua
ntita
tive
November 2013 Alberto Abelló & Oscar Romero 1
Business Process Management - Quantitative
Bus
ines
s Pr
oces
s M
anag
emen
t -
Qua
ntita
tive
November 2013 Alberto Abelló & Oscar Romero 2
Knowledge objectives 1. Recognize the importance of measuring processes 2. Enumerate the four performance measures 3. Enumerate different measures of time 4. Enumerate different kinds of cost 5. Distinguish quality measures regarding process and product 6. Enumerate what flexibility can affect 7. Explain the correlation between the four performance measures 8. Enumerate three process analysis techniques 9. Explain the drawbacks of flow analysis 10. Explain the drawbacks of queue theory 11. Explain the drawbacks of process simulation 12. Explain what cycle time efficiency is 13. Explain Little’s formula 14. Explain the reasons to have queues 15. Identify the statistical distribution of the time between the arrival
of jobs to a process 16. Enumerate the process simulation steps

Bus
ines
s Pr
oces
s M
anag
emen
t -
Qua
ntita
tive
Understanding Objectives
1. Recognize when flow analysis cannot be performed
2. Given a process model and its statistics, calculate its cycle time efficiency
3. Given a process model and its statistics, calculate the length of its queues, work-in-progress, cycle time, and the average time of a job in a queue
4. Given a process model, its statistics, and a list of jobs, simulate their execution
November 2013 Alberto Abelló & Oscar Romero 3
Bus
ines
s Pr
oces
s M
anag
emen
t -
Qua
ntita
tive
Key Performance Indicators
“I often say that when you can measure what you are speaking about, and express it in numbers, you know something about it; but when you cannot express it in numbers, your knowledge is of a meagre and unsatisfactory kind; it may be the beginning of knowledge, but you have scarcely, in your thoughts, advanced to the stage of science, whatever the matter may be.”
Lord Kelvin, 1883
November 2013 Alberto Abelló & Oscar Romero 4
Bus
ines
s Pr
oces
s M
anag
emen
t -
Qua
ntita
tive
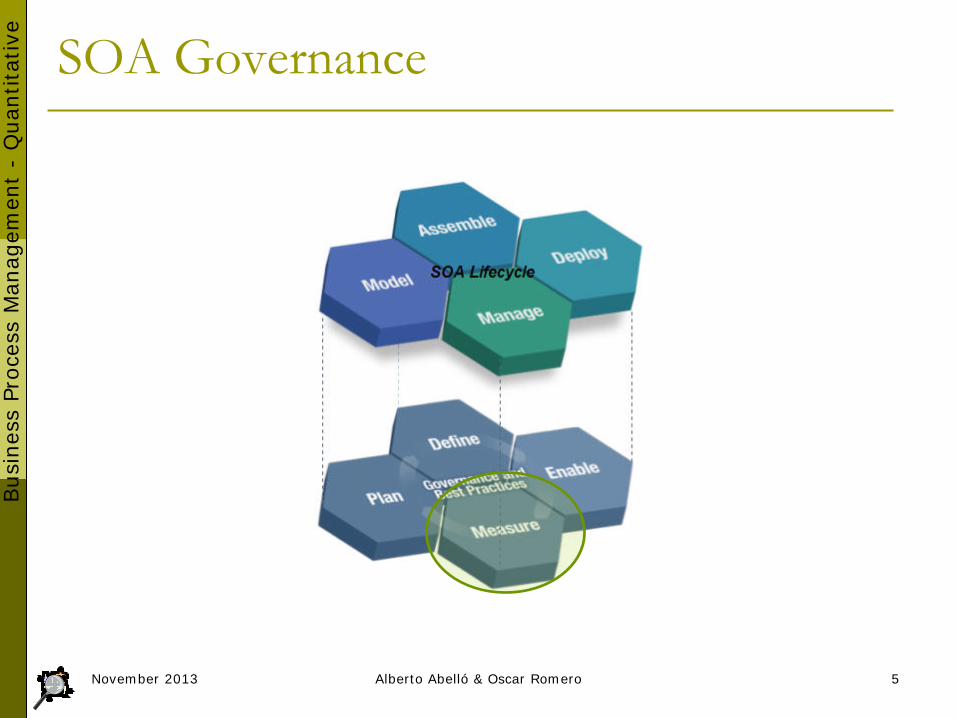
SOA Governance
November 2013 Alberto Abelló & Oscar Romero 5
Bus
ines
s Pr
oces
s M
anag
emen
t -
Qua
ntita
tive
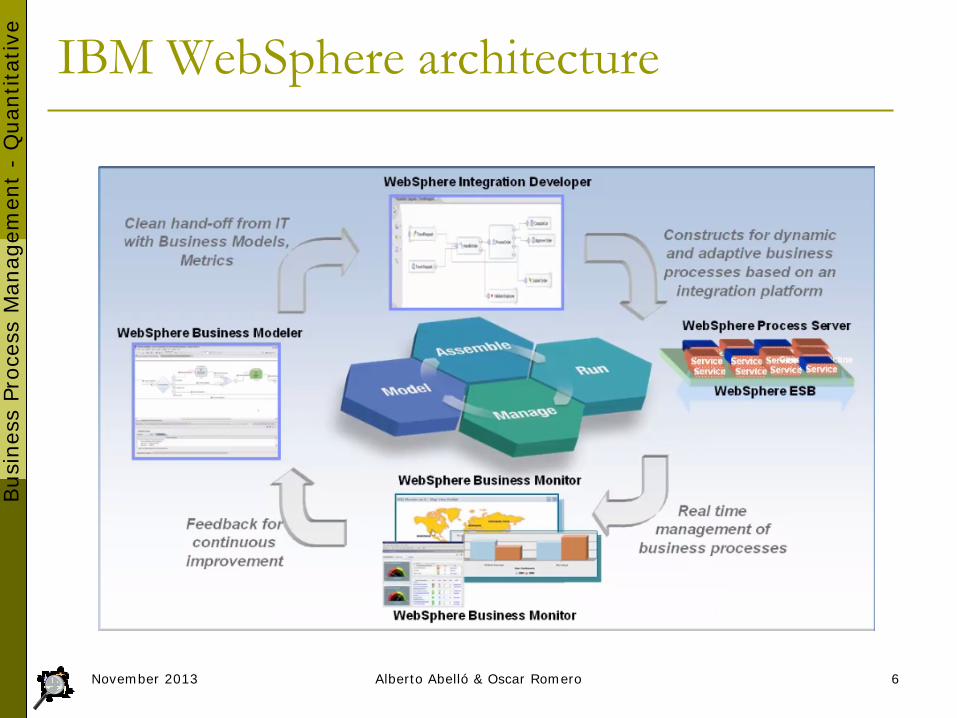
IBM WebSphere architecture
November 2013 Alberto Abelló & Oscar Romero 6

Bus
ines
s Pr
oces
s M
anag
emen
t -
Qua
ntita
tive
Performance measures: Time
Cycle/Flow/Lead time (latency) Processing/Service time Waiting time
Queuing time Contention (limited capacity) External communication (waiting for client/partner)
Synchronization time
Transport time
November 2013 Alberto Abelló & Oscar Romero 7
Bus
ines
s Pr
oces
s M
anag
emen
t -
Qua
ntita
tive
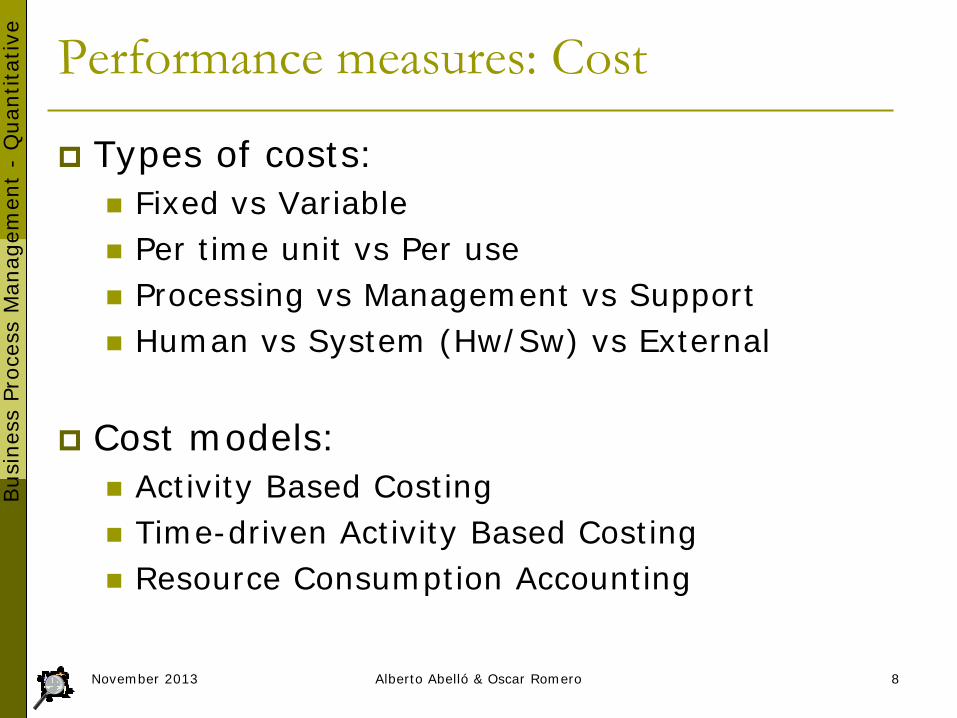
Performance measures: Cost
Types of costs: Fixed vs Variable Per time unit vs Per use Processing vs Management vs Support Human vs System (Hw/Sw) vs External
Cost models:
Activity Based Costing Time-driven Activity Based Costing Resource Consumption Accounting
November 2013 Alberto Abelló & Oscar Romero 8

Bus
ines
s Pr
oces
s M
anag
emen
t -
Qua
ntita
tive
Performance measures: Quality
Product Product meets specifications Promises made to customers and (reasonable)
customer expectations are met Satisfaction questionnaires Number of complaints
Process
Data and documents are handled correctly Decisions made in the process are correct Correct & timely information is provided to the
customer
November 2013 Alberto Abelló & Oscar Romero 9

Bus
ines
s Pr
oces
s M
anag
emen
t -
Qua
ntita
tive
Performance measures: Flexibility
Ability to react to changes Flexibility of
Resources Ability to execute many tasks/new tasks
Process Ability to handle various cases and changing
workloads Management
Ability to change rules/allocation Organization
Ability to change the structure and responsiveness to demands of market or business partners
November 2013 Alberto Abelló & Oscar Romero 10

Bus
ines
s Pr
oces
s M
anag
emen
t -
Qua
ntita
tive
The Devil’s Quadrangle
November 2013 Alberto Abelló & Oscar Romero 11
Improve average Improve variance Improve perception Increase ability to meet objectives
From http://fundamentals-of-bpm.org/

Bus
ines
s Pr
oces
s M
anag
emen
t -
Qua
ntita
tive
Process Analysis Techniques
Quantitative Flow Analysis Does not consider waiting times due to
resource contention Queuing Theory
Helps to balance the cost of increased capacity against the gains of increased productivity and service
Process Simulation (Play out) General purpose (measures any KPI) Risk of oversimplifying
Behavior of resources Cost model
November 2013 Alberto Abelló & Oscar Romero 12

Bus
ines
s Pr
oces
s M
anag
emen
t -
Qua
ntita
tive
Flow Analysis Definitions:
Cycle time: Difference between a job’s start and end time Cycle time analysis: the task of calculating the average
cycle time for an entire process or fragment Activity time = waiting time + processing time
Assumptions: The average activity times for all involved activities are
available In the simplest case a process consists of a list of
activities on a sequential path The average cycle time is the sum of the average activity
times … but in general we must be able to account for
Alternative paths (XOR splits) Parallel paths (AND splits) Rework (cycles)
November 2013 13 Alberto Abelló & Oscar Romero
From http://fundamentals-of-bpm.org/

Bus
ines
s Pr
oces
s M
anag
emen
t -
Qua
ntita
tive
Alternative Paths
CTalternative = p1T1+p2T2+…+pnTn =
piTii=1
n
∑
From http://fundamentals-of-bpm.org/ Inspired by a slide by Manuel Laguna & John Marklund
November 2013 14 Alberto Abelló & Oscar Romero

Bus
ines
s Pr
oces
s M
anag
emen
t -
Qua
ntita
tive
Parallel Paths
CTparallel = Max{T1, T2,…, TM}
From http://fundamentals-of-bpm.org/ Inspired by a slide by Manuel Laguna & John Marklund
November 2013 15 Alberto Abelló & Oscar Romero

Bus
ines
s Pr
oces
s M
anag
emen
t -
Qua
ntita
tive
Rework
CTrework = T/(1-r)
November 2013 16 Alberto Abelló & Oscar Romero
From http://fundamentals-of-bpm.org/

Bus
ines
s Pr
oces
s M
anag
emen
t -
Qua
ntita
tive
Rework example
November 2013 Alberto Abelló & Oscar Romero 17
Unitary cost: 20Rework probability: 0,2Expected iterations: 1,25Expected cost: 25
Iteration Probability Added cost Cummulative1 0,8 16 162 0,16 6,4 22,43 0,032 1,92 24,324 0,0064 0,512 24,8325 0,00128 0,128 24,96006 0,000256 0,03072 24,990727 0,0000512 0,007168 24,9978888 0,00001024 0,0016384 24,99952649 0,000002048 0,00036864 24,999895010 4,096E-07 0,000081920 24,9999770
From http://fundamentals-of-bpm.org/

Bus
ines
s Pr
oces
s M
anag
emen
t -
Qua
ntita
tive
Measured as the percentage of the total cycle time spent on value adding activities
CT = cycle time as defined before Theoretical Cycle Time (TCT) = cycle time if we
only counted value-adding activities and excluded any waiting time or handover time Count only processing times
Cycle Time Efficiency
Cycle Time Efficiency = CT
TimeCyclelTheoretica
November 2013 18 Alberto Abelló & Oscar Romero
From http://fundamentals-of-bpm.org/ Inspired by a slide by Manuel Laguna & John Marklund
Bus
ines
s Pr
oces
s M
anag
emen
t -
Qua
ntita
tive
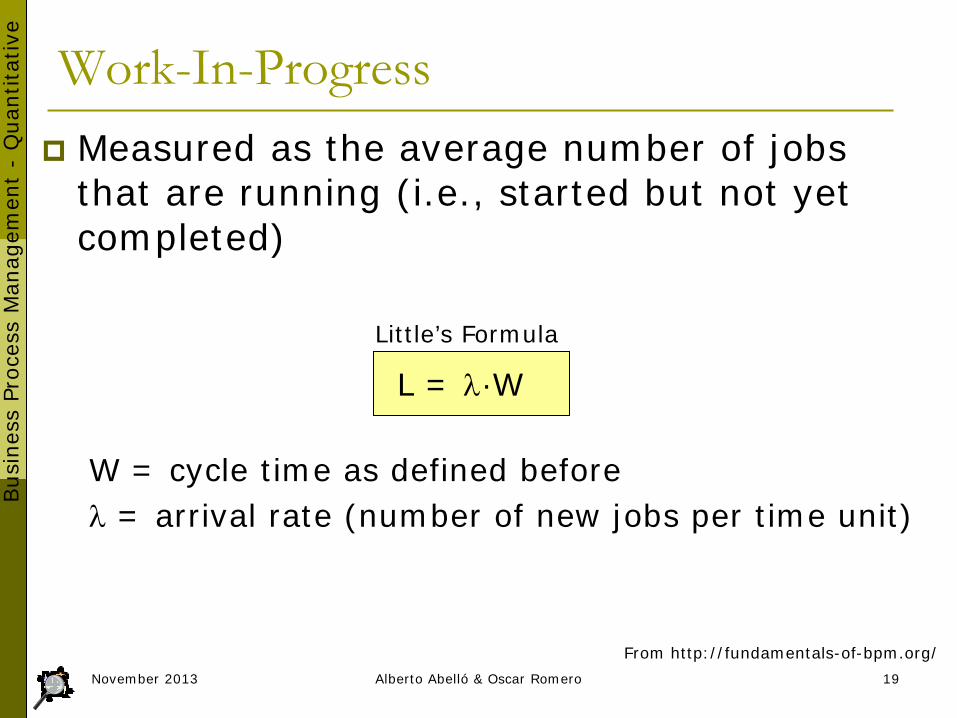
Measured as the average number of jobs that are running (i.e., started but not yet completed)
W = cycle time as defined before λ = arrival rate (number of new jobs per time unit)
Work-In-Progress
November 2013 19 Alberto Abelló & Oscar Romero
From http://fundamentals-of-bpm.org/
L = λ·W Little’s Formula

Bus
ines
s Pr
oces
s M
anag
emen
t -
Qua
ntita
tive
Flow Analysis discussion Generalization:
Calculating cost-per-process-instance Calculating error rates at the process level Estimating capacity requirements
Limitations Cycle time analysis does not consider waiting times
due to resource contention Queuing analysis and simulation address these
limitations and have a broader applicability Cannot be applied to all flows
November 2013 20 Alberto Abelló & Oscar Romero
From http://fundamentals-of-bpm.org/
Start End
Check for completeness Perform checks Make decision
Deliver card
Receive review request
Request infoReceive info
Notify acceptance
Notify rejection Time out
complete? Decide
review request
Yes
No
reject
reviiew
accept

Bus
ines
s Pr
oces
s M
anag
emen
t -
Qua
ntita
tive
Delay is Caused by Job Interference
Deterministic traffic
Variable but spaced apart traffic
November 2013 21 Alberto Abelló & Oscar Romero
From http://fundamentals-of-bpm.org/
Deterministic arrivals, variable job sizes
Bursty traffic
High utilization
Bus
ines
s Pr
oces
s M
anag
emen
t -
Qua
ntita
tive
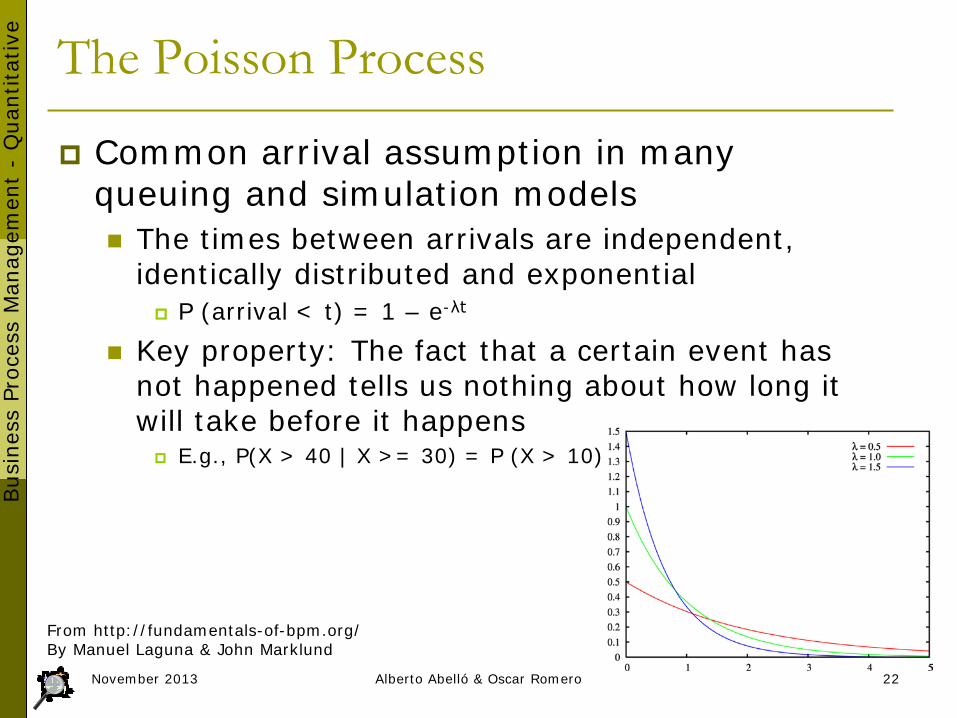
The Poisson Process
Common arrival assumption in many queuing and simulation models The times between arrivals are independent,
identically distributed and exponential P (arrival < t) = 1 – e-λt
Key property: The fact that a certain event has not happened tells us nothing about how long it will take before it happens E.g., P(X > 40 | X >= 30) = P (X > 10)
November 2013 22 Alberto Abelló & Oscar Romero
From http://fundamentals-of-bpm.org/ By Manuel Laguna & John Marklund

Bus
ines
s Pr
oces
s M
anag
emen
t -
Qua
ntita
tive
Queuing theory basics
Given λ , µ and c, we can calculate : ρ = occupation rate Wq = average time in the queue W = average time in the system (i.e. CT) Lq = average jobs in the queue (i.e. length of queue) L = average jobs in the system (i.e. WIP)
λ µ
c
Wq, Lq
W, L
November 2013 23 Alberto Abelló & Oscar Romero
From http://fundamentals-of-bpm.org/ By Wil van der Aalst
λ (mean arrival rate) = average number of arrivals per time unit
µ (mean service rate) = average number of jobs that can be handled by one server per time unit
c = number of servers

Bus
ines
s Pr
oces
s M
anag
emen
t -
Qua
ntita
tive
M/M/1 queue
L=ρ/(1- ρ) Lq= ρ2/(1-ρ) = L-ρ W=L/λ=1/(µ- λ) Wq=Lq/λ= λ /(µ(µ-λ))
μλ
CapacityAvailableDemandCapacityρ ==
November 2013 24 Alberto Abelló & Oscar Romero
From http://fundamentals-of-bpm.org/ By Manuel Laguna & John Marklund
λ µ
1
Wq, Lq
W, L

Bus
ines
s Pr
oces
s M
anag
emen
t -
Qua
ntita
tive
µλ
==ρ*cCapacityAvailable
DemandCapacity
Little’s Formula ⇒ Wq=Lq/λ W=Wq+(1/µ)
Little’s Formula ⇒ L=λW
November 2013 25 Alberto Abelló & Oscar Romero
From http://fundamentals-of-bpm.org/ By Manuel Laguna & John Marklund
λ µ
c
Wq, Lq
W, L
M/M/c queue

Bus
ines
s Pr
oces
s M
anag
emen
t -
Qua
ntita
tive
Drawbacks of queuing theory: Generally not applicable when system includes parallel
activities Requires case-by-case mathematical analysis Assumes “steady-state” (valid only for “long-term”
analysis) Process simulation is more versatile
Run a large number of process instances, gather data (cost, duration, resource usage) and calculate statistics from the output
Process Simulation
November 2013 26 Alberto Abelló & Oscar Romero
From http://fundamentals-of-bpm.org/
Bus
ines
s Pr
oces
s M
anag
emen
t -
Qua
ntita
tive
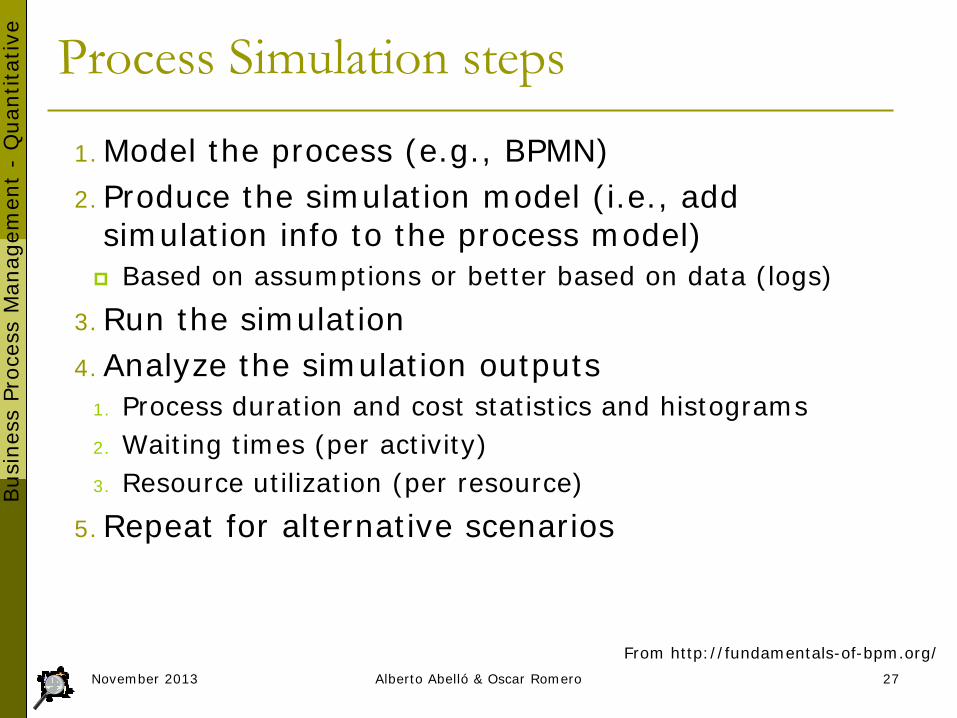
Process Simulation steps
1. Model the process (e.g., BPMN) 2. Produce the simulation model (i.e., add
simulation info to the process model) Based on assumptions or better based on data (logs)
3. Run the simulation 4. Analyze the simulation outputs
1. Process duration and cost statistics and histograms 2. Waiting times (per activity) 3. Resource utilization (per resource)
5. Repeat for alternative scenarios
November 2013 27 Alberto Abelló & Oscar Romero
From http://fundamentals-of-bpm.org/

Bus
ines
s Pr
oces
s M
anag
emen
t -
Qua
ntita
tive
Elements of a simulation model The process model including:
Events, activities, control-flow relations (i.e., flows, gateways)
Resource classes (i.e., swimlanes) Resource assignment
Mapping from activities to resource classes Processing times
Per activity or per activity-resource pair Costs
Per activity and/or per activity-resource pair Arrival rate of process instances Conditional branching probabilities (XOR gateways)
November 2013 28 Alberto Abelló & Oscar Romero
From http://fundamentals-of-bpm.org/
Bus
ines
s Pr
oces
s M
anag
emen
t -
Qua
ntita
tive
Activity
Objective: Understand the three process analysis techniques
Tasks: 1.(10’) Individually solve one exercise 2.(15’) Explain the solution to the others 3.Hand in the three solutions
Roles for the team-mates during task 2:
a)Explains his/her material b)Asks for clarification of blur concepts c)Mediates and controls time
November 2013 Alberto Abelló & Oscar Romero 29
Bus
ines
s Pr
oces
s M
anag
emen
t -
Qua
ntita
tive
November 2013 Alberto Abelló & Oscar Romero 30
Summary
Process performance measures Time Cost Quality Flexibility
Flow analysis Queue theory Process simulation
Bus
ines
s Pr
oces
s M
anag
emen
t -
Qua
ntita
tive
Bibliography
M. Dumas et al. Fundamentals of business process management. Springer, 2013
W. van der Aalst. Process mining : discovery, conformance and enhancement of business processes. Springer, 2011
B.D. Clinton and A. van del Merwe. Management Accounting: approaches, Techniques, and Management processes. Cost management, 20(3), 2006
November 2013 Alberto Abelló & Oscar Romero 31

Bus
ines
s Pr
oces
s M
anag
emen
t -
Qua
ntita
tive
Resources
Related to process simulation ITP Commerce Process Modeler for Visio Progress Savvion Process Modeler IBM Websphere Business Modeler Oracle BPA ARIS ProSim Signavio
November 2013 Alberto Abelló & Oscar Romero 32