Embed Size (px)
Citation preview

Business Objects X4
Introductory Procedure Guide
Version 1.0- August, 2012

PB University August, 2012 2
Business Objects X4
Table of Contents
Introduction ............................................................................................................................................................. 3
Logon .................................................................................................................................................................... 3
PBEDIS Home Page ............................................................................................................................................... 4
Documents Tab ........................................................................................................................................................ 5
My Documents ..................................................................................................................................................... 6
Viewing Existing Documents .................................................................................................................................... 7
Page Navigation and Basic Features ..................................................................................................................... 8
Exporting to Excel ................................................................................................................................................. 9
Creating a New Document ..................................................................................................................................... 10
Using the Query Panel ........................................................................................................................................ 11
Adding Result Objects ........................................................................................................................................ 12
Adding Query Filters ........................................................................................................................................... 13
Running a Query ................................................................................................................................................. 14
Viewing and Editing a Document ........................................................................................................................... 15
Saving a Report Document ................................................................................................................................. 16
Sending a Report Document to Another User .................................................................................................... 17
Editing Documents Using Tabs ........................................................................................................................... 18
Adding Data Elements ........................................................................................................................................ 19
Formatting a Document ..................................................................................................................................... 20
Sorting and Adding Breaks to a Document ......................................................................................................... 21
Adding Functions ................................................................................................................................................ 23
Adding Filters ..................................................................................................................................................... 24
Function and Filter Example ............................................................................................................................... 25
Purging Data ....................................................................................................................................................... 25
Tracking Changes................................................................................................................................................ 26

PB University August, 2012 3
Introduction
This document outlines the key features and functions of the Business Objects X4 system. Emphasis is placed on
the most commonly used screens and procedures in an effort to provide users with a fundamental
understanding of how to use the recently upgraded application.
System Requirements
Minimum recommendations for running Business Objects X4 are:
Internet Explorer 8
Java version 1.6
Logon
Access the system using the same link previously used at http://pbedis.onepb.net/.
Step Action
1 Open Internet Explorer.
2 Type http://pbedis.onepb.net/ in the address bar. (Note: PB Network access is required)
3 Type your User Name and Password.
4 Click the Log On button.

PB University August, 2012 4
PBEDIS Home Page
The home page provides a “dashboard” view containing key information. The screen is divided into the sections
described below.
Section Description
1 Documents Tab- Provides access to corporate documents and your saved documents and folders. Click this tab to access these items. (see page 5 for details)
2 Message Area- Provides a general message from the PBEDIS team. This may be updated to provide information on system maintenance or key business initiatives.
3 Unread Messages in My Inbox- Provides access to any unread messages (documents not viewed) in your inbox.
4 My Recently Viewed Documents- Provides links that open documents that you have viewed recently. This is automatically maintained and displayed by the system.
5 PBEDIS Support Links- Provides links to the EDIS Support Site, Knowledge Base, Data Dictionary, and EDIS Training. Note: The EDIS training here is an older version that will be updated later in 2012.

PB University August, 2012 5
Documents Tab
The documents tab provides access to saved documents in your “My Documents” area. It also allows you to
access the Public Folders and to search for documents. Each item is displayed as a small tab on the left side of
the split window display as shown below. Click anywhere on the gray rectangular tab to access that area. The
sample below displays the Public Folders. The contents of items selected on the left display in the main window
on the right.
My Documents- provides access to your personal
folders and saved documents.
Folders- provides access to public folders. The
contents of the folders are displayed on the right in
this example.
Search- provides access to a search window where you
can search for reports matching key words.
Note: There is an additional search field in the upper
right corner. This is always available in the application.

PB University August, 2012 6
My Documents
The screen sample below shows the main documents tab with the My Documents area selected. In this example
the Inbox is selected on the left and the contents display in the main viewing area on the right.
Documents in the inbox are displayed here.
Double click a document to open and view.
Inbox selected
Note: Buttons in upper left relate to the folder
area. The New button does not create a new
document, but will create a new folder.

PB University August, 2012 7
Viewing Existing Documents
To view existing documents, navigate to the applicable folder (Public Folders, My Documents, etc.). Double click
the document that you wish to view.
Double click a document to open and view.
Note: A new tab for the document is added.
An Autosave message appears the
first time you open a document.
This useful feature automatically
saves the document if the server
times out.
The application times out after 45
minutes of inactivity.
You may click the “Don’t notify me
again” check box to avoid this
message in the future.
Click the OK button to begin working
with the report.
PB University August, 2012 8
Page Navigation and Basic Features
Some of the important viewing features are highlighted below. (Note: the top and bottom tool bars are
magnified.)
1- Save button- Used to save the document or “save as” with a different location/name.
2- Export Document button- Used to export to Excel, PDF, Text, or CSV.
3- Report Refresh buttons- Note there are two buttons, one on the top toolbar and one on the bottom. The last
refresh date is displayed next to the button on the bottom toolbar.
4- Go Arrows- Small arrows scroll left, right, up, and down within a page.
5- Page Navigation- Buttons navigate to first, last, previous, and next pages.
6- Report Display- The report is displayed in the main window.

PB University August, 2012 9
Exporting to Excel
Follow the steps in the table below to export a document (report) to Excel.
Step Action
1 Click the Export button.
2 Select Export option:
Export Document As- to export all tabs.
Export Current Report As- to export only the current tab.
3 Select Excel 2007. [File Download window opens]
4 Click the Save button. [Save As window opens]
5 Type a file name and click the Save button.

PB University August, 2012 10
Creating a New Document
Follow the steps in the table below to create a new document. Please note that the applications menu is always available in the upper right corner of the application.
Step Action
1 Click the Applications menu and select Web Intelligence Application. [An additional tab is added and a blank screen loads; this may take a moment]
Step Action
2 Click the New button in the upper left corner.
Step Action
3 Click to select Universe and then click the OK button. [Universe window opens]
4 Click to select the Universe name and then click the Select button. [Query Panel opens- see next page for details]

PB University August, 2012 11
Using the Query Panel
The Query Panel is used to build your document (report). The available objects in the universe are displayed on
the left side of the screen. Click to expand the folders in the universe and then select the objects that you
would like to include. The right side of the Query Panel is divided into the following sections:
1- Result Objects- Items added to this area display as columns of data on the report.
2- Query Filters- Filters may be added to this area to target specific data by “filtering” out the data not
wanted. Predefined filters are often available and custom filters may also be created. Filters may be
created with specific values or may “prompt” the user to select parameters when running the report.
3- Data Preview- Displays a preview of several lines of data from the universe. Click the Refresh button to
generate this data preview.

PB University August, 2012 12
Adding Result Objects
Follow the steps in the table below to add result objects.
Step Action
1 Click to expand the folders on the left.
2 Click the desired dimension or measure object and drag it to the Result Objects area. (e.g., Store name)
3 Repeat Steps 1-2 to add additional objects as applicable. Note: Please see next page for an example of added results objects.
PB University August, 2012 13
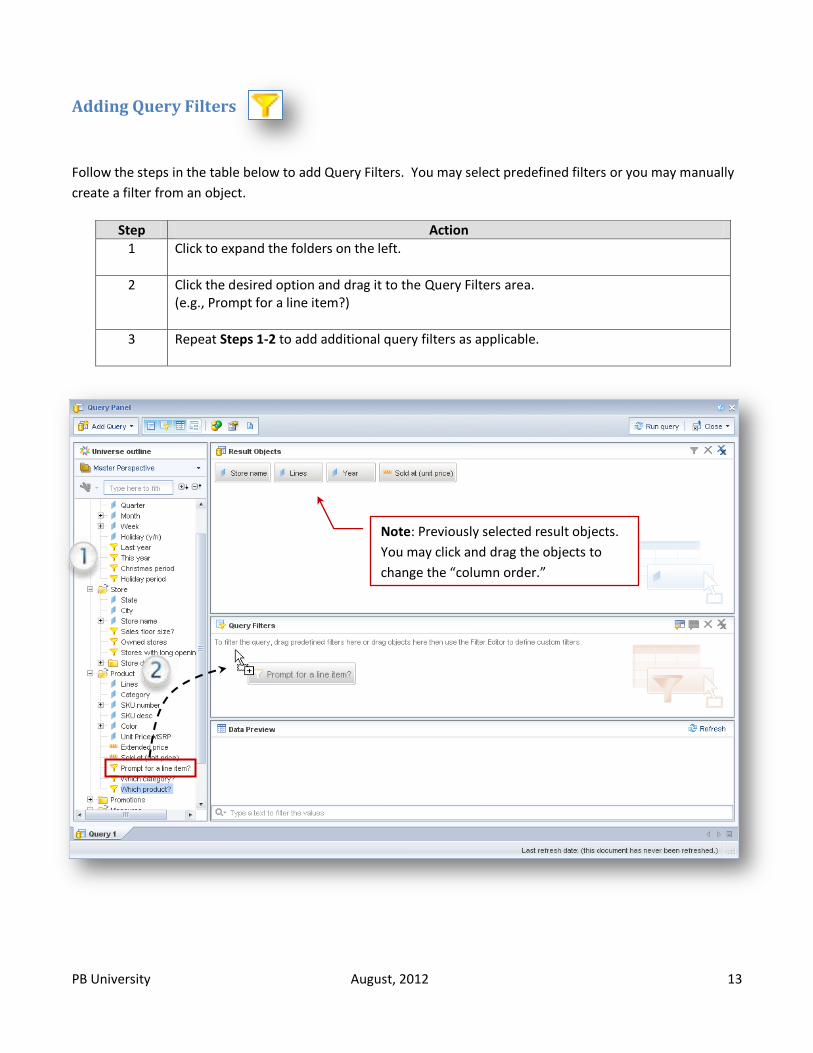
Adding Query Filters
Follow the steps in the table below to add Query Filters. You may select predefined filters or you may manually
create a filter from an object.
Step Action
1 Click to expand the folders on the left.
2 Click the desired option and drag it to the Query Filters area. (e.g., Prompt for a line item?)
3 Repeat Steps 1-2 to add additional query filters as applicable.
Note: Previously selected result objects.
You may click and drag the objects to
change the “column order.”

PB University August, 2012 14
Running a Query
1- Prior to running a query you may preview a sample of the data. Click the Refresh button. If applicable, a
prompt window will allow you to select filter information. Data is displayed in the Data Preview area at the
bottom.
2- You may add additional items from the Universe outline area on the left.
3- You may delete items by clicking the item and either pressing the delete key on the keyboard or by clicking
the delete button in the corresponding panel.
4- When your query is complete, click the Run query button in the upper right corner to run the query.
Delete buttons
Refresh button

PB University August, 2012 15
Viewing and Editing a Document
After running a query, the report displays in a new window.
1- File Tab- Provides general options including creating a new document, opening a document, saving the
document and printing the document.
2- Report Editing Tabs- A series of tabs with “sub tabs” provides access to the main report editing functions.
3- Available Objects- This area displays the data elements you selected for the report.
4- Report- Content is displayed in the main window.
5- Note: When you open a saved document it will display in Reading mode. To make changes to the document
you must change to Design mode.

PB University August, 2012 16
Saving a Report Document
Follow the steps in the table below to save your report document.
Step Action
1 Click the Save button in the upper left corner of the window.
Step Action
2 Click to select the location for the saved document.
3 Type a Name for the document.
4 Click the Save button.

PB University August, 2012 17
Sending a Report Document to Another User
You may send a document to another user’s inbox. Follow the steps in the table below to send a document.
Step Action
1 Click the Send to drop-down arrow in the upper left corner of the window.
2 Select “Send to User…”
Step Action
3 Click to select the user(s). Note: You may use the Find title field to search for a user name.
4 Click the “right arrow” to add the user to the Selected Recipients area on the right.
5 Click the Send button.

PB University August, 2012 18
Editing Documents Using Tabs
Most of the edits to the document may be made using the toolbars at the top of the window. This format is new
in this version of Business Objects. The toolbars are displayed using tab sets. The tabs are magnified in the
sample below.
The “sub-tabs” displayed on the bottom row change based on which main tab is selected. The elements on the
sub tabs also change based on what is selected on the report.
There are 5 main tabs displayed in the top row. These include: Report Element, Format, Data Access, Analysis, and Page Setup
The bottom row of “sub-tabs” changes based on which tab is selected on the top row. This example displays the sub-tabs for the main Report Element tab.

PB University August, 2012 19
Adding Data Elements
You may add data elements to your documents after your query is created and run. This is done by accessing
the main Data Access tab. Follow the steps in the table below to add a data element.
Step Action
1 Click the Data Access tab in the upper left corner of the window.
2 Click the Edit button on the Data Providers sub-tab. [Query Panel opens]
3 Click to select the desired data element(s). [See pages 11-13 for detailed steps if needed]
4 Click the Run query button. Note: Additional data elements are made available, but are not automatically added to the document. Perform Step 5 to add the new data element(s) to the document.
Step Action
5 Click the desired object in the Available Objects area and drag it to the appropriate position in the document.
Newly added object

PB University August, 2012 20
Formatting a Document
Basic formatting of the document is very similar to Microsoft Office functions. Click to highlight areas that you
would like to format and use the Formatting tab and sub-tabs. The application also has context specific
functions using the “Right-Mouse-Click” functionality (see green highlighted menu below). This is often easier
than finding the proper tab and sub-tab for new users. The screen sample below highlights some basic
formatting items.
Right mouse click tab to rename or
duplicate the report. The title will
automatically update at the top
when a report is renamed.
Click and drag
boarder between
columns to resize
Standard text and table
formatting buttons.
Sample “Right-Mouse-Click” menu.
Sub-menus expand when selected.

PB University August, 2012 21
Sorting and Adding Breaks to a Document
You may easily sort the data in your report document. After sorting you may also add breaks which allow you to
add sub totals and other calculations.
Step Action
1 Click to highlight the desired column.
2 Click the Analysis tab and Display sub-tab.
3 Click the Sort drop-down arrow and select the applicable option.

PB University August, 2012 22
Sorting and Adding Breaks to a Document, cont.
It is important to sort by a given item prior to adding a break. To add a break, follow the steps in the table
below.
Step Action
1 Click to highlight the desired column.
2 Click the Analysis tab and Display sub-tab.
3 Click the Break drop-down arrow and select Add Break.
Sample with break added to
the Store name column. Note
the break between e-Fashion
Austin and e-Fashion Boston
Newbury. Functions can then
be added to the break levels.
See the next page for details.

PB University August, 2012 23
Adding Functions
After sorting and applying breaks to your document you may add functions to your document to perform
calculations. These include count, average, sum, etc. Follow the steps in the table below to add a function.
Step Action
1 Click to highlight the desired column.
2 Click the Analysis tab and Functions sub-tab.
3 Click the applicable button to select the function. [Sum, Count, More] Note: The selected function is added to the break level.

PB University August, 2012 24
Adding Filters
You may add a filter to your document while in edit mode.
Step Action
1 Click the Analysis tab and Interact sub-tab.
2 Click the Filter Bar button. Note: This adds the filter bar under the toolbars.
3 Click the small filter icon to add a filter.
4 Select the applicable item (e.g., Store name) from the list. [A drop-down menu is added to the filter bar area]
Step Action
5 Click the applicable drop-down menu (e.g., Store name) and select the desired item.
Drop-down menu added to filter bar.

PB University August, 2012 25
Function and Filter Example
The example below shows the application of breaks, a filter, and the addition of the count and average
functions. This filter displays the store name of e-Fashion Chicago 33rd. A break has been applied to the Lines
column and the count and average functions are applied.
Purging Data
You may purge the data from your document at any time. To purge the data, click the Data Access tab and then
the Data Providers sub-tab. Click the Purge button.
Filter applied Break applied

PB University August, 2012 26
Tracking Changes
The track changes option allows you to see how the data in your report changes over time. You can select to
track and compare with the last refresh or a specific time. The system automatically highlights the changes to
the data. You may click either of the two buttons shown below to open the Data Tracking window.
Note: The procedure continues on the next page.
Track changes buttons
Data tracking options include tracking
insertions, deletions, and changes.
Numerical values are tracked for increases
and decreases. The formatting for
identifying the changes may be changed by
the user. The default values are shown to
the right.

PB University August, 2012 27
Tracking Changes, cont.
Follow the steps in the table below to select tracking changes options on the Data tab. You may change the
tracking options and formatting by clicking the Options tab. The default options are shown on the previous
page.
Step Action
1 Click the applicable tracking option.
Compare with last data refresh
Compare with data refresh from:
2 Click to select the applicable report(s).
3 If desired, click the Refresh data now checkbox.
4 Click the OK button.

![Edgelit Panel - Tungsram...Edgelit LED Panel Suspension Kit P x4 x4 x4x4 1 3 SKU: 93118779 x4 2 x4 PH2 6 x4 PH1 1 2 4 5 x4 x4 PH1 x4 x4 x4 2 1 7 2 1 x4 x y 2x2 1x4 x [mm]y [mm] 480](https://img.dokumen.tips/doc/110x75/60e1473154e46b35824a7459/edgelit-panel-tungsram-edgelit-led-panel-suspension-kit-p-x4-x4-x4x4-1-3-sku.jpg)


![EndNote X4 by CLM [โหมดความเข้ากันได้]clm.wu.ac.th/db_pdf/07-EndNote X4 by CLM.pdf · Introduction : Endnote X4 Šใช ในการจัดการบรรณานุก](https://img.dokumen.tips/doc/110x75/602f739583fd847af63d388f/endnote-x4-by-clm-aaaaaaaaaaaaaaaaaaclmwuacthdbpdf07-endnote.jpg)