Embed Size (px)
Citation preview

Financial capital
•• Net sales: ¥1,043.9 billion
•• Operating income: ¥35.0 billion
•• ROE: 3.7%
•• Debt/equity ratio: 1.75 times
•• EBITDA: ¥97.7 billion
Manufactured capital •• Paper, household paper: 4,023 thousand tons
•• Paperboard: 2,044 thousand tons
•• Chemical products: 100 thousand tons
Intellectual capital •• Developed Lamina® heat-sealable paper•• Commercialized SPOPS® replaceable containers
Human capital •• Frequency rate of occupational
accidents requiring time off from work: 0.79 (Nippon Paper Group, including affiliated companies)
•• Rate of annual paid leave taken: 74.4% (consolidated Group companies in Japan)
•• Percentage of female employees in management:
2.70% (consolidated Group companies in Japan)
Social and relationship capital
•• Individual meetings with investors: 136 times
•• Risk communication with local residents: 26 times
Natural capital •• Volume of greenhouse gas emissions:
6.26 million tons of CO2*
•• Final disposal of waste: 141 thousand bone-dry tons
* Scope: Consolidated and non-consolidated Group companies in Japan subject to
the Act on Rationalizing Energy Use
A Variety of Businesses out of Trees
INPUT(FY2020/3)
Business Environment
and Social TrendsOUTPUT/OUTCOME
(FY2020/3)
Wood Products and Construction Related Business
Energy Business
Innovative Materials
Paper and Paperboard Business
Daily-life Products Business
Household Paper and Healthcare
Chemical
Packaging
Financial capital
•• Consolidated total assets: ¥1,363.5 billion (as of March 31, 2020)
Manufactured capital
•• Japan: 24 bases Nippon Paper Industries Co., Ltd. (incl. paper cartons and chemicals),
Nippon Paper Crecia Co., Ltd., and Nippon Paper Papylia Co., Ltd.
•• Major overseas bases: Paper Australia Pty. Ltd., Jujo Thermal Oy, Siam Nippon Industrial
Paper Co., Ltd., and Nippon Dynawave Packaging Company, LCC
•• Capital investment: ¥70.6 billion
•• Wood chips: 5,228 thousand bone-dry tons
•• Wastepaper (pulp): 2,705 thousand air-dry tons
Intellectual capital
•• Research and development expenses:
¥6.1 billion
•• Technology and expertise for maximizing the use of trees
Human capital
•• Number of employees (Consolidated):
12,592 (as of March 31, 2020)
Social and relationship capital •• Recycling system•• CLOMA
Natural capital
•• Forest area: 173 thousand hectares
•• Environmental conservation costs: ¥35.3 billion
•• Water consumption: 930 million tons
The Nippon Paper Group’s Value Creation Process
Shift away from the use of plastics
Diversification of consumer needs
Transition to low-carbon society
Declining birth rate and aging population
in japan
Digitalization
Recycling of Paper Products
Sustainable forest
management
Sustainable procurement
of wood resources
Heightening awareness of
hygiene
Business Model
4 5Nippon Paper Group Integrated Report 2020 Nippon Paper Group Integrated Report 2020

Maximizing the Use of Woody Biomass Trees consist of three main components: cellulose, hemicellulose, and lignin. The Nippon Paper Group has accumulated technologies for wood processing, pulping, papermaking and coating, biochemical, and power generation that utilize woody biomass in a gradual and appropriate manner. In general, cellulose and hemicellulose are utilized as raw material for pulp while lignin is used as biomass fuel. These components are also utilized in a variety of biochemical prod-ucts. (See pages 42–45.)
CO2 sequestered in wood
The Characteristics of Wood ResourcesThe Nippon Paper Group strives to realize a sustainable society while engaging in business activities with its sights set on the long term. With this in mind, the Group must be fully committed to building a resource-circulating society. Guided by its slogan of “shaping the future with trees,” the Group continues to expand its business on the strength of its technological capabilities that maximize the use of woody biomass.
Trees are renewable resources that they can be planted and nur-tured. In addition, the carbon sequestered within trees through photosynthesis is utilized themselves as raw material and remains sequestered upon processing into wood resources, paper, and other products. While the burning of such products releases CO2, this is essentially offset by the absorption of CO2 by trees from the atmo-sphere (carbon neutral).
33 Over the years, the Group has accumulated a wealth of technolo-gies and know-how on the use of forests in Japan and overseas as a sustainable resource. The Group has also cultivated technologies that fully utilize wood components, allow for sophisticated recycling, and offer unique breeding capabilities. Looking ahead, the Group will continue to develop technologies that leverage the characteristics of wood resources as a part of our efforts to promote resource recycling.
Hemicellulose Lignin
Filling gap between fibers and promoting inter-fiber bonds
Cellulose
Fiber component
The Characteristics of Wood Resources
The Characteristics of Wood Resources × The Nippon Paper Group’s Technologies Realization of Three Cycles
Renewable Resources The Nippon Paper Group procures wood resources by conducting sustainable
forest management.
The sustainable management of our 173 thousand hectares of
forest resources worldwide entails repeated planting and nurturing of
trees upon harvesting.
Biodegradability When discarded, wood fiber can be decomposed by microorganisms and
other means and returned to nature.
Guided by its slogan of “let paper do what it can do,” the Group will
continue to help alleviate environmental burden through its production of
paper-based products, which consist of wood fiber.
Recyclability Paper products can be recycled after use, through collection, separation, and
wood fiber extraction.
Nippon Paper Industries utilizes collected and separated newsprint,
magazines, containerboards, and paper cartons after use as raw materials,
and recycles them to make paper.
CO2 Absorption and Fixation During photosynthesis, trees absorb CO2 from the atmosphere and release
oxygen while storing carbon. Provided that it is not burned, this carbon will
remain sequestered.
Through the use of our unique breeding technology, the Company is proceeding
with measures to increase the amount of CO2 absorption and fixation.
Carbon Circulation
Paper products
1
Image of main wood composition
Wastepaper utilization
technology
Use of Company-owned forests in Japan
Breeding technology
Energy-utilization
technology
Biomass fuels Waste
Use as material
Use as fuel
Wood resources and lumber,
plywood
Housing and buildings
Pulp
Fiber (rayon)
Chemical products
CO2 absorption through
growth of plants and trees
2Recycling of Paper ProductsCellulose:
approx. 50%
Wood composition
Lignin: approx.
30%
Hemicellulose: approx.
20%
Harvesting and use
Planting
Nurturing
Photosynthesis
Sustainable Forest Management
Absorption and fixation of CO2
through photosynthesis
Biomass procurement
network
Carbon neutrality
Use
Production of recycled paper
Separation and collection
Pulp production from wastepaper
Business Model
6 7Nippon Paper Group Integrated Report 2020 Nippon Paper Group Integrated Report 2020

Value Provided by the Nippon Paper GroupProvide environment-friendly packaging
In accordance with its Group Mission, the Nippon Paper Group strives to provide universal value by way of cultural progress and value that enriches lifestyles toward better living.The following are some of the values we provide to global society from the perspectives of cultural progress and better living.
Packaging and protection of goods / Transportation
Biomass power generation technology / Operational know-how
Preservation of quality / Reduction of single-use plastics
Energy sales
SHIELDPLUS® / Lamina®
High-performance cellulose (CMC)
01
02
04 0506
07
08
09
10
Warm and comfortable texture of wood
Bring pleasantness and comfort to homes through the aroma and warm texture of wood
Construction materials / Super Jet Fiber (heat-insulation material)
0808
0505
Interaction with trees and forests / Preservation and cultivation of forests
Marunuma Highland / Company-owned forests
0101Realize convenient and comfortable lifestyles
Protection of skin and body / Healthy and enriched lifestyles
Healthcare products (Adult diapers, products for mild incontinence)
0707
Contribute to reductions in CO2 emissions by developing alternative fuel for coal
Fuel technology
Biomass solid fuel
0202
0202
Promote printing culture and pass along to future generations
Reading / Writing / Communication
Newsprint / Printing and business communication paper
1010
Contribute to evolution of electrical devices
Contributions to better living
Functional films
0303
03
Contribute to reductions in CO2 emissions by reducing the weight of automobile parts and promoting the spread of lithium-ion battery
Weight reduction / Support for better living0404
CNF
0606
New-shape cartons with closures
0909 Cleanliness / Protection of skin and body
Contribute to greater hygiene awareness in various lifestyle settings
Household products (tissue, toilet roll, etc.)
Linerboards, corrugated mediums / Packaging paper
Business Model
8 9Nippon Paper Group Integrated Report 2020Nippon Paper Group Integrated Report 2020

Defined as “development that fulfills the hopes of current and future generations,” sustainable development entails the commitment of all individuals and organizations, including companies, to work toward the achievement of the Sustainable Development Goals (SDGs), a set of goals adopted by the United Nations in 2015 that addresses economic, social, and environmental issues. The Nippon Paper Group has identified impacts at each stage of its value chain on achieving the objectives of the SDGs.While striving to realize the Group Mission, the Group will strengthen the positive impacts while mitigating the negative impacts.
The Group Mission, “to contribute to better living and cultural progress everywhere it does business,” aligns with the “leave no one behind” principle of the SDGs. In addition, based on the Slogan, “shaping the future with trees,” the Group’s sincere commitment to engage in themes relevant to the four components of the vision under the Group Mission identifies with the aim of the SDGs, “building a sustainable society.”
Strengthen positive impactson the economy, the environment, and society
Mitigate negative impactson the economy, the environment, and society
SDG Initiatives
Positive and Negative Impacts in Our Value Chain on Realizing the SDGs
The Nippon Paper Group’s Approach to the SDGs
2015 Adoption by the United Nations
The Group’s environmental and social communication magazine Shiki Oriori, a special feature on the SDGs (Vol.24 https://www.nipponpapergroup.com/csr/Vol24_contents.pdf [in Japanese only])
“CSR Report 2017”: Disclosure of positive and negative impacts of the value chain on achieving the SDGs
The Group’s PR magazine “Dynawave”: “Let’s think about the SDGs” series (October 2018—October 2019, 12 issueshttps://www.nipponpapergroup.com/csr/download/sdgs/ [available in English])
E-learning seminar for all Group employees
2017
2016
2018
2019
2030
2050
Raw material procurement Production Shipping Sales and use
Separation, collec-tion, recycling, and disposal
Integrating the Group Mission with the SDGs
Building a Sustainable SocietyBuilding a Sustainable Society
Group MissionThe Nippon Paper Group aims to contribute to better living and cultural progress everywhere it does business.
Vision1. Drive social sustainability through our business
2. Delight our customers
3. Instill pride in employees
4. Give back to society
“Leave No One Behind” 17 goals and 169 targets
Goal 15 Life on landThrough the proper management of Company-owned forests, the Group will enhance public interest in and the ecological services of forests.
Goal 13 Climate change initiatives The Group will help reduce the loss of forests by strictly practicing proper, legal procurement and strive to rein in CO2 emissions generated via all its business activities.
Goals 6 , 12 , and 14 Water and hygiene, life on landThe Group will help prevent environmental pollution through Group manufacturing activities by reining in emissions or dis-charges of water, air, and soil contaminants.
Goal 3 Ensuring good health and well-being The Group takes every possible measure to prevent its employees from suffering illnesses or injuries by implementing extensive work safety measures and conducting thorough training and education.
Goals 2 , 7 , 9 , and 12 as well as 14 Providing environmen-tally and socially conscious products The Group will help protect the environment and enhance the sustainability of resources through technological innovations making greater use of renewable biomass resources.
Business Model
10 11Nippon Paper Group Integrated Report 2020 Nippon Paper Group Integrated Report 2020

Financial and Non-Financial Highlights
Net Income (Loss)*1 and Net Income (Loss) per Share*1
Frequency Rate of Occupational Accidents Requiring Time Off From Work
Net Sales Greenhouse Gas Emission Volume (in Japan)*6
Net Interest-Bearing Debt and Debt/ Equity Ratio*4
Circulation of Resources (in Japan)*7
ROE*2 / ROA*3
Percentage of Female Employees in Management
Operating Income and Operating Income Margin
Recycled Paper Utilization Rate (in Japan)*7
EBITDA*5
Domestic Wood Material Utilization Rate for Paper
¥ billion Yen
¥ billion
¥ billion Times
Million tons of CO2
Thousand tons%
¥ billion %
¥ billion%
%
%
%
122.89
14.22.4
20.95 72.57 67.80
(304.34)
8.4 7.8
(35.2)
2016/3 2017/3 2018/3 2019/3 2020/3
2016/3 2017/3 2018/3 2019/3 2020/3
1,043.91,007.1 992.4 1,046.5 1,068.7
1.75
637.1
1.47
591.3 588.0 634.6 625.2
1.49 1.611.76 1.75
2016/3 2017/3 2018/3 2019/3 2020/3
0.79
0.540.40
0.44
0.10
0.60
1.16
0.400.59
0.77
2016/3 2017/3 2018/3 2019/3 2020/3
6.267.12 7.17 6.99 6.83
2016/3 2017/3 2018/3 2019/3 2020/3
732
20
704
17
690
11
638
9
745
13
2016/3 2017/3 2018/3 2019/3 2020/3
35.8
30.8
35.8
31.1
36.1 35.236.8
31.432.4
2016/3 2017/3 2018/3 2019/3 2020/3
2.7
3.7
0.5
2.0 2.6 1.9 2.2
2.0 1.8
(8.6)
2016/3 2017/3 2018/3 2019/3 2020/3
35.0
3.422.6
2.2 2.4 1.7 1.8
23.8
17.619.6
2016/3 2017/3 2018/3 2019/3 2020/3
97.792.8 89.3 83.7 86.1
2016/3 2017/3 2018/3 2019/3 2020/3
2.43
2.70
16.8
1.60
1.90
20.4
1.86
2.47
14.415.9
2.14
23.2
2.39 2.29
2.47
2016/3 2017/3 2018/3 2019/3 2020/3
33
89
38
89 89 89 88
38 35 34
2016/3 2017/3 2018/3 2019/3 2020/3
Net income (loss) Net income (loss) per share
Net interest-bearing debt Debt/equity ratio
Nippon Paper Group*10
Nippon Paper Group (including affiliated companies)
ROE ROA
Operating income Operating income margin
Nippon Paper Industries Nippon Paper Group (Japan)*11 Nippon Paper Group (overseas)*12
Paperboard Paper
Nippon Paper Industries’ domestically produced wood utilization rate*8 Self-sufficiency rate of domestic wood resources*9 (calendar year)
Waste generated Final waste disposal
(FY) (FY)
(FY)
(FY)
(FY)
(FY)
(FY) (FY)
(FY)
(FY)
(FY)
(FY)
*1 Profit (loss) attributable to owners of parent*2 Return on equity (ROE) = Profit (loss) attributable to owners of parent / [Average of beginning and end of year (Shareholders’ equity + Accumulated other comprehensive income)] × 100*3 Return on assets (ROA) = (Ordinary income + Interest expense) / Total assets × 100*4 Debt/equity ratio = (Interest-bearing debt – Cash and deposits) / Shareholders’ equity*5 EBITDA = Operating income + Depreciation + Interest income + Dividend income + Amortization of goodwill
*6 Scope: Consolidated and non-consolidated Group companies in Japan subject to the Act on Rationalizing Energy Use*7 Scope: Domestic companies among environment-related organizations specified in Sustainability Report 2020*8 Data includes scrap wood and wood chips of domestic mills *9 Source: “Wood Supply/Demand Chart,” Forestry Agency*10 Aggregate data for the manufacturing offices belonging to Nippon Paper Industries Co., Ltd., Nippon Paper Crecia Co., Ltd., Nippon Paper Papylia Co., Ltd., and Nippon Paper Liquid Package Product Co., Ltd.*11 Aggregate data for consolidated Group companies in Japan *12 All managers of sections or higher (including department managers and section managers)
❶ Net Sales• Net sales in the Paper and Paperboard Business
declined ¥32.1 billion due to lower domestic demand and a sluggish export market.
• Revenue in the Daily-life Products Business increased ¥8.9 billion on the back of brisk results in the Household Paper and Healthcare Business.
❷ Operating Income & Operating Income Margin• Operating income in the Paper and Paperboard
Business shifted upward, climbing ¥14.6 billion, owing to the maintenance of revised prices and the realization of effects from the reorganization of its production structure.
❸ Net Income (Loss) & Net Income (Loss) per Share
• Profit (loss) attributable to owners of parent turned positive mainly due to the absence of loss on reorganization of production structure and other extraordinary losses recorded in FY2019/3.
❹ ROE / ROA• ROE increased behind the upturn in profit (loss)
attributable to owners of parent.
❺ Net Interest-Bearing Debt & Debt/ Equity Ratio
• Net interest-bearing debt is projected to rise in FY2021/3 as a result of the increase in loans payable stemming from the acquisition of Orora Limited’s paperboard and fiber based packaging business in Australia and New Zealand.
❻ EBITDA• EBITDA increased ¥11.6 billion owing to an
improvement in operating income, despite a decline in depreciation.
❶ Greenhouse Gas Emission Volume (in Japan)• Surpassed the targets of Green Action Plan 2020
thanks to systematic energy-saving investments and promotion of fuel conversion
❷ Recycled Paper Utilization Rate (in Japan)• Established a closed-loop system and development
of application technology for difficult-to-recycle paper amid the challenging environment for procurement of wastepaper
❸ Circulation of Resources (in Japan)• Revised production process and promoted efforts
to utilize ashes from boiler combustion in con-struction materials
❹ Domestic Wood Material Utilization Rate for Paper
• Utilized domestic wood materials by leveraging our procurement network
• Continue to actively utilize domestic wood materials
❺ Frequency Rate of Occupational Accidents Requiring Time Off From Work
• One serious accident occurred• Formulated medium-term management plan
centered on safety initiatives and created disaster-prevention framework
❻ Percentage of Female Employees in Management
• Aim to double the number of female managers by FY2021/3 through measures to expand the number of female employees in the work place
❶ ❶
❸
❺
❷ ❷
❹
❺ ❻❻
❸ ❹
Overview of the Nippon Paper Group
12 13Nippon Paper Group Integrated Report 2020 Nippon Paper Group Integrated Report 2020
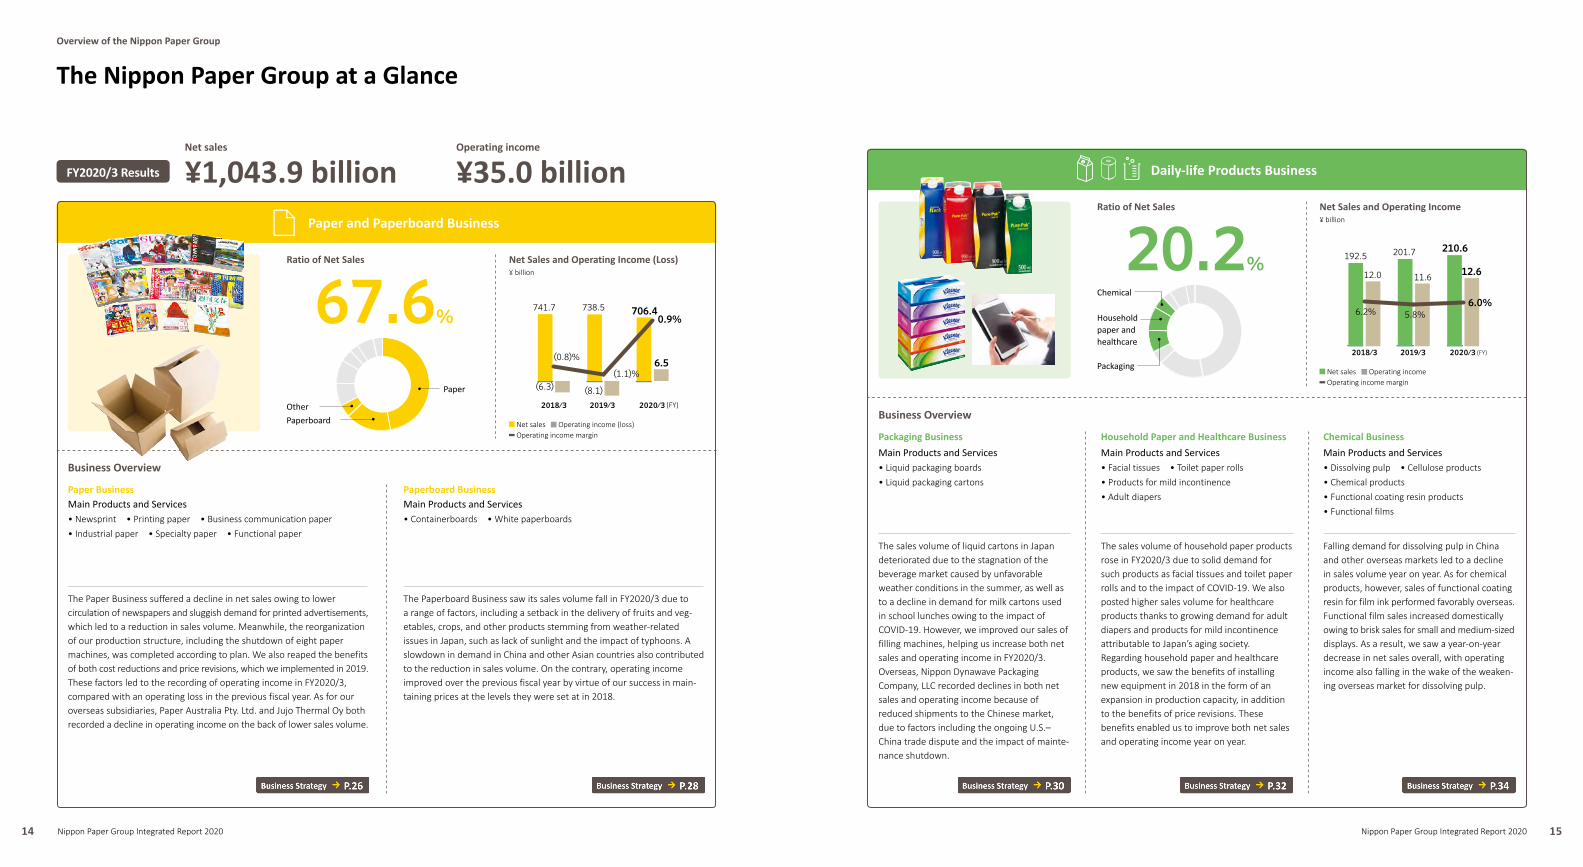
The Nippon Paper Group at a Glance
Paper and Paperboard Business
Ratio of Net Sales
FY2020/3 Results
Ratio of Net Sales
Business Overview
Business Overview
67.6%
20.2%
2018/3 2019/3 2020/3
0.9%706.4
6.5
741.7
(0.8)%
(6.3)
738.5
(1.1)%
(8.1)
6.0%
210.6
12.6
192.5
6.2%
12.0
201.7
5.8%
11.6
2018/3 2019/3 2020/3
Net sales Operating income (loss) Operating income margin
Net sales Operating income Operating income margin
Paperboard
Packaging
Paper
Chemical
Other
Household paper and healthcare
Net sales
¥1,043.9 billionOperating income
¥35.0 billion
Net Sales and Operating Income (Loss)¥ billion
(FY)
(FY)
Net Sales and Operating Income¥ billion
Daily-life Products Business
Paper Business Main Products and Services• Newsprint • Printing paper • Business communication paper
• Industrial paper • Specialty paper • Functional paper
Paperboard Business Main Products and Services• Containerboards • White paperboards
Packaging Business Main Products and Services• Liquid packaging boards
• Liquid packaging cartons
Household Paper and Healthcare Business Main Products and Services• Facial tissues • Toilet paper rolls
• Products for mild incontinence
• Adult diapers
Chemical Business Main Products and Services• Dissolving pulp • Cellulose products
• Chemical products
• Functional coating resin products
• Functional films
The Paper Business suffered a decline in net sales owing to lower circulation of newspapers and sluggish demand for printed advertisements, which led to a reduction in sales volume. Meanwhile, the reorganization of our production structure, including the shutdown of eight paper machines, was completed according to plan. We also reaped the benefits of both cost reductions and price revisions, which we implemented in 2019. These factors led to the recording of operating income in FY2020/3, compared with an operating loss in the previous fiscal year. As for our overseas subsidiaries, Paper Australia Pty. Ltd. and Jujo Thermal Oy both recorded a decline in operating income on the back of lower sales volume.
The sales volume of liquid cartons in Japan deteriorated due to the stagnation of the beverage market caused by unfavorable weather conditions in the summer, as well as to a decline in demand for milk cartons used in school lunches owing to the impact of COVID-19. However, we improved our sales of filling machines, helping us increase both net sales and operating income in FY2020/3. Overseas, Nippon Dynawave Packaging Company, LLC recorded declines in both net sales and operating income because of reduced shipments to the Chinese market, due to factors including the ongoing U.S.–China trade dispute and the impact of mainte-nance shutdown.
The Paperboard Business saw its sales volume fall in FY2020/3 due to a range of factors, including a setback in the delivery of fruits and veg-etables, crops, and other products stemming from weather-related issues in Japan, such as lack of sunlight and the impact of typhoons. A slowdown in demand in China and other Asian countries also contributed to the reduction in sales volume. On the contrary, operating income improved over the previous fiscal year by virtue of our success in main-taining prices at the levels they were set at in 2018.
The sales volume of household paper products rose in FY2020/3 due to solid demand for such products as facial tissues and toilet paper rolls and to the impact of COVID-19. We also posted higher sales volume for healthcare products thanks to growing demand for adult diapers and products for mild incontinence attributable to Japan’s aging society. Regarding household paper and healthcare products, we saw the benefits of installing new equipment in 2018 in the form of an expansion in production capacity, in addition to the benefits of price revisions. These benefits enabled us to improve both net sales and operating income year on year.
Falling demand for dissolving pulp in China and other overseas markets led to a decline in sales volume year on year. As for chemical products, however, sales of functional coating resin for film ink performed favorably overseas. Functional film sales increased domestically owing to brisk sales for small and medium-sized displays. As a result, we saw a year-on-year decrease in net sales overall, with operating income also falling in the wake of the weaken-ing overseas market for dissolving pulp.
Overview of the Nippon Paper Group
14 15Nippon Paper Group Integrated Report 2020 Nippon Paper Group Integrated Report 2020

20.6%
2018/3 2019/3 2020/3
17.8
36.233.0
23.0%
21.8%4.1
7.96.8
9.6%
2018/3 2019/3 2020/3
62.8 59.8 61.6
7.2%8.2%
4.5 4.95.9
9.9%
2018/3 2019/3 2020/3
32.3
3.2
31.7
10.4%
3.3
32.5
10.2%
3.3
The Nippon Paper Group at a Glance Group Strategy
Warehousing, Logistics, and Leisure Facilities Operation • Ski resorts
• Bowling alleys
Energy Sales
Ratio of Net Sales
Net Sales and Operating Income¥ billion
Ratio of Net Sales
Net Sales and Operating Income¥ billion
Ratio of Net Sales
Lumber and Construction Materials • Lumber • Building materials
• Raw materials and fuel for paper manufacturing
Construction Related
3.1%3.2% 5.9%
Net sales Operating income Operating income margin
Net sales Operating income Operating income margin
Net sales Operating income Operating income margin
Wood Products and Construction Related Business Other Businesses
Key Themes
Themes
Priority Tasks
FY2021/3 Targets
• Reorganize the production structure of the Paper Business and make maximum use of in-house facilities
• Expand businesses in growth areas and achieve early commercialization of new businesses
Complete reorganization of
production structure
Expand continuously in growth areas
Promptly achieve EBITDA of
¥100 billion
Net sales
¥1,115.0 billion
1.5 times or less
¥47.0 billion
3.8%
¥110.0 billion
At least 5%
Debt/equity ratio
Operating income
ROA
EBITDA
ROE
1. Enhance the competitiveness of existing businesses Maintain stable quality and operation and slash costs
2. Transform our business structure Expand business in growth areas and create new businesses
(FY)(FY) (FY)
Net Sales and Operating Income¥ billion
The electric power generation facility at Nippon Paper Ishinomaki Energy Center Ltd. operated steadily. However, due to the facility’s fewer stream days and higher fixed costs—such as tax on fixed assets—compared with the previous fiscal year, the Energy Business recorded a decline in both net sales and operating income.
In the Wood Products and Construction Related Business, the number of new housing starts was stagnant and the sales volume of Nippon Paper Lumber Co., Ltd.’s lumber and other products declined. Conversely, we were able to raise the number of construction-related orders, which contributed to an increase in net sales for the business. Operating income also soared behind brisk sales of AMCEL.
While the leisure business was affected to a certain degree by COVID-19, this impact was offset by the increased number of visitors to Marunuma Highland as a result of the refurbishment of its facilities, which led to an increase in both net sales and operating income for the business.
Energy Business
Sixth Medium-Term Business Plan
(FY2019/3–FY2021/3)
Next Medium-Term Business Plan
(FY2022/3―)
Review of Fifth Medium-
Term Business Plan
(FY2016/3–FY2018/3)
Overview of the Nippon Paper Group
16 17Nippon Paper Group Integrated Report 2020 Nippon Paper Group Integrated Report 2020