Embed Size (px)
Citation preview
REPORT FOR BDS DIAGNOSTIC IN RWANDA FIT RESOURCES JANUARY 2009
1
FINAL REPORT
CONSULTANCY SERVICES FOR BUSINESS DEVELOPMENT SERVICES (BDS) MARKET
DIAGNOSTIC IN RWANDA
CONDUCTED BY:
SUBMITTED TO:
EAST AFRICA DAIRY DEVELOPMENT (EADD) PROJECT
JANUARY 2009

REPORT FOR BDS DIAGNOSTIC IN RWANDA FIT RESOURCES JANUARY 2009
2

REPORT FOR BDS DIAGNOSTIC IN RWANDA FIT RESOURCES JANUARY 2009
3
CONTENTS
Background and introduction 3
Methodology and activities 3
Preplanning 4
Training 5
Field work 5
Sampling 6
Key challenges of fieldwork 7
Data processing 7
Presentations 8
Key conclusions of the methodology 8
Findings of fieldwork and data analysis 9
CONSUMER SURVEY by location 9
Locations covered and key informants interviewed 9
Targeted SME consumers interviewed 9
Market profiles 11
Key demand side constraints and opportunities 25
Business development services that address those constraints and opportunities 26
Specific policy constraints that are affecting MSE product markets 28
SUPPLIER DIAGNOSTIC by location 29
Existing providers/ services and their locations 29
A workable data base of the BDS actors 30
BDS suppliers interviewed 30
Types of services and price of services, how providers cover costs, profitability, existing contractual arrangements and promotional/marketing strategies
31
Capacity gaps of interviewed suppliers 34
Priority supply side constraints, market failures, and market opportunities 34
Comparison of interviewed suppliers 36
The enabling environment for BDS 37
Conclusions 38
Characteristics of the market for BDS in each specific region in relation to existing supply, demand and transactions
38
An insight into the potential of each target market location 39
Level of market distortion 40
Comparative information on the in-country sites and the 3 markets 41
Recommendations 42
Other current or proposed dairy sector interventions 42
Sustainable solutions to address priority market constraints and market failures 42
Illustrative market based interventions 51
Approaches and methodologies 55
Strategies which ensure effectiveness and efficiency 56
Strategies which ensure sustainability 59
Suggested BDS providers/delivery channels to target for future interventions 62
Selecting appropriate BDS providers 63
BDS performance measurements at the BDS market level 63
Annexes 67
Database of SME actors including persons interviewed
Database of BDS suppliers including persons interviewed
Database of targeted suppliers
Itinerary
FIT/RI scope of work
Final instruments
Data collected
BDS training report

REPORT FOR BDS DIAGNOSTIC IN RWANDA FIT RESOURCES JANUARY 2009
4
Researcher training report
Background and Introduction
In a bid to improve life through poverty reduction, a consortium of organisations comprising of Heifer International as lead, TechnoServe Inc, ILRI, ABS-TCM and ICRAF launched a 4 year program dubbed EADD (East Africa Dairy Development) funded by Bill and Melinda Gates Foundation. The programme aims to move smallholder farmers out of poverty by delivering farmer-focused, value-chain activities that are implemented simultaneously to stimulate dairy farm production, dairy-sector services, business development and dairy market pull. The vision of success for the EADD is that the lives of 179,000 families—or approximately one million people—are transformed by doubling household dairy income by 2018 through integrated interventions in dairy production, market-access and knowledge application. The consortium deemed it important to carry out a market assessment to understand the characteristics of the BDS markets in relation to existing supply, demand and transactions in the dairy sectors in some key sites in Kenya, Uganda and Rwanda. The information would:
• Provide an insight into the potential of each market
• Clarify opportunities for interventions
• Define broad strategic approaches FIT Resources Kenya (FIT) in collaboration with Research International East Africa Ltd (RIEAL) were contracted to coordinate the market diagnostic in key locations in Kenya. The findings and recommendations of this consultancy will contribute to the market focused, sub sector approach of the EADD aimed at improving the functioning of BDS markets. The final scope of work is attached to this report (Annexes/Final Revised SOW). FIT Resources act as the lead agency and contract holder, to provide strategic leadership in devising and conducting the business development service consumer research and supplier diagnostic. Research International conduct the field work as a sub contractor, to collect primary and secondary qualitative and quantitative information, analyse, process and present the data. Methodology and activities To achieve the above results the following activities were agreed on:
• Preplanning (planning meetings, research boundaries on the basis of project resources, existing sub sector information, market assessment goal/ objectives/research hypothesis, developing and testing the tools, screening interviewers, target locations in each country, preliminary key informants, other current or proposed interventions)
• Training (training of EADD staff, field research teams and BDS training workshop)

REPORT FOR BDS DIAGNOSTIC IN RWANDA FIT RESOURCES JANUARY 2009
5
• Field work (target groups, sample size, areas covered, team structure, consumer survey and supplier diagnostic)
• Data processing (developing the data base of BDS actors, profiling the markets, choose priority constraints, identifying and scoping out sustainable solutions, defining ‘illustrative’ market based interventions and strategies, suggest appropriate BDS providers, establishing comparative information, identifying BDS performance measurements)
• Presentations (stakeholder workshops and final presentation) Preplanning
Relevant background information was sourced via a series of planning meeting with Technoserve and EADD consortium members. Meeting presentations and minutes are attached to this report (Annexes/Process meetings). These meetings also included setting the research boundaries on the basis of project resources, preliminary selection of target locations and the agreed definition of ‘small holder farmer’. The market assessment goal, objectives and research hypothesis were agreed as follows: The market assessment goal is: To understand the characteristics of the BDS markets in relation to existing supply, demand and transactions in key sites in Rwanda. The market assessment objectives are:
• To provide an insight into the potential of each market • To clarify opportunities for interventions • To define broad strategic approaches
The research hypothesis is: If current BDS market dynamics are better understood then strategic approaches and interventions can be devised to develop BDS markets in a sustainable manner and benefit SMEs. It was agreed that the FIT/RI team would build capacity of the project staff to undertake future market assessments during the life of the project. Due to budget constraints a targeted number of sites were discussed that affords the best opportunities to kick-off the project and generate some ‘quick wins’. A training itinerary was also agreed upon to capacitate EADD project staff in BDS and research skills. FIT Resources provided lead for the overall assignment and liaison with Technoserve and the country offices on all the pre planning activities. FIT Resources coordinated the field preparation with Research International and Technoserve including: tool development and testing, researcher selection and training and itinerary development. Different tools were developed to cover the demand (consumer) side and supply (supplier) side of the market. The final instruments and itinerary are attached to this report (Annexes/Final Instruments). The following activities were undertaken prior to the commencement of fieldwork: screening of team members, preparation and translation of questionnaires and preparation of reporting tools and manuals. Research International personnel met field staff/counterparts and finalised the selection of target locations and identification of key informants in each country. Research International finalised the training of field researchers including EADD project staff and preparations for field research.

REPORT FOR BDS DIAGNOSTIC IN RWANDA FIT RESOURCES JANUARY 2009
6
No secondary information was used as the project is building on a baseline survey and existing value chain assessments in each country. The comprehensive examination of targeted BDS markets and value chains will assist EADD in designing systemic solutions to key market problems. The two subsystems—BDS markets and value chains—are complementary components of the larger market system into which MSEs must integrate.

REPORT FOR BDS DIAGNOSTIC IN RWANDA FIT RESOURCES JANUARY 2009
7
Training
1. BDS training workshop - FIT Resources personnel implemented an indepth EADD
staff stakeholder training in Uganda (to include Uganda and Rwanda stakeholders). This 2 day formal training in diagnostic skills covered the principles and practices of BDS, BDS market development, BDS market assessment and BDS market development programme design and performance measurement. The aim of this training was to capacitate project staff and provide stakeholders with a contextual framework for the research. The workshop presentations, training materials and training reports are attached (Annexes/BDS Training).
2. Training of field research teams - teams including Technoserve and consortium
member staff, were subject to an in country briefing session prior to fieldwork commencement. The training sessions covered methodology of the assessment stages, sampling, tools and stimulus methods to use with market players and how to complete reporting formats. The aim of this training was to capacitate project staff to engage in further market diagnostics beyond the life of this collaboration. The workshop presentation and training reports are attached (Annexes/Research Training).
Field work
In order to complete this assignment within the defined period, a large teams of interviewers, team-leaders and supervisors were assigned. Team members were recruited from the RIEAL regional offices, according to specifications based on experience and qualifications. The RIEAL Principle Researcher and a field coordinator coordinated the research at all stages, and focused on ensuring that outputs were planned in advance so time-schedules were met. They worked alongside the RIEAL existing field management structure that forms the line management for the field departments. Daily reporting of results and activities from each team was channeled back through this central management team. Research International led and implemented the field research in collaboration with EADD project staff. Consultations and market observation were undertaken during the fieldwork which included visiting identified target locations plus identifying and holding interviews with key informants and targeted dairy sector stakeholders relevant to the selected sites. Consumer survey - Consumer research was implemented with a selection of consumers from the core market itself with a focus on farmers and chilling plant stakeholders. However the definition regarding ‘small holder farmer’ was reviewed and altered during a process meeting and the ceiling lifted of the number of cows as many farmers in Uganda and Rwanda are large compared to Kenya’s extensive small holder population. Constraints and opportunities were then identified in the areas of market access, input supply, technology/product development, management and organisation, policy, finance and infrastructure. The size and strength of the market in each specific area of the country for those services was estimated broadly plus key sub sector constraints, market failures and market opportunities defined from the demand side. Key business development services were identified that address the specific constraints and opportunities.

REPORT FOR BDS DIAGNOSTIC IN RWANDA FIT RESOURCES JANUARY 2009
8
Supplier diagnostic - Based on the identified priority services, relevant suppliers were identified and a supplier survey implemented with service providers from the support markets to determine who is supplying BDS and how. Constraints, market failures and opportunities were then determined from the supply side. A comparison of suppliers was also undertaken and the level of market distortion anticipated. Stakeholders from the business environment such as local authorities, regulators/policy makers were contacted as required to provide an overview of the business environment. The BDS Market Assessment Survey took place in Rwanda from 14th - 25th November, 2008. The area of coverage of the survey research was Nyagatare and Gatsibo Districts covering the following sectors and sampling points:
Nyagatare BMN
Nyagatare Mbare
Gatsibo
• Bushoga • Karangazi • Kiramuruzi
• Tabagwe
New sites not included will be covered by Technoserve staff beyond the life of this consultancy. Sampling
� The sample included 316 interviews spread across the 3 sites. � 302 farmers were interviewed. � As per the briefing instructions, the teams covered a 20KM radius from the location
of the chilling plant. Depending on the number of locations located within the 20 KM radius, an equal number of sampling points were picked in each location to ensure spread of interviews.
� For each location, the team leader picked the starting point randomly, and using the random route method, farmers who fitted the set criteria were interviewed: Selection criteria included:
• Dairy farmer • Have mature milking cows
� Interviews were conducted on farmers who possessed up to 20 cows either being milked or dry currently. There was a shift from the earlier limit of 5 cows due to the widespread ownership of traditional cows in the region. Again it was also realized that even when farmers owned vast herds here, their milk production remained low as they keep indigenous cows that produce an average of between 1 and 4 liters each per day.
� The team traveled as one and on reaching the research site (village) members were dispatched in different directions. The left hand rule applied in selecting the dairy farmer to interview starting from a given landmark. This meant that once an interview took place, the interviewer moved 3 households keeping on the left hand side then interviewed the 4th household.
� However, the above rule was only applied where the population was dense and where farms were relatively big (over 10 acres), the skipping was limited to 1 household. At the household, the interviewers first spoke to the adult member of the family, mainly the husband or wife though at some instances, some other family members who were directly responsible for dairy farming gave information.

REPORT FOR BDS DIAGNOSTIC IN RWANDA FIT RESOURCES JANUARY 2009
9
� In Rwanda, farmers are allocated grazing land by Government in accordance with the size of cattle herd one has. A centralized area is then set aside where people are allowed to build their homes and the farms are located at a considerable distance away from their homes. This state of affairs meant that our interviewers in most cases could not physically see the cows to ascertain some claims by farmers.
� As for suppliers (14 were interviewed), the team picked supplier names from the farmers, other suppliers and also those they came across in the trading centres. From the list, a score was given to each and every supplier based on set criteria (capacity to deliver services, closeness to SMEs e.g. in terms of understanding their culture and geography, commercial focus e.g. level of profitability, focus on services, SMEs or BDS, organizational independence- especially from donor funds, legally registered and willingness/interest/ability to partner). This set of requirements not withstanding, and because of their scarcity, all suppliers listed were sought for interview, although a few could not be found.
Key challenges of the fieldwork
• Late start in Rwanda due to technical hitches and strict protocols e.g. Government requirement of research license
• Accessibility of some sectors o Transport – lack of efficient public transport. Tabagwe Sector is
approximately 20 kilometers away from Nyagatare Township and the only available mode of public transport was motorbikes.
o Rains – the timing of the study coincided with rainy season and this affected the movement.
• Special events – the arrest of a senior Rwanda Government official in Germany and the visit to Gatsibo district by Kenya’s President Kibaki coincided and interrupted fieldwork as farmers were called on to participate in the demonstrations and rallies that were organized by the Government countrywide.
• Few/ uncooperative BDS suppliers. Some of the BDS suppliers were either uncooperative or hard to find. There were very few BDS suppliers of dairy products and services and as such farmers have limited choices.
• Research fatigue – a good number of farmers complained of having participated in other recent agricultural and other types of surveys whose results and benefits they had no idea of.
• Questionnaire duration. Some respondents complained it was taking too long to go through a questionnaire. This was particularly so during the first few days when most of the interviewers took over one and a half hours (90 minutes).
Data processing
Research International processed all the data collected on an ongoing basis. Research International personnel have developed a database of actors (BDS providers in each of the areas under study are listed, categorized by service provision and their location recorded). A further database defines specific provider gaps and capacities including a score against agreed selection criteria for determining target partner providers. A database of the small and micro enterprises (SMEs) interviewed has also been developed. The full data set is attached to this report (Annexes/Databases). To understand the markets, RI examined three key issues - demand, supply and transactions (the interaction between demand and supply) during the market assessment.

REPORT FOR BDS DIAGNOSTIC IN RWANDA FIT RESOURCES JANUARY 2009
10
The outcome of analyzing this information forms a picture of each BDS market showing how it works, where the opportunities for growth are, and where significant problems lie. Data analysis was undertaken to profile the markets, establish comparative information on the in-country sites and the 3 markets and draw conclusions from the data. A round table meeting was held in early December 08 with stakeholders to overview the methodology and process of data processing and analysis and reach consensus on the priority constraints/opportunities and identify possible solutions. The meeting presentation is attached to this report (Annexes/ Process meetings). Sustainable solutions that address priority supply side and demand side constraints were discussed. Illustrative market based interventions were also developed with a focus on potentially sustainable/profitable services that are replicable in the private sector. Strategies which ensure effectiveness, efficiency and sustainability were also discussed alongside suggested BDS performance measurements. The data processing plan was then circulated for stakeholder feedback during the analysis process and the data plan is attached to this report (Annexes/Process meetings). Comparative information on the in-country sites and 3 BDS markets was also produced. Presentations
FIT Resources and Research International personnel collaboratively implemented a presentation and action planning at a stakeholder workshops in Rwanda with staff, consortium members and key informants on 9th January 09. This workshop included a short training presentation on the basic principles and practices of BDS and the Market Development Paradigm. All the research findings were presented and proposed illustrative solutions and performance measurements discussed. Feedback was recorded and an action plan developed. FIT Resources then prepared this final draft report and will present the final report to Technoserve with support from Research International in Nairobi, Kenya by FIT Resources and Research International on January 30th 2009. Key conclusions of the methodology
• Outsourcing the MA to a research company ensured a more effective and efficient MA process.
• A combination of outsourcing and internal capacity building ensured the best possible results. The likelihood of useful research results was ensured as EADD stayed close to the MA process.
• The ability of EADD staff to remain consistent to the process was questionable. Staff members were not always available for the trainings and meetings as required plus EADD field staff were not available to partner on the field work in some locations drawing into question the long term ability of field staff to implement further diagnostics in new locations.
• Determining a clear hypotheses and outlined MA goal and objectives ensured a more effective delivery of analysed data from Research International.
• The MA focused on a holistic picture of the market and incorporated both sides of the market equation—demand and supply.

REPORT FOR BDS DIAGNOSTIC IN RWANDA FIT RESOURCES JANUARY 2009
11
Findings of fieldwork and data analysis
CONSUMER SURVEY by location
Locations covered and key informants interviewed
Nyagatare BMN Bushoga Tabagwe
Nyagatare Mbare Karangazi
Gatsibo Kiramuruzi
Targeted SME consumers interviewed The consumer survey in Rwanda covered 302 respondents. The respondents qualified to be interviewed if they were small scale milk producers and specifically for Rwanda if they had less than 20 traditional cows. For every site covered, a minimum of 100 farmers were interviewed. Of the 302 respondents interviewed, 80 percent (243) were males while 20 percent (59) were females. A majority of the male respondents (26%) were aged between 36 – 45 years while for the females the majorities (32%) were aged 46 – 55 years. Only few respondents (4%) were aged between 18 – 25 years and above 64 years. Distribution of Respondents by age BASE=302
% of total sample interviewed
Males 80
Females 20
Most of the farmers practiced mixed farming –crop growing and cattle keeping. Expectedly and as per the recruitment procedure all respondents were dairy farmers. This was followed by food crop farming at 81%. Cash crop farming in the region is insignificant as only 3% of the respondents reported growing cash crop. As per the recruitment procedure all the respondents interviewed were the key decision makers on dairy farming activities. Currently, a majority (88%) of the farmers milk between 1 – 5 cows despite most of them having more than 5 cows. In terms of herds kept, Majority of the farmers in Nyagatare claimed to own more than 5 cows while in Gatsibo the proportion of those who have more than five was small. Farmers in the three sites were found to be keeping mixed breeds. However, a majority of them (84%) keep indigenous breeds. About half of the farmers interviewed also keep cross breeds 46% while those who keep pure breeds are less than 10%. The findings also indicated that Nyagatare-BMN had more pure breeds (14%) compared to Gatsibo and Nyagatare-Mbare where farmers claimed to own 8% and 4% of pure breeds.

REPORT FOR BDS DIAGNOSTIC IN RWANDA FIT RESOURCES JANUARY 2009
12
TOTAL Nyagatare
Mbare Nyagatare
BMN Gatsibo
BASE: 302 101 100 101
%
Pure breed 9 4 14 8
Cross breed 46 47 54 39
Indigenous 84 88 88 76
On average, farmers with pure breeds reported to produce 17 liters of milk per day while cross breeds produced 8.5 litres per day. Expectedly, the productivity for traditional breeds was reported to be the lowest. In terms of regions, Nyagatare BMN and Mbare farmers produce more milk per day with an average of about 10 litres per day compared to Gatsibo where daily production average was reported to be around 6.6 liters. Expectedly, the amount of milk sold per day on average within the three sites is less than the amount produced as some milk is spared for domestic use. The table below indicated the average amount of milk sold by farmers:
District Average liters produced per day per farm
Average liters sold per day
Difference (unsold milk - liters)
Nyagatare-Mbare 9.5 6.7 2.8 Gatsibo 6.6 5.5 1.1 Nyagatare-BMN 10.1 7.3 2.8
Across the three sites covered in the research, most of the farms were between 1 – 5 acres in size.
Market profiles
Awareness and affordability of services/ inputs When respondents were asked the dairy inputs/ services they are aware of, AI, mineral supplements, vet treatment services and veterinary vaccination were mentioned by more than 90% of the farmers. Other inputs that were mentioned by more than 60% of the respondents include insecticide and tick sprays and supplementary feeds. However, despite AI ranking as the service majority of the farmers were aware of (98%), complete familiarity of its benefit was rated below average. Across all services/ inputs in totality, farmers were least aware of chaff cutters and hay balers. Expectedly, almost all farmers were not familiar with the benefit of the two farm equipments. In terms of affordability, of the 7 top most inputs/ services that farmer were aware of, supplementary feeds, veterinary vaccination and AI were rated as highly unaffordable to farmers. The table below summarises some key inputs/ services that farmers are aware of

REPORT FOR BDS DIAGNOSTIC IN RWANDA FIT RESOURCES JANUARY 2009
13
in regard to familiarity with the benefits, availability, affordability and most important overall.

REPORT FOR BDS DIAGNOSTIC IN RWANDA FIT RESOURCES JANUARY 2009
14
On enquiring from the farmers the services/ inputs they have purchased or received in the past for their dairy animals, supplementary feeds and disinfectants were ranked lowest among the 7 top services farmers were aware of as shown in the figure below. However, farmers expressed concerns on the adequacy of most inputs/ services that they have received in the past 12 months. In terms of services/ inputs that were being used nowadays, only three performed averagely and above. These were mineral supplements 77%, insecticide and tick sprays 66% and veterinary treatment services 52%.
47
58
63
84
91
93
96
98
23
46
84
63
80
84
24
59
21
47
30
79
84
71
92
70
Aware
Completely familiar with benefit of Easily available
Information/training on animal husbandry
Disinfectants for Cleaning
Supplementary feeds
Insecticide and Tick sprays
Veterinary vaccination
Vet Treatment Services
Mineral supplements
Artificial Insemination (AI)
80
84
74
89
87
82
87
84
Very strongly needed
37
31
56
26
54
29
16
34
Most important overall
Not affordable even after saving up

REPORT FOR BDS DIAGNOSTIC IN RWANDA FIT RESOURCES JANUARY 2009
15
Services/inputs ever purchased or received Generally, the 3 markets do not indicate any significant differentials in the demand for services and inputs purchased or received. However, some slight differences were noted in Nyagatare (BMN & Mbare) where almost all farmers claimed to have vaccinated their animals and in Nyagatare Mbare where AI services were claimed to have been used by over 80% of the farmers. This may mean that the drive to transform herds from indigenous to cross breeds is at a higher level in Nyagatare which conforms to the breeds kept.
Services/Inputs ever purchased or received TOTAL
Nyagatare Mbare Gatsibo
Nyagatare BMN
BASE: Total Sample 302 101 101 100 %
Artificial Insemination (AI) 77 83 72 77 Veterinary treatment services 80 82 82 76 Veterinary vaccination 91 88 87 97 Supplementary feeds 34 33 38 31 Mineral supplements 94 96 99 87 Disinfectants - for cleaning and sterilizing 46 51 44 43
Insecticides & tick sprays 84 76 89 87 Although some farmers observed that through savings, they could purchase some of the services or inputs, milk coolers, supplementary feeds and veterinary vaccination were perceived to be out of reach by a majority. Those who said services/ inputs were not
47
58
63
84
91
93
96
98
7
46
34
84
91
80
94
77
Aware
1
33
12
66
48
52
77
40
67
39
71
37
23
45
30
52
Used nowadays Ever purchased
Inadequate amount
Purchased in P12M
Information/training on animal husbandry
Disinfectants for Cleaning
Supplementary feeds
Insecticide and Tick sprays
Veterinary vaccination
Vet Treatment Services
Mineral supplements
Artificial Insemination (AI)
4
45
24
82
82
74
92
62

REPORT FOR BDS DIAGNOSTIC IN RWANDA FIT RESOURCES JANUARY 2009
16
affordable were asked why they thought so. The following table provides a breakdown of some of the reasons advanced (sample: all who said not affordable):
Service/ product Total sample
So expensive could never
consider using
May be able to use if saves
up %
Artificial Insemination (AI) 79 34 66 Veterinary treatment services 104 29 71
Veterinary vaccination 57 54 46 Supplementary feeds 140 56 44 Mineral supplements 90 16 84 Disinfectants - for cleaning and sterilizing
85 31 69
Insecticides & tick sprays 126 26 74 Seeds to grow fodder 82 46 54
Milk testing kits 90 44 56 Hay bailers 87 47 53 Milk coolers 140 68 32 Metal milk churns 115 37 63 Information/training on animal husbandry
94 39 61
For the services/ inputs that farmers have received in the past, a majority of the farmers reported having paid something the last time to access certain services/ products. The fees paid ranged depending on the type of service, distance from where the service provider was coming from, among other things. The table below provides an average cost of different products and services offered to the farmers:
Artificial Insemination (AI)
Veterinary treatment services
Veterinary vaccination
Supplementary feeds
Mineral supplements
Disinfectants - for cleaning and sterilizing
Insecticides & tick sprays
BASE: All who ever received.... 234 242 274 102 284 139 254
%
Yes 93 98 95 86 98 96 97
No 7 2 5 14 2 4 3 Amount paid (mean in Fr) 4100 8900 1900 19100 10800 14400 11300

REPORT FOR BDS DIAGNOSTIC IN RWANDA FIT RESOURCES JANUARY 2009
17
Level of satisfaction with service/inputs received The following table shows the level of satisfaction with services/inputs received:
Level of satisfaction with service received last time
Art
ific
ial
Insem
inatio
n
(AI)
Vete
rinary
tr
eatm
ent
serv
ices
Vete
rinary
vaccin
ation
Supple
menta
ry f
ee
ds
Min
era
l supple
ments
Dis
infe
cta
nts
-
for
cle
anin
g
an
d
ste
riliz
ing
Insecticid
es
& tic
k s
pra
ys
BASE: All ever purchased/received service 234 242 274 102 284 139 254
Completely satisfied 42 74 94 54 87 77 85
Partly satisfied 34 21 6 34 12 22 13
Not at all satisfied 24 4 - 12 1 1 2
A majority of the farmers who accessed the seven most popular services/ inputs reported being satisfied with the quality and nature of services provided. For those reporting complete satisfaction, the lowest reported complete satisfaction was recorded among farmers who received Artificial Insemination (42%) while the highest was registered among farmers receiving veterinary vaccination at 94%. Other levels of satisfaction stood at 74% for veterinary treatment services, 54% for supplementary feeds, 87% mineral supplements, 85% for insecticides and tick sprays, and 77% for disinfectants for cleaning and sterilizing.
While there is room for improvement among those reporting complete satisfaction, particularly among those reporting lower than 90%, there is more to be done among those reporting partial satisfaction and those claiming not satisfied at all.
Areas where milk could be sold Respondents mentioned a number of possible areas where milk could be sold as presented below:
Area
Areas could sell milk TOTAL Nyagatare
Mbare Gatsibo Nyagatare
BMN BASE: Total Sample 302 101 101 100
% Bulking/ cooling center 75 88 60 75 Hawker/ brokers 57 70 29 72 Farmers cooperative /group /association 47 49 38 54 Direct to homes e.g. Neighbours or family members 47 49 49 45
Direct to institutions e.g. school, hospital, food kiosk 25 25 31 19
Milk bar 26 32 31 16
There were more farmers reporting milk bulking and collection centers as places where they could sell their milk. This was reported by 75% of the farmers. It was followed by

REPORT FOR BDS DIAGNOSTIC IN RWANDA FIT RESOURCES JANUARY 2009
18
hawkers/ brokers at 57%, and neighbors/ relatives and cooperatives/farmer groups tying at 47%, milk bars 26%, institutions 25%. However on being asked where they are selling milk currently a majority of them reported selling to brokers/ hawkers (52%) followed by neighbours/ family members, milk bulking/ cooling centers or to farmers associations. Interestingly, hawkers are not a popular buyer in Gatsibo district, while selling to neighbours and family members seem to be the most preferred here.
Types of customers TOTAL Nyagatare
Mbare Gatsibo Nyagatare
BMN
BASE: Total Sample 302 101 101 100
% Hawker 52 62 26 67 Cooling plant 47 51 47 42 Direct to homes e.g. Neighbours or family members 47 49 49 45 Farmers cooperative/group/association 47 49 38 54 Milk bar 26 32 31 16 Direct to institutions e.g. school, hospital, food kiosk 25 25 31 19
Bulking center 11 12 8 12 Processor 10 11 4 15 Broker at farm gate 5 8 3 5
However, in terms of preference among those who sell to more than 1 channel, ‘direct to homes’ and ‘farmers co-operatives’ emerged as the preferred buyers. Adequacy of information received on where could sell milk Asked to explain what they felt about the information they received regarding where they could sell their milk, a majority of the farmers indicated they received just enough information (72%). Only a paltry 2% reported receiving what they considered as a lot of information. However, farmers in Nyagatare BMN seem to be divided almost equally among those claiming to receive just enough information (52%) and those saying they received very little information (46%).
Info received TOTAL Nyagatare
Mbare Nyagatare
BMN Gatsibo BASE 302 101 100 101 %
Very little 26 23 46 11 Just enough 72 75 52 87
A lot 2 2 2 2 Asked to indicate the other services they enjoyed from their main buyers besides buying their milk, the majority of farmers (57%) reported receiving no other services at all. The table below shows some of the services received by farmers from some milk buyers:

REPORT FOR BDS DIAGNOSTIC IN RWANDA FIT RESOURCES JANUARY 2009
19
Services received TOTAL
Nyagatare Mbare
Gatsibo Nyagatare
BMN
BASE: Total Sample 302 101 101 100 %
Advance on milk payments 20 22 19 20 Farm inputs - seeds, fertilizer 5 2 6 8 Animal feeds/ supplements 7 6 6 8 Milk collection from the farm or near farm
6 5 4 10
AI services 7 4 4 12 Animal health services- treatment, vaccination and drugs
19 21 16 20
Training on animal husbandry 12 4 18 14 Information on market prices 8 11 5 9 Delivery/ transport of farm inputs and animal feeds 3 3 3 4 None 57 53 63 55
Of the services received, some farmers claimed to have paid for them while some were either not sure or did not pay anything. The main mode of payments for these services was the check-off system with only 28% claiming to pay in cash.
Services paid for (%)
Advance on milk payments 30
Farm inputs - seeds, fertilizer 31
Animal feeds/ supplements 50
Milk collection from the farm or near farm 26
AI services 50
Animal health services- treatment, vaccination and drugs 65
Training on animal husbandry 14
Information on market prices 8
Delivery/ transport of farm inputs and animal feeds 10
Extra services required from milk buyers When asked if they would require extra services from the milk buyers, majority of the farmers responded positively. Below is the list of services they would expect to get from the milk buyers:
Services/ inputs required TOTAL
Nyagatare Mbare
Gatsibo Nyagatare
BMN
BASE: Total Sample 302 101 101 100
%
Advance on milk payments 37 30 37 46
Farm inputs - seeds, fertilizer 18 14 22 18
Animal feeds/ supplements 30 23 36 33 Milk collection from the farm or near farm 25 23 25 27

REPORT FOR BDS DIAGNOSTIC IN RWANDA FIT RESOURCES JANUARY 2009
20
AI services 25 23 23 30 Animal health services- treatment, vaccination / drugs 29 28 35 26 Training on animal husbandry 30 25 31 35
Information on market prices 28 24 27 33 Delivery/ transport of farm inputs and animal feeds 18 16 19 18
None 33 31 41 29 In regard to payments for milk, 2/3 of the farmers indicated they are paid in cash after a specified period as shown in the table below. However, in Gatsibo, a significant number of farmers confirmed to receive money through their bank accounts. Two modes of payments also emerged as the most preferred means of receiving payments by farmers:
Mode of payment for sold milk TOTAL Nyagatare
Mbare Nyagatare
BMN Gatsibo BASE: Total Sample 302 101 100 101 % Paid cash on delivery 8 4 9 11
Paid in cash after a specified period 62 73 64 50 Cash deposited to a financial institution 14 9 14 18 Barter - exchange milk for other services 0 - - 1
Farmers who deliver milk to the formal market were asked how they deliver milk to the market. ¾ of the respondents claimed to deliver milk on their own to the market. However, in terms of the preferred mode, over ¾ of the farmers would prefer their milk to be picked up at farm gate. This pattern was similar in all the 3 markets:
Current milk delivery system TOTAL Nyagatare
Mbare Gatsibo Nyagatare
BMN Base 181 60 58 63
% The buyer provides for transport from the farm or near farm 25 33 12 29 Use your own means to transport (bike, walk) etc 75 67 88 71
Overall, among the farmers whose milk is collected by the buyer, slightly less than half felt it was either reliable or very reliable. However, in Gatsibo (though the base was small) the majority of the farmers rated the transport to be unreliable.
Buyer reliability TOTAL Nyagatare
Mbare Nyagatare
BMN Gatsibo BASE: All provided transport by the buyer 45 20 18 7

REPORT FOR BDS DIAGNOSTIC IN RWANDA FIT RESOURCES JANUARY 2009
21
% [wt=5] Very reliable 24 15 44 - [wt=4] Reliable 20 15 28 14
[wt=3] average 16 15 11 29 [wt=2] Poor unreliable 13 20 6 14 [wt=1] Very unreliable 27 35 11 43

REPORT FOR BDS DIAGNOSTIC IN RWANDA FIT RESOURCES JANUARY 2009
22
Frequency of milk collection Milk is collected generally once a day across the three regions:
Milk collection TOTAL
Nyagatare
Mbare
Nyagatare
BMN Gatsibo BASE: All provided transport by the buyer 45 20 18 7 %
Once in a day 93 95 89 100 Two times a day 4 - 11 - Three times 2 5 - -
Asked to express their feeling on whether they thought this was adequate or inadequate, a majority (62%) felt it was inadequate. However, in Nyagatare BMN, 56% of the respondents felt it was adequate.
Adequacy of Milk collection TOTAL
Nyagatare Mbare
Nyagatare BMN Gatsibo
BASE: All provided transport by the buyer 45 20 18 7
%
Adequate 38 30 56 14
Inadequate 62 70 44 86 Awareness of cooling plant Almost all respondents were aware of a cooling plant near them. Some of the cooling plants mentioned include:
• Mudakos
• Nyagatare cooling plant
• Mbare
• Terimbere mworozi (Karangazi)
• Rwabiharamba dairy
• Musenyi
• Bashumbambeza
• Karama
• Mubyatarama
• Kirebe
• Cyangarama
• Kamate A majority of the farmers (90%) also claimed that the cooling plants were owned by farmers’ cooperative groups in the region. Farmers stated they would expect to get the following services from the cooling plants:
Cooling plant services Total Nyagatare
Mbare Gatsibo Nyagatare
BMN BASE: Total Sample 302 101 101 100
Credit facility 74 69 72 81

REPORT FOR BDS DIAGNOSTIC IN RWANDA FIT RESOURCES JANUARY 2009
23
Farm inputs - seeds, fertilizer 46 42 48 48 Animal feeds 62 51 67 67 Milk collection from the farm or near farm 54 55 44 62 AI services 57 51 57 63
Animal health services - treatment and prevention 74 70 78 72 Vaccination and drugs 71 64 69 80 Training on animal husbandry 58 58 50 66 Information on market prices 74 69 72 81
Credit facility, animal health services – treatment and prevention and information on market prices emerged as the key services farmers need, although most of the other services and inputs are also needed at varying levels which reflects a very high demand. Asked if they would be happy with check-off as mode of payment for their milk, nearly all farmers (93%) said that they would be very happy.
Reaction to check-off payment system TOTAL
Nyagatare Mbare Gatsibo
Nyagatare BMN
BASE: Total Sample 302 101 101 100
% Happy 93 92 92 95 Not sure 4 2 7 3 Unhappy 3 6 1 2
Skills/ information needed by farmers Majority of the farmers (83%) indicated they do not have the skills needed for good dairy farming across the 3 regions. When asked to mention the areas they needed more information on, the following emerged:
Skills/info required TOTAL Nyagatare
Mbare Gatsibo Nyagatare
BMN
BASE: Total Sample 302 101 101 100
Disease id, treatment & prevention 72 76 77 63
Improvement of milk production 66 71 61 66
Drug administration 61 62 60 59
New animal feeds 60 64 55 59
Milk prices 55 53 55 57
Cattle breeding 54 57 41 64
Dairy farm record keeping 30 34 25 31
Record keeping 25 21 26 28
Public health issues and requirements 22 19 27 21
Awareness of government policies 19 17 20 21
Buyers 13 11 14 13
Whether ever received any useful information Farmers were asked whether they had ever received any useful information about dairy farming. About 69% reported not to have received any. The same trend was recorded

REPORT FOR BDS DIAGNOSTIC IN RWANDA FIT RESOURCES JANUARY 2009
24
from the three regions. Those reporting having received useful information were then asked to indicate what services they had received. The advice/ information were mainly stated to be from government extension workers and to some extent, the NGO’s. The following Table shows the breakdown:
Info received TOTAL Nyagatare
Mbare Gatsibo Nyagatare
BMN BASE: All ever received information 93 24 36 33 %
Improvement of milk production 54 50 56 55 Awareness of government policies 33 25 28 45 Cattle breeding 32 33 25 39 New animal feeds 24 25 25 21 Disease identification, treatment and prevention 19 17 25 15 Drug administration 18 8 28 15
Dairy farm record keeping 10 13 8 9 Record keeping 2 - 3 3 Public health issues and requirements 1 - 3 - Milk prices 1 - - 3
Whether plans to change anything Asked whether they planned to change anything about their dairy farming in the next 1 year, nearly all farmers indicated they have some plans in mind. However, 85% of the farmers highlighted breed improvement as the key change they would like to implement. The figure below shows areas farmers mentioned they would like or plan to improve on in the next 1 year. Planned changes for farm and dairy improvement:
11%
12%
15%
15%
23%
23%
85%
33%
32%
31%
30%
30%
28%
23%
Improve breeding / breed of cattle through breeding
methods / use AI
Improve building
Change feeding to zero grazing
Improve feed through growing better / more feed
Enlarge size of herd / Buy more cattle
Improve the veterinary treatment / drugs used on
cattle
Improve my knowledge about dairy farming
Improve feed by buying supplements
Group together with other farmers / join association
/ join coop / join producer group
Improve the management of my dairy as a business
Grouping with other farmers to get cheaper inputs
Buy farm equipments
Improve feed storage methods
Improve the quality of my milk / improve my milk
handling skills

REPORT FOR BDS DIAGNOSTIC IN RWANDA FIT RESOURCES JANUARY 2009
25
REPORT FOR BDS DIAGNOSTIC IN RWANDA FIT RESOURCES JANUARY 2009
26
To achieve the above desired changes farmers mentioned the following measures as drivers they are definitely likely to adopt:
• Grouping together with other farmers or joining co-operative to benefit from economies of scale - e.g. cheap farm inputs
• Use of AI services
• Growing of more and quality feed
• Enlarging size of herd
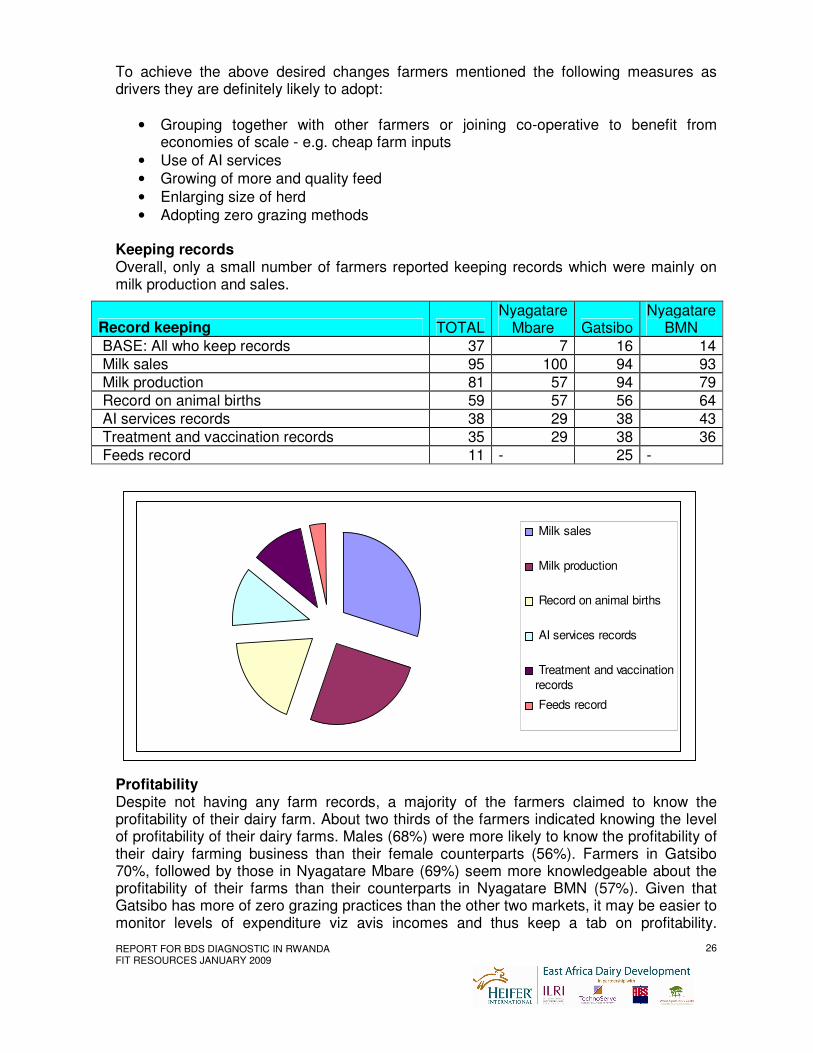
• Adopting zero grazing methods Keeping records Overall, only a small number of farmers reported keeping records which were mainly on milk production and sales.
Profitability Despite not having any farm records, a majority of the farmers claimed to know the profitability of their dairy farm. About two thirds of the farmers indicated knowing the level of profitability of their dairy farms. Males (68%) were more likely to know the profitability of their dairy farming business than their female counterparts (56%). Farmers in Gatsibo 70%, followed by those in Nyagatare Mbare (69%) seem more knowledgeable about the profitability of their farms than their counterparts in Nyagatare BMN (57%). Given that Gatsibo has more of zero grazing practices than the other two markets, it may be easier to monitor levels of expenditure viz avis incomes and thus keep a tab on profitability.
Record keeping TOTAL Nyagatare
Mbare Gatsibo Nyagatare
BMN
BASE: All who keep records 37 7 16 14
Milk sales 95 100 94 93
Milk production 81 57 94 79
Record on animal births 59 57 56 64
AI services records 38 29 38 43
Treatment and vaccination records 35 29 38 36
Feeds record 11 - 25 -
Milk sales
Milk production
Record on animal births
AI services records
Treatment and vaccination
records
Feeds record

REPORT FOR BDS DIAGNOSTIC IN RWANDA FIT RESOURCES JANUARY 2009
27
Nyagatare BMN, which has bigger herds of the indigenous cattle, may still have more farmers who keep cattle for traditional values rather than as business.
Awareness on farm profitability TOTAL Nyagatare
Mbare Gatsibo Nyagatare
BMN
BASE: Total Sample 302 101 101 100
Yes 66 69 70 57
No 34 31 30 43 Technology (mobile phones) Penetration of mobile phone within the three areas is high as attested by the table below. Generally, about 82% of the farmers reported owning/ having access to a mobile phone. This was almost uniformly distributed across all segments.
Mobile phone access TOTAL Nyagatare
Mbare Gatsibo Nyagatare
BMN BASE: Total Sample 302 101 101 100 %
Yes 82 80 84 82 No 18 20 16 18
Asked which services they would like to access via the mobile phone sms service, cow disease alerts, milk prices, and market for breeds, availability of new products, and training/ field days/ dairy farming workshops emerged as the five leading pieces of information they would require.
Info required by phone TOTAL Nyagatare
Mbare Gatsibo Nyagatare
BMN BASE: All with/ have access to a mobile phone 248 81 85 82 Cow disease alerts 75 73 73 78 Milk prices 72 70 64 83
Market for breeds 71 69 69 74 Availability of new products and services 62 63 64 60 Trainings/ field days/ dairy farming workshops 61 58 64 61 Availability of milk payments 50 47 44 60 New markets 50 48 39 65 Sale of cows 50 57 41 52
Quantity of milk supplied 48 51 45 49 New market opportunities 48 44 40 60 Access to loans 38 32 41 39
Farmers indicated high willingness to pay fees ranging from Fr 1000- 2100 to be able to access these services. See the figure below:

REPORT FOR BDS DIAGNOSTIC IN RWANDA FIT RESOURCES JANUARY 2009
28
Capital Almost all farmers indicated that they require capital to develop their dairy farming business. Most of the farmers (61%) say they would seek credit from banks. See table below:
Credit options TOTAL Nyagatare
Mbare Gatsibo Nyagatare
Bmn BASE: All need lump sum/ capital 278 90 99 89
Banks 61 61 64 58 Micro finance institutions 13 12 12 16 Cooperative SACCO 8 6 8 11
Cooling plant 6 7 7 4 No source 4 4 4 4 NGOs 3 4 4 1
Family/ friends 3 4 1 2 Suppliers 1 1 - 1 Government 0 - - 1
Awareness of farmer lobby organization Only a few farmers were aware of an organisation that looks after their needs apart from Gatsibo where 45% claimed to be aware:
72
71
62
61
50
50
50
48
48
38
37
68
67
65
54
57
42
45
44
40
41
35
33
75 Cow disease alerts
Milk prices
Market for breeds
Availability of new products and services
Trainings/field days/dairy farming workshops
Availability of milk payments
New markets
Sale of cows
Quantity of milk supplied
New market opportunities
Access to loans
Milk rejected at processor level to inform farmer
Info would be ready to pay for
Info would like to access via mobile phone

REPORT FOR BDS DIAGNOSTIC IN RWANDA FIT RESOURCES JANUARY 2009
29
Awareness of organization TOTAL
Nyagatare Mbare Gatsibo
Nyagatare Bmn
BASE: Total Sample 302 101 101 100 %
Yes 38 30 45 39 No 62 70 55 61
In regard to membership to a farmer’s co-operative majority of the farmers belongs to none. However, in Nyagatare BMN slightly over half claimed to be members of a cooperative.
Whether member of a Cooperative TOTAL
Nyagatare Mbare Gatsibo
Nyagatare Bmn
BASE: Total Sample 302 101 101 100
Yes 45 34 49 53
No 55 66 51 47
Challenges faced by farmers Low and fluctuating milk prices coupled with delayed payments, inadequate and low quality foliage for feeding cattle – e.g. grass and Napier grass, irregularity and unaffordability of AI services and unaffordable/ unreliable animal treatment services were some of the key challenges farmers highlighted as major constraints to their dairy farming. Low milk prices combined with fluctuating milk prices and delayed milk payments accounted for the highest single challenge at 67%. In terms of gender, there were no significant variations although the findings seem to indicate that male farmers were significantly (74%) more likely to complain about low / fluctuating milk prices/ delayed payments compared to their female counterparts (37%), while female farmers were significantly (82%) more inclined to complain about inadequate/ low quality animal foliage than their male colleagues (58%). The same trend was noticed for irregular/ unaffordable AI services. Age wise, there were no significant differentials across except that farmers aged less than 35 years were significantly less likely to complaint about the adequacy/ quality of foliage than their counterparts in higher age groups. As per the markets, Gatsibo records the lowest complaint about low milk prices (51%) as compared to the 2 Nyagatare Sectors – BMN 82%, and Mbare 68%. Perhaps this can be explained by the fact that Gatsibo reports the lowest milk output, (and thus higher prices) and less dependence on milk brokers unlike the other two. However, Gatsibo reports the highest complaint (72%) regarding adequacy/ quality of foliage available in the region – reflecting its bigger dependency on zero grazing for its dairy farming. BMN records the lowest at 55% mirroring its larger grazing fields. Other challenges mentioned are as per the table below:
Main
Gender Age Region

REPORT FOR BDS DIAGNOSTIC IN RWANDA FIT RESOURCES JANUARY 2009
30
challenges/ constraints facing farmers
TOTAL Male
Female
18-35
36-55
56+ Nyagatare Mbare
Gatsibo
Nyagatare BMN
BASE: Total Sample 302 243 59 76 143 83 101 101 100
Low/fluctuating milk prices/ delayed payments 67 74 37 71 60 74 68 51 82
Inadequate/ low quality foliage - e.g. grass, napier grass etc 63 58 82 38 68 70 62 72 55 Irregular/ unaffordable AI services 55 58 41 58 47 66 61 45 59 Unreliable/ unaffordable animal health services 46 46 46 46 44 53 38 45 56 Unreliable source/ unaffordable supplementary feeds 43 44 37 46 37 48 45 33 52 Inaccessible loan facilities (high interest etc) 37 38 32 41 35 31 30 42 40 Poor climatic conditions 32 34 24 33 37 27 38 26 33 Lack of various dairy management skills 19 20 16 9 20 27 19 13 26
Disease outbreaks 13 14 8 13 15 12 12 10 18
Insecurity 10 10 10 3 13 12 5 23 3 Exploitation by middle men 8 9 3 10 6 11 11 1 12 Unavailability of quality seed for growing feed on farm 7 7 7 7 6 8 9 5 6 Unavailability of milk cooling facility 5 5 5 6 4 8 6 5 4 High transport cost 4 5 3 2 5 7 4 5 4 Inaccessible roads 2 2 - 1 2 3 2 - 3

REPORT FOR BDS DIAGNOSTIC IN RWANDA FIT RESOURCES JANUARY 2009
31
Key demand side constraints and opportunities
The following are the constraints and potential opportunities. Constraint Opportunity
Inadequate foliage and grass to feed animals due to poor climatic conditions – draught.
• Provide seed to grow fodder to selected farmers who have larger farms. They can thus sell to others at competitive prices
• Introduce supplementary feeds Irregular and unaffordable AI services
• More AI providers needed at main trading centres at village level
• Establish scheduled visits by AI providers to all villages
• Train farmers on basic procedures of conducting AI
Inaccessible/ unaffordable loans to promote dairy farming.
• Provide easily accessible/ affordable financial products that are developed/ tailored to meet farmer needs
Low and fluctuating milk prices hindering farmers from planning their future
• Establish more strategic milk collection/ cooling centres
• Improve on roads to facilitate easy/ cheaper milk transport
• Establish a local dairy processing plant Poor/ unreliable animal treatment and vaccination services
• Additional veterinary doctors needed at village level
• Further training for skill upgrading for vet technicians
Unaffordable supplementary feeds beyond the reach of many small scale farmers Unreliable source of supplementary feeds
• More suppliers needed
• Use of locally available raw materials need to be explored to make them affordable
• More farmers should be trained on how to prepare them
Disease outbreaks • Modern lab testing facility established in the region
• Vaccination of cattle strengthened
Business development services that address those constraints and opportunities
The following table outlines the BDS that address these constraints and opportunities: Constraint Opportunity BDS that address those
constraints & opportunities
Inadequate foliage and grass to feed animals due to poor climatic conditions – draught.
• Provide seed to grow fodder
• Supplementary feeds
INPUT SUPPLY such as creating links between farmers and suppliers and enabling suppliers to reach more farmers and develop their capacity to offer better quality inputs.

REPORT FOR BDS DIAGNOSTIC IN RWANDA FIT RESOURCES JANUARY 2009
32
Irregular and unaffordable AI services
• More AI providers needed at main trading centres at cell level
• Scheduled visits by AI providers to all villages
INPUT SUPPLY such as facilitating links between farmers and AI suppliers and enabling suppliers to reach more farmers and develop their capacity to offer better, less expensive inputs.
Inaccessible/ unaffordable loans to promote dairy farming.
• Easily accessible/ affordable financial products developed tailored to meet farmer needs by banks and MFIs
• Major milk buyers e.g. dairy cooperatives consider introducing simple financial products that are affordable by the farmers
FINANCE such as helping farmers identify and access funds through formal and alternative channels that include supplier or buyer credits, factoring companies, equity financing, venture capital, credit unions and commercial banks (letters of credit, etc.)
Low and fluctuating milk prices hindering farmers from planning their future
• Establish more milk collection /cooling centres
• Improve on road networks
• Establish locally a dairy processing plant to take advantage of the excess milk.
MARKET ACCESS such as identifying and establishing new markets for products plus the creation of links between all the actors and helping buyers to expand their outreach to, and purchases from, farmers. This may also include helping farmers to produce to buyer specifications. INFRASTRUCTURE such as establishing sustainable infrastructures that enable farmers to increase sales and income e.g. refrigeration, processing facilities, transport systems, communication centers, and improved roads.
Poor /unreliable animal treatment and vaccination services
• Additional veterinary/vaccination doctors needed at village level
• Further training for skill upgrading
• Scheduled visits to villages to attend to farmer needs
INPUT SUPPLY as above TRAINING & TECHNICAL ASSISTANCE such as workshops to develop the capacity of farmers and suppliers to better plan and manage their operations and improve their technical expertise. This may also include fostering links between service providers and farmers.
Unaffordable supplementary feeds beyond the reach of many
• More suppliers needed
• Use of locally available raw materials need to
INPUT SUPPLY as above. This may also include encouraging more potential suppliers to meet
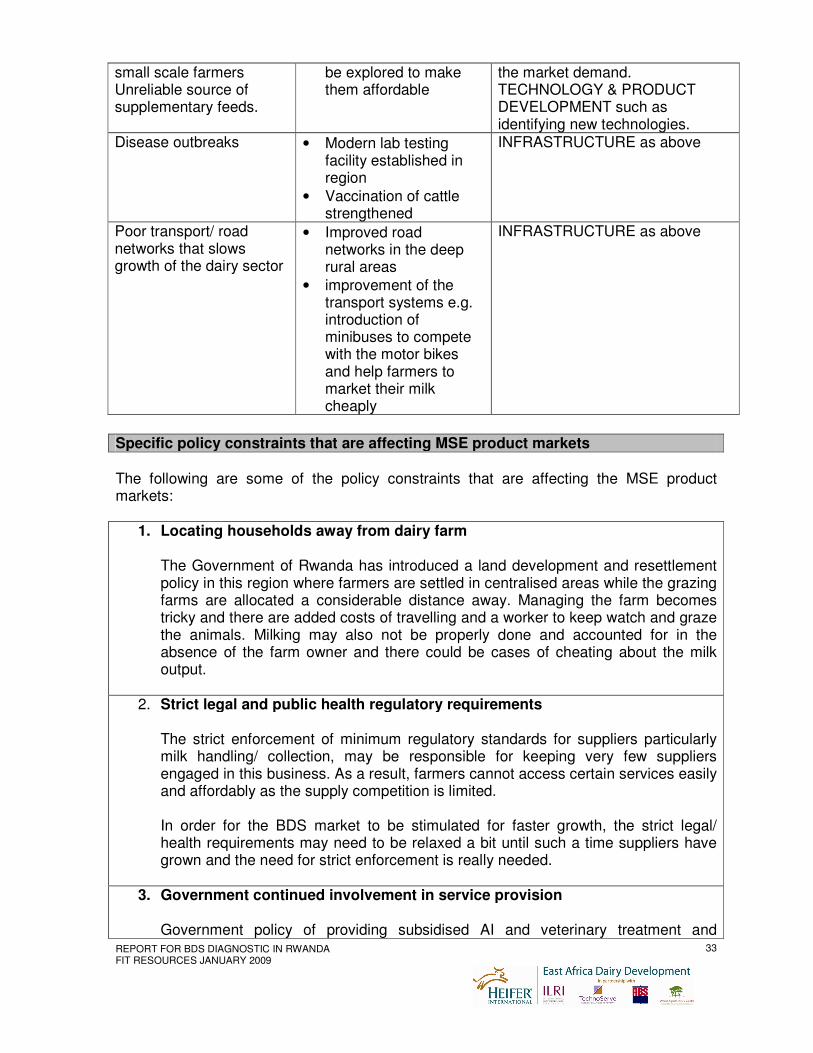
REPORT FOR BDS DIAGNOSTIC IN RWANDA FIT RESOURCES JANUARY 2009
33
small scale farmers Unreliable source of supplementary feeds.
be explored to make them affordable
the market demand. TECHNOLOGY & PRODUCT DEVELOPMENT such as identifying new technologies.
Disease outbreaks • Modern lab testing facility established in region
• Vaccination of cattle strengthened
INFRASTRUCTURE as above
Poor transport/ road networks that slows growth of the dairy sector
• Improved road networks in the deep rural areas
• improvement of the transport systems e.g. introduction of minibuses to compete with the motor bikes and help farmers to market their milk cheaply
INFRASTRUCTURE as above
The following are some of the policy constraints that are affecting the MSE product markets:
1. Locating households away from dairy farm
The Government of Rwanda has introduced a land development and resettlement policy in this region where farmers are settled in centralised areas while the grazing farms are allocated a considerable distance away. Managing the farm becomes tricky and there are added costs of travelling and a worker to keep watch and graze the animals. Milking may also not be properly done and accounted for in the absence of the farm owner and there could be cases of cheating about the milk output.
2. Strict legal and public health regulatory requirements
The strict enforcement of minimum regulatory standards for suppliers particularly milk handling/ collection, may be responsible for keeping very few suppliers engaged in this business. As a result, farmers cannot access certain services easily and affordably as the supply competition is limited. In order for the BDS market to be stimulated for faster growth, the strict legal/ health requirements may need to be relaxed a bit until such a time suppliers have grown and the need for strict enforcement is really needed.
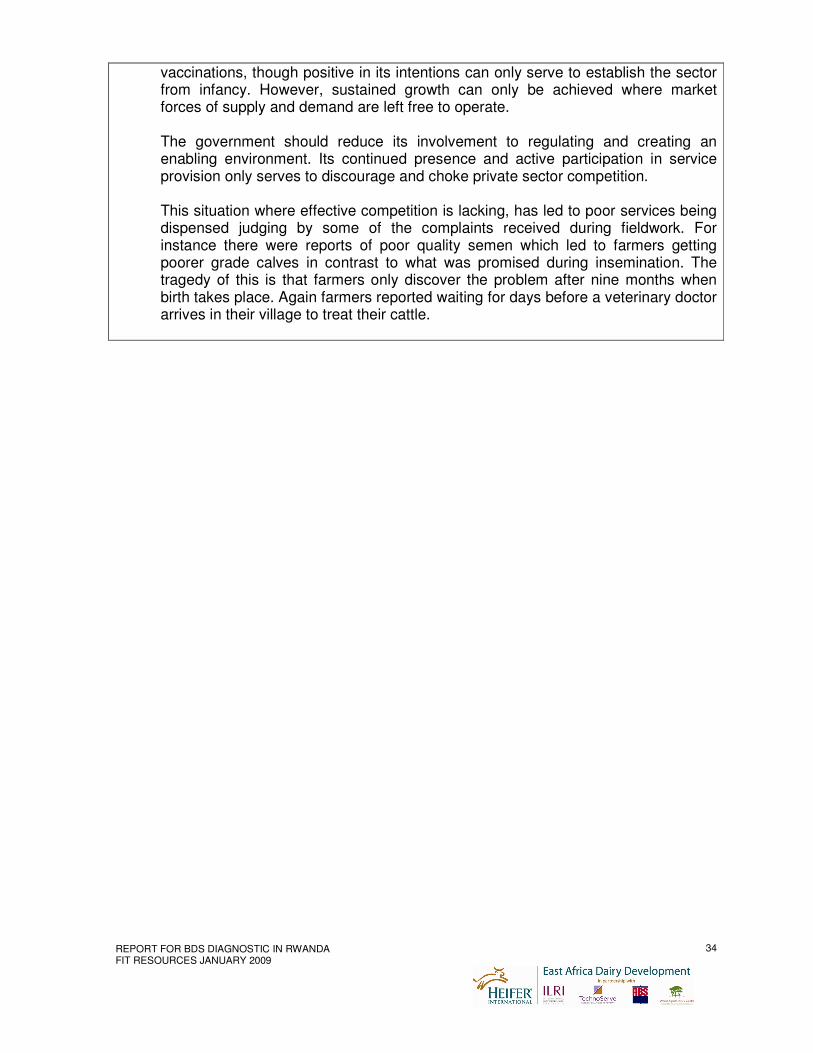
3. Government continued involvement in service provision
Government policy of providing subsidised AI and veterinary treatment and
Specific policy constraints that are affecting MSE product markets
REPORT FOR BDS DIAGNOSTIC IN RWANDA FIT RESOURCES JANUARY 2009
34
vaccinations, though positive in its intentions can only serve to establish the sector from infancy. However, sustained growth can only be achieved where market forces of supply and demand are left free to operate. The government should reduce its involvement to regulating and creating an enabling environment. Its continued presence and active participation in service provision only serves to discourage and choke private sector competition. This situation where effective competition is lacking, has led to poor services being dispensed judging by some of the complaints received during fieldwork. For instance there were reports of poor quality semen which led to farmers getting poorer grade calves in contrast to what was promised during insemination. The tragedy of this is that farmers only discover the problem after nine months when birth takes place. Again farmers reported waiting for days before a veterinary doctor arrives in their village to treat their cattle.

REPORT FOR BDS DIAGNOSTIC IN RWANDA FIT RESOURCES JANUARY 2009
35
SUPPLIER DIAGNOSTIC by location
Existing providers/ services and their locations The following breakdown shows how suppliers were distributed across this region. A total of seven suppliers were identified in Nyagatare/ Tabagwe sectors. However, only six were found/ interviewed. In Karangazi sector, six suppliers were listed but only five were found/ interviewed. In Kiramuruzi sector four suppliers were identified but only three were found and interviewed. A workable data base of the BDS actors A workable data base of these BDS providers is attached to this report (Annexes/Databases). BDS suppliers interviewed
List of suppliers interviewed as attached above.
Types of services and price of services, how providers cover costs, profitability, existing contractual arrangements/relationships and promotional/marketing strategies Types of services The common services/ inputs provided in this area include veterinary treatment and vaccination services, mineral supplements, insecticide and tick sprays, and disinfectants for cleaning and sterilizing, and supplementary feeds. Others are information/ training in animal husbandry and artificial insemination (AI). Across the two districts, it appears that the services provided are similar although Nyagatare District could be defined as more of a cattle keeping district while Gatsibo would qualify more as an area of mixed farming practices with less land for cattle rearing. Grazing fields are therefore bigger in Nyagatare than in Gatsibo.
Services/ inputs provided Nyagatare BMN (No of suppliers –
BASE=6)
Nyagatare Mbare (No of suppliers
BASE=5)
Gatsibo (No of suppliers
BASE=3)
Vet treatment services 6 5 3
Disinfectants - for cleaning and sterilizing
6 5 3
Mineral supplements 3 5 3 Info/training in animal husbandry
5 4 2
Insecticides & tick sprays 6 2 2 Supplementary feeds 2 1 2 Milk testing kits 2 3 1
Seeds to grow feed 2 2 2

REPORT FOR BDS DIAGNOSTIC IN RWANDA FIT RESOURCES JANUARY 2009
36
One of the AI providers told of cases where they are sometimes forced to forego payments when they come across needy farmers who are unable to pay for services.
Such costs are absorbed through government subsidiaries like ERAGIC – an institution that promotes modern dairy development through easy access to AI services.
Price of services and how providers cover costs/ profitability Across the 3 sites, suppliers interviewed indicated that they do not charge their customers for any information they dispense concerning dairy farming. They make their money and profits by selling/ charging for the conventional products and services provided like selling drugs, AI provision or treatment of cows. When pricing services and inputs suppliers considered several factors to arrive at a given price, as follows:
• Wholesale price of input from source
• Transport cost/ distance covered if it is an outreach service
• Taxes payable on service/ input
• Rent
• Whether demand for input/ service is high or low
• Competition
• Profit margin
• Big suppliers like Agrotech Nyagatare who is associated with Agrotech chain of animal drug shops, explained that they do not determine prices, but that the prices are dictated from the head office in Kigali.
• For instance, some AI providers reported buying semen to fertilize one cow at 500 fr from the Government agents only to sell this at 1500 fr to the dairy farmer. Besides, the farmer pays transport cost separately. Usually, this will be the cost of hiring a motor bike by the AI provider.
The commonest form of payment for services/ inputs rendered was cash after service, across all types of service providers. When the service provider is a Cooperative or an Association of farmers, members enjoy the check-off system facility which allows them to pay later through deductions from their weekly/ monthly payment for milk deliveries. Other forms of payment options are delayed/ staggered payment and payment by cheque. Staggered payment is normally allowed for instance where a cow is either dry or sick until it heals and resumes being milked. Should it die, then the charges are written off - if it is only one. The following table shows the common modes of payments for services and the associated challenges.
Vet vaccination 2 1 Milk collection/ bulking 2 2 Milk advance payments or credit services
2
Artificial Insemination 2 2
Information on dairy markets
1 1 1
Metal milk churns 2 1

REPORT FOR BDS DIAGNOSTIC IN RWANDA FIT RESOURCES JANUARY 2009
37
Nature/ type of business
Common payment modes
Challenges associated with payment modes
Supplier preferred modes of payment
Cooperatives Check off, cash, delayed/ staggered
Follow ups expensive/ time consuming
Check-off, cash
Private firm/ proprietor Cash, cheque Bouncing cheques Cash
Government/ NGOs Cash (subsidized), delayed/free
Expensive & time consuming follow ups
Cash/free
However, suppliers reported that they face some challenges using the check-off system. Some suppliers complained that there were occasions when farmers called them for treatment emergencies on their cows only to be informed after the treatment that there was no money for payment until later. The biggest complaints with the various forms of payments were associated with cheques due to dishonesty and staggered/ delayed payments as it was both time consuming and expensive to make a follow-up on the farmer. Suppliers prefer to deal in cash with their customers as it is easy and efficient. Check-off is preferred only where members of associations or cooperatives are involved. Contracts In terms of contractual arrangements for supply of goods and services, a good number of the suppliers had ever entered into such arrangements. Of the 14 suppliers interviewed, 7 reported being in some form of contractual arrangements with Nyagatare Sector having 5 and Gatsibo 2. In Nyagatare BMN one supplier reported having entered into contractual arrangements with 10 groups of farmers and another with 300 individuals. In Nyagatare Mbare, a supplier had entered into a contractual arrangement with one group of farmers, while another had entered with 4 individual farmers while yet another had entered with both a group of farmers and individual farmers. In Gastibo, 2 suppliers reported having entered into contractual arrangements with individual farmers. One of these agreements was for the supply of semen/ hormones to fertilize cows. Another one was simply an Agrotech branch in Nyagatare getting supplies from Agrotech head office in Kigali. The contracts were both written and verbal and were entered mostly with farmer groups and individuals as well. In terms of Contractual arrangements we can say that Nyagatare BMN is more advanced than the other two markets. The following table provides an outline of the suppliers and the various aspects of contractual arrangements:

REPORT FOR BDS DIAGNOSTIC IN RWANDA FIT RESOURCES JANUARY 2009
38
Who entered Contracts with
Number in contracts in each market
Nyagatare BMN
Nyagatare Mbare Gatsibo
With a group 10 1 None
With an individual 300 4 2 Both individuals & groups None 2 None NA 4 2 1 Nature of Contracts
Written 1 2 1 Verbal 1 1 2
None 4 2 - Reasons for signing Contracts For better/ easier follow-up & auditing Yes Yes - Encourage farmers to buy our products Yes - - To reach small scale farmers in deep rural areas
Yes - -
To ensure farmers can pay us later - Yes - To be able to advance loan facilities - - Yes
Promotional strategies The commonest marketing strategies in the 3 sites include public meetings, use of satisfied customers (word of mouth) signboards and posters. In Gatsibo and BMN suppliers said they ensure their shops are located in strategic points for maximum visibility and access. In Nyagatare BMN, radio adverts, outreach services and use of regional representatives are also used in addition.
How suppliers create awareness Nyagatare BMN
Nyagatare Mbare
Gatsibo
Public meetings Yes Yes Yes Signboards/ posters Yes Yes Yes Satisfied customer/ word of mouth Yes Yes Yes Providing quality products/ services Yes Yes - Strategic locations for business premises
Yes - Yes
Outreach visits Yes - -
Media adverts (Radio) Yes - - Use regional reps to penetrate areas Yes - -
Capacity gaps of interviewed suppliers The key capacity gaps identified among BDS suppliers include the following
• Lack of capital to improve and expand business. This is particularly acute in the transport of milk to the market centers both locally and outside the region.

REPORT FOR BDS DIAGNOSTIC IN RWANDA FIT RESOURCES JANUARY 2009
39
• Lack of training on how to do conduct certain services like AI. This means some suppliers have to depend on others to do things they would have done – with some training.
• Lack of proper/ sufficient equipment and facilities. For instance some suppliers need basic lab equipment in order to diagnose animal diseases with some accuracy and thereby provide the correct drugs.
• Identifying/ accessing the skilled experienced Vet Technicians to support the suppliers is a major challenge.
• Lack of well trained staff to handle milk as required in accordance with public health.
• Ignorance and lack of knowledge is also common among some suppliers. Suppliers need to be knowledgeable enough in particular with the BDS sector they are dealing in.
• Keeping to the required regulatory/ sectoral standards has become difficult for some like premises, official documents, and mandatory training etc.
Priority supply side constraints, market failures, and market opportunities Key supply side constraints/ market failures
• Long distances and bad roads that farmers have to cover to reach suppliers and vice versa.
• Lack of an efficient public means of transport.
• Limited demand of dairy services and products owing to a depressed farmer income due to low milk sales/ price.
• Lack of stock of highly demanded products services.
• Farmers lack efficient communication tools like mobile phones that can ease communication between them and their suppliers.
• Few qualified technical staff hence sometimes delayed response to farmers’ requests.
• Government and NGO interference in service/ input provision at subsidized rates hence creating an artificial market environment. The price levels existing are not sustainable if subsidies are removed.
• Some of the AI providers have not been trustworthy and on many occasions they have promised farmers certain type of crossbreed/ pure breed and charged them accordingly, only for the farmers to get poor quality calves. In other words, what AI providers promise is not what farmers always receive.
• Lack of access to affordable capital was also mentioned by many suppliers as a key constraint. This became an issue when they wanted to expand their businesses. The situation is made worse by local banks who demand security for any credit advanced.
• Limited laboratory services that can boost accuracy in diagnosis of animal diseases and proper drug administration.
• Meeting the mandatory minimum legal requirements is sometimes a big challenge for suppliers to set up or expand their businesses.
• Lack of adequate back-up power/ maintenance skills to assure good milk even when there was power failure. Sometimes power goes off and the back-up generators fail to work due to poor maintenance practices. When this happens, all milk collected goes to waste. Farmers cannot also sell their next days milk until the problem is sorted out.

REPORT FOR BDS DIAGNOSTIC IN RWANDA FIT RESOURCES JANUARY 2009
40
Market opportunities In view of the foregoing discussion, the following were found to be potential market opportunities:
• Need to enhance milk collection/ bulking: The survey established that in each of the three markets there existed one or two cooling plants/ milk collection points. None of these cooling plants had the capacity to collect all the milk coming in from farmers in their catchment areas. As a result, some milk is returned to farmers when the tanks get filled up to capacity. This, coupled with the national campaign to transform cows to higher milk producing grades among farmers, means that the need for more storage and transport facilities is very urgent. More cooling plants will need to be established to cater for the increased milk in a site far away from the current cooling plant. This would reduce distances traveled to access the milk collection centers by dairy farmers. Reduced distances may also encourage farmers to deliver their milk instead of relying on middlemen and thereby increase their earnings.
• There is need for improved milk transportation from farms to the collection centers in additional to milk tankers being added to assist in efficient transporting of milk to the markets in Kigali and other parts of Rwanda. This may call upon local investors to introduce pick-up trucks to transport the milk efficiently and thus do away with the numerous exploitative milk middlemen.
• Efficient supply of affordable supplementary feeds, foliage and mineral supplements: This is an area that has the potential to grow very fast in the next few years. This is particularly so given the government drive to have farmers adopt modern dairy farming techniques. As farmers discard the traditional cows in favour of the higher grade cows, there will be a commensurate demand for appropriate feeds/ fodder and mineral supplements. This is also strengthened by the fact that land for grazing is getting smaller and zero grazing is being seen as the solution for the future.
• Improved AI services: With the shift to modern dairy farming in top gear in the region, there is need to enhance the provision of reliable AI services to assist in the transformation of local herds.
• Under the same assumption, another potential opportunity is the provision of seed to grow fodder. This would provide feed to the higher grade cows with zero grazing being encouraged.

REPORT FOR BDS DIAGNOSTIC IN RWANDA FIT RESOURCES JANUARY 2009
41
Comparison of interviewed suppliers
The following table provides a summarized synthesis of the comparison of the interviewed providers:
Aspect being rated Nyagatare BMN Nyagatare Mbare Gatsibo TOTAL
Capacity to deliver services
4 5 3 5 5 3 4 4 4 5 5 4 5 56
Closeness to SMEs (In terms of understanding their culture and geography
5 5 3 5 4 3 4 2 4 5 4 4 4 52
Commercial focus e.g. level of profitability
4 3 3 4 5 4 5 5 4 4 3 4 4 52
Focus on services, SMEs or BDS
4 4 3 3 4 3 5 3 4 4 4 4 4 49
Organizational independence- especially from donor funds
5 3 4 4 5 4 5 5 4 4 4 4 4 55
Legally registered 5 5 4 5 5 1 5 1 5 5 5 5 5 56
Willingness/interest/ability to partner
3 5 3 5 5 2 5 2 5 5 3 5 5 53
TOTAL 30 30 23 31 33 20 33 22 30 32 28 30 31 373 Mean 4.
28 4.28
3.28
4.42
4.71
2.85
4.71
3.14
4.28
4.57
0 4 4.28
4.42 28.69
27.8 3.97 29.25 4.17 29.66 4.23
Interviewers/ moderators were asked to rate their perceptions of services rendered by the suppliers whom they had just interviewed, using a rating of 1-5 where 1 was lowest and 5 the highest. From this scale it has emerged that most suppliers were rated highly in various aspects of service provision. The following points illustrate this.
• Suppliers scored a total of 373 out of an overall score of 455. This is a high score.
• Most of the aspects of business measurement scored impressively – between 49 and 56 marks out of a possible 65 points.
• Individually, most providers scored a mean of 3.97 (BMN), 4.17 (Mbare) and 4.23 for Gatsibo out of a possible 5 points.
• Gatsibo based suppliers seem to be doing slightly better than their counterparts in the other markets according to these ratings.
• NB: these ratings are subjective and likely to change if done by a different interviewer.

REPORT FOR BDS DIAGNOSTIC IN RWANDA FIT RESOURCES JANUARY 2009
42
The enabling environment for BDS An enabling environment for BDS will require the support of all stakeholders in each market in Rwanda. This will be in terms of policy framework that fit the scenarios existing in the local markets. The following will need to be done in order to create an enabling environment for BDS development in the three markets.
• There is need to improve on the market for milk. This would act as the stimulus for other BDS services to grow.
• Improve on roads to create efficiency in milk transportation. • Train BDS staff/ farmers in dairy farming service provision/ client service. • Remove on a gradual basis government participation and visibility and facilitate for
private sector competition. • Reduce government/ stakeholder financial support to sector to create real market
driven forces for long term sustainability. • Establish systems by which affordable credit is accessible to farmers who need it. • The mandatory minimum requirements for setting up BDS businesses for dairy
farming need to be relaxed particularly during the infancy stages of BDS development. Such requirements can be re-evaluated later for reintroduction when the time is ripe.

REPORT FOR BDS DIAGNOSTIC IN RWANDA FIT RESOURCES JANUARY 2009
43
Conclusions Characteristics of the market for BDS in each specific region in relation to existing supply, demand and transactions
Although there are no set criteria for plotting a location on the matrix, a form of benchmarking has been used that compares the quality (productivity and practices) of one BDS market against another within the country and between locations across the 3 countries. Supply and demand have been evaluated as a one off event during the assessment process in relation to best practice which forms the basis of this informal comparison exercise. The exercise was undertaken during a group discussion between the team leaders of the research teams for each country.
STRONG SUPPLY LOW DEMAND
STRONG SUPPLY STRONG DEMAND
LOW SUPPLY LOW DEMAND Nyagatare BMN/Mbare Gatsibo
STRONG DEMAND LOW SUPPLY
Each of the areas has been plotted on the above matrix and the region as a whole is characterised by a low supply, and low demand situation. It is however moving towards a situation of strong demand against low supply scenario. For this reason, it recommended that strong educational campaigns are launched, with a view of raising both demand and supply. The survey established that most farmers in this region keep livestock as a fulfilment of local cultural values and thus do not see it as a business – thus education will help them see economic potential in dairy farming. The common characteristics of the BDS market are presented in table below:
Supply
Demand
Transactions
Key Characteristics
• Low supply of BDS services and inputs
• The commonest BDS services are basically about animal health and AI
• The biggest BDS providers are cooperatives and private sector operators – firms and individuals
• Demand for BDS services/ inputs is low. This correlates with the low supply regime of the same.
• The most popular services demanded by farmers are on animal health generally. Milk transportation to markets/ cooling plants
• Low value transactions that have been affected by the prevalent low incomes in the area.
• Again, as in demand and supply, most BDS transactions revolve around the purchase of drugs, curative services and

REPORT FOR BDS DIAGNOSTIC IN RWANDA FIT RESOURCES JANUARY 2009
44
• The BDS market price for various services is distorted due to government and NGO interventions which subsidizes and sometimes provides services free.
• The BDS services here are strong in milk production support but weak in marketing of the milk which is essential to stimulate further growth.
• Capital is limited, hence slowed or stagnated growth
• Transportation of milk within the local markets/ cooling plants dominated by the unpopular milk brokers.
is also in high demand. • The major hindrance to
high demand is the low incomes prevalent in the 3 markets.
• Lack of affordable credit facilities for farmers is also a major problem
• Farmers also lack dairy farming information and education that would not only enhance their skills but also help them see the importance of using BDS services for their dairy development.
• Poor transport network and high cost of travel also affect the demand for BDS especially with regard to milk transportation from farm gate to collection centres and other markets.
vaccinations. • The transactions are
done mainly by cash payments. However members of cooperatives and farmer associations can use check-off system to make payments.
• Some few farmers
also use delayed /staggered payments when unable to make cash payments, but with good reasons like a dry / sick cow.
• Generally there is
poor access to credit facilities among farmers and cooperatives. This has tended to limit the transactions they can execute to benefit them.
CONSUMERS – DEMAND SIDE CONCLUSIONS
• Local breeds (84%) are predominant across all the locations however farmers (85%) specifically want to improve breeds to enlarge herd size via adopting zero grazing methods, growing feed, AI services and grouping together to benefit from economies of scale.
• Key problems for farmers include low milk prices and irregularity of AI services. • The services farmers are most aware of are basic veterinary treatment services,
vaccination and products such as mineral supplements, sprays and disinfectants. Generally the demand for services is low.
• Although farmers are aware of many services and do acquire some services they are not clear as to the benefits they should expect from the services.
• Consumers shy away from purchasing services due to the expense involved and the poor quality/unreliability of many products.
• Farmers sell predominantly to homes, hawkers and cooling plant. Sales to cooling plants are preferred.
• Information on dairy markets is considered to be ‘just enough’ across all sites. • Buyers currently provide few required services to farmers yet the opportunity for
such embedded services is apparent. • Farmers currently deliver milk but would prefer it to be collected (more than once a
day) however milk collection is unreliable.

REPORT FOR BDS DIAGNOSTIC IN RWANDA FIT RESOURCES JANUARY 2009
45
• Farmers are aware of the local cooling plants and would like to receive such services as health services, market prices and credit via a check off payment system. Cooling plants have limited capacity to store milk so milk is turned away.
• Dairying skills are inadequate especially in regards to disease identification, treatment and prevention plus improvements in milk production.
• Information and training on dairy farming is currently non existent for most farmers with extension workers and NGOs being a key source of assistance.
• Farmers keep few records and cannot determine the true profitability of their business activities despite claims to do so.
• Most farmers have access to a mobile phone and are willing to pay for important information via SMS such as disease alerts and milk prices.
• Farmers struggle to self fund their operations and few acquire loans or other financial services (despite a desire to do) so due to inaccessible or unaffordable loans.
• Few farmers are aware of organisations that can support them and few belong to formal groups, cooperatives and associations.
• There is very little knowledge among farmers regarding policy issues and the legal and regulatory authorities and standards/regulations that concern their operations.
• Nyagatare District is more of a cattle keeping district and grazing fields are bigger requiring a slightly different range of services.
SERVICE PROVIDERS – SUPPLY SIDE CONCLUSIONS
• Poor roads and lack of public transport hinder service delivery. • General services such as basic health treatment services and products
(disinfectants and supplements) are on offer but more specialised services are scarce. Services offered across all locations are similar. Demand appears generally low.
• Fee based stand alone services are the norm and limited embedded services are apparent. Cash payments are the norm but check off systems exist for those engaged with coops and associations. Defaults are high and payment recovery is often staggered.
• A few Government subsidies exist in the market undermining existing provider’s ability to deliver services profitably.
• The business acumen of existing service providers is relatively but with some entering into contractual arrangements. Few are formalized or understand the process. Few are implementing clear pricing strategies or focused marketing strategies.
• Capital is very limited for business development. Stock levels remain constantly low. Access to affordable finance is limited.
• Lack of technical knowledge and abilities to delivery more specialised services. Limited access to appropriate equipment (lab equipment).
• Lack of knowledge relating to public health issues, regulations and standards. • All evident services are focused on production support and non on market support.
An insight into the potential of each target market location
As the drive to transform herds here is in high gear, the demand and supply for BDS will definitely pick up and grow. Farmers are learning the advantages of keeping higher grade cows and as more farmers appreciate this a variety of BDS services will be needed to

REPORT FOR BDS DIAGNOSTIC IN RWANDA FIT RESOURCES JANUARY 2009
46
support this transformation. Thus the potential for growth here is very high. This applies to all 3 markets. Road/ infrastructural development: Feeder roads connecting farmers to the trading centres are in bad shape. When it rains, it becomes almost impossible to transport milk to the cooling plants. Even transport to take farmers to the trading centres become scarce and expensive. Thus, this situation limits the consumption of the dairy services and inputs. Although the Government of Rwanda has done a commendable job in creating good roads, there are still more roads to be improved and made all weather away from the main highways. Given that Nyagatare BMN is the most potential of all in terms of milk production and with Nyagatare Township located here, a local dairy processing plant would probably be best suited if located in this township. The Board to run the plant should draw membership from all stakeholders within the three markets in order to ensure the interests of all farmers are catered for. Such a facility would encourage more farmers to increase their milk output to take advantage of the new market channel. With more income farmers are likely to want to improve the care, health and nutrition of their animals leading to high demand of the BDS services/ inputs. While policies to promote dairy farming in the 3 markets are being developed/ enhanced, it is important to consider the local market dynamics. For instance, while BMN and Mbare could easily expand their dairy farming by extensive farming processes due to their larger farms, Gatsibo has to contend with intensive farming techniques like zero grazing and would thus demand more of supplementary feeds, etc than farmers in the other two regions – who may need more of seeds to grow fodder. This is because Gatsibo is more densely populated and farmers have smaller grazing land. Given the scarcity of BDS suppliers in Gatsibo and even in the other two markets, it would appear that more private providers are needed here. Demand should be demonstrated to potential suppliers and technical assistance provided for start ups. Once established, they should conduct promotional campaigns among the farmers in the villages so that the services/ inputs they are offering are popularised. The providers should then strive to provide quality services and inputs for them to remain competitive. The survey found that an overall dairy farmer union has been established in Nyagatare Township to oversee existing dairy cooperatives. It is felt that this union should encompass all local dairy cooperatives in the 3 markets and play the pivotal role of regulating quality among member cooperatives. It should also be involved in seeking bigger markets and lobbying for policies to stimulate and enhance dairy development and growth. This would ensure that milk produced is readily marketed with the balance going to the dairy processing plant, which is an initiative of the union. This is likely to enhance the capacity of each market to produce more milk. Level of market distortion
Government and other stakeholders have been providing support in the form of subsidized services/ inputs in order to grow the dairy sector from infancy and encompass all farmers including the very poor. This has succeeded and it is now time for the sector to grow in a sustainable manner.

REPORT FOR BDS DIAGNOSTIC IN RWANDA FIT RESOURCES JANUARY 2009
47
To grow in a sustainable manner, the government role and other stakeholders would have to be reduced to a facilitative one. Government presence is currently felt in the provision of extension services for vaccination and treatment and AI services. The government needs to wean itself out of this and leave the private sector and cooperative movements to do the job. It should instead focus on creating conducive policies and an environment for BDS development and growth. It should address issues of infrastructure, policy formulation and strengthening institutions to coordinate all efforts in dairy development. The survey established that some farmers depend on the government to access certain services as it is common knowledge here that the government provides subsidies on certain essential services. Even when they can afford, some farmers claim they cannot so as to benefit from the subsidized services. This undermines any private providers ability to compete. Due to the high demand for government sponsored services, some farmers wait for so long to access a government vet technician that they sometimes expose their cows to the danger of dying if they are sick as they await free services. Comparative information on the in-country sites and the 3 markets Nyagatare BMN, according to the findings, is leading in size and number of dairy farmers who belong to groups. The cooling plant in Nyagatare BMN covers a bigger catchment area which includes Nyagatare Mbare, and some parts of Gatsibo and Kayonza districts. All three sites suffer from similar problems and challenges, particularly regarding milk transportation, collection, and marketing. Although Nyagatare Township is located in Nyagatare BMN, this market is the most remote, with bigger grazing farms and has bigger herds of the indigenous cows than the other two markets. Given that Gatsibo District is more densely populated than the other two markets; it has fewer cows for milking (1-5) while the rest have more. Gatsibo also has less milk spared for domestic consumption about one litre while Nyagatare BMN/Mbare have the most milk kept for domestic consumption (about 3 liters) each. All the three sites are actually on the main Nyagatare – Kigali highway, with Nyagatare BMN being the farthest (about 150 km) while Gatsibo is closest to Kigali (about 90 Km). Nyagatare Mbare occupies a central position in this linear arrangement. A dairy farmers union for Nyagatare district as a whole is at an advanced stage of setting up a processor to take advantage of the plentiful milk produced. By so doing, farmers will be able to sell all their milk locally plus the dairy products to be manufactured would fetch the farmers more income. In terms of credit/banking facilities, Nyagatare BMN farmers are at an advantage as they enjoy these facilities nearby at Nyagatare Township, (largest/ upcoming town in the region) while other farmers in the other sites do not have such easy access and have to travel longer distances.

REPORT FOR BDS DIAGNOSTIC IN RWANDA FIT RESOURCES JANUARY 2009
48
However, in comparison to Uganda and Rwanda, the dairy market in the surveyed sites was relatively developed in Kenya. The table below shows some comparison between the three markets.
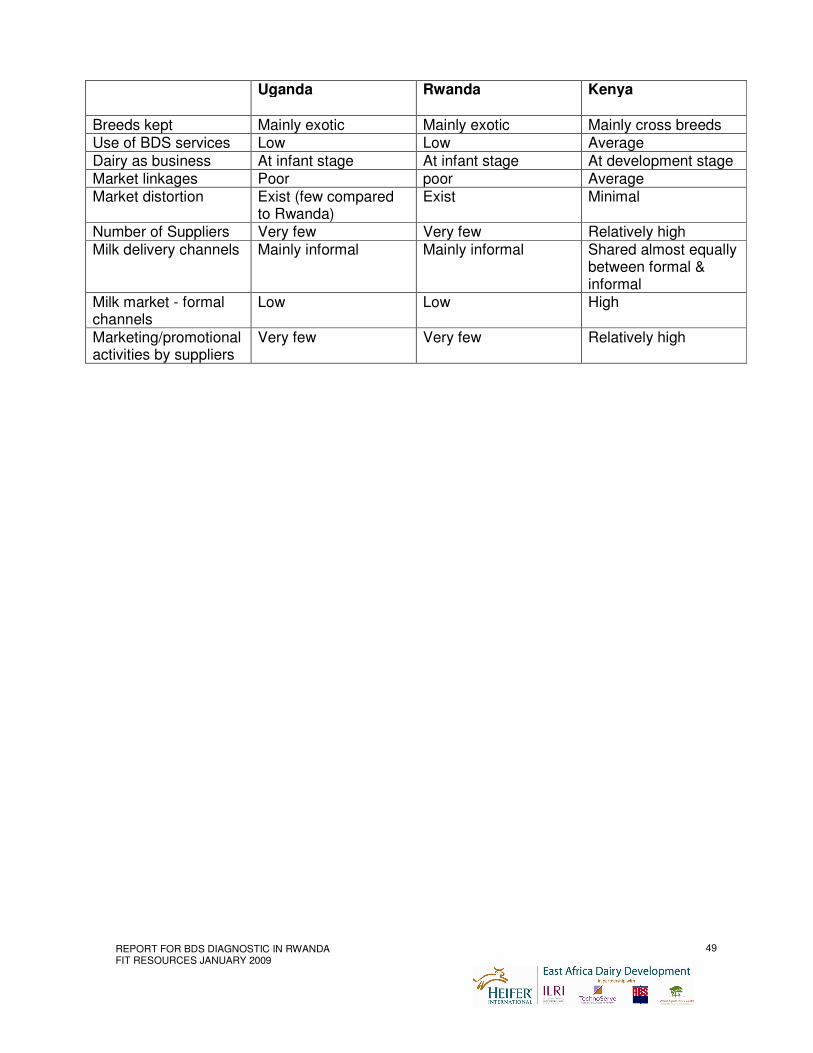
REPORT FOR BDS DIAGNOSTIC IN RWANDA FIT RESOURCES JANUARY 2009
49
Uganda Rwanda Kenya
Breeds kept Mainly exotic Mainly exotic Mainly cross breeds Use of BDS services Low Low Average
Dairy as business At infant stage At infant stage At development stage Market linkages Poor poor Average Market distortion Exist (few compared
to Rwanda) Exist Minimal
Number of Suppliers Very few Very few Relatively high Milk delivery channels Mainly informal Mainly informal Shared almost equally
between formal & informal
Milk market - formal channels
Low Low High
Marketing/promotional activities by suppliers
Very few Very few Relatively high

REPORT FOR BDS DIAGNOSTIC IN RWANDA FIT RESOURCES JANUARY 2009
50
Recommendations1 Other current or proposed dairy sector interventions It is very important to coordinate INGO/donor efforts. It is very difficult, and not at all effective, for one INGO donor funded project to pursue a market development approach if others continue to subsidize transactions and offer publicly-funded services in the same market. Suppliers will almost always choose to work with a donor who will subsidize transactions rather than one advocating market development. Free services also dampen SME willingness to pay. Even if all donors pursue a market development approach, coordination across projects and programmes is critical. In markets with relatively few suppliers, these suppliers can be overloaded or lose their commercial focus if they receive significant financial resources from several donors. EADD must be aware of the other projects supporting the sector and liaise with the facilitators to ensure that efforts are appropriately coordinated. Sustainable solutions to address priority market constraints and market failures The project must ensure that all interventions have a market focus (private sector domination with numerous competitive BDS suppliers selling commercially to large numbers and types of SMEs). It is possible to ensure impact and outreach of BDS if the interventions focus on profitable services, focus on services that are replicable in the private sector and build on what is already being offered by the private sector. Always ask: “What problems do businesses have and why isn’t the market environment providing solutions to these?” The end result of a market focused programme is numerous SME’s buying BDS of their choice from a wide selection of products offered from unsubsidized private sector suppliers in a competitive and evolving market. Remember that the provision of subsidies to particular suppliers may crowd out other, private sector suppliers who do not receive subsidies. Supplier costs must ultimately be appropriate for the SME market and not skewed by donor funding. It is important to promote as many suppliers as the market will bear. That is not to say that subsidies are a bad thing. Subsidies can be used to stimulate demand and supply for a finite period of time with an explicit reason and exit strategy. The project should group services as per the following recognised categories: MARKET ACCESS - These services identify/ establish new markets for SME products. They facilitate the creation of links between all the actors in the market and enable buyers to expand their outreach to, and purchases from, SMEs. They also enable SMEs to develop new products and produce them to buyer specifications. Key dairy sector examples include:
• Linkages to processors and informal markets • Linkages to cooling plants and setting up chilling plants • Linkages to traders for inputs and access to quality requirements
1 Some of the narrative and ideas in this section have been drawn from various papers and presentations placed in the public domain
by BDS practitioners and sourced from the following website: www.mmw4p.org

REPORT FOR BDS DIAGNOSTIC IN RWANDA FIT RESOURCES JANUARY 2009
51
• Creating access to market information • Facilitating milk supply contractual agreements with processors • Linking farmers to steady markets • Creating awareness of available markets • Ensuring stable and reasonable milk prices to farmers • Creating milk collection centers • Forming milk cooperatives • Improving access to reliable and affordable transport
INPUT SUPPLY - These services help SMEs improve their access to raw materials and production inputs. They facilitate the creation of links between SMEs and suppliers and enable the suppliers to both expand their outreach to SMEs and develop their capacity to offer better, less expensive inputs. Key dairy sector examples include:
• Create awareness regarding Agrovet shops selling farm inputs • Facilitate access to Agro-Vet Shops, AI service, Feeds, Livestock Health/Veterinary
(quality, credit services , payment systems, bulk purchase, efficiency, distribution systems, negotiate delivery contracts)
• Avail vet kits to farmers • Facilitate access to quality inputs through CP check off system • Group people together to bring down inputs costs • Increase access of milk cans and coolers • Enhance skills and knowledge about feed and fodder to farmers • Encourage farmers to set up their agro-shops • Facilitate water drilling services
TECHNOLOGY & PRODUCT DEVELOPMENT - These services research and identify new technologies for SMEs and look at the capacity of local resource people to produce, market, and service those technologies on a sustainable basis. They also develop new and improved SME products that respond to market demand. Key dairy sector examples include:
• Facilitate access to Biogas installers, • Facilitate feed formulation enterprises • Raise awareness to feed conservation techniques • Facilitate provision of new milk handling containers/equipments • Improving cooling plant MIS through training and computerization • Facilitate simple milk testing equipment • Development of market information services • Enhance farmers ability to identify enterprises and engage in value addition • Advise processors on how to improve on the product packaging. • Promotion and adoption of new technology • Access and training in adoption of relevant ICT e.g. accounting soft-wares • Raise awareness regarding feeding and feeding systems, housing systems, fodder
production/agronomic practices, milk handling, milk quality testing, milk preservation, water harvesting, milk transportation and milk storage
• Training and equipping AI experts • Use ICT to disseminate information
TRAINING AND TECHNICAL ASSISTANCE - These services develop the capacity of enterprises to better plan and manage their operations and improve their technical expertise. They develop sustainable training and technical assistance products that SMEs are willing to pay for and they foster links between service providers and enterprises. Training and technical assistance may be delivered on any topic. Key dairy sector examples include:

REPORT FOR BDS DIAGNOSTIC IN RWANDA FIT RESOURCES JANUARY 2009
52
• Cattle registration and milk recording services • Training on feed conservation and fodder crops • Business advisory services on chilling plant management • Technical assistance on improving milk quality • Research on new milk market opportunities • Capacity building for farmers, staff and chilling plan management, BOD plus
management and staff of the Coop societies • Exposure visits and farmer study tours • Dairy cows registration to the Stud book • Training on animal husbandry (feeding, pasture production and conservation, health
management) and milk hygiene/handling, storage and transportation • Group formation • Capacity building on business development • Facilitate access to consultancy services in strategic plans, feasibility studies,
business management training, marketing, auditing and book keeping, record keeping, financial management, governance and group dynamics
• Facilitate TOTs and the development of training manuals • Training on how to advocate for change • Facilitate disease surveillance
INFRASTRUCTURE - These services establish sustainable infrastructures that enable SMEs to increase sales and income. Examples include refrigeration, storage, processing facilities, transport systems, loading equipment, communication centers, and improved roads and market places. Key dairy sector examples include:
• Facilitate access to improved road network, water supply, communication facilities and electricity
• Liaise with Government and private contractors for improvement of road networks, power and water supply
• Organizational management of the dairy hub • Facilitate access to improved storage facilities, milk bulking and cooling and milk
transport, • Building cooling plants • Agro dealer networks • Access to feed analysis facilities and milk testing facilities • Social services • Assist farmers to acquire chilling plants, transport facilities and laboratory equipment • CP start-up and setting up a hub of business services; feed shops, Agro-Vet shops;
hardware shops; transport and village banks POLICY/ADVOCACY - These services carry out sub-sector analyses and research to identify policy constraints and opportunities for SMEs. They also facilitate the organization of coalitions, trade organizations, or associations of business people, donors, government officials, academics, etc. to effect policies that promote the interests of SMEs. Key dairy sector examples include:
• Awareness creation on environmental degradation and traceability • Facilitate business registration • Lobbying for policy change (e.g. milk payment based on milk quality, semen
importation in Uganda governance of operations of CAHWs in Rwanda and Uganda) • Expose farmers to KEDAPO • Facilitate stakeholder collaboration • Facilitate research and disseminate to policy makers • Facilitate engagement of legal services
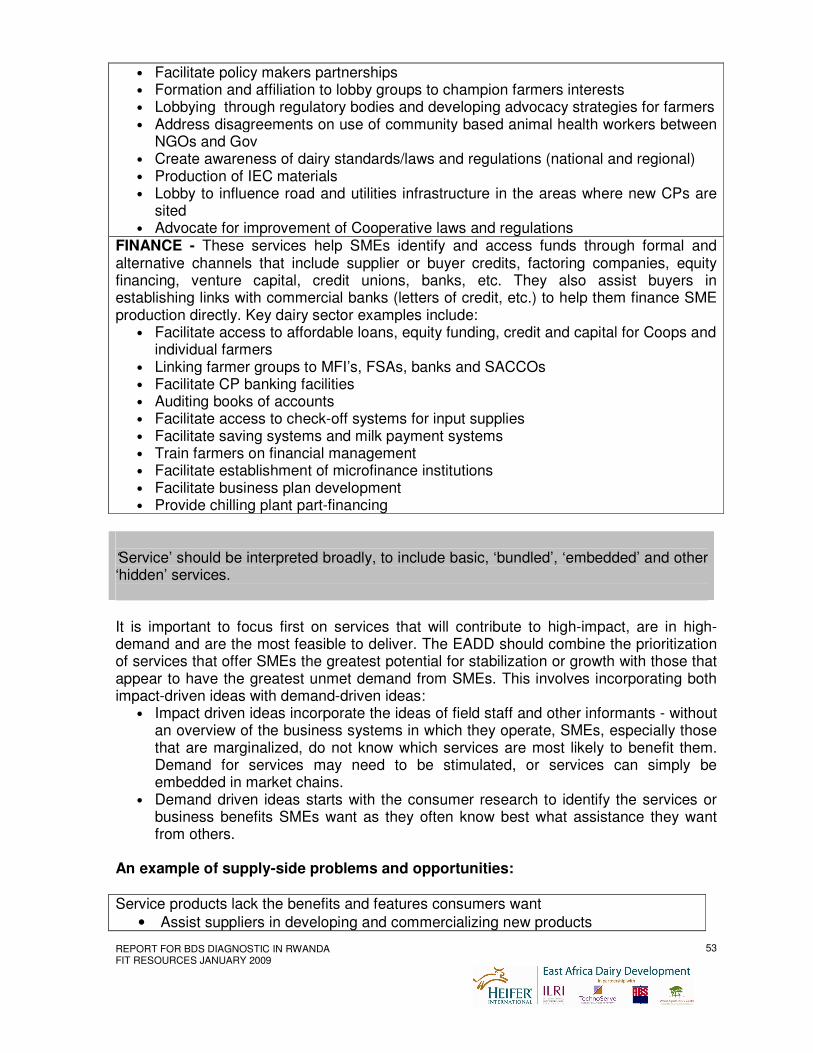
REPORT FOR BDS DIAGNOSTIC IN RWANDA FIT RESOURCES JANUARY 2009
53
• Facilitate policy makers partnerships • Formation and affiliation to lobby groups to champion farmers interests • Lobbying through regulatory bodies and developing advocacy strategies for farmers • Address disagreements on use of community based animal health workers between
NGOs and Gov • Create awareness of dairy standards/laws and regulations (national and regional) • Production of IEC materials • Lobby to influence road and utilities infrastructure in the areas where new CPs are
sited • Advocate for improvement of Cooperative laws and regulations
FINANCE - These services help SMEs identify and access funds through formal and alternative channels that include supplier or buyer credits, factoring companies, equity financing, venture capital, credit unions, banks, etc. They also assist buyers in establishing links with commercial banks (letters of credit, etc.) to help them finance SME production directly. Key dairy sector examples include:
• Facilitate access to affordable loans, equity funding, credit and capital for Coops and individual farmers
• Linking farmer groups to MFI’s, FSAs, banks and SACCOs • Facilitate CP banking facilities • Auditing books of accounts • Facilitate access to check-off systems for input supplies • Facilitate saving systems and milk payment systems • Train farmers on financial management • Facilitate establishment of microfinance institutions • Facilitate business plan development • Provide chilling plant part-financing
‘Service’ should be interpreted broadly, to include basic, ‘bundled’, ‘embedded’ and other ‘hidden’ services. It is important to focus first on services that will contribute to high-impact, are in high-demand and are the most feasible to deliver. The EADD should combine the prioritization of services that offer SMEs the greatest potential for stabilization or growth with those that appear to have the greatest unmet demand from SMEs. This involves incorporating both impact-driven ideas with demand-driven ideas:
• Impact driven ideas incorporate the ideas of field staff and other informants - without an overview of the business systems in which they operate, SMEs, especially those that are marginalized, do not know which services are most likely to benefit them. Demand for services may need to be stimulated, or services can simply be embedded in market chains.
• Demand driven ideas starts with the consumer research to identify the services or business benefits SMEs want as they often know best what assistance they want from others.
An example of supply-side problems and opportunities:
Service products lack the benefits and features consumers want
• Assist suppliers in developing and commercializing new products

REPORT FOR BDS DIAGNOSTIC IN RWANDA FIT RESOURCES JANUARY 2009
54
• Bring in suppliers from other countries to adapt and franchise appropriate products
Suppliers are risk averse to targeting new consumer segments, such as women or micro enterprises
• Provide suppliers with information on the viability of selling to SMEs
• Subsidize cost of targeting new consumer segments, e.g., market testing
• Use market research to identify promising opportunities to serve new consumer segments
Suppliers lack market information
• Develop or improve marketing research services/suppliers
• Provide suppliers with market information
• Teach suppliers how to gather market information Suppliers lack business or technical skills
• Provide training and technical assistance to suppliers
• Assist training suppliers in developing and selling appropriate products to other BDS suppliers
There is insufficient supply in the market
• Provide venture capital to suppliers to expand
• Design a programme to assist start-up suppliers Variable service quality harms supplier reputation
• Provide quality assurance services
• Assist supplier to improve consistency in service provision
• Help suppliers form associations with certification processes Supplier cannot manage supplier credit or other purchasing mechanisms
• Build capacity of suppliers to manage supplier credit
• Link SMEs with MFIs or other financial services providers Key solutions that address supply side constraints and increase demand include:
o market research o provision of information for consumers/social marketing o new product development o identifying market niches o supplier training o service demonstrations o improving marketing strategies o monitoring and evaluation of services
An example of demand-side problems and opportunities:
Consumers lack information about services
• Develop a BDS yellow pages
• Open a BDS consumers’ bureau or information center
• Help suppliers improve their marketing
• Implement a voucher scheme Consumers are unable to effectively identify their business problems
• Develop an awareness-raising campaign about typical business problems and BDS that can help
• Help suppliers create marketing campaigns that help SMEs identify business problems

REPORT FOR BDS DIAGNOSTIC IN RWANDA FIT RESOURCES JANUARY 2009
55
Consumers do not have the capacity to pay for services up front
• Assist suppliers in developing payment options
• Promote embedded services
• Promote services financed by large firms
• Help consumers form clusters to purchase services in groups
Consumers are risk averse to trying services
• Provide suppliers with technical assistance to improve trial inducing strategies
• Implement a voucher scheme
• Promote business linkages for embedded services Consumers do not see the value of services
• Help suppliers test, demonstrate, and gather information about the quality of services
• Assist suppliers in improving advertising
• Assist suppliers in developing customer referral programmes
• Conduct general advertising for the service Consumers want services packaged together
• Broker agreements among suppliers to develop service packages
• Provide venture capital and technical assistance for suppliers to diversify Key solutions that address demand side constraints and improve supply include:
o awareness raising o provide information about services o linking SMEs with BDS suppliers o forming SME clusters/associations to access services o temporary incentives and financing o temporarily discounting services
An example of transaction problems and opportunities:
Consumers cannot afford to purchase services
• Develop a business model with third party payment such as advertising, or with embedded services
There is a lack of trust between suppliers and consumers; suppliers insist on up-front payment; consumers insist on delivery before payment
• Support entrepreneurs or social enterprises to establish a guarantee or wholesale system
• Establish a temporary guarantee system until there is stronger trust in the market There is no mechanism for exchanging payment or collecting payment due to distance, lack of technology, or banking system
• Help SMEs and others in the supply chain to form an intermediary who is sophisticated enough to access the formal banking system or an international banking system that is functioning
• Promote Smart Cards — electronic banking cards
• Develop money transfer services Consumers are geographically and/or socially isolated from service markets
• Help SMEs form clusters, associations, or cooperatives that can act as intermediaries to reach distant services providers
• Form a social enterprise to provide services

REPORT FOR BDS DIAGNOSTIC IN RWANDA FIT RESOURCES JANUARY 2009
56
An example of market environment problems and opportunities Free services are distorting the BDS market
• Advocate with government and/or other donors to rationalize BDS subsidies Regulations adversely affect the BDS market
• Advocate for changes in the regulations
• Organize SME suppliers to advocate for changes in regulations affecting the BDS market
Solutions that specifically address policy constraints and remove macro-economic constraints to BDS market development include:
o policy research o building the capacity of advocacy groups o helping SMEs engage in advocacy activities o building the capacity of local governments
The programme must focus on facilitative activities such as market research, provision of information for consumers, new product development, supplier training, monitoring and evaluation. These activities are aimed at “facilitating” market improvement by increasing demand and/or improving supply. The main activity of the programme must not be direct service provision. Country specific suggestions that address priority market constraints/ market failures
Market constraints Opportunities
Market distortion due to too much government/ stakeholder involvement in service provision.
Government/ NGO presence and visibility as critical service providers will need to be minimized to reduce market distortion. Their role should be left at the level of facilitators and policy makers. This would ensure that forces of supply and demand are operating in a perfect market.
Markets not easily accessible due to bad roads
The government will also have to ensure that infrastructure particularly roads are addressed conclusively in order to facilitate dairy sector growth within the dairy farming communities. Support or instigation of lobbying and advocacy initiatives to address these issues is required.
Over reliance of farmers on milk brokers/ hawkers to transport and market their milk exposes farmers to cheating and reduced income.
Given the adverse publicity associated with milk hawkers /brokers and their exploitative operations, it is recommended that farmers be encouraged to join cooperatives and farmer associations in order to avoid over reliance on the brokers. Incentives should be developed in the short and long run to attract such reluctant farmers. The government/ stakeholders should be responsible for this.
Lack of capacity by farmer groups/ associations/ cooperatives due to the
Cooperatives and other farmer producer groups or associations should be strengthened and the

REPORT FOR BDS DIAGNOSTIC IN RWANDA FIT RESOURCES JANUARY 2009
57
limited size of membership and lack of resources.
small ones encouraged joining forces with others in order to enjoy economies of large scale operations. Such outfits should be encouraged to seek credit so that they can invest in milk transport vehicles and equipment. They should then take over milk transportation from the brokers at a small fee.
Earlier interventions seem to have been generalized to solve problems affecting the region as a whole rather than targeting specific markets.
While Nyagatare has larger farms for grazing, Gatsibo’s options for expanding dairy farming lies on increased uptake of zero grazing. Thus future supplies of BDS should strongly be hinged on prevailing market specific scenarios.
Everything considered, all 3 markets in this region are still in their infancy and therefore are seen more as low supply against low demand situations.
Both farmers and suppliers will need educating on the usefulness of BDS for dairy development. Education should thus be the lead intervention by stakeholders.
Little value /erratic transactions which reflect the nature of incomes existing in the area.
Strengthen farmer groups/ associations and cooperatives particularly in order to improve in the marketing of farmers milk, and diversify the milk market.
Prevalent shortages of highly demanded services & inputs/ products
The government needs to wean itself from service provision, while at the same time encouraging private sector providers to join the market. If possible market research could be conducted – facilitated by stakeholders, to highlight the areas with high demand. This information would then be shared with potential providers in a workshop situation.
Poor quality services sometimes and lack of integrity among some suppliers
With the government role reduced to regulation, it would be easy to control quality, which would promote mutual satisfaction for all parties involved.
Insufficient milk collection/ cooling infrastructure which limits growth and depresses price of milk
The government needs to facilitate the erection of more cooling plants through local investors or outsource them from outside the region.
Country specific suggestions that address supply side constraints Supply side constraints Opportunities
Long distances and bad roads that farmers have to cover to reach suppliers/ Lack of an efficient public means of transport
The government of Rwanda is called upon to improve on the rural feeder roads in the 3 markets to make them all weather and thus encourage BDS growth, among others.
Limited demand of dairy services and products owing to a depressed farmer income due to low milk sales /price.
There is need to establish a local dairy processing plant in the region to mop up excess milk, stimulate more production and thus improve on farmer income
Lack of sufficient stock of the highly Conduct a market research survey to establish

REPORT FOR BDS DIAGNOSTIC IN RWANDA FIT RESOURCES JANUARY 2009
58
demanded products/services what is needed where when so that supply is equal to demand. The government/ stakeholders should facilitate the survey and share findings.
Some farmers lack efficient communication tools like mobile phones that can ease communication between them and their suppliers.
Through training farmers can be encouraged to buy simple phones or talk to their closest neighbours through whom they may access their mobile phones. This need can also be taken up as a BDS and some farmers encouraged setting up their telephone bureau services that can serve those without mobile phones.
Few qualified technical staff hence sometimes delayed response to farmers’ requests.
Government/ Stakeholders need to ensure there is sufficient trained technical staff to attend to the needs of all farmers without delay.
Government and NGO interference in service / input provision at subsidized rates hence creating an artificial market environment. The price levels existing are not sustainable if subsidies are removed.
Service provision should be left to private sector for sustainability, while government/ stakeholders facilitate and set conducive policies for sector to grow.
Some of the government AI providers have not been trustworthy and on many occasions they have promised farmers certain type of crossbreed/ pure breed and charged them accordingly, only for the farmers to get poor quality calves. In other words, what AI providers promise is not what farmers always receive
Quality control should be made a priority issue and the government should step in to ensure there is some integrity in the sector.
Lack of access to affordable capital was also mentioned by many suppliers as a key constraint. This became an issue when they wanted to expand their businesses. The situation is made worse by local banks who demand security for any credit advanced.
Providers need to be facilitated with access to affordable credit. Again there is need for the development of appropriate financial products.
Limited laboratory services that can boost accuracy in diagnosis of animal diseases and proper drug administration.
Need to establish locally available laboratory facilities to boost the treatment of cattle in the region. The GOR/ stakeholders need to facilitate this.
Meeting the mandatory minimum legal requirements is sometimes a big challenge for suppliers to set up or expand their businesses
The GoR needs to relax these requirements until such a time the sector has grown enough to be regulated to ensure quality.
Lack of adequate back-up power / maintenance skills to assure good milk even when there was power failure. Sometimes power goes off and the back-up generators fail to work due to poor maintenance practices. When this
Power interruptions need to be checked and controlled. Alternatively, milk cooling plants need to have an in-house engineer who can attend to generator repairs urgently when the need arises.

REPORT FOR BDS DIAGNOSTIC IN RWANDA FIT RESOURCES JANUARY 2009
59
happens, all milk collected goes to waste. Farmers cannot also sell their next days milk until the problem is sorted out.
There is a shortage of BDS suppliers in the 3 markets.
It is recommended that more private providers be encouraged to enter into the market as the government reduces its role as a provider of services. Once established, they should conduct promotional campaigns among the farmers in the villages.
SERVICE PROVIDERS – SUPPLY SIDE RECOMMENDATIONS
• Support all existing service providers to better source and offer quality, affordable and consistent seeds and feed products.
• Support new providers to enter the market competitively with products/services based on market demand (with a focus on currently unavailable specialist services such as AI). Support can include the identification of, development of, testing of, rolling out of, marketing of and monitoring of the new services/products. Use market research to highlight business opportunities. Support as many as the market will bear. Cost share where possible.
• Support existing service providers to source and offer quality, affordable and consistent (transparent) breeding services and animal health products with a view to increasing the herd sizes and milk production. Support existing providers to improve outreach of their services via new outlets and sales teams. Support service demonstrations.
• Promote quality stable services via bulking centres, cooling plans and processing facilities. Help build the reputation of such facilities to offer reputable and transparent fee-based services.
• Support advocacy efforts to improve roads and electricity supply and support regulation and outreach of veterinary support services.
• Partner with the private sector to facilitate establishment of sustainable infrastructures such as cooling plants, testing facilities and storage/processing facilities in underserved locations.
• Facilitate expansion of existing infrastructures such as cooling plants and transport services.
• Improve access to broader veterinary services by facilitating new and existing veterinary input suppliers to better respond to consumer demand and reach under served customers. Support suppliers to offer advice in the appropriate use of products as an embedded service.
• Offer support to service providers to increase their own technical ability via training, counseling and mentoring programmes. Organise study tours between service providers.
• Identify and introduce new appropriate technologies and link providers to suppliers. • Increase knowledge among service providers regarding policy issues and the legal
and regulatory issues that concern their operations such as public health issues. This may include research to identify policy constraints and opportunities or support to effect policies.
• Increase awareness or loan acquisition and use for service providers. Assist them to identify and access funds through formal and alternative channels.

REPORT FOR BDS DIAGNOSTIC IN RWANDA FIT RESOURCES JANUARY 2009
60
• Support service providers to develop their capacity to better plan and manage their businesses. Assistance is required in strategic/business planning, pricing and marketing. Offer support to service providers to implement appropriate marketing activities to create awareness of their products and services. Facilitate this via the private sector where possible.
• Assist providers to legalise and formalize their operations. • Facilitate training providers to develop and offer fee-based technical assistance in
order to develop farmer’s ability to better plan and manage their operations and promote ‘farming as a business’.
• Promote ‘farming as a business’ via social media campaigns, radio programmes, field days, brochures and exchange visits.
• Facilitate private sector providers such as value add companies who handle closed user groups for SMS services to Interactive Voice Response (IVR) companies who can establish and run call-up voice services. Demand led information such as disease alerts and milk prices can be delivered via mobile phones on a sponsored or user pays basis. Information on quack products and providers may also be useful. This may have to be supported with basic knowledge on phone use.
• Promote the sustainable role of the private sector in service delivery and highlighting opportunities and necessity for reduced/removal of subsidies among NGOs and Government institutions.
• Work with buyers and input suppliers to develop new embedded and fee based services such as health services, milk bulking, input delivery, information on herd management/improvement and animal husbandry. Subsidize the cost of the new products/services in the short term with vouchers for farmers.
• Offer support to service providers to develop appropriate and transparent pricing and payment mechanisms for clients such as installments and discounts for group purchasing.
• Facilitate training providers to develop and offer/market fee-based technical assistance and advice in order to improve knowledge among farmers on dairy farming. Such providers new and existing may include local training institutions, NGOs, individual consultants and local media/print houses.
• Few providers exist to support sales. Promote new providers who can perform the role of identifying and establishing markets for milk and milk based products. Fees can be charged for services such as business linkages, research information and organising exhibitions.
• Assist existing financial service providers to promote their services. Work with the suppliers to facilitate new user friendly services such as preferential loans, factoring, equity financing and venture capital.
• Partner with the private sector to facilitate establishment of new business support infrastructure such as communication centers, courier services and money transfer services.
Country specific suggestions that address demand side constraints Demand side constraints Opportunities
Inadequate foliage and grass to feed animals due to poor climatic conditions – draught.
Provide seed to grow fodder to selected farmers who have larger farms. They can thus sell to others at competitive prices. Also providers be encouraged / empowered to sell supplementary feeds at affordable prices

REPORT FOR BDS DIAGNOSTIC IN RWANDA FIT RESOURCES JANUARY 2009
61
Irregular and unaffordable AI services
More AI providers needed at main trading centres and village level. Also encourage scheduled visits by AI providers to all villages. It would also be necessary train farmers on basic procedures of conducting AI
Inaccessible/ unaffordable loans to promote dairy farming.
Provide easily accessible/ affordable financial products that are developed/ tailored to meet farmer needs
Low and fluctuating milk prices hindering farmers from planning their future
Establish more strategic milk collection/ cooling centres and improve on roads to facilitate easy/ cheaper milk transport. Consider also establishing a local dairy processing plant
Poor/ unreliable animal treatment and vaccination services
Additional veterinary doctors needed at village level and further training for skill upgrading for vet technicians
Unaffordable supplementary feeds beyond the reach of many small scale farmers Unreliable source of supplementary feeds
More suppliers needed in order to meet demand and lower prices. It would also be important to consider exploring using locally available raw materials to make them affordable. More farmers should be trained on how to prepare them
Disease outbreaks Modern lab testing facility established in the region and vaccination of cattle strengthened
CONSUMERS – DEMAND SIDE RECOMMENDATIONS
• Promote existing embedded and fee based services via milk buyers and input suppliers such as health services, milk collection, advances on payments and information on animal husbandry.
• Bring farmers together to access training via local providers on dairy farming and business management issues. This can be subsidized in the short term. Some key areas of concern for farmers are disease identification, milk production, drug administration and business planning and management. Training and technical assistance should include information relating to the expected benefits of BDS services – this will also help increase demand for services. Increase opportunities for farmer to farmer forums/exchanges and study tours.
• Increase farmer’s strength to actively participate in and influence the dairy chain. Bring farmers together to bulk purchase and access other services such as training and finance. Promote the concept of formal groups, cooperatives and associations.
• Facilitate access for farmers to input suppliers in order to improve of breeds through cross breeding and artificial insemination.
• Facilitate access to markets by linking actors in the chain especially new buyers to small scale farmers. Also support farmers to produce to different buyer specifications.
• Facilitate access to sustainable infrastructures for increased sales such as cooling plants and storage/processing facilities.

REPORT FOR BDS DIAGNOSTIC IN RWANDA FIT RESOURCES JANUARY 2009
62
• Increase access to information for farmers via print, radio and TV. Improve awareness of Internet access and telecommunication opportunities.
• Increase awareness or loan acquisition and use for farmers, buyers and input suppliers. Assist them to better identify and access funds through formal and alternative channels such as credit unions and banks.
• Increase knowledge among farmers regarding policy issues and the legal and regulatory authorities and environment that concern their operations. This may include research to identify policy constraints and opportunities or support to effect policies and regulations.
• Promote existing services that support business such as communication centers, courier services and money transfer services.
Country specific suggestions that address policy constraints The survey has revealed that certain policies may impact negatively on farmer operations including:
• Policy on location of farm from household – leads to poor management by owner and possible cheating by workers
• Strict regulatory requirements may also discourage entry into the business by those without enough capital to meet all requirements.
• Government continued involvement in service provision leads to market distortion and creates an artificial environment.
Since this is a young sector, the government/ other stakeholders are called upon to create an enabling environment for growth. This would include relaxing some of these regulations such that more providers are encouraged to join the business. Once interest has been created and sufficient numbers of providers’ established, minimum regulations can be reintroduced on a gradual basis. The providers would also require to be trained on how to maintain quality services and customer care and thereby help in sustaining the BDS growth. Besides, government policy of providing subsidised AI and veterinary treatment and vaccinations, though positive in its intentions, can only serve to establish the sector from infancy. However, sustained growth can only be achieved where market forces of supply and demand are left free to operate ‘Illustrative’ market based interventions to develop the market for key identified services that are in demand or offer the greatest potential for stabilization or growth Interventions must “fit” the market and be designed to improve a particular market problem or take advantage of a market opportunity. A key principle for choosing and designing interventions is that the intervention should not be any more intensive than required to address the market issue. Interventions have the capacity to both distort and develop the market. By targeting a specific problem and intervening only to address that problem, programmes run the least risk of distorting the market. It is recommended that all interventions follow the best practice and principles of BDS market development. They must facilitate market development rather than providing services. Programmes should be designed to be flexible and responsive to the market and efforts should be made to coordinate with other development actors. It is vitally important to fit interventions to market issues in such a way that employs subsidies primarily for pre and post service delivery activities only. All interventions activities must be aimed at

REPORT FOR BDS DIAGNOSTIC IN RWANDA FIT RESOURCES JANUARY 2009
63
facilitating market improvement by increasing demand and/or improving supply. The EADD project must clearly separate the roles of provider and facilitator. Providers take care of on-going service delivery the costs of which should be covered by the markets. The provider is an integral part of the system. The facilitator performs the temporary function of developing markets (these activities are considered appropriate to subsidize). The facilitator is external to the market system. Interventions must promote competition and efficiency in the market and work toward a clear picture of a sustainable market. As defined by best practice it is important that the interventions:
� Engage the private sector in devising and developing viable businesses and market models that are likely to be copied and to take off in the wider market.
� Involve little financial support to market players and lots of cost sharing opportunities. The project should develop a transactional relationship with suppliers.
� Are flexible, responsive and multi faceted. The project must tread lightly in markets. � Employ an overarching strategy of ‘crowding in’ or ‘getting others to do things’.
A variety of interventions have been used by other BDS programmes and each aims to address one or several weaknesses in a BDS market such as:
• Voucher programmes address SMEs lack of information about services and reluctance to try a service. It expands demand by providing information and temporary subsidies to SMEs that do not commonly use BDS, and link them with BDS suppliers who do not normally serve SMEs. This increases awareness and demand among SMEs which stimulates suppliers to develop and improve services. However vouchers may distort a market more than necessary by fostering SMEs dependence on subsidies.
• Information to consumers addresses SMEs lack of information about services and
suppliers. The aim is to expand demand for BDS by making SMEs aware of available services and their potential benefits. Some programmes have commercialized the information dissemination role, which increases the potential for sustainability.
• Collective action through clusters, networks and associations addresses SMEs
inability to pay for services and supplier unwillingness (or inability) to sell services in small enough quantities. The aim is to help SMEs overcome dis-economies of scale by enabling them to purchase services in groups. A major challenge of this approach is how labor-intensive it is to form groups and identify services common to everyone in the group. In general, SMEs do not perceive “group organizing” as a service and are not willing to pay for it.
• Business linkages and promoting embedded services address SME isolation
and inability to pay for services up front. Business linkages also address suppliers’ lack of knowledge about SMEs. The aim is to create or expand BDS embedded within business relationships between SMEs and other firms. Facilitation to foster

REPORT FOR BDS DIAGNOSTIC IN RWANDA FIT RESOURCES JANUARY 2009
64
links focuses on disseminating information about players or promoting sub contracting. Examples include:
o Promoting sub-contracting from large firms to SMEs o Providing opportunities for large firms and SMEs to interact o Supporting SMEs participation in trade shows and trade associations o Developing business associations that include SMEs and larger businesses o Building supplier capacity for enterprises that provide embedded services to
SMEs
• Technical assistance (TA) to suppliers addresses suppliers’ lack of technical or managerial skills. The aim is to address a range of supply-side constraints and build the capacity of new or existing BDS suppliers to profitably serve SMEs. TA lessens supplier risk in diversifying by absorbing the costs of innovation. Suppliers also need help to learn how to profitably meet demand. A key advantage of TA is that it allows facilitators to target specific problems in supply. A disadvantage is it may be difficult for a facilitator to offer equal access to assistance to many providers. Providing TA to only a few may give them an unfair advantage however, the market could be developed if other suppliers copy those business strategies. It is also wise to develop the capacity of the private sector itself to provide technical assistance to suppliers.
• Social enterprise addresses a lack of supply in the market. The aim is to increase
the supply of services by helping new suppliers to enter the market. Developing business service markets when “there is no market,” is a challenge. The BDS market development approach encourages not-for-profit institutions to understand and build on the capacity of the existing private sector market. There is some evidence that social enterprises have the potential to contribute to the development of a competitive, vibrant BDS market but key market development principles must apply.
• Product Development and commercialization addresses a lack of appropriate
service products for SMEs in the market and supplier reluctance to target new consumer segments. Suppliers may not be skilled innovators, lacking the knowledge and experience to develop new service products. The aim is to commercialize new products through existing suppliers by assisting with product development, market testing, and initial marketing. New product commercialization can also be undertaken by promoting franchising of appropriate products. But product development costs can be high and sustainability is a key challenge (some programmes have found that they must also provide on-going support services, such as advertising and branding, quality control, remedial service support, and upgrades).
• Offer matching grants to private sector players for strategic technical assistance to
associations, lead firms, service providers, or for pilot programmes to develop new ways of doing business.
• Support BDS policy and advocacy such as developing appropriate SME policies,
ensuring a supportive business environment, and helping SMEs engage in advocacy activities can be an important part of both economic and democratic development. Try building the capacity of advocacy groups, developing mechanisms for public-private dialogue, building the capacity of local governments and developing business environment (BE) reform support functions.

REPORT FOR BDS DIAGNOSTIC IN RWANDA FIT RESOURCES JANUARY 2009
65
• Promote access to Information and Communication Technologies (ICTs):
physically and economically isolated SMEs are gaining better access to information and to communication technologies that put them in touch with markets. SMEs use ICTs to communicate with suppliers, customers, workers, transporters, membership associations, BDS suppliers, and policy makers. However it is challenging to find viable ICT business models that target SMEs. Often the information seems like a public good and commercialization can be problematic. Some charge SMEs for services, others embed the information into existing transactions between SMEs and buyers or suppliers, while some information suppliers generate revenue from advertising or sponsorship deals.
Many of these above strategies are effective ways to stimulate markets or launch a systemic process, but without a strategy for sustainability and market replication, they tend to end with the project. The EADD is not designed as a systemic market project but should be aware of the challenges involved with implementing non systemic interventions such as the ones described above:
• Beware of matching grants to selected private-sector firms, with no clear link to employment creation or backward linkages to small-scale farmers or other poverty-reducing mechanisms.
• Beware of “challenge” grants to individual lead firms that do create jobs and/or link to small-scale farmers, but that are one-off investments, not replicable to other firms and not generating or stimulating other economic development.
• Beware of grants to service providers on a short-term, subsidized, and small-scale basis, rather than stimulating purchasing power of SMEs through vouchers.
• Beware of facilitating business linkages between individual firms and buyers, firms and service providers, firms and suppliers without an over-arching industry competitiveness strategy or a sustainability strategy for the linkage service.
• Beware of direct value chain development: directly enhancing value chain competitiveness by training value-chain businesses and directly facilitating linkages, rather than stimulating associations, business support markets and other learning systems to strengthen multiple businesses in the value chain on a sustainable basis.
• Beware of targeting all assistance directly to SMEs, ignoring the power of larger firms to generate growth that benefits SMEs and the poor.
Approaches and methodologies
EADD should focus on the market system not individual enterprises and view the BDS market from an external and objective position with the goal of benefiting as many SMEs as possible. As a market facilitator the project should plan for a viable and independent market structure that continues to exist after EADD have exited. This includes visualizing the functions of a sustainable market (offering more benefits to SMEs) and the various types of players who do or might perform those functions. The facilitator should promote competition among suppliers in the market. Business-like relationship between the facilitator and suppliers are more effective in developing markets plus this business-like approach has a number of advantages:
• Requiring investment from private sector suppliers means that the financial scale of the initiative will generally fit the capacity of the market.

REPORT FOR BDS DIAGNOSTIC IN RWANDA FIT RESOURCES JANUARY 2009
66
• Business-like relationships foster business-like incentives, behavior and attitudes • It is possible to link support to suppliers’ achievement of agreed upon objectives • The approach attaches a value to support • It builds ownership without being overwhelmed by external funds and advice.
It is recommended that the EADD adopt a facilitative approach to implementation which includes employing a light touch to catalyse, initiate, motivate and link. It is less about ‘what a project does’ and more about ‘why’ and ‘how’. Such as approach focuses on using indirect interventions such as networking, player alignment, intelligence and awareness building. BDS best practice defines the facilitator’s role in the following ways:
• NOT playing a direct role in the market system • Demonstrate the business case, benefits and vision to market players via press
conferences, study trips and seminars. • Share information publicly about opportunities/ lessons learnt in open workshops,
on the internet and in the media. • Implement calls to select service provider partners and engage dynamic
commercial service providers where ever possible. • Mentor partners to develop/ test viable models, strategies and approaches. • Facilitate advice and assistance to capacitate service providers. • Cost share to develop, test/ demonstrate, monitor and evaluate approaches and
services. • Facilitate business linkages, partnerships and contracts. • Capture lessons learnt with analysis of the market system and developed models. • Measure systems change and broader market response. • Undertake impact assessment and examination of causal chain. • Replicate successful interventions. • Implement strategies to promote market-driven replication and scale up.
EADD must:
• Be aware of the entire BDS market using both the value chain and BDS survey results: In a market system, service markets are complementary subsystems to value chains. Researching BDS markets provides information that is not readily available through value chain analysis alone. Although a BDS market can exist completely within a value chain a service provider may also be outside the value chain making a case for cross-cutting services.
• Develop a clear offer: a description of what EADD is bringing to the situation will support the development of a sustainable system.
• Define an exit strategy upfront: the BDS markets and transactions must be sustainable when facilitation activities end and certain facilitation activities may need to continue on a commercial basis. EADD can prepare for this by training BDS providers to conduct these activities themselves.
• Manage expectations and establish credibility: communicating the vision for the BDS market and the part the EADD will play in achieving it is critical. Managing expectations will help EADD establish its credibility.

REPORT FOR BDS DIAGNOSTIC IN RWANDA FIT RESOURCES JANUARY 2009
67
It is strongly recommended that the project pilot interventions early. Some aspects of markets can be understood only after piloting starts and commencing interventions highlights information gaps. An effective programme pilot is an iterative process in which a facilitator tries an intervention on a small scale, learns from the intervention, gathers more information, and adjusts the intervention. Strategies which ensure effectiveness and efficiency
The EADD has adopted a sub sector BDS strategy to support the provision of BDS services to SME players in the dairy sub-sector chains to help them take advantage of market opportunities and earn more profits within the sub-sector. However it is important to recognise that the programme will also promote some “cross-sector” business services. Accounting, computer services, basic legal services, technical training, marketing, and telecommunications services are “cross-sector” services that help firms increase productivity, reduce costs, and access markets. When assessing the performance of the project it will be important to acknowledge how facilitating these services may have impacted on other sub sectors also. It is recommended that the BDS component of the EADD combine all the following key effectiveness strategies. However as the Rwanda locations have been plotted in the low supply and demand quadrant, the strategy of ‘EDUCATING’ should lead:
INFORMING
STRONG SUPPLY LOW DEMAND
FACILITATING
STRONG SUPPLY STRONG DEMAND
EDUCATING
LOW SUPPLY LOW DEMAND
STIMULATING
STRONG DEMAND LOW SUPPLY
“Educating” is advised in the weakest markets (low demand and low supply), in the “marginal” BDS markets where there are few enterprises or where there are extremely exploitative trade relationships. These markets may have been disrupted or have yet to develop and there are few community organizations or private firms with the potential for delivering services. Interventions in these very weak markets should strive to influence the business culture by helping potential clients understand what business development services are and how they help people start, stabilize, and grow businesses. Activities might include:
• Basic business education
• Skills training for self-employment
• Business awareness creation and opportunity identification to help people identify viable businesses
• Identification and capacity building of potential service suppliers
• Tours to other areas where business is more vibrant and BDS markets exist
• Conduct service demonstrations and seminars

REPORT FOR BDS DIAGNOSTIC IN RWANDA FIT RESOURCES JANUARY 2009
68
• Promote farming as a business via radio programs, field days, brochures and exchange visits
• Promote model farmers/consumers and success stories
• Implement and disseminate market studies
• Social media campaigns e.g. dramas and road shows for awareness creation “Facilitating” (strong demand and strong supply) is advised in the markets that have large numbers of small- to medium-sized firms and some active suppliers. BDS programmes operating here conform best to the ideal BDS market development approach of facilitating BDS markets with lighter interventions, helping service providers:
• Identify market niches and provide market research information
• Develop and commercialize new services plus promote use of new technology
• Improve their marketing strategies and facilitate market linkages and expansion to new markets
• Link SMEs with BDS suppliers
• Remove macro-economic constraints to BDS market development
• Developing new business models and differentiated high quality services
• Develop check off systems
• Develop and test ICT potential
• Networking between suppliers
• Capacity building to increase operational efficiency
• Facilitate hubs to improve transactional efficiency
• Promote provision of embedded services
• Match supply and demand via trade shows, farmer field days, creation of a national trading platform
“Stimulating” (strong demand and low supply). Interventions in the BDS markets with very weak supply should focus on stimulating supply. In order to convince private sector suppliers to enter the market, the facilitator may take on the role of supplier by:
• Developing and testing viable business models for service delivery to demonstrate BDS market opportunities
• Researching demand for BDS and publishing the results or holding investor conferences/forums and business opportunity seminars
• Building the capacity of existing and new suppliers
• Linking existing suppliers to financiers and markets
• Linking SMEs with distant service providers
• Helping SMEs work together (clusters, associations, etc.) to access services
• Conducting policy research to identify barriers to entry for suppliers
• Offering suppliers temporary incentives such as matching grants
• Assisting BDS providers with their initial promotion
• Assisting BDS providers with improving their products and marketing
• Advocacy for favourable investment climate
• Create incentives for service providers “Informing” (strong supply and low demand) is advised in the markets with very low demand. Where there are some BDS suppliers, there may be a fairly large gap between the services the supplier offers and SME understanding of their own need for them. In the BDS markets with very low demand, such as those in rural areas, the EADD should aim at “informing” SMEs about the potential benefits of particular BDS by:

REPORT FOR BDS DIAGNOSTIC IN RWANDA FIT RESOURCES JANUARY 2009
69
o Devising a social marketing campaign o Improving supplier marketing capabilities o Assisting suppliers to develop a customer referral system o Conducting service demonstrations and product trials for target enterprises -
explain the benefits of services and illustrate to “first-time users” their need for the services and encourage them to purchase the service at full cost in the future
o Provide direct stimulation - use free samples and vouchers as a direct stimulation strategy
o Improve the level of interaction between SMEs and BDS providers – this can encourage SMEs to purchase BDS. Facilitate fairs, trade shows, exhibitions, meetings, and technical clinics plus initiate advertising in print and mass media.
o Introduce links between BDS providers and potential users - providers who are unfamiliar to SME communities have difficulty promoting their services. These links can also assist providers with increasing their outreach or penetrating new markets
This demand stimulation should be coupled with the capacity building of service providers to help them respond better to SME wants and needs. It is recommended that after the existing and potential commercial providers are agreed in each location, EADD must firstly persuade them that a market opportunity exists to serve dairy business customers. It is important to share market assessment findings with targeted providers and show providers the demand in the market. Market assessment data can show that SMEs purchase services and are willing and able to pay for services that benefit them. EADD can highlight the percentage of potential customers who expressed interest in the service, provide an estimation of potential revenues, and describe the various features customers expect from the service, including modes of payments for services and delivery mechanisms. Maybe in the future the project can involve BDS providers in the market assessment process by having them perform their own market assessments under supervision - this strategy encourages BDS providers to be committed to entering the market. EADD must also educate the providers on the benefits of commercialized BDS, for example, embedded service providers may not realize that they offer services. They may not have consciously thought about improving their services or offering them on a larger scale. The project must be cogniscent of the fact that providers will not enter a new market unless they are reasonably confident that they will make money. Market information can provide much of the data needed to analyze the viability of a new business model or serving a new consumer segment. Market information is useful, and in many cases essential, to assist providers in developing viable business models and a business plan. When considering which business models might work for the delivery of a particular service, the project needs to think broadly and build on existing businesses, business models, or business relationships. The following examples of business models might be viable:
• Independent small service providers

REPORT FOR BDS DIAGNOSTIC IN RWANDA FIT RESOURCES JANUARY 2009
70
• Bigger service businesses subcontracting to small, independent providers • Existing service businesses extending their services to new types of customers • Franchises • Business linkages with embedded services • Previously noncommercial BDS providers, such as vocational training institutions,
government parastatals, and NGOs entering the commercial market Even when providers are willing to enter a new market, they may not have sufficient capacity. In particular, providers often need assistance with developing appropriate service products for new types of customers, designing workable payment mechanisms, and promoting their services to new customers. No amount of persuasion will attract commercial BDS providers if no demonstrable demand exists for the service. Indeed, if providers do not see early revenues, they will quickly drop out of the market. Particularly for new or unfamiliar services, demand creation is an essential part of attracting commercial service providers to the market. Service demonstrations and sales agents are two useful strategies for stimulating demand. Strategies which ensure sustainability It is recommended that the following key sustainability strategies be considered within the business models adopted: Fee for services - suppliers offer services that are low-cost and often have a short-term payback period. Costs are reduced by dividing activities — the facilitator performs much of the service development and testing, and suppliers provide standard services on a regular basis. Suppliers become expert at serving SMEs and the facilitator specializes in negotiating and managing funds and developing supplier capacity. Market research costs may be subsidized by the facilitator who helps with technical assistance or conducts research for many suppliers such as in this BDS market assessment. BDS marketing costs may be subsidized by the facilitator who promotes awareness of services. Suppliers are primarily private sector businesses — donor funding is not used to subsidize direct transactions and the presence of donor funding is not publicized, thus minimizing SME expectations of subsidies. Full prices are charged when service design is complete. Many suppliers may use the following promotional, packaging, and payment mechanisms to reach low-income markets:
• Lower costs by delivering services through other SMEs.
• Package services in small pieces or “sachets”.
• Offer introductory services with immediate value-added for a small fee.
• Offer gradual payment mechanisms such as installment payments.
• Offer financing to allow the poor to pay for services.
• Collect payments “on commission” if services help the business make a profit.
• Help SMEs purchase as a group and receive a discount. Benefits of stand alone services Risks of stand alone services
Provides SMEs with more choice Increased competition leads to lower prices and improved service delivery Maximizes outreach
Lead firms have limitations on quality and standardization Financing constraints may inhibit service delivery

REPORT FOR BDS DIAGNOSTIC IN RWANDA FIT RESOURCES JANUARY 2009
71
Levels power relationships amongst value chain businesses
Difficult to kick-start in an immature market
A combination of fee-based and embedded service provision is crucial in creating a dynamic, competitive market. Embedded services - many SMEs are reluctant or unable to pay up-front for valuable services. However, they can produce commodities or manufacture products if a buyer supplies raw material, market information, product specifications, or other services. Small enterprises may not be able to afford BDS in any form that requires direct payment and embedded services have excellent potential to reach the poor because they are not fee-based. Services provided by buyers of SME products are more likely to reach the poor as are services embedded in essential inputs that the poor already purchase. Embedded services can act as a natural driving force of market transactions and thus provide programmes with an advantage in developing markets. Such services are well tailored to improving transactions between SMEs and other businesses. Services embedded with another service may stimulate the demand for stand-alone services. Benefits of embedded services Risks of embedded services
Enables lead firms to produce per market specification Overcomes financing constraints among SMEs Useful when support market is immature or non-existent
Heavy investment may over-expose lead firms May inhibit development of stand-alone services Potential to “over-service” leading to market distortions
Cross-subsidies - in cases where services are demand-driven and valuable, but not financially viable, some providers choose to cross-subsidize them with other revenue generating activities. Such as supplying BDS to larger businesses that can pay profitable rates and then using profits to supply smaller businesses with services; or operating a completely unrelated business and using those profits to subsidize BDS activities; or using income from a viable BDS to cover the cost of a non-viable BDS. Third party payment - another strategy is to identify and deliver services that are mutually beneficial to both small and large firms, and charge only the large firms. Another example would be harnessing advertising or sponsorship revenue to provide a service which is seen as a public good such as information delivered by radio, print or mobile telephony. Piggy-backing on microfinance and disseminating a BDS through a microfinance institution - successful programmes use credit meetings to disseminate information about a BDS, but offer it as a separate, non-required, fee-based activity. Usually, loan officers and BDS staff are separate as well. The advantages of this approach is that promotional costs are minimal because there is a captive audience in credit meetings, clients have access to finance to pay the fee for a BDS and training costs can be kept to a minimum and overheads minimized. The disadvantages of this approach are that clients may feel compelled to purchase the service for fear of not receiving a loan, primary clients may not

REPORT FOR BDS DIAGNOSTIC IN RWANDA FIT RESOURCES JANUARY 2009
72
be the same as microfinance clients, staff may have too many activities and skills could be diluted. Plus there is a danger of cross-subsidizing low-demand services with lucrative microfinance services, thus compromising institutional profitability. The following strategies are recommended and focus on the preferences and limitations of SMEs:
• Use installments (or hire purchase, renting, leasing) so clients pay a predetermined fee every week/ month or facilitate bulk purchasing.
• Facilitate a guaranteed payment system (a revolving fund or a check off system via a service hub).
• Collect a commission on products sold by the client to recover costs. • Embed the cost of the services into fees for services or products that clients are
known to value. • Educate BDS providers on cost analysis to promote fair and consistent pricing. • Keep the price of the service within the affordability limits of the clients. • Clearly link the services to increased profits for SMEs. • Offer the service over the same time period as the payments. • Determine the installments by assessing the client’s capacity to pay. • Ensure high-quality demand driven services based on market awareness resulting in
concrete benefits for the client. • Ensure continuous improvement of services. • Develop a trusting relationship. Full cost recovery can also depend on the strength
of the existing relationship between the provider and the client. When a trusting relationship exists, greater flexibility in the payment schedule may be possible.
• Monitor payments and follow up with the clients. It is recommended that the project share financial risk only when the market development effects would outweigh the market distortion effects. The facilitator should analyze the potential impact of risk sharing on the market. Will risk sharing distort the BDS market, limiting the entry of potential providers, or expand the market, facilitating the entry of other providers in the market? In the following situations, sharing financial risks is likely to be both essential and beneficial:
o When no or very few existing providers are in the market o When developing new services o In very weak markets o In markets with subsidized providers
To develop a sustainable commercial market for BDS alongside subsidized BDS - commercial services must offer something different, better, or beyond what subsidized services offer; and SMEs must be aware of what these added benefits from commercial services are. The project can use the following methods to meet these conditions:
• Develop unique selling features of a commercial service by understanding the clients’ needs and the gaps in the subsidized services.
• Assist providers with customizing services. • Enable BDS providers to address SMEs’ problems that are not addressed by
existing subsidized services.

REPORT FOR BDS DIAGNOSTIC IN RWANDA FIT RESOURCES JANUARY 2009
73
• Teach commercial providers how to promote their services. It is recommended that on the demand side, the facilitator may need to realize the following objectives: lessen SMEs’ distrust of middlemen and service providers, increase SMEs’ understanding of how services add value to products, and promote a culture of payment for intangible services. It is recommended that on the supply side, the facilitator may need to realize the following objectives: increase BDS providers’ capacities to price services logically, fairly, and consistently; explain to SMEs how services are priced to increase trust; and develop payment options with input from client SMEs. For SMEs to be comfortable paying for services, some transparency on how those services are priced must exist. Value chain workshops can assist with developing this transparency.
Always ask “who would/ should perform this role if the project was not there? The vision is that functions performed by facilitators will either not be needed in sustainably growing markets, or they will be commercialized. Suggested BDS providers/delivery channels to target for future interventions The EADD should ideally work with private sector providers who are business like and willing to invest. This may not be possible in all locations and the project may partner with some of the following types of suppliers: private BDS businesses and individual consultants, informal networks, companies offering other products, farmers’ associations and Coops, religious institutions, employers or business associations, Chambers of Commerce, NGOs, CBOs, research institutions, educational institutions, financial institutions, media houses, publicly funded enterprise development agencies and Government institutions and departments. The project may also partner with members of the supply chain such as input providers who provide embedded services that can be promoted and replicated. The important questions to ask include:
o Who can deliver BDS sustainably and how can the services be paid for? o Which kinds of institutions make highly sustainable providers and how can
services be paid for through commercial channels over the long run and still reach the poor?
o What is the capacity of existing suppliers to expand and/or improve service delivery and potential providers to transform into viable private sector providers?
If the target population is isolated, low-income SMEs, informal sector business may be more appropriate options. In some situations, the dearth of suppliers may require the facilitator to work with community-based entrepreneurs and groups to launch new supplier businesses. But be aware of national level NGOs struggling to define their role. Some NGOs who support the BDS market development approach choose to remain BDS providers, but register as a private company or social enterprise. Others opt to become facilitators. The facilitator may have to support these organisations to define their role clearly.

REPORT FOR BDS DIAGNOSTIC IN RWANDA FIT RESOURCES JANUARY 2009
74
Selecting appropriate BDS providers In order to assist EADD staff in selecting appropriate providers for future interventions a set of criteria has been developed as follows:
• Capacity to deliver services - e.g. existing contracts, marketing strategy & accounting and management systems
• Close to SMEs - in culture, operating environment & geography • Focus on services, SMEs or BDS • Commercial focus - business like with a business vision, profitability (pricing strategy
& pricing mechanisms) & business culture • Organizational independence - especially from donor funds • Legally registered • Willingness/interest/ability to partner – use information, provide minimum investment
capital & expand capacity During the supplier diagnostic interviews each supplier was given a rating against these criteria to enable staff to select partners with the best ability to develop and deliver appropriate services. A workable data base of these BDS providers is attached to this report (Annexes/Databases). BDS performance measurements at the BDS market level It is recommended that the causal chain is firstly made implicit: What does the project expect to happen, and how can the project show that each effect is causally linked back to the original inputs? This describes the overall SME development strategy — the causality between programme inputs, activities, outputs, outcomes, and ultimate impacts. A recommended clear causal link is defined below:
It is further recommended that the EADD adopts the Performance Measurement Framework (PMF). PMF is a common system for measuring the performance of BDS programmes or components of programmes. The goal of PMF is to help improve performance in the BDS field by helping identify best practices and programmes improve their performance. The PMF focuses on assessing changes in supply and demand for
Strengthening the demand for, and supply of, services leads to a vibrant, competitive BDS market
BDS market development leads to large numbers of SMES using and applying business services to improve their business
Better business practices contribute to SME growth and profitability and, eventually, increased employment and income

REPORT FOR BDS DIAGNOSTIC IN RWANDA FIT RESOURCES JANUARY 2009
75
services, the development of BDS markets, and how SMEs use services to change business practices. It proposes to monitor results in 3 categories:
1. Household level (measuring impact on SMEs2) 2. BDS market level (measuring the development of vibrant competitive
markets for BDS) 3. Programme level (measuring programme performance and costs
effectiveness) It is designed to be used in conjunction with occasional impact assessment and more frequent tracking of efficiency indictors by suppliers. Remember a performance evaluation is not the same as an impact assessment.
• Inputs are used to undertake project activities • Project activities produce outputs • Outputs can be evaluated to see if a project achieved its immediate purpose
(performance evaluation) • Outputs lead to outcomes. Outcomes are the final results to show that the project
has contributed towards its overall objective • Outcomes lead to impacts • Impact assessment measures the final results of a project once it has had time to
produce an impact
The PMF is structured to measure common objectives: impact-changes in SMEs, outreach-market development, sustainability and cost effectiveness. The framework proposes objectives that the BDS component of the programme might be trying to achieve: o Impact on SME BDS customers and the wider economic/social environment – to
increase consumer acquisition of BDS, increase customer application of BDS in the business and increase business benefits from BDS
o Outreach, meaning both the number of SMEs reached (scale) and the effort to provide services to people not served by existing markets (access) – to expand the market for BDS, develop a high quality, diverse, competitive market and increase access to BDS by under-served groups
o Sustainability of business service delivery and supplier institutions – to promote sustainable access to services
o Cost-effectiveness of programme activities – to maximize programme cost effectiveness
Goal 1: Increase Impact Assessing BDS Customer, SMES Objective Indicators
Strengthen demand for Total number of firms acquiring BDS by service type 2 SMEs refer to small holder farmers however the definition of what this term to the EADD means must be clear from the onset.
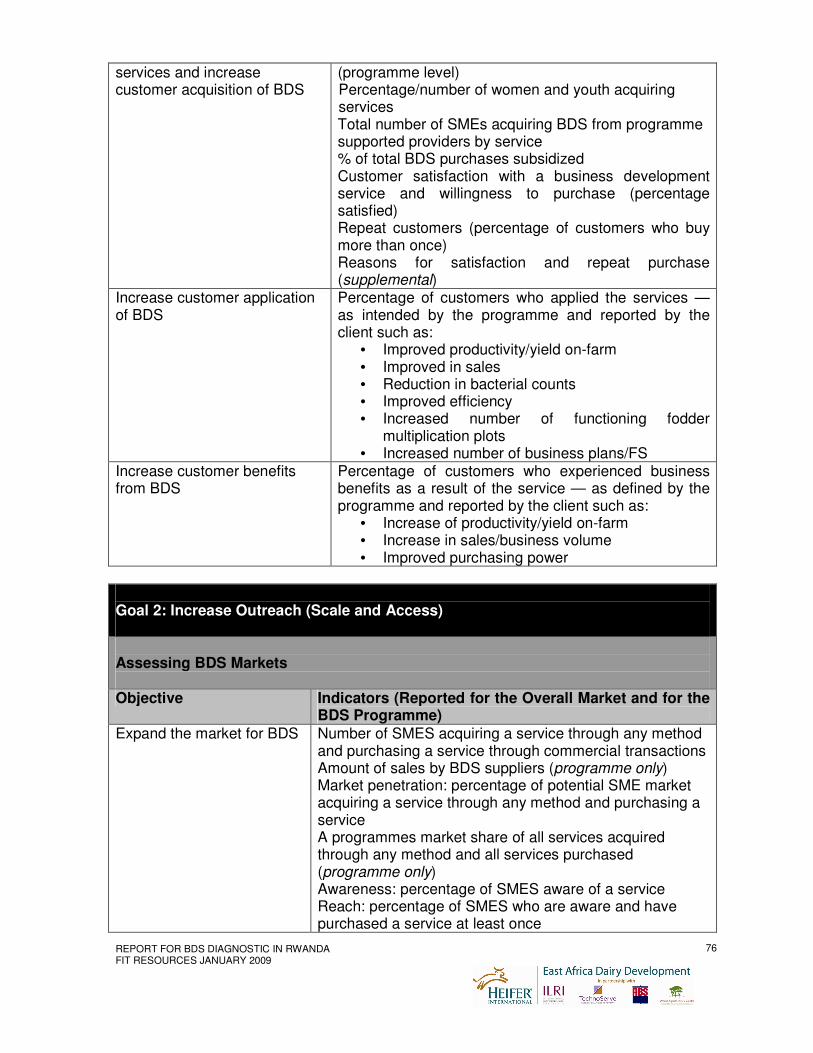
REPORT FOR BDS DIAGNOSTIC IN RWANDA FIT RESOURCES JANUARY 2009
76
services and increase customer acquisition of BDS
(programme level) Percentage/number of women and youth acquiring services Total number of SMEs acquiring BDS from programme supported providers by service % of total BDS purchases subsidized Customer satisfaction with a business development service and willingness to purchase (percentage satisfied) Repeat customers (percentage of customers who buy more than once) Reasons for satisfaction and repeat purchase (supplemental)
Increase customer application of BDS
Percentage of customers who applied the services — as intended by the programme and reported by the client such as:
• Improved productivity/yield on-farm • Improved in sales • Reduction in bacterial counts • Improved efficiency • Increased number of functioning fodder
multiplication plots • Increased number of business plans/FS
Increase customer benefits from BDS
Percentage of customers who experienced business benefits as a result of the service — as defined by the programme and reported by the client such as:
• Increase of productivity/yield on-farm • Increase in sales/business volume • Improved purchasing power
Goal 2: Increase Outreach (Scale and Access) Assessing BDS Markets Objective Indicators (Reported for the Overall Market and for the
BDS Programme)
Expand the market for BDS
Number of SMES acquiring a service through any method and purchasing a service through commercial transactions Amount of sales by BDS suppliers (programme only) Market penetration: percentage of potential SME market acquiring a service through any method and purchasing a service A programmes market share of all services acquired through any method and all services purchased (programme only) Awareness: percentage of SMES aware of a service Reach: percentage of SMES who are aware and have purchased a service at least once

REPORT FOR BDS DIAGNOSTIC IN RWANDA FIT RESOURCES JANUARY 2009
77
Develop a high-quality, diverse, competitive market
Total number of BDS providers in the market by service (market and programme level) % of private, for private (no donor funds/contracts) sector BDS providers Number of BDS products (programme only) % of high quality, differentiated and appropriate services Retention: percentage of multiple purchasers out of all purchasers (not relevant for some programmes) Satisfaction with last service purchase (supplemental) Reasons for purchase, non-purchase, and choice of supplier (supplemental)
Increase access of underserved groups to BDS
Extent of access: percentage of SME customers purchasing a service that represents targeted populations (women, micro enterprises, and so on) Target market penetration: percentage of potential SME targeted markets (women, micro enterprises, etc.) acquiring a service through any method and purchasing a service
Goal 3: Achieving Sustainability and Cost Effectiveness Assessing BDS Suppliers and Facilitators Objective Indicators
Achieve supplier sustainability/profitability
Price for each BDS service % of profitable BDS providers Percentage supplier revenue from SMES Breakdown of sources of supplier revenue (supplemental) BDS supplier financial sustainability (non-donor revenues /total expenses) (supplemental) BDS contribution margin (SME revenues from a service-direct expenses for the service / total expenses) (supplemental) BDS viability (SME revenues from a service / direct expenses for the service) (supplemental)
Improve programme cost-effectiveness
Ratio of annual programme expenses to annual programme sales to SMES Annual programme expenses per customer served Total programme costs per SME (rural households) served Long term outreach growth of programme
The programme must aim to deliver a greater number of differentiated suppliers earning profits from fees (or other commercial sources) with a range of service products available in the market and a gradually increasing numbers of transactions between private suppliers and SMEs. It is expected that service quality and appropriateness will improve with increased competition. Information gathering:

REPORT FOR BDS DIAGNOSTIC IN RWANDA FIT RESOURCES JANUARY 2009
78
• Much of the information required can be sourced for partner suppliers. However the partners must be clear from the outset as to the information to be collected and at what time intervals.
• Data from consumers must be collected via sample surveys. Depending on the budget available quantitative information should be collected during face to face interviews using a questionnaire plus qualitative case studies and testimonies via client interviews. To reduce costs it is recommended that the project also run a number of tele research panels using the phone numbers in the databases compiled during the market assessment. This would involve developing a short questionnaire to collect targeted information over the telephone from a sample of consumers and suppliers.
• Internal quantitative sample surveys using questionnaires The project should aim to:
• CREATE VALUE: Provide information on what’s working/not working and why
• BE SCALEABLE: Provide evidence/potential to serve larger number of poor people
• BE SUSTAINABLE: Provide evidence/potential of market capacity to sustain improvements over time without continued support
It is important that the project capture lessons learnt and provide an analysis of developed business or market models incorporating new and improved business linkages and practices that embody a market development strategy. Specific strategies should be identified for market replication and resilience and systems defined for disseminating information, promoting learning and adaptation and catalyzing market change. Annexes
� Database of SME actors including persons interviewed � Database of BDS suppliers including persons interviewed � Database of targeted suppliers � Itinerary � FIT/RI scope of work � Final instruments � BDS training report � Researcher training report