Embed Size (px)
Citation preview

Business Cycle &Economic Indicators
Understanding the past
Seeing the future!

Business CycleHistorically every economy moves through cycles
expansion,growth
peak
contraction,recession
trough
expansion,growth
Economic Indicators
• Monthly or quarterly
• Helpful in “predicting” future economic trends

Leading Indicators Lagging Indicators
Tends to improve (or deteriorate) BEFORE the Economy does
Tends to improve (or deteriorate) AFTER the Economy does
Examples: Stock Market Price of Oil
Examples: Unemployment Rate GDP Growth Rate
Okay, so now it’s time to do some Indicators Research. . .

Gross Domestic Product (GDP) Growth Rate
• Slowest ever -13.0% (1932)
• Fastest ever +18.5% (1942)
• Historical average: +2.5%-3.0%
Recent GDP Growth Rates: 2Q 2007 +3.6%3Q 2007 +3.0%4Q 2007 +1.7%
1Q 2008: -1.8%2Q 2008 +1.3% 3Q 2008 -3.7%4Q 2008 -8.9%
1Q 2009: -6.7%
2Q 2009 -0.7%3Q 2009 +1.7%
4Q 2009 +3.8%
1Q 2010 +3.9%2Q 2010 +3.8%
3Q 2010 +2.5%4Q 2010 +2.3%
2Q 2011 +1.3%
1Q 2011 +0.4%

Unemployment Rate
•Lowest ever:1.2% (1944)
•Highest ever:24.9% (1933)
•“Full” Employment—4 to 5 percent unemployment
•Inflationary Pressure—unemployment below 4%
--the percentage of people in the total labor force who are actively seeking jobs, but cannot find them
Example: 7.5 million seeking jobs = 5.1% unemployment rate 148 million in labor force

-- a general increase in prices in an economy and consequent fall in the purchasing value of money
Inflation

Inflation Rate—Calculated using the Consumer Price Index (CPI)
CPI = prices of 80,000 goods from 30,000+ stores collected monthly, added together, and averaged.
They are weighted this way:• Housing: 41.4%• Food/Beverage: 17.4%,• Transportation: 17.0%• Medical Care: 6.9%• Other: 6.9%• Apparel: 6.0%• Entertainment: 4.4%.
http://en.wikipedia.org/wiki/Price_index
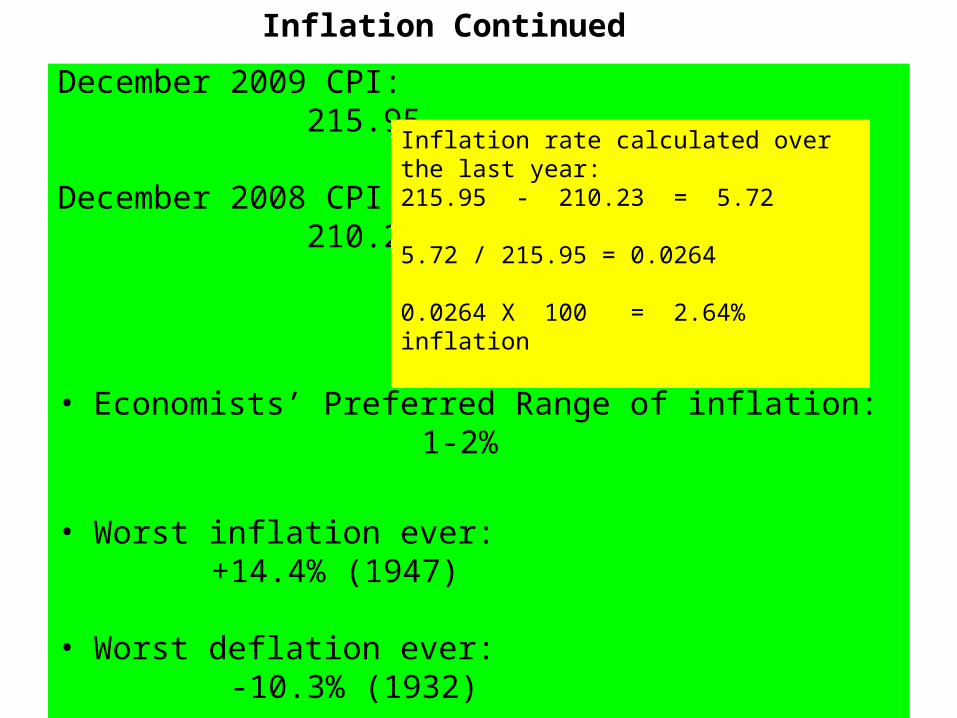
December 2009 CPI: 215.95
December 2008 CPI: 210.23
• Economists’ Preferred Range of inflation: 1-2%
• Worst inflation ever: +14.4% (1947)
• Worst deflation ever: -10.3% (1932)
Inflation Continued
Inflation rate calculated over the last year:215.95 - 210.23 = 5.72
5.72 / 215.95 = 0.0264
0.0264 X 100 = 2.64% inflation

Wholesale Price Index in Germany
“Billions of marks were being printed to finance costs under Weimar government. By late 1923, 300 paper mills
were working top speed and 150 printing companies had 2000 presses going day and night turning out currency.”
July 1914 100.0 January 1919 200.6 July 1919 300.4
January 1921 1,400.4
January 1922 3,600.7
July 1921 2,400.3
January 1920 1,200.6
July 1923 19,400,000.0
January 1923 278,500.0
November 1923 72,600,000,000,000.0
July 1922 10,000.6
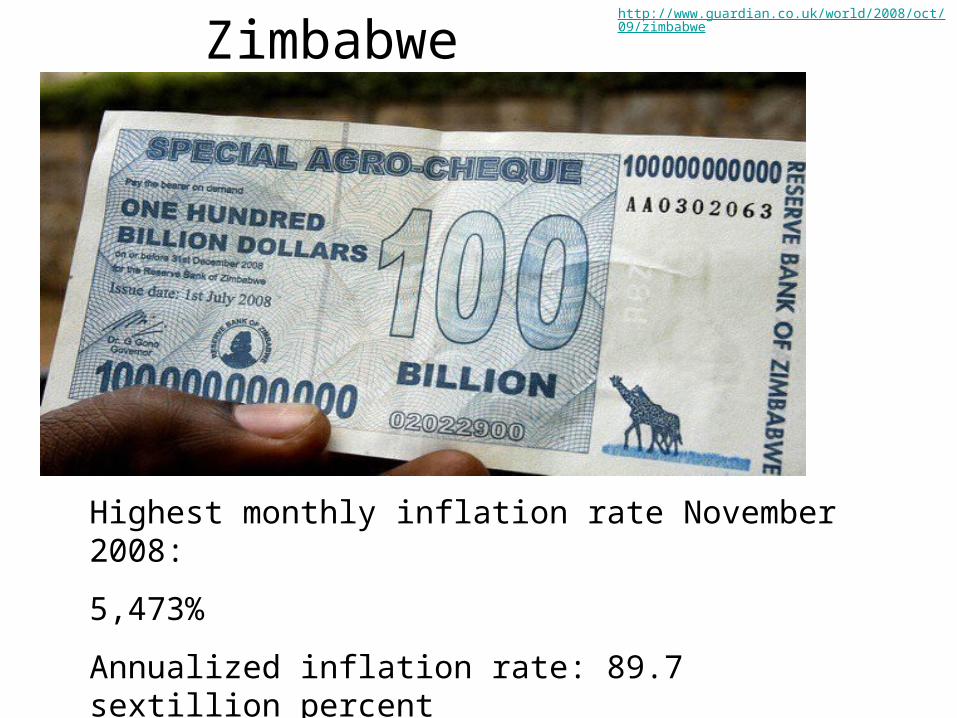
Zimbabwe
Highest monthly inflation rate November 2008:
5,473%
Annualized inflation rate: 89.7 sextillion percent
897,000,000,000,000,000,000,000%
http://www.guardian.co.uk/world/2008/oct/09/zimbabwe
Candy Bar Exercise
INFLATION VIDEO

Candy Simulation Analysis
1. Was this inflation?
2. Why did the price of the candy rise?
3. How could the price be kept stable?

#1: What is the ideal range for the GDP growth rate, that allows for job creation without too much inflation?
Review
2-5%

#2: What is “full” employment?
Review
When the unemployment rate is between 4 and 5%.

#3: Economists and policy makers strive to keep the inflation rate within what range?
Review
1-2%

#4: What happens when the unemployment rate falls below 4 percent?
Review
There is upward pressure on inflation.

#5: Who is the head of the Federal Reserve?
Review
Ben Bernanke

Housing Starts—The number of residential building construction
projects begun during a specific period
http://www.census.gov/const/www/quarterly_starts_completions.pdf
http://www.census.gov/const/newresconst.pdf
2003 1,848
In thousands of starts
2004 1,9562005 2,068 2006 1,801
2007 1,355 2008 906 2009 554

Job Growth
http://data.bls.gov/PDQ/servlet/SurveyOutputServlet?data_tool=latest_numbers&series_id=CES0000000001&output_view=net_1mth
The gross number of jobs created in the American economy in the previous month
The economy needs to create between 130,000-150,000 new jobs per month to keep up with new people entering the labor force
Job Growth Numbers
Fed Chairman Ben Bernanke

What is an interest rate?
• The price that must be paid for the privilege of using someone else’s money
Example:You take out a car loan of $20,000 at a 5% interest rate.Each year until you pay off the loan you will pay a fee of 5% of the amount of money you still have to pay back. The first year you will pay $20,000 X .05 = $1000 interest.
Example:You deposit $1,000 in a savings account that pays 3% interest. Each year that you keep the money in the account, the bank will pay you 3% of the amount of your bank balance.In the first year the bank will pay you $1,000 X .03 = $30 interest.
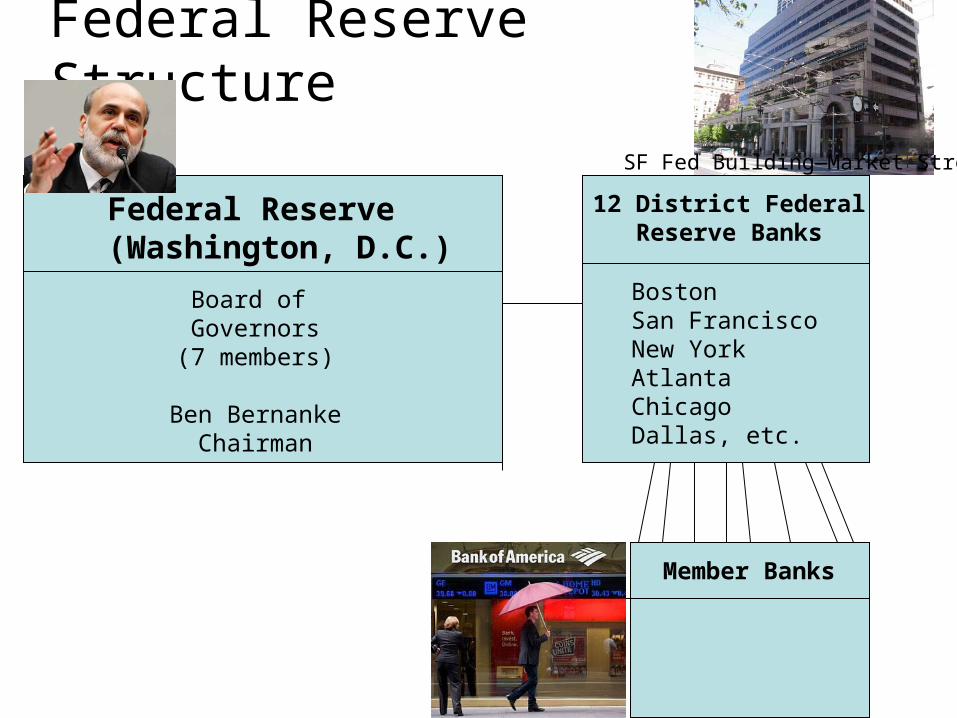
Federal Reserve Structure
Meets 8 times a year to vote on Monetary Policy
Federal Reserve (Washington, D.C.)
Board of Governors
(7 members)
Ben BernankeChairman
12 District FederalReserve Banks
BostonSan FranciscoNew YorkAtlantaChicagoDallas, etc.
Member Banks
SF Fed Building—Market Street


Federal Reserve Structure
Meets 8 times a year to vote on Monetary Policy
Federal Reserve (Washington, D.C.)
Board of Governors
(7 members)
Ben BernankeChairman
12 District FederalReserve Banks
BostonSan FranciscoNew YorkAtlantaChicagoDallas, etc.
Member Banks
All national banks
Some state banks
Federal Funds Rate = Interest ratethat the 12 District banks charge each other on overnight loans
SF Fed Building—Market Street


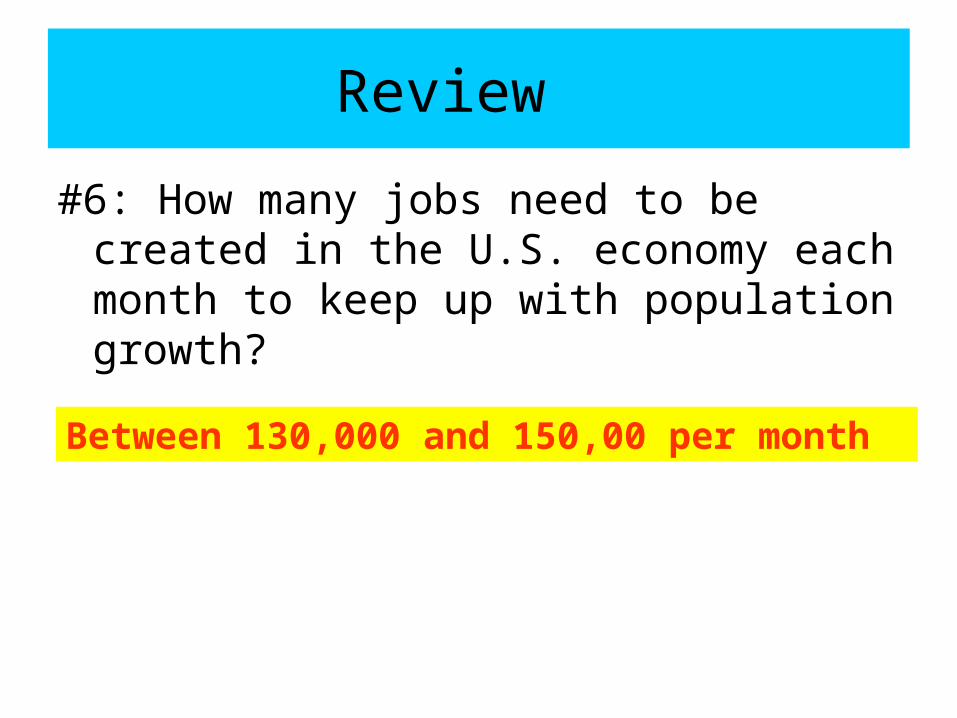
#6: How many jobs need to be created in the U.S. economy each month to keep up with population growth?
Review
Between 130,000 and 150,00 per month
Bubble Demonstration