Embed Size (px)
Citation preview

NSS Discipline Report – Business and Management
2
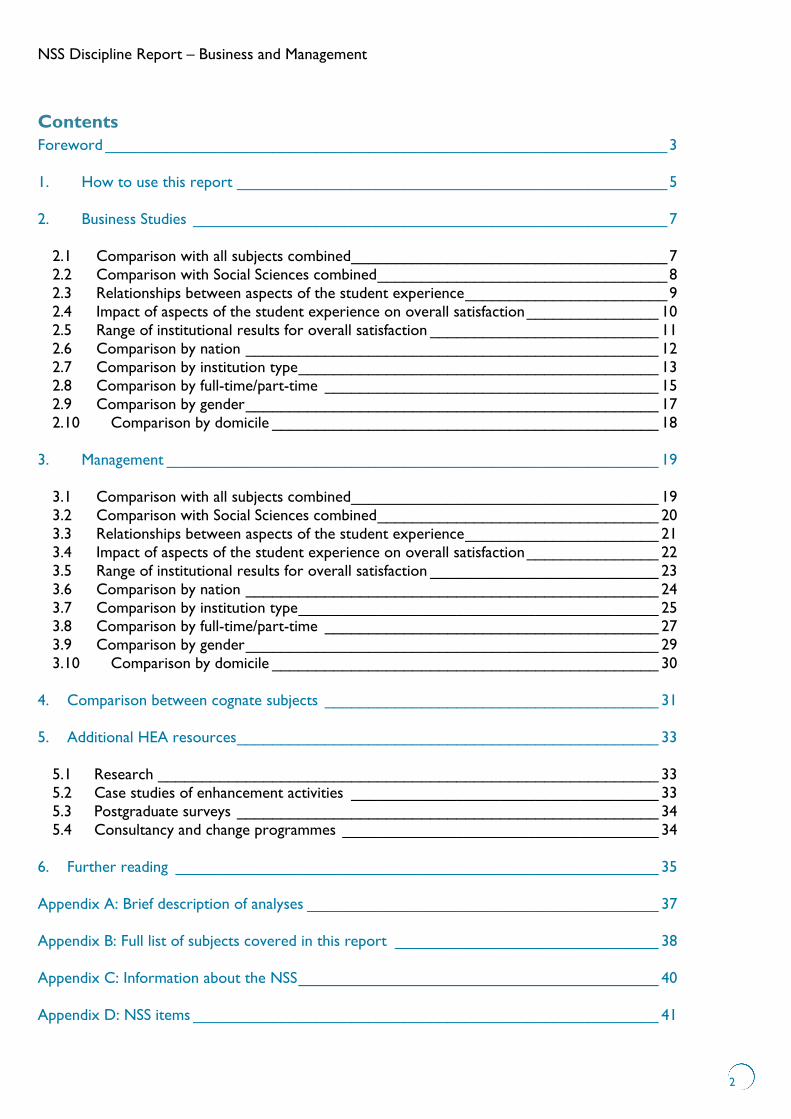
Contents Foreword ________________________________________________________________ 3
1. How to use this report _________________________________________________ 5
2. Business Studies ______________________________________________________ 7
2.1 Comparison with all subjects combined ____________________________________ 7
2.2 Comparison with Social Sciences combined _________________________________ 8
2.3 Relationships between aspects of the student experience _______________________ 9
2.4 Impact of aspects of the student experience on overall satisfaction _______________ 10
2.5 Range of institutional results for overall satisfaction __________________________ 11
2.6 Comparison by nation _______________________________________________ 12
2.7 Comparison by institution type _________________________________________ 13
2.8 Comparison by full-time/part-time ______________________________________ 15
2.9 Comparison by gender _______________________________________________ 17
2.10 Comparison by domicile ____________________________________________ 18 3. Management ________________________________________________________ 19
3.1 Comparison with all subjects combined ___________________________________ 19
3.2 Comparison with Social Sciences combined ________________________________ 20
3.3 Relationships between aspects of the student experience ______________________ 21
3.4 Impact of aspects of the student experience on overall satisfaction _______________ 22
3.5 Range of institutional results for overall satisfaction __________________________ 23
3.6 Comparison by nation _______________________________________________ 24
3.7 Comparison by institution type _________________________________________ 25
3.8 Comparison by full-time/part-time ______________________________________ 27
3.9 Comparison by gender _______________________________________________ 29
3.10 Comparison by domicile ____________________________________________ 30
4. Comparison between cognate subjects ______________________________________ 31
5. Additional HEA resources ________________________________________________ 33
5.1 Research _________________________________________________________ 33
5.2 Case studies of enhancement activities ___________________________________ 33
5.3 Postgraduate surveys ________________________________________________ 34
5.4 Consultancy and change programmes ____________________________________ 34 6. Further reading _______________________________________________________ 35
Appendix A: Brief description of analyses ________________________________________ 37
Appendix B: Full list of subjects covered in this report ______________________________ 38
Appendix C: Information about the NSS _________________________________________ 40
Appendix D: NSS items _____________________________________________________ 41

NSS Discipline Report – Business and Management
3
Foreword Introduction
28 National Student Survey (NSS) discipline reports have been produced by the HEA surveys team, one for each of the areas covered by a Discipline Lead. The reports contain analyses of subject-level data, including comparisons between demographic and institutional characteristics (gender, mission group, etc.).
In this Business and Management report, the data have been further separated using the Joint Academic Coding System (JACS) codes for Business Studies (N100, N700 and N900) and Management (N200 and N600). For business education this report will be complemented by those for Finance and Accounting, Hospitality and Marketing.
Observations
Concentrate on quality teaching and quality support
Quality learning is most often achieved when students are satisfied with their context and circumstances, whether studying full-time or part-time, on campus or by flexible or distance learning. A key challenge is how to ensure that the learning opportunities provided are interesting, relevant, stimulating and challenging within a supportive environment.
The core message from this and previous surveys is the need to ensure firstly, the high quality of the teaching and learning experience and, secondly, the academic support provided to students, as we know these have the greatest impact on student satisfaction and their learning experience (Sections 2.4 and 3.4).
It is hoped that senior HEI staff see through the headline ‘problem’ figures like assessment and feedback, so often their focus because they feature in various comparative tables, because concentrating on these can distract and detract from the more influential underlying factors1.
Student responses – Business Studies compared to Management
There were over 12,600 Business Studies students in the dataset along with nearly 7,600 for Management. Similar proportions are female (51.4% to 55.1%), UK (81.1% to 78.8%) and study full-time (89.4% to 86.6%).
Assessment and feedback
These data send a clear message that there still is a lack of shared understanding between tutors, students and institutions about what constitutes ‘useful’ and ‘prompt’ feedback and what is feasible and desirable given the resources available. This is a particular challenge for institutions where module sizes are high; something the data comparing different institutional types seem to support as further education colleges (FEC) responses are often higher in this respect.
National origin
The national breakdown is in three groupings, i.e. UK, EU and non-EU, and of those the non-EU students seem to be the more satisfied. This may reflect the significant efforts made by UK universities and their staff to meet the challenges presented by students from other countries and cultures.
Within the UK it is noticeable that responses from students in Wales indicate lower satisfaction than those in the other home countries and this deserves further study, although the proposed mergers will prevent direct future comparisons.
1 Dean A, (2011) Enhancing the learning experience of students: lessons from the NSS 2008-2010. Oxford: HEA BMAF Subject Centre.
Available from: http://www.heacademy.ac.uk/assets/bmaf/documents/news/Enhancing_the_learning_experience_of_students_lessons_from_the_NS
S_2008_to_2010.pdf [20 July 2012].

NSS Discipline Report – Business and Management
4
‘Small and Specialist’
It is interesting to note that for these disciplines the ‘Small and Specialist’ institutions receive high satisfaction scores on many questions than bigger pre- and post-1992 HEIs in Business, although this does not apply to Management. In a context where the Welsh Government are driving institutional mergers for possible economies of scale, the impact on future NSS outcomes of the revised institutions will be ones to watch.
Full-time and part-time
15-20% of students in both groups study part-time and higher levels of satisfaction are indicated, but it is unclear whether the levels of satisfaction are similar for distance learners and regular part-time students on campus, some of whom may attend FEC. One possibility is that class sizes may be lower with improved student/lecturer ratios, but there is no evidence to support that in these data.
Institutional type
For Business and Management, Russell Group universities seem to have lower levels of satisfaction and this raises the question whether it reflects a conflict between research and teaching rather than one supporting the other. Or are students’ expectations of these institutions higher based on the wider reputation they have?
For Business, in the institutional support question (Q1, Section 2.7) figures of over 90% for the 1994 Group and Million+ suggest the value of good staff to those students. Interestingly for Management students the highest rating was for the Russell Group, albeit with very similar levels for 1994 Group and Million+.
It is noticeable that in the comparisons across institutional types, FEC attract high or competitive ratings in both Business (Section 2.7) and Management (Section 3.7). This may relate to convenience of access, different expectations, lower student/lecturer ratios and probably a higher proportion of part-time participation. Although these are 12-14% of overall student responses the potential lessons for HE more widely deserve further study.
Discipline comparisons
It is interesting to note that overall more specialist business education programmes like Finance and Accounting attract higher satisfaction levels in most areas than what could be seen as more generalist Business or Management. Institutions may wish to consider some movement from often big generalist towards smaller more specific Business and Management programmes.
Richard Atfield Discipline Lead for Business and Management at the Higher Education Academy

NSS Discipline Report – Business and Management
5
1. How to use this report
This report presents data from the 2011 National Student Survey (NSS) for specific subjects, aggregated across all institutions. By providing information about how subjects are reflected nationally in the NSS, the charts and tables are designed to help departments, faculties and institutions to contextualise and understand their own results.
This report includes NSS data for the following subjects, as classified in the Joint Academic Coding System (JACS) (see Appendix B for a more detailed list)
• Business Studies (N100, N700 and N900)
• Management (N200 and N600) Note about students studying multiple subjects Unless otherwise indicated, all students studying a subject at 50% FPE (full-person equivalent) or more will have their responses allocated to that subject. Students studying two subjects at 50% FPE may therefore have their responses allocated twice. In addition, students studying multiple courses, all at less than 50% FPE, will be excluded from the data. These decisions have been taken to ensure that a response is allocated to a subject when the student has had a significant experience of that subject.
When used with an awareness of the limitations, NSS data can play a useful role in supporting improvements in learning and teaching. By allowing comparisons and benchmarking, the data can highlight areas that would reward further investigation, either as areas of apparent success or challenge. NSS results can be a useful starting point for discussions about learning and teaching, either with colleagues, senior managers, student representatives or students themselves. It is also advisable to triangulate the data with quantitative and qualitative information from other sources in order to effectively target, design and evaluate enhancement activities. This report presents a high-level picture of the discipline through the lens of NSS data, broken down and analysed in a number of different ways. It does not provide a detailed picture of students’ learning experiences, nor does it dictate specific areas for intervention. However, it can be used in conjunction with local NSS data to gain an overview of the views of a group of students, which can provide an excellent starting point for further investigation and discussion. As with all uses of quantitative data, caution should be exercised when interpreting small differences between respondent groups. Small differences may be due to random variations in response, demographic characteristics of the respondents, method of response and many other factors, and small numerical differences may not in fact correspond to genuine differences in experience. A standard method of evaluating whether patterns in the survey sample are likely to reflect patterns in the wider population is to use tests of statistical significance. Methods of analysis used in this report are detailed in Appendix A. Significance levels are included in the tables, but for ease of use significance levels of 0.05 or lower have been highlighted in bold – this is the level at which results are standardly taken to be significant, and suggests that there is a 95% or greater probability that the patterns found in the survey sample are reflective of the final-year undergraduate population as a whole. Unless otherwise stated, where differences are significant (at the 0.05 level) the higher score is in bold text.

NSS Discipline Report – Business and Management
6
It should be noted, however, that significance testing assumes that the survey has been conducted using a random sample, or a design that approximates this. In fact, the NSS attempts to survey the whole final-year undergraduate population and, while all surveys may experience non-response bias, it can be more difficult to correct for this in a ‘census’ type survey. Previous research by Paula Surridge for the HEA has attempted to test for non-response bias and found no significant effect2 and the overall profile of NSS respondents is broadly representative of the wider student body. However, it is not possible to say whether each subgroup explored in this report (such as part-time students, or the results for HEI ‘mission groups’) is similarly representative. For this reason, the significance levels included in this report should only be taken as indications of confidence in the survey results and we recommend that caution be exercised when interpreting, using or relying on small differences. Similarly, the error bars placed around institutional scores may, if anything, be too narrow where non-response bias is substantial. In order to present the data in a more complete manner, tables rather than charts have been used for the majority of this report3. Because there are different response rates for each item in the NSS, no single number of responses can be included for each group in a table. Instead, the range between the lowest and the highest number of responses is shown. The percentage values included in the tables correspond to the proportion of students who agreed with the relevant statement (survey item), i.e. selected either ‘definitely agree’ or ‘mostly agree’. This report contains high-level analyses involving institutional and demographic characteristics. Other than The Open University, no institutions are identified anywhere in the report – in the section on part-time students, the OU’s results have been separated out as they constitute such a large proportion of the part-time student responses. No group smaller than 23 students is reported, and every care has been taken to ensure that no student can be identified either directly or through implication. The analyses included in this report were carried out by Nuala Toman. The HEA acknowledges the assistance of the Higher Education Funding Council for England (HEFCE) in providing the NSS dataset used in this report.
2 The National Student Survey three years on: What have we learned (Surridge, 2009). 3 The data contained in the tables can be used to create charts, if desired, by copying the entire table into a Microsoft Word document, and then copying the required data from that document into a Microsoft Excel spreadsheet.

NSS Discipline Report – Business and Management
7
2. Business Studies There are 12,631 students in the NSS dataset who study Business Studies at 50% FPE or more. 51.4% of students who responded are women, 81.1% are from the UK, and 89.4%% study full-time.
2.1 Comparison with all subjects combined This table compares the experiences of students across the UK responding to the NSS in Business Studies with the experience of all other students responding to the NSS. All (excl. Business
Studies) Business Studies Sig.
Q1. Staff are good at explaining things 88.1% 86.1% .000
Q2. Staff have made the subject interesting 81.3% 72.7% .000
Q3. Staff are enthusiastic about what they are teaching 85.7% 78.3% .000
Q4. The course is intellectually stimulating 84.1% 75.8% .000
Q5. The criteria used in marking have been made clear in advance 72.9% 76.5% .000
Q6. Assessment arrangements and marking have been fair 74.5% 72.8% .000
Q7. Feedback on my work has been prompt 62.8% 58.2% .000
Q8. I have received detailed comments on my work 67.2% 61.3% .000
Q9. Feedback on my work has helped me clarify things I did not understand 61.6% 56.5% .000
Q10. I have received sufficient advice and support with my studies 75.1% 71.7% .000
Q11. I have been able to contact staff when I needed to 83.0% 81.3% .000
Q12. Good advice was available when I needed to make study choices 72.4% 67.5% .000
Q13. The timetable works effectively as far as my activities are concerned 78.4% 78.3% .028
Q14. Any changes in the course or teaching have been communicated effectively
73.4% 74.7% .004
Q15. The course is well organised and is running smoothly 72.3% 75.2% .000
Q16. The library resources and services are good enough for my needs 80.9% 83.0% .000
Q17. I have been able to access general IT resources when I needed to 83.4% 83.5% .174
Q18. I have been able to access specialised equipment, facilities, or rooms when I needed to
75.6% 76.1% .175
Q19. The course has helped me to present myself with confidence 78.9% 80.4% .000
Q20. My communication skills have improved 81.8% 84.1% .000
Q21. As a result of the course, I feel confident in tackling unfamiliar problems 79.2% 79.6% .580
Q22. Overall, I am satisfied with the quality of the course 83.1% 82.4% .006
Number of responses to each item (range lowest – highest) 229,245 – 251,696 11,577 – 12,625

NSS Discipline Report – Business and Management
8
2.2 Comparison with Social Sciences combined This table compares the experience of students across the UK responding to the NSS in Business Studies with the experience of all other students in the wider subject area of Social Sciences responding to the NSS. Social Sciences
(excl. Business Studies
Business Studies Sig.
Q1. Staff are good at explaining things 88.4% 86.1% .000
Q2. Staff have made the subject interesting 79.4% 72.7% .000
Q3. Staff are enthusiastic about what they are teaching 84.8% 78.3% .000
Q4. The course is intellectually stimulating 82.7% 75.8% .000
Q5. The criteria used in marking have been made clear in advance 74.8% 76.5% .000
Q6. Assessment arrangements and marking have been fair 74.9% 72.8% .000
Q7. Feedback on my work has been prompt 62.8% 58.2% .000
Q8. I have received detailed comments on my work 67.8% 61.3% .000
Q9. Feedback on my work has helped me clarify things I did not understand 60.3% 56.5% .000
Q10. I have received sufficient advice and support with my studies 74.1% 71.7% .000
Q11. I have been able to contact staff when I needed to 82.4% 81.3% .008
Q12. Good advice was available when I needed to make study choices 71.1% 67.5% .000
Q13. The timetable works effectively as far as my activities are concerned 79.8% 78.3% .000
Q14. Any changes in the course or teaching have been communicated effectively
74.9% 74.7% .641
Q15. The course is well organised and is running smoothly 74.6% 75.2% .001
Q16. The library resources and services are good enough for my needs 78.5% 83.0% .000
Q17. I have been able to access general IT resources when I needed to 81.8% 83.5% .000
Q18. I have been able to access specialised equipment, facilities, or rooms when I needed to
74.0% 76.1% .000
Q19. The course has helped me to present myself with confidence 80.3% 80.4% .418
Q20. My communication skills have improved 82.7% 84.1% .000
Q21. As a result of the course, I feel confident in tackling unfamiliar problems 79.4% 79.6% .253
Q22. Overall, I am satisfied with the quality of the course 83.3% 82.4% .032
Number of responses to each item (range lowest – highest) 70,375 – 78,923 11,577 – 12,625

NSS Discipline Report – Business and Management
9
2.3 Relationships between aspects of the student experience 21 items in the NSS are grouped into 6 scales, each measuring a different aspect of the student experience (see Appendix D), while item 22 examines overall satisfaction. This table shows the extent to which these different scales are correlated with one another. In other words, it gives an indication of the strength of the relationship between different aspects of the student experience. Values nearer 1 indicate a stronger relationship. However, due to the fact that this analysis shows correlations rather than causal relationships, it is not possible to conclude that improving one aspect of the student experience will automatically lead to improvements in another aspect, even where the relationship appears strong.
Q22. Overall, I am satisfied with the
quality of the course
Quality of Learning and
Teaching scale
Assessment and Feedback
scale
Academic Support scale
Organisation and
Management scale
Learning Resources scale
Personal Development
scale
Q22. Overall, I am satisfied with the quality of the course
1 .706 .571 .624 .589 .368 .613
Quality of Learning and Teaching scale
1 .581 .618 .524 .339 .571*
Assessment and Feedback scale
1 .596 .493 .321 .440
Academic Support scale 1 .547 .367 .515
Organisation and Management scale
1 .370 .440
Learning Resources scale 1 .358
Personal Development scale 1
All correlations are statistically significant at 0.01level. The strongest relationship appears to be between overall satisfaction and quality of learning and teaching.

NSS Discipline Report – Business and Management
10
2.4 Impact of aspects of the student experience on overall satisfaction The different aspects of the student experience, as measured by the 6 item scales in the NSS, are likely to impact upon students’ overall satisfaction with their course, as measured by question 22. To test this, a multiple regression has been performed, examining the extent to which the results for different item scales explain or predict overall satisfaction. In the table below, the higher the size of the standardised coefficient, the greater the influence of that aspect of the student experience on overall satisfaction. All scales combined explain 62.9% (Adjusted R2 = 0.629 ) of the variability of the overall satisfaction item. This is a strong effect but nevertheless suggests the existence of other factors affecting the overall experience which are not measured by the NSS survey. Unstandardised
Coefficients Standardised Coefficients t Sig.
B Std. Error Beta
(Constant) -.550 .036 -15.208 .000
Quality of Learning and Teaching scale .420 .011 .323 38.496 .000
Assessment and Feedback scale .107 .008 .100 12.935 .000
Academic Support scale .152 .009 .141 16.958 .000
Organisation and Management scale .190 .008 .180 24.233 .000
Learning resources scale .026 .007 .024 3.725 .000
Personal Development scale .271 .009 .228 30.567 .000
This analysis shows that the quality of learning and teaching is the most important factor affecting the overall experience while the learning resources have the weakest impact.

NSS Discipline Report – Business and Management
11
2.5 Range of institutional results for overall satisfaction
The points on the graph represent the % agree for overall satisfaction (item 22) among those answering the survey for this subject. The error bars represent 95% confidence intervals – in other words, there is a 95% probability that the actual % agree for all students taking this subject at an institution, rather than just those who responded to the survey, lies within this range. This is important because it is a significant limitation on any rank ordering of institutions based on NSS scores. Institutions with 22 students or less were removed from the graph. If more than one subject in the report then include: ‘Institutions have been anonymised and the numbers on the x-axis do not correspond to the numbers on the x-axis in other graphs in this report.’ In general, this analysis is intended to give an indication of the range of overall satisfaction across institutions offering this subject.

NSS Discipline Report – Business and Management
12
2.6 Comparison by nation This analysis breaks down the results for the subject by the UK nation in which the institution is located. Results from The Open University have not been included in this analysis.
England Scotland Wales Northern Ireland
Sig.
Q1. Staff are good at explaining things 85.9% 89.3% 83.0% 87.6% .003
Q2. Staff have made the subject interesting 72.2% 78.8% 67.6% 66.0% .000
Q3. Staff are enthusiastic about what they are teaching 78.2% 82.4% 71.5% 71.6% .000
Q4. The course is intellectually stimulating 75.3% 78.1% 72.8% 68.6% .005
Q5. The criteria used in marking have been made clear in advance
76.6% 77.2% 70.5% 77.8% .005
Q6. Assessment arrangements and marking have been fair 72.1% 73.4% 73.3% 80.4% .187
Q7. Feedback on my work has been prompt 57.9% 49.7% 56.1% 65.6% .000
Q8. I have received detailed comments on my work 61.4% 53.2% 54.5% 49.0% .000
Q9. Feedback on my work has helped me clarify things I did not understand
56.6% 50.7% 49.8% 49.0% .000
Q10. I have received sufficient advice and support with my studies
71.5% 72.3% 70.0% 69.9% .952
Q11. I have been able to contact staff when I needed to 80.8% 84.9% 79.3% 81.9% .106
Q12. Good advice was available when I needed to make study choices
67.8% 64.5% 65.3% 62.5% .059
Q13. The timetable works effectively as far as my activities are concerned
78.0% 80.4% 79.5% 80.4% .052
Q14. Any changes in the course or teaching have been communicated effectively
73.8% 76.9% 77.1% 80.2% .058
Q15. The course is well organised and is running smoothly
74.3% 75.5% 80.3% 83.5% .000
Q16. The library resources and services are good enough for my needs
83.3% 81.2% 82.6% 87.1% .001
Q17. I have been able to access general IT resources when I needed to
83.3% 82.3% 84.7% 85.1% .696
Q18. I have been able to access specialised equipment, facilities, or rooms when I needed to
76.6% 75.4% 76.0% 75.7% .672
Q19. The course has helped me to present myself with confidence
81.0% 79.8% 72.4% 77.3% .000
Q20. My communication skills have improved 84.6% 85.2% 76.9% 82.4% .000
Q21. As a result of the course, I feel confident in tackling unfamiliar problems
80.1% 79.8% 72.9% 75.3% .001
Q22. Overall, I am satisfied with the quality of the course 81.9% 86.1% 79.6% 87.1% .003
Number of responses to each item (range lowest – highest) 9,741 – 10,641 828 – 884 597 – 652 185 – 194
Where there are statistically significant differences for an item, this is highlighted in bold in the ‘Sig.’ column.

NSS Discipline Report – Business and Management
13
2.7 Comparison by institution type
This analysis categorises the results for the subject according to the institution’s ‘mission group’. Mission group membership is correct for the time the survey took place (Spring 2011). Russell
Group 1994 Group
Million+ University Alliance*
Guild HE**
Sig.
Q1. Staff are good at explaining things 86.7% 91.5% 91.4% 84.0% 85.3% .000
Q2. Staff have made the subject interesting 71.8% 78.3% 80.7% 70.6% 71.6% .000
Q3. Staff are enthusiastic about what they are teaching 78.7% 84.9% 80.7% 77.6% 76.8% .001
Q4. The course is intellectually stimulating 78.5% 81.6% 73.5% 74.4% 73.8% .000
Q5. The criteria used in marking have been made clear in advance
68.5% 76.6% 80.7% 75.6% 77.3% .000
Q6. Assessment arrangements and marking have been fair 68.3% 75.6% 69.5% 70.9% 70.8% .043
Q7. Feedback on my work has been prompt 51.4% 55.7% 60.7% 58.0% 57.1% .003
Q8. I have received detailed comments on my work 48.7% 60.9% 75.1% 62.9% 59.7% .000
Q9. Feedback on my work has helped me clarify things I did not understand
42.4% 53.6% 62.9% 55.3% 57.0% .000
Q10. I have received sufficient advice and support with my studies
65.1% 74.1% 80.2% 70.0% 70.0% .000
Q11. I have been able to contact staff when I needed to 84.0% 86.8% 82.7% 80.9% 78.0% .000
Q12. Good advice was available when I needed to make study choices
62.1% 71.4% 70.4% 66.9% 65.8% .000
Q13. The timetable works effectively as far as my activities are concerned
85.0% 82.0% 81.7% 76.5% 75.3% .000
Q14. Any changes in the course or teaching have been communicated effectively
80.6% 81.1% 69.6% 75.3% 70.6% .000
Q15. The course is well organised and is running smoothly 80.2% 81.3% 78.7% 74.4% 71.4% .000
Q16. The library resources and services are good enough for my needs
88.1% 81.6% 72.1% 86.1% 80.9% .000
Q17. I have been able to access general IT resources when I needed to
87.8% 86.9% 79.2% 83.8% 81.2% .000
Q18. I have been able to access specialised equipment, facilities, or rooms when I needed to
78.0% 81.2% 70.6% 76.4% 75.9% .000
Q19. The course has helped me to present myself with confidence
74.7% 86.7% 83.7% 80.6% 78.3% .000
Q20. My communication skills have improved 78.3% 90.8% 86.2% 83.9% 83.0% .000
Q21. As a result of the course, I feel confident in tackling unfamiliar problems
74.3% 85.1% 77.9% 79.0% 77.7% .000
Q22. Overall, I am satisfied with the quality of the course 83.0% 88.9% 90.3% 81.3% 79.4% .000
Number of responses to each item (range lowest – highest) 812 – 879
738 – 787
187 – 196
3,364 – 3,799
2,282 –2,428
*Excluding Bucks New University (included in Million+). **Excluding Kingston University (included in Million+). Where there are statistically significant differences for an item, this is highlighted in bold in the ‘Sig.’ column.
NSS Discipline Report – Business and Management
14
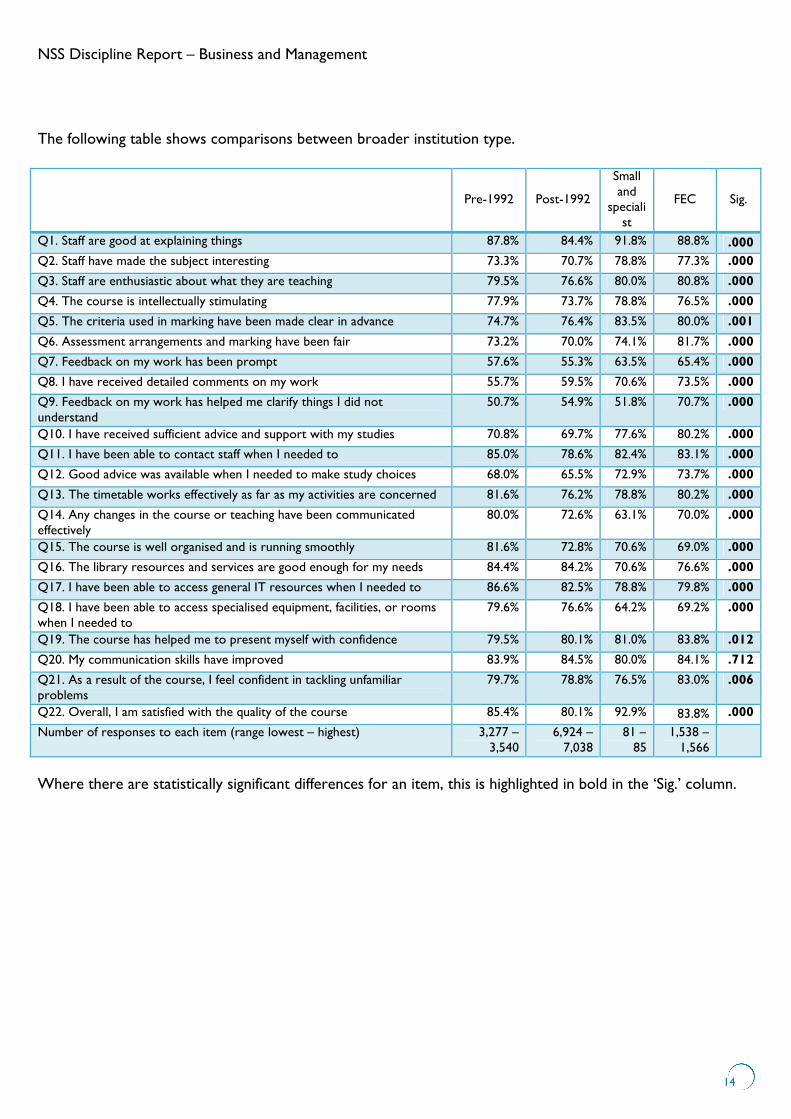
The following table shows comparisons between broader institution type.
Pre-1992 Post-1992
Small and
specialist
FEC Sig.
Q1. Staff are good at explaining things 87.8% 84.4% 91.8% 88.8% .000
Q2. Staff have made the subject interesting 73.3% 70.7% 78.8% 77.3% .000
Q3. Staff are enthusiastic about what they are teaching 79.5% 76.6% 80.0% 80.8% .000
Q4. The course is intellectually stimulating 77.9% 73.7% 78.8% 76.5% .000
Q5. The criteria used in marking have been made clear in advance 74.7% 76.4% 83.5% 80.0% .001
Q6. Assessment arrangements and marking have been fair 73.2% 70.0% 74.1% 81.7% .000
Q7. Feedback on my work has been prompt 57.6% 55.3% 63.5% 65.4% .000
Q8. I have received detailed comments on my work 55.7% 59.5% 70.6% 73.5% .000
Q9. Feedback on my work has helped me clarify things I did not understand
50.7% 54.9% 51.8% 70.7% .000
Q10. I have received sufficient advice and support with my studies 70.8% 69.7% 77.6% 80.2% .000
Q11. I have been able to contact staff when I needed to 85.0% 78.6% 82.4% 83.1% .000
Q12. Good advice was available when I needed to make study choices 68.0% 65.5% 72.9% 73.7% .000
Q13. The timetable works effectively as far as my activities are concerned 81.6% 76.2% 78.8% 80.2% .000
Q14. Any changes in the course or teaching have been communicated effectively
80.0% 72.6% 63.1% 70.0% .000
Q15. The course is well organised and is running smoothly 81.6% 72.8% 70.6% 69.0% .000
Q16. The library resources and services are good enough for my needs 84.4% 84.2% 70.6% 76.6% .000
Q17. I have been able to access general IT resources when I needed to 86.6% 82.5% 78.8% 79.8% .000
Q18. I have been able to access specialised equipment, facilities, or rooms when I needed to
79.6% 76.6% 64.2% 69.2% .000
Q19. The course has helped me to present myself with confidence 79.5% 80.1% 81.0% 83.8% .012
Q20. My communication skills have improved 83.9% 84.5% 80.0% 84.1% .712
Q21. As a result of the course, I feel confident in tackling unfamiliar problems
79.7% 78.8% 76.5% 83.0% .006
Q22. Overall, I am satisfied with the quality of the course 85.4% 80.1% 92.9% 83.8% .000
Number of responses to each item (range lowest – highest) 3,277 – 3,540
6,924 – 7,038
81 – 85
1,538 – 1,566
Where there are statistically significant differences for an item, this is highlighted in bold in the ‘Sig.’ column.
NSS Discipline Report – Business and Management
15
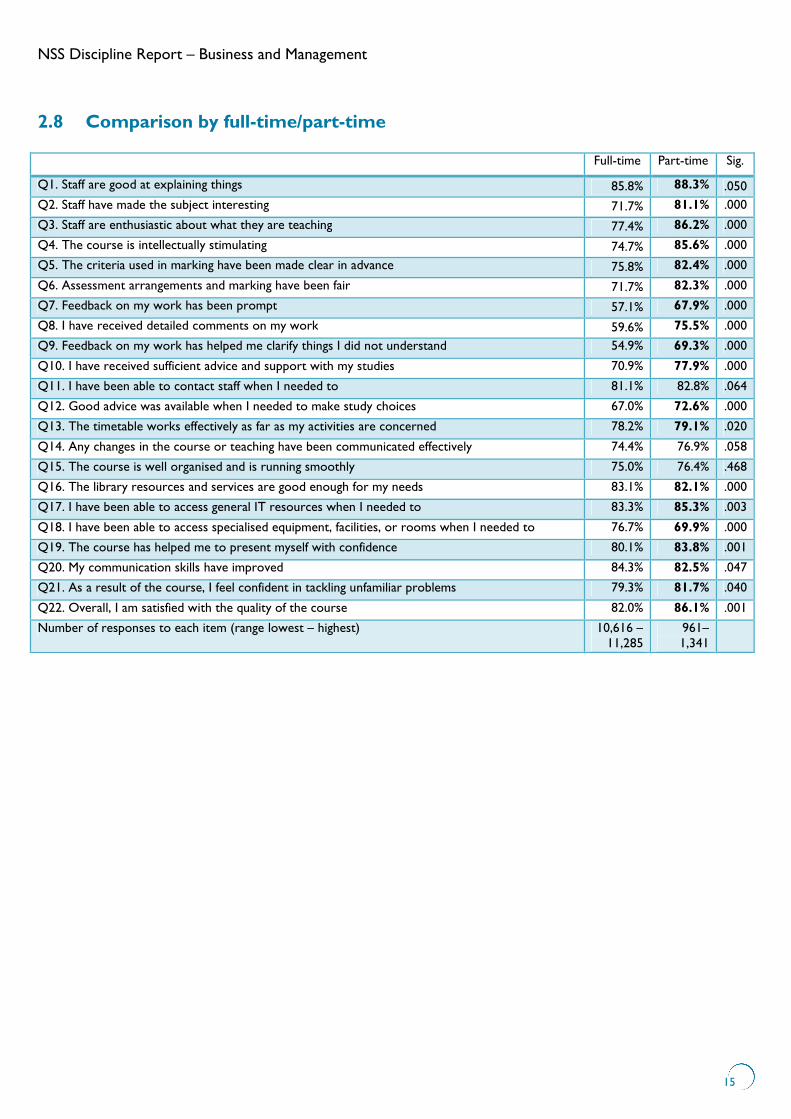
2.8 Comparison by full-time/part-time
Full-time Part-time Sig.
Q1. Staff are good at explaining things 85.8% 88.3% .050
Q2. Staff have made the subject interesting 71.7% 81.1% .000
Q3. Staff are enthusiastic about what they are teaching 77.4% 86.2% .000
Q4. The course is intellectually stimulating 74.7% 85.6% .000
Q5. The criteria used in marking have been made clear in advance 75.8% 82.4% .000
Q6. Assessment arrangements and marking have been fair 71.7% 82.3% .000
Q7. Feedback on my work has been prompt 57.1% 67.9% .000
Q8. I have received detailed comments on my work 59.6% 75.5% .000
Q9. Feedback on my work has helped me clarify things I did not understand 54.9% 69.3% .000
Q10. I have received sufficient advice and support with my studies 70.9% 77.9% .000
Q11. I have been able to contact staff when I needed to 81.1% 82.8% .064
Q12. Good advice was available when I needed to make study choices 67.0% 72.6% .000
Q13. The timetable works effectively as far as my activities are concerned 78.2% 79.1% .020
Q14. Any changes in the course or teaching have been communicated effectively 74.4% 76.9% .058
Q15. The course is well organised and is running smoothly 75.0% 76.4% .468
Q16. The library resources and services are good enough for my needs 83.1% 82.1% .000
Q17. I have been able to access general IT resources when I needed to 83.3% 85.3% .003
Q18. I have been able to access specialised equipment, facilities, or rooms when I needed to 76.7% 69.9% .000
Q19. The course has helped me to present myself with confidence 80.1% 83.8% .001
Q20. My communication skills have improved 84.3% 82.5% .047
Q21. As a result of the course, I feel confident in tackling unfamiliar problems 79.3% 81.7% .040
Q22. Overall, I am satisfied with the quality of the course 82.0% 86.1% .001
Number of responses to each item (range lowest – highest) 10,616 – 11,285
961– 1,341

NSS Discipline Report – Business and Management
16
Because of the large proportion of part-time students who study at The Open University, as an aid to effective benchmarking the following table compares OU part-time students to part-time students studying at other institutions.
Part-time non-OU
Part-time OU
Sig.
Q1. Staff are good at explaining things 88.0% 88.9% .290
Q2. Staff have made the subject interesting 79.9% 83.6% .114
Q3. Staff are enthusiastic about what they are teaching 85.8% 87.0% .043
Q4. The course is intellectually stimulating 83.0% 91.0% .000
Q5. The criteria used in marking have been made clear in advance 83.4% 80.2% .230
Q6. Assessment arrangements and marking have been fair 81.6% 83.9% .321
Q7. Feedback on my work has been prompt 60.3% 83.9% .000
Q8. I have received detailed comments on my work 68.6% 90.2% .000
Q9. Feedback on my work has helped me clarify things I did not understand 64.8% 79.0% .000
Q10. I have received sufficient advice and support with my studies 77.7% 78.3% .161
Q11. I have been able to contact staff when I needed to 80.2% 88.4% .001
Q12. Good advice was available when I needed to make study choices 72.1% 73.8% .174
Q13. The timetable works effectively as far as my activities are concerned 80.2% 76.9% .319
Q14. Any changes in the course or teaching have been communicated effectively 73.1% 85.5% .000
Q15. The course is well organised and is running smoothly 72.5% 84.7% .000
Q16. The library resources and services are good enough for my needs 84.2% 76.8% .000
Q17. I have been able to access general IT resources when I needed to 84.2% 87.9% .001
Q18. I have been able to access specialised equipment, facilities, or rooms when I needed to 73.1% 59.7% .000
Q19. The course has helped me to present myself with confidence 85.0% 81.0% .091
Q20. My communication skills have improved 83.9% 79.6% .028
Q21. As a result of the course, I feel confident in tackling unfamiliar problems 82.8% 79.3% .112
Q22. Overall, I am satisfied with the quality of the course 84.3% 89.8% .007
Number of responses to each item (range lowest – highest) 735 – 909
226 – 421

NSS Discipline Report – Business and Management
17
2.9 Comparison by gender Female Male Sig.
Q1. Staff are good at explaining things 85.9% 86.2% .483
Q2. Staff have made the subject interesting 73.4% 72.0% .190
Q3. Staff are enthusiastic about what they are teaching 78.7% 77.8% .183
Q4. The course is intellectually stimulating 77.6% 74.0% .000
Q5. The criteria used in marking have been made clear in advance 77.5% 75.4% .018
Q6. Assessment arrangements and marking have been fair 73.5% 72.1% .003
Q7. Feedback on my work has been prompt 59.4% 56.9% .014
Q8. I have received detailed comments on my work 61.8% 60.7% .425
Q9. Feedback on my work has helped me clarify things I did not understand 56.0% 57.0% .503
Q10. I have received sufficient advice and support with my studies 70.8% 72.6% .010
Q11. I have been able to contact staff when I needed to 81.4% 81.2% .273
Q12. Good advice was available when I needed to make study choices 66.2% 68.9% .000
Q13. The timetable works effectively as far as my activities are concerned 78.0% 78.5% .784
Q14. Any changes in the course or teaching have been communicated effectively 75.0% 74.3% .513
Q15. The course is well organised and is running smoothly 74.5% 75.9% .029
Q16. The library resources and services are good enough for my needs 81.6% 84.5% .000
Q17. I have been able to access general IT resources when I needed to 83.1% 83.9% .441
Q18. I have been able to access specialised equipment, facilities, or rooms when I needed to 75.9% 76.3% .874
Q19. The course has helped me to present myself with confidence 79.3% 81.6% .003
Q20. My communication skills have improved 84.0% 84.1% .342
Q21. As a result of the course, I feel confident in tackling unfamiliar problems 78.6% 80.6% .004
Q22. Overall, I am satisfied with the quality of the course 83.0% 81.8% .204
Number of responses to each item (range lowest – highest) 5,900 – 6,490
5,677– 6,129

NSS Discipline Report – Business and Management
18
2.10 Comparison by domicile The following analysis breaks down the NSS results for the subject by students’ place of residence. Students are allocated to one category only, so those based in the UK are not included in the EU category for the purpose of this analysis. UK EU Non-
EU Sig.
Q1. Staff are good at explaining things 85.6% 88.3% 87.8% .002
Q2. Staff have made the subject interesting 72.9% 72.9% 71.6% .000
Q3. Staff are enthusiastic about what they are teaching 78.2% 77.0% 79.7% .372
Q4. The course is intellectually stimulating 76.0% 72.3% 76.5% .000
Q5. The criteria used in marking have been made clear in advance 76.1% 75.7% 80.1% .000
Q6. Assessment arrangements and marking have been fair 73.4% 67.7% 71.5% .000
Q7. Feedback on my work has been prompt 56.7% 54.7% 70.7% .000
Q8. I have received detailed comments on my work 60.6% 53.7% 70.6% .000
Q9. Feedback on my work has helped me clarify things I did not understand 55.5% 52.2% 65.8% .000
Q10. I have received sufficient advice and support with my studies 71.1% 73.1% 74.8% .001
Q11. I have been able to contact staff when I needed to 80.4% 85.6% 84.7% .000
Q12. Good advice was available when I needed to make study choices 66.8% 66.6% 72.9% .000
Q13. The timetable works effectively as far as my activities are concerned 78.2% 77.2% 79.1% .000
Q14. Any changes in the course or teaching have been communicated effectively 73.3% 78.2% 81.6% .000
Q15. The course is well organised and is running smoothly 73.6% 78.9% 83.7% .000
Q16. The library resources and services are good enough for my needs 83.3% 84.8% 79.7% .005
Q17. I have been able to access general IT resources when I needed to 82.9% 86.5% 85.5% .000
Q18. I have been able to access specialised equipment, facilities, or rooms when I needed to 75.0% 81.9% 80.0% .000
Q19. The course has helped me to present myself with confidence 80.7% 78.0% 80.1% .129
Q20. My communication skills have improved 83.9% 85.5% 84.2% .693
Q21. As a result of the course, I feel confident in tackling unfamiliar problems 79.7% 78.7% 79.1% .057
Q22. Overall, I am satisfied with the quality of the course 82.0% 81.5% 86.1% .000
Number of responses to each item (range lowest – highest) 9,305 – 10,238
840 – 893
1,432– 1,489
Where there are statistically significant differences for an item, this is highlighted in bold in the ‘Sig.’ column.

NSS Discipline Report – Business and Management
19
3. Management There are 7,598 students in the NSS dataset who study Management at 50% FPE or more. 55.1% of students who responded are women, 78.8% are from the UK, and 86.6% study full-time.
3.1 Comparison with all subjects combined This table compares the experiences of students across the UK responding to the NSS in Management with the experience of all other students responding to the NSS. All (excl.
Management) Management Sig.
Q1. Staff are good at explaining things 88.1% 86.3% .000
Q2. Staff have made the subject interesting 81.1% 74.2% .000
Q3. Staff are enthusiastic about what they are teaching 85.5% 80.7% .000
Q4. The course is intellectually stimulating 83.9% 76.6% .000
Q5. The criteria used in marking have been made clear in advance 73.0% 75.2% .000
Q6. Assessment arrangements and marking have been fair 74.5% 73.1% .022
Q7. Feedback on my work has been prompt 62.7% 59.4% .000
Q8. I have received detailed comments on my work 67.1% 60.5% .000
Q9. Feedback on my work has helped me clarify things I did not understand 61.6% 55.4% .000
Q10. I have received sufficient advice and support with my studies 75.0% 71.7% .000
Q11. I have been able to contact staff when I needed to 83.0% 81.0% .000
Q12. Good advice was available when I needed to make study choices 72.2% 68.5% .000
Q13. The timetable works effectively as far as my activities are concerned 78.4% 79.9% .002
Q14. Any changes in the course or teaching have been communicated effectively
73.4% 75.9% .000
Q15. The course is well organised and is running smoothly 72.4% 74.2% .000
Q16. The library resources and services are good enough for my needs 81.0% 80.9% .929
Q17. I have been able to access general IT resources when I needed to 83.4% 83.0% .189
Q18. I have been able to access specialised equipment, facilities, or rooms when I needed to
75.7% 75.4% .852
Q19. The course has helped me to present myself with confidence 79.0% 80.3% .003
Q20. My communication skills have improved 81.9% 83.2% .014
Q21. As a result of the course, I feel confident in tackling unfamiliar problems 79.2% 78.9% .727
Q22. Overall, I am satisfied with the quality of the course 83.1% 81.3% .000
Number of responses to each item (range lowest – highest) 233,967 – 256,728 6,855 – 7,593
NSS Discipline Report – Business and Management
20
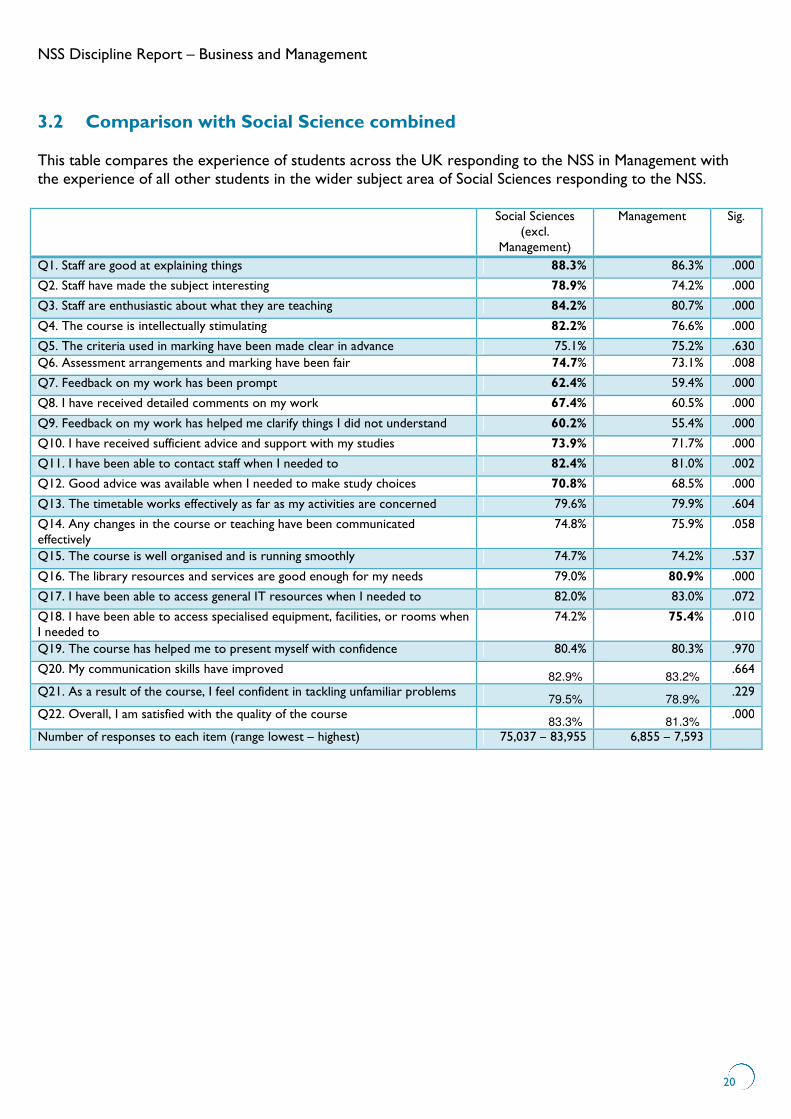
3.2 Comparison with Social Science combined This table compares the experience of students across the UK responding to the NSS in Management with the experience of all other students in the wider subject area of Social Sciences responding to the NSS. Social Sciences
(excl. Management)
Management Sig.
Q1. Staff are good at explaining things 88.3% 86.3% .000
Q2. Staff have made the subject interesting 78.9% 74.2% .000
Q3. Staff are enthusiastic about what they are teaching 84.2% 80.7% .000
Q4. The course is intellectually stimulating 82.2% 76.6% .000
Q5. The criteria used in marking have been made clear in advance 75.1% 75.2% .630
Q6. Assessment arrangements and marking have been fair 74.7% 73.1% .008
Q7. Feedback on my work has been prompt 62.4% 59.4% .000
Q8. I have received detailed comments on my work 67.4% 60.5% .000
Q9. Feedback on my work has helped me clarify things I did not understand 60.2% 55.4% .000
Q10. I have received sufficient advice and support with my studies 73.9% 71.7% .000
Q11. I have been able to contact staff when I needed to 82.4% 81.0% .002
Q12. Good advice was available when I needed to make study choices 70.8% 68.5% .000
Q13. The timetable works effectively as far as my activities are concerned 79.6% 79.9% .604
Q14. Any changes in the course or teaching have been communicated effectively
74.8% 75.9% .058
Q15. The course is well organised and is running smoothly 74.7% 74.2% .537
Q16. The library resources and services are good enough for my needs 79.0% 80.9% .000
Q17. I have been able to access general IT resources when I needed to 82.0% 83.0% .072
Q18. I have been able to access specialised equipment, facilities, or rooms when I needed to
74.2% 75.4% .010
Q19. The course has helped me to present myself with confidence 80.4% 80.3% .970
Q20. My communication skills have improved 82.9% 83.2%
.664
Q21. As a result of the course, I feel confident in tackling unfamiliar problems 79.5% 78.9%
.229
Q22. Overall, I am satisfied with the quality of the course 83.3% 81.3%
.000
Number of responses to each item (range lowest – highest) 75,037 – 83,955 6,855 – 7,593

NSS Discipline Report – Business and Management
21
3.3 Relationships between aspects of the student experience 21 items in the NSS are grouped into 6 scales, each measuring a different aspect of the student experience (see Appendix D), while item 22 examines overall satisfaction. This table shows the extent to which these different scales are correlated with one another. In other words, it gives an indication of the strength of the relationship between different aspects of the student experience. Values nearer 1 indicate a stronger relationship. However, due to the fact that this analysis shows correlations rather than causal relationships, it is not possible to conclude that improving one aspect of the student experience will automatically lead to improvements in another aspect, even where the relationship appears strong.
Q22. Overall, I am satisfied with the
quality of the course
Quality of Learning and
Teaching scale
Assessment and Feedback
scale
Academic Support scale
Organisation and
Management scale
Learning Resources scale
Personal Development
scale
Q22. Overall, I am satisfied with the quality of the course
1 .736 .577 .660 .617 .397 .652
Quality of Learning and Teaching scale
1 .598 .643 .571 .378 .605
Assessment and Feedback scale
1 .614 .504 .336 .473
Academic Support scale 1 .574 .407 .537
Organisation and Management scale
1 .415 .480
Learning Resources scale 1 .382
Personal Development scale 1
All correlations are statistically significant at 0.01level. The strongest relationship appears to be between overall satisfaction and the quality of learning and teaching.

NSS Discipline Report – Business and Management
22
3.4 Impact of aspects of the student experience on overall satisfaction The different aspects of the student experience, as measured by the 6 item scales in the NSS, are likely to impact upon students’ overall satisfaction with their course, as measured by question 22. To test this, a multiple regression has been performed, examining the extent to which the results for different item scales explain or predict overall satisfaction. In the table below, the higher the size of the standardised coefficient, the greater the influence of that aspect of the student experience on overall satisfaction. All scales combined explain 66.3% (Adjusted R2 = 0.663) of the variability of the overall satisfaction item. This is a strong effect but nevertheless suggests the existence of other factors affecting the overall experience which are not measured by the NSS survey. Unstandardised
Coefficients Standardised Coefficients t Sig.
B Std. Error Beta
(Constant) -.688 .044
-15.466 .000
Quality of Learning and Teaching scale .448 .014 .338 31.180 .000
Assessment and Feedback scale .068 .010 .063 6.489 .000
Academic Support scale .177 .011 .163 15.388 .000
Organisation and Management scale .188 .010 .174 18.442 .000
Learning resources scale .020 .009 .018 2.263 .024
Personal Development scale .287 .011 .240 25.312 .000
This analysis shows that the quality of learning and teaching is the most important factor affecting the overall experience while the learning resources have the weakest impact.

NSS Discipline Report – Business and Management
23
3.5 Range of institutional results for overall satisfaction
The points on the graph represent the % agree for overall satisfaction (item 22) among those answering the survey for this subject. The error bars represent 95% confidence intervals – in other words, there is a 95% probability that the actual % agree for all students taking this subject at an institution, rather than just those who responded to the survey, lies within this range. This is important because it is a significant limitation on any rank ordering of institutions based on NSS scores. Institutions with 22 students or less were removed from the graph. In general, this analysis is intended to give an indication of the range of overall satisfaction across institutions offering this subject.

NSS Discipline Report – Business and Management
24
3.6 Comparison by nation This analysis breaks down the results for the subject by the UK nation in which the institution is located. Results from The Open University have not been included in this analysis.
England Scotland Wales Northern Ireland
Sig.
Q1. Staff are good at explaining things 86.2% 90.1% 84.7% 83.4% .210
Q2. Staff have made the subject interesting 73.9% 77.7% 76.8% 70.7% .575
Q3. Staff are enthusiastic about what they are teaching 80.6% 80.7% 78.8% 79.0% .920
Q4. The course is intellectually stimulating 76.5% 77.4% 73.4% 75.8% .562
Q5. The criteria used in marking have been made clear in advance
75.1% 79.6% 74.3% 64.3% .010
Q6. Assessment arrangements and marking have been fair 72.7% 78.9% 72.9% 70.7% .076
Q7. Feedback on my work has been prompt 59.4% 53.8% 64.0% 53.5% .074
Q8. I have received detailed comments on my work 59.4% 53.8% 64.0% 53.5% .354
Q9. Feedback on my work has helped me clarify things I did not understand
55.5% 52.4% 56.7% 44.2% .106
Q10. I have received sufficient advice and support with my studies
71.2% 73.0% 78.7% 75.0% .254
Q11. I have been able to contact staff when I needed to 80.8% 82.4% 81.7% 80.8% .834
Q12. Good advice was available when I needed to make study choices
68.4% 67.8% 71.2% 68.9% .280
Q13. The timetable works effectively as far as my activities are concerned
79.7% 81.9% 74.8% 83.4% .229
Q14. Any changes in the course or teaching have been communicated effectively
75.8% 74.9% 74.3% 79.6% .515
Q15. The course is well organised and is running smoothly
73.9% 74.9% 71.9% 79.0% .287
Q16. The library resources and services are good enough for my needs
81.0% 83.2% 68.7% 86.5% .000
Q17. I have been able to access general IT resources when I needed to
83.0% 87.5% 77.0% 82.6% .006
Q18. I have been able to access specialised equipment, facilities, or rooms when I needed to
75.6% 77.8% 66.5% 77.5% .061
Q19. The course has helped me to present myself with confidence
80.0% 81.7% 85.1% 80.9% .583
Q20. My communication skills have improved 83.0% 84.9% 86.7% 82.2% .813
Q21. As a result of the course, I feel confident in tackling unfamiliar problems
78.7% 80.1% 81.1% 75.8% .779
Q22. Overall, I am satisfied with the quality of the course 80.9% 86.8% 79.8% 80.9% .046
Number of responses to each item (range lowest – highest) 6,103 – 6,749 369 – 394 182 – 203 151 – 157
Where there are statistically significant differences for an item, this is highlighted in bold in the ‘Sig.’ column.
NSS Discipline Report – Business and Management
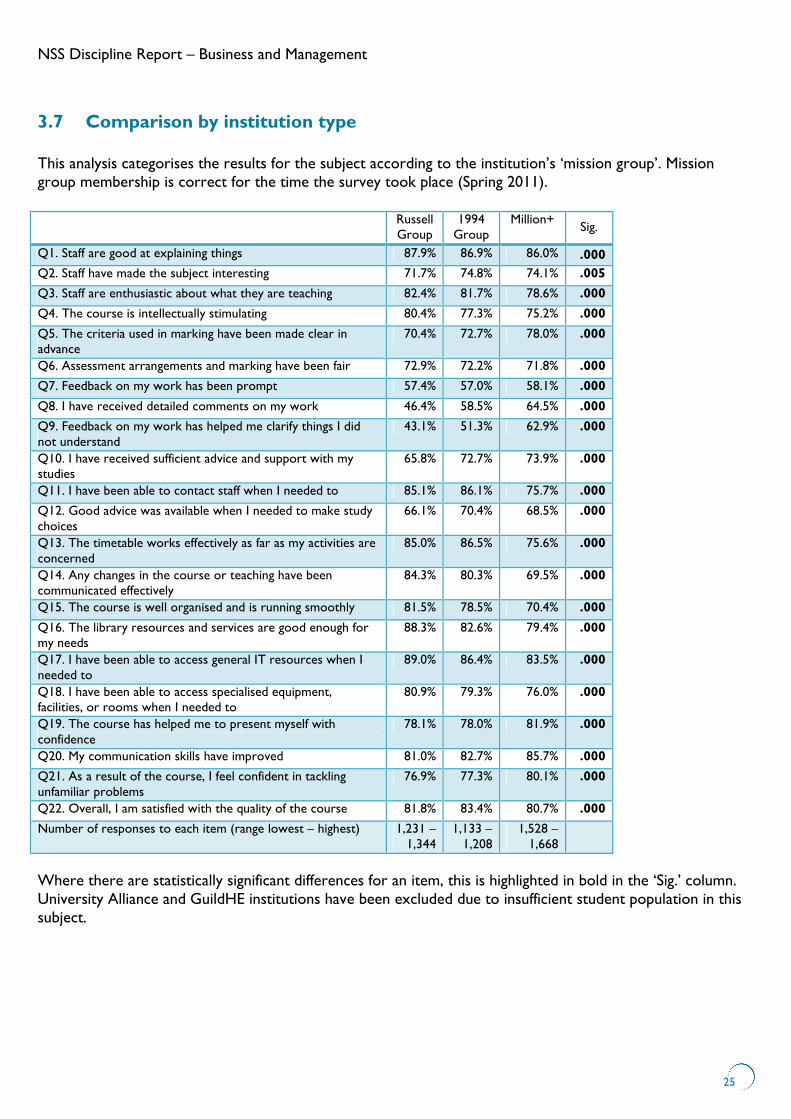
25
3.7 Comparison by institution type This analysis categorises the results for the subject according to the institution’s ‘mission group’. Mission group membership is correct for the time the survey took place (Spring 2011). Russell
Group 1994 Group
Million+ Sig.
Q1. Staff are good at explaining things 87.9% 86.9% 86.0% .000
Q2. Staff have made the subject interesting 71.7% 74.8% 74.1% .005
Q3. Staff are enthusiastic about what they are teaching 82.4% 81.7% 78.6% .000
Q4. The course is intellectually stimulating 80.4% 77.3% 75.2% .000
Q5. The criteria used in marking have been made clear in advance
70.4% 72.7% 78.0% .000
Q6. Assessment arrangements and marking have been fair 72.9% 72.2% 71.8% .000
Q7. Feedback on my work has been prompt 57.4% 57.0% 58.1% .000
Q8. I have received detailed comments on my work 46.4% 58.5% 64.5% .000
Q9. Feedback on my work has helped me clarify things I did not understand
43.1% 51.3% 62.9% .000
Q10. I have received sufficient advice and support with my studies
65.8% 72.7% 73.9% .000
Q11. I have been able to contact staff when I needed to 85.1% 86.1% 75.7% .000
Q12. Good advice was available when I needed to make study choices
66.1% 70.4% 68.5% .000
Q13. The timetable works effectively as far as my activities are concerned
85.0% 86.5% 75.6% .000
Q14. Any changes in the course or teaching have been communicated effectively
84.3% 80.3% 69.5% .000
Q15. The course is well organised and is running smoothly 81.5% 78.5% 70.4% .000
Q16. The library resources and services are good enough for my needs
88.3% 82.6% 79.4% .000
Q17. I have been able to access general IT resources when I needed to
89.0% 86.4% 83.5% .000
Q18. I have been able to access specialised equipment, facilities, or rooms when I needed to
80.9% 79.3% 76.0% .000
Q19. The course has helped me to present myself with confidence
78.1% 78.0% 81.9% .000
Q20. My communication skills have improved 81.0% 82.7% 85.7% .000
Q21. As a result of the course, I feel confident in tackling unfamiliar problems
76.9% 77.3% 80.1% .000
Q22. Overall, I am satisfied with the quality of the course 81.8% 83.4% 80.7% .000
Number of responses to each item (range lowest – highest) 1,231 – 1,344
1,133 – 1,208
1,528 – 1,668
Where there are statistically significant differences for an item, this is highlighted in bold in the ‘Sig.’ column. University Alliance and GuildHE institutions have been excluded due to insufficient student population in this subject.

NSS Discipline Report – Business and Management
26
The following table shows comparisons between broader institution type.
Pre-1992 Post-1992
Small and specialist
FEC Sig.
Q1. Staff are good at explaining things 87.6% 85.8% 71.0% 86.2% .000
Q2. Staff have made the subject interesting 73.6% 74.1% 63.6% 78.7% .001
Q3. Staff are enthusiastic about what they are teaching 82.3% 78.3% 72.8% 83.5% .000
Q4. The course is intellectually stimulating 78.3% 74.7% 63.0% 78.8% .000
Q5. The criteria used in marking have been made clear in advance 72.4% 77.5% 65.4% 78.3% .000
Q6. Assessment arrangements and marking have been fair 72.6% 71.7% 67.9% 79.9% .000
Q7. Feedback on my work has been prompt 57.5% 59.6% 52.5% 64.8% .003
Q8. I have received detailed comments on my work 53.8% 63.9% 59.9% 70.3% .000
Q9. Feedback on my work has helped me clarify things I did not understand
48.2% 59.7% 49.1% 65.0% .000
Q10. I have received sufficient advice and support with my studies 69.8% 72.9% 56.8% 76.1% .000
Q11. I have been able to contact staff when I needed to 84.9% 77.2% 72.2% 80.8% .000
Q12. Good advice was available when I needed to make study choices 67.9% 68.2% 65.8% 72.1% .002
Q13. The timetable works effectively as far as my activities are concerned 84.6% 76.7% 60.9% 77.0% .000
Q14. Any changes in the course or teaching have been communicated effectively
81.7% 72.9% 60.2% 67.6% .000
Q15. The course is well organised and is running smoothly 79.3% 72.4% 53.4% 64.3% .000
Q16. The library resources and services are good enough for my needs 85.3% 78.8% 77.0% 72.8% .000
Q17. I have been able to access general IT resources when I needed to 86.9% 81.3% 72.8% 76.8% .000
Q18. I have been able to access specialised equipment, facilities, or rooms when I needed to
79.7% 74.4% 65.8% 64.0% .000
Q19. The course has helped me to present myself with confidence 78.8% 82.3% 61.1% 81.8% .000
Q20. My communication skills have improved 82.4% 85.5% 69.1% 80.4% .000
Q21. As a result of the course, I feel confident in tackling unfamiliar problems
77.6% 80.5% 64.2% 79.8% .000
Q22. Overall, I am satisfied with the quality of the course 82.6% 80.8% 63.6% 80.8% .000
Number of responses to each item (range lowest – highest) 2,855 – 3,259
2,752 – 3,211
115 – 162 751 – 871
Where there are statistically significant differences for an item, this is highlighted in bold in the ‘Sig.’ column.

NSS Discipline Report – Business and Management
27
3.8 Comparison by full-time/part-time
Full-time Part-time Sig.
Q1. Staff are good at explaining things 86.3% 86.6% .805
Q2. Staff have made the subject interesting 73.1% 81.7% .000
Q3. Staff are enthusiastic about what they are teaching 79.8% 86.6% .000
Q4. The course is intellectually stimulating 75.5% 83.4% .000
Q5. The criteria used in marking have been made clear in advance 74.7% 78.5% .015
Q6. Assessment arrangements and marking have been fair 72.0% 79.9% .000
Q7. Feedback on my work has been prompt 58.0% 68.5% .000
Q8. I have received detailed comments on my work 59.0% 69.7% .000
Q9. Feedback on my work has helped me clarify things I did not understand 54.2% 63.3% .000
Q10. I have received sufficient advice and support with my studies 71.0% 75.9% .002
Q11. I have been able to contact staff when I needed to 81.1% 80.3% .320
Q12. Good advice was available when I needed to make study choices 68.4% 69.7% .000
Q13. The timetable works effectively as far as my activities are concerned 80.1% 78.1% .299
Q14. Any changes in the course or teaching have been communicated effectively 76.2% 73.8% .207
Q15. The course is well organised and is running smoothly 74.5% 72.4% .207
Q16. The library resources and services are good enough for my needs 81.2% 79.0% .163
Q17. I have been able to access general IT resources when I needed to 83.4% 80.5% .000
Q18. I have been able to access specialised equipment, facilities, or rooms when I needed to 76.2% 68.5% .000
Q19. The course has helped me to present myself with confidence 79.8% 83.7% .001
Q20. My communication skills have improved 83.4% 81.7% .006
Q21. As a result of the course, I feel confident in tackling unfamiliar problems 78.5% 81.2% .006
Q22. Overall, I am satisfied with the quality of the course 80.8% 85.1% .004
Number of responses to each item (range lowest – highest) 6,115 – 6,575
740 – 1,108

NSS Discipline Report – Business and Management
28
Because of the large proportion of part-time students who study at The Open University, as an aid to effective benchmarking the following table compares OU part-time students to part-time students studying at other institutions.
Part-time non-OU
Part-time OU
Sig.
Q1. Staff are good at explaining things 86.8% 85.2% .172
Q2. Staff have made the subject interesting 81.8% 81.6% .984
Q3. Staff are enthusiastic about what they are teaching 86.2% 90.7% .359
Q4. The course is intellectually stimulating 83.1% 86.7% .587
Q5. The criteria used in marking have been made clear in advance 78.4% 79.8% .815
Q6. Assessment arrangements and marking have been fair 79.4% 85.4% .135
Q7. Feedback on my work has been prompt 67.2% 82.0% .016
Q8. I have received detailed comments on my work 67.9% 87.6% .001
Q9. Feedback on my work has helped me clarify things I did not understand 62.0% 77.5% .006
Q10. I have received sufficient advice and support with my studies 75.5% 79.8% .181
Q11. I have been able to contact staff when I needed to 79.4% 89.5% .067
Q12. Good advice was available when I needed to make study choices 69.2% 76.3% .086
Q13. The timetable works effectively as far as my activities are concerned 77.4% 85.2% .212
Q14. Any changes in the course or teaching have been communicated effectively 72.6% 87.3% .007
Q15. The course is well organised and is running smoothly 70.7% 90.0% .000
Q16. The library resources and services are good enough for my needs 78.8% 81.0% .008
Q17. I have been able to access general IT resources when I needed to 80.6% 80.2% .149
Q18. I have been able to access specialised equipment, facilities, or rooms when I needed to 69.1% 60.0% .050
Q19. The course has helped me to present myself with confidence 83.6% 85.2% .621
Q20. My communication skills have improved 81.9% 79.8% .206
Q21. As a result of the course, I feel confident in tackling unfamiliar problems 81.1% 82.2% .822
Q22. Overall, I am satisfied with the quality of the course 84.2% 94.4% .032
Number of responses to each item (range lowest – highest) 690 – 928
50-90

NSS Discipline Report – Business and Management
29
3.9 Comparison by gender Female Male Sig.
Q1. Staff are good at explaining things 85.5% 87.3% .043
Q2. Staff have made the subject interesting 73.8% 74.8% .577
Q3. Staff are enthusiastic about what they are teaching 79.7% 81.9% .041
Q4. The course is intellectually stimulating 76.4% 76.8% .219
Q5. The criteria used in marking have been made clear in advance 75.3% 75.0% .945
Q6. Assessment arrangements and marking have been fair 73.0% 73.2% .302
Q7. Feedback on my work has been prompt 60.2% 58.4% .262
Q8. I have received detailed comments on my work 60.3% 60.7% .692
Q9. Feedback on my work has helped me clarify things I did not understand 53.7% 57.5% .004
Q10. I have received sufficient advice and support with my studies 69.3% 74.6% .000
Q11. I have been able to contact staff when I needed to 80.8% 81.2% .868
Q12. Good advice was available when I needed to make study choices 67.1% 70.3% .010
Q13. The timetable works effectively as far as my activities are concerned 79.0% 81.0% .034
Q14. Any changes in the course or teaching have been communicated effectively 74.9% 77.2% .043
Q15. The course is well organised and is running smoothly 72.3% 76.7% .000
Q16. The library resources and services are good enough for my needs 78.4% 84.0% .000
Q17. I have been able to access general IT resources when I needed to 82.2% 84.1% .007
Q18. I have been able to access specialised equipment, facilities, or rooms when I needed to 73.8% 77.2% .004
Q19. The course has helped me to present myself with confidence 78.8% 82.1% .002
Q20. My communication skills have improved 82.4% 84.1% .050
Q21. As a result of the course, I feel confident in tackling unfamiliar problems 77.0% 81.1% .000
Q22. Overall, I am satisfied with the quality of the course 80.8% 82.0% .385
Number of responses to each item (range lowest – highest) 3,745 – 4,184
3,110 – 3,411

NSS Discipline Report – Business and Management
30
3.10 Comparison by domicile The following analysis breaks down the NSS results for the subject by students’ place of residence. Students are allocated to one category only, so those based in the UK are not included in the EU category for the purpose of this analysis. UK EU Non-
EU Sig.
Q1. Staff are good at explaining things 85.4% 88.3% 90.7% .000
Q2. Staff have made the subject interesting 73.5% 77.9% 76.3% .000
Q3. Staff are enthusiastic about what they are teaching 80.1% 80.2% 84.0% .004
Q4. The course is intellectually stimulating 76.1% 76.1% 79.8% .000
Q5. The criteria used in marking have been made clear in advance 74.9% 74.9% 77.2% .003
Q6. Assessment arrangements and marking have been fair 73.7% 69.9% 71.4% .001
Q7. Feedback on my work has been prompt 57.9% 58.0% 68.8% .000
Q8. I have received detailed comments on my work 59.5% 55.9% 68.6% .000
Q9. Feedback on my work has helped me clarify things I did not understand 54.2% 52.2% 64.0% .000
Q10. I have received sufficient advice and support with my studies 71.0% 73.9% 74.2% .000
Q11. I have been able to contact staff when I needed to 79.9% 86.1% 84.2% .000
Q12. Good advice was available when I needed to make study choices 66.8% 72.8% 76.0% .000
Q13. The timetable works effectively as far as my activities are concerned 79.1% 81.9% 82.9% .000
Q14. Any changes in the course or teaching have been communicated effectively 73.9% 84.8% 82.4% .000
Q15. The course is well organised and is running smoothly 71.9% 79.6% 84.4% .000
Q16. The library resources and services are good enough for my needs 81.2% 80.7% 79.5% .076
Q17. I have been able to access general IT resources when I needed to 81.9% 87.6% 86.7% .000
Q18. I have been able to access specialised equipment, facilities, or rooms when I needed to 73.8% 82.0% 80.1% .000
Q19. The course has helped me to present myself with confidence 80.4% 79.3% 80.4% .117
Q20. My communication skills have improved 82.5% 87.6% 84.4% .022
Q21. As a result of the course, I feel confident in tackling unfamiliar problems 78.6% 81.0% 79.1% .371
Q22. Overall, I am satisfied with the quality of the course 80.4% 83.4% 85.8% .000
Number of responses to each item (range lowest – highest) 5,314– 5,985
534 – 566
1,007 – 1,043
Where there are statistically significant differences for an item, this is highlighted in bold in the ‘Sig.’ column.

NSS Discipline Report – Business and Management
31
4. Comparison between cognate subjects This analysis compares NSS results for cognate subjects. Because of important differences in the demographic characteristics of students studying different subjects, and the large effect that subject of study has been shown to have on NSS results, caution should always be exercised when comparing NSS data between subjects. Cognate subjects have been selected for this comparison in order to provide potentially useful information and to suggest where there may be opportunities for learning between subjects, but the limitations of inter-subject comparison should be borne in mind. Unlike in previous tables, only students who study that subject at 100% FPE have been included in this comparison.

NSS Discipline Report – Business and Management
32
Accounting
Business Studies
Finance Management Sig.
Q1. Staff are good at explaining things 89.1% 85.4% 89.0% 86.9% .000
Q2. Staff have made the subject interesting 73.9% 72.3% 74.8% 74.6% .000
Q3. Staff are enthusiastic about what they are teaching 81.7% 77.7% 81.7% 81.1% .000
Q4. The course is intellectually stimulating 81.7% 75.7% 83.8% 76.8% .000
Q5. The criteria used in marking have been made clear in advance
79.2% 76.3% 76.3% 76.2% .002
Q6. Assessment arrangements and marking have been fair 77.7% 72.6% 77.0% 74.3% .000
Q7. Feedback on my work has been prompt 65.3% 58.5% 68.8% 68.8% .000
Q8. I have received detailed comments on my work 61.4% 62.1% 63.9% 63.9% .000
Q9. Feedback on my work has helped me clarify things I did not understand
58.6% 56.7% 60.6% 56.7% .000
Q10. I have received sufficient advice and support with my studies
76.8% 71.6% 74.2% 73.2% .000
Q11. I have been able to contact staff when I needed to 85.8% 80.7% 87.2% 81.2% .000
Q12. Good advice was available when I needed to make study choices
74.0% 67.0% 74.7% 69.3% .000
Q13. The timetable works effectively as far as my activities are concerned
82.4% 78.3% 82.5% 80.3% .000
Q14. Any changes in the course or teaching have been communicated effectively
83.7% 74.6% 81.2% 76.5% .000
Q15. The course is well organised and is running smoothly 84.4% 75.1% 83.5% 83.5% .000
Q16. The library resources and services are good enough for my needs
84.2% 83.1% 86.3% 80.8% .000
Q17. I have been able to access general IT resources when I needed to
85.6% 83.4% 88.1% 82.8% .000
Q18. I have been able to access specialised equipment, facilities, or rooms when I needed to
78.2% 76.2% 80.2% 75.0% .000
Q19. The course has helped me to present myself with confidence
80.2% 80.3% 78.0% 80.9% .009
Q20. My communication skills have improved 82.3% 83.8% 78.5% 83.1% .001
Q21. As a result of the course, I feel confident in tackling unfamiliar problems
79.5% 79.1% 78.3% 78.9% .382
Q22. Overall, I am satisfied with the quality of the course 87.3% 82.0% 86.5% 82.0% .000
Number of responses to each item (range lowest – highest) 2,896 – 3,207
8,469– 9,328 911 – 987 4.960– 5,564
Where there are statistically significant differences for an item, this is highlighted in bold in the ‘Sig.’ column.

NSS Discipline Report – Business and Management
33
5. Additional HEA resources The Higher Education Academy supports institutions and discipline communities to use student survey data to bring about the enhancement of the student learning experience. For more about our work on the National Student Survey please visit http://www.heacademy.ac.uk/nss.
5.1 Research The HEA has produced a number of key pieces of research relating to the NSS:
Dimensions of Quality (2010) Produced by Graham Gibbs, this report sets out to identify those factors that give a reliable indication of the quality of student learning. Its focus is broader than just the use of student survey data, but it provides a useful overview of different mechanisms of evaluating educational quality. Available from: http://www.heacademy.ac.uk/assets/documents/evidence_informed_practice/Dimensions_of_Quality.pdf.
The National Student Survey three years on: What have we learned? (2009) This report by Paula Surridge summarises some key pieces of research to give an overview of findings relating to the NSS. It also gives recommendations for future work. It is a very useful guide to NSS data, especially regarding the important question of what it can and cannot tell us. Available from: http://www.heacademy.ac.uk/assets/documents/research/surveys/nss/NSS_three_years_on_surridge_02.06.09.pdf.
National Student Survey of Teaching in UK Universities: Dimensionality, multilevel structure and differentiation at the level of university and discipline: preliminary results (2008)
This report, by Herb Marsh and Jacqueline Cheng, is a technical investigation of a number of issues, focusing in particular on the relative effects on NSS scores of various factors such as institution and discipline. It is a rich source of information that can help to illuminate raw NSS data. Available from: http://www.heacademy.ac.uk/assets/documents/research/surveys/nss/NSS_herb_marsh-28.08.08.pdf.
5.2 Case studies of enhancement activities Through its Institutional Working Group, the HEA has collected case studies describing how NSS data have been used to enhance learning and teaching within institutions. These have been drawn together in a report called Making it Count, authored by Alex Buckley. Previous case studies are also available:
• Making it count: Reflecting on the National Student Survey in the process of enhancement (2012) available from http://www.heacademy.ac.uk/news/detail/2012/making_it_count
• 12 case studies from 2007, available from: http://www.heacademy.ac.uk/assets/documents/subjects/bioscience/nss-case-studies.doc

NSS Discipline Report – Business and Management
34
• 5 case studies from 2010, available from: http://www.heacademy.ac.uk/assets/EvidenceNet/Case_studies/NSS_case_studies_Nov_2010.pdf.
5.3 Postgraduate surveys In addition to supporting the sector to use NSS data for the enhancement of learning and teaching, the HEA has also developed its own national surveys, looking at the postgraduate student experience.
Postgraduate Taught Experience Survey PTES has been running since 2009, and in 2011 about 39,000 students from 80 institutions completed the survey. The survey asks students about a wide range of elements of their learning experience, including feedback, teaching and skills development. It also asks about the depth and sophistication of the learning they have engaged in. 85 institutions are taking part in the survey in 2012. For more information visit: http://www.heacademy.ac.uk/ptes.
Postgraduate Research Experience Survey PRES is the sister survey of PTES and is aimed at postgraduate research students. It runs every two years, and in 2011 over 31,000 students from 102 institutions completed the survey. The survey will next run in 2013. For more information please visit: http://www.heacademy.ac.uk/pres.
5.4 Consultancy and change programmes The HEA runs regular change programmes for departments and faculties wishing to explore their NSS results. More information can be found here: http://www.heacademy.ac.uk/change. The HEA is also currently developing an institutional consultancy service, which will provide senior managers with advice, tailored analysis and support to help them use survey data to strategically address issues in learning and teaching. If you are interested in this service then please email: [email protected].

NSS Discipline Report – Business and Management
35
6. Further reading In addition to the research produced by the HEA described in the previous section, there are number of other studies and reviews that provide useful information about the strengths and limitations of NSS data.
• Alan Fielding, Peter Dunleavy and Mark Langan (2010) Interpreting context to the UK’s National Student (Satisfaction) Survey for science subjects. Journal of Further and Higher Education. 34 (3), 347-368.
This is an investigation into the complex issues that can arise when interpreting NSS data. A number of important findings are contained in the article, such as the absence of a strong correlation between the experience of feedback and overall satisfaction, and the important subject differences in students’ responses to the NSS items.
• Abbi Flint, Anne Oxley, Paul Helm and Sally Bradley (2009) Preparing for success: one institution’s aspirational and student focused response to the National Student Survey. Teaching in Higher Education. 14 (6), 608-618.
This article discusses the involvement of students in the process of using NSS data for quality enhancement purposes. Various activities are described, including an event to allow academics to hear student perspectives in detail, and the publication of a ‘You Said, We Did...’ document to inform students of the changes that had resulted from their feedback.
• HEFCE (2011) National Student Survey: Findings and trends 2006 to 2010. Bristol: HEFCE. This is the latest annual report on the NSS by HEFCE. It provides an overview of the 2010 data, as well as looking at trends in the data from 2006 to 2010 around various demographic characteristics of the student population.
• Paul Ramsden, Denise Batchelor, Alison Peacock, Paul Temple and David Watson (2010) Enhancing and developing the National Student Survey: report to HEFCE. Bristol: HEFCE.
This report, commissioned by HEFCE, provided an interim evaluation of the functions and performance of the NSS, in order to arrive at recommendations about whether the survey should be updated or developed. The study proposed no substantial changes to the survey, but recommended that a full review be undertaken in 2015.
• John Richardson (2005) Instruments for obtaining student feedback: a review of the literature. Assessment and Evaluation in Higher Education. 30 (4), 387-415.
This is a very useful review of the research literature concerning the different kinds of survey tools that can be used to gather information about students’ learning experiences.
• John Richardson, John Slater and Jane Wilson (2007) The National Student Survey: development, findings and implications. Studies in Higher Education. 32 (5), 557-580.
This article describes the history and development of the NSS, focusing on the mechanisms and findings of the two pilot surveys that took place in 2003 and 2004.
• Ruth Williams and John Brennan (2003) Collecting and using student feedback on quality and standards of learning and teaching in HE. Bristol: HEFCE.
NSS Discipline Report – Business and Management
36
This is a report commissioned by HEFCE in order to: i) to identify good practice in collecting feedback from students, for quality enhancement; and ii) to make recommendations about the design and implementation of a national survey of students. This report played an important role in the development of the NSS.
• Mantz Yorke (2009) Student experience surveys: some methodological considerations and an empirical investigation. Assessment & Evaluation in Higher Education. 34 (6), 721-739.
This article looks at a number of issues and controversies around the design and administration of sector-wide student surveys, including the NSS.

NSS Discipline Report – Business and Management
37
Appendix A: Brief description of analyses Differences between subjects and between various demographic groups within each subject were analysed using the chi-square test. Each NSS item was recoded from the 5 point Likert scale into the 3 point Likert scale and was treated as a discrete variable. The Pearson chi-square statistics were calculated for each NSS item separately and relevant statistical significance values are reported in the tables. If the statistical significance value is equal or less than 0.05 then the difference between groups on the particular NSS item is statistically significant.
NSS scale scores were calculated for each student as the averages taken over all items that belong to the same scale. The averages were taken over the original 5 point Likert scale items, hence they take values between 1 and 5. Some missing values were allowed, i.e. scale score was computed even if a student did not provide an answer to all questions in the scale. The minimum number of answers required per scale was 3. The correlation coefficients between scales and Q22 (the overall satisfaction item) were calculated using the Bivariate correlation (Two-tailed)4.
The regression analysis employs simple linear regression. The dependent variable – Q22 on a 5 point Likert scale – was treated as a continuous variable, which is fairly common although not the only method used to analyse this type of data. This method was chosen for the simplicity of the output and interpretation of the regression coefficients. The NSS scale scores were used as the explanatory variables in the regression equation. Some of them are highly correlated, hence the regression analysis may be subject to the multicolinearity issue. Multicolinearity usually inflates the standard errors of the coefficients, but it does not affect the main conclusion from the model.
The graph(s) shown in the report are simple error bar graph(s). The dots represent the proportion of students who agreed with the overall satisfaction item (Q22). Error bars represent 95% confidence intervals. Please see the Introduction for further guidance on the interpretation of statistical significance and confidence intervals as used in this report.
4 Mean scale scores can oversimplify Likert scale categories, and have only been used in this report where necessary – to undertake correlations and multiple regression analyses.

NSS Discipline Report – Business and Management
38
Appendix B: Full list of subjects covered in this report Business Studies includes: N100 Business Studies The study of organisations and the environment in which they operate.
N110 European Business Studies The study of organisations and their operations within Europe. N120 International Business Studies The study of organisations and their operations throughout the world. N190 Business studies not elsewhere classified Miscellaneous grouping for related subjects which do not fit into the other Business studies categories. To be used sparingly.
N700 Office Skills The generic skills involved in organisational administration.
N710 Office Administration The skills involved in office administration and management. N720 Secretarial and Typing skills Generic secretarial skills.
N721 Audio Typing The typing of documents from a spoken source. N722 Shorthand and Shorthand Transcription Study of shorthand writing and transcription back into normal English.
N790 Office skills not elsewhere classified Miscellaneous grouping for related subjects which do not fit into the other Office skills categories. To be used sparingly.
N900 Others in Business and Administrative Studies Miscellaneous grouping for related subjects which do not fit into the other Business and Administrative studies categories. To be used sparingly.
N990 Business and Administrative studies not elsewhere classified Miscellaneous grouping for related subjects which do not fit into the Others in Business and Administrative categories. To be used sparingly.
Management includes: N200 Management Studies The study of managing organisations.
N210 Management Techniques The specific techniques for managing an organisation.
N211 Strategic Management The techniques involved in the formation and implementation of a strategy within an organisation. N212 Creative Management Techniques for creative problem solving and the management of creativity in others. N213 Project Management The techniques specific to the planning, managing and monitoring of projects. N214 Change Management The specific techniques involved in the planning and management of change within an organisation. N215 Organisational Development The techniques involved in the development of an organisation’s physical and human resources, structure and culture.
N220 Institutional Management The study of the specific techniques required for the management of specific types of institutions.
N223 Domestic Management The specific management techniques involved in the management of homes for the elderly or infirm, childrens’ homes, and other care homes. N224 Management and Organisation of Education The study of the personnel and administration necessary for the efficient organisation of an education establishment. May include investigation of disparate subjects such as office skills, book-keeping, interpersonal skills, child welfare etc.
N230 Land and Property Management The techniques involved in the management of land, buildings and similar physical resources.

NSS Discipline Report – Business and Management
39
N231 Land Management The techniques involved in the management of land. N232 Property Management The techniques involved in the management of buildings and other structures. N234 Property Valuation and Auctioneering The specific techniques involved in the valuation and auctioneering of property.
N240 Retail Management The specific techniques involved in the management of retail outlets. N290 Management studies not elsewhere classified Miscellaneous grouping for related subjects which do not fit into the other Management studies categories. To be used sparingly.
N600 Human Resource Management The specific techniques involved in the management and development of an organisation's human resources.
N611 Industrial Relations The specific techniques involved in the management of people in a situation involving trade unions or similar staff organisations. N612 Staff Development The specific techniques involved in the development of an organisation's human resources. N613 Training Methods The study of specific techniques involved in teaching within a business environment. N614 Recruitment Methods The study of specific techniques involved in recruitment.
N620 Health and Safety Issues The study of issues relating to health and safety in the workplace. N690 Human Resources Management not elsewhere classified Miscellaneous grouping for related subjects which do not fit into the other Human Resources Management categories. To be used sparingly.

NSS Discipline Report – Business and Management
40
Appendix C: Information about the NSS The NSS is a survey of final-year students on undergraduate programmes. It is compulsory for HE providers in England, Wales and Northern Ireland, and some Scottish institutions take part on a voluntary basis5. Ipsos-MORI administer the survey on behalf of HEFCE, and contact all suitable students using a variety of methods (including email and telephone). The survey was introduced in 2005, and in 2011 154 HEIs and 99 FECs took part, and 265,000 students responded – an overall response rate of 65%. NSS data are currently available primarily from the Unistats website (http://unistats.direct.gov.uk), which allows visitors to compare overall satisfaction results at course and institutional level, as well as download spreadsheets with more comprehensive information. In addition HEFCE releases headline figures, as well as annual reports providing national-level analysis. From September 2012, course-level NSS data will be incorporated into Key Information Sets, which will be available on institutional websites and on a new central website. For reasons of reliability and confidentiality, the threshold for public reportability of the results is a response rate of 23 responses, which must also represent at least 50% of the eligible students. Where there are less than 23 responses, responses from more than one year, or from across different courses, can be aggregated to produce publicly reportable data. In addition to the public availability of the data, institutions receive their own data at a more detailed subject level. The reportability threshold for the data that institutions receive is 10 responses, rather than 23. Data at the individual student level are also available for researchers on application to HEFCE. Data at that level have been used in this report. The NSS is based to a significant extent on the Course Experience Questionnaire (CEQ), which has been in use in Australia since 1993. There has been a significant amount of research on the CEQ, and a more limited amount on the NSS, and this research indicates that the two surveys are both reliable – they yield consistent and repeatable data – and valid – they measure what they purport to measure. The NSS asks participants to rate their level of agreement with 22 positive statements, on a five-point scale (in addition to ‘not applicable’): definitely disagree; mostly disagree; neither agree nor disagree; mostly agree; definitely agree. The statements are grouped into six areas, or ‘scales’, in addition to an overall statement: teaching; assessment and feedback; academic support; organisation and management; learning resources; personal development. As well as asking participants to rate their agreement with 22 statements, the survey also invites them to add free-text comments about particular positive or negative aspects of their experience. Institutions can choose to utilise a bank of optional statements in addition to the 22 core statements, which are not publicly reported.
5 14 Scottish institutions took part in 2011.
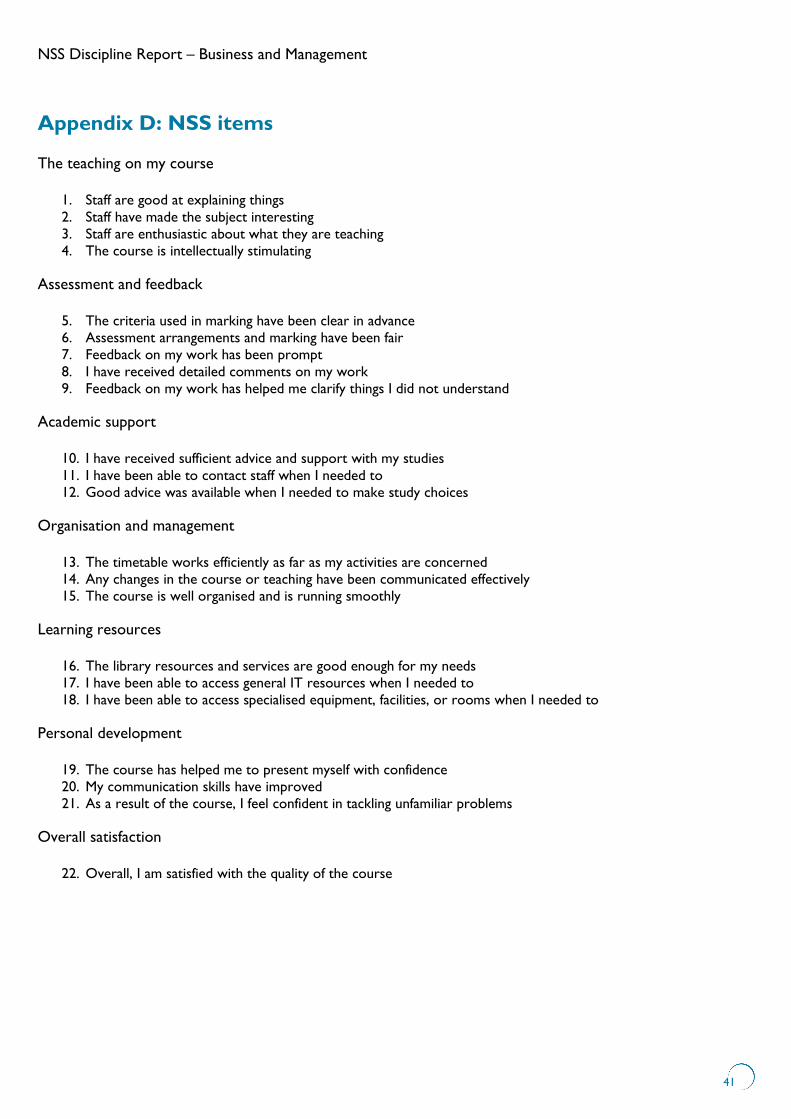
NSS Discipline Report – Business and Management
41
Appendix D: NSS items The teaching on my course
1. Staff are good at explaining things 2. Staff have made the subject interesting 3. Staff are enthusiastic about what they are teaching 4. The course is intellectually stimulating
Assessment and feedback
5. The criteria used in marking have been clear in advance 6. Assessment arrangements and marking have been fair 7. Feedback on my work has been prompt 8. I have received detailed comments on my work 9. Feedback on my work has helped me clarify things I did not understand
Academic support
10. I have received sufficient advice and support with my studies 11. I have been able to contact staff when I needed to 12. Good advice was available when I needed to make study choices
Organisation and management
13. The timetable works efficiently as far as my activities are concerned 14. Any changes in the course or teaching have been communicated effectively 15. The course is well organised and is running smoothly
Learning resources
16. The library resources and services are good enough for my needs 17. I have been able to access general IT resources when I needed to 18. I have been able to access specialised equipment, facilities, or rooms when I needed to
Personal development
19. The course has helped me to present myself with confidence 20. My communication skills have improved 21. As a result of the course, I feel confident in tackling unfamiliar problems
Overall satisfaction
22. Overall, I am satisfied with the quality of the course