Embed Size (px)
Citation preview

Business and Biodiversity Offsets Programme (BBOP)
BBOP Pilot Project Case StudyThe Ambatovy Project
Forest Trends, Conservation International and the Wildlife Conservation Society provided the Secretariat for BBOP during the first phase of the programme's work (2004 – 2008).
Publication Data
The Ambatovy Project Business and Biodiversity Offsets Programme Pilot Project Case Study, 2009: The Ambatovy Project is a Joint Venture project between Sherritt Incorporated, Sumitomo Incorporated, Kores and SNC Lavalin. The Ambatovy Project is comprised of the following two Madagascan operating companies, Ambatovy Minerals SA (AMSA) and Dynatec Madagascar S.A. (DMSA). The Project Administrative offices are located at Trano Fitaratra, 7ème étage, Ankorondrano, Antananarivo, Madagascar (PO Box 12085, Poste Zoom, Ankorondrano), T: +261 20 22 230 88 / 22 397 35 – 37 F: +261 20 22 540 30, http://www.sherritt.mg/
Available from www.forest-trends.org/biodiversityoffsetprogram/guidelines/ambatovy-case-study.pdf.
© The Ambatovy Project (Ambatovy Minerals SA/Dynatec Madagascar SA) 2009.
Reproduction of this publication for educational or other non-commercial purposes is authorised without prior written permission from the copyright holder provided the source is fully acknowledged.
Reproduction of this publication for resale or other commercial purposes is prohibited without prior written permission of the copyright holder.
The findings, interpretations and conclusions expressed here are those of the authors and do not necessarily reflect the views of The Ambatovy Project. Any errors are purely the responsibility of the authors.
Cover and graphic design by Rima Design.

THE AMBATOVY PROJECT
BBOP PILOT PROJECT
BUSINESS AND BIODIVERSITY OFFSETS PROGRAMME
CASE STUDYPREPARED BY PIERRE O. BERNER, STEVEN DICKINSON AND ARISTIDE ANDRIANARIMISA
JANUARY 2009


1
BBOP Pilot Project Case Study – Ambatovy Project
About this document
To help developers, conservation groups, communities, governments and financial institutions that wish to
consider and develop best practice related to biodiversity offsets, the Business and Biodiversity Offsets
Programme (BBOP) has prepared a set of Principles, interim guidance and resource documents1, including
pilot project case studies, of which this Document2 is one. All those involved in BBOP are grateful to the
companies who volunteered pilot projects in this first phase of its work.
The ability to test methods and learn from practical experience in a set of pilot projects has played an
important role in the development of the BBOP Principles on Biodiversity Offsets and supporting materials
during the first phase of the programme’s work (2004 – 2008). The Ambatovy Project’s four shareholders
volunteered to undertake pilot projects during BBOP’s first phase, with some joining at the outset, and some
at later stages. While BBOP has offered some support and technical advice to the individual pilot projects
through its Secretariat and Advisory Committee, each pilot project has been directed and managed by a team
employed or contracted by the companies and city council leading the respective projects. Each of the case
studies prepared by the pilot projects explains the approach taken and how close the Project has come to
completing the design of the biodiversity offset concerned, and sets out the developer’s current thinking on the
most appropriate offset. This may change as the Project teams finalise their offset programme design and
further implementation. The nature of the guidance used by the pilot projects has varied according to which
drafts of the evolving BBOP Handbooks were available to them at the time. This and the individual
circumstances and context of each pilot project have affected the extent to which they have used or adapted
the BBOP guidance. Consequently, the case studies do not necessarily reflect the range of interim guidance
currently presented in BBOP’s Biodiversity Offset Design Handbook, Cost-Benefit Handbook and
Implementation Handbook.
This Document has been provided by the Ambatovy Project subject to the limitations set out herein.
The Ambatovy Project is still working on the design of the proposed biodiversity offset discussed in this case
study. Consequently, none of the suggested or projected activities based on fieldwork to date represent a
commitment on the part of The Ambatovy Project, it shareholders or potential partners to proceed with the
offset as described in draft form in this Document. Such commitment is the subject of continuing internal
discussions. The information and data relating to possible offset sites, areas and activities are presented here
to communicate the initial work that has been done on a potential offset design and to illustrate one possible
approach to the design of a biodiversity offset intended to comply with the BBOP principles.
Where data supplied by external sources, including previous site investigation data, have been used, it has
been assumed that the information is correct unless otherwise stated. No responsibility is accepted by the
Ambatovy Project for incomplete or inaccurate data supplied by others.
1 The BBOP Principles, interim guidance and resource documents, including a glossary, can be found at www.forest-trends.org/biodiversityoffsetprogram/guidelines/. To assist readers, a selection of terms with an entry in the BBOP Glossary has been highlighted thus: biodiversity offsets. Users of the Web or CD-ROM version of this document can move their cursors over a glossary term to see the definition.
2 This case study was prepared by Pierre O. Berner, Steven Dickinson and Aristide Andrianarimisa.

About this document 2
BBOP Pilot Project Case Study – Ambatovy Project
The Ambatovy Project may have retained sub-consultants affiliated with the Ambatovy Project to provide
Services for the benefit of the Ambatovy Project. To the maximum extent allowed by law, users of this
Document acknowledge and agree they will not have any direct legal recourse to, and waive any claim,
demand, or cause of action against, the Ambatovy Project’s contractors, sub-contractors, partners,
shareholders and other related or affiliated companies, and their respective employees, officers and directors.
This Document is provided for the use by developers, conservation groups, communities, governments and
financial institutions that wish to consider and develop best practice related to biodiversity offsets. No
responsibility whatsoever for the contents of this Document will be accepted by any person. Any use made of
this Document or any reliance on or decisions to be made based on it, is the responsibility of such users. The
Ambatovy Project accepts no responsibility for damages, if any, suffered by any third party as a result of
decisions made or actions based on this Document.
For greater certainty, this Document has been prepared for the particular purpose outlined herein and no
responsibility is accepted for the use of this Document, in whole or in part, in other contexts or for any other
purpose.
BBOP is embarking on the next phase of its work, during which BBOP hopes to collaborate with more
individuals and organisations around the world, to test and develop these and other approaches to biodiversity
offsets more widely geographically and in more industry sectors. BBOP is a collaborative programme, and we
welcome your involvement. To learn more about the programme and how to get involved please:
See: www.forest-trends.org/biodiversityoffsetprogram/
Contact: [email protected]

3
BBOP Pilot Project Case Study – Ambatovy Project
Contents
Table of contents
About this document 1
1. Executive Summary 6
2. Project Context 11
2.1 Policy context 11
2.2 Regional context 12
2.3 Shareholders involved in offset design 14
3. Project Summary 15
3.1 General project description 15
3.2 Ambatovy offset programme 17
4. How the Ambatovy Project is Applying the BBOP Principles 19
5. Current Status of the Project and Offset 24
5.1 Project chronology and status (as of December 2008) 24
5.2 Offset chronology and status (as of December 2008) 24
6. Business Case for a Biodiversity Offset 26
7. The Offset Design Process 28
7.1 Guidance and methodologies used 28
7.2 Roles and responsibility 28
7.3 The offset design process 29
7.3.1 Step 1: Review project scope and activities 29
7.3.2 Step 2: Review the legal framework and / or policy context for a biodiversity offset 29
7.3.3 Step 3: Initiate a stakeholder participation process 29
7.3.4 Step 4: Determine the need for an offset based on residual adverse effects 29
7.3.5 Step 5: Choose methods to calculate loss / gain and quantify residual losses 35
7.3.6 Step 6: Review potential offset locations and activities and assess the biodiversity gains which could be achieved at each 46
7.3.7 Step 7: Calculate offset gains and select appropriate offset locations and activities 51
7.3.8 Step 8: Record the offset design and enter the offset implementation process 51
8. Implementation Plan and Long-term Management 53
9. Summary of Offset Process Costs 54

Contents 4
BBOP Pilot Project Case Study – Ambatovy Project
10. Project Outcomes 56
11. Lessons Learned 58
11.1 Limitations 58
11.1.1 Available data 58
11.1.2 Averaging 59
11.2 Recommendations 59
12. Next Steps 60
13. References 62
Tables
Table 1: Summary of the Ambatovy pilot Project 9
Table 2: Ambatovy Project offset programme 18
Table 3: Summary of attribute weighting (December 2008) 41
Table 4: Azonal habitat (December 2008) 43
Table 5: Transitional habitat (December 2008) 43
Table 6: Zonal habitat (December 2008) 43
Table 7: Pipeline zonal habitat (December 2008) 43
Table 8: Biodiversity loss calculations scenarios at impact site and effect of post-impact remediation 45
Table 9: Summary of estimated costs 54
Table A5.1: Fauna and flora species vulnerability matrix (April 2008) 92
Table A5.2: Key Biodiversity Components Matrix (KBCM) vulnerability scores (April 2008) 92
Graphs
Graph 1: Post-impact mitigation influence on biodiversity loss for forest habitats at impact site 45
Photographs
Photograph 1: Ankerana aerial view 48
Photograph 2: Ankerana azonal habitat 48

Contents 5
BBOP Pilot Project Case Study – Ambatovy Project
Figures
Figure 1: Project location map 13
Figure 2: Project components map 16
Figure 3: Mine area, showing conservation zones (green) that constitute on-site offset area (including azonal, transitional and zonal forests) 32
Figure 4: Mine area habitat map 37
Figure 5: Mine footprint and environmental buffer map 37
Figure 6: BBOP benchmark site map 40
Figure 7: Forest habitat percentage hectares loss for the mine component (the pipeline affects only a small portion of the zonal habitat) 44
Figure 8: Ankerana offsite offset area location and other candidate sites surveyed by the project, in relation to the Ambatovy mine area 47
Figure 9: Correlation between EVC (azonal, transitional and zonal), substrate and topography 48
Figure 10: Ankerana map 50
Figure 11: Mine area and Analamay-Mantadia forest corridor, allowing link between on-site offset and forest corridor 50
Figure 12: Actions and timings (2004 – onwards) 53
Appendices
Appendix 1: Key Biodiversity Components Matrix (KBCM) and Habitat Hectares Score, December 2008 Iteration 64
Appendix 2: Key Biodiversity Components Matrix (KBCM) and Habitat Hectares Score, February 2008 Iteration 78
Appendix 3: Key Biodiversity Components Matrix (KBCM) and Habitat Hectares Score, April 2008 Iteration 80
Appendix 4: Mine Footprint Status Sheet, 2nd Iteration 87
Appendix 5: Vulnerability Index 91
Appendix 6: Survey for Off-site Azonal Outcrops (in French) 94
Appendix 7: Comparison of Ambatovy / Analamay and Ankerana Azonal Habitats 115

6
BBOP Pilot Project Case Study – Ambatovy Project
1. Executive Summary
The Ambatovy Project is a large-tonnage nickel project in Madagascar with an annual design capacity of
60,000 tonnes of nickel and 5,600 tonnes of cobalt. The Project is comprised of two companies Ambatovy
Minerals SA and Dynatec Madagascar SA each owned in the same proportion by Sherritt Incorporated,
Sumitomo Incorporated, Kores and SNC Lavalin. The Project was permitted in December 2006. Construction
began in early 2007 and production is due to begin by the end of 2010, reaching full capacity by 2013. The
Project’s expected LIFECYCLE is 27 years, although operation beyond this is likely.
The Ambatovy Project has six components: the mine, the slurry pipeline, the processing plant (including
refinery), the tailings management facility, the harbour extension and the resettlement site. The Project covers
a large territory extending over two of Madagascar’s twenty-two regions. The mine is located at an elevation
of approximately 1,000 m above sea level, on Madagascar’s eastern escarpment, near the town of
Moramanga. The industrial complex (plant, tailings management facility and harbour) is located 130 km to the
northeast of the mine site, in the seaport city of Toamasina. A 218 km slurry pipeline carrying a water laterite
slurry, which contains the ore, links the mine and plant. The proposed off-site offset of Ankerana, which
constitutes the key component of the multifaceted offset programme, is situated in a very remote area
between the mine site and Toamasina.
The Ambatovy Project’s vision states that it will operate a sustainable nickel / cobalt mining and processing
enterprise that delivers outstanding environmental and social records. The Project developed an
environmental strategy aiming at honouring the Project’s vision, by producing positive CONSERVATION OUTCOMES on biodiversity through an offset programme. The offset programme aims at achieving NO NET LOSSon biodiversity, and preferably NET GAIN. The business benefit is essentially linked to risk management and
aims to sustain ‘a good citizen project’ status in a host country recognised to constitute a BIODIVERSITY HOTSPOT but suffering from chronic poverty.
The Ambatovy offsets programme is multifaceted with many components. The programme has been adopted
voluntarily to go above and beyond the Project’s impacts management strategy. The Programme includes:
1. The Ankerana offset: the off-site offset area covers 11,600 hectares (ha) of endangered forest, with
similar ABIOTIC and BIOTIC conditions to those found at the mine site; the Project aims to ensure its long
term protection through legal arrangements, financing and community consensus.
2. Two azonal forest sites: two on-site (mine) azonal forest conservation areas occur partially over the
ore body footprint; the Project aims to ensure their long term protection through legal and managerial
commitments.
3. The mine area conservation forest: the conservation forest area around the mine footprint is 4,900
ha; the Project aims to ensure its long term conservation as part of the priority species management
programme and maintenance of the ecological services for the local communities.
4. The Analamay-Mantadia forest corridor: the Project is spearheading the establishment of a forest
corridor between the mine area forests and the nearby Ankeniheny-Zahamena Corridor; the forest
corridor aims at long term landscape level CONNECTIVITY for the protection of mine area biodiversity
through partnerships with government, NGOs and local communities.

Executive Summary 7
BBOP Pilot Project Case Study – Ambatovy Project
5. The Torotorofotsy Ramsar wetland ecosystem: the Project is supporting the site management plan
design and implementation in conjunction with government and local NGOs; these efforts aim to ensure
the permanency of legal and managerial commitments in partnership with government and a local NGO.
6. The pipeline right of way reforestation programme: the programme aims at enhancing FOREST CONNECTIVITY in targeted areas of the Ankeniheny-Zahamena Corridor through expanded reforestation
activities along the slurry pipeline right of way by conducting targeted reforestation in partnership with
government and local NGOs.
7. The mine footprint replacement forest: the Project aims to create a replacement, multifunctional
forest on the footprint during progressive reclamation with an established, integrated managerial
structure by mine closure.
The Ambatovy offset programme design approach was tailored according to the guidelines provided by the
BBOP Secretariat and Advisory Committee. It includes the following steps:
Step 1. Reviewing the offset project scope and activities: the offset project was outlined in the
ENVIRONMENTAL AND SOCIAL IMPACT ASSESSMENT (ESIA), to go above and beyond the expected
regulatory requirements, and was presented during stakeholder consultation; the Project became a
pilot project in 2006 before obtaining its operating permit.
Step 2. Reviewing the legal policy context for its biodiversity offset programme: key elements
comprise the MECIE decree (Mise en Compatibilité des Investissements avec l'Environnement, Decree N° 2004-167 modified), the Madagascar Action Plan (MAP) 2007 – 2012, the regional and
communal development plans and the EQUATOR PRINCIPLES.
Step 3. Initiating stakeholder participation: PARTICIPATION has been pursued since the ESIA stage,
engaging the Project’s shareholders, government, financiers, NGOs and local communities in the
design of the offset programme and integrating their feedback.
Step 4. Determining the need for an offset based on residual adverse effects: the Project’s principal
impacts on natural systems and biodiversity were assessed by the project ESIA. DIRECT IMPACTSwere predicted to occur at the mine area through the phased clearing of the 1,336 ha mine footprint
within an ecologically sensitive semi-pristine forest mosaic. The KEY BIODIVERSITY COMPONENTS in
the mine area and upper slurry pipeline portion include significant numbers of fauna (16 lemurs, 62
birds, 123 herpetofauna), fish and 376 flora species, three structurally distinct HABITAT TYPES and a
landscape-level habitat assemblage with functional interactions between its forest habitats. A very
substantial MITIGATION programme was implemented through the Ambatovy Project’s Biodiversity
Management Plan (BMP). The Project’s most significant RESIDUAL IMPACTS occur at the mine site,
including both direct impacts through the clearing of the 1,336 ha footprint (and associated
biodiversity) and indirect residual impacts from edge effects on the environmental buffer (790 ha).
Other key Project components are located in areas that are already heavily and historically
degraded and thus have negligible negative impacts on biodiversity.
Step 5. Methods to calculate LOSSES / GAINS and quantify residual losses: the Project used the BENCHMARKand HABITAT HECTARES methodology to determine the scale of the offset needed to achieve the
CONSERVATION GAINS that will achieve no net loss of biodiversity. The Project will generate a total loss
of 1,168 habitat hectares that any offset will be required to compensate; this result will be refined with
complementary fauna quantitative data acquired in early 2009. Socioeconomic losses and
compensations from the offset programme will be determined during 2009.

Executive Summary 8
BBOP Pilot Project Case Study – Ambatovy Project
Step 6. Reviewing potential offset locations and activities to assess biodiversity gains which could
be achieved: preliminary surveys of offset candidate sites were undertaken in 2005 with the
objective of identifying potential IN-KIND type offsets. The Ankerana forest site has many similarities
with the Ambatovy mine site forests, supporting the hypothesis that Ankerana can be considered ‘in-
kind’ relative to the Ambatovy azonal habitats.
Step 7. Calculating offset gains and select appropriate offset locations and activities: additional work
to verify Ankerana’s similarities is required and planned for 2009, including detailed quantification of
potential offset gains. Gains from other offset programme components will also be calculated and
integrated.
Step 8. Recording the offset design and entering the offset implementation process: the Ankerana
offset design and other components of the offset programme have not yet been finalised, thus the
implementation process has not formally begun. The Project will finalise the offset programme
design, using BBOP guidance, during the course of 2009.
The team plans to complete the design of the offset programme implementation plan by the end of 2009, with
the Ankerana and other offset sites’ gain calculated in 2010, and thus the final offset design completed at that
point. The Project will have the responsibility of ensuring the management of the Ankerana site, while actual
site protection and local management will likely be entrusted to an NGO. For Ankerana, the annual
operational costs are in the process of being established and are estimated to be in the range US$ 250,000 –
300,000 per annum. Since the offset programme is still in the design phase, the actual conservation outcomes
to date are limited. They represent what the Project has achieved thus far and the benefits the Project has
already enjoyed and include securing the temporary protection of Ankerana until the Ministerial decree for its
protection is finalised; integrating Ankerana into the national protected areas network; coordination between
government organisations, NGOs, local communities and the private sector; local community awareness and
reforestation activities. At the mine site, forest and TAXA-specific conservation management plans were
developed for flora and fauna, (e.g., lemurs, Mantella frog species and fish). Although these programmes
were developed as part of the Biodiversity Management Plan, their importance is reinforced by their aim of
ensuring the conservation of azonal habitat and associated species, thus ensuring that all key biodiversity
components present on the IMPACT SITE are present at the offset.
A summary of the Ambatovy Project pilot project BBOP programme is presented in Table 1.

Executive Summary 9
BBOP Pilot Project Case Study – Ambatovy Project
Table 1: Summary of the Ambatovy pilot Project
Company name Ambatovy Minerals SA & Dynatec Madagascar SA (AMSA / DMSA)
Project name Ambatovy Project – Madagascar
Sector & project description
Ambatovy is a large-tonnage nickel Project with an annual design capacity of 60,000 tonnes of nickel, 5,600 tonnes of cobalt and 190,000 tonnes of ammonium sulphate. Production is scheduled to begin in 2010, with full capacity expected to be achieved by 2013. The Project’s assessed reserve life is 27 years, with potential for extension beyond this. The main impacts to biodiversity are located at the mine footprint with the clearing of near-primary forest. The Project has designed and implemented a Biodiversity Management Programme to mitigate and monitor the residual impacts associated to development, whilst pursuing its impact AVOIDANCE and reduction approach. The mitigation measures cover flora, fauna and aquatics.
Country Republic of Madagascar (Alaotra Mangoro and Atsinanana regions, eastern Madagascar).
Shareholders Sherritt International Corporation, Sumitomo Corporation, Kores, and SNC Lavalin Incorporated.
Principal biodiversity components affected by Project
The key biodiversity components, mostly confined to the mine area and upper slurry pipeline portion, can be summarised as follows:
Priority species:
– 16 lemurs species, including Prolemur simus (IUCN CR), Propithecus d. diadema (IUCN EN), Indri indri (IUCN EN), Eulemur rubriventer (IUCN VU), Daubentonia madagascarensis(IUCN NT), Hapalemur griseus (VU), Allocebus trichotis (IUCN DD);
– 62 birds species, including Tyto soumagnei, Anas melleri and Ardea humbloti, Sarothurawatersi (IUCN EN);
– 123 herpetofauna species, including Mantella aurantiaca (IUCN CR), M. crocea (IUCN EN) and Sanzinia madagascariensis (IUCN VU);
– 5 fish species of which Rheoles alaotrensis (IUCN VU) and at least two new Ratsirakiaspecies;
– 24 insect species, which are considered rare at a national level;
– 376 plants including Asteropeia mcphersonii (IUCN VU), Leptolaena multiflora (IUCN EN), Dalbergia baroni (IUCN VU) and 330 species of concern, which are considered rare in Madagascar;
Three structurally distinct habitat types: zonal, transitional and azonal forests (the latter including seasonal ponds and upper watershed stream systems) and their fauna and flora communities; and
The landscape-level habitat assemblage with the functional interaction between the zonal, transitional and azonal forests.
Scale of impact The main anticipated residual impacts on biodiversity caused by the Project will occur at the mine site and in the upper portion of the slurry pipeline through the progressive clearing of the mine footprint (approximately 1,336 ha), located within an ecologically sensitive natural forest mosaic of the eastern mid-altitudinal forest corridor. Stringent impact avoidance and minimisation strategies were applied in the design phase of the Project. Residual impacts on biodiversity at the other Project components are insignificant due to human-induced degradation in these areas but will nonetheless be offset. These include pipelines, the processing plant, the tailings area and a pier extension project.
The 218 km of buried slurry pipelines will involve the clearing of a mix of native and non-native secondary vegetation resulting from historical slash and burn with comparatively little biodiversity value. However, two sections of the pipeline cross sensitive habitats: the first 2 km of zonal, near-primary forest accounted for in the mine footprint and the crossing of the Ankeniheny-Zahamena Corridor at Vohimana, where the pipeline has been routed to avoid residual primary forest fragments.

Executive Summary 10
BBOP Pilot Project Case Study – Ambatovy Project
The processing plant occupies 2.6 km2 of the Toamasina industrial zone. The associated tailings system of 14 km2 will be located in a highly degraded agricultural matrix. An existing pier at the harbour will be extended by over 300 m to accommodate the Project’s logistical needs. The processing plant, tailings and pier extension have been assessed in the Environmental and Social Impact Assessment (ESIA) to have negligible residual impacts on biodiversity.
As the Project is developing the ESIA is being revisited to ensure that no residual impact to biodiversity is being neglected. Any further residual impacts identified will be accounted for in the biodiversity offset calculation.
Description of offset
The Ambatovy offsets programme is multifaceted with many components. The Ambatovy Project is committed to achieve positive conservation outcomes through designing and implementing its multifaceted programme, that includes:
1. Ankerana offset: establishing an 11,600 ha endangered forest off-site offset, with similar abiotic and biotic conditions to those found at the mine site and ensuring long term protection through legal arrangements and community consensus.
2. Azonal forest sites: establishing two on-site (mine) azonal forest habitats conservation areas that occur partially over the mine footprint and ensuring long term protection through legal andmanagerial commitments.
3. Mine area conservation forest: establishing a 4,900 ha conservation forest area around the footprint and ensuring long term conservation as part of the priority species management programme and maintenance of the ecological services for the local communities.
4. Analamay-Mantadia forest corridor: spearheading the establishment of a forest corridor between the mine area forests and the nearby Ankeniheny-Zahamena Corridor and securing long term landscape level connectivity for the protection of mine area biodiversity through partnerships with government, NGOs and local communities.
5. Torotorofotsy Ramsar: supporting the site management plan design and implementation in conjunction with government and local NGOs and ensuring permanency of legal and managerial commitments with its partnerships.
6. Pipeline right of way reforestation: enhancing forest connectivity in targeted areas of the Ankeniheny-Zahamena Corridor through expanded reforestation activities along the slurry pipeline right of way and conducting targeted reforestation in partnership with government and local NGOs.
7. Mine footprint replacement forest: creating a replacement, multifunctional forest on the footprint during progressive reclamation with an established, integrated managerial structure by mine closure.
While the design and implementation of the several components of the Ambatovy offset programme has progressed, the predicted conservation outcomes from these various offset components have not yet been fully calculated. Meanwhile, Ambatovy has focused on its proposed Ankerana offset as the most significant component of its offset. However, the high degree of social sensitivity around Ankerana has led the project to undertake community involvement before the planned biodiversity assessment at the site. The impact of the first pipeline section will be included in the offset calculation for the mine site. The second section of pipeline will be offset by reforestation not only of the pipeline footprint but also of broader areas with the aim of reconnecting the forest corridor.
Links to further information
http://www.sherritt.com and http://www.sherritt.mg

11
BBOP Pilot Project Case Study – Ambatovy Project
2. Project Context
2.1 Policy context
Investment projects in Madagascar must be compatible with Malagasy environmental regulations. This
principle is embedded in the MECIE (Mise en Compatibilité des Investissements avec l'Environnement)
decree (Decree N° 2004-167 modified). The application of this decree is enforced by the environmental
regulator, ONE (Office National de l’Environnement), which has developed stringent guidelines and protocols
on how to elaborate, review, permit and monitor Environmental and Social Impact Assessments (ESIA).
Although the terms of reference for an ESIA in Madagascar typically require stringent mitigation of impacts,
biodiversity offsets are not included in the text.
The Government of Madagascar became aware of biodiversity offset mechanisms through interactions with
environmental NGOs in 2005 (WWF, Conservation International – CI, Wildlife Conservation Society – WCS).
Subsequently, the BBOP Secretariat attended a presidential audience to discuss biodiversity offsets in June
2006 during which the concept of offsets as a complementary mechanism to reduce impacts on Madagascar’s
heritage was well received by the President of Madagascar. Biodiversity offsets were subsequently referred to
in the Madagascar Action Plan (MAP) 2007 – 2012:
Commitment # 7 “Cherishing the Environment”
Challenge # 3 “Develop the Environmental Reflex at All Levels"
Priority Projects and Activities # 3 “Develop a policy for mining companies and logging companies for
biodiversity offsets and other mechanisms and incentives for environmental protection”
The ESIA for the Ambatovy Project (MINEVEF/ONE Permit # 47/06 dated December 1st, 2006) established
that the Project, and specifically the mine component, would be located in a sensitive biodiversity area and
that the mitigation of residual impacts would require both on-site and off-site compensation measures. While
on-site measures at the mine are commitments made in the ESIA, the Ambatovy offset programme goes
above and beyond compliance with legal obligations. The offset programme is believed to deliver positive
conservation outcomes under a vision of no net loss of biodiversity, and possibly net gain. This would enable
the Project to honour its stringent biodiversity policy developed and endorsed by its shareholders:
“… to cause no net harm to biological diversity where we operate, to mitigate unavoidable impacts, and to
practice responsible closure procedures;
… to assure the conservation of habitats, flora and fauna, using all reasonable actions and technologies;
… to ensure responsible attention to the maintenance and, where possible, enhancement of biodiversity in
the best interest of our business, the communities in which we operate, and the world at large.”
The Project’s principal financial lenders have subscribed to the Equator Principles (http://www.equator-
principles.com/index.shtml). In this context, full regulatory compliance and the implementation of a thorough
impact management strategy is expected. In addition, the lenders also require the Project’s general
compliance with the IFC Performance Standards and specifically Performance Standard 6 (Biodiversity
Conservation and Sustainable Natural Resource Management). In the context of biodiversity offsets,

Project Context 12
BBOP Pilot Project Case Study – Ambatovy Project
paragraph 8 of Standard 6 is particularly relevant and requires the design of mitigation measures to achieve
no net loss of biodiversity where feasible. These measures may include a combination of actions, such as:
Post-operation restoration of habitats
Offset of losses through the creation of ecologically comparable area(s) that is managed for biodiversity
Compensation to direct users of biodiversity
The Project is thus designed to comply with the IFC Performance Standards for major projects.
2.2 Regional context
The Ambatovy Project has six components, including the mine, the slurry pipeline, the processing plant
(including refinery), the tailings management facility, the harbour extension and resettlement sites (see Figure
1). The Project covers a large territory extending over two of Madagascar’s twenty-two regions (Alaotra-
Mangoro and Toamasina). The mine is located at an elevation of approximately 1,000 m above sea level
(m.a.s.l.), near the town of Moramanga. The industrial complex (plant, tailings management facility and
harbour) is located 130 km to the northeast of the mine site, in the seaport city of Toamasina. A slurry pipeline
carrying a water laterite slurry, which contains the ore, links the mine and plant. The proposed Ankerana
offset, constituting the key component of the multifaceted offset programme, is situated in a very remote area
between the mine site and Toamasina.
As presented in the Project ESIA, the principal biodiversity sensitivities of the Project are concentrated in the
forested mine area and within the upper portion of the slurry pipeline, while social issues are relevant for all
components. Biodiversity resources within the mine region have strong intrinsic and USE VALUES and
communities there largely depend on these biodiversity resources for their LIVELIHOODS. However, in light of
current agricultural practices and population growth, natural resource and biodiversity utilisation by local
communities is far from sustainable in the mine region; the depletion is such that this natural capital will not be
available to future generations unless fundamental changes take place. The socioeconomic impacts on the
local communities from the Project’s offset programme will need to be considered. The mitigation of these
impacts needs to be designed in the context of national, regional and communal plans that address long-term
issues of sustainable resource use in the regions in which the Project operates.

Project Context 13
BBOP Pilot Project Case Study – Ambatovy Project
Figure 1: Project location map

Project Context 14
BBOP Pilot Project Case Study – Ambatovy Project
2.3 Shareholders involved in offset design
Shareholders: the Project is jointly owned by Sherritt Incorporated, Sumitomo Incorporated, Kores and
SNC Lavalin. Each partner has played an important role in the Project’s environmental programme,
including regulatory compliance, impact mitigation, risk management and design of a comprehensive
biodiversity offset programme. The Ambatovy vision, besides the goal of generating attractive economic
results, is to contribute significantly to the host country and to deliver outstanding safety, social and
environmental performance.
Government: the general offset principle is captured in the MAP (see Policy Context section above) and
specific governmental entities have been involved in the offset design, including the Ministry of
Environment, Water, Forests and Tourism (MEWFT) and the Malagasy Forest Service, which have actively
participated in securing the proposed offset site at Ankerana via a community-led zoning process.
Lenders: the Ambatovy Project is one of the largest capital investment projects in the world and it is
financially supported by a number of lender banks, most of which have adopted the EQUATOR PRINCIPLES.
Lenders includes the African Development Bank (AFDB), Export Development Canada (EDC), Export-
Import Bank of Korea (K-EXIM), the European Investment Bank (EIB), the Japan Bank for International
Cooperation (JBIC) and various commercial banks such as Société Générale and BNP Paribas. The
consideration of Performance Standard 6 in the Project’s Biodiversity Management Plan, including the
taxa-specific plans, reflects this.
NGOs: environmental NGOs in Madagascar are aware of the offset concept and are encouraging the
Ambatovy Project to continue moving its offset programme forward in an effort to ensure NO NET LOSS on
biodiversity and, preferably, net gain. However, it is worth noting that some STAKEHOLDERS voice concerns
about the Project’s ability to deliver no net loss of biodiversity and are closely scrutinising the Project’s
offset initiative. Given this, the Project has been actively working to enhance its offset programme in
collaboration with NGOs such as CI, WCS and ERI (Eco Regional Initiative). A number of other NGOs
working with the Ambatovy Project on impact mitigation have also provided valuable input to the offset
design process (e.g., Groupe d’Etudes et de Recherche des Lémuriens, Henry Doorly Zoo and its
Madagascar Biodiversity Program, Madagasikara Voakajy, Missouri Botanical Garden, Mitsinjo, University
of Antananarivo Biology department, the South African Institute of Aquatic Biology, WWF and others).
Local communities: the Project continues to engage stakeholders, including local communities, to ensure
that any offset is compatible and integrated with regional and local land and resource management visions.

15
BBOP Pilot Project Case Study – Ambatovy Project
3. Project Summary
3.1 General project description
The Ambatovy Project is a large-tonnage nickel project with an annual design capacity of 60,000 tonnes of
nickel and 5,600 tonnes of cobalt. Additionally, the Project will produce 190,000 tonnes of fertiliser
(ammonium sulphate) as a by-product from the refinery, a product much needed in this part of the world.
The Project was permitted in December 2006 and construction began in early 2007. Production is due to
begin at the end of 2010, reaching full capacity by 2013. Based on proven nickel and cobalt ore reserves, the
Project’s expected lifecycle is 27 years, although operation beyond this is likely, as stored low-grade ore could
become an economic commodity in the future.
The locations of the main Project components are shown in Figure 2, and the key features are summarised below:
The Ambatovy mine lies within the mid-altitude forests, at the westerly limit of the residual eastern rain
forest known as the Ankeniheny-Zahamena Corridor. The near-primary forests of the mine area have
undergone considerable human-induced pressures including hunting and gathering, selective logging,
slash and burn agriculture, uncontrolled fires and species collection for trade;
The slurry pipeline, buried over the majority of its route, will pass through 2 km of near-primary forest
surrounding the mine, crosses a Ramsar site (avoiding the wetlands by following an old railroad spur) and
traverses the Ankeniheny-Zahamena forest corridor by avoiding residual forest fragments whenever
possible. It then continues to the coast through hilly terrain of the former eastern rain forest destroyed by
extensive slash and burn agriculture;
The industrial complex, including the processing plant and the refinery, the tailings and the harbour, is
located within an anthropogenic coastal landscape in a suburban setting. The plant and harbour lay within
the industrial zones of Toamasina; and
The proposed Ankerana offset site, which is equidistant between the mine and Toamasina, is a large,
mountainous dome covered with primary forest, encroached only by slash and burn agriculture in
surrounding valleys where frontier dwellings exist. The pristine character of the site is a result of its
remoteness and the low density of surrounding human populations.
The Project’s principal impacts on natural systems and biodiversity will occur at the mine area, through the
phased clearing of the mine footprint within an ecologically sensitive natural forest mosaic. The sensitivity of
this mosaic arises from the considerable local heterogeneity in terms of geology, geomorphology, substrate,
topography and meso-climate.
It is widely documented that the average annual deforestation rate calculated over the period between 2000
and 2005 was 0.35%. In total, between 1990 and 2005, Madagascar lost 6.2% of its forest cover,
approximately 854,000 ha. The current annual loss of the residual eastern rain forest is equivalent to 14,000
ha per year. The total mine footprint to be cleared (1,336 ha) represents only 0.03% of the residual eastern
rain forest, estimated in 2008 at 4,012,100 ha. In consideration of the large forest loss in eastern Madagascar,
the INTRINSIC VALUE of the offset area at Ankerana (11,600 ha) will increase over time as such forest estates
and their associated biodiversity become rarer.
Project Summary 16
BBOP Pilot Project Case Study – Ambatovy Project
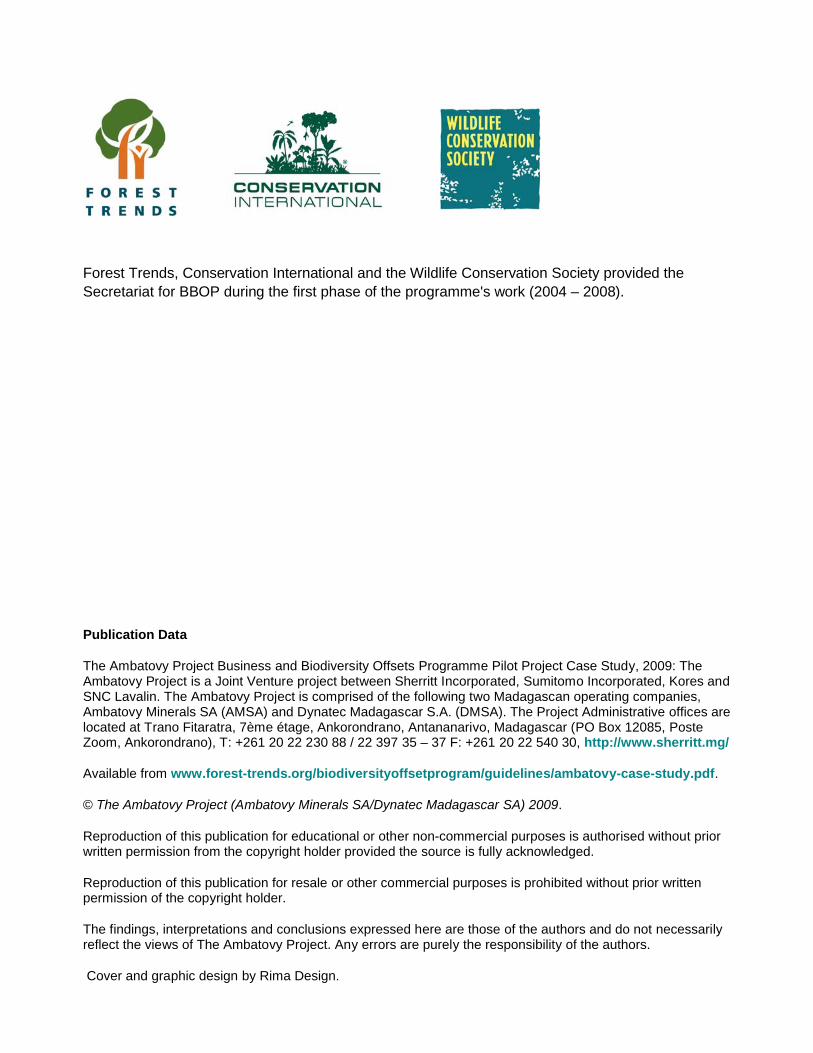
Figure 2: Project components map
While the bulk of the residual biodiversity impact will arise in the mine area and in the upper portion of the
pipeline, the Project’s offset calculation considers residual impacts from each project component including the
entire slurry pipeline, the processing plant, the tailings and the harbour extension. The intention is that all
residual impacts will be offset.
Approximately 90% of the pipeline’s 218 km right of way will require the clearance of secondary, non-sensitive
and mostly non-ligneous vegetation, which has resulted from historical slash and burn and has comparatively
little biodiversity value. Disturbed land will ultimately be rehabilitated using species appropriate to current land
use in the different pipeline sectors (including provision of fuel wood species to reduce pressure on native
forests). However, two sections of the pipeline cross sensitive habitats:
The first 2 km of zonal, near-primary forest at the mine area; these losses are integrated to the mine
footprint loss calculations; and
The Ankeniheny-Zahamena forest corridor area, which led to 16.5 ha of zonal forest being cleared, despite
planning and routing efforts to avoid the residual primary forest fragments present there.
The processing plant, currently under construction, covers 2.6 km2 of Toamasina’s industrial zone. The
tailings management facility has a footprint of 14 km2 and is located in a highly degraded, fire-driven
agricultural matrix, where irreversible, human-induced depletion of the original biodiversity occurred during
historical forest clearance. The harbour expansion requires the construction of an extended pier (over 300 m)
to accommodate the unloading of equipment during the construction and the importation of raw material (coal,
sulphur, limestone and diesel) and the loading of nickel and cobalt briquette bags and ammonium sulphate
during operation. At the Project’s industrial complex (plant, tailings management facility and harbour), most of
the biodiversity values were lost many years ago through extensive habitat conversion. The Project’s ESIA

Project Summary 17
BBOP Pilot Project Case Study – Ambatovy Project
notes that the industrial complex will have negligible residual impacts on biodiversity, which will nonetheless
be traded up through the Project’s offset programme.
Specific aspects of the biological environment assessed in the ESIA are being revisited through expanded
BASELINE STUDIES to ensure that residual impacts are fully documented and included in the biodiversity offset
calculation.
The KEY BIODIVERSITY COMPONENTS in the mine area and upper slurry pipeline portion can be summarised as:
Priority species, with home ranges overlapping (and or potentially overlapping) the mine footprint:
– 16 lemurs species, including Prolemur simus (IUCN CR), Propithecus d. diadema (IUCN EN), Indri indri
(IUCN EN), Eulemur rubriventer (IUCN VU), Daubentonia madagascarensis (IUCN NT), Hapalemur
griseus (VU), Allocebus trichotis (IUCN DD);
– 62 birds species, including Tyto soumagnei, Anas melleri and Ardea humbloti, Sarothura watersi (all
IUCN EN);
– 123 herpetofauna species, including Mantella aurantiaca (IUCN CR), M. crocea (IUCN EN), Sanzinia
madagascariensis (IUCN VU);
– 5 fish species of which Rheoles alaotrensis (IUCN VU) and at least two new Ratsirakia species;
– 24 insects species, which are considered rare at a national level;
– 376 plants including Asteropeia mcphersonii (IUCN VU), Leptolaena multiflora (IUCN EN), Dalbergia
baroni (UCN VU) and the 330 species of concern which are considered rare in Madagascar;
Three structurally distinct HABITAT TYPES: zonal, transitional and azonal forests (the latter including
seasonal ponds and upper watershed stream systems) and their fauna and flora communities; and
The landscape-level habitat assemblage with the functional interaction between the zonal, transitional and
azonal forests.
Section 7.3 presents more detail in the form of a Key Biodiversity Components Matrix (KBCM) and the steps
followed in its completion. The full KBCM (December 2008 iteration) is provided in Appendix 1. Earlier
iterations (February and April 2008) are presented in Appendices 2 and 3 respectively.
3.2 Ambatovy offset programme
The Ambatovy Project offset programme is a multifaceted endeavour to achieve measurable CONSERVATION OUTCOMES resulting in no net loss and preferably a NET GAIN of biodiversity. It has been adopted voluntarily to
go above and beyond the Project’s impacts management strategy. The Ambatovy Project intends to
implement its diversified offset portfolio, as presented in Table 2.

Project Summary 18
BBOP Pilot Project Case Study – Ambatovy Project
Table 2: Ambatovy Project offset programme
#Offset component
Design Implementation
1 Ankerana Establishing a large off-site offset site at Ankerana, encompassing similar ABIOTICand BIOTIC conditions to those found at the mine site. The site is located 71 km to the northeast of the mine site and would involve conservation of 11,600 ha of endangered forest, including a multiple use area of 7,000 ha and a core conservation area of 4,600 ha, within which there is a large tract of azonal forest.
Ensure long term protection of the Ankerana offset site through the stringent legal arrangements and strong community consensus. Community motivation and consent is the highest priority of the Ambatovy Project offset implementation in its early phase and needs to be obtained before the BIODIVERSITY INVENTORIES are conducted (perceived as external intrusions by the local communities if ill prepared). Adhere to BBOP principles and guidelines for offset processes. Monitoring of efficacy of BBOP tools used and offset programme evaluation in 2011 and option analysis.
2 Azonal forest sites
Protecting, for the long term, two on-site conservation sites of the azonal forest habitats that occur partially over the mine footprint that would otherwise be lost to deforestation.
Ensure permanency of on-site conservation azonal sites through legal and managerial commitments. Ensure permanency of surrounding mine area forests (see offset component #3) with same measures as mentioned above. Ensure connectivity of mine area forests with surrounding protected areas (see offset component #4).
3 Mine area conservation forest
Ensuring long term conservation of the forest surrounding the mine footprint as part of the priority species management programme and maintenance of the ecological services for the local communities. The area consists of the establishment of 4,900 ha of buffer forest around the footprint.
Conduct multifunctional zoning based on existing models in Madagascar and ensure management of leased lands and in areas of targeted community transfer. It is believed that site that would otherwise be lost given regional deforestation rates.
4 Analamay-Mantadia forest corridor
Promoting the landscape level connectivity of the mine area forests with the nearby Ankeniheny-Zahamena Corridor to secure long term protection of mine area biodiversity as part of the Durban Vision implementation.
Enter into formal partnerships with government, NGOs and local communities to design and develop implementation plans for the Analamay-Mantadia Corridor, that take present and future community needs into account.
5 Torotorofotsy Ramsar
Supporting the Torotorofotsy Ramsar site management plan design and implementation in conjunction with government and local NGO.
In partnership with government and local NGO, ensure permanency of legal and managerial commitments. In a first phase, complete zoning and management plan for Ramsar site. Development of pragmatic viable resources uses to maintain ecological functions of wetland area while community needs are met.
6 Pipeline right of way reforestation
Enhancing FOREST CONNECTIVITY in targeted areas of the Ankeniheny-Zahamena Corridor through expanded reforestation activities along the slurry pipeline right of way.
In partnership with government and local NGOs conduct targeted reforestation of the Ankeniheny-Zahamena Corridor (CAZ) with the aim of re-establishing forest connectivity.
7 Mine footprint replacement forest
Creating a replacement, multifunctional forest on the entire footprint during progressive reclamation with an established, integrated managerial structure by mine closure.
Design and implement management plans for engineering, water management, erosion control, early vegetation establishment, targeted species reforestation, induced and facilitated secondary successions and sylviculture treatments.

19
BBOP Pilot Project Case Study – Ambatovy Project
4. How the Ambatovy Project is Applying the BBOP Principles
During the ESIA in 2004 and 2005, the Ambatovy Project initiated its offset programme based on an improved
understanding of RESIDUAL IMPACTS and the need for developing compensatory conservation activities. In
2006, Ambatovy became a BBOP PILOT PROJECT and refined its initial offset vision and the design approach
was tailored according to the guidelines provided by the BBOP Secretariat and Advisory Committee.
The BBOP PRINCIPLES ON BIODIVERSITY OFFSETS were finalised in December 20083, following several years of
groundwork including the development of draft guidance and tools. The Project’s offset initiative was
developed alongside, and is generally well-aligned with, the BBOP Principles. The Project’s alignment with the
BBOP Principles is illustrated in more detail in Section 7. The Project applies the BBOP Principles as follows:
1. No net loss:
The Project’s aim is to achieve measurable conservation outcomes that deliver NO NET LOSS of biodiversity
and a possible net gain through a mix of complementary offset and mitigation activities, including:
An offset site at Ankerana that contains a core conservation area designed to compensate for the Project’s
residual impacts on azonal forest biodiversity.
Protection of viable tracts of azonal forest habitats through the set-aside of two specific on-site azonal
forest habitat conservation zones within the forests surrounding the mine footprint (see next point).
Implementation of a ‘no species EXTINCTION’ commitment and protection of forests surrounding the mine
footprint to ensure the long-term viability of priority species populations impacted by the Project. This
approach would include the on-site azonal forest habitat conservation zones and mechanisms to control
current human pressure on these areas.
Design and implementation of protection measures for an existing residual forest corridor linking forests
surrounding the mine area and the Mantadia National Park to ensure landscape-level forest connectivity.
Targeted reforestation of the Ankeniheny-Zahamena Corridor, in partnership with government and local
NGOs, to re-establish forest connectivity between Mantadia National Park and the Man and the Biosphere
Private Reserve.
Development of the Ramsar Torotorofotsy Management Plan in partnership with government and local
NGOs, and contribution to its subsequent implementation.
Progressive rehabilitation at the mine site to produce a multifunctional replacement forest with reinstated
biodiversity values to be included in the offset calculation.
To date, the Project’s offset planners have used BBOP guidance and methodologies to assess the impact on
biodiversity and to identify potential sites for biodiversity offsets. BBOP methodologies will also be followed to
3 The full text of the BBOP Principles is available in the BBOP document “Business, Biodiversity Offsets and BBOP: An Overview” –see www.forest-trends.org/biodiversityoffsetprogram/guidelines/overview.pdf.

How the Ambatovy Project is Applying the BBOP Principles 20
BBOP Pilot Project Case Study – Ambatovy Project
determine the scale of the offset required to deliver no net loss, to verify that no net loss has been achieved
and to define implementation measures that will ensure the long-term sustainability of the offset.
2. Additional conservation outcomes:
The Project is designing and implementing conservation activities that are predicted to deliver ADDITIONALITY,
as summarised below for each of the Project’s components:
The proposed Ankerana offset site is currently being integrated within the recently established SAPM
(National Protected Areas System) under the Durban Vision. However, there is a significant shortfall in the
financial and human resources to offer protection to all these areas and the Durban Vision can only be
implemented if an array of different partners commits to developing the required financial and human
resources. Through the proposed offset, the Project will play a role in that development process.
Historically the azonal forest habitats of Ambatovy and Analamay have suffered significant anthropogenic
impacts (e.g., from hunting and gathering, destructive honey collection, fire, charcoal, slash and burn, and
the pet trade). The long-term survival of this habitat in the absence of the Project is far from proven. This is
clearly seen in the baseline data for the mine area: of the total area of 1,347 ha of azonal forest habitat in
the mine area, only 60% is of prime quality, the rest being significantly degraded before the project was
established. While the mine development is predicted to impact 590 ha of prime quality azonal forest
habitat, 212 ha (26.4% of the total prime quality habitat) will be preserved through the Project’s on-site
azonal habitat conservation initiative. The likelihood of successful conservation of a viable portion of the
unique azonal forest habitat at Ambatovy is therefore significantly increased by the presence of the Project.
Similarly, the zonal forests surrounding the mine footprint have experienced historic anthropogenic impacts
such as forest structure modification (logging), species composition modification though canopy openings
(invaders, heliophytes), FOREST FRAGMENTATION through clear cutting, and plain, irreversible loss of forest
areas. The Project has committed to preserving the residual forests of the mine area by, for example,
implementing forest community transfer4 to avoid further anthropogenic losses. Such additionality, if clearly
established, will be included in the offset calculations once data and a model for the rate of regional
deforestation are available.
In the long-term, the forests of the mine area and Mantadia National Park are likely to become isolated
unless the existing forest corridor that links these areas is managed and protected. The loss of this corridor
would cause landscape-level forest fragmentation and jeopardise the long-term viability of populations of
critical species that the project has committed to protect at the mine area. As of December 2008, the forest
corridor has not been included in the first zoning approximation of the Durban Vision. The Project and its
partners plan to create a westerly extension of the Durban Vision zoning to incorporate this area in the
protection zone of the Ankeniheny-Zahamena Corridor. Forest loss avoidance via the successful
management and protection of the corridor will be taken into account in offset calculations based on a fair
assessment of the resulting additionality.
The Ramsar Torotorofotsy site is experiencing considerable pressure from inward migration, the drainage
of wetlands and subsequent conversion to rice paddies, wildfires, slash and burn activities in the forested
watersheds, hunting and the pet trade. The National Committee on Ramsar (CONARAMS) has given a
local NGO (Mitsinjo) the mandate to design and implement a management plan. Ambatovy has joined this
effort as a partner and will work with Mitsinjo and others to enhance the management plan. The first step
4 The targeted forest areas are jointly managed with local communities, using a defined management programme that meets conservation and sustainable use requirements.

How the Ambatovy Project is Applying the BBOP Principles 21
BBOP Pilot Project Case Study – Ambatovy Project
will be to establish a functional zoning that results in the avoidance of BIODIVERSITY LOSS, which will be
taken into account in offset calculations, again based on a fair assessment of the resulting additionality.
Reforestation activities to reconnect residual patches of primary forests at the perimeter of the slurry
pipeline right of way within the Ankeniheny-Zahamena Corridor will contribute to an overall corridor
defragmentation. The areas to be reforested sit outside of the SAPM and will be accounted for in the offset
GAIN calculation as clearly additional outcomes.
3. Adherence to the mitigation hierarchy:
Given the Project’s setting (high regional biodiversity and endemicity), rigorous biodiversity management is
necessary to meet its policy of ‘no net harm to biodiversity’. Before considering biodiversity offsets, the
Ambatovy Project implemented appropriate avoidance and minimisation measures according to the
MITIGATION HIERARCHY, for example:
AVOIDANCE: analysis of pipeline route alternatives, including the study of 21 major re-routes to avoid
ecologically, socially and culturally sensitive areas; avoidance of other sensitive areas during the
development of other Project components whenever possible. Also, set-aside of an area of the ore body
that would otherwise be mined as the foundation of the on-site azonal habitat conservation initiative.
Minimisation: reduction of the surface area subject to impacts through appropriate design and
implementation.
– Early (2004 / 05) impact mitigation through the rehabilitation of 50 km of exploration roads and
platforms in the mine area.
– Mitigation of impacts following forest clearance through biodiversity rescue and management programs
(lemurs, small mammals, herpetofauna and fish).
– Management of surges in total suspended solids to protect water quality and aquatic biodiversity in
seven affected watersheds downstream of the mine site using large retention dams (at a cost of US$ 40
million).
Restoration / rehabilitation: planned progressive rehabilitation of the mine site footprint to create a
replacement forest with reinstated biodiversity values and reduce the net residual impact.
4. Limits to what can be offset:
The Ambatovy Project currently believes that all its direct residual impacts on biodiversity are OFFSETABLE. No
habitat or species (flora and fauna) ENDEMIC to the mine footprint alone have been identified during the
thorough investigations to date. Nevertheless, given the high levels of biodiversity and endemicity around the
Project, field studies will continue as the mine is developed and forest clearance progresses.
In contrast, the Project believes that there are limits to offsetting certain social impacts. For local communities,
there were few legal and cultural constraints on the exploitation of natural resources and biodiversity prior to
the arrival of the mine. In light of forest clearance during development of the mine and the Project’s
commitment to conserve the surrounding forests by introducing a zoned approach to forest use, the local
communities’ existing way of life, including unsustainable use of biodiversity, will undoubtedly be disrupted.
The Ambatovy Project believes that this disruption cannot be entirely offset and also that, in light of dwindling
forest resources and population growth, it is desirable from a BIODIVERSITY CONSERVATION perspective to seek
to break the cycle of unsustainable use by local communities and replace it with a more sustainable model.

How the Ambatovy Project is Applying the BBOP Principles 22
BBOP Pilot Project Case Study – Ambatovy Project
The present unfettered community exploitation of resources may reflect a lack of community empowerment
and choice. Hence, the changes envisioned by the Project (sustainable, participatory forest use) may
ultimately be viewed by local communities as a positive transformation relative to the current situation.
The same concept applies to the Ankerana offset site where the Project believes that the pre-project
socioeconomic conditions should not be, and ultimately cannot be, maintained. While this change can also not
be offset, the Project believes the change to sustainable use of natural resources will ultimately be to the
benefit of both local communities and biodiversity.
5. Landscape context:
The spatial spread of the Project has driven the integration of planned conservation activities with regional
and landscape-level environmental and social initiatives. At the mine, the landscape approach currently
consists of maintaining forest connectivity between the on-site azonal habitat conservation zones (and
rehabilitated areas as these progress) and the surrounding forests. Moreover, forest connectivity between the
mine area and the Ankeniheny-Zahamena Corridor will be maintained through landscape-level designs and
interventions in line with the Durban Vision to increase the surface areas of protected areas in Madagascar;
the development of this programme is at an early stage and aims to be conducted in collaboration with
Conservation International. At Ankerana, the offset design is based on a phased and spatially concentric,
landscape-level approach. Long-term community needs have been identified and participative zoning has
been completed.
6. Stakeholder participation:
The Project is committed to stakeholder PARTICIPATION and has made significant progress with local
communities and NGOs. Examples include interaction during the integration of the Ambatovy Project offset
programme with national, regional and local plans and community involvement at the heart of the zoning
project at the proposed Ankera offset site. In the latter example, a functional, participatory forest zoning
process is being implemented by the community with assistance from the Forest Services and the help of
local NGOs. This will result in areas identified for multiple-use at the periphery of the offset site being
transferred to the community as stipulated by Malagasy law and promoted in the regional plan.
7. Equity:
While the Ambatovy Project is committed to BBOP Principles 6 and 7, insufficient data are currently available
to apply the latter strictly. As data become available, the Project will develop its cost-benefit model and
analysis using key elements of the BBOP BIODIVERSITY OFFSET COST-BENEFIT HANDBOOK5 and in consultation
with stakeholders. The Project is currently in the process of establishing a strategy to implement the socio-
environmental action programme, including assessing natural resources usages by the local communities at
the Ankerana and mine sites, further to which dollar value of the losses will be determined and compensation
options identified and provided.
8. Long-term outcomes:
The Ambatovy offset programme for the mine region, comprising on-site azonal habitat conservation,
community-based forest management, forest connectivity of mine area, Ramsar wetland management, forest
5 Available at www.forest-trends.org/biodiversityoffsetprogram/guidelines/cbh.pdf.

How the Ambatovy Project is Applying the BBOP Principles 23
BBOP Pilot Project Case Study – Ambatovy Project
corridor rehabilitation and the proposed Ankerana offset, is being designed for long-term success following its
implementation. Four activities will support the long-term outcomes:
Strong community involvement throughout the planning, designing and implementation phases with the
development of complementary sustainable activities in the surrounding agricultural matrix and in the
multiple use area of the forests surrounding the critical habitats (core areas). Appropriate joint activities are
being identified as the result of ongoing stakeholder interaction and data gathering.
Development of financial strategies, mechanisms, and commitments as the operational phase of the
Project begins (2011), based on the analysis of stakeholder needs and the Project’s predicted economic
operating environment. In light of the ongoing financial crisis and the resulting economic uncertainties,
ADAPTIVE MANAGEMENT strategies will play a key role in securing long-term financing for the Ambatovy
offset programme.
Identification of long-term governmental legal and political commitment to protect the conservation sites in
the mine region and the proposed offset site at Ankerana. A high level of commitment is expected as
elements of the mine area and the proposed offset site have been designed to fall under the future
Malagasy protected area system (SAPM), which itself is a part of the Presidential Durban commitment and
which is expected to attract significant outside funding as a result of a global concern for biodiversity.
Determining the institutional arrangements for managing the offset sites into the long-term. It has not yet
been decided how the Ankerana site will be managed, with all options remaining open, i.e., managed by
governmental institutions, by an NGO, by the community, by the company or a combination of any of the
foregoing. The on-site conservation zones forests will be managed by the Project, the FOREST CONNECTIVITY programme will likely be community-based, while the Ramsar site has a defined
management structure.
9. Transparency:
The Ambatovy Project’s intention to offset its residual impacts on biodiversity is a commitment developed in
the ESIA, which has undergone thorough public consultation, hearings and a public information process.
Consequently, the Project’s strategic environmental and social commitments are in the public domain and its
offset activities have been, and are being, scrutinised by the Malagasy environmental authorities, regional and
international NGOs, the local communities and the lender banks. Since becoming a BBOP Pilot Project,
Ambatovy has committed to ensuring that design (and ultimately implementation) activities are completed in a
transparent fashion. Transparency allows the Project to ensure stakeholders are well informed and able to
offer insightful feedback that contributes to the optimisation of conservation outcomes.
10. Science and traditional knowledge:
In order to evaluate residual impacts on biodiversity and quantify the required offset, the Project has applied
established and developing scientific methodologies. In parallel, traditional knowledge is being utilised (for
example, species identification in time and space, identification of species’ utilisation by humans (medicinal)
and animals (fruit trees), and land use patterns (plant-substrate relationships)).
24
BBOP Pilot Project Case Study – Ambatovy Project
5. Current Status of the Project and Offset
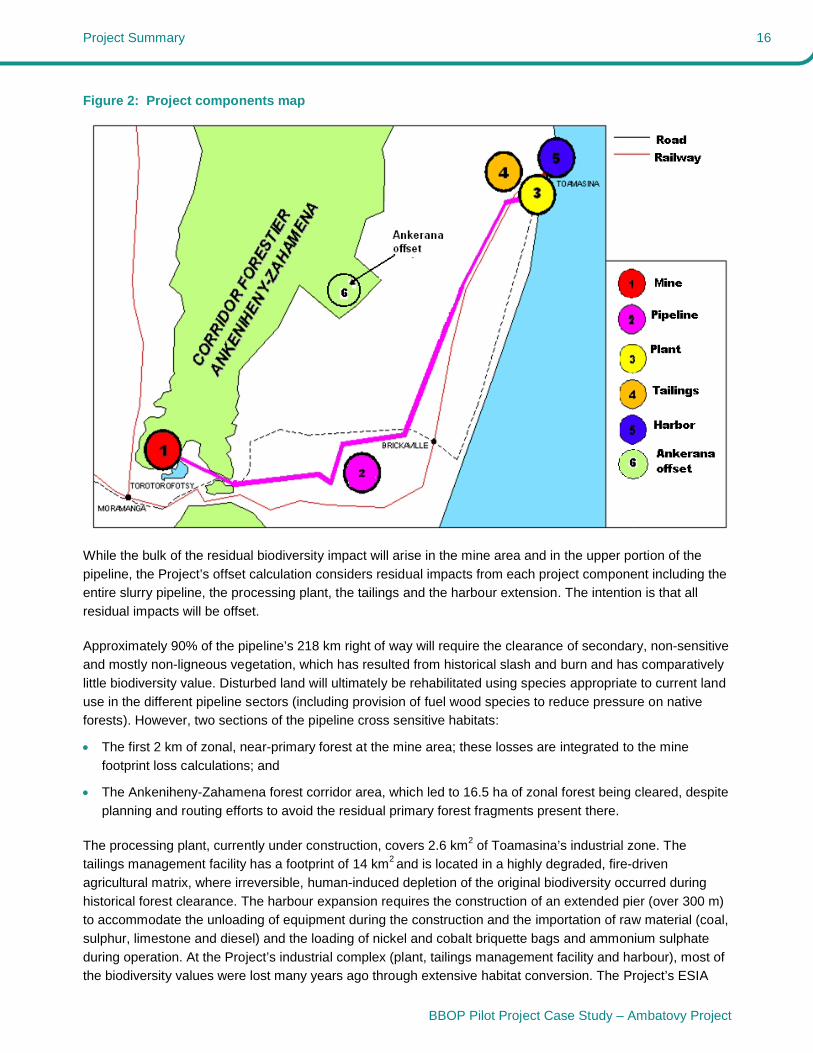
5.1 Project chronology and status (as of December 2008)
1960: Genim, a French company, conducts exploration drilling and identifies the Ambatovy and Analamay
nickel cobalt ore bodies; environmental considerations of the early feasibility study were very limited and
did not consider vegetation anomalies nor the importance of nearby wetland (e.g. using Torotorofotsy for
tailings disposal);
1970: Under the President of Madagascar, Didier Ratsiraka, a partnership with North Korea leads to the
analysis of a bulk sample that confirmed the existence of nickel and cobalt but which led to no further
development; environmental considerations were absent during exploration (e.g. no rehabilitation of test
pit, which remains unvegetated today);
1994 – 1997: Phelps-Dodge conducts exploration drilling and develops a feasibility study and an ESIA (not
submitted to ONE); vegetation anomaly recognised and quantified (vegetation map), biological inventories
created; management principles for surrounding forests conceptualised; importance of azonal habitats
recognised;
1998 – 2003: Restoration of exploration roads and platforms undertaken in light of Project development
uncertainties;
2003 – 2006: Dynatec conducts exploration drilling and develops a feasibility study and an ESIA; Final
Investment Decision taken by the investors (Dynatec and partners); on-site and offset conservation ideas
captured in the ESIA; Ambatovy becomes BBOP pilot Project; ESIA was permitted by ONE on December
1st, 2006; and
2007 – 2008: Elaboration of the Ambatovy Project thematic Environmental and Social Plans (18 plans: air,
noise, water etc and biodiversity); implementation of Biodiversity Action Plan (and others), development of
priority TAXA-specific draft management plans (lemur, Mantella species, fish and flora). Confirmation of
shareholders and loans and start of construction.
5.2 Offset chronology and status (as of December 2008)
2004 – 2005: Concept of biodiversity offset integrated with other Project activities, with a preliminary
survey of proposed offset site undertaken and documented in the ESIA; proposed offset site selection
based on geological, substrate, altitude and forest structure similarity (relative to principal IMPACT SITE);
2006: Ambatovy Project selected as a BBOP Pilot Project at Pretoria meeting;
2007: Participation in BBOP meetings (London and Bainbridge) and contribution to development of BBOP
handbooks and guidelines; concepts for Ankerana site management programme developed and zoning
initiated;

Current Status of the Project and Offset 25
BBOP Pilot Project Case Study – Ambatovy Project
2008:
– Preparation of interim report outlining technical aspects of the offset process (e.g. benchmark
selection, confirmation of impacts, preliminary loss calculations and completed Key Biodiversity
Components Matrix (KBCM);
– Preparation of supplementary report with revised benchmark selection and loss calculations, including
updated KBCM with quantitative species data;
– Preparation of complementary field work (terrestrial fauna) in response to gap analysis; inclusion of other
Project components (pipeline, tailings, plant and harbour) in overall assessment of residual impacts;
– Implementation of Ankerana site management programme:
Stakeholder consultations (local communities, NGOs and government including Office National
l’Environnement (ONE,) Forestry Department, Gendarmerie, District of Brickaville, local mayors and
police forces);
Reforestation work on periphery area of proposed offset; this focused mainly on planting wood for
construction uses to avoid primary forest logging in the offset area;
Population awareness campaigns around the proposed offset, conducted by field teams and
partners. The objectives of the campaigns were to define the offset site boundary and explain
existing laws that prohibit forest clearance;
Support provided to the mixed brigade (includes local communities, NGOs, local administrative staff
and the police force) which manages forestry resource exploitation through out the local communes;
Financial and logistic support to update the five year Communal Development Plans for impacted
communes; and
Technical committee meeting with SAPM focusing on integration of the proposed offset site with the
national protected areas network.
Conceptualised and pending (for 2009):
– The offset design work, following guidance in the BBOP BIODIVERSITY OFFSET DESIGN HANDBOOK has to
date quantified biodiversity losses as presented below. The next phase of work will be to calculate
offset gains and continue with the design of the offset and offset activity plan;
– The proposed Ankerana offset site has undergone only preliminary characterisation. Detailed baseline
ecological characterisation is planned for 2009 focusing on ecosystems, habitats, fauna, flora and
socioeconomic attributes. This information will underpin the calculation of offset gains;
– Socio-environmental losses will be defined and subsequently an appropriate compensation calculation
strategy and programme will be designed; and
– Continued interaction with stakeholders to refine and enhance the offset activity plan.
In summary, the Project is committed to designing and financing a long-term offset programme that aims at
achieving NO NET LOSS on biodiversity and preferably NET GAIN. Substantial progress has been made by
calculating the residual impacts on biodiversity and identifying potential offset mechanisms. Ambatovy will
continue to work closely with stakeholders on the offset design and plan the financial mechanisms to secure
the offsets in the long-term, using adaptive management in response to the insecurities of the global financial
crisis. The following pages of this case study detail the actions conducted and those that are planned for the
future.
26
BBOP Pilot Project Case Study – Ambatovy Project
6. Business Case for a Biodiversity Offset
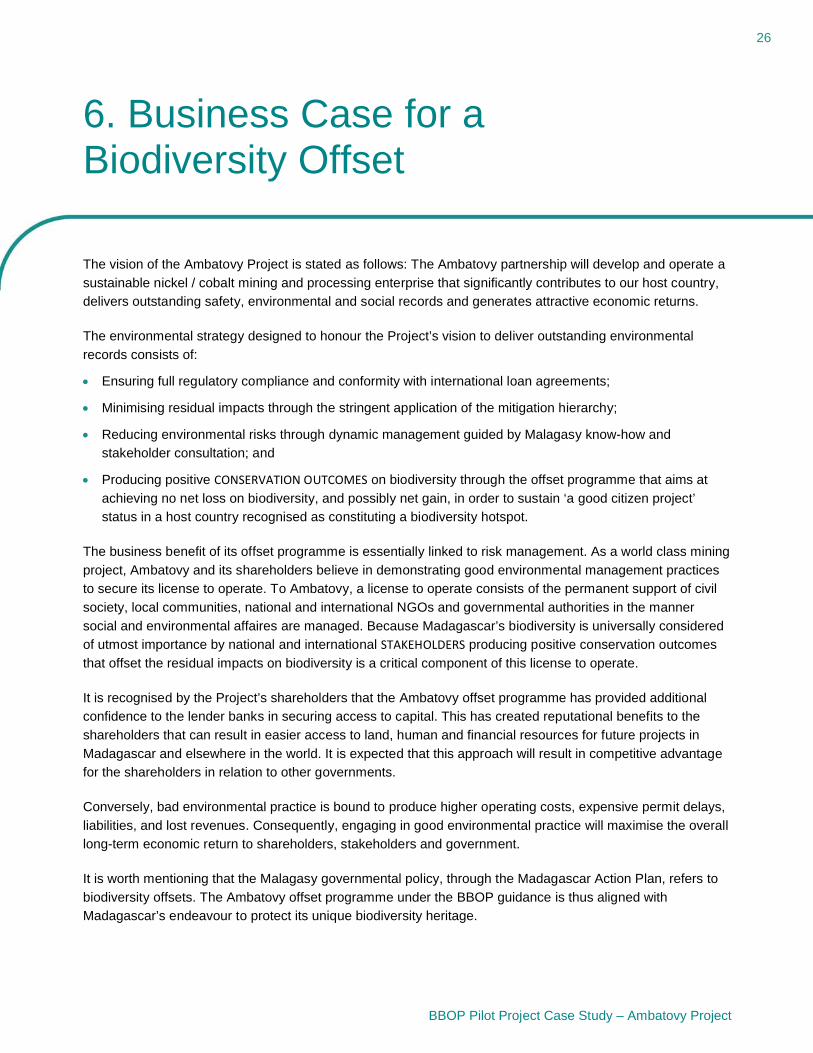
The vision of the Ambatovy Project is stated as follows: The Ambatovy partnership will develop and operate a
sustainable nickel / cobalt mining and processing enterprise that significantly contributes to our host country,
delivers outstanding safety, environmental and social records and generates attractive economic returns.
The environmental strategy designed to honour the Project’s vision to deliver outstanding environmental
records consists of:
Ensuring full regulatory compliance and conformity with international loan agreements;
Minimising residual impacts through the stringent application of the mitigation hierarchy;
Reducing environmental risks through dynamic management guided by Malagasy know-how and
stakeholder consultation; and
Producing positive CONSERVATION OUTCOMES on biodiversity through the offset programme that aims at
achieving no net loss on biodiversity, and possibly net gain, in order to sustain ‘a good citizen project’
status in a host country recognised as constituting a biodiversity hotspot.
The business benefit of its offset programme is essentially linked to risk management. As a world class mining
project, Ambatovy and its shareholders believe in demonstrating good environmental management practices
to secure its license to operate. To Ambatovy, a license to operate consists of the permanent support of civil
society, local communities, national and international NGOs and governmental authorities in the manner
social and environmental affaires are managed. Because Madagascar’s biodiversity is universally considered
of utmost importance by national and international STAKEHOLDERS producing positive conservation outcomes
that offset the residual impacts on biodiversity is a critical component of this license to operate.
It is recognised by the Project’s shareholders that the Ambatovy offset programme has provided additional
confidence to the lender banks in securing access to capital. This has created reputational benefits to the
shareholders that can result in easier access to land, human and financial resources for future projects in
Madagascar and elsewhere in the world. It is expected that this approach will result in competitive advantage
for the shareholders in relation to other governments.
Conversely, bad environmental practice is bound to produce higher operating costs, expensive permit delays,
liabilities, and lost revenues. Consequently, engaging in good environmental practice will maximise the overall
long-term economic return to shareholders, stakeholders and government.
It is worth mentioning that the Malagasy governmental policy, through the Madagascar Action Plan, refers to
biodiversity offsets. The Ambatovy offset programme under the BBOP guidance is thus aligned with
Madagascar’s endeavour to protect its unique biodiversity heritage.

Business Case for a Biodiversity Offset 27
BBOP Pilot Project Case Study – Ambatovy Project
In summary, Ambatovy believes that its offset programme will bring about the following advantages:
Continuing access to land and capital;
Increasing investor confidence and loyalty;
Reducing risks and liabilities;
Strengthening relationships with local communities, government regulators, environmental groups and
other stakeholders;
Building trust on a credible reputation for environmental and biodiversity related management performance
and winning a ‘social license to operate’;
Increasing ‘regulatory goodwill’ which leads to faster permitting;
Influencing emerging environmental regulation and policy;
Developing more cost effective means of complying with increasingly stringent environmental regulations;
Taking advantage of ‘first mover’ benefits in the marketplace Madagascar;
Maximising strategic opportunities in the new markets and businesses emerging as biodiversity offsets
become more widespread; and
Improving staff loyalty.

28
BBOP Pilot Project Case Study – Ambatovy Project
7. The Offset Design Process
7.1 Guidance and methodologies used
The Ambatovy biodiversity offset programme has been developed as an iterative process calling upon BBOP principles and guidance. Additional inputs towards the development of the Project’s offset programme came from a number of recent good practice guides, including Good Practice Guidance for Mining and Biodiversity(International Council on Mining and Metals 2006), Planning for Integrated Mine Closure: Toolkit (International Council on Mining and Metals 2008), Performance Standard 6: Biodiversity Conservation and Sustainable Natural Resource Management (International Finance Corporation 2006) and Biodiversity Offsets: Views, Experience, and the Business Case (ten Kate et al. 2004).
The BBOP guidance supports the development of either single or COMPOSITE OFFSET sites to compensate for residual impacts on biodiversity. The Ambatovy offsets programme is multifaceted because it is a large project with many components (see Section 3.2). While the design and implementation of the several components of the Ambatovy offset programme has progressed, the predicted conservation outcomes from these various offset components have not yet been fully calculated. Meanwhile, Ambatovy has focused on its proposed Ankerana offset as the most significant component of its offset. The proposed Ankerana offset design is based on the guidance in the draft BBOP Biodiversity Offset Design Handbook revised in December 2008 (available at www.forest-trends.org/biodiversityoffsetprogram/guidelines/odh.pdf). However, the high degree of social sensitivity around Ankerana has led the project to undertake community involvement before the planned biodiversity assessment at the site.
7.2 Roles and responsibility
The Ambatovy offset programme is designed, implemented and financially supported by the Ambatovy
Project. The offset commitment was reiterated by Sherritt Incorporated, the Project’s operator, in November
2008 during a clarification meeting with the BBOP Secretariat and representatives of Forest Trends, CI and
WCS. The offset programme is managed and monitored by the Project’s environmental department. Since
Ambatovy became a BBOP Pilot Project, the BBOP Secretariat and members of the BBOP Advisory
Committee have also monitored progress. Senior Project representatives attend all BBOP meetings and
provide updates and feedback to the BBOP Secretariat. The Project’s BBOP team includes:
A focal point (Pierre O. Berner, Environmental Director, Ambatovy Project);
A full time consultant responsible for supporting the offset programme management implementation
(Steven Dickinson of Golder Associates / Ambatovy Project);
An ecological assessment consultant responsible for the benchmark, loss and gain calculations (Aristide
Andrianarimisa of WCS); and
Environmental superintendent (monsieur Alphonse) leading a technical environmental and social field team
responsible for social and environmental management at the proposed Ankerana offset site. This team led
consultations with local stakeholders, including local communities, local forestry and police authorities and
local NGOs. A legal team is supporting the superintendent to ensure the legal protection status of the
Ankerana site.

The Offset Design Process 29
BBOP Pilot Project Case Study – Ambatovy Project
7.3 The offset design process
7.3.1 Step 1: Review project scope and activities
The nature, scope and geographical location of the Ambatovy offset programme was outlined in the ESIA as a
COMPENSATION measure that would go above and beyond the expected regulatory commitments. The basic
Ambatovy offset concept was presented and discussed in the many stakeholder public information meetings
associated with the ESIA review. As Ambatovy was accepted as a BBOP Pilot project in 2006, a more
structured approach was developed, which led to the multifaceted programme outlined in Section 3.2.
7.3.2 Step 2: Review the legal framework and / or policy context for a biodiversity offset
The key elements of the legal framework and policy context for the Ambatovy Project’s biodiversity offset
programme comprise the MECIE decree, the Madagascar Action Plan (MAP) 2007 – 2012, the regional and
communal development plans and the EQUATOR PRINCIPLES. Further information on these and other regulatory
requirements is provided in Section 2.1.
7.3.3 Step 3: Initiate a stakeholder participation process
As noted previously, the Ambatovy Project obtained its permit from the Malagasy regulatory authorities in
December 2006, based on a large ESIA that involved public information, consultation and enquiry throughout
the development and review process. Subsequently stakeholder consultations have been central to
discussions on integrating the offset programme with national, regional and local plans. At the Ankerana offset
site, the community buy-in process is progressing well and precedes the hard-core biological assessment that
can only be conducted after full community participation is demonstrated.
The offset stakeholder participation process can be summarised as:
Confirming key stakeholders (the JV partners, government, financiers, NGOs and local communities, see
Section 2.3);
Engaging stakeholders in the offset design process by presenting and discussing the offset’s objectives
and the proposed implementation process;
Engaging communities in the offset design process by assessing the impact the offset will bring about and
agreeing on an acceptable MITIGATION strategy; and
Integrating stakeholder feedback into the design process, especially with respect to land use in the multiple
use areas (site zoning); this part of the process is in its initial stage and will continue throughout the offset
zoning processes.
7.3.4 Step 4: Determine the need for an offset based on residual adverse effects
This section describes how the Ambatovy offset planning team:
1. Assessed the likely impacts on biodiversity caused by the Ambatovy Project;
2. Prepared a Key Biodiversity Components Matrix (KBCM);
3. Applied the mitigation hierarchy;
4. Determined residual impacts; and
5. Checked whether these residual impacts could be offset.

The Offset Design Process 30
BBOP Pilot Project Case Study – Ambatovy Project
7.3.4.1 Assessing biodiversity impacts
Biodiversity impacts are presented in the Project’s 2006 ESIA. The ESIA BASELINE and impact analysis
(including CUMULATIVE IMPACTS) followed World Bank (IFC, International Finance Corporation) standards.
A formal summary is available at:
http://www.sherritt.com/doc08/files/coal/abatovy/EAAmbatovy_EnglishSummary.pdf.
Details of the biodiversity impacts are available in Volume J of the full ESIA report (full document available in
French or English, on CD, through the Ambatovy Project or the Malagasy Ministry for Environment).
The Project’s main impacts will occur at the mine site, through the progressive clearing of the mine footprint
(total footprint of 2,126 hectares, of which 1,336 ha will result from clearance and the balance resulting from
indirect (edge effect) impacts around the cleared area) located within an ecologically sensitive natural forest
mosaic of the eastern mid-altitudinal forest corridor. Stringent impact avoidance and minimisation strategies
were applied in the design phase of the Project, so RESIDUAL IMPACTS on biodiversity from the other key
Project components, most of which lie in heavily degraded areas, are of less significance (but will nonetheless
be offset). These include pipelines, the processing plant and refinery, tailings management facility and pier
extension (see Section 3 for a summary of associated impacts).
As the Project has evolved, specific aspects covered in the ESIA are currently being revisited to ensure that
no residual impacts to biodiversity have been neglected. Any further residual impacts identified will be
included in the biodiversity offset calculation.
7.3.4.2 Key Biodiversity Components Matrix (KBCM)
Key biodiversity components
KEY BIODIVERSITY COMPONENTS were identified for the impact area, including mainly species and habitats, but
also landscapes / ecosystems. The completed key biodiversity components matrix (KBCM) conveys the
essence of the character of the site by identifying a range of its highest biodiversity values. The KBCM can
help ensure that the offset generates additional conservation outcomes for these key biodiversity values, and
the matrix can also contribute to the design of the BENCHMARK that will help with the calculations of residual
BIODIVERSITY LOSS caused by the Project (see Appendix 1) and the gain that will be achieved through the
offset. Both intrinsic and NON-USE VALUES of key species and habitats / ecosystems were assessed according
to their significance level and IRREPLACEABILITY. The KBCM based on the current data is in Appendix 1. The
Project will conduct additional surveys and improve analysis of existing data during 2009.
The key biodiversity components listed here will subsequently be considered during the offset site selection6
and characterisation stage.
7.3.4.3 Applying the mitigation hierarchy
Prior to consideration of biodiversity offsets, the Ambatovy Project implemented appropriate avoidance,
minimisation and restoration measures through its Biodiversity Management Plan (BMP) to avoid species
EXTINCTION and EXTIRPATION (all IUCN EN and CR species), avoid sensitive areas where possible and
minimise impacts on flora, fauna and aquatic resources.
6 A rapid assessment of the Ankerana site provided preliminary species-level data. The potential offset site is located within the same biogeographical setting as the impact area, so it is anticipated that more detailed assessments will also reveal the presence of the key biodiversity components at Ankerana.

The Offset Design Process 31
BBOP Pilot Project Case Study – Ambatovy Project
Specific avoidance strategies include the use of conservation barriers to physically isolate the on-site azonal
conservation areas from construction activities in surrounding areas and ensure that modification of the mine
footprint follows a strict environmental protocol (see Appendix 4: Protocol for Mine Area Modification).
A very substantial minimisation programme was implemented through the BMP. Significant activities include:
Directional and paced forest clearance to optimise the natural migration of terrestrial fauna. Clearance
procedures are provided to the forest clearing team manager as part of Forest Clearing Biodiversity Action
List procedure; the proper implementation of the actions is monitored on a daily basis by the mine
environmental team and any deviation reported for immediate corrective action.
Repetition of full biological surveys in the clearing perimeter and surrounding areas prior to any forest
clearance in order to inventory fauna taxa present, particularly priority species (IUCN Endangered [EN] and
Critically Endangered [CR] categories) but also including lemurs, other mammals, birds, reptiles and
amphibians. The surveys facilitate the development of taxa-specific mitigation measures. For example, a
representative sample of individuals from all lemur species are captured and fitted with radio collars and
subcutaneous microchips in order to monitor their ability to migrate from an area as it is cleared and the
receiving populations’ behaviour on arrival of displaced groups in their territory. For plants, a list of species
of concern (SOC) was drawn up during ESIA baseline studies in collaboration with the Project’s botanical
expert partner. Pre-clearance work involves identifying whether SOC are present in the clearing perimeters
and searching for these SOC outside the mine footprint (in protected areas) to avoid potential species
extinction. For fish in streams, a spatial and genetic survey (endemicity assessment) was conducted to
determine whether the species present were ENDEMIC to the mine footprint. Until genetic results became
available, fish from impacted streams were recovered and temporarily maintained in aquaculture systems;
subsequent management actions are currently being undertaken.
Monitoring of fauna during and after clearance. For example, lemur spatial dispersion is monitored during
forest clearance to assess their capacity to (i) migrate (avoid immediate impacts); (ii) settle in their new
home range (a medium-term impact) and (iii) reproduce and maintain population viability (a long-term
impact). Biomedical health is assessed in parallel to behavioural assessments with the aim of improving
analysis of trends in the Project’s long-term lemur population viability assessment programme.
Salvaging activities focused on fauna likely to require human aid to migrate towards refuge areas (the
conservation zones shown in green on Figure 3). A crew of 80 technical agents was trained by experts to
identify and salvage all small mammals, stranded lemurs, nocturnal birds and herpetofauna. Systematic
salvage of these taxa was undertaken for all mine, pipeline and plant site clearings, under the supervision
of external experts (e.g. biologists from the University of Antananarivo) and the Ambatovy biodiversity
team. Taxa were logged and relocated / monitored in refuge areas. Limited salvaging of flora was also
conducted. Some SOCs required ex situ conservation, with individuals translocated to a dedicated on-site
area while searches for the SOC in areas outside the footprint were completed; cells from these SOC were
collected for micro-propagation and cryoconservation as a back-up. To date all SOC surveys have lead to
the identification of off-site VIABLE POPULATIONS, and the Project and its botanical partners remain confident
that this will be the case for all remaining SOCs. In the event that SOC are not found, then the
aforementioned mitigation will be applied.

The Offset Design Process 32
BBOP Pilot Project Case Study – Ambatovy Project
Figure 3: Mine area, showing conservation zones (green) that constitute on-site offset area (including
azonal, transitional and zonal forests)
The mine restoration programme includes progressive footprint rehabilitation through erosion control,
reforestation with targeted species and facilitated secondary successions. The aim is to produce a
multifunctional replacement forest with biodiversity values that can be included in the offset calculation (by
reducing the residual impact on biodiversity that will require offsetting). The pipeline restoration programme
will focus on targeted reforestation of the right of way.
7.3.4.4 Determining residual impacts
The Project’s most significant residual impacts will occur at the mine site. Residual impacts caused by the
other key Project components are limited as these components are located in areas that are already heavily
and historically degraded. Nonetheless, these less significant residual impacts will also be included in the
offset calculations.
The Project’s residual impacts are summarised below.
Direct negative impacts
The total loss of habitats as progressive clearance of the mine footprint (1,336 hectares, excluding the
environmental buffer) proceeds in an ecologically sensitive natural forest mosaic. Following clearance
some areas will be built on and / or eventually mined. In the areas lost to DIRECT IMPACT the HABITAT TYPESwere identified (azonal, transitional and zonal forests, ephemeral ponds and streams) and the quality of

The Offset Design Process 33
BBOP Pilot Project Case Study – Ambatovy Project
each determined (good or degraded). Flora, fauna and aquatic taxa assemblages were associated where
feasible with these habitat types and quality. Finally, habitat surface areas were calculated using ESIA
habitat maps and GIS. Taxa assemblages and forest structural characteristics were determined for each
habitat where possible. Available fauna data were generally qualitative, although pre-clearance survey
data from both the mine footprint and surrounding conservation areas were used, providing updated lemur
densities and abundance.
Clearance of 16.5 ha of fragmented and degraded primary forest during installation of the 218 km buried
slurry pipeline (a total clearance permit for approximately 70.5 hectares was granted as 98% of the pipeline
route passes through secondary, non-sensitive vegetation (e.g. non-native eucalyptus) resulting from
historic slash and burn). Two sections of the pipeline do, however, cross sensitive habitats: the first 2 km
passes through zonal, near-primary forest and the pipeline also crosses the Ankeniheny-Zahamena
Corridor (CAZ). Losses associated with the pipeline’s first 2 km have been included in the mine losses
using the same approach for determining residual impacts as applied to the mine footprint.
Indirect negative impacts
INDIRECT IMPACTS through edge effects (dust, noise, plant desiccation, invasion of natural heliophytes), will
potentially affect 790 ha of forest surrounding the mine footprint. This area was defined on the basis of a 100
m zone surrounding polygon features (e.g. mine pits and ancillary facilities) and a 50 m zone around linear
features such as roads (except the main access road) and pipelines (see Appendix 4: Mine Footprint
Definition, 2nd Approximation, December 12, 2007). The degree to which these areas will be affected
remains unclear; as a precautionary approach the full 790 ha has been included in the total loss calculations.
This may be modified as information on the degree of impact becomes available through monitoring.
Low or negligible negative impacts for biodiversity
The processing plant is being constructed on a 150 ha (1.5 km2) area of the Toamasina industrial zone. The
1,400 ha (14 km2) tailings management facility will be located in a highly degraded fire-driven agricultural
matrix. An existing pier at the harbour will be extended by over 300 m. The residual biodiversity impacts
associated with the processing plant, tailings facility and pier extension are expected to be negligible. The
habitat classes for the plant site and tailings facility location would be defined as highly impacted and
degraded and have been omitted from the loss calculations for the time being. However, the Project will
consider how to trade-up these areas by conserving higher priority biodiversity elsewhere; one suggestion is
to simply add the surface areas lost (i.e., 15.5 km2) and apply a MULTIPLIER to determine the area of higher
BIODIVERSITY CONSERVATION priority land as part of the offset. The Project will seek assistance from the BBOP
Advisory Committee before making a decision.
Socioeconomic impacts
The Project will conduct loss calculations for the socio-environmental aspects in 2009. The aim of the offset
programme is to compensate for all AMENITY and LIVELIHOOD related losses experienced by local communities
as a result of the biodiversity offset. Potential compensation measures include the introduction of improved
agricultural techniques to increase crop yield and the provision of jobs related to environmental protection.
At present, a number of positive socioeconomic impacts are also apparent:
Over 80 members of the local community at the mine are permanently employed in biodiversity
management-related jobs (in total, over 8,000 jobs for Malagasies will be generated by the Project); the
biodiversity jobs include ongoing training.

The Offset Design Process 34
BBOP Pilot Project Case Study – Ambatovy Project
14 community members have been hired as park rangers at the mine site to protect the mine forests.
A public awareness programme is underway to raise community understanding of their natural heritage
and their role in its protection.
Reinforcement of the local forestry service’s capacity to protect forests (and their fauna and flora) around
the mine footprint; the work at the Torotorofotsy wetland will also improve the forest service’s capacity
there.
Over 50 local expert biologists have been hired (on a project-by-project basis) to bring their knowledge to
the Project’s activities and to promote the development and use of Malagasy skills).
7.3.4.5 Offsetable nature of residual impacts
The Project is ensuring that its residual impacts are OFFSETABLE by focusing on the avoidance of species,
habitat and ecosystem loss and checking that the particular biodiversity components affected can be found in
the surrounding area and beyond, so that their populations will not be unduly affected by the Project and will
benefit viably from the offset activities. The Project has ensured that species of concern (SOC) were present
outside of the mine footprint and is using taxa-specific management programs to define the relevant
conservation management activities:
The Flora Management Programme aims to ensure that SOC – flora species that were only identified on
the mine footprint during the ESIA baseline – are not lost. These species remain listed as SOC until viable
populations are located outside the mine’s footprint in protected areas. Surveys and viability assessments
are being conducted by experts in flora taxonomy and ecology from Missouri Botanical Garden –
Madagascar.
The Lemur Management Programme aims to confirm that the mine’s construction and operation activities
are not leading to a long-term reduction in the viability of priority species’ populations present in the mine
area. The programme focuses on IUCN EN and CR species, but includes all 16 species as a BEST PRACTICE measure due to the unique nature of lemurs. The programme includes two principal phases, a
short-term three year assessment (covering the 2007 – 2010 construction phase) to begin identifying any
trends in lemur groups and populations in the footprint and receiving areas located in the conservation
forests. The second phase (from 2010 to end of the mine’s life), aims to identify any long-term viability
trends and to develop appropriate mitigation measures, such as off-site relocation programs, recruitment
boosting (e.g. captive breeding and release), reduction of slash and burn activities and strict control of
hunting (bushmeat).
The Mantella Management Programme aims to ensure that there are no measurable adverse impacts on
the ability of the mine area forests to support the established Mantella aurantiaca (IUCN CR) and Mantella
crocea populations (IUCN EN). Any reduction in their population sizes is also to be avoided. The
programme was implemented in November 2007, although the species are located in areas that will not be
mined for 10 years or more. The Project is defining populations present on the footprint and in the
conservation zones and comparing them to regional population sizes. Various mitigation measures are
possible including footprint reduction or shifting (i.e., modifying the footprint to avoid breeding areas),
relocation (based on successful trials) and increasing population recruitment.
The Fish Management Programme aims to avoid the extinction of fish species and to maintain population
viability at pre-Project levels. Endemicity assessments have been conducted as the species present were
only previously described to the genus level. Mitigation measures will be applied accordingly and may
include, for example, the creation of conservation streams and relocation.

The Offset Design Process 35
BBOP Pilot Project Case Study – Ambatovy Project
7.3.5 Step 5: Choose methods to calculate loss / gain and quantify residual losses
The Project is using methodologies described in the BBOP Biodiversity Offset Design Handbook to assess the Project’s impact on biodiversity, to identify appropriate activities and sites for the biodiversity offset, and to determine the scale of the offset needed to achieve the CONSERVATION GAINS that will achieve NO NET LOSS. The methodologies combine consideration of biodiversity of equivalent or higher value and site selection to ensure that all key biodiversity components are represented at the offset and have two key features: ‘benchmarks’ and ‘HABITAT HECTARES’:
BBOP defines a ‘benchmark’ as reference point against which the losses of biodiversity due to the Project and gains through the proposed offset can be quantified and compared consistently and transparently. A benchmark usually comprises a number of representative and characteristic ‘ATTRIBUTES’ used to represent the type, amount and quality of biodiversity which will be lost / gained. Comparison of the observed level (or ‘score’) of each BENCHMARK ATTRIBUTE at the impact site (before and as predicted after the impact) against the level at the benchmark can help to quantify the loss of biodiversity to be caused by the Project. Similarly, comparing the observed level (or ‘score’) of each benchmark attribute at the offset site (before the offset and as predicted after the offset intervention) against the level at the benchmark can help to quantify the gain in biodiversity caused by the offset. A benchmark can be based on an area of land that provides a representative example, in a good condition, of the type of biodiversity that will be affected by the proposed development project.
‘Habitat hectares’ are units of measurement that take into account the area affected and the quality or CONDITION of the biodiversity impacted (determined by the quantities of a number of chosen attributes related to the structure, composition and function of that habitat). The habitat hectares METRIC was originally developed in Victoria, Australia to focus on HABITAT STRUCTURE, particularly native vegetation, and thus to provide proxies for composition and function. It has since been adapted by BBOP to cover both flora and fauna, and to include some aspects of composition and function as benchmark attributes. The habitat hectares approach is described in more detail in Section 7.3.5.1 below.
The Project’s proposed benchmark meets specific predetermined criteria with respect to surface area, habitat quality and connectivity (see below). It is ideally located as it is in the mine area conservation zones, thus ensuring its long term protection. The long-term presence of the benchmark is important as it will enable background environmental degradation arising from external factors (such as climate change) to be quantified and subsequently addressed at the offset site.
Lists of key biodiversity components were identified in the impact area; these include species and habitat types (structural). Complementary faunal data will be collected by the Project in 2009 to integrate more species attributes into the habitat hectares loss calculation, as current calculations are limited to quantitative information for only three priority lemur species.
The Project has calculated its habitat hectares loss values for forest habitats. Scores for streams and ephemeral pools were calculated in April 2008, but have been temporarily excluded subject to re-assessment during the next iteration of the loss calculations.
Two habitat hectares calculation scenarios were assessed in April 2008: without and with post-impact MITIGATION. It is important to note that both potentially relate to real situations since restoration performance is not well documented for Madagascar or the Ambatovy region. ‘Post-impact mitigation’ significantly decreases the habitat hectares loss value and will ultimately be included in the final (definitive) offset calculations. However, care is necessary to avoid overestimating the potential for rehabilitation success as this can result in the underestimation of the number of habitat hectares that the offset must deliver. Only the ‘without post-impact mitigation’ scenario is reported here as further analysis (modelling) is required to accurately calculate losses based on the ‘with post-impact mitigation’ scenario.

The Offset Design Process 36
BBOP Pilot Project Case Study – Ambatovy Project
7.3.5.1 The habitat hectares approach
This section:
Introduces the ‘HABITAT HECTARES’ approach;
Describes how the ‘benchmark’ was defined for forest habitats; and
Explains how the Project’s residual impacts on biodiversity have been calculated using the benchmark.
The habitat hectares approach
Biodiversity loss was calculated using the habitat hectares approach, summarised as:
1. Completion of the Key Biodiversity Component Matrix (KBCM), which corresponds to conducting a biodiversity assessment of species, habitats and ecosystems components and determining intrinsic (significance and irreplaceability) and use (socioeconomic and cultural) values;
2. Completion of a table to review the application of the MITIGATION HIERARCHY to the key biodiversity components;
3. Selecting attributes for the key biodiversity components using available or complementary data and assigning ‘weights’ to each. For example:
Forest structural attributes can be selected and compared (weighed) against each other, e.g. tree species richness is considered to be the most important attribute at Ambatovy and therefore has a higher WEIGHTING than attributes related to forest physical structure.
Taxa attributes such as quantitative fauna data (e.g. density) from priority species can also be integrated and therefore allow key fauna data into the weighing of attributes; this reflects more accurately the importance of species biodiversity in the habitat hectares scores.
4. Defining and selecting a BENCHMARK for selected habitats;
5. Calculating biodiversity loss at the IMPACT SITES by comparison to the benchmark, for each habitat CONDITION classes in light of impact levels;
6. Completion of a table to record and compare whether POTENTIAL OFFSET SITES could deliver conservation gains for key biodiversity components; and
7. Calculating the habitat hectares gained at the offset site.
Using the previously cited information, habitat hectare scores were determined for all habitats (e.g., forests, streams and ephemeral ponds). Calculation of the forest habitat hectare loss at Ambatovy requires the following condition information:
Habitat types, namely azonal, transitional and zonal forests and respective surface areas (see Figure 4 showing the mine area habitat map);
Habitat condition class and respective surface areas (see Figure 4), namely:
– Quasi pristine primary forest (see definition in benchmark section hereafter, Forest habitats, 3rd and 4th bullets);
– Disturbed / degraded primary forest; and
– Heavily fragmented and degraded primary forest.
Impact types, namely high (cleared footprint) and medium (environmental buffer) and respective surface areas (see Figure 5).

The Offset Design Process 37
BBOP Pilot Project Case Study – Ambatovy Project
Figure 4: Mine area habitat map
Figure 5: Mine footprint and environmental buffer map

The Offset Design Process 38
BBOP Pilot Project Case Study – Ambatovy Project
The Ambatovy forest habitat loss scores were determined by merging data from the three existing habitat
types, since the selected forest attributes did not exhibit a statistical difference and faunal movement from
intensive fauna surveys in the pre-clearing perimeters showed the same occupancy pattern for the three
habitat types. Knowledge of the condition class is particularly important, since it reflects the biodiversity loss at
stake, thus highlighting the application of multipliers in degraded habitats that are subsequently subject to
negative impacts. The importance of multipliers was highlighted, for example, when considering degraded
azonal forests which constitute 44.6% of the azonal habitat loss, but equivalent to only 29.3 habitat hectares
of the total 620 habitat hectares score for the azonal habitat. High impact areas corresponded to 100% forest
clearance with earthworks, medium impacts corresponded to the potential edge effects on the forest
environmental buffer (50 m for linear features and 100 m for polygons), while low impacts did not apply to the
impact areas. The habitat hectares score provided above is for the ‘without post-impact’ mitigation scenario.
The habitat hectare gain for the proposed offset site has not yet been calculated, as detailed forest structure and
quantitative species attribute data are still being acquired, with field surveys for flora / forest structure and aquatics
planned in July 2009 and terrestrial fauna in November 2009. As the proposed Ankerana site is considered to be
an ‘IN-KIND’ offset (relative to the impact site), the same benchmark will be used to calculate gains.
Benchmark
Based on the BBOP definition of a benchmark, the following criteria were used to define and identify a
candidate site:
Forest habitats:
– Minimal critical size: in the Ambatovy forests, a benchmark is required that captures the progressive
structural changes between the existing three vegetation types, and the faunal movement between
them throughout the seasons. A contiguous area of quasi pristine ‘azonal’, ‘transitional’ and ‘zonal’
forests, each of which must be a minimum of 40 ha is proposed. This area of 120 ha includes the core
area of original habitat with a 100 m wide buffer around it and appears to be the minimum required as a
home range for lemurs and to represent an adequate assemblage of vegetation.
– CONNECTIVITY: the contiguous forest area (minimum size – 120 ha) must be connected to other forest
habitats.
– Human disturbance: there must be no sign that the site has ever been cleared by humans (in both core
and buffer areas). However other evidence including tree stumps, historical records, soil charcoal,
archaeological remains and signs of selective logging (defined as less than 12.5% of crown cover loss)
over the last 20 years do not exclude a site from consideration as a benchmark (such evidence is
widespread and unavoidable in the region). Any small degraded areas within the larger benchmark area
are mapped and excluded from the benchmark calculations (and surface area).
– Natural disturbances: a site that has experienced a natural fire in the last 20 years, at a level of 10% of
its surface area (in both its core and buffer area) is excluded. Also, no evidence of cyclonic events is
acceptable (above 10% loss of canopy crown cover in the last 20 years).
Streams and ephemeral pools:
– The benchmark must be the mostly pristine habitat.
– The stream locations where benchmark data were acquired must be surrounded by quasi-pristine
and natural habitat, unaffected by any major human-induced disturbance and under pristine forest
cover.

The Offset Design Process 39
BBOP Pilot Project Case Study – Ambatovy Project
– Since many natural ephemeral pools occur in hollow rocky ground, benchmark data must be taken
where the rock outcrops are of natural origin and not the result of forest clearance or other human
disturbance.
Assumptions:
– Within the azonal and transitional habitats, the highest ENDEMISM is associated with the lowest human
impact.
– No sylviculture or tree enrichment has been carried out in Ambatovy.
The benchmark site is presented in Figure 6.
Quantifying biodiversity residual impacts calculations using the benchmark
Benchmark
A scoping exercise was undertaken to determine from the KBCM and other studies which biodiversity
components would be most appropriate as attributes of the benchmark. The data quality associated with
each of these components available in the ESIA was checked. The selected attribute types are:
Species:
– 3 lemurs: Propithecus d. diadema, Indri indri, Allocebus trichotis (the attributes of species such as
Prolemur simus and Daubentonia madagascariensis will be re-examined in the next iteration of the
offset calculations); and
– 2 fish: Ratsirakia sp and Rheocles sp (suspended for the moment and to be re-examined in the next
iteration).
Communities / habitats:
– Forest (three habitats, azonal, transitional and zonal);
– Streams (suspended for the moment and to be re-examined in the next iteration); and
– Ephemeral pools (suspended for the moment and to be re-examined in the next iteration).
Impact assessment and mitigation hierarchy application:
An impact assessment of the biodiversity components was subsequently conducted based on the anticipated
impacts, of which the principal impact is forest clearance and subsequent habitat loss. The corresponding
mitigation strategies for each biodiversity component are presented below:
Species: lemurs are displaced from their habitats by forest clearance. The Project’s mitigation measure is
to monitor (through radio collars and telemetry) their ability to migrate from the clearance area towards the
refuge areas (see Figure 3, conservation zones). The mitigation measures include assisting stranded
individuals from all 16 known species identified on-site and limited off-site relocation to protected areas
(e.g. Propithecus diadema) following IUCN translocation guidelines.
Habitats: the main mitigation strategy for the three forest habitats is offsetting due to their fixed location.
AVOIDANCE will also be applied to the azonal habitat since 26.4% of this habitat will be protected in the
form of the mine area conservation zones (see Figure 4).
The December 2008 iteration of the impact assessment and mitigation strategies is presented in Appendix 1.

The Offset Design Process 40
BBOP Pilot Project Case Study – Ambatovy Project
Benchmark and attributes
A benchmark site was selected (see Figure 6) in line with the BBOP definition and Project-specific criteria
noted above. The benchmark includes a forest tract of 1,149.15 ha, composed of quasi pristine azonal,
transitional and zonal forests, at least two streams and several ephemeral ponds.
Figure 6: BBOP benchmark site map
A limited number of ATTRIBUTES were selected as SURROGATES for both forest habitat structure and function
based on the following characteristics:
Sensitive INDICATORS to habitat quality;
Simple and practical to measure and quantify;
Reliable and repeatable in assessments; and
Reflect outstanding biodiversity values (e.g. species of conservation concern, or CULTURAL VALUE).
Due to data limitations (e.g., difficulties faced in obtaining quantitative data for fauna at the impact site), the
present loss calculations are limited to forest structural attributes (streams, number of tree species, canopy
height, basal area and Diameter to Breast Height, Dbh) and the attributes of selected fauna species (lemur
density). Future iterations will include additional attributes as appropriate data become available.
The December 2008 iteration results are presented in Table 3, with WEIGHTING assigned to forest habitat and
species attributes according to their relative importance for biological diversity.

The Offset Design Process 41
BBOP Pilot Project Case Study – Ambatovy Project
Table 3: Summary of attribute weighting (December 2008)
Attributes Unit Weighting (%) Justification
Stems (a) number / ha 15Reflects forest density, an important ecological attribute for fauna, especially lemurs.
Number of tree species (per ha)
number / ha 20Provides overall floral diversity and habitat heterogeneity. Higher numbers are better.
Canopy height m 5Indicator of forest maturity and canopy continuity. For azonal habitat lower canopy height is better.
Basal area (b) m2 / ha 5Indicator of habitat CONDITION. Higher value is better as it is an indication of mature forest.
Dbh m 5Indicator of habitat condition. Higher value is better as it is an indication of mature forest.
Propithecus diadema density (c)
individual number / ha
20IUCN CR (d) status, species very sensitive to human activities in their habitat.
Allocebus densityIndividual
number / ha10
Nocturnal species sparsely distributed and appears to be sensitive to forest structure.
Indri indri densityIndividual
number / ha20
Madagascar’s largest lemur species sparsely confined to eastern rain forest, IUCN EN status, and also has a cultural value (the most taboo lemur species).
Total 100
(a) Number of trees with diameter ≥10 cm, with measurements taken at 1.3 m above the ground.(b) Basal area is calculated as π x (diameter at breast height / 2)2.(c) Lemur species density is estimated based on line transect samples within a surface area, S = 2 x (Width x Length) in which density D
= individual number / S.(d) Was recently lowered to EN.
The selection and weighting of the attributes is examined below.
Selected attributes are divided in two groups:
– Forest structure, as a general surrogate for forest dependent biodiversity; and
– Lemur species, as an ‘umbrella species’ fauna group considered to be the most sensitive to human
disturbance in Ambatovy (bush meat, slash and burn, logging); the species selected include both
diurnal and nocturnal species.
Weighting: 60% and 40% importance were chosen for forest structure and faunal assemblage species,
respectively. Attributes that express biological diversity (e.g., tree SPECIES DIVERSITY and stem number) are
weighted with higher importance, as are species with CR rather than EN status. Since the mine is located
in a BIODIVERSITY HOTSPOT area, IUCN species of concern have been chosen as the main attributes to
reflect the principles of ‘IRREPLACEABILITY’ and no loss of NON-OFFSETABLE components.
TAXA selection: lemurs were selected over other fauna groups, due to their wide presence in forest
habitats. Fish, amphibians and reptiles are restricted to specific habitats at Ambatovy, for example
microhabitats for herpetofauna. Therefore any impact occurring away from these specific microhabitats
(which are yet to be defined) might not reflect the Project’s impact on these taxa. The possibility of
considering some of the herpetofauna and pond invertebrate species will be explored after new data has

The Offset Design Process 42
BBOP Pilot Project Case Study – Ambatovy Project
been collected in 2009. The inclusion of fish components for stream habitats will also require further
analysis and consideration.
VULNERABILITY: although this attribute was integrated in the April 2008 calculations (see Appendix 5), it is
excluded from the present iteration of the loss calculations. The taxa groups should be considered
together, not only at the species level, so that the same weight can be given to all taxa (lemurs, birds,
herpetofauna, etc). This would allow the Project to consider not only specific species, but also the
taxonomic groups that are important for monitoring purposes. In fact species EXTIRPATION can sometimes
be linked to group effects or intra-species interactions; therefore, it is best to consider taxa group
vulnerability rather than that of specific species. It is thus assumed that vulnerability considered as an
attribute makes more ecological sense than that considering specific species alone. However, the use of
vulnerability attributes requires further detailed analysis, to be conducted in 2009.
Calculating biodiversity loss at the impact site
The attributes presented above are for the mine and pipeline components.
As described in the previous sections, the pipeline’s impact on forest habitat is very limited since routing
avoided relic forest fragments present in the first 32 km (after which the area crossed is entirely exotic
secondary vegetation resulting from slash and burn activities). Only the first 2 km of the pipeline cross quasi
primary forest, and these losses were included in the mine loss calculations. The pipeline’s losses thus
correspond to the forest fragments (16.5 ha) that could not be avoided: the habitat hectares could be
calculated for this as the area impacted could be compared to the zonal forest BENCHMARK ATTRIBUTES. The
pipeline’s forest fragments are classed as Ecological Vegetation Class (EVC) 3: ‘heavily fragmented and
degraded primary forest’. Instead of using the ‘basal area’ attribute, ‘volume’ was considered since these
forests are heavily exploited by the local communities for fire wood. Volume can also be used in the future
socioeconomic compensation analyses. The pipeline’s aquatic components include the crossing of more than
400 streams with variable levels of ecological integrity and sensitivity. However, pipeline-related impacts to
the aquatic environment are considered temporary, which cannot be captured by the habitat hectare
methodology. The Project will therefore use methodological options for integrating temporary impacts in the
next iteration of the loss calculations.
The locations of the processing plant and tailing management facility have an EVC of 4 (essentially heavily
degraded, with no remaining integrity, based on ESIA data). The habitat hectares calculation for this fourth
category has not yet been undertaken for these areas. However the Project is committed to ‘TRADING UP’
these areas and will work with BBOP to define an appropriate methodology for doing so. The harbour has
been used as an industrial port for some time and little biodiversity of any significant conservation value is
found there now.
The mine area includes two Ecosystem Vegetation Classes (EVC): ‘quasi pristine primary forest’ and
‘disturbed primary forest’. The pipeline has only one EVC: ‘heavily fragmented and degraded primary forest’.
For each EVC the Project will have either a:
‘High impact’ corresponding to total forest clearance with or without grubbing (removal of stumps, roots,
and vegetable matter). A total area of 1,336 ha will fall in this impact category.
‘Medium impact’ corresponding to the environmental buffer around the mine footprint (100 m) and linear
features (pipeline / roads, with a 50 m buffer), which will be indirectly affected by forest clearance (impacts
are mainly through edge effects such as light, dust and unauthorised disturbances.

The Offset Design Process 43
BBOP Pilot Project Case Study – Ambatovy Project
Results of the HABITAT HECTARES scores for each HABITAT TYPE at the mine and along the pipeline are
presented in Tables 4 to 7.
Table 4: Azonal habitat (December 2008)
… of Condition Class 1:
…of Condition Class 2:
AZONAL FORESTQuasi pristine primary forest
Disturbed primary forest
TOTAL HABITAT HECTARE LOSS
Total areas 590.74 475.55
High impact 528.86 427.22
Medium impact 61.88 48.33
620
Table 5: Transitional habitat (December 2008)
… of Condition Class 1:
…of Condition Class 2:TRANSITIONAL
FOREST Quasi pristine primary forest
Disturbed primary forest
TOTAL HABITAT HECTARE LOSS
Total areas 126.37 328.22
High impact 53.38 222.68
Medium impact 72.99 105.54
239
Table 6: Zonal habitat (December 2008)
… of Condition Class 1:
…of Condition Class 2:
ZONAL FORESTQuasi pristine primary forest
Disturbed primary forest
TOTAL HABITAT HECTARE LOSS
Total areas 412.74 124.97
High impact 256.9 14.94
Medium impact 155.84 110.03
305
Table 7: Pipeline zonal habitat (December 2008)
…of Condition Class 3:
PIPELINE Heavily fragmented and degraded primary forest
TOTAL HABITAT HECTARE LOSS
Total area 71.04
High impact 16.5
Medium impact 4.95
4
The forest habitat percentage hectares loss for the mine (and pipeline) components is shown in Figure 7.

The Offset Design Process 44
BBOP Pilot Project Case Study – Ambatovy Project
Figure 7: Forest habitat percentage hectares loss for the mine component
(the pipeline affects only a small portion of the zonal habitat)
Based on the current iteration, calculations show that:
The project will generate a total loss of 1,168 habitat hectares that any offset will be required to
compensate.
In the mine area, the azonal forest habitat hectares score is the highest, with a total loss of 620 habitat
hectares, representing over half of the entire forest habitat lost.
The pipeline terrestrial biodiversity losses are minimal at 3.83 habitat hectares (0.33% of the total loss).
The Project’s offset programme must focus its offset efforts on the azonal forest and associated
biodiversity components, whilst ensuring that the other two habitats (transitional and zonal) habitat
hectares losses are also compensated. Early analysis of trends in lemur species distribution (based on
ESIA and construction mitigation management data) indicates that none of the three habitats has distinctly
higher species richness. Instead it appears that the combination of the three habitats underpins high lemur
species richness at Ambatovy. The azonal and other forest habitats that will be cleared during mine
construction are not required for the survival of critically endangered or endangered species, since each
lemur species found at Ambatovy is also present outside the mine area. However, the azonal forest
habitats, including the forest assemblage composed of the azonal, transitional and zonal habitats, appear
to favour the presence of lemur species biodiversity, with 16 species identified in the mine area compared
with 6 to 10 species (depending on location) in the forest corridor (Schmid and Alonso 2005)
Post-impact mitigation
By excluding post-impact MITIGATION, the results remain conservative. When rehabilitation (as a mitigation
measure) is considered, the habitat hectares losses are decreased by 50% within a 30 year period and there
is a trend in the decrease of the habitat hectares loss using this mitigation strategy. It is important to note that
the absence of a temporal parameter that integrates post-impact mitigation in the habitat hectares calculation
may mask a project’s success over time in reducing habitat hectares loss.
Pipeline(Zonal ) 0.33%
Azonal53.08%
Transitional20.46%
Zonal26.13%

The Offset Design Process 45
BBOP Pilot Project Case Study – Ambatovy Project
0
200
400
600
800
1000
1200
1400
1600
1800
0 5 20 40 75 90
Post-project mitigation level (%)
Hab
itat
hec
tare
s lo
ss
0
200
400
600
800
1000
1200
1400
1600
1800
0 5 20 40 75 90
Post-project mitigation level (%)
Hab
itat
hec
tare
s lo
ssTable 8: Biodiversity loss calculations scenarios at impact site and effect of post-impact remediation
Habitat type – forestPercentage of attributes rehabilitated
YearHABITAT HECTARES loss
0% 0 (without mitigation) 1,168
5% 0 – 7 1,110
20% 7 – 15 934
40% 15 – 30 701
75% 30 – 60 292
90% 60 – 120 117
For the forest habitat, the results show a significant difference for the varying levels of post-impact mitigation.
However, in order to obtain a more realistic assessment of the post-impact condition, the Project considered
the influence of forest rehabilitation on the habitat hectares loss numbers over time. Although the temporal
factor is not considered in the habitat hectares loss calculations, a basic simulation was designed that
integrated basic forest regeneration activities and specific ecosystem dynamics in the context of the Ambatovy
forests. There are four essential steps in forest regeneration:
1. Erosion control (involves engineering, addition of organic matter and water control).
2. Planting of heliophytes species (including native and potentially some non-natives).
3. Planting of native tolerant species to increase ground cover.
4. Assisted natural succession of native species.
The inclusion of post-impact rehabilitation based on these activities shows a distinct decrease in the habitat
hectares loss score over time, due to forest regrowth patterns and increases in the values of attributes
(Pearson correlation R2 = -0.98 p< 0.001, n = 6; see Graph 1).
Graph 1: Post-impact mitigation influence on biodiversity loss for forest habitats at IMPACT SITE

The Offset Design Process 46
BBOP Pilot Project Case Study – Ambatovy Project
It is important to note reforestation of the azonal forest area will create zonal type forest, with some azonal
influences arising from the use of backfill originating in the azonal areas (which has specific geochemistry and
broken ferricrete crust and pisolitic iron). Complete restoration to azonal habitat is deemed impossible due to
its strong links with the removed ground structure and geochemistry.
To improve the basic simulation discussed above, the Project will collect available rehabilitation data for
Madagascan lateritic soils and the eastern domain. This will enable the refinement of reforestation predictions.
Based on Madagascan forestry experience, it is estimated that at 30 years forests will begin to offer a habitat
that can be exploited by lemurs and other important taxa, for both food and shelter. The closure biodiversity
programme will include monitoring of priority taxa in these rehabilitated areas to define the rate of
recolonisation. Irrespective of improvements in the model, continuing care in integration of rehabilitation data
in the loss calculations will be necessary due to:
1. Limitations in the availability of specific information on Malagasy forests rehabilitation success rates;
2. The specificity of the Ambatovy mine site forests and overall associated uncertainties; and
3. The risk that lower success rates may occur despite improved confidence in predictions.
Consequently, the Project may decide to take a more precautionary approach and retain conservative habitat
hectares scores to ensure that NO NET LOSS is not undermined by an undersized offset design.
7.3.6 Step 6: Review potential offset locations and activities and assess the biodiversity gains which could be achieved at each
Identifying offset options
Preliminary surveys of offset candidate sites were undertaken in 2005 (see Appendix 6, Survey for Off-site
Azonal Outcrops (in French)) with the objective of identifying potential in-kind type offsets. The surveys were
based on geological, substrate, altitude and forest structure similarities (see Figure 9, showing correlation
between the EVC (azonal, transitional and zonal), substrate and topography) and comprised:
A desk study using geological maps to identify ultramafic outcrops and satellite imagery for remaining
forest cover.
Aerial (plan) reconnaissance survey to confirm the presence of forest cover and rapid visual integrity
assessment; the survey had to be conducted by air, due to the absence of road infrastructure and general
remoteness of the areas. Two potential candidate sites (of 14 initially identified – see Figure 8) were
chosen based on forest integrity and surface area.
Aerial (helicopter) reconnaissance survey and walk over ground survey of potential candidate sites
(Vohimenakely and Ankerana). Vohimenakely, located northwest of Zahamena National Park appeared to
have azonal characteristics but was very small (<10 ha) and highly disturbed. Thus, this location has some
potential for off-site purposes, but it is not highly regarded because of its small size and relatively poor
condition. Ankerana, located northeast of Mantadia National Park is the best potential off-site azonal
vegetation area among those visited. It had the general appearance of Analamay, although the presence
of ferricrete could not be confirmed from the air. It appeared a reasonable size (>500 ha) and with no signs
of disturbance (see Photograph 1).
A ground-level vegetation survey at selected candidate site (Ankerana) to determine if it has similar habitat
and floristic (see Photograph 2) characteristics as at Ambatovy and Analamay. The preliminary comparison
of the Ankerana area with Ambatovy / Analamay is presented in Appendix 7. Ankerana had previously and
independently been identified by the Missouri Botanical Garden – Madagascar (a Project partner) as a

The Offset Design Process 47
BBOP Pilot Project Case Study – Ambatovy Project
potential conservation area based on its floral assemblages. Overall, many similarities were noted in the
physical, climatic and biological characteristics compared to Ambatovy / Analamay, supporting the
hypothesis that Ankerana can be considered ‘IN-KIND’ relative to the Ambatovy azonal habitats. Additional
work to verify these similarities is required and planned for 2009.
Figure 8: Ankerana offsite offset area location and other candidate sites surveyed by the Project, in
relation to the Ambatovy mine area

The Offset Design Process 48
BBOP Pilot Project Case Study – Ambatovy Project
Figure 9: Correlation between EVC (azonal, transitional and zonal), substrate and topography
Photograph 1: Ankerana aerial view
Photograph 2: Ankerana azonal habitat

The Offset Design Process 49
BBOP Pilot Project Case Study – Ambatovy Project
Quantifying gains of offset options
The detailed quantification of potential offset GAINS has not yet been conducted. Rough estimates of gains
have been prepared based on mapping data and the surface areas that would be protected:
1. Ankerana offset site (see Figure 10): the Ankerana offset has a total surface area of approximately 11,600
ha, consisting of a 4,600 ha core conservation area and a 7,000 ha multiple use buffer area surrounding
the core. The site lies within the area planned for inclusion in the Malagasy protected area system (SAPM).
Consequently, the Project funding is being designed to ensure that any biodiversity offset offers
conservation ADDITIONALITY. The field surveys to characterise species, habitats and ecosystems at the
proposed offset site will be conducted in 2009, allowing calculation of the habitat hectares gains. Based on
the preliminary survey conducted during the ESIA, the Project is confident that the KEY BIODIVERSITY COMPONENTS identified at Ambatovy (species, habitats and ecosystem) can be found at Ankerana,
although Ambatovy species assemblages may not all be present at Ankerana. It is important to note that
this issue justifies the conservation of the two on-site azonal forest tracts (the mine area conservation
zones). The forest will form part of the on-site offset component. The on-site offset includes all forest
habitats present on the mine footprint, including two azonal forest areas (one being the Project’s
BENCHMARK site). Therefore it is acceptable to assume that all key biodiversity components are present in
the on-site offset.
2. On-site azonal habitat conservation sites (see Figure 4): the azonal forest surface area equals 212.33 ha
(26.4% of the total prime quality habitat; the azonal habitat remaining outside the mine footprint is all
pristine).
3. Management of mine area forests (see Figure 3): the Ambatovy offset programme includes the 4,900 ha
conservation zones forest around the mine footprint; the azonal conservation zones noted above are
located within this area. The Project aims to reinforce the legally protected status of these forests to ensure
their continued protection following mine closure. Their current protection is ensured by the mine Forest
Management Plan, since most of the forest areas are within the mine lease where the Project has
exclusive management rights. The Project is also currently discussing with Conservation International the
regional integration of its on-site offset.
4. Mine area / Ankeniheny-Zahamena Corridor link (see Figure 11): the forest corridor between the mine area
conservation zones forest and the rest of the eastern rain forest corridor is a key component in ensuring
CONNECTIVITY between these two areas. The corridor concept has been integral to the Project’s species
management strategies (particularly for lemurs). The exact boundaries have not yet been defined, but are
likely to enclose about 2,500 ha. The Project is also currently discussing with CI the regional integration
and protection of this forest corridor to ensure its connection with the relic Ankeniheny-Zahamena Corridor
and the SAPM protected areas (e.g. Mantadia National Park).
5. Torotorofotsy Ramsar site management (see Figure 11): the total surface area of this site’s watershed is
8,500 ha of which 1,100 ha is wetland. However, results of recent surveys led by Ambatovy indicate that
the ecological integrity of the overall area has been several degraded, resulting in reduced gains for
biodiversity. The true gains will be quantified based on analysis of the survey results.
6. FOREST CONNECTIVITY CAZ (see Figure 11): the total area of zonal forest lost to the pipeline right of way will
be reforested (so a gain of 16.5 ha, the first 2 km reforested route being integrated with the mine). The
exact surface area to reforest for the CAZ connection has yet to be determined, but may be around 200 ha.
7. Footprint rehabilitation: the total surface area of the mine footprint will be rehabilitated, of which a majority
will be reforested (approximately 1,336 ha).

The Offset Design Process 50
BBOP Pilot Project Case Study – Ambatovy Project
Figure 10: Ankerana map
Figure 11: Mine area and Analamay-Mantadia forest corridor, allowing link between on-site offset and
forest corridor

The Offset Design Process 51
BBOP Pilot Project Case Study – Ambatovy Project
Comparative analysis of offset options
A comparative analysis of offset options was conducted during the site selection process (as noted above).
Results are presented in Appendix 6 (in French).
7.3.7 Step 7: Calculate offset gains and select appropriate offset locations and activities
Finalising offset sites and activities
The habitat hectares gain score for the offset sites has yet to be calculated, as detailed forest structure and
species attribute quantitative data need to be obtained for the Ankerana and other offset sites. This will take
place as soon as the stakeholder consultation process is completed. As the Ankerana site is considered ‘in-
kind’ with the Ambatovy azonal habitats, the same benchmark will be used to calculate gains. A detailed
BASELINE STUDY of the Ankerana offset will be conducted in 2009 to check the offset site for the presence and
suitability for all the key biodiversity components identified at the impact site and to support the gain score
calculations.
The plan for the Ankerana offset will include a core conservation area, surrounded by a multiple use area to
ensure social integration of the offset and thus its sustainability in the context of local community support.
The principle of pursuing an offset was established in 2004. However, the offset was not fully established
before the Project’s impacts began occurring in May 2007 (the date that mine forest clearance began). The
Project must thus still determine whether the temporal loss is critical or not (i.e. that any biodiversity
component cannot be offset because of impacts in the period before the offset is created). However, the
Project is confident that this is not the case for any of the taxa present; especially for very sensitive species
such as Mantella aurantiaca and Mantella crocea (whose habitats will not be disturbed for at least 10 years,
when Analamay will be cleared for mining). With respect to lemurs, a short-term and long-term trend
assessment programme (Lemur Viability Assessment Programme) is underway for all priority species (IUCN
CR and EN species). However, even though the temporal loss will not compromise the success of the offset,
the offset design does plan to take it into account. Conventionally, this could be done through application of a
MULTIPLIER and TIME DISCOUNTING (the concept that 1 habitat hectare delivered accruing in 10 years time has
only a fraction of that value at the present time). The Project will explore and define a methodology and apply
it to the next iteration of loss and gain calculations in 2009, taking into consideration that the main impacts will
be spread over a period of approximately 20 years, while the offset could be in place much earlier.
7.3.8 Step 8: Record the offset design and enter the offset implementation process
The Ankerana offset design and other components of the offset have not yet been finalised, thus the
implementation process has not formally begun. The Project will finalise the offset design, using BBOP
guidance, during the course of 2009. A summary of the management plan will be presented in subsequent
case study revisions. However, a brief description of the progress made to date is presented below:
Stakeholder consultations: the Project has pursued stakeholder consultations, ensuring through a
participatory process that the offset can be integrated into national, regional and local plans and that
feedback is taken into account in the offset design and the development of multiple use zones.
Legal protection: the Ankerana forest was under temporary protection status until the end of 2008. The
Project requested that this protection status be prorogated (continued) until the final Ministerial Protection
Decree is finalised and made law (planned for July 2009).

The Offset Design Process 52
BBOP Pilot Project Case Study – Ambatovy Project
Boundary definition: delimitation of the Ankerana offset boundaries (see Figure 10). The mapping has been
presented to the local communities, regional authorities and partner NGOs. Several awareness campaigns
have enabled presentation of this information to remote habitations around the proposed offset site. The
campaigns will be repeated twice per year at key periods i.e. before and during the traditional clearing
period (with police enforcement against passing the boundary). Results if the campaigns to date indicate
that Ankerana has been extremely isolated for a long time and people had no idea of forest laws restricting
forest clearance.
Zoning: the current land uses have been described and will be integrated with the offset design in 2009.
Reforestation activities: continuation of reforestation on the periphery of the proposed offset; this has
focused mainly on planting construction wood to avoid primary forest logging in the core offset area.
Support (financial and logistic) for updating of the Marserana commune’s five year Communal
Development Plan. This commune covers the offset area. Discussions with a second commune,
Andahamana have begun; this commune includes a small fraction of the offset area and will also be
assisted with updating of its five year plan.
Integration of Ankerana with the SAPM: a technical committee meeting with SAPM was used to discuss
the integration of the offset site into the national protected areas network.

53
BBOP Pilot Project Case Study – Ambatovy Project
8. Implementation Plan and Long-term Management
The team plans to complete the design of the offset implementation plan by the end of 2009, with the
Ankerana and other offset sites’ gain calculated in early 2010 and thus the final offset design completed at
that point. The Ministerial Protection Decree should be ready by June 2009, thus allowing the Project to
legally implement the management of the core and multiple use buffer area of the Ankerana part of the offset.
While the ESIA stated the Project’s commitment to establish a biodiversity offset at Ankerana, no timing
commitment was made. The offset establishment is therefore assumed to be in line with the Project’s
temporal goals. The Project is establishing the offset to last the Project’s lifetime of 30 years and beyond. The
establishment of a Ministerial Protection Decree is underway and the financing mechanisms are being
discussed. Actions and timings are summarised in Figure 12.
Figure 12: Actions and timings (2004-onwards)
The Project will have the responsibility of ensuring the management of the Ankerana site. Actual site
protection and local management will likely be entrusted to an NGO. The exact mode of financing has not yet
been defined precisely. An in depth financial assessment will be conducted to determine the most viable
means of ensuring long term financial revenue to support site protection.

54
BBOP Pilot Project Case Study – Ambatovy Project
9. Summary of Offset Process Costs
The Ambatovy Project BBOP programme component is part of the Project’s Biodiversity Programme (itself
part of the Environmental Programme). Specific activities are designed, budgeted and implemented. Offset
design and early implementation cost estimates are presented in Table 9.
Table 9: Summary of estimated costs
Human resources Staff TasksCosts (man
days per annum*)
Cost for 2008, 2009 (USD)
Project focal point : Pierre Berner (Ambatovy Project Environmental Director)
1 Ensure communication / meetings (international) with BBOP committee and management of overall Ambatovy BBOP programme.
24
Superintendent responsible for Ankerana site: monsieur Alphonse (Ambatovy Project)
1 Ankerana off-site offset management. Spearheading legal protection status programme with governmental and local STAKEHOLDERS. Supervising financial arrangements for programme’s long term viability.
36
Superintendent responsible for Special Programs: Irene Daso (Ambatovy Project)
1 Support Project focal point. Liaising with local and international stakeholders (e.g. CI).
12
Environmental Coordinator for Ankerana (Sylvain Be Totozafy)
1 Ensuring local stakeholder involvement. Supervising Ankerana zoning (core / buffer / inhabited areas). Awareness campaigns.
132
Technical support team Ankerana management:
Environmental Forest Technician (to be filled)
Environmental Community Agent (to be filled)
Guest house manager (to be filled)
3 Ankerana Forest and community management. 264 (currently one staff member)
BBOP programme management: Steven Dickinson (Golder Associates)
1 Managing overall BBOP design, including benchmark / loss / gain calculations.
36
BBOP design ecological assessment: Aristide Andrianarimisa (WCS)
1 Conducting benchmark / loss / gains calculations and overall ecological assessments.
140

Summary of Offset Process Costs 55
BBOP Pilot Project Case Study – Ambatovy Project
Human resources Staff TasksCosts (man
days per annum*)
Cost for 2008, 2009 (USD)
BBOP external auditing progress reports: JonEkstrom (TBC)
(1) Carry out a technical peer review of the Ambatovy offset (e.g. benchmark, losses and gain calculation).
2
TOTALS 9 646 560,000
* based on 2008 man days
The average annual operational costs are in the process of being established and are estimated to be in the
range US$ 250,000 – 300,000 per annum.
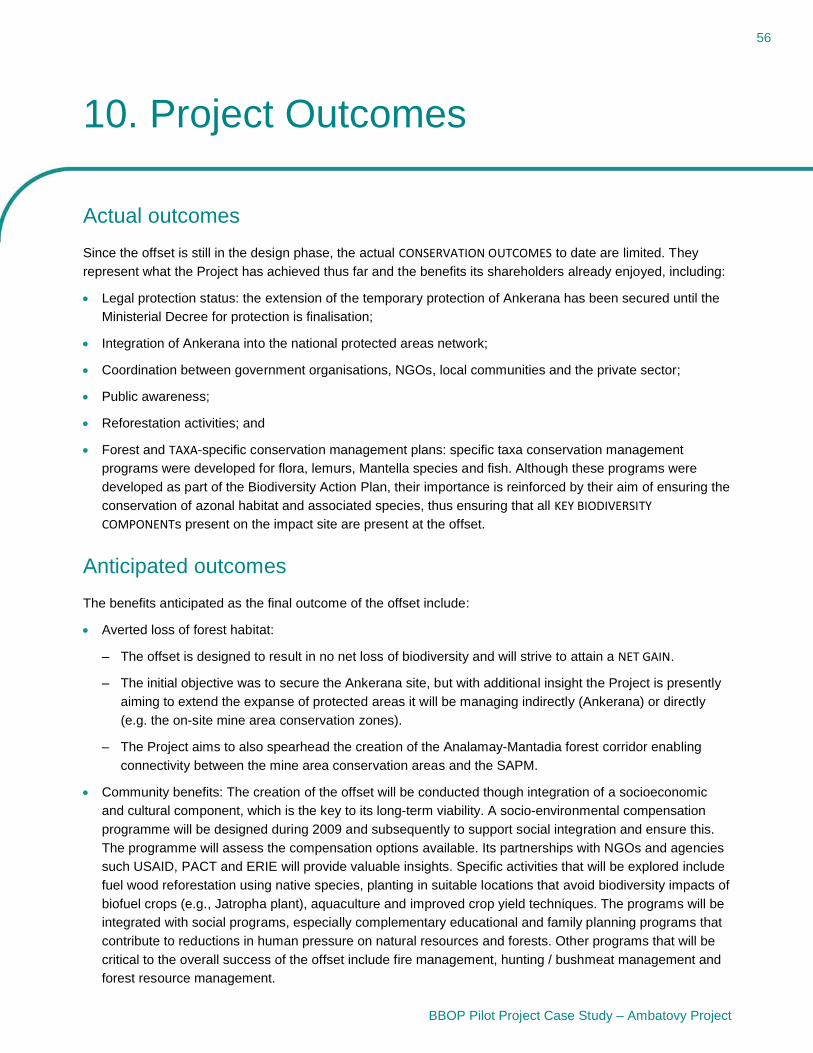
56
BBOP Pilot Project Case Study – Ambatovy Project
10. Project Outcomes
Actual outcomes
Since the offset is still in the design phase, the actual CONSERVATION OUTCOMES to date are limited. They
represent what the Project has achieved thus far and the benefits its shareholders already enjoyed, including:
Legal protection status: the extension of the temporary protection of Ankerana has been secured until the
Ministerial Decree for protection is finalisation;
Integration of Ankerana into the national protected areas network;
Coordination between government organisations, NGOs, local communities and the private sector;
Public awareness;
Reforestation activities; and
Forest and TAXA-specific conservation management plans: specific taxa conservation management
programs were developed for flora, lemurs, Mantella species and fish. Although these programs were
developed as part of the Biodiversity Action Plan, their importance is reinforced by their aim of ensuring the
conservation of azonal habitat and associated species, thus ensuring that all KEY BIODIVERSITY COMPONENTs present on the impact site are present at the offset.
Anticipated outcomes
The benefits anticipated as the final outcome of the offset include:
Averted loss of forest habitat:
– The offset is designed to result in no net loss of biodiversity and will strive to attain a NET GAIN.
– The initial objective was to secure the Ankerana site, but with additional insight the Project is presently
aiming to extend the expanse of protected areas it will be managing indirectly (Ankerana) or directly
(e.g. the on-site mine area conservation zones).
– The Project aims to also spearhead the creation of the Analamay-Mantadia forest corridor enabling
connectivity between the mine area conservation areas and the SAPM.
Community benefits: The creation of the offset will be conducted though integration of a socioeconomic
and cultural component, which is the key to its long-term viability. A socio-environmental compensation
programme will be designed during 2009 and subsequently to support social integration and ensure this.
The programme will assess the compensation options available. Its partnerships with NGOs and agencies
such USAID, PACT and ERIE will provide valuable insights. Specific activities that will be explored include
fuel wood reforestation using native species, planting in suitable locations that avoid biodiversity impacts of
biofuel crops (e.g., Jatropha plant), aquaculture and improved crop yield techniques. The programs will be
integrated with social programs, especially complementary educational and family planning programs that
contribute to reductions in human pressure on natural resources and forests. Other programs that will be
critical to the overall success of the offset include fire management, hunting / bushmeat management and
forest resource management.

Project Outcomes 57
BBOP Pilot Project Case Study – Ambatovy Project
Improved communication: information available to international NGOs did not reflect the full scale of works
conducted in the field by the Project. The reason was linked to rather limited communication efforts by the
Project, which was subsequently ramped up. The high velocity of Project implementation has been
generally overwhelming for most NGOs, who felt they needed a deeper involvement with the Project. Such
aspects were discussed in detail with CI, Forest Trends and WCS in November 2008. The Project will
present and implement its communication strategy on biodiversity management and BBOP activities in
2009. The offset programme is not yet mentioned as a standalone project on the Sherritt web site, however
it is mentioned on the Environmental Assessment documents (page 12), available at:
http://www.sherritt.com/doc08/subsection.php?submenuid=operations&category=operations/metal
s_ambatovy.
A specific web page will ultimately describe in detail the biodiversity offset process and activities, including
this case study and subsequent, updated versions of it.
Stakeholder confidence: the Project hopes to increase and consolidate the confidence of the public
(government, NGOs, authorities and the public at large) and private partners, (banks) and demonstrate its
commitment to sustainability. This is strongly linked to both the communication effort and compliance
activities. The governmental authorities and local communities are aware of, and have taken part in, the
offset activities. Project partners and lender banks have monitored the progress of the offset programme
through quarterly audits and bi-annual biodiversity audits.
Significant scientific knowledge will be obtained through biological surveys (which underpin the loss and
gain calculations), especially at Ankerana, where studies have been limited despite the description of these
ultramafic outcrops as biodiversity hotspots. The Project intends to prepare external publications of its
biodiversity management programs, especially for MITIGATION in high biodiversity areas, possibly setting a
precedent for other mining projects in Madagascar. A publication, likely a monograph of both the impact
and offset sites, will be produced in collaboration with scientific partners. An article on the Project was
provided to the CBD newsletter Business 2010 in April 2008 (www.cbd.int/doc/newsletters/news-biz-
2008-04/).
Forest restoration: the reforestation activities include targeted reforestation with native species to improve
connectivity around the Ankerana offset site and between it and the remaining forest corridor; similar
programs exist around the mine and the pipeline component.
Taxa-specific conservation: species taxa conservation management programs will be developed for key
taxa such as lemurs, Mantella spp., flora and fish, on the same basis as those developed at the mine site.

58
BBOP Pilot Project Case Study – Ambatovy Project
11. Lessons Learned
The main lesson learned to date (during the offset conceptualisation and design stages) is that a commitment
to implement a biodiversity offset can generate substantial interest and respect from third parties for the
Project developer in tandem with delivering real and measurable benefits for biodiversity. The ‘NO NET LOSS’
offset represents a strong and positive vision that allows the Project to present its mitigation programme
elegantly and coherently to third parties.
The main difficulties encountered to date have been:
While beneficial, the BBOP guideline development process has been lengthy, dense and not always
readily applicable to the Ambatovy Project. However, the Project feels privileged to continue with its
contribution to the improvement of the offset design tools though its feedback.
The integration of biodiversity offsets at the ESIA stage is also crucial if baseline data collection is to:
– Prioritise target species with high biodiversity value for the Key Biodiversity Components Matrix;
– Target sampling stations to ensure that a benchmark is identified;
– Ensure loss and gain sites are adequately covered; and
– Ensure that quantitative data is gathered for the HABITAT HECTARES calculations.
Ideally, the offset calculations for LOSSES and GAINS should have been completed before Project construction
began, in order to alleviate the risk of being confronted with a low gains score. Greater targeting of baseline
data collection during the ESIA would have helped reduce the cost and time associated with subsequent filling
of data gaps.
11.1 Limitations
Limitations and issues identified during the habitat hectare calculations are presented below.
11.1.1 Available data
The main limitation for the Ambatovy Project offset design is that only azonal forests were sufficiently
sampled for habitat structure ATTRIBUTES. Fewer data exist for zonal and transitional habitats. In addition,
more accurate improved diversity and abundance data were required for species (especially lemurs and
other taxa) in both the benchmark and impact areas. Obtaining these data in 2009 should improve
precision of the habitat hectares loss calculation.
No available data exist at present for the selected attributes at the proposed Ankerana offset site. This
means that offset gains cannot yet be calculated.
Some of the existing data were not sufficiently habitat specific to meet the requirements of the habitat
hectares calculations. The fauna data did not allow the species identified to be clearly linked to either the
three ecological vegetation classes (azonal, transitional and zonal) or the habitat CONDITION classes. The
January 2009 fauna surveys will aim to resolve this.

Lessons Learned 59
BBOP Pilot Project Case Study – Ambatovy Project
11.1.2 Averaging
Averaging of attribute values was necessary in the habitat hectares calculation in order to avoid overly
conservative results and to reflect the reality of conditions on the ground. However, it is commonly recognised
that by calculating averages of vegetation parameters within a large area, habitat heterogeneity and its
variations, which are the key elements for microclimate and ecological processes, are masked (Whittaker et
al. 1974; Parkes et al. 2003). This approach thus limits the impact of variability on the calculation. While the
variation is small-scale, considering its effects is important.
11.2 Recommendations
1. Integrate a temporal parameter to the post-Project impact in the habitat hectares calculation in order to
show the Project’s success through time in reducing habitat hectares loss. This aspect is important for time
discounting (i.e. delay of offset creation and delivery of ultimate habitat hectares gain, see Step 7).
2. Averaging of contiguous HABITAT TYPES as far as habitat classes is optimal as it best reflects the reality of
conditions in the impact area.
3. Tools are based merely on numerical data that might not always have a biological and / or ecosystem
health significance. It is important to assess how to integrate biodiversity qualitative data (like ENDEMISM,
only presence / absence etc.) with the habitat hectares calculation.
4. There is a need for a ‘Weighting Guideline’ to guide the operator in weighting attributes, since this will
ultimately affect the scoring.
5. SPECIES DIVERSITY and other fauna attributes should be used (e.g., lemur and herpetofauna) as often as
possible to better reflect true biodiversity values (as opposed to forest structural SURROGATES).
6. The Project should design its data acquisition programs at the ESIA stage (baseline collection) to ensure it
meets the habitat hectares calculation requirements in an optimal fashion (e.g. fauna, flora, aquatics
sample sites linked with all main vegetation types likely to be impacted, as well as their condition classes –
for example, good / disturbed).

60
BBOP Pilot Project Case Study – Ambatovy Project
12. Next Steps
The next steps for the Ambatovy offset team are presented below:
1. Habitat hectares loss scores:
a. Integrate the IMPACT SITE and benchmark terrestrial fauna data being gathered in January 2009,
integrate Mantella aurantiaca and M. crocea data that is being acquired for these two key species as
part of the Mantella Management Programme during 2009, re-evaluate the fish and aquatic (stream
and ponds) data to adequately integrate with the KBCM; this will imply reassessing the weighting of
the attributes generally, giving more importance to the species attributes to better reflect BIODIVERSITY LOSS values.
b. Re-calculate habitat hectares loss scores for the impact site, for each forest habitat type (azonal,
transitional and zonal), aquatic ecosystems (streams and ponds) and condition class.
2. Habitat hectares gain scores:
a. Prepare and implement the habitat, flora, fauna and aquatics BASELINE data collection at the proposed
Ankerana offset site.
b. Calculate habitat hectares gains scores for the variety of POTENTIAL OFFSET SITES (e.g. contiguous with
the mine footprint, the Analamay-Mantadia Corridor and the Ankerana offset site), for each forest
habitat type (azonal, transitional and zonal), aquatic ecosystems (streams and ponds) and condition
class.
3. Socio-environmental losses and compensation calculations:
a. Apply cost-benefit model and analysis using key elements of the BBOP BIODIVERSITY OFFSET COST-BENEFIT HANDBOOK to determine the ecosystems services to the local communities in and around
Ankerana as well as the mine site (COMPOSITE OFFSET).
b. Determine socio-environmental compensations required, including compensations options; the Project
will distinguish between legal and illegal activities specifically (the latter being obviously recognised by
local legislation as unsustainable).
c. Design and implement a compensation programme.
4. Offset management programme:
a. In light of both the biodiversity and socio-environmental inputs, the Project will finalise the design of
the Ankerana (and mine site) management programs.
b. The Project will implement and monitor the implementation of the programs.

Next Steps 61
BBOP Pilot Project Case Study – Ambatovy Project
5. Legal protection status:
a. The Project will pursue the finalisation of the Ministerial Protection Decree for Ankerana and creation
of a protection status for the mine area conservation zones forests; the status of other offset
programme components (Analamay-Mantadia Corridor, Ramsar site) will also be pursued in
collaboration with the Project’s partners (CI).
b. The Ankerana offset jurisdictional protection status is being finalised with Malagasy authorities with its
integration in the National Park network, in order to ensure the long-term protection status of the site
from a legal perspective.
6. Other activities:
a. The Project will be pursuing the implementation of its MITIGATION HIERARCHY strategy, namely through
the Biodiversity Action Plan and the taxa-specific management programmes for lemurs, Mantella, fish
and flora.

62
BBOP Pilot Project Case Study – Ambatovy Project
13. References
Benstead, J.P., De Rham, P.H., Gattolliat, J.-L., Gibon, F.-M., Loiselle, P.L.V., Sartori, M., Sparks, J.S. and
Stiassny, M.L.J. 2003. Conserving Madagascar’s Freshwater Biodiversity. Bioscience 53 (11): 1101-1111 [see
Appendix 3].
Dufils, J.-M. 2003. Pact Madagascar (see http://www.pactworld.org/cs/africa/madagascar).
Ganzhorn, J.U., Andrianasolo, T., Andrianjazalahatra, T., Donati, G., Fietz, J. et al. 2007. Lemur in evergreen
littoral forest fragments. In Biodiversity, Ecology and Conservation of Littoral Ecosystem in Southeastern
Madagascar, Tolagnaro (Fort Dauphin). Serie editor Alfonso Alonso. SI/MAB Serie # 11. Smithsonian
Institution, Washington DC. USA [see Appendix 3].
Grooves, C. 2000. The genus Cheirogaleus: unrecognized diversity in dwarf lemurs. International Journal of
Primatology, 21 (6): 943-962 [see Appendix 3].
International Council on Mining and Metals (ICMM). 2006. Good Practice Guidance for Mining and
Biodiversity. ICMM, 19 Stratford Place, London W1C 1BQ, United Kingdom.
International Council on Mining and Metals (ICMM). 2008. Planning for Integrated Mine Closure: Toolkit,
ICMM, 19 Stratford Place, London W1C 1BQ, United Kingdom.
International Finance Corporation (IFC). 2006. Performance Standard 6, Biodiversity Conservation and
Sustainable Natural Resource Management, World Bank Group.
ten Kate, K., Bishop, J., and Bayon, R. 2004. Biodiversity offsets: Views, experience, and the business case.
IUCN, Gland, Switzerland and Cambridge, UK and Insight Investment, London, UK. ISBN: 2-8317-0854-0.
Kattan, G.H. 1992. Rarity and vulnerability: The Birds of the Cordillera Central of Colombia. Conservation
Biology 6 (1): 64-70.
Kleynhans, C.J. 1996. A qualitative procedure for the assessment of the habitat integrity status of the Luvuvhu
River (Limpopo System, South Africa). J. Aquat. Ecosystem Health 5: 41-54 [see Appendix 3].
Kleynhans, C.J. 1999. Comprehensive Habitat Integrity Assessment. In: Water Resources Protection. Policy
Implementation. Resource Directed Measures for Protection of Water Resources. River Ecosystems. Version
1 Department of Water Affairs and Forestry [see Appendix 3].
Meyers, N., Mittermeier, R.A., Mittermeier, C.G., Fonseca, G.A.B da and Kent, J. 2000. Biodiversity hotspots
for conservation priorities. Nature 403: 853–858 [see Appendix 3].
Parkes, D., Newell, G. and Cheal, D. 2003. Assessing the quality of native vegetation: the ‘habitat hectares’
approach. Ecological Management and Restoration 4, S29-S38.

References 63
BBOP Pilot Project Case Study – Ambatovy Project
Rabinowitz, D.S., Cairns, S. and Dillon, T. 1986. Seven forms of rarity and their frequency in the flora of the
British Isles. In Soulé, M. E. (eds.). Conservation biology: the science of scarcity and diversity. Sinauer
Associates, Sunderland, Massachusetts.
Rakotoarison, N., Zimmermann, H., & Zimmermann, E. 1997. First discovery of the hairy-eared dwarf lemur
(Allocebus trichotis) in a higland rain forest of eastern Madagascar. Folia Primatologica 68 : 86-94 [see
Appendix 3].
Schmid, J. and Alonso, L.E. (eds). 2005. A rapid biological assessment of the Mantadia-Zahamena Corridor,
Madagascar. RAP Bulletin of Biological Assessment No. 32. Conservation International. Washington, D.C.).
Watson, J. E. 2007. Conservation of Bird Diversity in Madagascar Southeastern Littoral forest [see Appendix
3].
Whittaker, R.H., Bormann, F.H., Likens, G.E. and Siccama, T.G. 1974. The Hubbard Brook Ecosystem Study:
forest biomass and production. Ecol. Monogr. 44(2):233-254.

64
BBOP Pilot Project Case Study – Ambatovy Project
Appendix 1: Key Biodiversity Components Matrix (KBCM) and Habitat Hectares Score, December 2008 Iteration

Appendix 1: Key Biodiversity Components Matrix (KBCM) and Habitat Hectares Score, December 2008 Iteration 65
BBOP Pilot Project Case Study – Ambatovy Project
Key Biodiversity Components Matrix
Global National Local Site Endemic Localized Widespread
MAMMALSProsimans (primates)Allocebus trichotis DD X Ecotourism, illegal bush meat, CITES I TabouAvahi laniger LC X Ecotourism, illegal bush meat, CITES ICheirogaleus crossleyi DD X Ecotourism, illegal bush meat, CITES ICheirogaleus major LC X Ecotourism, illegal bush meat, CITES IDaubentonia madagascariensis NT X Ecotourism, illegal bush meat, CITES IEulemur fulvus fulvus NT X Ecotourism, illegal bush meat, CITES I, pet tradeEulemur rubriventer VU X Ecotourism, illegal bush meat, CITES IHapalemur griseus griseus VU X Ecotourism, illegal bush meat, CITES IIndri indri EN X Ecotourism, illegal bush meat, CITES I Tabou Existence of illegal bush meat for all these lemur speciesLepilemur microdon DD X Ecotourism, illegal bush meat, CITES ILepilemur mustelinus DD X Ecotourism, illegal bush meat, CITES IMicrocebus lehilahytsara DD X Ecotourism, illegal bush meat, CITES IMicrocebus rufus LC X Ecotourism, illegal bush meat, CITES IProlemur simus CR X Ecotourism, illegal bush meat, CITES I Ecological services: main seeds disperseurs Propithecus d. diadema EN X Ecotourism, illegal bush meat, CITES I Ecological services: main seeds disperseurs Varecia v. variegata CR X Ecotourism, illegal bush meat, CITES ICarnivoresCryptoprocta ferox VU X Ecotourism, illegal bush meatFossa fossana NT X illegal bush meatGalidia elegans LC X illegal bush meatSmall mammalsBrachytarsomis albicauda NE X illegal bush meat symbiotic to Allocebus trichotisEliurus minor LC X illegal bush meatEliurus tanala LC X illegal bush meatEliurus webbi LC X illegal bush meatMicrogale cowani LC X illegal bush meatMicrogale drouhardi LC X illegal bush meatMicrogale majori LC X illegal bush meatMicrogale thomasi LC X illegal bush meatMyotis goudoti LC X illegal bush meat
BIRDSAccipiter henstii NT X pet trade, CITES IIAccipiter madagascariensis NT X pet trade, CITES IIAcridotheres tristis NE XAgapornis cana cana LC X pet trade, CITES IIAlectroenas madagascariensis LC XAnas melleri EN XArdea humbloti EN XAsio madagascariensis LC X pet trade, CITES IIAtelornis pittoides LC XAviceda madagascariensis LC X pet trade, CITES IIBerneria zosterops LC XBernieria cinereiceps NT XBrachypteracias squamigera VU XButeo brachypterus LC XCalicalicus madagascariensis LC XCanirallus kioloides LC XCaprimulgus enarratus LC XCaprimulgus madagascariensis LC XCircus m. macrosceles VU XCopsychus albospecularis LC XCoracopsis nigra nigra LC X pet trade, CITES IICoracopsis vasa vasa LC X pet trade, CITES IICoua caerulea LC XCoua reynaudii LC XCoua serriana LC XCrossleyia xanthophrys NT XCyanolanius madagascarinus LC XDromaeocercus brunneus LC XEurystomus glaucurus LC XFalco eleonorae LC X pet trade, CITES IIFalco newtoni newtoni LC X pet trade, CITES IIFoudia madagascariensis LC XFoudia omissa LC XGallinago macrodactyla NT XHypsipetes madagascariensis LC XLeptopterus chabert LC XLonchura nana LC XLophotibis cristata NT XMargaroperdix madagascariensis LC XMilvus migrans LC X pet trade, CITES IIMystacornis crossleyi LC XNectarinia notata LC XNeodrepanis coruscans LC XNeomixis flavoviridis NT XNeomixis tenella LC XNeomixis viridis LC XNesillas typica LC XNewtonia brunneicauda LC XNinox superciliaris LC X pet trade, CITES IIOtus rutilus rutilus LC X pet trade, CITES IIOxylabes madagascariensis LC XPhilepitta castanea LC XPloceus nelicourvi LC XPolyboroides radiatus LC X pet trade, CITES IIRallus madagascariensis VU XSarothrura insularis NE XSarothrura watersi EN XTylas eduardi LC XTyto soumagnei EN X CITES IVanga curvirostris LC XXenopirostris polleni NT XZosterops maderaspatana LC X
Species
Justification (Insert comments here explaining
data entered in columns A to I)
Biodiversity Assessment
Biodiversity Component
Socioeconomic Values Cultural ValuesSignificance
Irreplaceability(mark only one)
Use ValuesIntrinsic, 'non use' Values

Appendix 1: Key Biodiversity Components Matrix (KBCM) and Habitat Hectares Score, December 2008 Iteration 66
BBOP Pilot Project Case Study – Ambatovy Project
Key Biodiversity Components Matrix
Global National Local Site Endemic Localized Widespread
REPTILESAmphiglossus melenopleura NE XAmphiglossus minutus NE XAmphiglossus mouroundavae NE XAmphiglossus punctatus NE XBrookesia superciliaris NE X pet trade, CITES IIBrookesia therezieni NE X pet trade, CITES IIBrookesia thieli NE X pet trade, CITES IICalumma brevicornis NE X pet trade, CITES IICalumma cf nasuta NE X pet trade, CITES IICalumma crypticum NE X pet trade, CITES IICalumma gastrotaenia NE X pet trade, CITES IICalumma malthe NE X pet trade, CITES IICalumma nasuta NE X pet trade, CITES IICalumma parsoni NE X pet trade, CITES IIEbenavia inunguis NE X pet trade, CITES IIExallodontophis albignaci NE XFurcifer lateralis NE X pet trade, CITES IIFurcifer willsii NE rare X pet trade, CITES IIGeodipsas laphystia NE XItycyphus perineti NE XLeioheterodon madagascariensis NE XLiophidium nov. sp. 1 NE XLiophidium nov. sp. 2 NE XLiophidium rhodogaster NE XLiophidium torquatus NE XLiopholidophis dolicocercus NE XLiopholidophis epistibes NE XLiopholidophis infrasignatus NE XLiopholidophis pinguis NE XLiopholidophis thieli NE XLygodactylus guibei NE XLygodactylus miops NE XMabuya gravenhorstii NE XMadagascarophis colubrinus NE XMicropisthodon ochraceus NE rare XParoedura gracilis NE XPhelsuma lineata bifasciata NE X pet trade, CITES IIPhelsuma lineata lineata? NE X pet trade, CITES IIPhelsuma madagascariensis NE XPhelsuma pronki NE high extinction risk X pet trade, CITES IIPhelsuma pusilla hallmanni NE XPhelsuma quadriocellata bimaculata NE X pet trade, CITES IIPhelsuma quadriocellata quadriocellata NE X pet trade, CITES IIPseudoxyrhopus microps NE XPseudoxyrhopus tritaeniatus NE XSanzinia madagascariensis VU X bushmeat, CITES IStenophis arctifasciatus NE XTyphlops sp. NE XUroplatus phantasticus NE X pet trade, CITES IIUroplatus pieschmanni NE X pet trade, CITES IIUroplatus sikorae NE X pet trade, CITES IIZonosaurus aeneus NE XZonosaurus madagascariensis LC X
AMPHIBIANSAglyptodactylus madagascariensis LC XAnodonthyla boulengeri LC XBlommersia blommersae LC XBlommersia grandisonae LC XBoophis albilabris LC XBoophis boehmei NE XBoophis brachychir NE XBoophis burgeri NE XBoophis cf.burgeri NE XBoophis cf.miniatus NE XBoophis cf.sibilans NE XBoophis erythrodactylus LC XBoophis goudoti LC XBoophis guibei LC XBoophis idae LC XBoophis luteus LC XBoophis madagascariensis LC XBoophis marojezensis LC XBoophis nov. sp. NE XBoophis pyrrhus NE XBoophis reticulatus LC XBoophis sibilans DD XBoophis viridis LC XGephyromantis cf. leucocephala NE XGephyromantis asper NE XGephyromantis boulengeri LC XGephyromantis cf.boulengeri NE XGephyromantis plicifer NT XGuibemantis albolineatus DD XGuibemantis cf. bicalcaratus NE XGuibemantis cf.albolineatus NE XGuibemantis depressiceps LC XGuibemantis flavobrunneus NE XGuibemantis liber LC XGuibemantis tornieri LC XHeterixalus betsileo LC XMantella aurantiaca CR X pet trade, CITES IIMantella baroni NE X pet trade, CITES IIMantella crocea EN X pet trade, CITES IIMantidactylus argenteus LC XMantidactylus betsileanus LC X
Species
Justification (Insert comments here explaining
data entered in columns A to I)
Biodiversity Assessment
Biodiversity Component
Socioeconomic Values Cultural ValuesSignificance
Irreplaceability(mark only one)
Use ValuesIntrinsic, 'non use' Values

Appendix 1: Key Biodiversity Components Matrix (KBCM) and Habitat Hectares Score, December 2008 Iteration 67
BBOP Pilot Project Case Study – Ambatovy Project
Key Biodiversity Components Matrix
Global National Local Site Endemic Localized Widespread
Mantidactylus cf. betsileanus NE XMantidactylus femoralis LC XMantidactylus guttulatus LC XMantidactylus melanopleura LC XMantidactylus opiparis LC XMantidactylus sp. C NE XMantidactylus sp. H NE XMantidactylus zipperi LC XParadoxophyla palmata NE XPlatypelis barbouri LC XPlatypelis cf.barbouri NE XPlatypelis grandis LC XPlatypelis pollicaris DD XPlatypelis sp. (aff. mavomavo) NE XPlatypelis sp.nov NE new undescribed species XPlatypelis tuberifera LC XPlethodontohyla inguinalis LC XPlethodontohyla mihanika LC XPlethodontohyla notosticta LC XPlethodontohyla nov. sp. NE XPlethodontohyla sp. NE XRhombophryne alluaudi LC XRhombophryne coronata VU XRhombophryne coronata VU XScaphiophryne marmorata VU XScaphiophryne spinosa NE XSpinomantis aglavei LC XSpinomantis phantasticus NE XStumpffia sp. "kibomena" NE X
FISHRatsirakia sp nov 1 (Mangoro catchment) NE new undescribed species XRatsirakia sp nov 2 (Berano catchment) NE new undescribed species XRheocles alaotrensis VU XRheocles spp ? (Berano catchment) NE potential new species XRheocles spp ? (Mangoro catchment) NE potential new species X
INSECTSAmblyopone sp. mad-01 NE rare XAmblyopone sp.2 NE rare XArtitropa hollandi NE rare XCerapachys lividus NE rare XCerapachys sp. mad-38 NE rare XCerapachys sp.6 NE rare XCerapachys sp.7 NE rare XCoeliades fidia NE rare XColotis lucasi NE rare XFulda imorina NE rare XHeteropsis andasibe NE rare XHeteropsis paradoxa NE rare XHovala sp. 2 NE rare XMalaza carmides NE rare XMystrium mysticum NE rare XMystrium rogeri NE rare XProceratium sp.1 NE rare XSmerina manoro NE rare XStrabena consobrina NE rare XStrabena dyscola NE rare XStrabena modestissima NE rare XStrabena niveata NE rare XStrabena perroti NE rare XVitsika sp.1 NE rare X
FLORAAdenia acuta rare XAerangis citrata rare X ornementalAerangis fastuosa rare X ornementalAerangis macrocentra rare X ornementalAerangis sp. rare X ornementalAerangis stylosa rare X ornementalAeranthes adenopoda rare X ornementalAeranthes angustidens rare X ornementalAeranthes antennophora rare X ornementalAeranthes ecalcarata rare X ornementalAeranthes fasciola rare X ornementalAeranthes longipes rare X ornementalAeranthes nidus rare X ornementalAeranthes peyrotii rare X ornementalAeranthes sp. rare X ornementalAloe leandrii rare X medicinal valueAmyrea sp patrimonial value X as defined by MBGAngraecum calceolus rare X ornementalAngraecum caricifolium rare X ornementalAngraecum chaetopodum rare X ornementalAngraecum chloranthum rare X ornementalAngraecum compactum rare X ornementalAngraecum danguyanum rare X ornementalAngraecum filicornu rare X ornementalAngraecum finetianum rare X ornementalAngraecum germinyanum rare X ornementalAngraecum graminifolium rare X ornementalAngraecum humblotianum rare X ornementalAngraecum lecomtei rare X ornementalAngraecum linearifolium rare X ornementalAngraecum mauritianum rare X ornementalAngraecum panicifolium rare X ornementalAngraecum pinifolium rare X ornemental
Species
Justification (Insert comments here explaining
data entered in columns A to I)
Biodiversity Assessment
Biodiversity Component
Socioeconomic Values Cultural ValuesSignificance
Irreplaceability(mark only one)
Use ValuesIntrinsic, 'non use' Values

Appendix 1: Key Biodiversity Components Matrix (KBCM) and Habitat Hectares Score, December 2008 Iteration 68
BBOP Pilot Project Case Study – Ambatovy Project
Key Biodiversity Components Matrix
Global National Local Site Endemic Localized Widespread
Angraecum rhynchoglossum rare X ornementalAngraecum rostratum rare X ornementalAngraecum sedifolium rare X ornementalAngraecum setipes rare X ornementalAngraecum sp. rare X ornementalAngraecum teretifolium rare X ornementalAngraecum urschianum rare X ornementalAngraecum viguieri rare X ornementalAntirhea borbonica rare XAsparagus similens X Magical against demonic possessionsAspidostemon conoideum rare XAsplenium nidus patrimonial value X as defined by MBGAsplenium sp patrimonial value X as defined by MBGAsteropeia mcphersonii VU rare X timber for construction, bark = medicinalAstrotrichilia parvifolia rare XBaroniella acuminata rare XBaroniella linearis rare XBathioramnus sp patrimonial value X as defined by MBGBenthamia sp. rare X ornementalBiophytum sp. nov. rare X ornementalBrexia montana rare XBulbomolossus sp1 patrimonial value X as defined by MBGBulbomolossus sp2 patrimonial value X as defined by MBGBulbophyllum alexandrae rare X ornementalBulbophyllum analamazoatrae rare X ornementalBulbophyllum ankaizinense rare X ornementalBulbophyllum aubrevillei rare X ornementalBulbophyllum auriflorum rare X ornementalBulbophyllum baronii rare,patrimonial value X ornementalBulbophyllum complanatum rare X ornementalBulbophyllum coriophorum rare X ornementalBulbophyllum francoisii rare X ornementalBulbophyllum leandrianum rare X ornementalBulbophyllum longiflorum rare X ornementalBulbophyllum lyperocephalum rare X ornementalBulbophyllum molossus rare X ornementalBulbophyllum multiflorum rare X ornementalBulbophyllum occlusum rare X ornementalBulbophyllum occultum rare X ornementalBulbophyllum oxycalyx rare X ornementalBulbophyllum pachypus rare X ornementalBulbophyllum peyrotii rarepatrimonial value X ornementalBulbophyllum platypodum rare X ornementalBulbophyllum rhizomatosum rare X ornementalBulbophyllum sandrangatense rare X ornementalBulbophyllum sp. indet. rare X ornementalBulbophyllum sulfureum rare X ornementalBurasaia sp. nov A rare XByttneria heteromorpha rare XCaesalpinia delphinensis rare XCalantica sp nov. rare XCalophyllum mulvis X Magical against thunderCanarium sp. 2 (egregium) rare XCarallia brachiata X Magical astrologyCarex sphaerogyna rare XCassinopsis sp. nov. rare XCeropegia cf. racemosa rare XChassalia bojeri rare XChassalia leptothyrsa rare XChassalia stenantha rare XCheirostylis gymnochiloides rare X ornementalCirrhopetalum longiflorum rare X ornementalClaoxylon lancifolium rare XClaoxylopsis purpurascens rare XCleistanthus sp. 1 rare XCoffea liaudii rare XCoffea mangoroensis rare, patrimonial value XColea fusca rare XColea sp nov. A rare XCombretum sp. nov. rare XCoptosperma sp. nov. '17' rare XCoptosperma sp. nov. '36' rare XCraterispermum laurinum rare XCroton alceicornu rare XCroton droguetioides rare XCroton lepidotoides rare XCroton sp. cf. jennyanum rare XCroton sp. nov. cf nitidulus 'cinereum' rare XCryptocarya myristicoides rare XCryptocarya pervillei rare XCryptocarya spathulata rare XCryptopus brachiatus rare X ornementalCryptopus paniculatus rare X ornementalCyathea cf tsaratananensis CITES IICyathea dregei X CITES IICyathea hildebrandtii rare XCynanchum moramangense rare XCynorkis angustipetala rare X ornementalCynorkis aurantiaca rare X ornementalCynorkis fastigiata rare X ornementalCynorkis flexuosa rare X ornementalCynorkis gibbosa rare X ornementalCynorkis graminea rare X ornementalCynorkis jumelleana rare X ornementalCynorkis lilacina rare X ornementalCynorkis lowiana rare X ornementalCynorkis purpurascens rare X ornemental
Species
Justification (Insert comments here explaining
data entered in columns A to I)
Biodiversity Assessment
Biodiversity Component
Socioeconomic Values Cultural ValuesSignificance
Irreplaceability(mark only one)
Use ValuesIntrinsic, 'non use' Values

Appendix 1: Key Biodiversity Components Matrix (KBCM) and Habitat Hectares Score, December 2008 Iteration 69
BBOP Pilot Project Case Study – Ambatovy Project
Key Biodiversity Components Matrix
Global National Local Site Endemic Localized Widespread
Cynorkis ridleyi rare X ornementalCynorkis sp. rare X ornementalCynorkis uncinata rare X ornementalCyperus longifolius rare XDalbergia baronii VU X timber for furniture (rose wood)Danais andribensis rare XDanais humblotii rare XDanais ligustrifolia rare XDanais pauciflora rare XDanais pubescens rare XDicoryphe laurina rare XDilobea thouarsii patrimonial value X as defined by MBGDiospyros sp patrimonial value X as defined by MBGDiporidium louvelii rare XDisperis oppositifolia rare X ornementalDistephanus aff. garnieriana rare XDombeya biumbellata rare XDombeya megaphylla rare XDombeya sp patrimonial value X as defined by MBGDombeya spectabilis rare XDracaena sp. 3 rare XDracaena sp2 patrimonial value X as defined by MBGDypsis sp. nov. 2 (aff. hildebrandtii) rare XElaphoglossum sp. 'B' rare XEmbelia nummulariifolia rare XErica sp. 'senescens' rare XErythroxylum "sp. 2 rare XErythroxylum ferrugineum rare XErythroxylum sp. 1 rare XErythroxylum sp. 3 rare XErythroxylum sp. 4 rare XErythroxylum sp. 5 rare XErythroxylum sp. 6 rare XErythroxylum sp. 7 rare XErythroxylum sp. 8 rare XEugenia alaotrensis rare XEugenia arthroopoda rare XEugenia goviala rare XEugenia sp. Nov 3 rare XEugenia sp. Nov 4 rare XEugenia sp. Nov. 1 rare XEugenia sp. Nov. 2 rare XEuphorbia rangovalensis rare XExacum bulbilliferum rare XFilicium sp patrimonial value X as defined by MBGGaertnera aff. Pauciflora rare XGaertnera madagascariensis rare XGaertnera obovata rare XGaertnera obovata rare XGaertnera phanerophlebia rare XGaertnera phyllostachya rare XGallienia sclerophylla rare XGastropis sp patrimonial value X as defined by MBGGastrorchis francoisii rare X ornementalGastrorchis humblotii rare X ornementalGastrorchis pulchra rare X ornementalGouania mauritiana X Magical against evil spiritsGrammangis ellisii rare X ornementalGrammangis sp. indet. rare X ornementalGravesia setifera rare XGravesia setifera vel. sp.aff. rare XGravesia sp. nov. cf. baronii rare XGravesia tanalensis rare XGussonea gilpinae rare X ornementalHabenaria sp. indet. rare X ornementalHelichrysum sp. nov. aff. ambondrombeense rare XHomalium axillare rare XHomalium maringitra rare XHomolliella sericea rare XHomolliella sp. nov. 'pauciflora' ined. rare XHyperacanthus sp. indet. rare XHyperacanthus sp. nov. ined. 'mangoroensis' rare XHyperacanthus thouvenotii rare XInula speciosa rare XIxora trichocalyx rare XJasminum sp patrimonial value X as defined by MBGJumellea arborescens rare X ornementalJumellea brachycentra rare X ornementalJumellea francoisii rare X ornementalJumellea gracilipes rare X ornementalJumellea lignosa rare X ornementalJumellea punctata rare X ornementalJumellea sagittata rare X ornementalJumellea sp. rare X ornementalJumellea teretifolia rare X ornementalKeraudrenia macrantha rare XKhaya madagascariensis rare XKorthalsella commersonii rare XLemurella virescens rare X ornementalLemyrea sp. rare XLeptolaena multiflora EN X timber for construction, bark = medicinalLeptolaena sp2 patrimonial value X as defined by MBGLiparis bulbophylloides rare X ornementalLiparis hildebrandtiana rare X ornementalLiparis jumelleana rare X ornementalLiparis longicaulis rare X ornementalLiparis sp rare X ornemental
Species
Justification (Insert comments here explaining
data entered in columns A to I)
Biodiversity Assessment
Biodiversity Component
Socioeconomic Values Cultural ValuesSignificance
Irreplaceability(mark only one)
Use ValuesIntrinsic, 'non use' Values
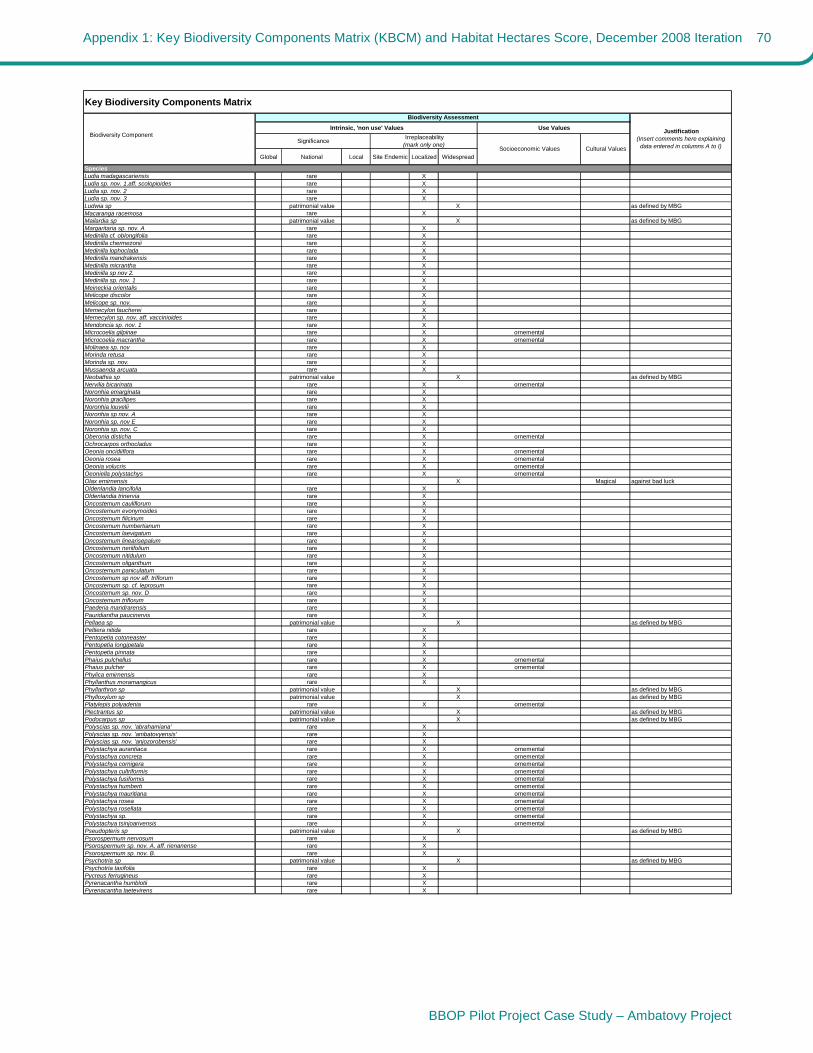
Appendix 1: Key Biodiversity Components Matrix (KBCM) and Habitat Hectares Score, December 2008 Iteration 70
BBOP Pilot Project Case Study – Ambatovy Project
Key Biodiversity Components Matrix
Global National Local Site Endemic Localized Widespread
Ludia madagascariensis rare XLudia sp. nov. 1.aff. scolopioides rare XLudia sp. nov. 2 rare XLudia sp. nov. 3 rare XLudwia sp patrimonial value X as defined by MBGMacaranga racemosa rare XMailardia sp patrimonial value X as defined by MBGMargaritaria sp. nov. A rare XMedinilla cf. oblongifolia rare XMedinilla chermezonii rare XMedinilla lophoclada rare XMedinilla mandrakensis rare XMedinilla micrantha rare XMedinilla sp nov 2. rare XMedinilla sp. nov. 1 rare XMeineckia orientalis rare XMelicope discolor rare XMelicope sp. nov. rare XMemecylon faucherei rare XMemecylon sp. nov. aff. vaccinioides rare XMendoncia sp. nov. 1 rare XMicrocoelia gilpinae rare X ornementalMicrocoelia macrantha rare X ornementalMolinaea sp. nov rare XMorinda retusa rare XMorinda sp. nov. rare XMussaenda arcuata rare XNeobathia sp patrimonial value X as defined by MBGNervilia bicarinata rare X ornementalNoronhia emarginata rare XNoronhia gracilipes rare XNoronhia louvelii rare XNoronhia sp nov. A rare XNoronhia sp. nov E rare XNoronhia sp. nov. C rare XOberonia disticha rare X ornementalOchrocarpos orthocladus rare XOeonia oncidiiflora rare X ornementalOeonia rosea rare X ornementalOeonia volucris rare X ornementalOeoniella polystachys rare X ornementalOlax emirnensis X Magical against bad luckOldenlandia lancifolia rare XOldenlandia trinervia rare XOncostemum cauliflorum rare XOncostemum evonymoides rare XOncostemum filicinum rare XOncostemum humbertianum rare XOncostemum laevigatum rare XOncostemum linearisepalum rare XOncostemum neriifolium rare XOncostemum nitidulum rare XOncostemum oliganthum rare XOncostemum paniculatum rare XOncostemum sp nov aff. triflorum rare XOncostemum sp. cf. leprosum rare XOncostemum sp. nov. D rare XOncostemum triflorum rare XPaederia mandrarensis rare XPauridiantha paucinervis rare XPellaea sp patrimonial value X as defined by MBGPeltiera nitida rare XPentopetia cotoneaster rare XPentopetia longipetala rare XPentopetia pinnata rare XPhaius pulchellus rare X ornementalPhaius pulcher rare X ornementalPhylica emirnensis rare XPhyllanthus moramangicus rare XPhyllarthron sp patrimonial value X as defined by MBGPhylloxylum sp patrimonial value X as defined by MBGPlatylepis polyadenia rare X ornementalPlectrantus sp patrimonial value X as defined by MBGPodocarpus sp patrimonial value X as defined by MBGPolyscias sp. nov. 'abrahamiana' rare XPolyscias sp. nov. 'ambatovyensis' rare XPolyscias sp. nov. 'anjozorobensis' rare XPolystachya aurantiaca rare X ornementalPolystachya concreta rare X ornementalPolystachya cornigera rare X ornementalPolystachya cultriformis rare X ornementalPolystachya fusiformis rare X ornementalPolystachya humberti rare X ornementalPolystachya mauritiana rare X ornementalPolystachya rosea rare X ornementalPolystachya rosellata rare X ornementalPolystachya sp. rare X ornementalPolystachya tsinjoarivensis rare X ornementalPseudopteris sp patrimonial value X as defined by MBGPsorospermum nervosum rare XPsorospermum sp. nov. A. aff. rienanense rare XPsorospermum sp. nov. B. rare XPsychotria sp patrimonial value X as defined by MBGPsychotria taxifolia rare XPycreus ferrugineus rare XPyrenacantha humblotii rare XPyrenacantha laetevirens rare X
Species
Justification (Insert comments here explaining
data entered in columns A to I)
Biodiversity Assessment
Biodiversity Component
Socioeconomic Values Cultural ValuesSignificance
Irreplaceability(mark only one)
Use ValuesIntrinsic, 'non use' Values

Appendix 1: Key Biodiversity Components Matrix (KBCM) and Habitat Hectares Score, December 2008 Iteration 71
BBOP Pilot Project Case Study – Ambatovy Project
Key Biodiversity Components Matrix
Global National Local Site Endemic Localized Widespread
Pyrostria analamazaotrensis rare XRhodolaena bakeriana patrimonial value X as defined by MBGRhynchospora sp. nov. 1 rare XSaldinia coursiana rare XSaldinia mandracensis rare XSaldinia myrtilloides rare XSaldinia proboscidea rare XSaldinia sp patrimonial value X as defined by MBGSarcolaena sp patrimonial value X as defined by MBGSchismatoclada concinna rare XSchismatoclada psychotrioides rare XScleria madagascariensis rare XScolopia taimbarina rare XScolopia thouvenoti rare XSecamone glaberrima rare XSecamone sp. aff. Perrieri rare XSecamone sp. nov. 1 rare XSelaginella lyalii patrimonial value X as defined by MBGSenecio vel. sp. aff. multidenticulatus rare XStenandrium amoenum rare XSyzigium sp. 1 rare XSyzigium sp. 2 rare XSyzigium sp. 3 rare XSyzygium bernieri rare XSyzygium condensatum rare XSyzygium emirnense rare XSyzygium lugubre rare XSyzygium onivense rare XSyzygium parkeri rare XTacca sp patrimonial value X as defined by MBGTambourissa capuronii rare XTambourissa sp nov. aff. mandrarensis rare XTambourissa sp. nov. A rare XTambourissa trichophylla rare XTarenna alleizettei rare XTarenna sp. nov. aff spiranthera rare XTerminalia sp patrimonial value X as defined by MBGTerminalia sp patrimonial value X as defined by MBGTragia perrieri rare XTricalysia sp. ined. 'analamazaotrensis' rare XTristellateia grandiflora rare XVepris sp1 patrimonial value X as defined by MBGVepris sp2 patrimonial value X as defined by MBGVigueranthus sp_ patrimonial value X as defined by MBGViguieranthus sp. X Magical sorcelleryViscum multicostatum rare XViscum radula rare XViscum sp. Nov. 1 rare XViscum sp. Nov. 2 rare XVitex coursii rare XVitex oscitans rare XXylopia sp patrimonial value X as defined by MBG
Azonal thicket X X medecinal, bushmeatDisturbed azonal thicket X X medecinal, bushmeatAzonal forest X X medecinal, bushmeatDisturbed azonal forest X X medecinal, bushmeatBrunt azonal forest XDisturbed azonal habitat (sucessions I and II) X XDisturbed azonal habitat (sparse vegetation) X
Transitional forest of azonal influence on gabbro sustratum X X timbers, medecinal, bushmeat, water ressourcesDistrubed transitional forest of azonal influence on gabbro sustratum X X timbers, medecinal, bushmeat, water ressourcesTransitional forest X X timbers, medecinal, bushmeat, water ressourcesExploited transitional forest X X timbers, medecinal, bushmeat, water ressources
Moderately exploited zonal forest X X X timbers, medecinal, bushmeat, water ressourcesModerately exploited zonal gallery forest X X X timbers, medecinal, bushmeat, water ressourcesHeavily exploited zonal forest (with other disturbances), mine and pipeline timber, medecinal, bushmeat
Ephemeral ponds X X
Streams X X water resources
Edaphic mid-altitudinal eastern humid forest on laterite profil above ultramafic outcrop X X timbers, medecinal, bushmeat, water ressources
Communities/Habitats
Whole Landscapes/Ecosystems
Species
Justification (Insert comments here explaining
data entered in columns A to I)
Biodiversity Assessment
Biodiversity Component
Socioeconomic Values Cultural ValuesSignificance
Irreplaceability(mark only one)
Use ValuesIntrinsic, 'non use' Values

Appendix 1: Key Biodiversity Components Matrix (KBCM) and Habitat Hectares Score, December 2008 Iteration 72
BBOP Pilot Project Case Study – Ambatovy Project
Key to Global Significance Criteria
Further detailed information is available at http://www.iucnredlist.org/info/categories_criteria2001.
EXTINCT (EX)
A taxon is Extinct when there is no reasonable doubt that the last individual has died. A taxon is presumed
Extinct when exhaustive surveys in known and/or expected habitat, at appropriate times (diurnal, seasonal,
annual), throughout its historic range have failed to record an individual. Surveys should be over a time frame
appropriate to the taxon's life cycle and life form.
EXTINCT IN THE WILD (EW)
A taxon is Extinct in the Wild when it is known only to survive in cultivation, in captivity or as a naturalized
population (or populations) well outside the past range. A taxon is presumed Extinct in the Wild when
exhaustive surveys in known and/or expected habitat, at appropriate times (diurnal, seasonal, annual),
throughout its historic range have failed to record an individual. Surveys should be over a time frame
appropriate to the taxon's life cycle and life form.
CRITICALLY ENDANGERED (CR)
A taxon is Critically Endangered when the best available evidence indicates that it meets any of the criteria A
to E for Critically Endangered (see Section V), and it is therefore considered to be facing an extremely high
risk of extinction in the wild.
ENDANGERED (EN)
A taxon is Endangered when the best available evidence indicates that it meets any of the criteria A to E for
Endangered (see Section V), and it is therefore considered to be facing a very high risk of extinction in the
wild.
VULNERABLE (VU)
A taxon is Vulnerable when the best available evidence indicates that it meets any of the criteria A to E for
Vulnerable (see Section V), and it is therefore considered to be facing a high risk of extinction in the wild.
NEAR THREATENED (NT)
A taxon is Near Threatened when it has been evaluated against the criteria but does not qualify for Critically
Endangered, Endangered or Vulnerable now, but is close to qualifying for or is likely to qualify for a threatened
category in the near future.
LEAST CONCERN (LC)
A taxon is Least Concern when it has been evaluated against the criteria and does not qualify for Critically
Endangered, Endangered, Vulnerable or Near Threatened. Widespread and abundant taxa are included in
this category.
DATA DEFICIENT (DD)
A taxon is Data Deficient when there is inadequate information to make a direct, or indirect, assessment of its
risk of extinction based on its distribution and/or population status. A taxon in this category may be well
studied, and its biology well known, but appropriate data on abundance and/or distribution are lacking. Data
Deficient is therefore not a category of threat. Listing of taxa in this category indicates that more information is

Appendix 1: Key Biodiversity Components Matrix (KBCM) and Habitat Hectares Score, December 2008 Iteration 73
BBOP Pilot Project Case Study – Ambatovy Project
required and acknowledges the possibility that future research will show that threatened classification is
appropriate. It is important to make positive use of whatever data are available. In many cases great care
should be exercised in choosing between DD and a threatened status. If the range of a taxon is suspected to
be relatively circumscribed, and a considerable period of time has elapsed since the last record of the taxon,
threatened status may well be justified.
NOT EVALUATED (NE)
A taxon is Not Evaluated when it is has not yet been evaluated against the criteria.

Appendix 1: Key Biodiversity Components Matrix (KBCM) and Habitat Hectares Score, December 2008 Iteration 74
BBOP Pilot Project Case Study – Ambatovy Project
Total Habitat Hectares Lost:
620.00
Each Site Class…
Post-Project, High Impact Sites…
Post-Project, Medium Impact Sites…
Post-Project, Low Impact Sites…
#Units/Bands
Condition/Level
Net Loss
Condition/Level
Net Loss
Condition/Level
Net Loss
Pre-Project 911 285Post-Project, High Impact Sites 0 911 0 285 0Post-Project, Medium Impact Sites 911 0 285 0 0Post-Project, Low Impact Sites 0 0 0Pre-Project 43 18Post-Project, High Impact Sites 0 43 0 18 0Post-Project, Medium Impact Sites 43 0 18 0 0Post-Project, Low Impact Sites 0 0 0Pre-Project 8.98 5.45Post-Project, High Impact Sites 0 8.98 0 5.45 0Post-Project, Medium Impact Sites 8.98 0 5.45 0 0Post-Project, Low Impact Sites 0 0 0Pre-Project 19.42 3.55Post-Project, High Impact Sites 0 19.42 0 3.55 0Post-Project, Medium Impact Sites 19.42 0 3.55 0 0Post-Project, Low Impact Sites 0 0 0Pre-Project 13.29 9.95Post-Project, High Impact Sites 0 13.29 0 9.95 0Post-Project, Medium Impact Sites 13.29 0 9.95 0 0Post-Project, Low Impact Sites 0 0 0Pre-Project 0.033 0Post-Project, High Impact Sites 0 0.033 0 0 0Post-Project, Medium Impact Sites 0.033 0 0 0 0Post-Project, Low Impact Sites 0 0 0Pre-Project 0.0248 0Post-Project, High Impact Sites 0 0.0248 0 0 0Post-Project, Medium Impact Sites 0.0248 0 0 0 0Post-Project, Low Impact Sites 0 0 0Pre-Project 0.013 0Post-Project, High Impact Sites 0 0.013 0 0 0Post-Project, Medium Impact Sites 0.013 0 0 0 0Post-Project, Low Impact Sites 0 0 0
Condition Class 2:
CALCULATING BIODIVERSITY LOSS AT IMPACT SITE(Quantifcation of Biodiversity Loss Through Project Impact, via Habitat Hectares)
Azonal thicketHabitat Type 1:
…of Condition Class 3:
1. To the left, label each pre-project site condition class found.
(Three or less. e.g. "pristine", "good", "degraded", or "good", "poor", etc.)
528.86 427.22
Disturbed primary forest
Condition Class 3:0
2. Fill in the area of … (enter "0" for non-relevent
condition classes and impact levels)
3. For each relevant condition class and impact level below, please fill in the condition/level of the attribute in question…
Pre/Post-Project ConditionsHabitat
Hectares Lost
Rationale(enter comments explaining data in columns
B to Q)
61.88
0
NT
NT
NT
Condition Class 1:
Trad'ble/ Non? (T/NT)
BENCHMARK
Meter 30.77179043
No mitigation Year _0
Attribute
Tree species/h
a41
0.05
105.772
89.19445714
0.05
Wei
ghtReference Level
Quasi pristine primary forest
0.15
148.44360980.2
stems number/h
a1015
0
… of Condition Class 1:
0 0 0
48.33 0
Quasi pristine primary forest
Disturbed primary forest
590.74 475.55
…of Condition Class 2:
0.05 30.06911276
57.90240452
0.1 52.886
0.2
NT
NT
NT
NT
11.5
Propithecus diadema density
0.033number/h
a
Number of tree species
Canopy height
Steams
9.74 cm
Basal area 19.6 m2/ha
Dbh
Allocebus density 0.025number/h
a
104.9645802Indri indri density 0.013number/h
a0.2 NT

Appendix 1: Key Biodiversity Components Matrix (KBCM) and Habitat Hectares Score, December 2008 Iteration 75
BBOP Pilot Project Case Study – Ambatovy Project
Total Habitat Hectares Lost: 239
Each Site Class…
Post-Project, High Impact Sites…
Post-Project, Medium Impact Sites…
Post-Project, Low Impact Sites…
#Units/Bands
Condition/Level
Net Loss
Condition/Level
Net Loss
Condition/Level
Net Loss
Pre-Project 1045 880Post-Project, High Impact Sites 1045 880 0Post-Project, Medium Impact Sites 1045 0 880 0 0Post-Project, Low Impact Sites 0 0 0Pre-Project 138 55Post-Project, High Impact Sites 138 55 0Post-Project, Medium Impact Sites 138 0 55 0 0Post-Project, Low Impact Sites 0 0 0Pre-Project 8.48 10.1Post-Project, High Impact Sites 8.48 10.1 0Post-Project, Medium Impact Sites 8.48 0 10.1 0 0Post-Project, Low Impact Sites 0 0 0Pre-Project 23.88 17.2Post-Project, High Impact Sites 23.88 17.2 0Post-Project, Medium Impact Sites 23.88 0 17.2 0 0Post-Project, Low Impact Sites 0 0 0Pre-Project 12.26 9.18Post-Project, High Impact Sites 12.26 9.18 0Post-Project, Medium Impact Sites 12.26 0 9.18 0 0Post-Project, Low Impact Sites 0 0 0Pre-Project 0.033 0.033Post-Project, High Impact Sites 0.033 0.033 0Post-Project, Medium Impact Sites 0.033 0 0.033 0 0Post-Project, Low Impact Sites 0 0 0Pre-Project 0.0248 0.0248Post-Project, High Impact Sites 0.0248 0.0248 0Post-Project, Medium Impact Sites 0.0248 0 0.0248 0 0Post-Project, Low Impact Sites 0 0 0Pre-Project 0.013 0.013Post-Project, High Impact Sites 0.013 0.013 0Post-Project, Medium Impact Sites 0.013 0 0.013 0 0Post-Project, Low Impact Sites 0 0 0
54.79053435Indri indri density 0.0131number/h
a0.2 NT
Allocebus density 0.0248number/h
a
Number of Tree species
Canopy height
Stems
7.65 cm
Basal area 24.87 m2/ha
Dbh
8.55
Propithecus diadema density
0.033number/h
a
0.05 10.26298834
17.63817778
0.1 27.606
0.2
NT
NT
NT
NT
Disturbed primary forest
126.37 328.22
…of Condition Class 2:… of Condition Class 1:
105.54
[Fill in name here]Quasi pristine primary
forest
Wei
ghtReference Level
Quasi pristine primary forest
0.15
28.425855070.2
stems/ha1273
Attribute
Tree species/h
a138
0.05
55.212
29.6630597
0.05 15.79959298
NT
NT
NT
Condition Class 1:
Trad'ble/ Non?
(T/NT)
BENCHMARK
m
Disturbed primary forest
Condition Class 3:
[Fill in name here]
2. Fill in the area of … (enter "0" for non-relevent
condition classes and impact levels)
3. For each relevant condition class and impact level below, please fill in the condition/level of the attribute in question…
Pre/Post-Project Conditions Habitat Hectares Lost
Rationale(enter comments explaining data in columns B to Q)
72.99
Condition Class 2:
LOSS AT IMPACT SITE(Quantifcation of Biodiversity Loss Through Project Impact, via Habitat Hectares)
Transitional ForestsHabitat Type 2:
…of Condition Class 3: 1. To the left, label each pre-project site condition class found.
(Three or less. e.g. "pristine", "good", "degraded", or "good", "poor", etc.)
53.38 222.68

Appendix 1: Key Biodiversity Components Matrix (KBCM) and Habitat Hectares Score, December 2008 Iteration 76
BBOP Pilot Project Case Study – Ambatovy Project
Total Habitat Hectares Lost: 305.13
Each Site Class…
Post-Project, High Impact Sites…
Post-Project, Medium Impact Sites…
Post-Project, Low Impact Sites…
#Units/Bands
Condition/Level
Net Loss
Condition/Level
Net Loss
Condition/Level
Net Loss
Pre-Project 1207 970Post-Project, High Impact Sites 1207 970 0Post-Project, Medium Impact Sites 1207 0 970 0 0Post-Project, Low Impact Sites 1207 970 0Pre-Project 107 30Post-Project, High Impact Sites 107 30 0Post-Project, Medium Impact Sites 107 0 30 0 0Post-Project, Low Impact Sites 107 30 0Pre-Project 10.5 12.65Post-Project, High Impact Sites 10.5 12.65 0Post-Project, Medium Impact Sites 10.5 0 12.65 0 0Post-Project, Low Impact Sites 10.5 12.65 0Pre-Project 33.3 21.65Post-Project, High Impact Sites 33.3 21.65 0Post-Project, Medium Impact Sites 33.3 0 21.65 0 0Post-Project, Low Impact Sites 33.3 21.65 0Pre-Project 13.77 15.44Post-Project, High Impact Sites 13.77 15.44 0Post-Project, Medium Impact Sites 13.37 0.4 15.44 0 0Post-Project, Low Impact Sites 13.77 15.44 0Pre-Project 0.033 0.033Post-Project, High Impact Sites 0.033 0.033 0Post-Project, Medium Impact Sites 0.033 0 0.033 0 0Post-Project, Low Impact Sites 0.033 0.033 0Pre-Project 0.025 0Post-Project, High Impact Sites 0.025 0 0Post-Project, Medium Impact Sites 0.025 0 0 0 0Post-Project, Low Impact Sites 0.025 0 0Pre-Project 0.013 0.013Post-Project, High Impact Sites 0.013 0.013 0Post-Project, Medium Impact Sites 0.013 0 0.013 0 0Post-Project, Low Impact Sites 0.013 0.013 0
Condition Class 2:
LOSS AT IMPACT SITE(Quantifcation of Biodiversity Loss Through Project Impact, via Habitat Hectares)
Zonal ForestsHabitat Type 3:
…of Condition Class 3: 1. To the left, label each pre-project site condition class found. (Three or less. e.g. "pristine", "good", "degraded", or "good", "poor", etc.)
256.9 14.94
Disturbed primary forest
Condition Class 3:[Fill in name here]
2. Fill in the area of … (enter "0" for non-relevent
condition classes and impact levels)
3. For each relevant condition class and impact level below, please fill in the condition/level of the attribute in question…
Pre/Post-Project ConditionsHabitat
Hectares LostRationale
(enter comments explaining data in columns B to Q)
155.84
NT
NT
NT
Condition Class 1:
Trad'ble/ Non? (T/NT)
BENCHMARK
meter 14.57798485
Attribute
Tree species/h
a72
0.05
54.368
45.71409859
0.05
Wei
ghtReference Level
Quasi pristine primary forest
0.15
77.601388890.2
Stem number/h
a1065
… of Condition Class 1:
110.03
[Fill in name here]Quasi pristine primary
forestDisturbed primary
forest
412.74 124.97
…of Condition Class 2:
0.05 20.177775
12.84548156
0.1 25.89717742
0.2
NT
NT
NT
NT
9.9
Propithecus diadema density
0.033number/h
a
Number of tree species
Canopy height
Stems
14.91 cm
Basal area 22 m2/ha
Dbh
Allocebus density 0.0248number/h
a
53.9529771Indri indri density 0.0131number/h
a0.2 NT

Appendix 1: Key Biodiversity Components Matrix (KBCM) and Habitat Hectares Score, December 2008 Iteration 77
BBOP Pilot Project Case Study – Ambatovy Project
Total Habitat Hectares Lost: 3.83
Each Site Class…
Post-Project, High Impact Sites…
Post-Project, Medium Impact Sites…
Post-Project, Low Impact Sites…
#Units/Bands
Condition/Level
Net Loss
Condition/Level
Net Loss
Condition/Level
Net Loss
Pre-Project 104Post-Project, High Impact Sites 0 0 104Post-Project, Medium Impact Sites 0 0 104 0Post-Project, Low Impact Sites 0 0 104Pre-Project 45Post-Project, High Impact Sites 0 0 45Post-Project, Medium Impact Sites 0 0 45 0Post-Project, Low Impact Sites 0 0 45Pre-Project 4.139Post-Project, High Impact Sites 0 0 4.139Post-Project, Medium Impact Sites 0 0 4.139 0Post-Project, Low Impact Sites 0 0 4.139Pre-Project 14.502Post-Project, High Impact Sites 0 0 14.502Post-Project, Medium Impact Sites 0 0 14.502 0Post-Project, Low Impact Sites 0 0 14.502Pre-Project 14.978Post-Project, High Impact Sites 0 0 14.978Post-Project, Medium Impact Sites 0 0 14.978 0Post-Project, Low Impact Sites 0 0 14.978Pre-Project 0Post-Project, High Impact Sites 0 0 0Post-Project, Medium Impact Sites 0 0 0 0Post-Project, Low Impact Sites 0 0 0Pre-Project 0Post-Project, High Impact Sites 0 0 0Post-Project, Medium Impact Sites 0 0 0 0Post-Project, Low Impact Sites 0 0 0Pre-Project 0Post-Project, High Impact Sites 0 0 0Post-Project, Medium Impact Sites 0 0 0 0Post-Project, Low Impact Sites 0 0 0
0Indri indri density 0.0131number/h
a0.2 NT
Allocebus density 0.0248number/h
a
Number of tree species
Canopy height
Stems
14.91 cm
Volume 34.17 m3/ha
Dbh
9.9
Propithecus diadema density
0.033number/h
a
0.05 0.350136084
0.828762575
0.1 0
0.2
NT
NT
NT
NT
…of Condition Class 2:
16.5
… of Condition Class 1:
4.95
Heavily fragmented and degraded primary forest
Wei
ght
Reference Level 0
0.15
2.06250.2
Stems/ha1065
Attribute
Tree species/5
00m272
0.05
0
0.241690141
0.05 0.344916667
NT
NT
NT
Condition Class 1:
Trad'ble/ Non?
(T/NT)
BENCHMARK
m
0Condition Class 3:
Heavily fragmented and degraded primary forest
2. Fill in the area of … (enter "0" for non-relevent
condition classes and impact levels)
3. For each relevant condition class and impact level below, please fill in the condition/level of the attribute in question…
Pre/Post-Project ConditionsHabitat
Hectares LostRationale
(enter comments explaining data in columns B to Q)
71.04
Condition Class 2:
LOSS AT IMPACT SITE(Quantifcation of Biodiversity Loss Through Project Impact, via Habitat Hectares)
Pipeline degraded zonal forestsHabitat Type 4:
…of Condition Class 3: 1. To the left, label each pre-project site condition class found. (Three or less. e.g. "pristine", "good", "degraded", or "good", "poor", etc.)

78
BBOP Pilot Project Case Study – Ambatovy Project
Appendix 2: Key Biodiversity Components Matrix (KBCM) and Habitat Hectares Score, February 2008 Iteration
Key Biodiversity Components Matrix
Global National Local Site Endemic Localized Widespread
Prolemur simus CR X Ecotourism, bush meat Ecological services: main seeds disperseurs
Propithecus d. diadema CR X Ecotourism, bush meat Tabou Existence of illegal bush meat for all these lemur species
Indri indri EN X Ecotourism, bush meat TabouAllocebus trichotis EN X Ecotourism, bush meatDaubentonia madagascarensis EN X Ecotourism, bush meat TabouTyto soumagnei EN X Ecotourism
Platypelis sp. nov X X Rational exportationThere's annual quota for those species under CITES exporation. However, there are lacks of study on population density
Scaphiophryne marmorata VU X Rational exportationRhombophryne coronata VU X Rational exportationMantella aurantiaca CR X Rational exportationMantella crocea EN X Rational exportationMantidactylus plicifer NT X Rational exportationPararhadinaea sp.nov X X Rational exportationSanzinia madagascariensis VU X Rational exportation, bush meatAloe leandri X XRatsirakia sp X X Bush meatRheocles sp X X Bush meatAsteropeia micraster ENLeptolaena multiflora ENDalbergia baroni VUCyathea dregei NE Cites IICyathea cf tsaratananensis NE Cites IIEulemur rubriventer VU X Bush meat
Azonal forest X X medecinal, bushmeet, Transitional forest X X timbers, medecinal, bushmeet, water ressourcesZonal forest X Xtimbers, medecinal, bushmeet, water ressourcesAzonal fauna X XAzonal flora X X
Edaphic mid-altitudinal eastern humid forest on laterite profil above ultramafic outcrop X X forest & water ressources
Justification (Insert comments here explaining data entered in columns
A to I)
Biodiversity Assessment
Biodiversity Component
Socioeconomic Values
Cultural ValuesSignificance
Irreplaceability(mark only one)
Use ValuesIntrinsic, 'non use' Values
Communities/Habitats
Whole Landscapes/Ecosystems
Species
For ‘Key to Global Significance Criteria’ see Appendix 1 above.

Appendix 2: Key Biodiversity Components Matrix (KBCM) and Habitat Hectares Score, February 2008 Iteration 79
BBOP Pilot Project Case Study – Ambatovy Project
Total Habitat Hectares Lost:
859
Each Site Class…
Post-Project, High Impact Sites…
Post-Project, Medium Impact Sites…
Post-Project, Low Impact Sites…
#Units/Bands
Condition/Level
Net Loss
Condition/Level
Net Loss
Condition/Level
Net Loss
Pre-Project 739 263Post-Project, High Impact Sites 739 0 263 0Post-Project, Medium Impact Sites 739 263 0Post-Project, Low Impact Sites 739 263 0Pre-Project 58 15Post-Project, High Impact Sites 0 58 15 0Post-Project, Medium Impact Sites 58 15 0Post-Project, Low Impact Sites 58 15 0Pre-Project 4.43 2.02Post-Project, High Impact Sites 0 4.43 2.02 0Post-Project, Medium Impact Sites 4.43 2.02 0Post-Project, Low Impact Sites 4.43 2.02 0Pre-Project 7.07 1.18Post-Project, High Impact Sites 0 7.07 1.18 0Post-Project, Medium Impact Sites 7.07 1.18 0Post-Project, Low Impact Sites 7.07 1.18 0Pre-Project 9.64 7.26Post-Project, High Impact Sites 0 9.64 7.26 0Post-Project, Medium Impact Sites 9.64 7.26 0Post-Project, Low Impact Sites 9.64 7.26 0Pre-Project 4.98 3.13Post-Project, High Impact Sites 0 4.98 3.13 0Post-Project, Medium Impact Sites 4.98 3.13 0Post-Project, Low Impact Sites 4.98 3.13 0
Condition Class 2:
CALCULATING BIODIVERSITY LOSS AT IMPACT SITE(Quantifcation of Biodiversity Loss Through Project Impact, via Habitat Hectares)
Azonal forestHabitat Type 1:
…of Condition Class 3:
1. To the left, label each pre-project site condition class found.
(Three or less. e.g. "pristine", "good", "degraded", or "good", "poor", etc.)
615 447.04
DisturbedCondition Class 3:
Ponds
2. Fill in the area of … (enter "0" for non-relevent
condition classes and impact levels)
3. For each relevant condition class and impact level below, please fill in the condition/level of the attribute in question…
Pre/Post-Project ConditionsHabitat
Hectares Lost
Rationale(enter comments explaining data in
columns B to Q)
0
0
NT
NT
NT
Condition Class 1:
Trad'ble/ Non?
(T/NT)
BENCHMARK
Meter 57.0357044
Good: P.5; Disturbed: P. 20
after 30 years estimated approximately about 40% to 60% of the structure attribute value will be
restored on the impact site
Attribute
Tree species/5
00m241
0.15
72.78850245
195.2411331
0.15
Wei
ghtReference Level Good forest
0.2
258.38780490.25
steam/ha586
0
… of Condition Class 1:
0 0 0
0 0
PondsGood forest Disturbed
793.02 549.17
…of Condition Class 2:
0.15 134.1896477
141.2850678
0.1
NT
NT
NT
9.54
Height to crown 6.13 m3
Number of tree species
Canopy height variation
Steams
9.74 m
Basal area 5.45 m2/ha
Dbh

80
BBOP Pilot Project Case Study – Ambatovy Project
Appendix 3: Key Biodiversity Components Matrix (KBCM) and Habitat Hectares Score, April 2008 Iteration
BIODIVERSITY LOSS calculations scenarios at IMPACT SITE, and post-Project remediation effects on biodiversity
loss calculations scenarios at impact site, Ambatovy Project
Habitat typesPercentage of attributes
rehabilitationYear
Forest Streams/Rivers Ephemeral pools
0%0 (without mitigation)
1620 1.16 0.64
5% 0-7 1539 1.1 0.61
20% 7-15 1296 0.93 0.51
40% 15-30 972 0.69 0.38
75% 30-60 405 0.29 0.16
90% 60-120 162 0.12 0.06
Detailed calculations can be found below.

Appendix 3: Key Biodiversity Components Matrix (KBCM) and Habitat Hectares Score, April 2008 Iteration 81
BBOP Pilot Project Case Study – Ambatovy Project
Habitat hectares lost – no mitigation
Total Habitat Hectares Lost:
1620
Each Site Class…
Post-Project, High Impact Sites…
Post-Project, Medium Impact Sites…
Post-Project, Low Impact Sites…
#Units/Bands
Condition/Level
Net Loss
Condition/Level
Net Loss
Condition/Level
Net Loss
Pre-Project 1004.75 735.57Post-Project, High Impact Sites 1004.8 0 735.57 0Post-Project, Medium Impact Sites 1004.8 735.57 0Post-Project, Low Impact Sites 1004.8 735.57 0Pre-Project 23.22 14.57Post-Project, High Impact Sites 0 23.22 14.57 0Post-Project, Medium Impact Sites 23.22 14.57 0Post-Project, Low Impact Sites 23.22 14.57 0Pre-Project 9.07 9.5Post-Project, High Impact Sites 0 9.07 9.5 0Post-Project, Medium Impact Sites 9.07 9.5 0Post-Project, Low Impact Sites 9.07 9.5 0Pre-Project 13.57 15.17Post-Project, High Impact Sites 0 13.57 15.17 0Post-Project, Medium Impact Sites 13.57 15.17 0Post-Project, Low Impact Sites 13.57 15.17 0Pre-Project 85.08 36.86Post-Project, High Impact Sites 0 85.08 36.86 0Post-Project, Medium Impact Sites 85.08 36.86 0Post-Project, Low Impact Sites 85.08 36.86 0Pre-Project 0.033 0Post-Project, High Impact Sites 0.033 0 0Post-Project, Medium Impact Sites 0.033 0 0Post-Project, Low Impact Sites 0.033 0 0Pre-Project 123.3 123.3Post-Project, High Impact Sites 123.3 123.3 0Post-Project, Medium Impact Sites 123.3 123.3 0Post-Project, Low Impact Sites 123.3 123.3 0Pre-Project 0.025 0Post-Project, High Impact Sites 0.025 0 0Post-Project, Medium Impact Sites 0.025 0 0Post-Project, Low Impact Sites 0.025 0 0Pre-Project 142.4 142.4Post-Project, High Impact Sites 142.4 142.4 0Post-Project, Medium Impact Sites 142.4 142.4 0Post-Project, Low Impact Sites 142.4 142.4 0Pre-Project 0.007 0Post-Project, High Impact Sites 0.007 0 0Post-Project, Medium Impact Sites 0.007 0 0Post-Project, Low Impact Sites 0.007 0 0Pre-Project 4.13 4.13Post-Project, High Impact Sites 4.13 4.13 0Post-Project, Medium Impact Sites 4.13 4.13 0Post-Project, Low Impact Sites 4.13 4.13 0Pre-Project 0.013 0Post-Project, High Impact Sites 0.013 0 0Post-Project, Medium Impact Sites 0.013 0 0Post-Project, Low Impact Sites 0.013 0 0Pre-Project 31.12 31.12Post-Project, High Impact Sites 31.12 31.12 0Post-Project, Medium Impact Sites 31.12 31.12 0Post-Project, Low Impact Sites 31.12 31.12 0Pre-Project 0.8 14.05Post-Project, High Impact Sites 0.8 14.05 0Post-Project, Medium Impact Sites 0.8 14.05 0Post-Project, Low Impact Sites 0.8 14.05 0
Condition Class 2:
CALCULATING BIODIVERSITY LOSS AT IMPACT SITE(Quantifcation of Biodiversity Loss Through Project Impact, via Habitat Hectares)
ForestHabitat Type 1:
…of Condition Class 3: 1. To the left, label each pre-project site condition class found.
(Three or less. e.g. "pristine", "good", "degraded", or "good", "poor", etc.)
1587.963 497.7
DisturbedCondition Class 3:
Ponds
2. Fill in the area of … (enter "0" for non-relevent
condition classes and impact levels)
3. For each relevant condition class and impact level below, please fill in the condition/level of the attribute in question…
Pre/Post-Project ConditionsHabitat
Hectares Lost
Rationale(enter comments explaining data in
columns B to Q)
0
0
NT
NT
NT
NT
NT
NT
NT
NT
NT
NT
Condition Class 1:
Trad'ble/ Non? (T/NT)
BENCHMARK
Meter 47.92328259
50.03226773
183.4857277
Good forest is the average of : P.5, 6, 9, 12, 14, & 18; Disturbed forest
average of : P. 10 &20
No mitigation Year _0
Attribute
Square meters/ha
22.16
0.1
175.4906165
0.025
0.1 160.3136869
0.025
Wei
ghtReference Level Good forest
0.1
99.557738850.05
stems/ha1118
0
… of Condition Class 1:
0 0 0
0 0
PondsGood forest Disturbed
1587.963 497.7
…of Condition Class 2:
0.1 158.71055
NT
NT
NT
Allocebus trichotis density
0.025 number/ha
9.98
Basal area
Mean tree height canopy
Stems
83.63 number/ha
Top height tree 14.54 Meter
Tree species density
Propithecus diadema Density
0.033
142.4 0
0.1 169.8818697Prolemur simus
density0.007
104.3221485Propithecus
diadema vulnerability index
123.3 0 0.05 NT
0.05 104.2548391Allocebus trichotis vulnerability index
number/ha
Prolemur simus vulnerability index
4.13 0 0.05 104.2894121
Indri indri density 0.013 number/ha 0.1 157.7474504
104.275906Indri indri
vulnerability index31.12 0 0.05
Deforestation rate 0Percentag
e0.1 0

Appendix 3: Key Biodiversity Components Matrix (KBCM) and Habitat Hectares Score, April 2008 Iteration 82
BBOP Pilot Project Case Study – Ambatovy Project
Habitat hectares lost – 5% mitigation
Total Habitat Hectares Lost:
1539
Each Site Class…
Post-Project, High Impact Sites…
Post-Project, Medium Impact Sites…
Post-Project, Low Impact Sites…
#Units/Bands
Condition/Level
Net Loss
Condition/Level
Net Loss
Condition/Level
Net Loss
Pre-Project 1004.75 735.57Post-Project, High Impact Sites 50.2375 954.51 36.7785 698.79 0Post-Project, Medium Impact Sites 1004.8 735.57 0Post-Project, Low Impact Sites 1004.8 735.57 0Pre-Project 23.22 14.57Post-Project, High Impact Sites 1.161 22.059 0.7285 13.842 0Post-Project, Medium Impact Sites 23.22 14.57 0Post-Project, Low Impact Sites 23.22 14.57 0Pre-Project 9.07 9.5Post-Project, High Impact Sites 0.4535 8.6165 0.475 9.025 0Post-Project, Medium Impact Sites 9.07 9.5 0Post-Project, Low Impact Sites 9.07 9.5 0Pre-Project 13.57 15.17Post-Project, High Impact Sites 0.6785 12.892 0.7585 14.412 0Post-Project, Medium Impact Sites 13.57 15.17 0Post-Project, Low Impact Sites 13.57 15.17 0Pre-Project 85.08 36.86Post-Project, High Impact Sites 4.254 80.826 1.843 35.017 0Post-Project, Medium Impact Sites 85.08 36.86 0Post-Project, Low Impact Sites 85.08 36.86 0Pre-Project 0.033 0Post-Project, High Impact Sites 0.00165 0.0314 0 0 0Post-Project, Medium Impact Sites 0.033 0 0Post-Project, Low Impact Sites 0.033 0 0Pre-Project 123.3 123.3Post-Project, High Impact Sites 6.165 117.14 6.165 117.14 0Post-Project, Medium Impact Sites 123.3 123.3 0Post-Project, Low Impact Sites 123.3 123.3 0Pre-Project 0.025 0Post-Project, High Impact Sites 0.00125 0.0238 0 0 0Post-Project, Medium Impact Sites 0.025 0 0Post-Project, Low Impact Sites 0.025 0 0Pre-Project 142.4 142.4Post-Project, High Impact Sites 7.12 135.28 7.12 135.28 0Post-Project, Medium Impact Sites 142.4 142.4 0Post-Project, Low Impact Sites 142.4 142.4 0Pre-Project 0.007 0Post-Project, High Impact Sites 0.00035 0.0067 0 0 0Post-Project, Medium Impact Sites 0.007 0 0Post-Project, Low Impact Sites 0.007 0 0Pre-Project 4.13 4.13Post-Project, High Impact Sites 0.2065 3.9235 0.2065 3.9235 0Post-Project, Medium Impact Sites 4.13 4.13 0Post-Project, Low Impact Sites 4.13 4.13 0Pre-Project 0.013 0Post-Project, High Impact Sites 0.00065 0.0124 0 0 0Post-Project, Medium Impact Sites 0.013 0 0Post-Project, Low Impact Sites 0.013 0 0Pre-Project 31.12 31.12Post-Project, High Impact Sites 1.556 29.564 1.556 29.564 0Post-Project, Medium Impact Sites 31.12 31.12 0Post-Project, Low Impact Sites 31.12 31.12 0Pre-Project 0.8 14.05Post-Project, High Impact Sites 0.04 0.76 0.7025 13.348 0Post-Project, Medium Impact Sites 0.8 14.05 0Post-Project, Low Impact Sites 0.8 14.05 0
0.1 0
31.12 0 0.05
Deforestation rate 0Percentag
e
0.05 99.07494151
Indri indri density 0.013 number/ha 0.1 149.8600779
99.06211074Indri indri
vulnerability index
number/ha
Prolemur simus vulnerability index
4.13 0
99.10604103Propithecus
diadema vulnerability index
123.3 0 0.05 NT
0.05 99.04209716Allocebus trichotis vulnerability index
Propithecus diadema Density
0.033
142.4 0
0.1 161.3877762Prolemur simus
density0.007
Basal area
Mean tree height canopy
Stems
83.63 number/ha
Top height tree 14.54 Meter
Tree species density
Allocebus trichotis density
0.025 number/ha
9.98
0.1 150.7750225
NT
NT
NT
Disturbed
1587.963 497.7
…of Condition Class 2:
0
… of Condition Class 1:
0 0 0
0 0
PondsGood forest
Wei
ghtReference Level Good forest
0.1
94.579851910.05
stems/ha1118
Attribute
Square meters/ha
22.16
0.1
166.7160857
0.025
0.1 152.2980025
0.025
Good forest is the average of : P.5, 6, 9, 12, 14, & 18; Disturbed forest
average of : P. 10 &20
No mitigation Year _0
45.52711846
47.53065434
174.3114413
NT
NT
NT
Condition Class 1:
Trad'ble/ Non? (T/NT)
BENCHMARK
Meter
NT
NT
NT
NT
NT
NT
NT
DisturbedCondition Class 3:
Ponds
2. Fill in the area of … (enter "0" for non-relevent
condition classes and impact levels)
3. For each relevant condition class and impact level below, please fill in the condition/level of the attribute in question…
Pre/Post-Project ConditionsHabitat
Hectares Lost
Rationale(enter comments explaining data in
columns B to Q)
0
0
Condition Class 2:
CALCULATING BIODIVERSITY LOSS AT IMPACT SITE(Quantifcation of Biodiversity Loss Through Project Impact, via Habitat Hectares)
ForestHabitat Type 1:
…of Condition Class 3:
1. To the left, label each pre-project site condition class found.
(Three or less. e.g. "pristine", "good", "degraded", or "good", "poor", etc.)
1587.963 497.7

Appendix 3: Key Biodiversity Components Matrix (KBCM) and Habitat Hectares Score, April 2008 Iteration 83
BBOP Pilot Project Case Study – Ambatovy Project
Habitat hectares lost – 20% mitigation
Total Habitat Hectares Lost:
1296
Each Site Class…
Post-Project, High Impact Sites…
Post-Project, Medium Impact Sites…
Post-Project, Low Impact Sites…
#Units/Bands
Condition/Level
Net Loss
Condition/Level
Net Loss
Condition/Level
Net Loss
Pre-Project 1004.75 735.57Post-Project, High Impact Sites 200.95 803.8 147.114 588.46 0Post-Project, Medium Impact Sites 1004.8 735.57 0Post-Project, Low Impact Sites 1004.8 735.57 0Pre-Project 23.22 14.57Post-Project, High Impact Sites 4.644 18.576 2.914 11.656 0Post-Project, Medium Impact Sites 23.22 14.57 0Post-Project, Low Impact Sites 23.22 14.57 0Pre-Project 9.07 9.5Post-Project, High Impact Sites 1.814 7.256 1.9 7.6 0Post-Project, Medium Impact Sites 9.07 9.5 0Post-Project, Low Impact Sites 9.07 9.5 0Pre-Project 13.57 15.17Post-Project, High Impact Sites 2.714 10.856 3.034 12.136 0Post-Project, Medium Impact Sites 13.57 15.17 0Post-Project, Low Impact Sites 13.57 15.17 0Pre-Project 85.08 36.86Post-Project, High Impact Sites 17.016 68.064 7.372 29.488 0Post-Project, Medium Impact Sites 85.08 36.86 0Post-Project, Low Impact Sites 85.08 36.86 0Pre-Project 0.033 0Post-Project, High Impact Sites 0.0066 0.0264 0 0 0Post-Project, Medium Impact Sites 0.033 0 0Post-Project, Low Impact Sites 0.033 0 0Pre-Project 123.3 123.3Post-Project, High Impact Sites 24.66 98.64 24.66 98.64 0Post-Project, Medium Impact Sites 123.3 123.3 0Post-Project, Low Impact Sites 123.3 123.3 0Pre-Project 0.025 0Post-Project, High Impact Sites 0.005 0.02 0 0 0Post-Project, Medium Impact Sites 0.025 0 0Post-Project, Low Impact Sites 0.025 0 0Pre-Project 142.4 142.4Post-Project, High Impact Sites 28.48 113.92 28.48 113.92 0Post-Project, Medium Impact Sites 142.4 142.4 0Post-Project, Low Impact Sites 142.4 142.4 0Pre-Project 0.007 0Post-Project, High Impact Sites 0.0014 0.0056 0 0 0Post-Project, Medium Impact Sites 0.007 0 0Post-Project, Low Impact Sites 0.007 0 0Pre-Project 4.13 4.13Post-Project, High Impact Sites 0.826 3.304 0.826 3.304 0Post-Project, Medium Impact Sites 4.13 4.13 0Post-Project, Low Impact Sites 4.13 4.13 0Pre-Project 0.013 0Post-Project, High Impact Sites 0.0026 0.0104 0 0 0Post-Project, Medium Impact Sites 0.013 0 0Post-Project, Low Impact Sites 0.013 0 0Pre-Project 31.12 31.12Post-Project, High Impact Sites 6.224 24.896 6.224 24.896 0Post-Project, Medium Impact Sites 31.12 31.12 0Post-Project, Low Impact Sites 31.12 31.12 0Pre-Project 0.8 14.05Post-Project, High Impact Sites 0.16 0.64 2.81 11.24 0Post-Project, Medium Impact Sites 0.8 14.05 0Post-Project, Low Impact Sites 0.8 14.05 0
0.1 0
31.12 0 0.05
Deforestation rate 0Percentag
e
0.05 83.43152969
Indri indri density 0.013 number/ha 0.1 126.1979604
83.42072484Indri indri
vulnerability index
number/ha
Prolemur simus vulnerability index
4.13 0
83.45771876Propithecus
diadema vulnerability index
123.3 0 0.05 NT
0.05 83.40387129Allocebus trichotis vulnerability index
Propithecus diadema Density
0.033
142.4 0
0.1 135.9054958Prolemur simus
density0.007
Basal area
Mean tree height canopy
Stems
83.63 number/ha
Top height tree 14.54 Meter
Tree species density
Allocebus trichotis density
0.025 number/ha
9.98
0.1 126.96844
NT
NT
NT
Disturbed
1587.963 497.7
…of Condition Class 2:
0
… of Condition Class 1:
0 0 0
0 0
PondsGood forest
Wei
ghtReference Level Good forest
0.1
79.646191080.05
stems/ha1118
Attribute
Square meters/ha
22.16
0.1
140.3924932
0.025
0.1 128.2509495
0.025
Good forest is the average of : P.5, 6, 9, 12, 14, & 18; Disturbed forest
average of : P. 10 &20
No mitigation Year _0
38.33862607
40.02581418
146.7885821
NT
NT
NT
Condition Class 1:
Trad'ble/ Non?
(T/NT)
BENCHMARK
Meter
NT
NT
NT
NT
NT
NT
NT
Disturbed
Condition Class 3:
Ponds
2. Fill in the area of … (enter "0" for non-relevent
condition classes and impact levels)
3. For each relevant condition class and impact level below, please fill in the condition/level of the attribute in question…
Pre/Post-Project ConditionsHabitat
Hectares Lost
Rationale(enter comments explaining data in
columns B to Q)
0
0
Condition Class 2:
CALCULATING BIODIVERSITY LOSS AT IMPACT SITE(Quantifcation of Biodiversity Loss Through Project Impact, via Habitat Hectares)
ForestHabitat Type 1:
…of Condition Class 3:
1. To the left, label each pre-project site condition class found.
(Three or less. e.g. "pristine", "good", "degraded", or "good", "poor", etc.)
1587.963 497.7

Appendix 3: Key Biodiversity Components Matrix (KBCM) and Habitat Hectares Score, April 2008 Iteration 84
BBOP Pilot Project Case Study – Ambatovy Project
Habitat hectares lost – 40% mitigation
Total Habitat Hectares Lost:
972
Each Site Class…
Post-Project, High Impact Sites…
Post-Project, Medium Impact Sites…
Post-Project, Low Impact Sites…
#Units/Bands
Condition/Level
Net Loss
Condition/Level
Net Loss
Condition/Level
Net Loss
Pre-Project 1004.75 735.57Post-Project, High Impact Sites 401.9 602.85 294.228 441.34 0Post-Project, Medium Impact Sites 1004.8 735.57 0Post-Project, Low Impact Sites 1004.8 735.57 0Pre-Project 23.22 14.57Post-Project, High Impact Sites 9.288 13.932 5.828 8.742 0Post-Project, Medium Impact Sites 23.22 14.57 0Post-Project, Low Impact Sites 23.22 14.57 0Pre-Project 9.07 9.5Post-Project, High Impact Sites 3.628 5.442 3.8 5.7 0Post-Project, Medium Impact Sites 9.07 9.5 0Post-Project, Low Impact Sites 9.07 9.5 0Pre-Project 13.57 15.17Post-Project, High Impact Sites 5.428 8.142 6.068 9.102 0Post-Project, Medium Impact Sites 13.57 15.17 0Post-Project, Low Impact Sites 13.57 15.17 0Pre-Project 85.08 36.86Post-Project, High Impact Sites 34.032 51.048 14.744 22.116 0Post-Project, Medium Impact Sites 85.08 36.86 0Post-Project, Low Impact Sites 85.08 36.86 0Pre-Project 0.033 0Post-Project, High Impact Sites 0.0132 0.0198 0 0 0Post-Project, Medium Impact Sites 0.033 0 0Post-Project, Low Impact Sites 0.033 0 0Pre-Project 123.3 123.3Post-Project, High Impact Sites 49.32 73.98 49.32 73.98 0Post-Project, Medium Impact Sites 123.3 123.3 0Post-Project, Low Impact Sites 123.3 123.3 0Pre-Project 0.025 0Post-Project, High Impact Sites 0.01 0.015 0 0 0Post-Project, Medium Impact Sites 0.025 0 0Post-Project, Low Impact Sites 0.025 0 0Pre-Project 142.4 142.4Post-Project, High Impact Sites 56.96 85.44 56.96 85.44 0Post-Project, Medium Impact Sites 142.4 142.4 0Post-Project, Low Impact Sites 142.4 142.4 0Pre-Project 0.007 0Post-Project, High Impact Sites 0.0028 0.0042 0 0 0Post-Project, Medium Impact Sites 0.007 0 0Post-Project, Low Impact Sites 0.007 0 0Pre-Project 4.13 4.13Post-Project, High Impact Sites 1.652 2.478 1.652 2.478 0Post-Project, Medium Impact Sites 4.13 4.13 0Post-Project, Low Impact Sites 4.13 4.13 0Pre-Project 0.013 0Post-Project, High Impact Sites 0.0052 0.0078 0 0 0Post-Project, Medium Impact Sites 0.013 0 0Post-Project, Low Impact Sites 0.013 0 0Pre-Project 31.12 31.12Post-Project, High Impact Sites 12.448 18.672 12.448 18.672 0Post-Project, Medium Impact Sites 31.12 31.12 0Post-Project, Low Impact Sites 31.12 31.12 0Pre-Project 0.8 14.05Post-Project, High Impact Sites 0.32 0.48 5.62 8.43 0Post-Project, Medium Impact Sites 0.8 14.05 0Post-Project, Low Impact Sites 0.8 14.05 0
Condition Class 2:
CALCULATING BIODIVERSITY LOSS AT IMPACT SITE(Quantifcation of Biodiversity Loss Through Project Impact, via Habitat Hectares)
ForestHabitat Type 1:
…of Condition Class 3:
1. To the left, label each pre-project site condition class found.
(Three or less. e.g. "pristine", "good", "degraded", or "good", "poor", etc.)
1587.963 497.7
DisturbedCondition Class 3:
Ponds
2. Fill in the area of … (enter "0" for non-relevent
condition classes and impact levels)
3. For each relevant condition class and impact level below, please fill in the condition/level of the attribute in question…
Pre/Post-Project ConditionsHabitat
Hectares Lost
Rationale(enter comments explaining data in
columns B to Q)
0
0
NT
NT
NT
NT
NT
NT
NT
NT
NT
NT
Condition Class 1:
Trad'ble/ Non?
(T/NT)
BENCHMARK
Meter 28.75396955
30.01936064
110.0914366
Good forest is the average of : P.5, 6, 9, 12, 14, & 18; Disturbed forest
average of : P. 10 &20
No mitigation Year _0
Attribute
Square meters/ha
22.16
0.1
105.2943699
0.025
0.1 96.18821212
0.025
Wei
ghtReference Level Good forest
0.1
59.734643310.05
stems/ha1118
0
… of Condition Class 1:
0 0 0
0 0
PondsGood forest Disturbed
1587.963 497.7
…of Condition Class 2:
0.1 95.22633
NT
NT
NT
Allocebus trichotis density
0.025 number/ha
9.98
Basal area
Mean tree height canopy
Stems
83.63 number/ha
Top height tree 14.54 Meter
Tree species density
Propithecus diadema Density
0.033
142.4 0
0.1 101.9291218Prolemur simus
density0.007
62.59328907Propithecus
diadema vulnerability index
123.3 0 0.05 NT
0.05 62.55290347Allocebus trichotis vulnerability index
number/ha
Prolemur simus vulnerability index
4.13 0 0.05 62.57364727
Indri indri density 0.013 number/ha 0.1 94.64847026
62.56554363Indri indri
vulnerability index31.12 0 0.05
Deforestation rate 0Percentag
e0.1 0

Appendix 3: Key Biodiversity Components Matrix (KBCM) and Habitat Hectares Score, April 2008 Iteration 85
BBOP Pilot Project Case Study – Ambatovy Project
Habitat hectares lost – 75% mitigation
Total Habitat Hectares Lost:
405
Each Site Class…
Post-Project, High Impact Sites…
Post-Project, Medium Impact Sites…
Post-Project, Low Impact Sites…
#Units/Bands
Condition/Level
Net Loss
Condition/Level
Net Loss
Condition/Level
Net Loss
Pre-Project 1004.75 735.57Post-Project, High Impact Sites 753.5625 251.19 551.6775 183.89 0Post-Project, Medium Impact Sites 1004.8 735.57 0Post-Project, Low Impact Sites 1004.8 735.57 0Pre-Project 23.22 14.57Post-Project, High Impact Sites 17.415 5.805 10.9275 3.6425 0Post-Project, Medium Impact Sites 23.22 14.57 0Post-Project, Low Impact Sites 23.22 14.57 0Pre-Project 9.07 9.5Post-Project, High Impact Sites 6.8025 2.2675 7.125 2.375 0Post-Project, Medium Impact Sites 9.07 9.5 0Post-Project, Low Impact Sites 9.07 9.5 0Pre-Project 13.57 15.17Post-Project, High Impact Sites 10.1775 3.3925 11.3775 3.7925 0Post-Project, Medium Impact Sites 13.57 15.17 0Post-Project, Low Impact Sites 13.57 15.17 0Pre-Project 85.08 36.86Post-Project, High Impact Sites 63.81 21.27 27.645 9.215 0Post-Project, Medium Impact Sites 85.08 36.86 0Post-Project, Low Impact Sites 85.08 36.86 0Pre-Project 0.033 0Post-Project, High Impact Sites 0.02475 0.0083 0 0 0Post-Project, Medium Impact Sites 0.033 0 0Post-Project, Low Impact Sites 0.033 0 0Pre-Project 123.3 123.3Post-Project, High Impact Sites 92.475 30.825 92.475 30.825 0Post-Project, Medium Impact Sites 123.3 123.3 0Post-Project, Low Impact Sites 123.3 123.3 0Pre-Project 0.025 0Post-Project, High Impact Sites 0.01875 0.0063 0 0 0Post-Project, Medium Impact Sites 0.025 0 0Post-Project, Low Impact Sites 0.025 0 0Pre-Project 142.4 142.4Post-Project, High Impact Sites 106.8 35.6 106.8 35.6 0Post-Project, Medium Impact Sites 142.4 142.4 0Post-Project, Low Impact Sites 142.4 142.4 0Pre-Project 0.007 0Post-Project, High Impact Sites 0.00525 0.0018 0 0 0Post-Project, Medium Impact Sites 0.007 0 0Post-Project, Low Impact Sites 0.007 0 0Pre-Project 4.13 4.13Post-Project, High Impact Sites 3.0975 1.0325 3.0975 1.0325 0Post-Project, Medium Impact Sites 4.13 4.13 0Post-Project, Low Impact Sites 4.13 4.13 0Pre-Project 0.013 0Post-Project, High Impact Sites 0.00975 0.0033 0 0 0Post-Project, Medium Impact Sites 0.013 0 0Post-Project, Low Impact Sites 0.013 0 0Pre-Project 31.12 31.12Post-Project, High Impact Sites 23.34 7.78 23.34 7.78 0Post-Project, Medium Impact Sites 31.12 31.12 0Post-Project, Low Impact Sites 31.12 31.12 0Pre-Project 0.8 14.05Post-Project, High Impact Sites 0.6 0.2 10.5375 3.5125 0Post-Project, Medium Impact Sites 0.8 14.05 0Post-Project, Low Impact Sites 0.8 14.05 0
Condition Class 2:
CALCULATING BIODIVERSITY LOSS AT IMPACT SITE(Quantifcation of Biodiversity Loss Through Project Impact, via Habitat Hectares)
ForestHabitat Type 1:
…of Condition Class 3:
1. To the left, label each pre-project site condition class found.
(Three or less. e.g. "pristine", "good", "degraded", or "good", "poor", etc.)
1587.963 497.7
DisturbedCondition Class 3:
Ponds
2. Fill in the area of … (enter "0" for non-relevent
condition classes and impact levels)
3. For each relevant condition class and impact level below, please fill in the condition/level of the attribute in question…
Pre/Post-Project ConditionsHabitat
Hectares Lost
Rationale(enter comments explaining data in
columns B to Q)
0
0
NT
NT
NT
NT
NT
NT
NT
NT
NT
NT
Condition Class 1:
Trad'ble/ Non?
(T/NT)
BENCHMARK
Meter 11.98082065
12.50806693
45.87143191
Good forest is the average of : P.5, 6, 9, 12, 14, & 18; Disturbed forest
average of : P. 10 &20
No mitigation Year _0
Attribute
Square meters/ha
22.16
0.1
43.87265413
0.025
0.1 40.07842172
0.025
Wei
ghtReference Level Good forest
0.1
24.889434710.05
stems/ha1118
0
… of Condition Class 1:
0 0 0
0 0
PondsGood forest Disturbed
1587.963 497.7
…of Condition Class 2:
0.1 39.6776375
NT
NT
NT
Allocebus trichotis density
0.025 number/ha
9.98
Basal area
Mean tree height canopy
Stems
83.63 number/ha
Top height tree 14.54 Meter
Tree species density
Propithecus diadema Density
0.033
142.4 0
0.1 42.47046743Prolemur simus
density0.007
26.08053711Propithecus
diadema vulnerability index
123.3 0 0.05 NT
0.05 26.06370978Allocebus trichotis vulnerability index
number/ha
Prolemur simus vulnerability index
4.13 0 0.05 26.07235303
Indri indri density 0.013 number/ha 0.1 39.43686261
26.06897651Indri indri
vulnerability index31.12 0 0.05
Deforestation rate 0Percentag
e0.1 0

Appendix 3: Key Biodiversity Components Matrix (KBCM) and Habitat Hectares Score, April 2008 Iteration 86
BBOP Pilot Project Case Study – Ambatovy Project
Total Habitat Hectares Lost:
162
Each Site Class…
Post-Project, High Impact Sites…
Post-Project, Medium Impact Sites…
Post-Project, Low Impact Sites…
#Units/Bands
Condition/Level
Net Loss
Condition/Level
Net Loss
Condition/Level
Net Loss
Pre-Project 1004.75 735.57Post-Project, High Impact Sites 904.275 100.48 662.013 73.557 0Post-Project, Medium Impact Sites 1004.8 735.57 0Post-Project, Low Impact Sites 1004.8 735.57 0Pre-Project 23.22 14.57Post-Project, High Impact Sites 20.898 2.322 13.113 1.457 0Post-Project, Medium Impact Sites 23.22 14.57 0Post-Project, Low Impact Sites 23.22 14.57 0Pre-Project 9.07 9.5Post-Project, High Impact Sites 8.163 0.907 8.55 0.95 0Post-Project, Medium Impact Sites 9.07 9.5 0Post-Project, Low Impact Sites 9.07 9.5 0Pre-Project 13.57 15.17Post-Project, High Impact Sites 12.213 1.357 13.653 1.517 0Post-Project, Medium Impact Sites 13.57 15.17 0Post-Project, Low Impact Sites 13.57 15.17 0Pre-Project 85.08 36.86Post-Project, High Impact Sites 76.572 8.508 33.174 3.686 0Post-Project, Medium Impact Sites 85.08 36.86 0Post-Project, Low Impact Sites 85.08 36.86 0Pre-Project 0.033 0Post-Project, High Impact Sites 0.0297 0.0033 0 0 0Post-Project, Medium Impact Sites 0.033 0 0Post-Project, Low Impact Sites 0.033 0 0Pre-Project 123.3 123.3Post-Project, High Impact Sites 110.97 12.33 110.97 12.33 0Post-Project, Medium Impact Sites 123.3 123.3 0Post-Project, Low Impact Sites 123.3 123.3 0Pre-Project 0.025 0Post-Project, High Impact Sites 0.0225 0.0025 0 0 0Post-Project, Medium Impact Sites 0.025 0 0Post-Project, Low Impact Sites 0.025 0 0Pre-Project 142.4 142.4Post-Project, High Impact Sites 128.16 14.24 128.16 14.24 0Post-Project, Medium Impact Sites 142.4 142.4 0Post-Project, Low Impact Sites 142.4 142.4 0Pre-Project 0.007 0Post-Project, High Impact Sites 0.0063 0.0007 0 0 0Post-Project, Medium Impact Sites 0.007 0 0Post-Project, Low Impact Sites 0.007 0 0Pre-Project 4.13 4.13Post-Project, High Impact Sites 3.717 0.413 3.717 0.413 0Post-Project, Medium Impact Sites 4.13 4.13 0Post-Project, Low Impact Sites 4.13 4.13 0Pre-Project 0.013 0Post-Project, High Impact Sites 0.0117 0.0013 0 0 0Post-Project, Medium Impact Sites 0.013 0 0Post-Project, Low Impact Sites 0.013 0 0Pre-Project 31.12 31.12Post-Project, High Impact Sites 28.008 3.112 28.008 3.112 0Post-Project, Medium Impact Sites 31.12 31.12 0Post-Project, Low Impact Sites 31.12 31.12 0Pre-Project 0.8 14.05Post-Project, High Impact Sites 0.72 0.08 12.645 1.405 0Post-Project, Medium Impact Sites 0.8 14.05 0Post-Project, Low Impact Sites 0.8 14.05 0
0.1 0
31.12 0 0.05
Deforestation rate 0Percentag
e
0.05 10.42894121
Indri indri density 0.013 number/ha 0.1 15.77474504
10.4275906Indri indri
vulnerability index
number/ha
Prolemur simus vulnerability index
4.13 0
10.43221485Propithecus
diadema vulnerability index
123.3 0 0.05 NT
0.05 10.42548391Allocebus trichotis vulnerability index
Propithecus diadema Density
0.033
142.4 0
0.1 16.98818697Prolemur simus
density0.007
Basal area
Mean tree height canopy
Stems
83.63 number/ha
Top height tree 14.54 Meter
Tree species density
Allocebus trichotis density
0.025 number/ha
9.98
0.1 15.871055
NT
NT
NT
Disturbed
1587.963 497.7
…of Condition Class 2:
0
… of Condition Class 1:
0 0 0
0 0
PondsGood forest
Wei
ghtReference Level Good forest
0.1
9.9557738850.05
stems/ha1118
Attribute
Square meters/ha
22.16
0.1
17.54906165
0.025
0.1 16.03136869
0.025
Good forest is the average of : P.5, 6, 9, 12, 14, & 18; Disturbed forest
average of : P. 10 &20
No mitigation Year _0
4.792328259
5.003226773
18.34857277
NT
NT
NT
Condition Class 1:
Trad'ble/ Non? (T/NT)
BENCHMARK
Meter
NT
NT
NT
NT
NT
NT
NT
DisturbedCondition Class 3:
Ponds
2. Fill in the area of … (enter "0" for non-relevent
condition classes and impact levels)
3. For each relevant condition class and impact level below, please fill in the condition/level of the attribute in question…
Pre/Post-Project Conditions Habitat Hectares Lost
Rationale(enter comments explaining data in
columns B to Q)
0
0
Condition Class 2:
CALCULATING BIODIVERSITY LOSS AT IMPACT SITE(Quantifcation of Biodiversity Loss Through Project Impact, via Habitat Hectares)
ForestHabitat Type 1:
…of Condition Class 3:
1. To the left, label each pre-project site condition class found.
(Three or less. e.g. "pristine", "good", "degraded", or "good", "poor", etc.)
1587.963 497.7
Habitat hectares lost – 90% mitigation

87
BBOP Pilot Project Case Study – Ambatovy Project
Appendix 4: Mine Footprint Status Sheet, 2nd Iteration

Appendix 4: Mine Footprint Status Sheet, 2nd Iteration 88
BBOP Pilot Project Case Study – Ambatovy Project

Appendix 4: Mine Footprint Status Sheet, 2nd Iteration 89
BBOP Pilot Project Case Study – Ambatovy Project

Appendix 4: Mine Footprint Status Sheet, 2nd Iteration 90
BBOP Pilot Project Case Study – Ambatovy Project
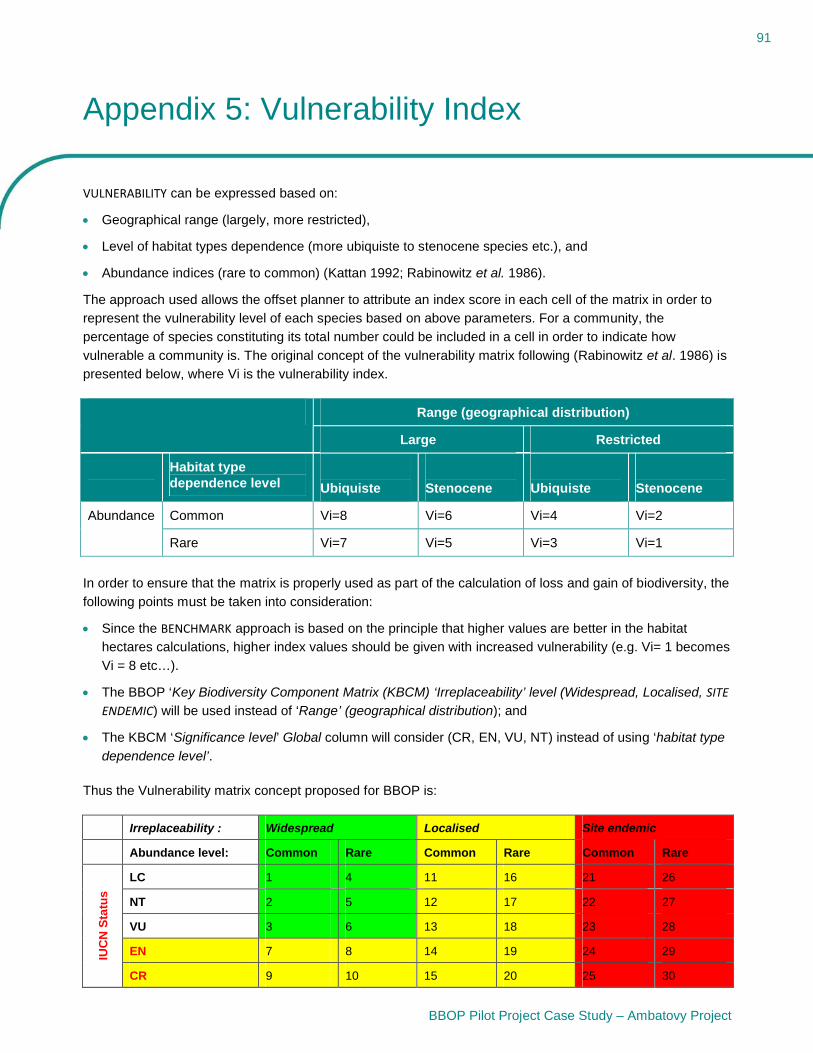
91
BBOP Pilot Project Case Study – Ambatovy Project
Appendix 5: Vulnerability Index
VULNERABILITY can be expressed based on:
Geographical range (largely, more restricted),
Level of habitat types dependence (more ubiquiste to stenocene species etc.), and
Abundance indices (rare to common) (Kattan 1992; Rabinowitz et al. 1986).
The approach used allows the offset planner to attribute an index score in each cell of the matrix in order to
represent the vulnerability level of each species based on above parameters. For a community, the
percentage of species constituting its total number could be included in a cell in order to indicate how
vulnerable a community is. The original concept of the vulnerability matrix following (Rabinowitz et al. 1986) is
presented below, where Vi is the vulnerability index.
Range (geographical distribution)
Large Restricted
Habitat type dependence level Ubiquiste Stenocene Ubiquiste Stenocene
Common Vi=8 Vi=6 Vi=4 Vi=2Abundance
Rare Vi=7 Vi=5 Vi=3 Vi=1
In order to ensure that the matrix is properly used as part of the calculation of loss and gain of biodiversity, the
following points must be taken into consideration:
Since the BENCHMARK approach is based on the principle that higher values are better in the habitat
hectares calculations, higher index values should be given with increased vulnerability (e.g. Vi= 1 becomes
Vi = 8 etc…).
The BBOP ‘Key Biodiversity Component Matrix (KBCM) ‘Irreplaceability’ level (Widespread, Localised, SITE ENDEMIC) will be used instead of ‘Range’ (geographical distribution); and
The KBCM ‘Significance level’ Global column will consider (CR, EN, VU, NT) instead of using ‘habitat type
dependence level’.
Thus the Vulnerability matrix concept proposed for BBOP is:
Irreplaceability : Widespread Localised Site endemic
Abundance level: Common Rare Common Rare Common Rare
LC 1 4 11 16 21 26
NT 2 5 12 17 22 27
VU 3 6 13 18 23 28
EN 7 8 14 19 24 29IUC
N S
tatu
s
CR 9 10 15 20 25 30

Appendix 5: Vulnerability Index 92
BBOP Pilot Project Case Study – Ambatovy Project
There are several ways to obtain ATTRIBUTES from the species Vulnerability matrix:
1. Fit all KBCM fauna and flora species into the matrix and assign a Vi number (1 to 30) and then simply
compare to the total number of species in the community considered with how many have specific Vi
numbers.
2. Determine the % of species with specific Vi numbers. For example, for all tree species assume that 30% of
those recorded in the benchmark have a Vi of 19 (EN, rare, localised), equating to 30% x 19 = 57. This can
be repeated for other Vi indices and finally a sum for the entire matrix table can be generated (for example
560). This value of 560 can then be compared with values for tree species from the impact site etc.
3. Taking a smaller community group, e.g. all lemur species, and proceed as above, assigning each species
a Vi score and then multiplying it with species biological data (e.g. density / ha) in order to obtain a sum for
each site. The higher the total Vi score is, the higher is the vulnerability of this group (note that the density
in the excel table is set at 1 until further data is collected during subsequent at Ambatovy).
The Vulnerability matrix developed by Ambatovy is presented below. This matrix was developed in April 2008,
as part of the second iteration of the benchmark and loss assessment7.
Table A5.1: Fauna and flora species Vulnerability matrix (April 2008)
Irreplacebility :Abundance level:
Nocturnal/diurnalAbility to move away
from impact Y N Y N Y N Y N Y N Y N Y N Y N Y N Y N Y N Y N
LC 1 4 7 10 13 16 19 22 41 46 51 56 61 66 71 76 81 86 91 96 101 106 111 116NT 2 5 8 11 14 17 20 23 42 47 52 57 62 67 72 77 82 87 92 97 102 107 112 117VU 3 6 9 12 15 18 21 24 43 48 53 58 63 68 73 78 83 88 93 98 103 108 113 118EN 25 26 27 28 29 30 31 32 44 49 54 59 64 69 74 79 84 89 94 99 104 109 114 119CR 33 34 35 36 37 38 39 40 45 50 55 60 65 70 75 80 85 90 95 100 105 110 115 120
Site endemicCommon RareRare
LocalisedCommon
Diurnal Nocturnal Diurnal Nocturnal
Widespread
IUC
N S
tatu
s
RareCommon
Diunral Nocturnal Diunral Nocturnal Diurnal Nocturnal Diurnal Nocturnal
A worked example of the application of the matrix to the Ambatovy KBCM is presented below (extract of
Ambatovy Project BBOP Bonn report (April 2008)).
Table A5.2: Key Biodiversity Components Matrix (KBCM) Vulnerability scores (April 2008)
Amabtovy KBCM Species IUCN Widespread LocalisedSite
endemic RareDiurnal/Noct:
D/NMoves:
Y/NVulnerabilty
indices'
Prolemur simus CR X X 65
Propithecus d. diadema CRX
Indri indri EN X
Allocebus trichotis EN X X 74
Daubentonia madagascarensis EN
X
Eulemur rubriventer VU XBirds Tyto soumagnei EN X
Platypelis sp. nov NE XScaphiophryne marmorata VU XRhombophryne coronata VU XMantella aurantiaca CR XMantella crocea EN XMantidactylus plicifer NT XPararhadinaea sp.nov NE XSanzinia madagascariensis VU XRatsirakia sp NE ?Rheocles sp NE ?Aloe leandri NE XAsteropeia micraster EN XLeptolaena multiflora EN XDalbergia baroni VU XCyathea dregei NE XCyathea cf tsaratananensis NE ?
Lemurs
Herptiles
Fish
Plants
7 Ambatovy Project BBOP Bonn report (April 2008), with revised Benchmark selection and losses calculations, including KBCM matrix update with species quantitative data).

Appendix 5: Vulnerability Index 93
BBOP Pilot Project Case Study – Ambatovy Project
Note that the results of the Biodiversity Assessment in relation to intrinsic NON-USE VALUES and USE VALUES are
presented in the KBCM sheet of the April 2008 report.
December 2008 iteration: the Project believes that the use of the Vulnerability attributes still requires more in
depth analysis, which will be conduced in 2009: the justifications for excluding the vulnerability index in the
December 2008 calculations are that:
This attribute should be calculated by taxonomic group not by single species as was done in the April 2008
report: this index is a product of the combination of the IUCN status and that of relative abundance;
Abundance is already considered in the other attributes for each species. Calculating the vulnerability
index by taxonomic group (not single species) will give a greater ‘overall scope’ of the vulnerability and
irreplaceability:
– The index will provide a more scientific approach to determining the group requiring most effort for on-
site conservation relative to other selected species.
– It gives first same value (weight) for the various taxonomic groups. In fact not only species must avoid
EXTIRPATION, but also the overall ecosystem characteristics should be offset. Among the latter is the
community composition that can be tackled through a biodiversity vulnerability index. Furthermore, a
gain on the vulnerability index by a taxonomic group will be more significant for biodiversity and
ECOSYSTEM SERVICES than a gain for a single species.

94
BBOP Pilot Project Case Study – Ambatovy Project
Appendix 6: Survey for Off-site Azonal Outcrops
Volume J
Section 1.1
Attachment 2
Survey for off-site azonal outcrops

Appendix 6: Survey for Off-site Azonal Outcrops 95
BBOP Pilot Project Case Study – Ambatovy Project

Appendix 6: Survey for Off-site Azonal Outcrops 96
BBOP Pilot Project Case Study – Ambatovy Project

Appendix 6: Survey for Off-site Azonal Outcrops 97
BBOP Pilot Project Case Study – Ambatovy Project

Appendix 6: Survey for Off-site Azonal Outcrops 98
BBOP Pilot Project Case Study – Ambatovy Project

Appendix 6: Survey for Off-site Azonal Outcrops 99
BBOP Pilot Project Case Study – Ambatovy Project

Appendix 6: Survey for Off-site Azonal Outcrops 100
BBOP Pilot Project Case Study – Ambatovy Project

Appendix 6: Survey for Off-site Azonal Outcrops 101
BBOP Pilot Project Case Study – Ambatovy Project

Appendix 6: Survey for Off-site Azonal Outcrops 102
BBOP Pilot Project Case Study – Ambatovy Project

Appendix 6: Survey for Off-site Azonal Outcrops 103
BBOP Pilot Project Case Study – Ambatovy Project
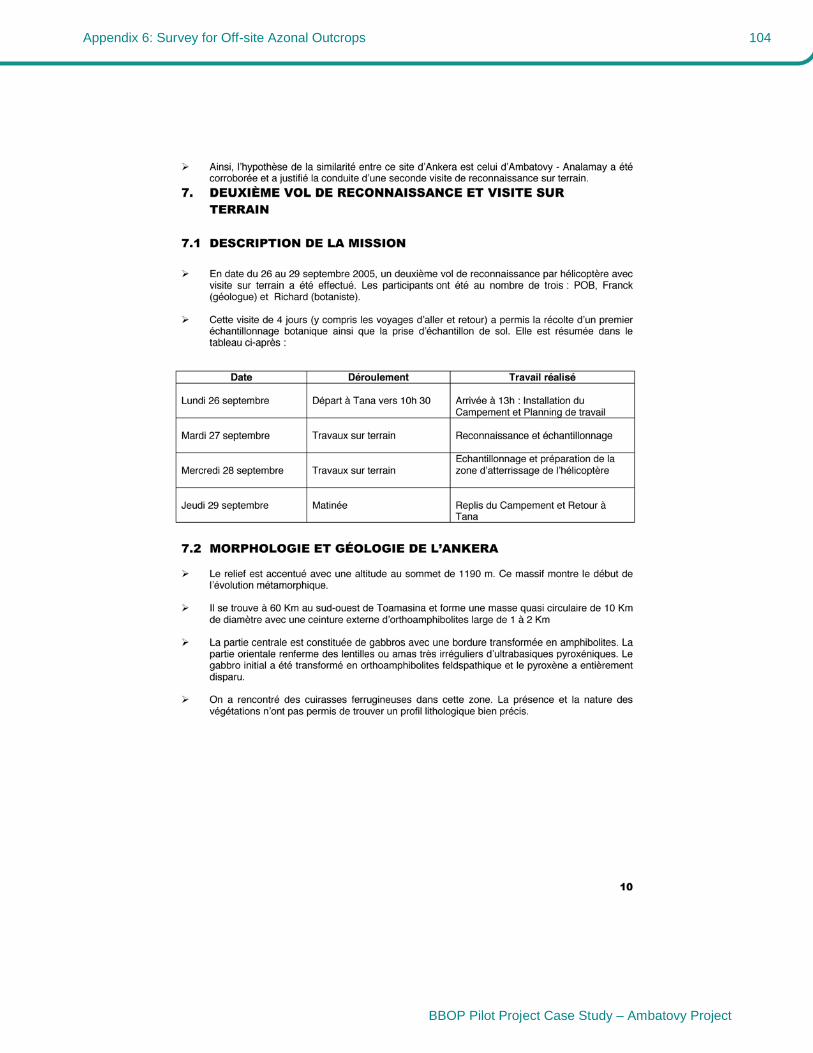
Appendix 6: Survey for Off-site Azonal Outcrops 104
BBOP Pilot Project Case Study – Ambatovy Project

Appendix 6: Survey for Off-site Azonal Outcrops 105
BBOP Pilot Project Case Study – Ambatovy Project

Appendix 6: Survey for Off-site Azonal Outcrops 106
BBOP Pilot Project Case Study – Ambatovy Project

Appendix 6: Survey for Off-site Azonal Outcrops 107
BBOP Pilot Project Case Study – Ambatovy Project

Appendix 6: Survey for Off-site Azonal Outcrops 108
BBOP Pilot Project Case Study – Ambatovy Project
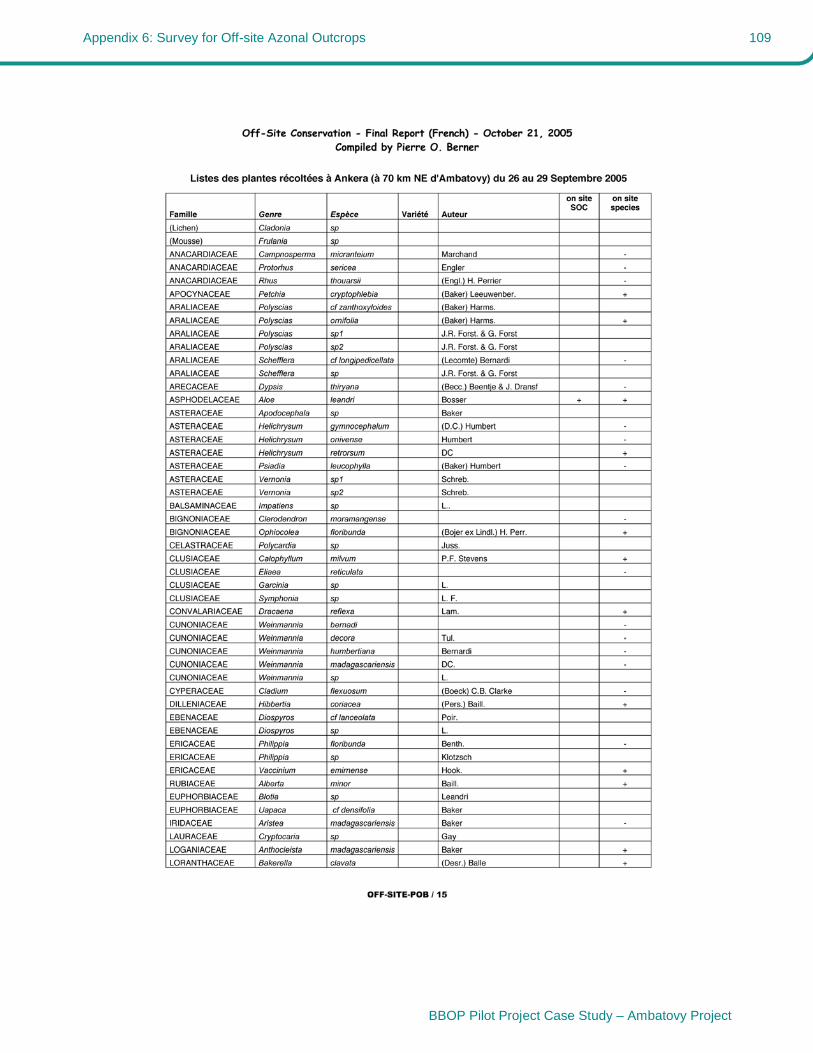
Appendix 6: Survey for Off-site Azonal Outcrops 109
BBOP Pilot Project Case Study – Ambatovy Project

Appendix 6: Survey for Off-site Azonal Outcrops 110
BBOP Pilot Project Case Study – Ambatovy Project

Appendix 6: Survey for Off-site Azonal Outcrops 111
BBOP Pilot Project Case Study – Ambatovy Project

Appendix 6: Survey for Off-site Azonal Outcrops 112
BBOP Pilot Project Case Study – Ambatovy Project

Appendix 6: Survey for Off-site Azonal Outcrops 113
BBOP Pilot Project Case Study – Ambatovy Project

Appendix 6: Survey for Off-site Azonal Outcrops 114
BBOP Pilot Project Case Study – Ambatovy Project

115
BBOP Pilot Project Case Study – Ambatovy Project
Appendix 7: Comparison of Ambatovy / Analamay and Ankerana Azonal Habitats

To learn more about the BBOP principles, guidelines and optional methodologies, go to:
www.forest-trends.org/biodiversityoffsetprogram/guidelines