Embed Size (px)
Citation preview

Business
Administration

1360
ENVIRONMENTAL FINANCING-INCENTIVE FINANCING FOR ENERGY
EFFICIENCY IN JAPAN
Keiki Fujita Obirin University 3758, Tokiwa-Cho
Machida-city, 194, Tokyo Japan
Tel +31 42 797 947 E-mail: [email protected]
1. Introduction
It becomes a serious global problem to everybody that the burden of the modern industrialization on the environment is approaching the limit of nature�s capacity. If humans continue to depend on the present social systems and lifestyles, the world of future will face an environmental catastrophe. It is also of big concern that wars and conflicts could break out over the limited energy resources, food and other resources.
In order to use energy effectively, it must be used efficiently. It is also important not simply to minimize energy consumption, but to consider the effects of energy use on the natural environment, taking into consideration of the global environment as well as the environmental costs.
Japan�s energy demand-supply structure changed much with the promotion of strenuous efforts for energy conservation in the aftermath of past two oil crises, by 1991. Japan had achieved an approximately 35% improvement in energy efficiency compared with the level in 1973 and now ranks at the top level among the countries of the world in terms of energy conservation. This promotion has been made by close tie up between environmental financing and technical development. In this paper major progress of this two factors have been described.
2. Energy situation of Japan
Japan focused its priority energy conservation measures specifically on the industrial sector, which then account for more than half of Japan�s total

1361
energy consumption, and this led to remarkable improvements in energy intensity and gave international trade competency.
Figure 1: Changes in Final Energy Consumption from 1970
(Source: Comprehensive Energy Statistics (preliminary figure for FY2000))
Figure 2 Changes in Final Energy Consumption by Sector from 1990
(Source: Comprehensive Energy Statistics (preliminary figure for FY2000))

1362
Since 1991, however, energy intensity has been showing a tendency to increase, mainly due to increased energy consumption by the residential, commercial and transportation sectors as a result of the public�s pursuit of convenience and comfort in daily life. In the industrial sector as well, the energy consumption trend is somewhat on the rise as a result of the diversification of products and the increased value added factor.
Japan�s level of dependence on oil has decreased drastically since the two oil crises. On the other hand, nuclear energy and natural gas have grown in importance in their supply share of energy. Consumption of nuclear energy has increased from 1% in 1973 to 12% in 2000, while natural gas has increased from 2% in 1973 to 13% in2000. Figure 3: Energy Intensity per industrial production index in Japan
Energy consumption in the industrial sector has been generally steady since oil crisis. Energy consumption unit per industrial production index for the manufacturing industry experienced sharp fall through to the 1980S, but has been on a trend of slight increase since the 1990s.
However Japan�s energy consumption unit against GDP in the industrial sector is lower than those of other major countries.

1363
Figure 4: Unit Energy Consumption per GDP
At the COP3 held in December 1997 at Kyoto Japan, Japan set a goal of reducing its green gas emissions for the 2008-2012 period by 6 % from the level in 1990, and thus it needs to make further efforts to improve energy efficiency.
Under these circumstances, energy conservation measures currently being taken in Japan include both reinforcing regulations, such as the amendment of the�Conservation Law� and providing incentives for investment in energy conservation through financial support.
Unit Energy Consumption per GDP in the IndustrialSector by Country
1 .1 71 .1 0
1 .3 3
1 .6 5
1 .00
0
0.5
1
1 .5
2
GGeerrmmaannyy FFrraanncceeUU..SS..JJaappaann UU..KK..

1364
Table 1 Japan has made a CO2 reduction plan by several measures.
Breakdown of the -5% Reduction in Greenhouse Gases
-2.50% Emission control of CO2, methane, and nitrous oxide
-3.70% Carbon dioxide sinks due to changes in land use and forest management
2.00% Control of emissions of CFC alternatives, etc. (HFC, PFC, SF6)
Remaining(-1.8%) Use of Joint Implementation and emission trading, etc.
Reference: The previous "Long-Term Supply and Demand Outlook" In June 1998, the previous "Long-Term Supply and Demand Outlook" was put together following COP3.
3. Energy Conservation Law and Financing
The�Energy Conservation Law�,which has enacted in 1979 as a fundamental law to promote energy conservation in Japan, stipulates the measures to be taken regarding facilities and equipment that use large amount of energy, such as factories, buildings, household electrical appliances and automobiles.
The Energy Conservation law was amended in June 1998, and come into effect as of April 1999. Table 2: Fundamental issues for promoting rational use of energy
1. Measures to be taken by the central and local governments themselves as energy users, etc.
2. Support to capital investment, etc. 3. Support to energy management 4. Support to technical development 5. Support to the introduction and diffusion of optimum energy supply-
demand systems in areas 6. Promotion of research and development, etc. 7. Education, public relations, etc. to people
3.1 Tax incentives
The �Tax System for Investment in Reformation of Energy Supply and Demand Structure� was established in 1978 with a view to facilitating the equipment investment involved in energy conservation. In reforming the tax

1365
system several times, it was reviewed in line with the technical development, etc, of the subject equipment.
Table 3 Tax Incentives Intended for Tax incentives �124facilities �64facilities for small and medium companies �others
System approved on the basis of the �Assistance Law� (Improvement of 5% energy intensity or 1,500kl energy saving)
1 Tax exemption equivalent to 7% of the equipment acquisition cost from the income tax or corporate tax payable(applicable only to small and medium companies from fiscal year 1999)
or 2 Special depreciation of up to 30% of the equipment acquisition cost.
Basic acquisition cost=[Acquisition cost]×[Multiplier rate(25to100%) Special depreciation; The depreciation is classified as�loss�as defined in the Tax Law, and is included in the calculation of profit in the settlement of accounts.
3.2 Low-interest loans
A system of low-interest financing by governmental financial institutions is available for installation of specific energy-efficient equipment. Table4 Low-Interest Loans Intended for Applicable for Loan limit Period of loan
(deferment) Energy facilities and production facilities(An improvement of 20% or more in energy efficiency, and energy saving of 100 kl/y)
Preferential rate
96 facilities and 14 systems approved under the �Assistance Law�(Energy saving of 100kl/y)
Preferential rate
50% of the construction cost.
Up to 15 yearyears
Co-generation facilities(60% or more primary energy efficiency and 50kw or more output)
Preferential rate
76facilities approved under the�Assistance Law�
Special energy conservation A
Replacing outdated boilers Special energy conservation B
Interest subsidies are granted to financial institutions from the Oil Special Account. 3.3 Subsidy

1366
The New Energy and Industrial technology Development organization(hereafter referred to as NEDO) grants subsidies for the financing required for the energy conserving technologies that specially need to be disseminated, as stipulated in the� Energy Conservation Law�
Table 5: Strategy for subsidy
1 ��������� �� introduction of high-performance industrial furnaces
2 Model projects for installation of advanced energy efficiency facilities 3 Projects for promotion of introduction of cogeneration systems 4 Supporting ESCO enterprises
4. Measures for energy conservation measures
Outline of efficiency measures is
(1) To further promote the improvement of energy consumption efficiency in automobiles and electrical equipment. (Strengthening measures for electrical equipment and appliances)
Introduction of a Top-runner program, which seeks to advance currently available products to a level above the level of the most currently, advanced products with regard to automobile fuel efficiency standards or energy efficiency standards for electrical appliances (household appliances and Office Equipment, etc). Security measures have also been strengthened (Public announcements, issuing orders, and penalties (fines) for those that do not follow the recommendations)
(2) Complete rationalization of energy use in factories and businesses (Strengthening measures for factories)
� The creation of measures obliging the submission of plans for rationalization from specified factories that have up until now had a multi faceted energy consumption approach, in order to bring about structured rationalization of energy use.
� For medium-scale energy consumption factories and businesses, the creation of thorough measures for energy efficiency (appointment of energy management, compulsory attendance of energy efficiency course, compulsory recording of the state of energy use).

1367
(3) Promotion of energy efficiency education
With regard to the sense of values that people have towards different problems, much of that comes from the education we receive in our youth, so priority will be given to providing enlightening activities at schools and educating people from a young age about energy efficiency.
(4) Promotion of highly efficiency cogeneration
Aiming to popularize Cogeneration, which has a high total efficiency, strengthening of operational measures for regulation (criteria of the Law Concerning the Rational Use of Energy) and implementation support was carried out. Moreover, environmental considerations were made for the technological development and introduction for the power generation efficiency improvement of a decentralized power supply. (5) Unutilized energy
Unutilized energy refers to energy we did not give consideration to before, such as temperature difference energy in rivers and sewer, etc. (water that is colder than air in summer, and warmer than air in winter), and waste heat from factories, etc. In recent years, it is becoming possible to meet the heat demand of daily living by utilizing heat pump technology, etc., and introducing the system that properly combines each step of heat utilization from high temperature range to low temperature suitable for local situation, including for power generating purpose.
5. Conclusion
1) Through the energy efficiency efforts of the public and the government, Japan has achieved the highest level of energy efficiency anywhere in the world since the oil crises. With an increasing tendency of energy consumption in commercial/residential and transportation sectors in recent years, the promotion of steady energy efficiency measures in the future is essential.
2) Energy conservation is a key for enhancement of industrial capacity Energy conservation has been put into practice sequentially by checking industrial statistics, such as heat balance, material balance, process flow, by grasping the problems of instrumental/control, machinery/process characteristics, condition and quality of utilities such as water, gas, energy, time adjustment between the front and rear lines, impact on quantity and quality of products.

1368
Therefore energy conservation activities should be started based on the knowledge of self-capacity and capability. Without this, we will often meet catastrophic conditions.
3)The fundamental goal of the energy conservation policy for each country is to achieve a stable supply of energy in accordance with demands for environmental preservation and efficiency improvement. It is indispensable activity in the 21st century. For this purpose, energy conservation expert development, renewal of old equipments, layout change, improvement of quality of raw materials, energy conservation technology development are needed as prior investment. Environmental financing by the government and banks for monetary support ,tax exemption as an incentive measures for the society. References [1] K FUJITA; Leadership for Environment and Development (1998) [2] A SATO; ESCAP Regional Seminar(1999) [3] Japan Bank for International Cooperation; The role and function of
JBIC (1998) [4] OECF; Operation Guidance on Japan's ODA Loan Project (1998) [5] METI ECCJ Seminar; Energy Saving Policy and International
Cooperation(2000) [6] K FUJITA; Industrial Development and Environment (1999) [7] K FUJITA; Environmental ODA and its reorganization
(2004,APCSEET) [8] K FUJITA ; Regional Cooperation in the 21st century (2005, 3rd
International symposium on Business Administration) [9] K FUJITA , International Cooperation for Mega-project (2002,Eastern
Regional Organization for Planning and Housing) [10] Energy Conservation Center ,Japan: Overseas Assistance Materials
(2005)

1369
FLEXIBILITY OF THE PRODUCTION SYSTEM: A COMPETITIVE ADVANTAGE
FOR AN INDUSTRIAL FIRM
Roxana Stegerean Oana Adriana Gică
Babeş-Bolyai University of Cluj-Napoca Faculty of Economics and Business Administration
No: 58-60, Th.Mihali Street 400591 Cluj-Napoca,
Romania e-mail: [email protected], [email protected]
Telephone: +40264 41.86.52
Abstract After December 1989 the Romanian economy had to deal with a new economic environment, due to the transition to a free market. Therefore, the industrial firms had to make changes in order to be competitive on the new market. The production system has to adapt to the new conditions. One of the most important mean to realize this goal is a new approach to flexibility. Flexibility is a very large concept, not a very simple one, including only production aspects. This paper presents the theoretical aspects of the flexibility � organizational, machines and equipment, human resources and how they are implemented in a Romanian firm acting on the cosmetic market. The case study presents the last 15 years of the activity of the firm and the main steps that it followed in order to achieve a sustainable advantage, and also the goals for the future. The final part of the paper tries to present some economic results to emphasize that an industrial firm whose priority is flexibility on a long term is a competitive one.
Keywords: competitiveness, flexibility, adaptability, continuous improvement

1370
1. The need for flexibility in an industrial firm In our days, in order to survive on a certain market, a firm has to pay
more and more attention to the market and its dynamic needs. This goal seems to be very simple to be accomplished, but the economic reality proves the opposite. The firm has a lot of means that help achieving the previous objective, but it has to know how these means can be used with high efficiency.
Another aspect is the fact that these means have to be used according to the particularities of the industries, revealed by some features like the level of scientific research development, the quality of competitors playing on the market, the implemented production system or the quality of human resources.
In order to be competitive a firm has to know how to gain and sustain a competitive advantage on the specific circumstances that came out from the market. One general solution is flexibility, but not only at the production level, like the traditional concept. The roots of flexibility came from production but the concept means much more than being flexible within the production area.
1.1 Historical approach to flexibility a. the simple approach is to see flexibility like � the ability to adjust
your production goals according to the market, not only in quantity, but also in the structure of the production schedules �. Even this simple approach evolved in the last decades and today we can enlarge it with some aspects regarding the market as the main priority. Therefore flexibility means that the firm has to change the parameters of the production system in an on-going process, not only from time to time. The advanced production systems can be implemented in any type of production, not only in mass production because their features afford that. Additionally, we can say today that there is a trend for any firm to reduce as much as possible the economic order quantity, in order to be able to adapt themselves as good as possible to the market demands. There is not any firm today managing with a high level of inventory because the firm has to reduce the costs instead of increasing them using a high level for inventory. Therefore we can say that a firm that wants to be a strong competitor on the market has to have flexible production schedules, established on a short period of time, in order to be able to change the products and to be responsive to the market.
1371
b. A complex approach to flexibility is to enlarge its content to the
entire firm, not only at the production level. To be competitive on the market you need to be flexible in every aspects of the production system, not only in production. When the firm is able to offer to the market �always a different product compared to the previous one� we can say that it is flexible. In order to achieve that goal a firm has to:
• Be able to produce different quantities of a certain group of product
• Be able to produce different types of products in a certain period of time
• Use a flexible supplier base in order to be itself flexible • Have good and adjustable human resource policies • Implement a modern production system • Adapt a product at the most recent demands on the market • Be innovative, in order to remain a real competitor on the
market
Another approach to flexibility is from internal and external point of view. For the last approach flexibility means to respond at the dynamic demands of the market in the shortest time; this goal leads to a sustaining competitive advantage. From internal point of view, the firm has to have the internal capacities and abilities � machines and equipments, human resources, information systems; finally they determine a better external flexibility.
1.2 The Flexible Manufacturing System - an instrument for increasing flexibility in a firm
A Flexible Manufacturing System (FMS) is an advanced system for organizing, coordinating and assessing the production. At a basis level it implies only the production activity but the results determine better performances for the entire production system. The main features of a FMS are the following:
• A central computer that coordinates the overall production activity and establishes all the production parameters like schedules, priorities for different activities, the utilization of capacities - equipment or human resource
• A computer integrated in the network at every workplace that transmits every change occurred at the work place. The influences over the entire process are processed in an ongoing activity. The 100 % of a FMS is when robots realize all the workplace activity. The

1372
worker has responsibilities regarding the coordination and surveillance of the machine. This is a reason that determines fewer workers compared with a traditional production process.
o A small batch production becomes desirable from cost prospective, very close to the optimum production batch determined by mathematical procedures. This is possible because the set up cost due to changes that occurred because of the changes in structure of production are less time consuming and therefore they do not really influence the final cost.
o A computerized system for transportation and handling that leads to a better coordination between these sectors and production
The advantages of a FMS are: • Reducing the direct costs of the final product • Reducing investments because of a better productivity for the new
ones compared with the older ones • A better reaction speed to the market needs • A better and constant quality level for the whole production • Better opportunities for coordination and evaluation of the
production results because of the computerized system • Reducing bureaucracy of the firm also due to the computerized
system The main disadvantages of a FMS are: • The initial investment is big • The implementation decision is a difficult one because it needs the
approval of every level in the firm • The implementation determines a smaller need for workers
compared with the traditional organization • The creativity and intelligence of the human resource is ignored;
the robots and machines have the central role • The system requires more qualified � with interdisciplinary
abilities - employees that determine higher costs for wages • Better results can be obtained only after a significant period so the
benefits are not as immediate as they are expected to be.
In conclusion, we can say that FMS is a solution for an increased flexibility at the production level in the first place and it is an expensive solution related to money and time. For the Romanian industry it is an alternative but, because of the financial aspect, not very desirable for the firms. Therefore we should look to other production systems, less expensive but also more flexible.
1373
1.3 Other production systems that determine flexibility There are other production systems that offer a bigger flexibility to
the firms. We consider that the most important one is Just In Time system ( JIT ). With its roots in Japan, JIT is in our days implemented all over the world, not always at the firm level but certainly in the most important areas.
A JIT has four main features and one of them is flexibility. Some aspects regarding flexibility in a JIT are:
• Flexibility in the supply process. The philosophy in supply policies is to have a long term orientation, with few suppliers. Also it is recommended to supply as often as possible in order to work with minimum inventory levels. JIT introduces for the firs time the concept of �supply on line�. • Flexibility in the production process It is given by work cells organization that permits to do different jobs by the same worker if he has the required skill. • Flexibility of human resources Human resources are one of the most critical resources in a firm and that determine a special attention. JIT offers it a central place and pay attention to any problem that may occur. A good level of flexibility is realized by team work whenever is possible and to give the responsibility both to the individual and to the group, also. • Flexibility in satisfying the market The market determines always what to produce, in what quantity and at a certain level of quality. As much the firm accomplish that, as more flexible will be.
There are other advanced systems that accomplish good level of flexibility through their specific features. All of them regard not only the production, but also other parts in the firm. Most of them include all the firm�s functions and have good performances if they are well implemented.
2. Case study: how a Romanian firm is able to compete in the cosmetics market
The firm F is one of the most famous in the cosmetic product industry in Romania. It was established more than fifty years ago in a period of developing for our area, after the second world war. At the very beginning the firm F had 6 workers and had a diversification range of 5 products.
The firm was privatized in 1995, after a long period of state ownership. In the year 2005 it represents about 45 % of the national cosmetic production and it has more than 700 employees.
1374
Some important elements about the firm F until the year 2000
• During the decade 1950- 1960 the structure of the product increased at 50 types of products, all in the cosmetics industry. Most of them were creams and lotions.
• Beginning with the year 1972 F decided to produce within the factory the packages for the main products
• Beginning with 1973-1974 the creams and lotions lose the leading position for another type of product sprays.
• Until the December 1989 F was the leader of the cosmetic products on the Romanian market
• The financial results after 5 years reveals an average increase by year with 25 % of the revenues
• At the beginning of the year 2000 the number of products was about 320, grouped in four main areas: deodorants spray and roll-on, creams and lotions, other cosmetic products like lipstick-nail care -make up products and the chemical home cleaning products. The first two groups represent more than 70 % from the point of view of both revenues and number of the products.
2.1 What did make F in the last 5 years in order to be flexible? The competition on the cosmetic market is very strong beginning with
1990. In the first years F had to deal with competitors that offer a lot of products, not always good quality, but low prices. After 1995 a lot of multinational companies came in and the competition became stronger but with other dimensions: a diversified range of products, a better quality and well developed marketing policies.
On these circumstances, F has to pay attention to flexibility, in order to be able to maintain its leading position gained in the previous years, in a more competitive environment.
2.2 Investments in the production area F has had a strategic approach of its objective earlier than other
Romanian competitors. In this sense, F realized that the old machines and equipment are obsolete and they are not any more able to compete efficiently. The managers in the firm decided in the year 1999 that a big investment has to be made in order to improve the productivity and to ensure a better and constant quality of the production. First, they decided to move some activities outside the city before that these movements has to be make due to the legislation because of ecological reasons. After that, they purchased a new

1375
automatic line for filling the sprays and they decided to move it on the new location. The investment was 3.2 million $ but the line was delivered from the best European line producer. It was the first investment in Central and Eastern Europe in the cosmetic industries.
The results in the filling line activity were impressive:
• with only 4 workers instead of 40 they increased the daily production with 100%
• increasing the ability to change the product on the line. Initially, it was changed two times a day because the workers had to pay attention to some previous phases of the production, like preparing the solution for filling. With the principal line they purchased some special containers of different capacities; therefore, they were able to prepare different solutions for filling in different quantities, adapting rapidly to the market needs
• on the line they were able to fill not only the deodorants, but also other spray products; after 4 months they moved the entire spray activity in the new location and optimize the capacity utilization. As we can see, the basic results within the production activity were
very good but with them a lot of questions appear, like:
What did happen with the extra-workers, no more needed in the production process? The simple answer is that some of them were retired, other used in other production process and about 20 were fired.
What about the capacity of the market to need a double level of the products? It was a problem for more than 3 months, the level of inventory increased with more than 80 % at the very beginning, but decreased later. Still, the inventory problems remained in the first 2 years of the activity for the new filling line.
What did they do about the connection between the new production rate and the marketing activity? This is still a weakness and the results could be improved by solving it.
2.3 Research and development The RD department is organized near the marketing department. The
employees have different specialties like chemical engineer or pharmaceuticals, biologists. They are selected very carefully and they are working in a good climate. The main problem is the small budget for RD department that determine results not very good related to the potential of human resources. Another problem is coming from the previous one. Even the RD employees were selected carefully, because of the small budget they

1376
have to work on a poor basis, like very few means for update them according to some research made outside the country, no opportunities to go and do some specialization courses abroad or a salary that do not always motivate them because it is not in correlation with their work.
Still, we consider that their performances are very good under the given circumstances and we consider them a real strength of the firm.
In the RD department flexibility comes out from the specialties diversification and also from the large range of researched products. Also, the activity is very dynamic if we consider that about 50 new products come out from the RD department every year. From these more than 60 % are successfully introduced on the cosmetics market
2.4 Product and price policy The flexibility in the product area comes out from the rate of the new
product. If we want to go further in the main groups of product we can say that the first two are the priorities because they represent more than 70 % of the activity.
• The creams and lotions group. F pays attention to the over world trend regarding the infusion of natural and medicine products within the cosmetic industry. Only in the last two years they developed 4 new brands for face and foot care. Within every brand we can find between 4-10 different products for different clients or problems therefore every client could be satisfied using the different products of the same brand and having a complete care system
o These brands are based on using Romanian natural plants with curative properties. The main strength is the relation between price and quality because the competition is a very hard one due to the multinational companies that have similar products at higher prices. We have to say that it is the main group to go for the international market, all over the world.
o The results in the last years prove that the group is the most powerful one in the firm and also with the biggest development potential.
• The sprays group. It is the group that benefited of the 3.2 million $ investment and the results came out. After a first period not very efficient this sector begins to get better results. The main strengths are namely product diversification and small batches in
1377
production in order to be able to adapt to the market needs in the shortest time. Despite the fact that this group lost some percentages in the overall activity of the firm, we can say that the efficiency increased and the sector is still a competitive one on the market. The new product policy determined 2 new brands in the last 2 years, one for women and the other one for men.
3. Conclusion
1. In order to be competitive a firm has to be able to adapt to the market at the best it can; it has to be able to offer the right product in the right place. This means that flexibility is one of the most important priorities
2. Flexibility has to be seen on a large basis because it is not only about being flexible in production, but in any function for the firm. The start is the production area but the ultimate goal is the market. To be able to achieve this goal it is necessary to adapt your policies in every area of the activity
3. It is obvious that firm F has a lot of development potential but it will have more and more difficult periods of time in the future.
4. Until now the results are good because F paid attention to the market and tried to anticipate the customer needs. F made the investment for the filling line despite the fact it was a big one and it was a risk that the product will not be sold on the market. Also, a flexible product policy determined a good rate for new product development and many new such products were successfully launched.
5. For the future F has to establish goals that have among them a good flexibility in every part of the firm. On a hard competition flexibility is not a desirable goal but a compulsory one. Because it has to be realized everywhere in the organization the main instrument to do that is an efficient production system that leads to achieve the goal.
1378
References
[1] ABRUDAN, I., Flexible Manufacturing System. Design And Management, Dacia Press, Cluj, Romania, 1996, ISBN 973-33-1004-7
[2] CONSTANTINESCU, D., A., Industrial Production Management, Nationala Press, Bucharest, Romania, 2000, ISBN 973-654-066-9
[3] PORTER, M., �The Technological Dimension Of Competitive Strategy�, In Research On Technological Innovation. Management And Policies, Jai Press, Usa, 1993
[4] NAGHI, M., STEGEREAN, R., Industrial Production Management, Dacia Press, Cluj, Romania, 2004, ISBN 973-35-1773-9
[5] STEGEREAN, R., Modern Systems For Managing Production, Dacia Press, Cluj, Romania, 2002, ISBN 973-35-1482-9
[6] STEGEREAN, R., Flexible Manufacturing System In Studia Oeconomica No. 2/2001, Babes Bolyai University Press, Cluj, Romania, Pg 115-122, Issn 1220-0476
1379
A STUDY ON THE SUCCESS FACTORS OF A STRATEGIC TOOL IN TURKISH
INDUSTRIAL ORGANIZATIONS
Fatma Gülruh Gürbüz Marmara University
Faculty of Economics and Administrative Sciences Department of Business Administration
Goztepe Campus 34722, Kadikoy, Istanbul
Turkey Tel:+90 532 2739837
e-mail: [email protected]
Abstract In today�s dynamic business environment sustaining competitive advantage is vital for survival and success of business organizations. In that sense, performance of the organization and its measurement as a mean of strategic control becomes very important for sustaining this competitive advantage. We can say that what organizations need is a real strategic performance measurement system that is balanced, integrated, and designed to highlight the firm's critical input, output, and process variables. The Balanced Scorecard (BSC) is a widely used management tool for optimal measurement of organizational performance. It is a strategic control methodology, which uses a multi-dimensional framework for describing, implementing and managing strategy throughout an organization An extensive review of the literature made us clear that the effectiveness and successful implementation of the BSC -as a strategic performance management tool- in business organizations depends on some factors. Therefore, these findings in the literature review made up the basis of the research to analyze the degree of importance and the degree of implementation of success factors of BSC in Turkish industrial organizations. Subjects of the study are the managers who are responsible from Balanced Scorecard Applications in business organizations in Turkey. Data were collected from the managers via questionnaire technique. Keywords: Strategic control, performance measurement, balanced scorecard

1380
1. Introduction
In today�s dynamic business environment sustaining competitive advantage is vital for survival and success of business organizations. In that sense, performance of the organization and its measurement as a mean of strategic control becomes very important for sustaining this competitive advantage. We can say that what organizations need is a real strategic performance measurement system that is balanced, integrated, and designed to highlight the firm's critical input, output, and process variables. Strategic measurement systems do not try to measure everything; only the elements crucial for managerial decision-making. Given the findings of these systems, management should be able to see where value is being created, where investment and improvement are required, and where the firm's strategies are being successfully implemented1 .
2. Literature Review
Balanced Scorecard (BSC) is a widely used management tool for optimal measurement of organizational performance. It is a strategic control methodology, which uses a multi-dimensional framework for describing, implementing and managing strategy throughout the organization2 . The heart of the BSC system lies in organization's vision and strategy. Vision is where the organization wants to be. Strategy is how the organization is going to get its vision 3.Balanced Scorecard is a way of implementing strategy, linking strategy to action, and making strategy understandable to those on the front line as well as to senior managers 4. BSC is a useful tool for translating vision and strategy into a comprehensive set of performance measures to which all levels of the organization can relate 5 .
Traditional performance measurement systems rely only on financial measures. These systems do not provide managers the information they need 1 Vitale, M., Mavrinac, S.C. and Hauser, M. (1994), New Process/Financial Scorecard: A Strategic Performance Measurement System, Planning Review, 22(4): 12-18. 2 Johnsen, A. (2001), Balanced Scorecard: Theoretical Perspectives and Public Management Implications, Managerial Auditing Journal, 16(6): 319-331. 3 Chia, A. and Hoon, H.S. (2000), Adopting and Creating Balanced Scorecards in Singapore-Based Companies, Singapore Management Review, 22(2): 1-15. 4 Vliet, A.V. (1997), The New Balancing Act, Management Today, July: 78-81. 5 - Eagle, K., Cooke, T.C. and Rossi, T.S.C. (2004), Translating Strategy into Results, Government Finance Review, 20(5): 16-26. - Randor, Z. and Lovell, B. (2003), Success Factors For Implementation of the Balanced Scorecard in a NHS Multi-Agency Setting, International Journal of Health Care Quality Assurance, 16(2/3): 99-108.
1381
to manage all the important capabilities and processes that drive competitive advantage for their organizations6 . By the early 1980s, there was a growing concern that with the global competition followed by increased customer orientation and technological change, it was no longer appropriate to use financial measures as the only criterion for assessing success7 .
The Balanced Scorecard supplements the traditional financial measures with three additional perspectives: customers, internal business processes and learning and growth 8.
2.1Perspectives of Balanced Scorecard
Balanced Scorecard methodology requires that companies set goals and specific measures related with customer expectations such as customer satisfaction, quality and service9. Customer perspective includes measures such as market share, customer acquisition and retention and customer satisfaction10 .Measures related with customer needs and satisfaction should be translated into measures of what the company must do internally to meet its customers� expectations. In the internal business processes, the company should focus on core competencies, processes, decisions and actions that have the greatest impact on customer satisfaction. The general measures should then be decomposed to department and workstation levels, where the action takes place11. The learning and growth perspective identifies the intangible assets that are most important to the strategy. The objectives of this perspective are to identify which jobs (the human capital), which systems (the information capital), and what kind of climate (the organization capital) required to support the value-creating internal business processes. These assets must be bundled together and aligned to the critical internal processes12. As a result of increasing competition, companies should make continual improvements to their existing products and processes and should have the ability to introduce new products with expanded capabilities in order
6 IBID, Vitale et al., 1994 7 Kaplan, R.S. and Norton, D. (1996b), Strategic Learning & the Balanced Scorecard, Strategy & Leadership, 24(5): 18-25. 8 Roest, P. (1997), The Golden Rules for Implementing the Balanced Business Scorecard, Information Management & Computer Security, 5(5): 163-165. 9 IBID, Kaplan, R.S. and Norton, D. (1996b). 10 Lubieniecki, E.C. and Desrocher, N. J. (2003), The Case for Simple Comparison: A Simple Performance Scorecard for Effectiveness and Efficiency, Journal of Corporate Real Estate, 6(1): 39-53. 11 IBID, Kaplan, R.S. and Norton, D. (1996b). 12 Kaplan, R.S. and Norton, D. (2004), Plotting Success with 'Strategy Maps', Optimize, February: 61-66.

1382
to survive13. The learning and growth perspective could be used to monitor this long-term value creation process14 .
Financial measures are essential to determine if the company executives correctly identified and constructed their measures for customer, internal business processes and learning and growth perspectives. The financial perspective describes the tangible outcomes of the strategy in traditional financial terms15. The financial perspective concentrates on whether the corporate strategy is resulting in bottom line improvement and covers measures such as profitability, growth and shareholder value16.
On conceptual basis BSC and its perspectives can easily be understood but its success in business organizations depends on how it is implemented17.Successful implementation of BSC provides various benefits to the organizations such as improvements in competitive position of the company in the market18, improvements in financial performance and profitability19 improvements in decision making and problem solving ability20.In organizations where BSC is successfully implemented morale and motivation of the employees increase through conceiving how their efforts
13 IBID, Kaplan, R.S. and Norton, D. (1996b). 14 Sim, K.L. and Koh, H.C. (2001), Balanced Scorecard: A Rising Trend in Strategic Performance Measurement, Measuring Business Excellence, 5(2): 18-27. 15 IBID, Kaplan, R.S. and Norton, D. (2004). 16 Newing, R. (1994), Benefits of a Balanced Scorecard, Accountancy, 114(1215): 52-54. 17Spcekbacher, G., Bischof, J. and Pfeiffer, T. (2003), A Descriptive Analysis on the Implementation of Balanced Scorecard in German Speaking Countries, Management Accounting Research, 14(4): 361-388. 18- Inamdar, N., Kaplan, R.S. and Reynolds, K. (2002), Applying the Balanced Scorecard in Healthcare Provider Organizations/Practitioner's Response, Journal of Healthcare Management, 47(3): 179-197. - Newing, R. (1995), Wake Up to the Balanced Scorecard!, Management Accounting, 73(3): 22-24. 19- IBID, Kaplan, R.S. and Norton, D. (1996b). -IBID, Lubieniecki, E.C. and Desrocher, N. J. (2003). -IBID, Newing, R. (1994). -Olve, N., Petri, C. and Roy, J.R.S. (2004), Twelve Years Later: Understanding and Realizing the Value of Balanced Scorecards, Business Journal Online, May/Jun: 1. - Maiga, A.S. and Jacobs, F.A. (2003), Balanced Scorecard, Activity-Based Costing and Company Performance: An Empirical Analysis, Journal of Managerial Issue, 15(3): 283-301. 20 - Kaplan, R.S. and Norton, D. (1992), The Balanced Scorecard- Measures that Drive Performance, Harvard Business Review, January-February: 71-79. - IBID, Chia and Hoon, 2000.
1383
contribute to the achievement of strategic goals and objectives of the organization21.
But in order to obtain benefits from BSC organizations have to consider some factors at the design and implementation stages of their balanced scorecards:
- The key to success with the BSC concept depends on the appropriateness and quality of the measures chosen 22.Measures derived from organization�s vision, mission and strategy is at the heart of the Balanced Scorecard 23. The selected measures should represent the strategic objectives 24otherwise managers will not be able to properly execute the strategy25 . It is important to have a well-balanced set of measures, from each of the perspectives26. BSC measures should be easy to interpret so that scorecard readers should understand both the operational and strategic significance of every measure27. When designing a scorecard, it is important to focus on the vital performance measures28 which are limited in number29 accurate, objective and reliable30, and dynamic since environment, strategy or structure of the organization changes.
21- Kaplan, R.S. and Norton, D. (1996a), Linking the Balanced Scorecard to Strategy, California Management Review, 39(1): 53-79. - Lyons, B. and Gumbus, A. (2004), How Unilever Hpc-Na Sold Its Employees on the Balanced Scorecard, Strategic Finance, 85(10): 40-45. - IBID,Inamdar et al., 2002 - Lawson, R., Stratton, W. and Hatch, T. (2003a), The Benefits of a Scorecard System, CMA Management, 77 (4): 24-26. 22 Sagner, M. (1998), Supporting the Balanced Scorecard, Work Study, 47(6): 197-200. 23 Fonvielle, W. and Carr, L.P. (2001), Gaining Strategic Alignment: Making Scorecards Work, Management Accounting Quarterly, Fall: 4-14. 24 Papalexandris, A., Ioannou, G. and Prastacos, G.P. (2004), Implementing the Balanced Scorecard in Greece: a Software Firm�s Experience, Long Range Planning, 37(4): 351-366. 25 Beiman, I. and Sun, Y. (2003b), Implementing a Balanced Scorecard in China: Steps for success, China Staff Hong Kong, 9(9): 11-14. 26 Brown, M.G. (1994), Is Your Measurement System Well Balanced?, The Journal for Quality and Participation, 17(6): 6-12. 27 IBID, Roest, 1997. 28 Frigo, M.L. and Krumwiede, K.R. (2000), The Balanced Scorecard, Strategic Finance, 81(7): 50-54. 29 -Broady-Preston, J. and Hayward, T. (2001), "Strategy, Information Processing and Scorecard Models in The UK Financial Services Sector�, Information Research, 7(1): http://InformationR.net/ir/7-1/paper122.html. -IBID, Sim and Koh 30 -Parker, C. (2000), Performance Measurement, Work Study, 49(2): 63-66.

1384
- Successful implementation of the Balanced Scorecard also depends on the commitment of top management31.Clear signals from the top of the organization about the importance of the Balanced Scorecard will help the organization to accept and use it 32. Besides executives, employees at all levels have to be aligned and committed to it. In the absence of commitment, Balanced Scorecard system is likely to be ignored or abandoned 33.
- The Balanced Scorecard supports the idea that employees should be observed on how they are performing with respect to the company strategy34. The best way to get a work force�s attention about corporate focus is to link achievement of desired results directly to rewards 35. BSC should be linked with well-understood rewards. Rewards that are delayed, uncertain, or ambiguous may be ineffective motivational devices36.
- Successful implementation of Balanced Scorecard depends on integrating the information stored in the computer systems of the organization and providing immediate organization-wide access to the status of key performance indicators 37.When an unexpected signal appears on the Balanced Scorecard, managers need access to the underlying data to investigate the cause of the problem or to analyze trends and correlation. In
-Malina, M.A. and Selto, F.H. (2001), Communicating and Controlling Strategy: An Empirical Study of the Effectiveness of the Balanced Scorecard, Journal of Management Accounting Research, 13: 47-91 31- Veen-Dirks, P. and Wijn, M. (2002), Strategic Control: Meshing Critical Success Factors with the Balanced Scorecard, Long Range Planning, 35(4): 407-427. -IBID, Roest.-Braam, G.J.M. and Nijssen, E.J. (2004), Performance Effects of Using the Balanced Scorecard: A Note on the Dutch Experience, Long Range Planning, 37(4): 335-349. -IBID, Beiman and Sun, 2003b. -IBID, Parker 32 IBID, Braam and Nijssen. 33 - IBID, Fonvielle and Carr. - IBID,Veen-Dirks, Wijn. - Blundell, B., Sayers, H. and Shanahan, Y. (2003), The Adoption and Use of the Balanced Scorecard in New Zealand: A Survey of the Top 40 Companies, Pacific Accounting Review, 15(1): 49-74. - Clarke, P. and Tyler, F. (2000), Implementing a Balanced Scorecard: An Irish example, IBAR, 21(2): 137-156. 34 Gautreau, A. and Kleiner, B.H. (2001), Recent Trends in Performance Measurement Systems- The Balanced Scorecard Approach, Management Research News, 2004(3): 153-156. 35 Boomer, L.G. (2002), Using Balanced Scorecards to Determine Compensation, Accounting Today, 16(21): 22-25. 36 IBID, Malina and Selto, 2001. 37 Wyatt, J. (2004), Scorecards, Dashboards, and KPI�s Keys to Integrated Performance Measurement, Healthcare Financial Management, 58(2): 76-80.

1385
that sense automation of BSC and choosing the appropriate software can significantly effect the success of Balanced Scorecard 38.
- As a performance measurement system, BSC is a dynamic model that needs to be modified, adapted and improved on a regular basis39. Because the competitive environment surrounding an organization is changing rapidly, performance measurement systems require continuous improvements and revisions to maintain their relevance.
- As other measurement tools, successful implementation of BSC also requires effective communication of the performance measures to all levels of management and staff within the organization 40. This enables them to understand how their own efforts can have an effect on the targets set in respect of each perspective 41.
- Activity Based Costing should be considered as a supportive measurement tool for Balanced Scorecard42 Activity Based Costing (ABC) is a method that aims to increase the accuracy of cost measures. ABC ties costs to activities and products much more accurately than traditional accounting
38- Sharman, P. and Kavan, C.B. (1999), Software is not the Solution: Software Selection�s Effect on Implementing the Balanced Scorecard, Journal of Strategic Performance Measurement, February/March: 7-15. - Marr, B. and Neely, A. (2003), Automating The Balanced Scorecard- Selection Criteria To Identify Appropriate Software Applications, Measuring Business Excellence, 7(3): 29-36. - IOMA's Report on Financial Analysis, Planning & Reporting (2004), Performance Reporting: Majority of Companies Need to Fix Their Balanced Scorecards, New York, 04(11): 4-6. - IBID, Wyatt. - IBID, Olve et al.. - IBID, Sagner. 39 - IBID, Braam and Nijjsen. - Vliet - Reisinger, H., Cravens, K.S. and Tell, N. (2003), Prioritizing Performance Measures Within the Balanced Scorecard Framework, Management International Review, 43(4): 429-437. - IBID, Parker. - Franco-Santos, M. and Bourne, M. (2003), Factors That Play a Role in Managing Through Measures, Management Decision, 41(8): 698-710. 40 - IBID, Lyons and Gumbus, 2004. - IBID, Gautreau and Kleiner. - Manas, T. (1999), Making the Balanced Scorecard Approach Pay Off, American Compensation Association Journal, 8(2): 13-21.
- National Partnership for Reinventing Government Balancing Measures: Best Practices in Performance Management. Part 1 of 4, August 1999 Report.
41- IBID, Newing, 1995 - IBID, Franco and Bourne 2003. 42 IBID, Maiga and Jacobs, 2003.
1386
methods 43. Inaccurate cost data can have a negative effect on the BSC system 44.
- Organizations that are implementing BSC , can increase their chances of success by starting with a pilot project45. A pilot study of BSC allows the determination of best measures that are useful. The development and the introduction of the BSC should not take too much time46.
Our findings in the literature review made up the basis of our research to analyze the factors, which are important for the success of BSC implementation in Turkish firms.
3.Methodology
3.1Population and Data collection In Turkey there are 70 companies implementing Balanced Scorecard
[As a result of contacting with 500 major industrial enterprises of Turkey listed in Istanbul Chamber of Industry47 It was found that only 70 of them were implementing Balanced Scorecard ].Our subjects of the study are the managers who are responsible from Balanced Scorecard Applications in these firms . Data were collected from the managers via questionnaire technique. As a survey instrument , questionnaire consisting of sixty items was used. All the items in the questionnaire was developed by the researcher benefiting from the literature . Respondents were asked to indicate the degree of importance of the given statements on a five-points scale. The scale ranged from 1, �not important at all� to 5, �very important�. Besides sixty items questionnaire some demographic questions were also asked. We sent our questionnaire to the managers who are responsible from Balanced Scorecard Applications in these 70 companies and 62 of the questionnaires were returned to us, so the degree of response rate is about 90 %. At the end of the research item analysis were done for the items measuring the degree of importance of success factors of BSC . None of the items on the degree of importance of success factors of BSC scale had an alpha value lower than
43 - IBID, Parker -Liberatore, M.J. and Miller, T. (1998), A Framework for Integrating Activity-Based Costing and the Balanced Scorecard into the Logistics Strategy Development and Monitoring Process, Journal of Business Logistics, 19(2): 131-155. 44 IBID, (Lawson et al., 2003a) 45 - McCunn, P. (1998), The Balanced Scorecard�The Eleventh Commandment, Management Accounting, 76(11): 34-36. - IBID, Roest. 46 - IBID, Veen-Dirks, Wijn. 47 (www.iso.org.tr/html/500htm)

1387
0.93 and Cronbach's alpha for full degree of importance of success factors of BSC scale was 0.94.
3.2 Findings According to the data collected from managers responding to our
questionnaire 97% of the firms were using all four perspectives of BSC, 65% of the firms tied compensation incentives and rewards to BSC results, 55% of the firms have automated their BSC system, 16.1 % of the firms were reviewing their BSC system once a year whereas 22.6 % of the firms twice a year, 25.8 % of the firms quarterly and 35.5 % of the firms were reviewing their BSC system monthly.77.4% of the firms had information about Activity Based Costing but only 38.7% of the firms were using ABC and only 29% of the firms were using ABC in the manner to support their BSC system.
H1: Appropriateness of the measures are important for successful
implementation of BSC. Model Summary
Model R R Square Adjusted R Square
Std. Error of the Estimate
1 .481 .231 .219 3.5982 a Predictors: (Constant), APPR.MEA
ANOVA
Model Sum of Squares
df Mean Square
F Sig.
1 Regression 234.001 1 234.001 18.073 .000** Residual 776.838 60 12.947 Total 1010.839 61
a Predictors: (Constant), APPR.MEA b Dependent Variable: SUCC.BSC ∗ p< 0.05 ∗∗ p< 0.01
Coefficients Unstandard.
Coefficients Standard
Coefficientst Sig.
Model B Std. Error Beta 1 (Constant) 14.330 6.003 2.387 .020 APPR.MEA .514 .121 .481 4.251 .000
a Dependent Variable: SUCC.BSC
Regression analysis result indicates that using appropriate measures is important for successful implementation of BSC ( 0.000 < 0.01)
H2:Senior management� involvement is important for successful
implementation of BSC.

1388
Model Summary Model R R Square Adjusted R
Square Std. Error of the
Estimate 1 .416 .173 .160 3.7319
a Predictors: (Constant), MNG.INV
ANOVA Model Sum of
Squares df Mean
Square F Sig.
1 Regression 175.221 1 175.221 12.581 .001* Residual 835.618 60 13.927 Total 1010.839 61
a Predictors: (Constant), MNG.INV b Dependent Variable: SUCC.BSC ∗ p< 0.05 ∗∗ p< 0.01
Coefficients Unstandard.
Coefficients Standard
Coefficientst Sig.
Model B Std. Error Beta 1 (Constant) 13.098 7.536 1.738 .087 MNG.INV .708 .200 .416 3.547 .001
a Dependent Variable: SUCC.BSC
As a result of the regression analysis it is clear that senior management support and commitment is important for successful implementation of BSC ( 0.001< 0.05 ) .
H3: Linking compensation system to BSC is important for successful
implementation of BSC. Model Summary
Model R R Square Adjusted R Square
Std. Error of the Estimate
1 .480 .230 .217 3.6016 a Predictors: (Constant), LINKCOMP
ANOVA
Model Sum of Squares
df Mean SquareF Sig.
1 Regression 232.536 1 232.536 17.926 .000** Residual 778.303 60 12.972 Total 1010.839 61
a Predictors: (Constant), LINKCOMP b Dependent Variable: SUCC.BSC ∗ p< 0.05 ∗∗ p< 0.01

1389
Coefficients Unstandard.
Coefficients Standard
Coefficients t Sig.
Model B Std. Error Beta (Constant) 30.336 2.276 13.331 .000 LINKCOMP .784 .185 .480 4.234 .000
a Dependent Variable: SUCC.BSC
H3 is accepted since 0.000< 0.01
H4 : Employees� participation and commitment is important for successful implementation of BSC.
Model Summary Model R R Square Adjusted R
Square Std. Error of the
Estimate 1 .368 .136 .121 3.8159
a Predictors: (Constant), EMP.COM ANOVA
Model Sum of Squares
df Mean Square
F Sig.
1 Regression 137.168 1 137.168 9.420 .003** Residual 873.671 60 14.561 Total 1010.839 61
a Predictors: (Constant), EMP.COM b Dependent Variable: SUCC.BSC ∗ p< 0.05 ∗∗ p< 0.01
Coefficients Unstandard.
Coefficients Standard
Coefficients t Sig.
Model B Std. Error Beta 1 (Constant) 21.323 6.031 3.535 .001 EMP.COM .993 .324 .368 3.069 .003
a Dependent Variable: SUCC.BSC The importance of employees participation and commitment for
successful implementation of BSC is evident since 0.003 < 0.01
H5 : Selecting the suitable BSC automation and software system is important for successful implementation of BSC.
Model Summary
Model R R Square Adjusted R Square
Std. Error of the Estimate
1 .582 .339 .328 3.3381 a Predictors: (Constant), AUT.SOFT

1390
ANOVA Model Sum of
Squares df Mean
Square F Sig.
1 Regression 342.251 1 342.251 30.714 .000** Residual 668.588 60 11.143 Total 1010.839 61
a Predictors: (Constant), AUT.SOFT b Dependent Variable: SUCC.BSC ∗ p< 0.05 ∗∗ p< 0.01
Coefficients Unstandard.
Coefficients Standard
Coefficients t Sig.
Model B Std. Error Beta 1 (Constant) 22.428 3.158 7.101 .000 AUT.SOFT .565 .102 .582 5.542 .000
a Dependent Variable: SUCC.BSC
Our hypothesis assuming that selecting the suitable BSC automation and software system effects successful implementation of BSC is accepted (α = 0.01, p=0.000).
H6 : Reviewing and updating BSC is important for its successful implementation
Model Summary
Model R R Square Adjusted R Square
Std. Error of the Estimate
1 .479 .229 .217 3.6030 a Predictors: (Constant), REW.BSC ANOVA
Model Sum of Squares
df Mean SquareF Sig.
1 Regression 231.921 1 231.921 17.865 .000** Residual 778.918 60 12.982 Total 1010.839 61
a Predictors: (Constant), REW.BSC b Dependent Variable: SUCC.BSC ∗ p< 0.05 ∗∗ p< 0.01
Coefficients Unstandard.
Coefficients Standard
Coefficients t Sig.
Model B Std. Error Beta 1 (Constant) 21.710 4.298 5.051 .000 REW.BSC 1.311 .310 .479 4.227 .000
a Dependent Variable: SUCC.BSC
1391
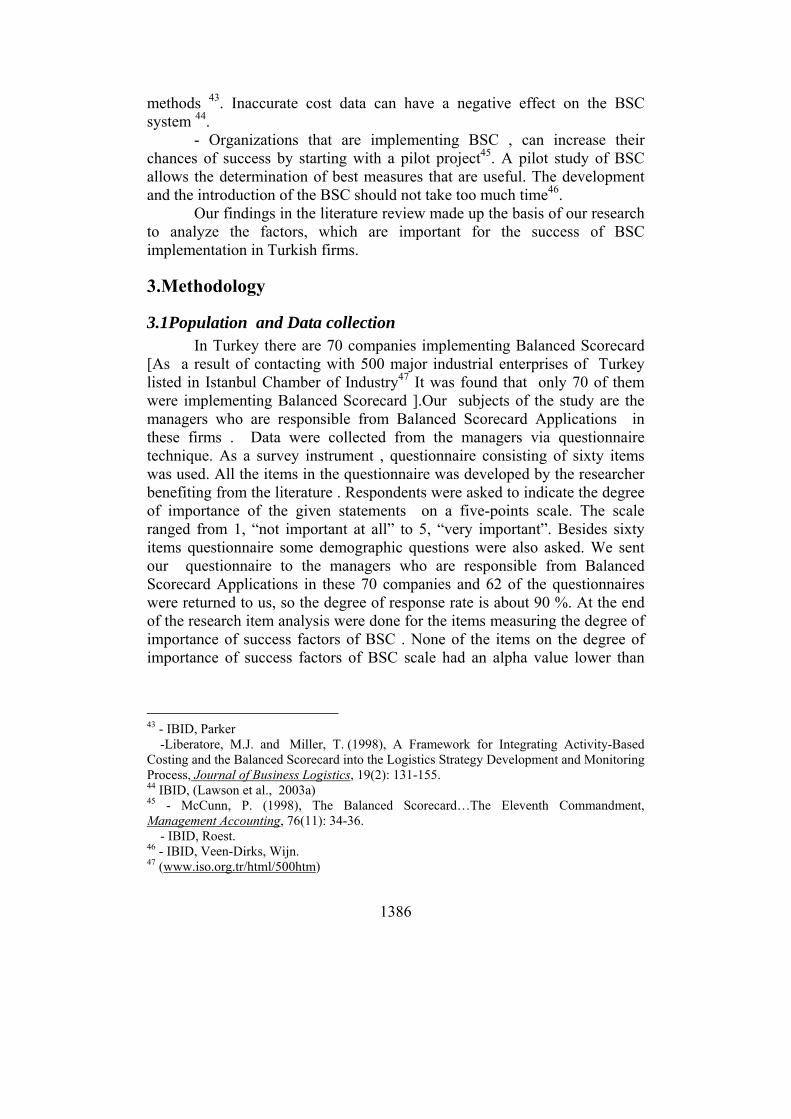
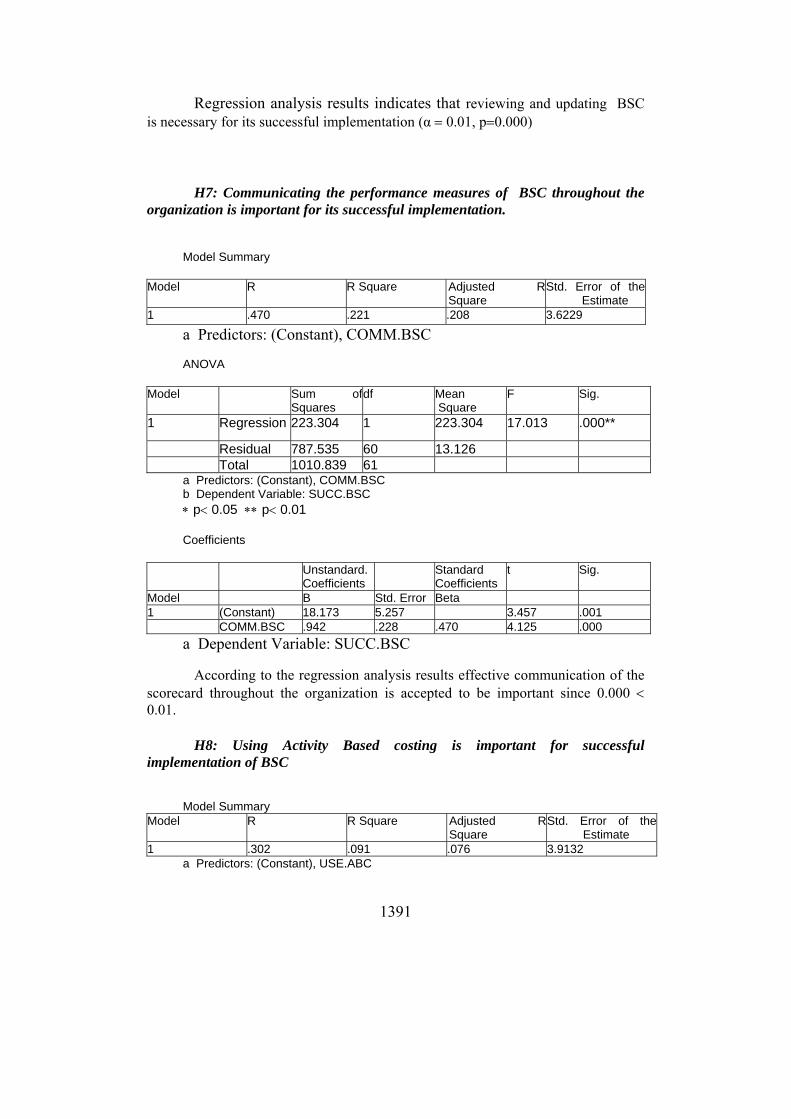
Regression analysis results indicates that reviewing and updating BSC is necessary for its successful implementation (α = 0.01, p=0.000)
H7: Communicating the performance measures of BSC throughout the organization is important for its successful implementation.
Model Summary
Model R R Square Adjusted R
Square Std. Error of the
Estimate 1 .470 .221 .208 3.6229
a Predictors: (Constant), COMM.BSC ANOVA
Model Sum of
Squares df Mean
Square F Sig.
1 Regression 223.304 1 223.304 17.013 .000**
Residual 787.535 60 13.126 Total 1010.839 61
a Predictors: (Constant), COMM.BSC b Dependent Variable: SUCC.BSC ∗ p< 0.05 ∗∗ p< 0.01
Coefficients Unstandard.
Coefficients Standard
Coefficients t Sig.
Model B Std. Error Beta 1 (Constant) 18.173 5.257 3.457 .001 COMM.BSC .942 .228 .470 4.125 .000
a Dependent Variable: SUCC.BSC
According to the regression analysis results effective communication of the scorecard throughout the organization is accepted to be important since 0.000 < 0.01.
H8: Using Activity Based costing is important for successful implementation of BSC
Model Summary Model R R Square Adjusted R
Square Std. Error of the
Estimate 1 .302 .091 .076 3.9132
a Predictors: (Constant), USE.ABC

1392
ANOVA Model Sum of
Squares df Mean
Square F Sig.
1 Regression 92.056 1 92.056 6.012 .017* Residual 918.783 60 15.313 Total 1010.839 61
a Predictors: (Constant), USE.ABC b Dependent Variable: SUCC.BSC ∗ p< 0.05 ∗∗ p< 0.01
Coefficients Unstandard.
Coefficients Standard
Coefficients t Sig.
Model B Std. Error Beta 1 (Constant) 34.239 2.312 14.812 .000 USE.ABC .455 .186 .302 2.452 .017
a Dependent Variable: SUCC.BSC
Using Activity Based Costing is important for the success of BSC implementation
0.017< 0.05
H9: Implementing a pilot study of BSC is important for the success of the BSC
Model Summary Model R R Square Adjusted R
Square Std. Error of the
Estimate 1 .484 .234 .221 3.5925
a Predictors: (Constant), PILOT.ST ANOVA
Model Sum of Squares
df Mean SquareF Sig.
1 Regression 236.492 1 236.492 18.325 .000** Residual 774.346 60 12.906 Total 1010.839 61
a Predictors: (Constant), PILOT.ST b Dependent Variable: SUCC.BSC ∗ p< 0.05 ∗∗ p< 0.01

1393
Coefficients Unstandard.
Coefficients Standard
Coefficients t Sig.
Model B Std. Error Beta 1 (Constant) 25.526 3.360 7.598 .000 PILOT.ST 1.234 .288 .484 4.281 .000
a Dependent Variable: SUCC.BSC
Implementing a pilot study before broadening the implementation of Balanced Scorecard is important for its success (α = 0.01, p=0.000)
Table 1: Correlations
PILOT STUDY
USE ABC
REW BSC
AUTO. & SOFTWARE
EMP COMMIT
LINK COMPEN
MNG.INV
APPR.MEA
COMMUNI.
PILOT STUDY
Pearson Corr.
1.000 .207 .067 .372 .233 .161 .124 .095 .314
Sig. (2-tailed)
. .106 .606 .003* .068 .213 .336 .462 .013*
N 62 62 62 62 62 62 62 62 62 USE ABC
Pearson Corr.
.207 1.000 .361 .473 .331 .336 .257 .577 .504
Sig. (2-tailed)
.106 . .004** .000* .009** .008** .044* .000** .000**
N 62 62 62 62 62 62 62 62 62 REW BSC
Pearson Corr.
.067 .361 1.000 .305 .483 .117 .495 .438 .538
Sig. (2-tailed)
.606 .004** . .016* .000** .364 .000** .000** .000**
N 62 62 62 62 62 62 62 62 62 AUTO. & SOFTWARE
Pearson Corr.
.372 .473 .305 1.000 .327 .503 .059 .580 .487
Sig. (2-tailed)
.003* .000** .016* . .009** .000** .648 .000** .000**
N 62 62 62 62 62 62 62 62 62 EMP COMMIT
Pearson Corr.
.233 .331 .483 .327 1.000 .309 .406 .439 .793
Sig. (2-tailed)
.068 .009** .000** .009** . .015* .001** .000** .000**
N 62 62 62 62 62 62 62 62 62 LINK COMPEN
Pearson Corr.
.161 .336 .117 .503 .309 1.000 -.031 .392 .253
Sig. (2-tailed)
.213 .008** .364 .000** .015* . .810 .002** .047*
N 62 62 62 62 62 62 62 62 62

1394
MNG.INV
Pearson Corr.
.124 .257 .495 .059 .406 -.031 1.000 .433 .522
Sig. (2-tailed)
.336 .044* .000** .648 .001** .810 . .000** .000**
N 62 62 62 62 62 62 62 62 62 APPR.MEA
Pearson Corr.
.095 .577 .438 .580 .439 .392 .433 1.000 .563
Sig. (2-tailed)
.462 .000** .000** .000** .000** .002** .000** . .000**
N 62 62 62 62 62 62 62 62 62 COMMUNI.
Pearson Corr.
.314 .504 .538 .487 .793 .253 .522 .563 1.000
Sig. (2-tailed)
.013* .000** .000** .000** .000** .047* .000** .000** .
N 62 62 62 62 62 62 62 62 62 ** Correlation is significant at the 0.01 level (2-tailed). * Correlation is significant at the 0.05 level (2-tailed).
3.3 Discussion and Concluding Remarks
Performance measurement is an issue of growing importance for business organizations, because success of business organizations, achieving competitive advantage and sustaining it depends on how good they are performing. Balanced Scorecard defines what management means by "performance" and measures whether management is achieving desired results 48. BSC is a powerful concept based on a simple principle; managers need a balanced set of performance indicators to run an organization successfully. The indicators should measure performance against the critical success factors of the business, and the �balance� is the balancing tension between the traditional financial and non-financial, operational, leading and lagging, and action-oriented and monitoring measures 49 .The term "balanced approach" also means that these four measurement categories are given roughly equal weight in supporting management decisions. While this model can be effective, its biggest contribution is that it emphasizes, particularly to traditional managers, that financial measures (the bottom line) are not the only measurements needed to manage companies effectively, there are also other measures of equal importance 50.
48 IBID, IOMA's Report on Financial Analysis, Planning & Reporting. 49 McCunn, P. (1998), The Balanced Scorecard�The Eleventh Commandment, Management Accounting, 76(11): 34-36. 50 - Stein, P. (2001), Measurements for Business, Quality Progress, 34(2): 29-33. - IBID, Roest

1395
In this study we tried to shed light on the factors which are important for successful implementation of Balanced Scorecard in Turkish business organizations. We have seen that in Turkish firms that implement BSC using appropriate measures, top management support and commitment, linking compensation, incentives and rewards to BSC results, employees� participation and commitment, selecting the appropriate BSC automation and software system, communicating the BSC throughout the organization, reviewing and updating BSC are important factors for the success of BSC implementation. Since managers give importance to the participation, commitment and support of both employees and managerial levels to the BSC and see communication as an essential tool for the success of BSC implementation, we can say that culture of the organization can also be a factor for successful implementation of BSC in Turkish Firms. This is also in accordance with the literature. Franco and Bourne,2003 in a survey found out that for the success of BSC there is a need for an organizational culture that encourages discussion and analysis. Correlations among the factors that effect successful implementation of BSC (table 1), had also some implications for us: Communicating BSC throughout the organization is significantly correlated to all other success factors. Similary top management�s support and commitment and employees participation and commitment are significantly correlated to all success factors except using a pilot study before implementing BSC. This finding also support our idea that organizational culture can be important for the success of BSC implementation in Turkish business firms. For further research implications a study can be conducted to analyze the type of organizational cultures and components of organizational culture that effects successful implementation of BSC in Turkish firms
There are also limitations to this study, in Turkey the number of firms implementing BSC are very few in size , because it is a new concept for the Turkish firms. For that reason this study can be repeated in future with a larger population when number of companies using BSC increase in size.
References
[1] Beiman, I. and Sun, Y. (2003b), Implementing a Balanced Scorecard in China: Steps for success, China Staff Hong Kong, 9(9): 11-14.
[2] Blundell, B., Sayers, H. and Shanahan, Y. (2003), The Adoption and Use of the Balanced Scorecard in New Zealand: A Survey of the Top 40 Companies, Pacific Accounting Review, 15(1): 49-74.

1396
[3] Boomer, L.G. (2002), Using Balanced Scorecards to Determine Compensation, Accounting Today, 16(21): 22-25.
[4] Braam, G.J.M. and Nijssen, E.J. (2004), Performance Effects of Using the Balanced Scorecard: A Note on the Dutch Experience, Long Range Planning, 37(4): 335-349.
[5] Broady-Preston, J. and Hayward, T. (2001), "Strategy, Information Processing and Scorecard Models in The UK Financial Services Sector�, Information Research, 7(1): http://InformationR.net/ir/7-1/paper122.html.
[6] Brown, M.G. (1994), Is Your Measurement System Well Balanced?, The Journal for Quality and Participation, 17(6): 6-12.
[7] Chia, A. and Hoon, H.S. (2000), Adopting and Creating Balanced Scorecards in Singapore-Based Companies, Singapore Management Review, 22(2): 1-15.
[8] Clarke, P. and Tyler, F. (2000), Implementing a Balanced Scorecard: An Irish example, IBAR, 21(2): 137-156.
[9] Eagle, K., Cooke, T.C. and Rossi, T.S.C. (2004), Translating Strategy into Results, Government Finance Review, 20(5): 16-26.
[10] Fonvielle, W. and Carr, L.P. (2001), Gaining Strategic Alignment: Making Scorecards Work, Management Accounting Quarterly, Fall: 4-14.
[11] Franco-Santos, M. and Bourne, M. (2003), Factors That Play a Role in Managing Through Measures, Management Decision, 41(8): 698-710.
[12] Frigo, M.L. and Krumwiede, K.R. (2000), The Balanced Scorecard, Strategic Finance, 81(7): 50-54.
[13] Gautreau, A. and Kleiner, B.H. (2001), Recent Trends in Performance Measurement Systems- The Balanced Scorecard Approach, Management Research News, 2004(3): 153-156.
[14] Inamdar, N., Kaplan, R.S. and Reynolds, K. (2002), Applying the Balanced Scorecard in Healthcare Provider Organizations/Practitioner's Response, Journal of Healthcare Management, 47(3): 179-197.
[15] IOMA's Report on Financial Analysis, Planning & Reporting (2004), Performance Reporting: Majority of Companies Need to Fix Their Balanced Scorecards, New York, 04(11): 4-6.
[16] Johnsen, A. (2001), Balanced Scorecard: Theoretical Perspectives and Public Management Implications, Managerial Auditing Journal, 16(6): 319-331.
[17] Kaplan, R.S. and Norton, D. (1992), The Balanced Scorecard- Measures that Drive Performance, Harvard Business Review, January-February: 71-79.
[18] Kaplan, R.S. and Norton, D. (1996a), Linking the Balanced Scorecard to Strategy, California Management Review, 39(1): 53-79.

1397
[19] Kaplan, R.S. and Norton, D. (1996b), Strategic Learning & the Balanced Scorecard, Strategy & Leadership, 24(5): 18-25.
[20] Kaplan, R.S. and Norton, D. (2004), Plotting Success with 'Strategy Maps', Optimize, February: 61-66.
[21] Lawson, R., Stratton, W. and Hatch, T. (2003a), The Benefits of a Scorecard System, CMA Management, 77 (4): 24-26.
[22] Liberatore, M.J. and Miller, T. (1998), A Framework for Integrating Activity-Based Costing and the Balanced Scorecard into the Logistics Strategy Development and Monitoring Process, Journal of Business Logistics, 19(2): 131-155.
[23] Lubieniecki, E.C. and Desrocher, N. J. (2003), The Case for Simple Comparison: A Simple Performance Scorecard for Effectiveness and Efficiency, Journal of Corporate Real Estate, 6(1): 39-53.
[24] Lyons, B. and Gumbus, A. (2004), How Unilever Hpc-Na Sold Its Employees on the Balanced Scorecard, Strategic Finance, 85(10): 40-45.
[25] Maiga, A.S. and Jacobs, F.A. (2003), Balanced Scorecard, Activity-Based Costing and Company Performance: An Empirical Analysis, Journal of Managerial Issue, 15(3): 283-301.
[26] Malina, M.A. and Selto, F.H. (2001), Communicating and Controlling Strategy: An Empirical Study of the Effectiveness of the Balanced Scorecard, Journal of Management Accounting Research, 13: 47-91
[27] Manas, T. (1999), Making the Balanced Scorecard Approach Pay Off, American Compensation Association Journal, 8(2): 13-21.
[28] Marr, B. and Neely, A. (2003), Automating The Balanced Scorecard- Selection Criteria To Identify Appropriate Software Applications, Measuring Business Excellence, 7(3): 29-36.
[29] McCunn, P. (1998), The Balanced Scorecard�The Eleventh Commandment, Management Accounting, 76(11): 34-36.
[30] National Partnership for Reinventing Government Balancing Measures: Best Practices in Performance Management. Part 1 of 4, August 1999 Report.
[31] Newing, R. (1994), Benefits of a Balanced Scorecard, Accountancy, 114(1215): 52-54.
[32] Newing, R. (1995), Wake Up to the Balanced Scorecard!, Management Accounting, 73(3): 22-24.
[33] Olve, N., Petri, C. and Roy, J.R.S. (2004), Twelve Years Later: Understanding and Realizing the Value of Balanced Scorecards, Business Journal Online, May/Jun: 1.
[34] Papalexandris, A., Ioannou, G. and Prastacos, G.P. (2004), Implementing the Balanced Scorecard in Greece: a Software Firm�s Experience, Long Range Planning, 37(4): 351-366.

1398
[35] Parker, C. (2000), Performance Measurement, Work Study, 49(2): 63-66. [36] Randor, Z. and Lovell, B. (2003), Success Factors For Implementation
of the Balanced Scorecard in a NHS Multi-Agency Setting, International Journal of Health Care Quality Assurance, 16(2/3): 99-108.
[37] Reisinger, H., Cravens, K.S. and Tell, N. (2003), Prioritizing Performance Measures Within the Balanced Scorecard Framework, Management International Review, 43(4): 429-437.
[38] Roest, P. (1997), The Golden Rules for Implementing the Balanced Business Scorecard, Information Management & Computer Security, 5(5): 163-165.
[39] Sagner, M. (1998), Supporting the Balanced Scorecard, Work Study, 47(6): 197-200.
[40] Sharman, P. and Kavan, C.B. (1999), Software is not the Solution: Software Selection�s Effect on Implementing the Balanced Scorecard, Journal of Strategic Performance Measurement, February/March: 7-15.
[41] Sim, K.L. and Koh, H.C. (2001), Balanced Scorecard: A Rising Trend in Strategic Performance Measurement, Measuring Business Excellence, 5(2): 18-27.
[42] Spcekbacher, G., Bischof, J. and Pfeiffer, T. (2003), A Descriptive Analysis on the Implementation of Balanced Scorecard in German Speaking Countries, Management Accounting Research, 14(4): 361-388.
[43] Stein, P. (2001), Measurements for Business, Quality Progress, 34(2): 29-33.
[44] Veen-Dirks, P. and Wijn, M. (2002), Strategic Control: Meshing Critical Success Factors with the Balanced Scorecard, Long Range Planning, 35(4): 407-427.
[45] Vitale, M., Mavrinac, S.C. and Hauser, M. (1994), New Process/Financial Scorecard: A Strategic Performance Measurement System, Planning Review, 22(4): 12-18.
[46] Vliet, A.V. (1997), The New Balancing Act, Management Today, July: 78-81.
[47] Wyatt, J. (2004), Scorecards, Dashboards, and KPI�s Keys to Integrated Performance Measurement, Healthcare Financial Management, 58(2): 76-80.
[48] www.iso.org.tr/html/500htm

1399
References used indirectly in the text
[1] Amaratunga, D., Baldry, D. and Sarshar, M. (2001), Process Improvement through Performance Measurement: The Balanced Scorecard Methodology, Work Study, 50(5): 179-189.
[2] Beiman, I. and Sun, Y. (2003a), Using the Balanced Scorecard for Strategy Execution in China, China Staff Hong Kong, 9(8): 10-14.
[3] Franco-Santos, M., Bourne, M. and Huntington, R. (2004), Executive Pay and Performance Measurement Practices in the UK, Measuring Business Excellence, 8(3): 5-11.
[4] Kaplan, R.S. and Norton, D. (1993), Putting the Balanced Scorecard to Work, Harvard Business Review, September-October: 134-147.
[5] Kaplan, R.S. (1994), Devising a Balanced Scorecard Matched To Business Strategy, Planning Review, 22(5): 15-20.
[6] Kaplan, R.S. and Norton, D. (1996c), Using the Balanced Scorecard as a Strategic Management System, Harvard Business Review, January-February: 75-85.
[7] Kaplan, R.S. and Norton, D. (2001), Leading Change with the Balanced Scorecard, Financial Executive, 17(6): 64-66.
[8] Kaplan, R.S. and Norton, D. (2004), How Strategy Maps Frame an Organization's Objectives, Financial Executive, 20(2): 40-46.
[9] Lawson, R., Stratton, W. and Hatch, T. (2003), Winning Ways: Implementation Strategies for Balanced Scorecard Success, CMA Management, 77(7): 22-24.
1400
INDUSTRY CHANGE THROUGH THE DECONSTRUCTION OF THE VALUE
CHAIN: NEW BUSINESS MODELS
Oana Adriana Gică Roxana Stegerean
Babeş-Bolyai University of Cluj-Napoca Faculty of Economics and Business Administration
NO: 58-60,Th.Mihali Street 400591 Cluj-Napoca
Romania E-mail: [email protected], [email protected]
Telephone:+40264 41.86.52
Abstract The business model at the end of the 19 th century was , in many industries the vertical integration of the value chain. Towards the end of 20 th century we began to witness the deconstruction of these integrated models. New business models are introduced transforming thus the boundaries and the competitive skills that define firms and industries and the nature of competition.In this new competitive environment is not unusual that firms that compete on a single layer of the value chain to extend their activity in more industries. Companies use, more and more, the different layers of the value chain to migrate to other markets. This migration not only causes new profitable markets and businesses but also causing the merger of previous separate industries. Thus it becomes difficult to define the industries using the traditional methods. It is very probable that in the future the competition will take place at the value chain layers and not at industry level. The paper concentrates also on the new business models in this new competitive environment: the layer players, the orchestrators, the market makers, the integrators and the navigators. Keywords: deconstruction; value chain; business models.

1401
1. Introduction
In many industries the business model at the end of 19 th century was the vertical integration of the value chain. Towards the end of 20 th century we began to witness the deconstruction of these integrated models. Competitors with new business models change or sometimes even destroy the competitive advantage of integrated firms. As these new firms introduce new business models, the boundaries and the competitive skills that define firms and industries are also changing, transforming the nature of competition.
Although vertical disintegration may be a relatively invisible part of industry evolution, it can radically transform the sectors in which it occurs. In this new competitive environment is not unusual that firms that compete on a single layer of the value chain to extend their activity in more industries. Companies use, more and more, the different layers of the value chain to migrate to other markets. This migration not only causes new profitable markets and businesses but also causing the merger of previous separate industries. Thus it becomes difficult to define the industries using the traditional methods. It is very probable that in the future the competition will take place at the value chain layers and not at industry level.
Practical experience and empirical research on vertical integration has stressed that internal transaction costs that make the vertically integrated firm inert and inflexible can be extremely high. As a result many integrated firms began disintegration or outsourcing processes in the 1980�s to save on overhead costs or to regain some sourcing flexibility. This was the beginning of the deconstruction of the integrated value chains. Over time factors such as: globalization, deregulation, privatization, increasing sophistication of capital markets and most important � the revolution in the economics of information contributed to the process of deconstruction. The consequence was an increasing number of specialized businesses (focusing on a single or few layers of the value chain), an augmentation of layer specialization and business migration across the traditional industries.
Vertical integration decisions were based on information anomalies. The high cost of getting enough information to suppliers, distribution channels and customers has been the factor that influenced most vertical integration. Today there is the possibility of an open exchange of information at a very low cost and those aspects have two immediate consequences: it allows firm to outsource more activities that was previously possible and encourage the firms that act on a single layer to attack the integrated firms by means of advanced information technology such as the Internet. As a result, the integrated value chains are fragmenting into multiple businesses.

1402
2. Causes of value chains deconstruction
It is very important to understand the reasons for deconstruction, which parts of the chain are most likely to be affected and how it can be used by the company to its advantage. There are three main theories that deal with the main reasons for value chain deconstruction : �rich versus reach', 'interaction versus transformation' and 'three businesses in one'.
2.1. Rich versus reach
Evans and Wurster1 hold that the value chain has traditionally been defined in terms of the trade off between 'richness' and 'reach' of information. Companies, for example, set up branch networks to communicate 'rich' (read detailed or complex) information to customers, whilst advertising could 'reach' a broader population, but not deliver rich information effectively.
The authors hold that a company can increase its competitiveness in this situation by moving along the tradeoff line, e.g. offering higher reach but with less richness than a competitor. A second, but more difficult, strategy would be to move the line outward by offering both increased richness and reach.
Evans and Wurster2 predict that the trade-offline is not only shifted by innovative competitors. Two inventions are causing the line to move. The first is the advent of open, universal communication standards, such as found in Internet communication. The second is the introduction of content standards for the definition, storage and presentation of information. The effect of these changes is that rich information will increasingly reach a much larger audience at a greatly reduced cost. In addition, the market starts performing activities previously requiring managerial co-ordination. Due to this some parts of the value chain might become obsolete and others can be performed in new ways. The outcome is often that the traditional integrated value chain starts deconstructing.
2.2. Interaction versus transformation Butler and Hall sustain that organizations frequently compare
interaction cost with transformation cost. Interaction refers to 'the searching, coordinating and monitoring that firms do when they exchange goods, services or ideas'. Transformation relates to the economic activities of 1 EVANS, P. WURSTER, Strategy and the new economics of information, Harvard Business Review, pg.72, 1997 2 EVANS, P. WURSTER, 'CLICK.BOOM', Ivey Business Journal, pg.35 , 2000

1403
production and delivery 3. The theory of comparative advantage holds that the parties should trade and increase individual and total wealth when one party has a comparative advantage in an activity. Butler and Hall hold that even if one party has a comparative advantage, but the cost of finding, negotiating and exchanging goods is more than can be gained through trading, the parties would not trade. Interaction is estimated to represent as much as 51 percent of labour activity in the United States of America (USA) with an equivalent cost of one third of the gross domestic product4. The authors postulate that due to this huge cost, traditional organisations were constructed to decrease the impact of interaction.
If, for any reason, the cost of interaction decrease, the dynamics of industry could change. A decrease in interaction cost could, for example, lead to a component being sourced from a third party rather than manufactured in-house.
2.3. Three different businesses The 'three firms in one' theory presents one of the most attractive
models. This probably results from the instinctive recognition of the different dimensions of an organization that managers have noticed through experience but were unable to describe in terms of a theoretical framework. Hagel and Singer suggest that most organisations engage in three kinds of businesses. The first attracts customers; the second develops products, whilst the third oversees operations. Each unit employs different types of people, has different cultures and even has different economic and competitive imperatives.
The main driver for the customer business is scope (gaining the largest share of market), whilst operations focus on scale. The product unit focuses on speed to market and innovation. Evans and Wurster hold that the integrated value chains often found in industries are sub-optimal because they integrate businesses with different drivers into one. Hagel and Singer agree that the trade-offs resulting from running the businesses as one adds inefficiency to the system. As soon as the cost of these inefficiencies is more than the interaction cost holding the business together, organisations will unbundle into three.
3 BUTLER, P., HALL, T.W. The revolution in interaction, McKinsey Quarterly, Issue 1,pg.2, 1997. 4 BUTLER, P., HALL, T.W. The revolution in interaction, McKinsey Quarterly, Issue 1,pg.4, 1997.

1404
The unbundled businesses are not predicted to necessarily remain loose standing entities. Some parts are expected to consolidate with similar sections of other organisations that have also unbundled. Consolidation in the customer and operations businesses is likely as the business drivers are scope and scale. Product companies are foreseen to remain small with fragmented players characterising the new industry. Evans and Wurster argue that in the traditional value chain trade-offs were inevitable. One activity was done at a sub-optimal level to accommodate another. The player with the lowest average cost for all activities held a competitive advantage. With deconstruction, 'de-averaging'5 occurs. Each part of the value chain must now be competitive. 'Deconstructors' seek out the most profitable part of the chain and focus only on this element, thus gaining a competitive advantage. Traditional players are potentially left with the less profitable activities.
3. The Implications of Deconstruction
The competitive implications of deconstruction are profound and wide ranging:
• The traditional definition of businesses and industries and, therefore, the reference set of competitors, suppliers, and customers becomes obsolete. The development of new technologies, deregulation, privatization, the liberalization of trade, the expansion of Internet have helped to blur the lines between industries and give rise to new businesses that do not readily fit the traditional industry definitions.
• Competitive advantage is de-averaged. Businesses in which the economics of one activity are compromised for the sake of the whole will be especially vulnerable. In an economy of integrated value chains, competitive advantage is a game of averages. Take the simple example of costs. If a company's aggregate costs are competitive, then having a cost advantage at every step of the value chain isn't necessary: the steps are bundled together. But as value chains deconstruct into distinct segments, layers, and markets, average advantage loses its importance. What counts is advantage in each individual piece of the value chain. Deconstruction leads to de-averaging.
• Advantage across the entire value chain no longer matters; it's advantage in each layer that counts. As a result, the new unit of strategic analysis is the layer.
5 EVANS, P., How deconstruction drives de-averaging,pg.1, 1998

1405
• Horizontal strategies those that leverage layer capabilities across previously distinct businesses become serious alternatives to traditional strategies of vertical integration and customer franchise in a single industry.
• Managing resource allocation at the layer level requires new ways to evaluate investments and gives birth to a whole new concept of the portfolio.
• The boundaries of the corporation become fluid and permeable. Ownership is no longer a condition for effective co-ordination or control. Companies can now make use of key activities in the value chain without owning them.
• Customers are empowered; brands become vulnerable. Traditional asymmetries of information are challenged by the rise of navigators that search and switch on the customer's behalf.
4. New business models
The deconstruction of the integrated value chains provides more freedom to search for or create new business opportunities as each layer of the value chain can be the focus of value creation. We can distinguish five new business models: the layer players, the market makers, the orchestrators ,the integrators and the navigators.
4.1 The layer players As deconstruction spreads, integrated value chains break apart into
independent businesses, or layers. Some of these layers have the potential to become the places where the most value is concentrated and where the highest profits and returns can be found.
The layer players usually try to exploit economies of scale and superior know-how to build a new market by dominating an existent layer of the value chain and maybe they try to expand the layer horizontally across several industries. In order to exist as a layer, a product or activity supplied by a single company must be a key input to one or many value chains, while also being modular enough to stand on its own as an independent business. The most common way to create increasing returns of this sort is to establish an industry wide standard. The existence of a common operating-system standard in personal computing creates enormous value for consumers as more and more software applications are written to the common standard. Microsoft's scale advantage has allowed it to shape the evolution of the personal computer industry. Companies have achieved layer mastery also by

1406
creating markets where none have existed before in the process, triggering further deconstruction and changing the way an entire industry does business.
Any aspiring layer master must carefully anticipate the likely moves and countermoves of other industry players partners, competitors, customers. They have to decide how much of the potential future value they can afford to give away in order to establish a standard. This companies have to be prepared to execute radical changes in strategy as the balance of competitive forces shifts.
Even when layer mastery is finally established, a company must remain vigilant. Mastery is rarely permanent. New technologies can render previously essential information or standards obsolete. Customers can conspire to work around established layers by finding new partners or even by going into business themselves. Although layer mastery often means that the winner takes all, that winner must be prepared to do so over and over again. In a deconstructed environment, defensibility is by definition dynamic. If you stand still, your control is likely to erode.
The best way to defend a layer is to extend it. The most successful layer masters search for opportunities to project their mastery across multiple industry boundaries to amass still more scale, to keep control of the customer, or to defend themselves against competitive threats from other industries. In this way, Microsoft has tried (with uneven success) to spread the Windows standard from personal computers to consumer-electronics devices to cable-television set-top boxes.
An example of layer player is EDS (Electronic Data Systems), a computer company that has specialized by providing services to control and govern comprehensive IT systems. Initially it has operated in the automotive industry- as a part of GM but today it provides IT services ( IT development, online marketing) to firms operating in different industries.
4.2. The Market Makers Another business model is the market maker. The firm�s success is
based on a pioneering development that has become an industry standard. In contrast to layer player that concentrate on an existing value chain layer, market makers create an entirely new value adding layer. But, like the layer players they develop new markets first by using informational advantages and capabilities in one industry. If the market maker succeeds in creating a new layer, the firm then tries to extend this layer across additional industries.
Sabre, with it�s IT- based airline reservation system is a good example of market maker. This system was a marketing invention by American

1407
Airlines and today Sabre is an independent company and it�s basic product is now a standard in the entire travel and tourist segment. This system connect thousands of tourism agents, airlines, car rental companies and hotels.
Another successful invention that resulted in a new market is Internet bookselling. Firms like Amazon.com achieved a high volume of business and gained a positive reputation that now develop related Internet markets.
Enron, that constitutes another example of market maker, revolutionized the business by creating a market for energy trading and making that market a key part of the industry's value chain. Today everyone in the business trades energy, but Enron retains a powerful advantage. Because the company has more than twice the trade volume of its next largest competitor, it has a wealth of experience that few rivals can match. The more trades Enron executes, the more information it acquires about how to identify the best deals and develop innovative techniques for structuring financing and for managing risk. That trading information has even given Enron a proprietary advantage in discovering the most profitable asset plays.
4.3. The orchestrators As the forces of deconstruction break industries apart into an array of
discrete businesses, one compelling strategic idea is to orchestrate the pieces of the value chain rather than own them. The logic is appealing. Instead of holding every link in the chain, orchestrators choose the pieces they want to own and direct the activities of the others by means of a powerful brand, control over critical information, or some other hard-to-create proprietary resource.
Orchestrators create competitive advantage by never acquiring nonstrategic or capital-intensive assets in order to focus on assets that add the most value. Their strategic focus allows them to concentrate capital, time, knowledge, and managerial expertise where they will have the greatest impact. Their unusually high asset efficiency leverages their economics and contributes to extraordinary returns. And their control of key resources gives them an opportunity to dominate the value-added architecture of an industry and even to shape its evolution.
There�s no wonder, then, that some of the most successful companies of recent years have been orchestrators. Nike has dominated the athletic footwear business by concentrating on design and marketing while outsourcing and closely coordinating production through an offshore network of low-cost suppliers. Dell Computer has become the leading supplier of

1408
personal computers to businesses by orchestrating a highly disaggregated supply chain to provide fast delivery of made-to-order PCs.
But orchestration can be hard to execute and even harder to sustain. The very changes in industry structure that make it possible also make it vulnerable to miscalculation, imitation, and competitive subversion. Unless orchestrators master new strategies and skills, they can find themselves defeated by the competitive dynamics that deconstruction unleashes.
The very factors that make orchestration possible also make it easy to copy. The process is straightforward: Orchestrators depend on a network of suppliers. If a supplier base does not exist, the orchestrator must create one. The orchestrator defines precise specifications for product design and delivery, then works with suppliers so they can meet them. As suppliers develop specialized expertise, an entire industrial infrastructure takes shape. Eventually, the system becomes so standardized and transparent that the suppliers are able to offer their services and products to anyone not only to the original orchestrator but to competing orchestrators as well.
That is what happened to Nike. Once the company established an efficient network of low-cost suppliers to produce its shoes, it found the network hard to hold on to. There was nothing to stop Nike's competitors from sourcing from the same suppliers on roughly the same terms. Today the athletic shoe market is awash in new labels and excess product, and Nike's growth has stalled despite the company's powerful brand. Orchestrators must learn to anticipate attacks by imitation and figure out how to head them off.
But imitation is not even the most serious competitive challenge that orchestrators face. Far more dangerous and disruptive is the situation where an orchestrator's suppliers themselves become so strong that the balance of power in the industry tilts decisively in their favor. The classic example is IBM's famous decision to outsource the operating system of its PC to Microsoft.
Orchestration is no mere outsourcing decision. It is a strategic choice that can be extraordinarily profitable but also extremely difficult to defend. Successful orchestrators understand thoroughly the economic attractions of their strategy. But they also anticipate the myriad ways competitors can take it apart. They think hard about whether their strategy can be defended and how.
4.4. The Integrators A viable strategic option is still the integrated business model. For
some firms, the control of all value chain layers allows for cost or
1409
differentiation advantages. The conditions for the success of value chain integration changed under the deconstruction. As compared with layer players, the integrator must be superior at every layer of the value chain, and in comparison with the orchestrators, the coordination capabilities must be at least as good if not superior. We can find successful integrators in many industries: ExxonMobil in oil industry, Nestle in food and Procter &Gamble in consumer products. As the factors that drive value chain disintegration proliferate, the integrator business model will be increasingly under attack.
4.5. The Navigators Power in a value chain often flows to the company that controls
navigation the activities shaping how customers search, compare, and decide what to buy. As value chains deconstruct, a new class of independent navigators is gaining power. These companies threaten to wrest control of navigation from traditional product suppliers, undermining long-standing brands and customer relationships. Fortunately, there are ways to fight back.
Independent navigation isn't a new idea. Retailers have been around for more than a century. More recently, new retail formats such as mail-order houses and big-box retailers have greatly expanded the power of navigators. Now electronic commerce is rapidly accelerating the trend, spreading independent navigation to new industries and to unprecedented levels of efficiency and reach.
The new navigators bring wider choice to more customers, give them more information, and cater more successfully to their individual preferences than ever before. Schwab OneSource, for example, helps investors pick and choose from more than 3,000 mutual funds; Chemdex helps industrial customers select from specialty chemicals offered by more than 100 suppliers. Unencumbered by constraints of geography, inventory, or existing distribution channels, the new navigators aim to control the customer relationship by providing a one-stop solution based on breadth of choice and rich information.
For established product brands, independent navigation is a serious competitive threat. By focusing on easily compared attributes like price, navigators shrink margins and threaten to commoditize every product in a category except the quality leader. By inserting themselves between companies and their customers, they erode the brand experience and hijack valuable customer information and relationships. By deconstructing traditional sales and distribution channels, they strip control from suppliers and profits from the value chain.

1410
Faced with such threats, many companies are tempted simply to give in for example, by adopting the navigator's product standard, buying "shelf space," or even manufacturing a navigator's private-label products. But surrender is a mistake. Incumbents can retake the initiative, but only if they start using the dynamics of the deconstructing value chain to their advantage.
5. Conclusion Information has always been the glue that has held value chains
together. The cost of getting sufficiently rich information to suppliers, distribution channels, and customers has given vertical integration its leverage. As transaction costs plummet, that glue is dissolving. Increasingly, universal access to rich information and common communications standards are enabling the open and virtually free exchange of all kinds of information.
Before deconstruction, a company could maintain an advantage if the average productivity of all the activities it performed was higher than that of its competitors. Today a company must excel in every activity because every link of its value chain is being challenged. That doesn't mean that integrated manufacturers will disappear altogether, but they must be highly productive in everything they do. Otherwise, they should be ready to deconstruct.
As new markets appear at every link in the value chain, the logic of a vertically integrated company must be continually proved rather than taken for granted. Deconstruction is having a considerable impact. But taking apart a value chain is a radical decision. It could mean transforming a company into a collection of independent businesses that buy and sell on the open market.
The key is knowing what you do best. If you are the low-cost manufacturer, could you gain leverage by producing for all players? If your brand can extend into new areas, could you create a licensing and management infrastructure? If you have technology that is applicable across disparate businesses, could you create a strategy to capture that value?
Deconstruction means separating a product or service chain into its component parts and realigning those components to maximize overall value or flexibility. . The goal isn't necessarily to break a company apart; it is to make each layer of the value chain as productive as it can be.

1411
References
[1] BRASER, R.,K.,F., HITT, M.,A.,NIXON, R.,D., HEUSKEL, D., Winning Strategies In A Deconstructing World ,Jon Wiley & Sons Ltd., 2000
[2] BUTLER, P., HALL, T.W. The Revolution In Interaction, Mckinsey Quarterly, Issue 1: 4-24., 1997.
[3] CARBAUGH, R.,J.. International Economics. Cincinnati:South-Westem.,2002
[4] DOMMISSE , W.,R.,OOSTHUIZEN H.,Value Chain Deconstruction In The United Kingdom Retail Life Insurance Industry And Resulting Strategic Options For New Entrants To The Market, South African .Journal Of .Business.Management, Issue 35, 2004
[5] EDELMAN, D., The Patterns Of Deconstruction: The Orchestrator , The Boston Consulting Group, Inc. 1998, Access From <Www.Bcg.Com/Publications/Publication_View.Jsp?Pubid=255>
[6] EDELMAN, D, The Patterns Of Deconstruction: The Orchestrator , The Boston Consulting Group, Inc. 1998, Access From <Www.Bcg.Com/Publications/Publication_View.Jsp?Pubid=255>
[7] EDELMAN, D, The Patterns Of Deconstruction: Layer Mastery , The Boston Consulting Group, Inc.1999, Access From <Www.Bcg.Com/Publications/Files/Eng375_Whlayer_Mastery.Pdf>
[8] EDELMAN, D, The Patterns Of Deconstruction: Layer Mastery , The Boston Consulting Group, Inc. 1999, Access From <Www.Bcg.Com/Publications/Files/Eng378_Reprint_Wh.Pdf>
[9] EVANS, P. WURSTER, Strategy And The New Economics Of Information, Harvard Business Review,75(5):71-84., 1997.
[10] EVANS, P., How Deconstruction Drives De-Averaging, 1998, Access From : <Http://Www.Bcg.Com/Publications/Search_View_Perspectives.Asp?Pubid=241.>
[11] EVANS, P. WURSTER ,Blown To Bits- How The Economics Of Information Transforms Strategy , Boston Massachusetts: Harvard Business School Press,2000.
[12] EVANS, P. WURSTER, 'Click.Boom', Ivey Business Journal, 64(4):35-42, 2000
[13] HAGEL, J.,SINGER, M., Unbundling The Corporation, Harvard Business Review, 11 (2):133-142, 1999
[14] HAGEL, J.,SINGER., Net Worth: Shaping Markets When Customers Make The Rules. Boston Massachusetts: Harvard Business School Press.,1999

1412
[15] JACOBIDES, M. G .,Industry Change Through Vertical Disintegration: How And Why Markets Emerged In Mortgage Banking., Academy Of Management Journal, Vol 48, No.3 June 2005
[16] STERN,C., The Deconstruction Of Value Chains, The Boston Consulting Group, Inc. 1998 ,Access From <Www.Bcg.Com/Publications/Publication_View.Jsp?Pubid=283>

1413
HUMAN RESOURCES CONTROLLING: ANSWER TO THE PRODUCTIVITY
CHALLENGE
Janusz Nesterak Marcin Kowalski
Cracow University of Economics School of Economics and Computer
Sciences in Cracow Department of Management Department of Management
ul. Rakowicka 27 ul. Sw. Filipa 17 30-510 Kraków 31-571 Krakow
Poland Poland e-mail: [email protected] e-mail: [email protected]
Abstract Productivity gap between new EU members and developed western countries has been a topic of recent debates both at macro- and microeconomic level. At micro level, a fundamental role is carried out by management. In this paper we focus on human resources factor as it is believed to be one of the most important determinant of companies growth. We refer to a concept of HR controlling, which stresses the need for complexity in human resources management. For the cross-country comparison of HR management we use the results from research conducted by Deloitte and the University of Economics of Prague. Keywords: controlling; human; resources; HR; management

1414
1. Introduction
Controlling as a management practice is understood as a group function which is carried out equally by the controller and the manager at various company organisational levels. The basis of this function is to determine the strategic and operational company aims, the collection and processing of information in decision making, preparation of material which will assist in the companies direction and also the ongoing control of gathering results.
Development of controlling also supports enterprise growth on a workforce level which up to this point has not demanded individual initiative. Thanks to this, employee activity has grown because of on the one hand delegation entitlement and on the other, the ability to have responsibility in the decision making process. This, however, requires much time and can�t be decided upon without direct participation in this process. This conversion requires gradual and controlled introduction, at the same time with commitment from staff and management where the situation for both is completely new.
Employees are, more than often, recognised as the most treasured element in company growth and expansion, they are recognised by modern managers as capital worth investing in. However, in order to create such a friendly environment, it is vital to work through or introduce a successful system in human resource management in a company which will give noticeable effects.
This task is undertaken by human resource controlling, which allows for avoiding the effects of improper decisions in the area of human resource management, which could contribute to unfounded growth in company operational costs.
The purpose of this paper is to present human resource controlling as an advanced management tool to improve companies productivity and effectiveness as well as employees� satisfaction.
2. The problem of productivity
Most of new EU members face the problem of low labour productivity (Table 1). This phenomenon is easily explained on a macro level. Most of these countries were centrally planned economies, which didn�t go in the line with the free market mechanism. Therefore, over decades private sector didn�t develop at the same pace as in western economies. In

1415
other words, when post communist workforce fulfilled the centrally planed tasks, whereas western economies developed organisations, which were market and profit oriented. Through capital accumulation and continuous quality increase they developed goods ands services which are now exported worldwide. Therefore, disproportions in aggregates presented below primarily arise from the fact, that advanced economies are using value added over long period.
Another reason behind low productivity may be poor organisational system and management dysfunctions. Again, it should be mentioned, that advanced economies have at disposal far more experienced managers than developing countries.
Human resources is recognised as one of the most important factor of company�s growth in the neoclassical models. Diagram 1 presents a typical work time structure. Area C and D stand for human resources failures. Both of them may be reduced or even eliminated through a proper design of HR system.
Table 1. Labour productivity index
2001 2002 2003 2004 2005 2006 EU (25 countries) 100.0 100.0 100.0 (f) 100.0 (f) 100.0 (f) 100.0 (f) EU (15 countries) 107.8 107.4 107.1 (f) 106.8 (f) 106.6 (f) 106.4 (f) Austria 104.4 103.3 103.5 104.9 105.4 (f) 105.2 (f) Czech Republic 60.4 60.9 62.7 63.9 65.5 (f) 67.2 (f) Hungary 64.5 66.9 67.2 69.2 70.5 (f) 71.4 (f) Poland 49.8 50.5 58.0 59.6 60.7 (f) 61.8 (f) Slovakia 56.1 59.1 59.0 59.4 61.1 (f) 62.7 (f) Slovenia 71.6 72.7 74.2 75.9 77.5 (f) 79.3 (f) Source: Eurostat

1416
Diagram 1. Work time structure
Source: Accel Team (www.accel-team.com)
Microsoft Office Personal Productivity Challenge discloses HR management dysfunctions. According to the research, unclear objectives and ineffective meetings are representatives of the top three time wasters. This suggest how much there is to be done in the field of human resources.
Diagram 2. Productivity research results for Poland
Source: Microsoft Office Personal Productivity Challenge Global Assessment Poland Data Snapshot ( February 2005)
Total time ( of operation under existing conditions )
Total ineffective time Total work content
C D A B
BASIC work content of product or
service
work content ADDED
by defects in design or
specification
work content ADDED
by inefficient method of
manufacture or operation
INEFFECTIVE time due to the fault of manage-
ment
INEFFECTIVE time due to the fault of
workers
44%
35%
35%
PROCRASTINATION
UNCLEAR OBJECTIVES
INEFFECTIVE MEETINGS
Poland – top time wasters Sample size – 522 persons Males – 86% Average age – 33 Managers – 17%
Out of 19 categories

1417
3. The essence, aims and tasks of human resource controlling in companies
Human resource controlling is defined in literature as �...an internal system controlling the achievement of aims in individual areas of human resource management in a company involving planning, control effects and work costs and also factors which influence this...�1. Controlling fulfils an extremely important role in the area of human resource management. It permits a better use of the opportunities which resides in the human resource potential the company has. Employees often constitute the companies largest growth and development factors, and proper management of them allows the attainment of high market placement, increasing its value and contributes to effectively making use of the abilities and qualifications of the staff. Via the integration of planning and forecasting, consultancy and also via the informing and controlling in human resource, the possibility of rational administration becomes accessible for all available company resources. This consequently influences a bettering of the competitive position in the market and contributes to achieving company success. The concept of such understood human resource controlling is represented in diagram 3.
Diagram 3. Concept of controlling in relation to human resource management
Source: I.Chomiak, Problemy kadrowe rozwiązywane poprzez wdrażanie systemu informacyjnego controllingu personalnego, Prace Naukowe Akademii Ekonomicznej, Wrocław, 2002, nr 953, s.229.
1 J. Lipiecki, Controlling personalny, �Ekonomika i Organizacja Przedsiębiorstwa�, 1998, nr 12, p.28.
planning direction
human resources
control

1418
In literature there are distinguished the following types of human resource controlling2:
o Strategic, whose task is one of observation and then analysis and forecasting qualitive factors and effects connected to the process of human resource management. It can be said that this is set on the maximum importance of human capital as well as the amount and quality, with the aim of achieving a greater stable market position and being more competitive.
o Operational whose short term activity direction within human resource management is aimed at a definite purpose for the company. The characteristic feature of human resource controlling is above all: much more detailed activities, short term planning, determining the direction of on going aims within the area of human resource management and the company itself.
In regard to the operational tasks of human resource controlling, it is important to3:
o combine both the strategy of the workforce with the strategy of management,
o verify the correct strategy to move human resources in the direction of a precise aim,
o control in the gradual carrying out of this strategy and achieving results,
o treating the human resource department as the core for profit and centre for shaping employee value.
It can be said, that the aim of human resource controlling is firstly based on a �bottle neck� principle, which means changes to employees production according to the scope and structure of work costs, recruitment and the qualifications of staff. Other factors such us changes in work related accidents which may effect loss of work time, internal work relationships and work related illness may in the end, effect how the reward system via the company is carried out4. The second aim may be determined by how to make the most of and shape the abilities of the staff, so that management may increase their value and to gain a competitive edge.
2 A.Pocztowski, J. Purgał-Popiela, Controlling�, op.cit., s.187. 3 A. Sikorski, Controlling�, op. cit, p.51 4 M.Sierpińska, B.Niedbała, System controllingu operacyjnego w przedsiębiorstwie,
Akademia Ekonomiczna w Krakowie, Kraków, 2001, p.85

1419
4. Cross-country analysis of the HR function5
The HR survey was divided into 5 sections and the questions (multiple choice and open questions) focused on providing us with specific details and insights on:
o HR leadership and staffing;
o HR roles and responsibilities;
o The current state of selected HR processes and activities;
o HR performance metrics;
o The envisaged challenges of the HR function in the forthcoming years.
4.1 HR Strategy and Service Delivery The HR function in general develops an HR strategy and then links it
with the organisation strategy. The responses in the Czech Republic, Slovakia and Slovenia show particularly high percentages. However 25% of the organisations in Poland and Hungary do not link the HR strategies with the organisation strategy. In Austria this is the case in 20% of the population. However in most countries the linkage seems to be only one-way: top-down. The organisations that develop an HR strategy take into account the organisation�s situational and environmental changes as well as culture, strengths and weaknesses of the organisation, and social and political changes.
However, only about 50% of the organisations measure the impact of the realisation of the HR strategy. About 75% of organizations in Austria and Slovenia, though, measure the impact human resources have on the organisation while in the Czech Republic just about a third do so.
The most mentioned reasons for not using HR performance metrics are:
o no knowledge about how to measure HR;
o no standard for generally accepted metrics;
o HRIS does not provide required data.
5 Deloitte and the University of Economics of Prague; �The State of HR in Central
Europe�; 2004/2005; http://www.deloitte.com/dtt/cda/doc/content/HRSurvey2EN.pdf

1420
All organisations in Slovenia indicated that they link the organisation with the HR strategy and use HR performance metrics.
When asked, which HR performance metrics are the top 3 HR performance indicators it appears that organisations mostly mention metrics like:
o employee satisfaction,
o employee turnover,
o absenteeism,
o training (hours) per employee.
Most organisations use both qualitative and quantitative indicators. This leads to the assumption that it looks like the HR function is focused primarily internally and not externally. An external focused HR function would stress HR key performance indicators that measure for example the:
o Human Capital return on investment,
o sales revenue per employee,
o productivity indicator,
o error-free service,
o the effect of salary costs on the value-added.
There were only about 5 organisations that mentioned these kind of HR metrics and all are from Hungary. Hungary and Austria are the countries that have the highest percentage of organisations which use HR performance metrics. The involvement of HR priorities in the short- and long-term strategic planning process of organisations differs from country to country. In Hungary in particular the HR function is much involved in the strategic planning process. HR strategies and priorities are involved in this process. This level of involvement might be linked to the HR performance metrics that are used in organisations in Hungary. Also in Slovakia the HR function has established not only top-down links but also bottom-up links with the top organisational level and planning. In Slovenia there is a mixture of answers which vary from �to a significant extent� to a �minimal extent�.
Many of the participants indicated that they are a local subsidiary that is part of a global organisation with a global HR function or they represent the HR function at the global level. Participants have been asked about the implementation and use at the local level of HR processes and services developed at the global level. It appears that in Austria, the Czech Republic and Poland most local subsidiaries develop and/or modify the global HR

1421
processes. Also most local subsidiaries are served with one or more HR processes/services from the global HR function. In Slovakia and Hungary a small percentage of organisations take HR services from a global level.
4.2 HR Structure and Roles The main role of the HR function in Austria and Poland is as a
strategic partner. The HR function focuses on aligning HRM strategies and practices with business strategy, internal and external resources and competences. The HR function executes the HR strategy and HRM practices support in accomplishing business objectives.
In the Czech Republic and Slovakia the main role of the HR function is as Change Enabler. The HR function focuses on managing transformation and change processes and creates relationships with its stakeholders (e.g. employees, management and unions).
Table 2. Human Resources Roles
Country Administrative Employee Champion
Change Enabler
Strategic Partner
Austria 0 % 33 % 27 % 40 % Czech Republic 19 % 21 % 37 % 23 % Hungary 11 % 39 % 22 % 28 % Poland 20 % 4 % 31 % 45 % Slovakia 0 % 6 % 50 % 44 %
Source: Deloitte and the University of Economics of Prague...
The main role of the HR function in Hungary is Employee Champion. The HR function is oriented on increasing employee commitment, capability and establishes relations with employees to solve day-to-day problems, concerns and needs.
In Poland and the Czech Republic about 20% of the respondents still indicate that the main role of the HR function is to design and deliver efficient HRM processes; HR builds efficient infrastructures. In Slovenia a mixture of roles is indicated.
Total HR staff : employee ratio and the span-of-control of HR executives/management were calculated. No correlation was found between the HR staff : employee ratio and:
o the main role of the HR function; or o the use of Human Resource Information Systems; or o outsourcing of HR processes/activities.
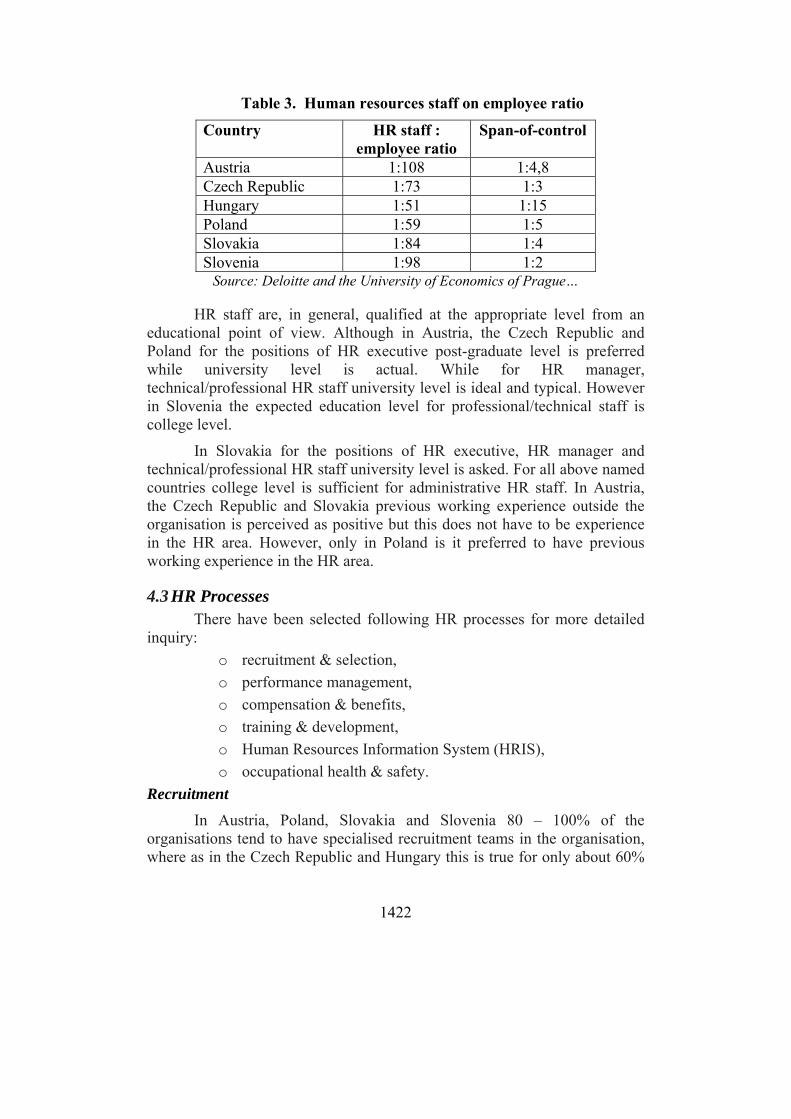
1422
Table 3. Human resources staff on employee ratio
Country HR staff : employee ratio
Span-of-control
Austria 1:108 1:4,8 Czech Republic 1:73 1:3 Hungary 1:51 1:15 Poland 1:59 1:5 Slovakia 1:84 1:4 Slovenia 1:98 1:2
Source: Deloitte and the University of Economics of Prague�
HR staff are, in general, qualified at the appropriate level from an educational point of view. Although in Austria, the Czech Republic and Poland for the positions of HR executive post-graduate level is preferred while university level is actual. While for HR manager, technical/professional HR staff university level is ideal and typical. However in Slovenia the expected education level for professional/technical staff is college level.
In Slovakia for the positions of HR executive, HR manager and technical/professional HR staff university level is asked. For all above named countries college level is sufficient for administrative HR staff. In Austria, the Czech Republic and Slovakia previous working experience outside the organisation is perceived as positive but this does not have to be experience in the HR area. However, only in Poland is it preferred to have previous working experience in the HR area.
4.3 HR Processes There have been selected following HR processes for more detailed inquiry:
o recruitment & selection, o performance management, o compensation & benefits, o training & development, o Human Resources Information System (HRIS), o occupational health & safety.
Recruitment In Austria, Poland, Slovakia and Slovenia 80 � 100% of the
organisations tend to have specialised recruitment teams in the organisation, where as in the Czech Republic and Hungary this is true for only about 60%
1423
of the organisations. The recruitment process incorporates in all countries most of the activities that are considered as �best practice� approaches: job profiles and competencies are used in the selection process, recruitment policy is linked with the HR strategy and in most cases (65% of participants) organisations have prepared employee value propositions (compensation & benefits, career and development, training possibilities are offered). One of the practices that is less used is the monitoring of the costs, quality and effectiveness of recruitment channels (between 50% and 65% of participants).
Performance management In Austria, Slovakia and Slovenia about 90% of the organisations
have a performance management process in place. In the Czech Republic, Hungary and Poland this percentage is about 60%. For the organisations that have a performance management process implemented the use of all recognised �best practices� is not that common. Almost all organisations however have regular performance appraisals with employees but on the other hand most organisations do not have a linkage between performance management and resourcing (internal and external recruitment).
Another weak linkage in most countries except Austria, Poland and Czech Republic is how performance management practices are connected to the development and deployment of employees. Examples of these practices are linkages between performance management and training & development, career & succession planning and personal growth plans.
Only in Austria and Slovenia is the use of performance management measurements broadly used (85% of participants). In the other countries this percentage is between 60% and 70% while for Hungary it is just 50%.
All countries, except Slovakia, have a propensity to link their compensation & benefits process well with other HR practices. And in all countries, except Slovakia, the compensation & benefits policy takes into account topics like motivation, employees� needs and financial forecasts. Most of the organisations distinguish between some employee groups for offering compensation & benefits services. In general almost all organisations offer variable and/or performance related pay but a large number of the organisations indicate that this is true only for some employees. The same counts for offering a cafeteria and/or flexible benefits model.
In Austria most organisations (over 80%) regularly use external compensation & benefits benchmarks for reflecting their policies with the external market.

1424
Training & Development In all countries about 80% or more of the organisations have
formalised training, development and learning programmes (and budgets) for at least some of the employee groups. Also, the majority of organisations monitor the effectiveness of at least some of the trainings at the individual and organisational level and use their training programmes to anticipate future strategic changes.
In this respect it is remarkable that many organisations invest in the development of employees but do not yet seem to have the right mechanisms in place to adequately deploy employees.
Human Resources Information System (HRIS) Only in Austria (47%) and Poland (63%) do the majority of
organisations have fully integrated HRIS systems implemented (i.e. HRIS systems that cover various HR processes and make it possible for one-time data administration per employee). In these countries respectively 38% and 30% of the organisations use various HR administration systems that are not necessarily linked, which leads to mutiple-data entry of employee data.
In the Czech Republic, Hungary, Slovakia and Slovenia integrated HRIS is not widely used and most organisations (40% to 50% of the participants) use various HR administration systems. In these countries only about 25% of the organisations use an integrated HRIS.
Occupational health & safety All participants follow regulations and therefore promote health and
safety protection. In Austria, Poland, Slovakia and Slovenia about 70% of the organisations monitor employee work satisfaction. In the Czech Republic this is only roughly 60% and in Hungary only 45%.
Participants were asked which benefits they provide to employees to improve employee well-being. Most organisations provide benefits which are more compensation based than supporting employee and organisation wellness. The majority of organisations provide:
o restaurant vouchers,
o contribution to holidays/recreation,
o travel allowance,
o insurance benefits,
o health care.
1425
Benefits that are focused on employee and organisation wellness provided by 50 � 60% of the organisations are:
o sport and activity programmes,
o company team building,
o flexible working hours.
Benefits that are particularly focused on employee and organisation wellness but are not common include:
o work-life balance,
o working from home,
o parental leave,
o child assistance.
4.4 Future outlook In all countries the majority (between 60% and 80%) of organisations
expect �no change� in the HR budget for the next fiscal year. A minority (between 10% and 30%) of organisations expect a decrease in the HR budget.
The same response was received for a change in the number of HR staff. Again a majority (between 60% and 90%) of organisations expect �no change� in FTE of the HR staff in the next fiscal year. A �decrease� in HR staff is expected by 10% to 30% of the participants. However, when asked what the situation will be 3 to 5 years from now the number of participants that expect a �decrease� remains the same but more participants expect an increase.
The table below shows which HR processes are expected to have the greatest demands. We have shown the HR processes with the top 3 percentages per country. In the EU accession countries it appears that the major focus and demand is expected to be on performance management, compensation & benefits, training & development as wells as internal communication, while in Austria the focus is on HR policy development, training & development, HR planning and employee counselling/coaching. The latter two topics are in Austria, as mentioned above, currently indicated by none of the participants as a main responsibility for line management.

1426
Table 4. Priority demand for HR processes
Austria Czech Rep. Hungary Poland Slovakia Slovenia
HR Policy Development 31% HR Planning 31% Recruitment & Selection 70% Performance Management 45% 26% 80% Training & Development 31% 36% 26% 75% 80% Compensation & Benefits 33% 36% 32% 80% 80% Change Management 36% Employee Counselling/Coaching 31% Internal Communication 34% 35% 70% Employe Relations 80%
Source: Deloitte and the University of Economics of Prague�
5. Organisation of human resource controlling within companies
One of the most intrinsic factors affecting the efficiency and effectiveness of human resource controlling as a helpful tool in the process of human resource management in companies is the organisational manner which has as its aim:6
o precise range of task and the competency as well as determining the responsibilities of the human resource controller or those for whom are accountable for this function,
o assigning specific activities to the appropriate organisational divisions by human resource controlling,
o to determine where these divisions can be most effective within the organisational structure of the company.
Generally, it can be said that the role of the controller in companies is to above all, implement human resource control systems and to then monitor
6 A. Pocztowski, J. Purgał-Popiela, Controlling�, op. cit, p.189

1427
their on going effective functioning. Responsibilities of the human resource controller are very wide and the administration of these activities more than often bring with them a great deal of accountability. Therefore, an absolutely vital function is to determine the individual personality, talent and ability along with the necessary qualifications such a controller should have in order for this person to realise his/her personal goals and achieve market success. It is necessary that the controller�s profile within the function of personnel and other functions have analytical, persuasive, motivational and interpersonal and management skills. Also of importance is that professional training includes the understanding of the concepts, instruments and techniques involved with human resource management as well as company economics, concepts of business planning, budgeting and balances. P. Świerkula states that the model controller should be an open minded person who is able to detect and identify the most important information quickly and effectively in order to analyse and present it to interested organisations7.
The basic role of the controller within the function of human resource management should include8:
o choosing a specific method, time and range of planning for personnel within a company,
o control the true realisation of processes connected to the area of human resource management as well as their progress in achieving desired goals,
o �bottle neck� analysis, where human resource management can identify the weaker areas of the company and define ways for them to be eliminated,
o coordinate work associated with the controlling process and to work through a coherent timetable and programme for human resource managers,
o establish the information needs for staff function,
o measurement and reporting of internal and external concerning employment,
o assistance and training for upper management and human resource manager.
The appropriate positioning of controlling staff within the organisational structure is an important factor in achieving high performance 7 P.Świerkula, Controller- rola i zadania: www.controlling.info.pl//artyk/pokaz_artykul.php3?nr=14 8 Z. Sekuła, Controlling�, op. cit., p.387-390

1428
and effectiveness in activities carried out. The human resource controlling department can be located at head office where it deals with upper management only9. The second location would be working with middle management on the same level as other management. A high human resource controller position within the company hierarchy allows for them to be in a favourable position to promote organisational issues of internal human capital, permitting independence and access to a variety of information of great strategic company value. Thanks to this structural position, the controller can fulfil the function of advisor although not having the ability to make or carry out decisions. In the second position, the controller works much closer with all company divisions which have an essential effect on the regularity and speed of the decision making process and carrying out of tasks. Z. Sekuła states that it is possible in such a situation of using human resource controlling which doesn�t present an independent controlling position but rather its function is passed on to the human resource department10.
Of course the factors which determine the location of human resource controlling staff within the organisational structure of companies are also quite wide and the specifics of its activity, already existing organisational structure and the company level of expansion shouldn�t be forgotten. In small business the function of controller is taken over by the owner or the director whose role is to support the process of management via the attainment of information and fulfilling a consulting function11. In mid range business the role of controlling is carried out by organisational divisions created for this purpose. Whereas in large companies, the position of controller emerges as either the head of the department of directly responsible to upper management.
The firm Cap Geminin Ernst & Young undertook a questionnaire among company owners regarding the use of controlling staff within their company. The results were published in the report Human Resources Management 2002/2005 Bedeutung, Strategien, Trends. Presented in Chart 212.
The research was carried out on a group of 100 companies of which over 60% responded that their controlling staff were located in the personnel department. Every 3d person also identified controlling staff within the personnel department and the financial department. Only 6% of respondents 9 K. Czubakowska, Controlling jako instrument zarządzania, Zeszyty Metodyczne Rachunkowości, Wydawnictwo Podatkowe GOFIN, 2000, nr 14, p.14 10 Z. Sekuła, Controlling�, op. cit, p.371-373. 11 A. Pocztowski, Controlling�, op. cit, p.8. 12 Human Resources Management 2002/2005, Bedeutung, Strategien, Trends, Cap Gemini
Ernst&Young, 2002, rozdz.V, s. 20- raport z badań.

1429
stated that their controlling staff were solely allocated to the financial department.
Chart 1. Location of human resources controlling within companies
Source: Research Report -Human Resources Management 2002/2005, Bedeutung,Strategien, Trends, Cap Gemini Ernst&Young, 2002, p. 20
6. Conclusion
In conclusion it should be stated that human resources controlling represents an essential tool in the assistance of the human resource management process within companies. They are necessary as this form of instrument management, results in mainly a greater meaning as to how not only staff work but their work within the company itself. Thanks to the effective use of their ability and qualifications, companies are in the position to follow through earlier plans, minimize or completely eliminate threats or difficulties which may appear in the near future.
The use of human resources controlling allows for recruitment rationalisation, taking into account the staff number realistically required by companies, limit accidental activities in the process of human resource management, eliminates the repetition of work by several members of staff, counteract incorrect decisions which are often expensive and carry out systematic appraisals of all activity connected with personnel policies realized within the company. All of these activities on significant levels effect the ability of companies to achieve results and to enhance its market performance. In order for these tools to be totally effective and provide the
6%
31%
2%
61%
human resourcesdepartment
fianancialdepartment
human resourcesand financialdepartmentsimultaneouslyno department
Where in your company is human resources controlling located?

1430
desired results, it is vital that managerial commitment and also abilities are utilized by the company to adapt to market changes.
Thanks to the information provided by the human resources controlling, improvements in human resource management occur and the consequences of this are represented by the companies results and stronger financial position.
The success of these adoption processes allow for controlling solutions which are dependant mainly upon the personal characteristics of the controller and also how important the process of human resource controlling is for upper management.
References
[1] ARTIGE L., CAMACHO C., DE LA CROIX D.; (2003), Wealth Breeds Decline: Reversals of Leadership and Consumption Habits, Universite de Louvian Discussion Paper No. 54.
[2] Deloitte and the University of Economics of Prague; �The State of HR in Central Europe�; 2004/2005; http://www.deloitte.com/dtt/cda/doc/content/HRSurvey2EN.pdf
[3] EASTERLY, W. and LEVINE, R. (2001), It's Not Factor Accumulation: Stylized Facts and Growth Models, World Bank Economic Review, 15(2), pp. 177-219
[4] GREINER L.E. (1972), Evolution and Revolution as Organizations Grow, Harvard Business Review 1972
[5] Human Resources Management 2002/2005, Bedeutung, Strategien, Trends, Cap Gemini Ernst&Young, 2002, rozdz.V, s. 20- raport z badań.
[6] JONES C.I., WILLIAMS J.C., (1999), Too Much of a Good Thing? The Economics of Investment in R&D, NBER Working Paper No. 7283
[7] VAN DE KLUNDERT T., SMULDERS S. (1998) Capital Mobility and Catching Up in Two Country, Two Sector Model of Endogenous Growth, Tilburg University Working Paper.
[8] LIPIECKI J. Controlling personalny, �Ekonomika i Organizacja Przedsiębiorstwa, 1998, nr 12.
[9] Microsoft Office Personal Productivity Challenge Global Assessment Poland Data Snapshot (2005)
1431
[10] POCZTOWSKI A., Controlling w zarządzaniu zasobami ludzkimi, �Ekonomika i Organizacja Przedsiębiorstwa�, 1994, nr 8.
[11] POCZTOWSKI A., Miś A., Analiza zasobów ludzkich w organizacji, Wydawnictwo Akademii Ekonomicznej w Krakowie, Kraków, 2000.
[12] POCZTOWSKI A., Purgał-Popiela J., Controlling personalny [w:] Controlling funkcyjny w przedsiębiorstwie pod. red. M. Sierpińskiej, Oficyna Ekonomiczna, Kraków, 2004.
[13] SEKUŁA Z., Controlling personalny, cz.I, Istota i przedmiot controllingu personalnego, OPO-TNOIK, Bydgoszcz, 1999.
[14] Sekuła Z., Z ręką na pulsie, Controlling personalny (1), �Personel�, 1998, nr 7/8.
[15] SIERPIŃSKA M., NIEDBAŁA B., System controllingu operacyjnego w przedsiębiorstwie, Akademia Ekonomiczna w Krakowie, Kraków, 2001.
[16] SIKORSKI A., Controlling personalny [w:] Controlling w zarządzaniu przedsiębiorstwem pod red. naukową J. Duraja, Katedra Analizy i Strategii Przedsiębiorstwa, Instytut Ekonomik Stosowanych, Wydział Ekonomiczno-Socjologiczny, Uniwersytet Łódzki, Łódź 1999.
[17] SIKORSKI A., Controlling personalny, Zarządzanie zasobami ludzkimi, 2001, nr 2.
[18] SOLOW R.M. (1956) , A Contribution to the Theory of Economic Growth, Quarterly Journal of Economics. Vol. 70 (1) pp. 65-94
[19] STĘPIEŃ J.B., Mierniki funkcji kadrowej (3), �Personel�, 2001, 1-31 lipca; http://www.deloitte.com/dtt/cda/doc/content/MiernikiKadrowe_pl.pdf.
[20] ŚWIERKULA P., Controller- rola i zadania: www.controlling.info.pl//artyk/pokaz_artykul.php3?nr=14
[21] TONDL G., VUKSIC G. (2003), What makes regions in Eastern Europe catching up? The role of foreign investment, human resources and geography, IEF Working Paper Nr. 51
[22] WUNDERER R., Schlagenhaufer P., Personal-Controlling,Schäffer Poeschel, Stuttgart, 1994.

1432
CHANGES IN THE FIELDS OF ACTIVITY DURING THE TRANSITION PERIOD AND
ROMANIA�S ACCESSION TO THE EUROPEAN UNION - CASE STUDY: SC ALCOM SA
Georgiana Costin Codruţa Osoian
Babeş � Bolyai University, Cluj Napoca Faculty of Economic Sciences and Business Administration
Management Department Str. Artelor Nr. 47
400439 Cluj Napoca Romania
e-mail: [email protected], [email protected] telephone: +40 (0)744 697 701, +40 (0)722765146
Abstract After the Revolution of 1989, Romanian economy went through an important transformation process from a planned economy to a functional market economy. The changes which occurred in the labor market (the increasing rate of unemployment), the market of goods and services (the emergence of foreign companies) and in the capital market forced many Romanian companies, which already existed before 1989, to change their field of activity in order to survive. The company S.C. ALCOM S.A of Cluj-Napoca is in the same situation. It used to be the greatest company of distribution and logistics in the county of Cluj. As the competition on the wholesale market increased due to the emergence of super and hypermarkets chains such as Metro, Selgros, Carrefour, Billa, Plus, Auchan etc.), the company was forced to reorient itself to the real estate market. This reorientation brought about the laying off of more than 500 employees as well as the giving up to the logistics equipment. Moreover, the frequent changes in the fiscal legislation forced the managers to adopt a strategy of company division into 14 micro-enterprises. In this article, we shall tackle on the changes that merged at the national level and the reaction mode of the managers at the micro level.
Keywords: labor market, distribution, logistics, hypermarkets, legislative changes

1433
1. Introduction
The transition to the market economy has eventually been understood as a movement from the public sector � controlled by administrative levers � to the private sector, where the managerial posts seem to go first. The most significant function held by the management within this transition is enforced by the necessity to create an overall capacity of innovation, flexibility, and, even under the circumstances of an unstable business environment, a certain stability that should ensure success in the most difficult or extreme situations will be needed.
Within the given context, the theoretical and furthermore, the methodological approach to a theory of the commercial management, which makes the object and the topic of this project brings distinct, practical bonds. Throughout this study, we will seek to emphasize, while building a case in point, the need to switch the traditional, managerial mentality over the economic activities to a marketing vision, which calls forth on the primary necessity of any company to detect the demands and the wishes of the aimed consumers / customers and give forth / satisfy their complacencies in an economic manner that should be more efficient than the competition�s offer.
The method of underlining the manners and the means that allowed the achievement of an efficient improvement of the commercial management, situation that applies to the company analyzed throughout this paperwork, and under the impact of the major changes appeared during the transition process, implied certain conceptual and methodological disentanglements regarding the essence of that process, the analysis tools and the evaluation markers.
2. Changes in the national economy after 1980
In order to recall the bonds of the economic science, it will be enough quoting John Maynard Keynes�s words: �The theory of the economic sciences does not furnish a complex of invariable conclusions, with direct application in politics. It is a method, not a doctrine, a mental instrument, a thinking technique that helps its users reach the right answer� (Conrad Hilton � �Be My Guest�, Ed. Prentice Hall Press, New York, 1987, page 278). Therefore, we will focus on the fact that, in order to elaborate efficient development strategies, the management of any business must set as its main goal the economic analysis, relating permanently to a given business environment, while permanently noticing and explaining the economic cycles.

1434
The overall categories of competitive management, undauntedly envisioned, will be approached by highlighting the technical solutions meant to improve the profitability of the company, considering that the success of a deal is possible only through a full insight into the environmental factors.
Conceptually, and considering the process of applying the theoretical principles to the practical area, the transition from a centralized economy, with the state propriety as its main feature, to a market economy, turned out to be a very complex matter. Due to the lack of precursory conditions, necessary for the good functioning of the economic body that relies on self-adjusting mechanisms, the transformation of the over-centralized system appeared to be a very difficult process. The major restrictions that affected the process of transformation in order to create the market self-adjusting mechanism are as follows:
• The idleness of various structures (social, economic, institutional);
• The lack of financial provision (the inhibition of the process of forming the in-land capital and the insignificant draw of foreign capital due to a general mistrust in the newly-formed markets);
• The insufficient development in the sector of services;
• The gap between the speed of the implementation of the banking, financial and currency policies and that of achieving the absolute economic basis of the transition (management buy-out, management, capital, labor force);
• The existence of serious structural mismatches in the areas of social protection and labor force;
• The scarcity of knowledge held by the formers of the economic policies, both at the macro and micro-economical levels.
• The economic thinking is divided into embracing two different opinions regarding the means of passing to the market economy: the so-called shock therapy, and the gradual transition.
The shock therapy brings forth its own disadvantages:
• It diminishes the time factor, the cold existence of the gap between the moment of the institutional reform and the

1435
moment of the adjustment of the micro-economic sector to the institutional changes;
• It neglects the national feature of the economies in transition;
• It totally disregards some events pointing at the changes in the international climate (the disappearance of the URSS, the breaking-up of the CAER, the national-separatist movements);
• Its fundamental thesis - modifying the institutional system would automatically bring radical changes in the society and the economy�s structure, behavior and function � is false.
In Romania, as well as in other former communist countries, due to the above mentioned conditions, the concept of gradual therapy, according to which the best transition strategy is combining the stabilizing policies (short-term policies) with those that promote the reforms and the reorganization (long-term policies) has been gradually developed. Today, when in Romania the management buy-out process has not been accomplished yet, most authorized opinions state that it has proved to be a wrong solution, which has excessively delayed the reform.
Ignoring the management buy-out process, the main components of the transformation process into market self-adjusting mechanisms, were:
• The creation of the market institutions and the organizational structures needed for their well-functioning: stock exchanges, banking system;
• The liberalization of prices and their evolution which was mostly determined by the demand-offer ratio;
• The creation of the main components of the market: the labor market, the goods and the services market and the financial market.
The management buy-out is a fundamental condition to meeting the demand of turning the structure of economic agents and of adjusting their behavior to the self-adjusting mechanism of the economic system. The management buy-out is not a goal per se, but it is the basic means by which the competitive structures of the environment of the market economy are created. It implies two major goals: the development of the private propriety and the building-up of organizational structures that would create and consolidate the competitive environment, as well as ensure the conditions for raising the business profitability.

1436
The following analysis will briefly revise the way in which the company - subject to our case in point has adapted itself to this process of transition to the market economy.
3. Case study � S.C. ALCOM S.A.
The �ALCOM� S.A. Company has been founded on the former structure of the Wholesale Trade Company (I.C.R.A.), being a Romanian legal person that operates according to the laws of the country, legally organized as a share company, with business quarters in the city of Cluj-Napoca.
In its first years of life, S.C. �ALCOM� S.A.Cluj functioned as a company with entirely state-held capital, carrying on the main activity of its predecessor (I.C.R.A.), the queue handling and the distribution of alimentary goods to its customers; these operations were carried out so as to meet the customers� demands or according to the assignations and decisions made by its board. Afterwards, following the creation of the two types of funds, The Fund of State Propriety (FPS) and The Fund of Private Propriety (FPP), the company�s capital was divided 70% to the F.P.S., namely to the state capital, and 30% towards the population in propriety certificates, handled by the F.P.P. Thus legally organized, the company functioned until 1992, with the General Shareholders Assembly as its board. The General Shareholders Assembly was not strongly motivated in taking decisions that should point at a real development of the company mainly because it consisted of representatives of the F.P.S., of the F.P.P. and of the employees, being a heterogeneous board from every point of view (business interests, professional training and involvement).
In 1993, the Company�s employees created a non-profit company, a legal person whose only purpose was to buy the shares held by F.P.S. and F.P.P., therefore the management buy-out of the �ALCOM� S.A.Cluj Company, renamed �ALCOM� P.A.S. Cluj (Employees Action Program). The board of �ALCOM� P.A.S. Cluj negotiated the buy-out of all the �ALCOM� S.A.Cluj shares for the employees with the two Funds, and got the deal.
In 1994 there the share buy-sell contracts were signed; thus, the entire joint stock of 991,8 millions lei, divided in 9918 shares of 100.000/ share face value, entered the private propriety of the employees, and the �ALCOM� S.A.Cluj Company became a company with entirely private capital.

1437
• The activity of lab analysis for all the products commercialized by the company as well as for other companies;
• The activity of getting together encasements, their reworking and capitalization through restitution and through selling to tierces;
• The activity of renting available camp sites to tierce legal persons in order to judiciously administrate the existing camp sites;
• The activity of maintenance and repair (by their own personnel) of en-gross camp sites, of their own shops, their own means of auto transport, their cargo handling appliances, of the machines, aggregates, apparatus, installations.
The �ALCOM� Company functioned according to the laws no. 15/1990, 31/1990 and to the Company�s Order - approved by the General Shareholders Assembly, within the space of goods camp sites, which add up to over 30.000 square meters, and which are adequately prepared for the mechanized handling of good where thousands of commercial companies used to get their supplies and where 10.000 � 12.000 bills, more than 2.000 taking � ins, more than 10.000 transfers to its own en � detail shops were operated, by using more than 60 transportation vehicles.
As the company�s logical diagram / organization chart shown in the Annex no. 1 points out, the supreme collective organism that makes the company�s decisions is the Shareholders General Assembly. The Administration Border of S.C. ALCOM S.R.L. is made up of 5 members, appointed by G.S.A. for a period of 4 years. While dealing with tierces the company is represented by the president of the Board who is also the General Director / Manager and who, together with his administrative directors operates the company�s management.
The Commercial Department is made up of two commercial departments, one for the en-gross activities and a commercial office for the en-detail activity, this being the engine of the company, taking care of both supplying the goods from various providers, thus concluding economic contracts which they monitor, they supervise the delivery of these products to their own chain of shops and take care of the prompt customer demands brought forth by the salesmen.

1438
According to art. 6 of the company�s statute, the company�s main object of activity refers to commercial deeds and commercial activities that follow the legal stipulations of the Romanian Commerce Book in force and the terms of the other regulations on the company�s activities, terms agreed on by its shareholders.
The company�s main activity involves traditional commerce, the en-gross type, with food and other products. Immediately after its buy-out, a chain of company-owned en-detail stores that have gradually counted 33 units was created.
With more than 30 years experience in the field, the company has accomplished its main goal, mainly by developing the following activities:
• Conclude mutually beneficial transactions with providers, producers or distributors of food and different types of non-food products.
• Conclude mutually beneficial transactions with the users � the company has signed more than 600 transactions with various customers, legal persons from Cluj County and the nearby counties.
• Regularly supply its own store houses and stores with a great variety of food products and food components.
• Organize the management of the products� qualitative and quantitative taking-over.
• Provide the stock supplies.
• The efficient management of the goods transportation while stocking and distributing them.
• Coordinating the activities of supplying the storehouses and the regional stores and managing the expenses involved.
• Obeying the legal terms while organizing and managing the operative evidence, the accounting handling, handling the analytic and synthetic accounting, efficient handling of the legal documents and of the operations generated by each activity.
• The efficient management of the camp sites.
• The activity of roasting the green coffee and of pre-packing the roasted coffee.

1439
• The activity of pre-packing a series of products delivered in bulk by their producers.
By the implementation of the already exposed organizational structure, by making use of the logistic data base and especially by adopting a strategic management, the company that we have monitored / analyzed, as emphasized by Table no. 1.1. registered between 1999 � 2000 an upwards evolution of both its rate of turnover and of its profit earning capacity indicators, although it has continuously been threatened by keen competition in the field. The study sighted out a total of 40 Romanian companies which had a similar start and status in 1990, a total of 37 having a different, downwards course.
Table 1.1. Sales Evolution at National Level and at S.C. ALCOM S.A. Years National Economy S.C. ALCOM S.A. Inflation
Indicators Whole sale food goods � billion Lei (current prices)
Evolution Indices(%)
Sales � Billion Lei (current prices)
Sales Evolution Indices
0 1 2 3 4 5 1993 395,5 666,6 100,0 1,204 100,0 1994 161,7 1083,2 100,5 2,351 120,76 1995 127,8 1607,2 116,1 4,283 142,55 1996 156,9 3048,7 120,9 9,857 146,68 1997 251,4 8361,8 109,1 34,837 141,39 1998 140,6 14108,6 120,1 56,011 114,8 1999 154,8 22298,8 102,1 95,993 110,74 2000 140,7 30339,1 96,7 98,070 73,37 2001 130,3 39097,1 98,9 106,419 83,34 2002 117,8 48727,7 105,8 92,598 73,88 2003 114,1 63882,5 114,9 63,035 59,73 2004 109,3 76945,6 110,2 36,212 52,59 Source: The statistical annual of Romania 1991 � 2004
Having in view the conditions of the nowadays market economy competition becomes an objective necessity, it becomes one of the most important rules of the market strategies, stimulating the need to maximize, diversify and improve the quality of the goods offer in order to align it to the market standards, namely to the customers� demands.

1440
The transition period in Romania � transition which we have summarized in the opening part of this paperwork � marked an uncontrolled use of the unfair competition, of the underground economy, phenomena widely generated by the activity of a series of economic agents who constantly broke the terms of the legislation in force. The legislation in every field has been gradually modified in order to keep the pace with the demands of the free market.
The fiscal legislation has met with multiple and repeated changes itself. Therefore, whether the period before 1989 considered it important just because of the tax rate that affected the goods sales and established a different percent for each group of products, beginning with the 90�s the tax rate on profit was introduced, initially demanding a totally unrealistic 42% / percent. This percent has eventually decreased in time to a 39%, then to a 25%, to ultimately come to a 16%, as a consequence of the amendment of the rules of the Fiscal Book this year. Beginning with 1993 the new element of the economic market appeared in the shape of the VAT (value added tax) which has been standardized for most of the products or services to a quote of 22%. The food tax equaled a rate of 11% for a while, a tax rate of 9% being applied to the so-called basic food products. During the last 6 years a 19% tax rate has been applied / demanded.
Although Alcom S.A. has tried to promote and enforce by its owners� associations and through the Romanian Department of Commerce certain law trends meant to stimulate a faster development in the sales sphere where it operates, in order to improve it and make it ready for the great competition caused and run by the international commercial concerns ( Metro, Billa, Selgros, Auchan, Aldi, etc) and which, immediately after 1990 have shown a particular interest for the Romanian market, attempts that have finally failed.
Under the given circumstances, the company management focused on the continuous evolution of the market and on the legislation amendments, trying to dwell on activities, products or departments which have proved to register a plus / a growth of their profitability level, by making an effort to choose strategic alternatives that should provide the company competitive advantages.
The excessive revenue legislation, the evolution of the inflation which during 1991 � 1993 registered a percentage of 322.8, 299.2, 395.5, and 251.4, in 1997 have led to a decapitalization of the company. This period registered a growth of the bank credit up to a level of 200% even during the years in which the inflation went under the already mentioned barriers, fact that cost the company unforeseen losses. In spite of these rough conditions S.C. Alcom S.A. has managed to achieve profitability. As far as its activities are
1441
concerned the company has accomplished its objectives and reinvesting the dividends of its stockholders it managed to pay off the installments stated by the buy � sale agreements on the already mentioned shares.
Rid of these contractual terms, here included the clauses regarding the main activity of the company and the need to keep all its employees up to the date of the final payment of the shares, the company which makes the object of the present paperwork implemented a different strategy: realizing its impossibility to compete with the chain of international stores, it has gradually reduced its activity of commercializing food products in the favor of producing goods (spice production, poultry, chicken breeding).
It has also had in view the revamping of its assets and their exploitation by renting them or by applying certain policies / strategies of association. While giving up certain traditional activities the company oriented itself to new activities, with a greater potential, such as civil building and real estate business.
Taking advantages of the legislative stipulations regarding the micro-corporations that should not pay any taxes on their profit and whose tax rate equals 3% (from a previous 1.5%) the company divided itself into 11 new commercial companies, each considered a micro-enterprise, each administrating just one asset of the initial company, each understood as an independent profit gathering center.
The need to adjust itself to the demands of the European Union has gradually turned the production activities into a costly business. First, the necessity to get and use a computer program that should allow a daily evaluation of the company stock became urgent. Secondly, the company had to draw a new project on packing its products so that the wrapping should now provide information on the bar code for each product, the cost of which not being easily swallowed by the amount of the whole manufacturing / production process.
4. Conclusion
Aiming not only at its survival but also at its adjustment to the demands of the market economy S.C. Alcom S.A. has been forced to adopt a series of strategic decision.
We consider the following to have had an enormous impact on the future development of the company: the company�s management buy-out, the creation of its own chain of en-detail stores, the development of a series of profitable activities, the change of the company�s traditional main activity into a new, required activity, the division of the company into 11 micro-
1442
enterprises and other strategic decisions regarding the efficient management of the company�s assets, managerial efforts that followed the requirements of Romania�s integration into the European Union.
References
[1] HILTON, Conrad:�Be My Guest�, Ed. Prentice Hall Press, New York, 1987
[2] ILIEŞ, Liviu: Managementul firmei, Ed. Dacia, Cluj � Napoca, 2003,ISBN 973-35-117-x
[3] PURCĂREA, Teodor: Management commercial, Ed. Expert, Bucureşti, 1994, ISBN 973-96322-5-4
[4] *** Anuarul Statistic al României pe anii 1991-2004, INS, Bucureşti, ISSN 1220-3246
[5] *** Codul Comercial şi legile uzuale, Ediţia 2005, Ed. All Beck, Bucureşti, 2005, ISBN 973-655-512-7