Embed Size (px)
Citation preview

-
-
BUREAU OF RECLAMATION DENVER LIBRARY
I llllll lllll lllll lllll lllll lllll 111111111111111111 92082811
REMOVAL OF SALT WATE;R
FROM TWO-PART AND SINGLE-PART
AQUIFERS USING TILE DRAINS
TA 416 .887 HYD-541 1965 C.1
by
E. J. Carlson Office of Chief Engineer Bureau of Reclamation
Department of the Interior Denver, Colorado
A paper to be presented at the ASCE Hydraulics Division Conference, Tucson, Arizona August 25-27, 1965

Carlson, E J REMOVAL OF SALT WAT DRAINS. . Paper, ASC Denver, 71 p, 47 fi DESCRIPI'ORS-- "·drai water/ permeability salts/ hydrostatic time/ laboratory te drains/ subsurface IDENTIFIERS-- *aqui
· rate/ Ghyben-Herzbe saline-nonsaline in
To :
1 U.S. DEPAR CURRENT AWAREN E
0 Document reques
DATE DUE
rII.E Reel,
line , ifers/ w nets/ -tal
flow ifers/
,N ---
:val.
i----
PRINTED IN U.SA
REMOVE END STUB FIRST; FOLD ON PERFORATIONS & DISCARD THIS 1/4-INCH STRIP
I I I I I I I I I I I I I I USING TILE DRAINS TO SWEEI'EN AQUIFER
Laboratory tests were made to study aquifer sweetening by applying fresh irrigation water to the soil surface and removing brackish water with tile drains placed 8 ft below the ground surface. These tests were conducted iD a glass-w.1.led tank 15, 71 ft long, 2. 5· ft deep, and 2. 5 ft wide, using (1) a 2-part aquifer representing a vertical cross section through idealized portions of an irrigated valley; and (2) a single-part aquifer of fine sano to evaluate a derived formula based on the Ghyben-Herzberg principle, for use in computing depth to a saline water-fresh water interface. Results ot both tests showed that tile drains placed near the ground surface will not intercept and discharge fresh irrigation water applied to the surface if all or part of the aquifer contains salt water. Fresh irrigation water replaces the salt water as the latter moves into drains and a stable fresh water-salt water interface is eventually formed in the aquifer. Decreasi?lg drain spacing reduces amount of salt water that will be removed from the aquifer because salt water has a greater density than fresh water and a bal, ance of forces develops in which the saline water reaches a condition of complete stagnation. Aquifers were charged with salt water having a concentration of 4,000 to 79 , 770 PIJ!l, The salt water was d,yed blue for visual identification and photographic recording.
ls) --...s),
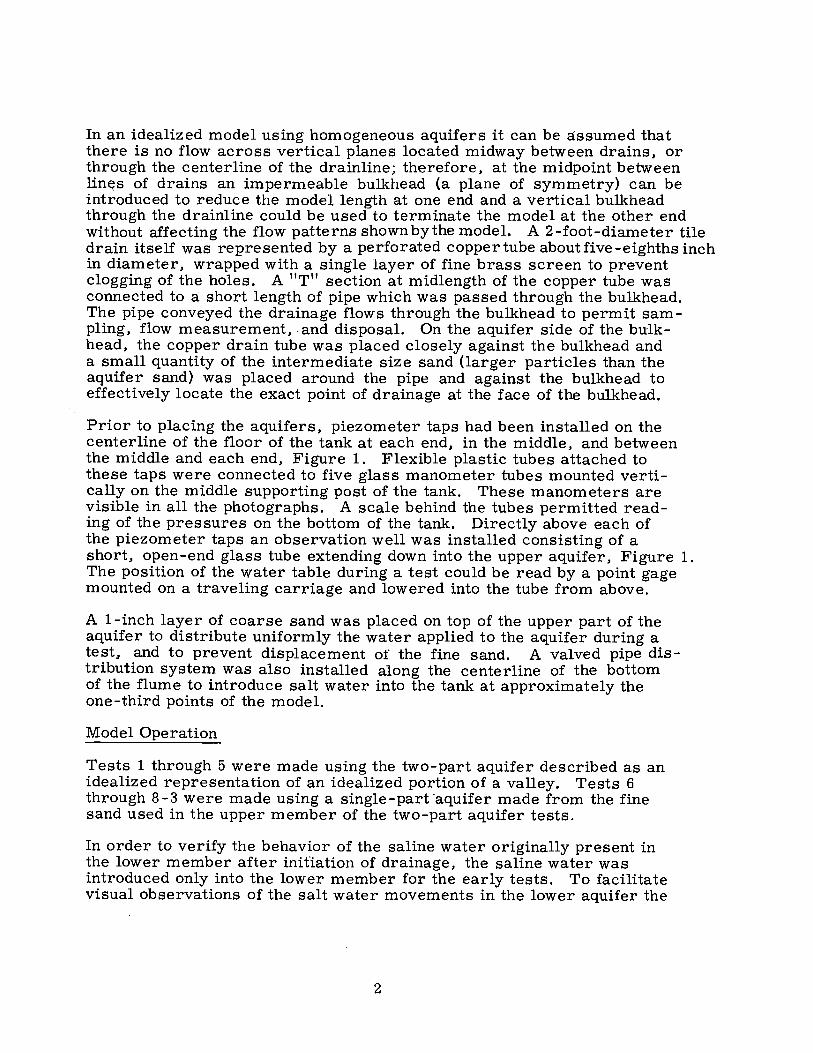
a- ABSTRACT -_ Tests were made to study the process of aquifer sweetening (removal of salt :j- water from an aquifer and into drains by applying fresh irrigation water .I.I) to the surface) ·inn glass walled testing tank 15.71 feet long, 2.5 feet
1 deep, and 2.5 feet wide, using (1) a 2-part aquifer representing, to 1:40 a scale, a vertical cross section through idealized portions of an irrigated r valley; and (2) a single-part aquifer consisting of fine sand to evaluate -.::t. a derived formula based on the Ghyben-Herzberg principle. TI1e formula is
used to compute the depth to a saline water-fresh water interface. Test r-- results for a 2-part aquifer and also for a single-part aquifer showed that e;,,:, tile drains, placed near the ground surface will not intercept and dis-~ charge fresh irrigation water applied to the surface if all or part of the ~ aquifer contains salt water. The fresh irrigation water replaces the salt j- water as the salt water moves into the drains and a stable fresh water-salt
water interface is eventually formed in the aquifer. Reducing the spacin.g ·· ff of. drains reduces the amount of salt water that will be removed from the · aquifer, Five tests were made using the 2-part aquifer and five tests
_· using the single-part aquifer. The aquifers were charged with salt water having a concentration of 4,000 to 79,770 ppm, which was colored blue for visual identification, Progress of the tests was recorded in both still and timed sequence motion pictures, (!~541') C~, E. J. . ~.1!i!J1'ffM6rtotf' OF Ttm" REMOVAL OF SALT WATER FROM 11\10-PART AND SINGLE-PART AQUIFERS USING TILE DRAINS v-::> Bureau of Reclamation, Denver,1..:> p, ) tab, -49' fig, 1965 DESCRIPTORS-- fine sand/ coarse sand/ sand tank/ hydraulic model/ drainage/ water table/ saline aquifer water/ permeability/ infiltration rate/ patent blue dye/ drain effluent/ Saline water-fresh water interface/ aquifer ·. sweetening/ salt water storage/ salt removal/ drains spacing/ flow path/ flow rate/ dye traces/ hydrostatic pressure/ dynamic forces/ density differential/ Ghyben-Herzberg principle/ timed sequence motion pictures/ Flow net/ time correlation . . . . IDENTIFIERS--:-two-part aquifer/: single_•part'aquifer/ saline ,aquifer water
,li'H2o1s- ..
REMOVAL OF SALT WATER FROM TWO-PART AND SINGLE-PART AQUIFERS USING TILE DRAINS
BYE. J. CARLSON
SYNOPSIS
Tests in a 1:40 scale model of an idealized portion of a typical valley were made to determine the hydraulic action of tile drains placed 8 feet below the ground surface. Tests in two-part and single-part aquifers initially charged with salt water dyed blue demonstrated that the tile drains will not intercept and discharge fresh water added to the soil surface as irrigation water. Only after saline water is flushed from the aquifer and a stable interface is formed between the moving fresh water and the remaining stagnant salt water will fresh water be discharged from the drains. As far as can be determined there were no previous investigations of this type and consequently there were no established principles to offer guidance in designing or testing a model. Construction and testing procedures were therefore modified as necessary before, during, or after accomplishment in an attempt to develop techniques.
THE MODEL
Model Construction
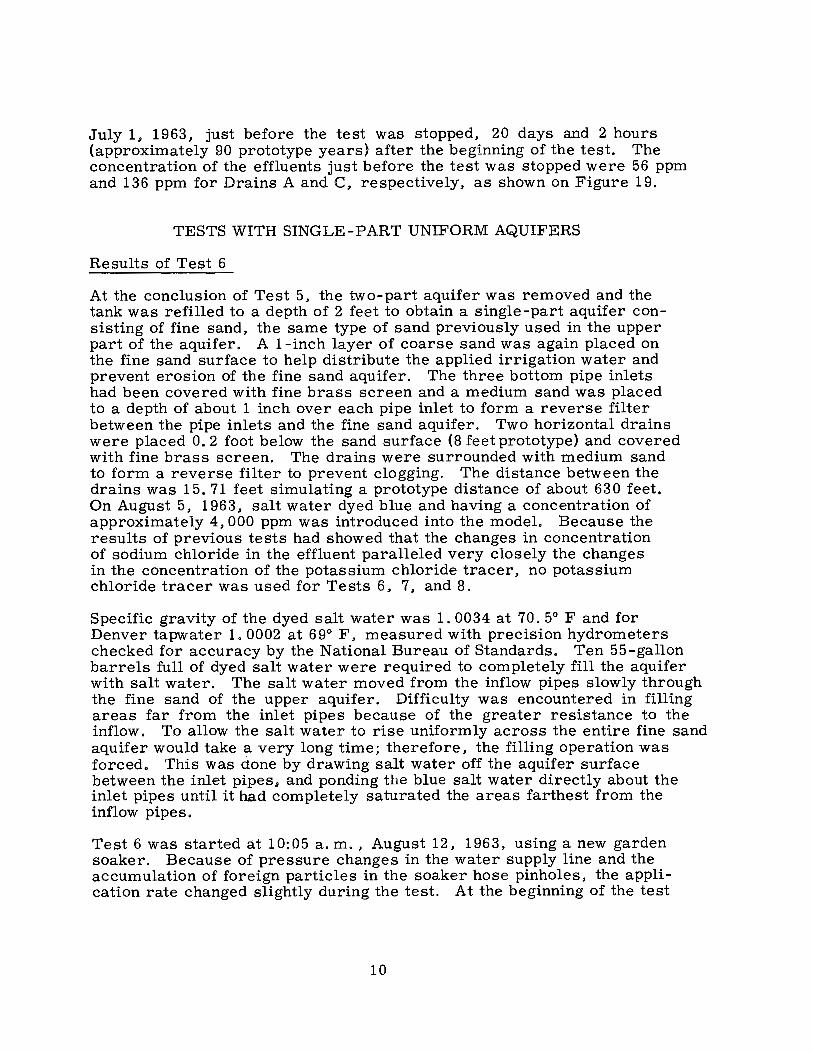
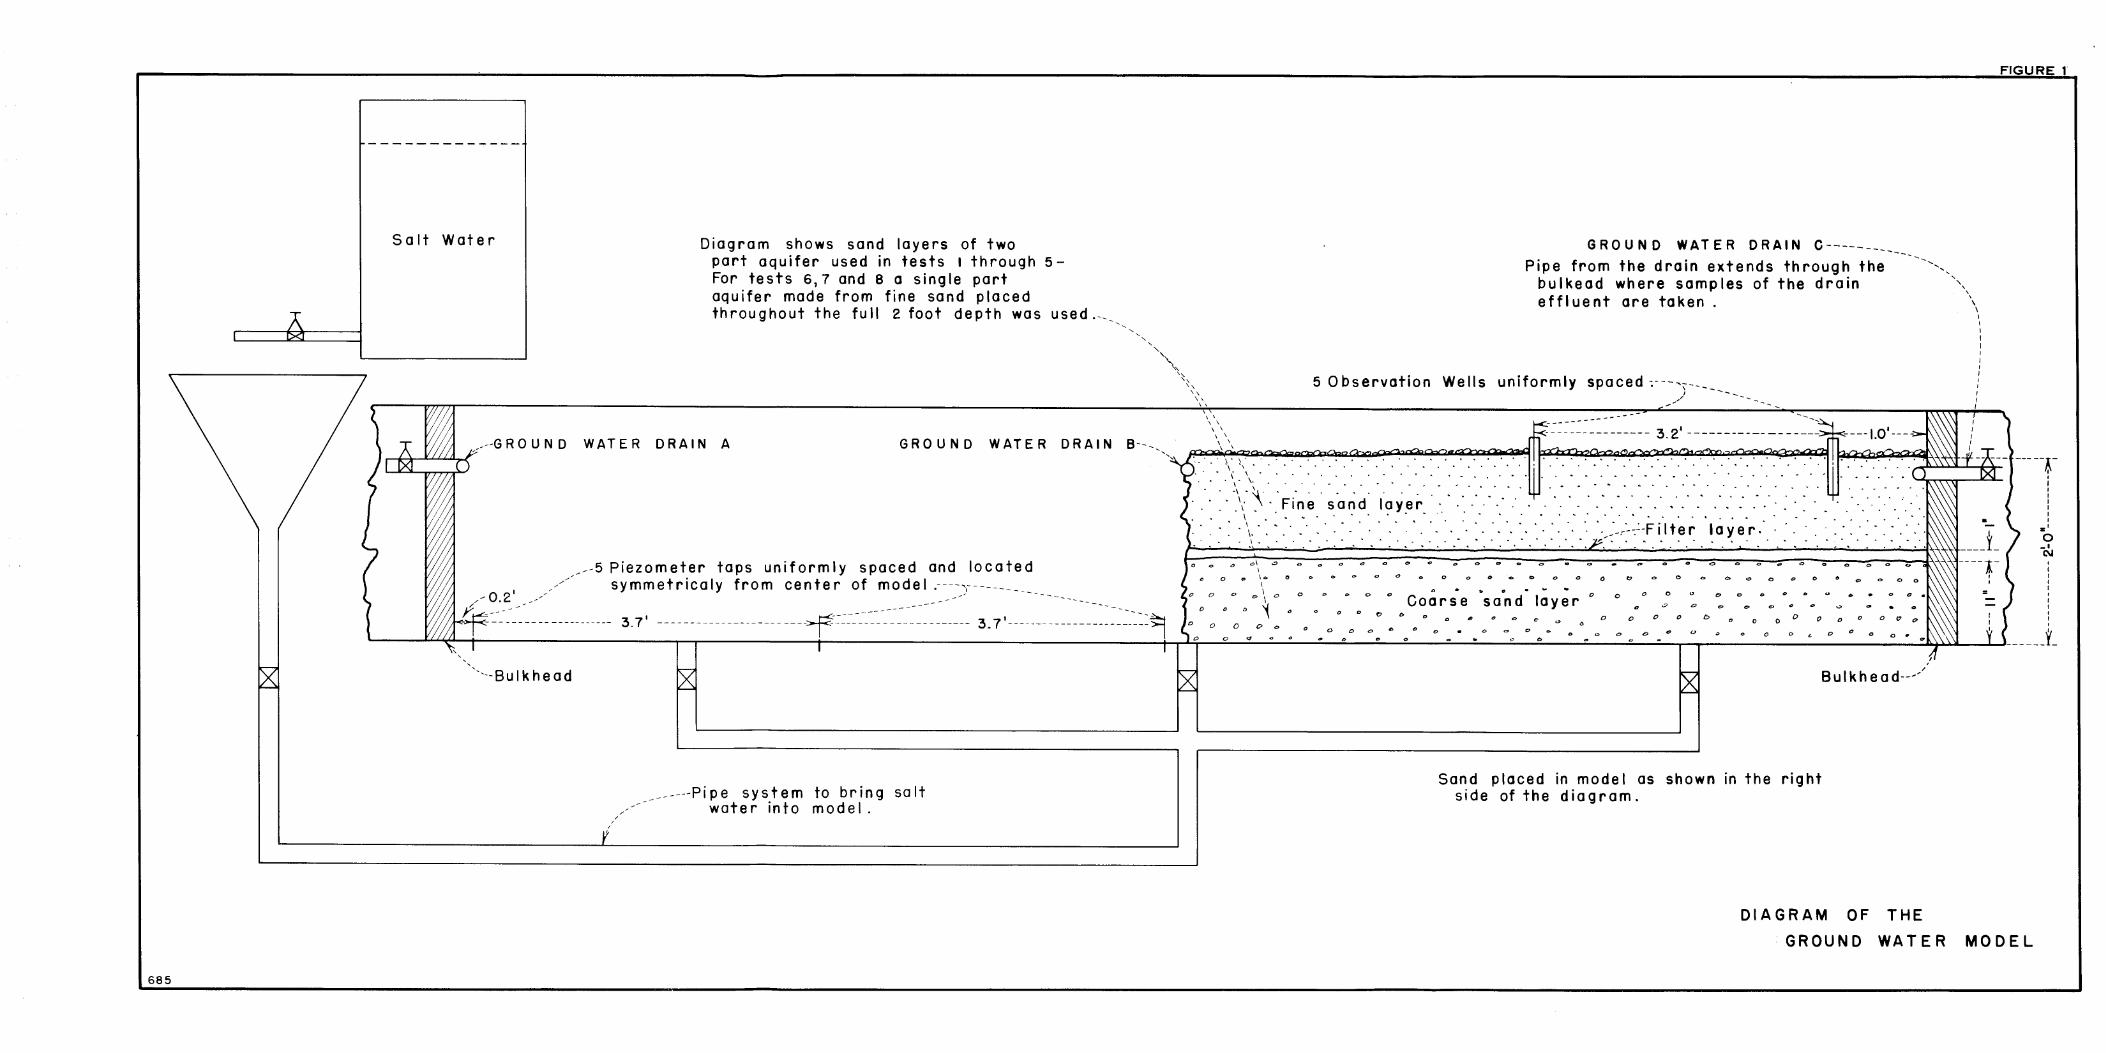
The model was constructed to a linear scale of 1:40 in a glass-walled tank. The primary purpose of the scale was to establish the depth of the model aquifer in terms of a typical aquifer and the size and location of drains. The scale did not apply to the aquifer particle sizes or to the time factors used to interpret the test results in terms of a prototype. These scale factors are discussed later at the time they are used. The tank containing the aquifer was 2. 5 feet wide and deep and had transparent plastic walls on both long sides. Of the entire length, a portion of 15. 71 feet long was isolated and used to represent half the distance between two lines of drains. To scale, this would represent a drain spacing of approximately 1,260 feet. To represent a two-part aquifer. two laboratory prepared sands were selected on the basis that the coarse sand was 50 times as permeable as the finer sand. The coarse sand was placed in the bottom of the tank to a depth of 11 inches, and the fine sand was placed over this to an additional depth of 1 foot, Figure 1. Before placing the upper layer an intermediate size sand was installed in a 1-inch layer to prevent the upper fine sand from working down into the coarse sand below. As placed, these sands represented prototype depths of about 40 feet each in a total aquifer depth of 80 feet.
In an idealized model using homogeneous aquifers it can be assumed that there is no flow across vertical planes located midway between drains. or through the centerline of the drainline; therefore, at the midpoint between lin~s of drains an impermeable bulkhead (a plane of symmetry) can be introduced to reduce the model length at one end and a vertical bulkhead through the drainline could be used to terminate the model at the other end without affecting the flow patterns shownbythe model. A 2-foot-diameter tile drain itself was represented by a perforated copper tube about five-eighths inch in diameter. wrapped with a single layer of fine brass screen to prevent clogging of the holes. A "T" section at midlength of the copper tube was connected to a: short length of pipe which was passed through the bulkhead. The pipe conveyed the drainage flows through the bulkhead to permit sampling, flow measurement,. and disposal. On the aquifer side of the bulkhead, the copper drain tube was placed closely against the bulkhead and a small quantity of the intermediate size sand (larger particles than the aquifer sand) was placed around the pipe and against the bulkhead to effectively locate the exact point of drainage at the face of the bulkhead.
· Prior to placing the aquifers, piezometer taps had been installed on the centerline of the floor of the tank at each end, in the middle, and between the middle and each end, Figure 1. Flexible plastic tubes attached to these taps were connected to five glass manometer tubes mounted vertically on the middle supporting post 01 the tank. These manometers are visible in all the photographs. A scale behind the tubes permitted reading of the pressures on the bottom of the tank. Directly above each of the piezometer taps an observation well was installed consisting of a short, open-end glass tube exte.nding down into the upper aquifer, Figure 1. The position of the water table during a test could be read by a point gage mounted on a traveling carriage and lowered into the tube from above.
A 1-inch layer of coarse sand was placed on top of the upper part of the aquifer to distribute uniformly the water applied to the aquifer during a test, and to prevent displacement of the fine sand. A valved pipe distribution system was also installed along the centerline of the bottom of the flume to introduce salt water into the tank at approximately the one-third points of the model.
Model Operation
Tests 1 through 5 were made using the two-part aquifer described as an idealized representation of an idealized portion of a valley. Tests 6 through 8-3 were made using a single-part ·aquifer made from the fine sand used in the upper member of the two-part aquifer tests.
In order to verify the behavior of the saline water originally present in the lower member after initlation of drainage, the saline water was introduced only into the lower member for the early tests. To facilitate visual observations of the salt water movements in the lower aquifer the
2
salt water was dyed blue. Sodium chloride (NaCl) was the salt added to provide the proper density; potassium chloride (KC 1) was added in the early tests to provide a tracer and for a secondary analysis to check thesodium chloride content of the drain samples. The sodium chloride concentration could be determined accurately by the flame photometer and therefore the potassium chloride tracer was not used in later tests. Thmixture varied from test to test but the salt water contained approximatby weight:
Test 1 to 5
Test 6
Test 7
Test 8-1 8-2 8-3
Approximately 250 ppm (parts per million) patent blue dye
6,200 to 7,050 ppm sodium chloride Approximately 100 ppm potassium chloride
Approximately 250 ppm patent blue dye Approximately 4, 000 ppm sodium chloride No potassium chloride
Approximately 250 ppm patent blue dye Approximately 79,800 ppm sodium chloride No potassium chloride
Approximately 250 ppm patent blue dye Approximately 75,200 ppm sodium chloride No potassium chloride
The salts and dye in granular form were added to water in a 50-gallon drand thoroughly mixed using a pneumatic propeller mixer. The mixture fthe drum was fed into the valved distribution system at the bottom of the testing tank and allowed to slowly rise to displace the air in the lower aqinterstices and the film of moisture covering each sand particle. Severdays were required to raise the level of the blue salt water to near the toof the lower aquifer. To prevent capillary action from pulling salt wateinto the upper aquifer, the inflow of blue salt water was stopped before ireached the separating sand layer used in the two-part aquifer tests. Frwater (Denver tapwater) was then added to the surface of the upper aquifand allowed to permeate the upper sand. The lower salt waterflow was trestarted, the process being repeated until the lower aquifer was full of salt water and the upper aquifer was full of fresh water up to the level ofthe drain, 0. 2 foot below the surface. Figure 2 shows the bottom aquifealmost full of blue salt water and the upper aquifer partially wetted with fresh water.
In the first test, water representing the irrigation water applied to cropwas applied to the surface of the upper aquifer by means of an ordinary garden sprinkling can. Three gallons of Denver tapwater were applied in less than a minute at 1-hour intervals. The water was uniformly distributed over the entire surface of the model; the quantity was sufficient
3

to raise the water table about O. 1 foot (model dimension) above the level of the drain. The water table level was closely controlled and was never allowed to reach the top of the upper sand.
In Tests 2 through 7 a· perforated garden soaker hose was used to apply a uniform and continuous supply of irrigation water at the rate of 3 gallons per hour. The soaker replaced the sprinkling can method of application. The hose was laid on the longitudinal centerline of the model on the coarse sand covering previously described; the water issued from pinholes uniformly spaced along the underside. The coarse sand distributed the water laterally.
For Tests 8-1, 8-2, and 8-3 the garden soaker hose was replaced with an automatically timed toilet flush tank which discharged into two perforated stainless steel troughs spaced to distribute the water uniformly over the aquifer surface. The tank float was positioned so the tank capacity was approximately 3 gallons. With this adjustable application arrangement water was applied at three rates: 3 gallons each 2-hour interval, Test 8-1; 3 gallons each 1-hour interval, Test 8-2; and 3 gallons each 1 /2-hour interval, Test 8-3.
The fine sand aquifer was left bare of the coarse sand cover for about 6 inches across the width of the tank at the drain ends of the model to insure that no free water was ever present in this zone.
Measurements were systematically made of the levels in the observation wells throughout the period of the test. Samples of the drain effluent were taken at scheduled times for chemical and colorimetric analysis to determine the concentration ( salt content) of the drain effluent. The salinity values were determined by flame photometer measurements in the Bureau's Chemical Engineering Laboratory. Measurements of the rate of flow from the drain were made at regular intervals, and photographs on 35-mm color film and 4- by 5-inch black and white'film were taken at frequent intervals. A 16-mm timed-sequence motion picture film was also made; individual frames were taken at 1-, 3-, or 6-minute intervals, day and night throughout the test.
In later tests another drain assembly was placed at the other bulkhead to represent a field problem with a drain spacing of 630 feet; a third drain was placed at the center of the test tank to represent a drain spacing of 315 feet. Modifications w.ere made to the model and testing procedures as testing progressed. Variations are discussed as they occur in each test, but, in general, the procedures were as described.
4

THE INVESTIGATION
Results of Tests 1 and 2
Test 1. --Almost immediately after the first application of 3 gallons of water to the top aquifer, the saline (blue) water began to flow through the fine sand layer toward and out of the drain, Figure 3. After a few hours a wedge of blue water, having a triangular shape with the hypotenuse at an angle of about 45 ° to the horizontal, had formed near the drain in the upper aquifer. After 11 hours the hypotenuse began to show a convex shape. This configuration was maintained until sufficient water had been added to the upper aquifer (50 hours) to make visible the flushing out of the lower aquifer with fresh water, Figure 4. As the testing proceeded, the blue water was confined to a narrow wedge in the lower sand and a very narrow band in the upper sand. After 4 days of operation most of the blue saline water had been flushed out of the lower aquifer except close to and below the drain where the height of the blue water wedge in the lower sand always occupied the full depth of the lower sand. The face of this wedge was concave upwards. Two more days of operation failed to dissipate the wedge.
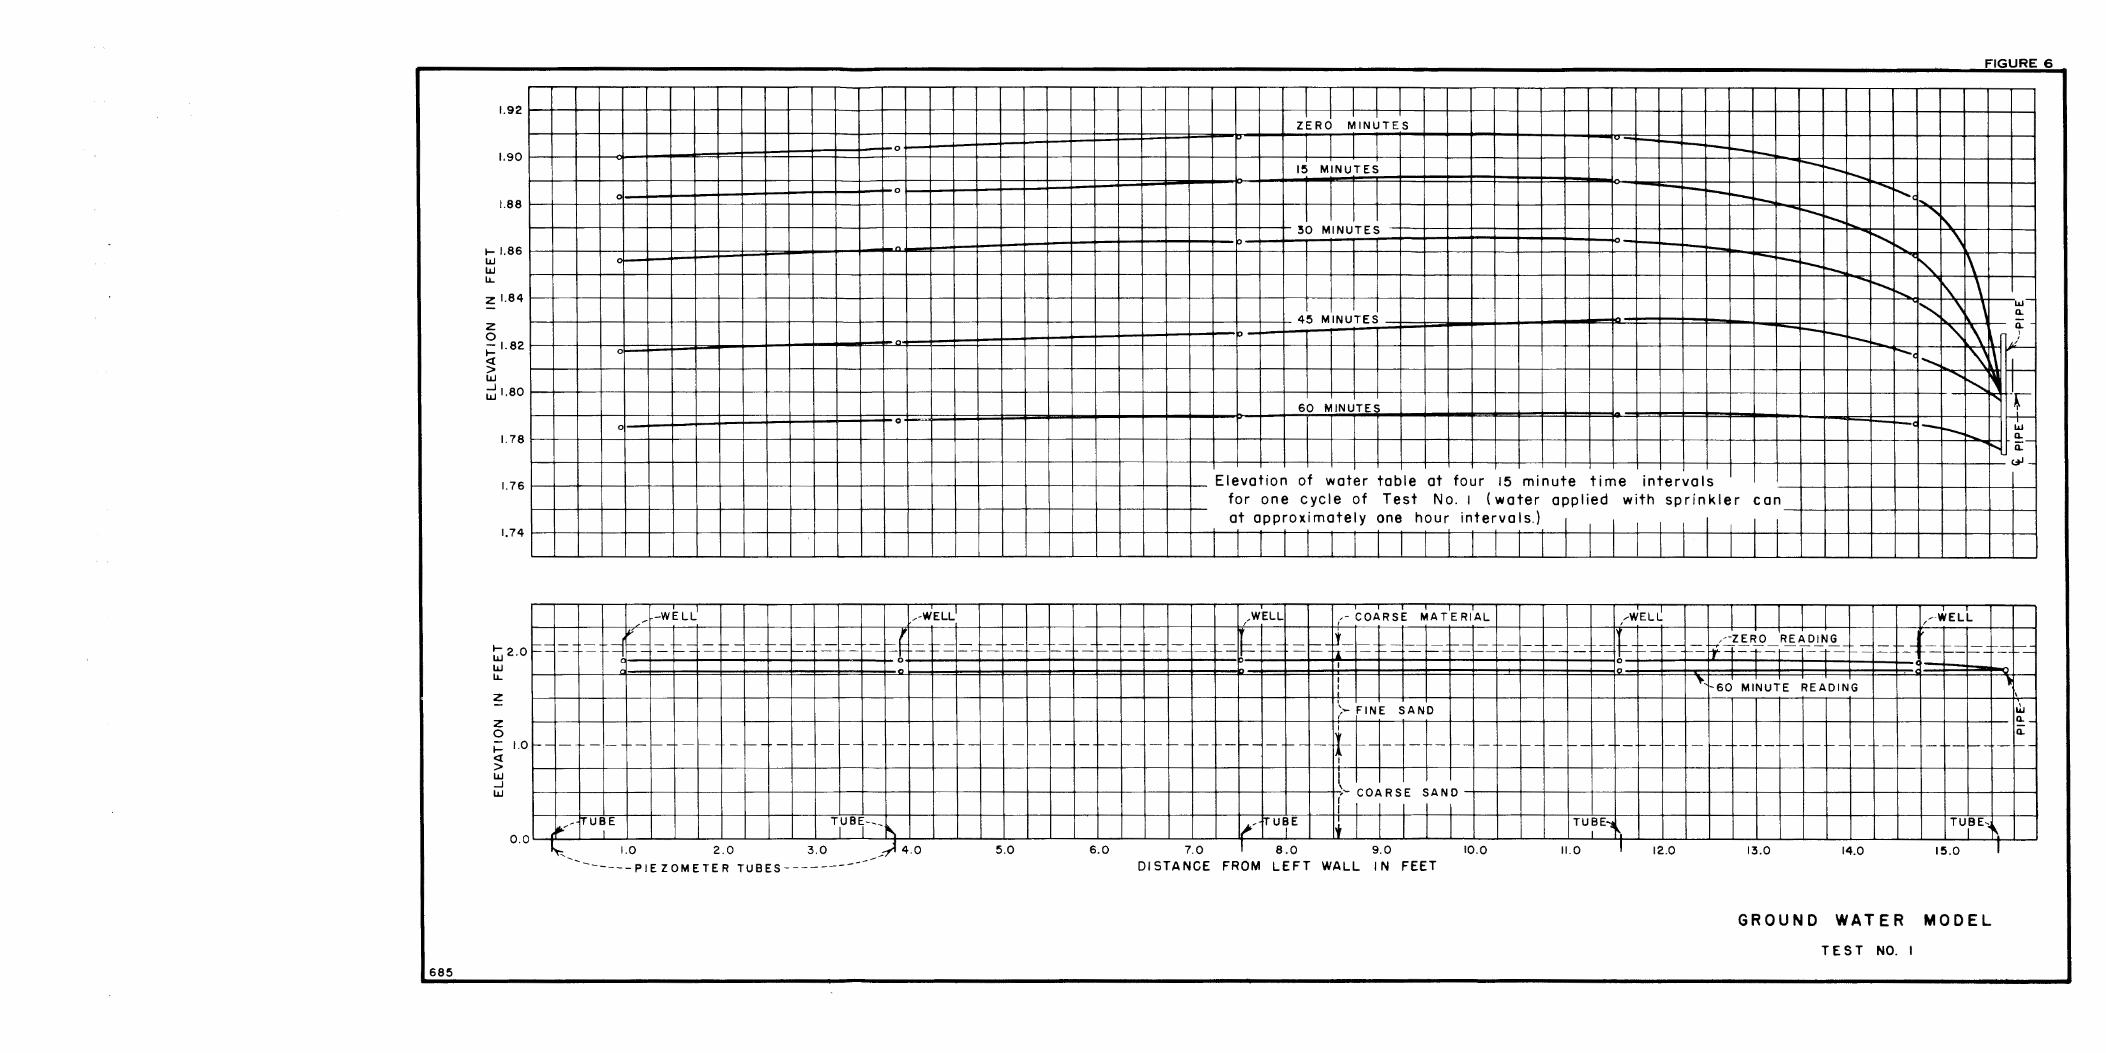
Figure 5 is a record of Test 1 operations and results plotted against the days of the month (which indicate the duration of the testing). The water application curve (which is also the water discharge curve) indicates that water was added during the regular working hours on the 19th, 20th, and 21st of March 1963; no water was added during the 16 off hours. Starting on the afternoon of March 21, water was added day and night; every hour 3 gallons of water were sprinkled over the surface. The drain effluent (sodium chloride) concentration curve rose rapidly for the first 2 days of the testing. declined at a rather rapid rate for about 3 days. then gradually approached a fresh water condition, although a fully fresh condition was not reached after 8 days of testing. The potassium chloride curve indicates a similar action. Figure 6 shows water surface profiles as determined from water surface observations made in the wells during one water cycle application, about 1 hour. The scale sketch at the bottom of the figure shows the stations at which wells were located, the drain location, and the relative height of the water level change in terms of the total depth of aquifers.
The upper curves in the figure show the water surface plotted to an exaggerated vertical scale. The top curve labeled "zero minutes" indicates the water table surface, beneath the surface of the upper aquifer, immediately after application of 3 gallons of water over the upper aquifer surface. The next curve below was taken 15 minutes later, the next 30 minutes later, the next 45 minutes, and the bottom curve 60 minutes later. At this time the cycle was repeated and more measurements were taken.
5

The convex upward curve of the water surface found in all profile measurements, Figure 6, was a reality and was not the result of poor measurement techniques. The rise in water surface indicated between the plane of symmetry bulkhead an<;l the high point in the water surface was about one-eighth inch in the model.
The results of Test 1 indicate that a single drain placed 8 feet below the surface of the upper aquifer will not intercept only fresh water applied to the upper aquifer surface. This is true even when there is a sufficient quantity of fresh water to raise the average water table level above the level of the drain. Instead, the fresh water tends to follow a path of least resistance to the drain by working its way into the lower aquifer, where flow resistance is considerably less, and displacing salt water up through the upper aquifer to the drain. The drain effluent is thereby contaminated with salt water. Analysis of the drain effluent indicates that the salt concentration rose as high as 4,500 ppm, and for a period of over 2 test days (model time) stayed above 1, 500 ppm.
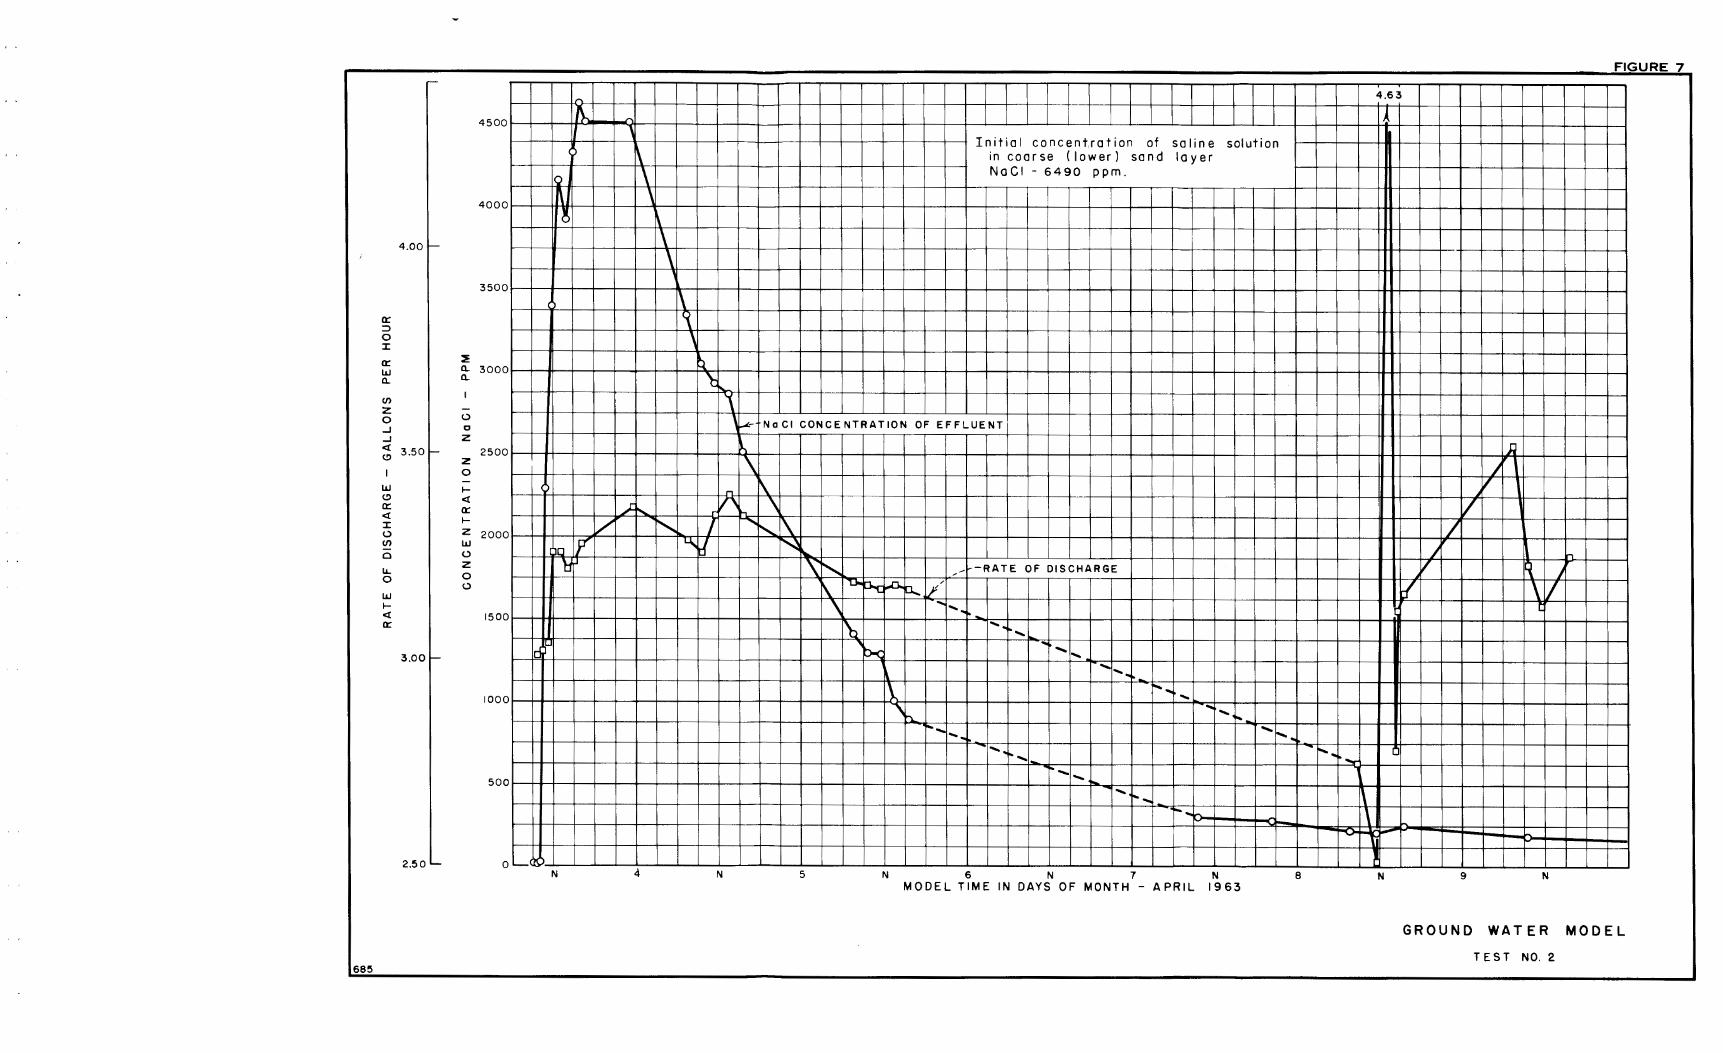
Test 2. --Test 2 was a rerun of Test 1, except that the method of applying irrigation water was changed. In this test, water was applied to the upper aquifer continuously at a uniform rate (2. 93 gallons per hour) through a perforated garden hose laid along the centerline on the top of the model. Figure 7 shows the drain effluent discharge rate in gallons per hour plotted against model time in days. Although the rate of water application should have been constant, the variations indicated are the result of needle valve control clogging, line pressure variation, etc. The large sudden increase at noon on April 8 was caused by opening the needle valve to clear the clogging prior to resetting of the desired quantity.
A study of these two curves indicates that there is, in general, an increase in salt concentration when there is an increase in fresh water discharge, and that the effect is apparent almost immediately.
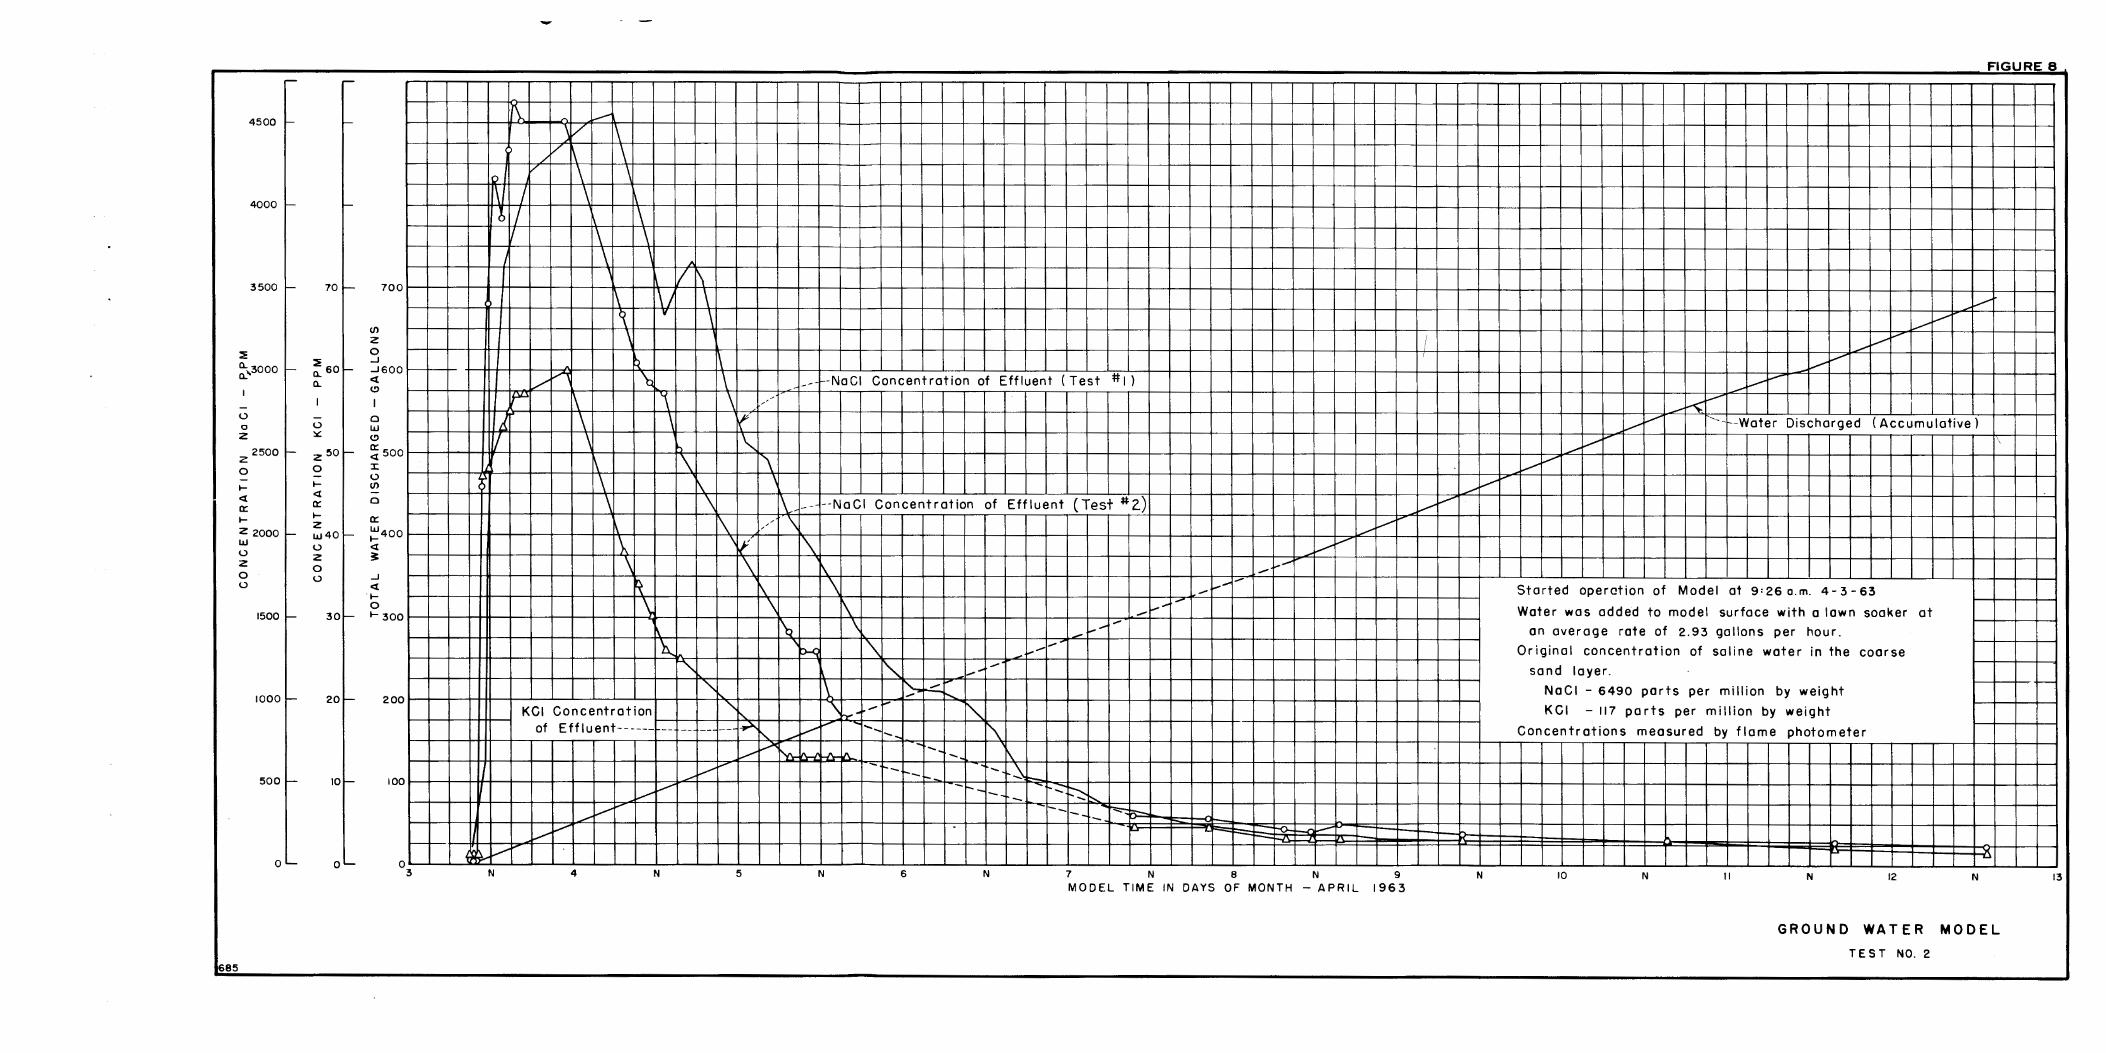
Salt concentration in the drain effluent was practically the same as for Test 1 and the overall test results were practically identical. For a direct comparison of Tests 1 and 2 the salt concentration curve for Test 1 has been replotted in Figure 8. after making time adjustments to compensate for the differences in the method of application of the fresh water. The slight displacement of the curves of Tests 1 and 2 is not significant in drawing general conclusions from these tests.
Near the end of the second test, crystals of potassium permanganate were used to indicate flow direction in various parts of the model.
6
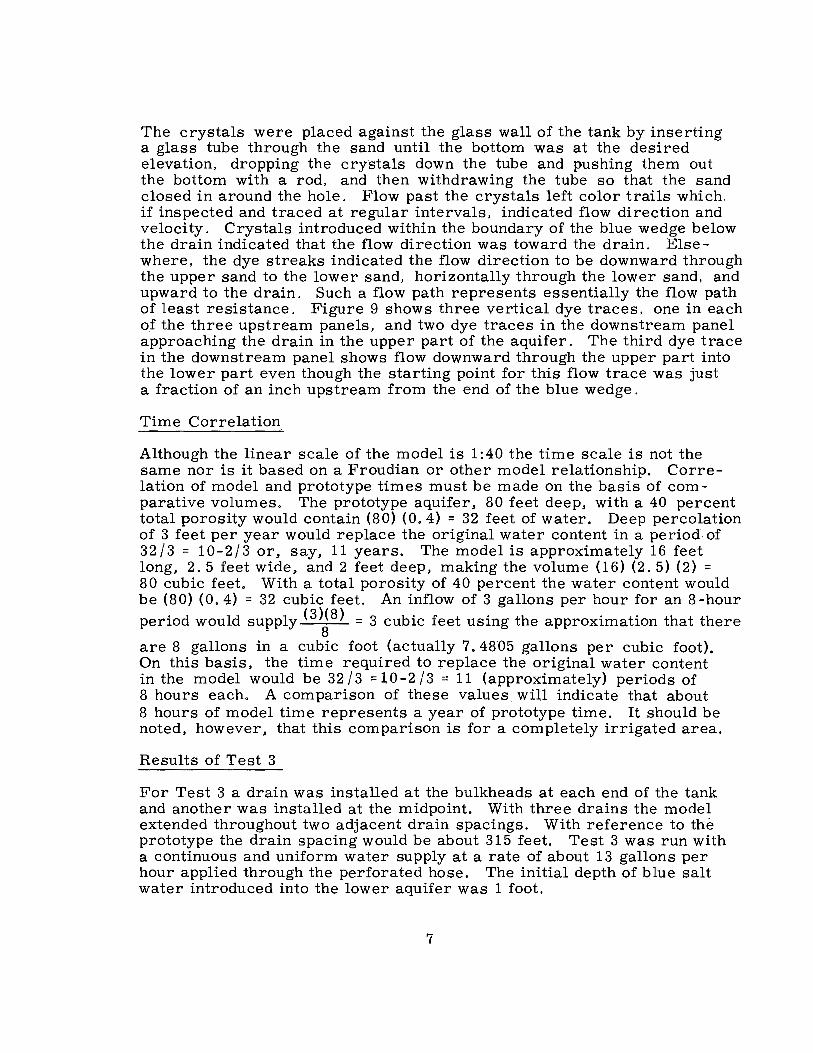
The crystals were placed against the glass wall of the tank by inserting a glass tube through the sand until the bottom was at the desired elevation, dropping the crystals down the tube and pushing them out the bottom with a rod, and then withdrawing the tube so that the sand closed in around the hole. Flow past the crystals left color trails which. if inspected and traced at regular intervals, indicated flow direction and velocity. Crystals introduced within the boundary of the blue wedge below the drain indicated that the flow direction was toward the drain. Elsewhere, the dye streaks indicated the flow direction to be downward through the upper sand to the lower sand, horizontally through the lower sand, and upward to the drain. Such a flow path represents essentially the flow path of least resistance. Figure 9. shows three vertical dye traces, one in each of the three upstream panels, and two dye traces in the downstream panel approaching the drain in the upper part of the aquifer. The third dye trace in the downstream panel shows flow downward through the upper part into the lower part even though the starting point for this flow trace was just a fraction of an inch upstream from the end of the blue wedge.
Time Correlation
Although the linear scale of the model is 1 :40 the time scale is not the same nor is it based on a Froudian or other model relationship. Correlation of model and prototype times must be made on the basis of com -parative volumes. The prototype aquifer, 80 feet deep, with a 40 percent total porosity would contain (80) (0. 4) = 32 feet of water. Deep percolation of 3 feet per year would replace the original water content in a period of 32 /3 = 10-2/3 or, say, 11 years. The model is approximately 16 feet long, 2. 5 feet wide, and 2 feet deep, making the volume (16) (2. 5) (2) =
80 cubic feet. With a total porosity of 40 percent the water content would be (80) (0. 4) = 32 cubic feet. An inflow of 3 gallons per hour for an 8-hour
period would supply <3H8) = 3 cubic feet using the approximation that there - 8
are 8 gallons in a cubic foot (actually 7. 4805 gallons per cubic foot). On this basis, the time required to replace the original water content in the model would be 32 /3 = 10-2 /3 = 11 (approximately) periods of 8 hours each. A comparison of these values. will indicate that about 8 hours of model time represents a year of prototype time. It should be noted, however, that this comparison is for a completely irrigated area.
Results of Test 3
For Test 3 a drain was installed at the bulkheads at each end of the tank and another was installed at the midpoint. With three drains the model extended throughout two adjacent drain spacings. With reference to the prototype the drain spacing would be about 315 feet. Test 3 was run with a continuous and uniform water supply at a rate of about 13 gallons per hour applied through the perforated hose. The initial depth of blue salt water introduced into the lower aquifer was 1 foot.
7
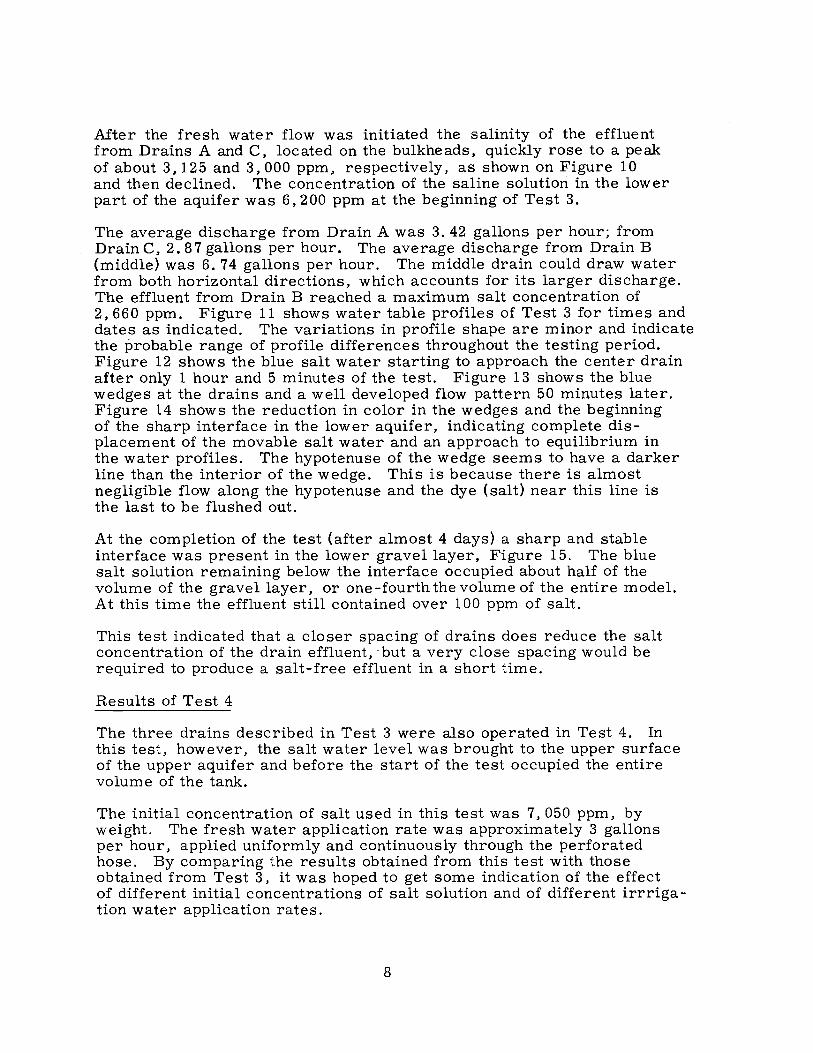
After the fresh water flow was initiated the salinity of the effluent from Drains A and C, located on the bulkheads, quickly rose to a peak of about 3,125 and 3. 000 ppm, respectively. as shown on Figure 10 and then declined. The concentration of the saline solutiori in the lower part of the aquifer was 6,200 ppm at the beginning of Test 3.
The average discharge from Drain A was 3. 42 gallons per hour; from DrainC. 2. 87 gallons per hour. The average discharge from Drain B (middle) was 6. 74 gallons per hour. The middle drain could draw water from both horizontal directions. which accounts for its larger discharge. The effluent from Drain B reached a maximum salt concentration of 2,660 ppm. Figure 11 shows water table profiles of Test 3 for times and dates as indicated. The variations in profile shape are minor and indicate the probable range of profile differences throughout the testing period. Figure 12 shows the blue salt water starting to approach the center drain after only 1 hour and 5 minutes of the test. Figure 13 shows the blue wedges at the drains and a well developed flow pattern 50 minutes later. Figure 14 shows the reduction in color in the wedges and the beginning of the sharp interface in the lower aquifer. indicating complete displacement of the movable salt water and an approach to equilibrium in the water profiles. The hypotenuse of the wedge seems to have a darker line than the interior of the wedge. This is because there is almost negligible flow along the hypotenuse and the dye ( salt) near this line is the last to be flushed out.
At the completion of the test (after almost 4 days) a sharp and stable interface was present in the lower gravel layer. Figure 15. The blue salt solution remaining below the interface occupied about half of the volume of the gravel layer. or one-fourth the volume of the entire model. At this time the effluent still contained over 100 ppm of salt.
This test indicated that a closer spacing of drains does reduce the salt concentration of the drain effluent. ·but a very close spacing would be required to produce a salt-free effluent in a short time.
Results of Test 4
The three drains described in Test 3 were also operated in Test 4. In this test. however. the salt water level was brought to the upper surface of the upper aquifer and before the start of the test occupied the entire volume of the tank.
The initial concentration of salt used in this test was 7. 050 ppm. by weight. The fresh water application rate was approximately 3 gallons per hour. applied uniformly and continuously through the perforated hose. By comparing the results obtained from this test with those obtained from Test 3. it was hoped to get some indication of the effect of different initial concentrations of salt solution and of different irrrigation water application rates.
8
As expected, immediately after the start of Test 4 (on May 10), a salt concentration of 7. 050 ppm appeared in the drain effluent. As the test progressed it was evident that operation was erratic since the right-hand end of the model (as shown in photographs taken) was cleared of blue salt water long before the left side was cleared. The reason for this, determined after the conclusion of the test, was that inadvertently. (1) the hose was delivering more than half pf the water to the right side of the model, and (2) the drains were at slightly different elevations. Figure 16 shows the erratic clearing of the blue salt water from the upper part of the aquifer and the beginning of the formation of a visible flow pattern at the middle "B" drain and right "C" drain, May 12, 1963. By May 20, 1963, a well established pattern for Drain A was apparent, and the C drain pattern was no longer visible. By May 28, 1963, the A and B drain flow patterns were beginning to disappear 1and the position of the salt water in the lower aquifer was sharply defined, Figure 1 7. Testing was then discontinued. The dark lines approaching the drains are. again, lines of least flow and are the last to be flushed clear. Figure 18 shows the salt concentration in the effluent from the three drains plotted against model time. This test disclosed that the drainage pattern is sensitive to slight variations of drain elevations. inflow. and aquifer conditions.
Results of Test 5
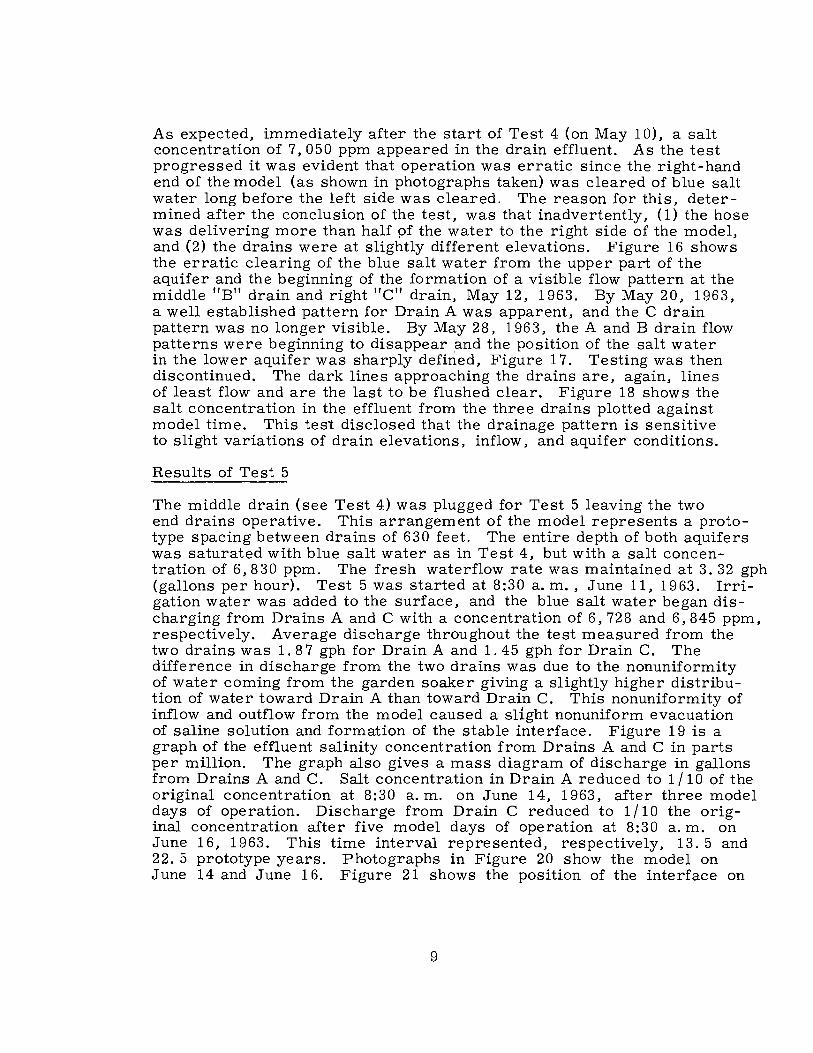
The middle drain (see Test 4) was plugged for Test 5 leaving the two end drains operative. This arrangement of the model represents a prototype spacing between drains of 630 feet. The entire depth of both aquifers was saturated with blue salt water as in Test 4, but with a salt concentration of 6,830 ppm. The fresh waterflow rate was maintained at 3. 32 gph (gallons per hour). Test 5 was started at 8:30 a. m .• June 11, 1963. Irrigation water was added to the surface, and the blue salt water began discharging from Drains A and C with a concentration of 6,728 and 6,845 ppm, respectively. Average discharge throughout the test measured from the two drains was 1. 87 gph for Drain A and 1. 45 gph for Drain C. The difference in discharge from the two drains was due to the nonuniformity of water coming from the garden soaker giving a slightly higher distribution of water toward Drain A than toward Drain C. This nonuniformity of inflow and outflow from the model caused a slight nonuniform evacuation of saline solution and formation of the stable interface. Figure 19 is a graph of the effluent salinity concentration from Drains A and C in parts per million. The graph also gives a mass diagram of discharge in gallons from Drains A and C. Salt concentration in Drain A reduced to 1 / 10 of the original concentration at 8:30 a. m. on June 14, 1963, after three model days of operation. Discharge from Drain C reduced to 1/10 the original concentration after five model days of operation at 8:30 a. m. on June 16, 1963. This time interval represented, respectively, 13. 5 and 22. 5 prototype years. Photographs in Figure 20 show the model on June 14 and June 16. Figure 21 shows the position of the interface on
9
July 1, 1963, just before the test was stopped, 20 days and 2 hours (approximately 90 prototype years) after the beginning of the test. The concentration of the effluents just before the test was stopped were 56 ppm and 136 ppm for Drains A and C, respectively, as shown on Figure 19.
TESTS WITH SINGLE-PART UNIFORM AQUIFERS
Results of Test 6
At the conclusion of Test 5, the two-part aquifer was removed and the tank was refilled to a depth of 2 feet to obtain a single-part aquifer consisting of fine sand, the same type of sand previously used in the upper part of the aquifer. A 1-inch layer of coarse sand was again placed on the fine sand surface to help distribute the applied irrigation water and prevent erosion of the fine sand aquifer. The three bottom pipe inlets had been covered with fine brass screen and a medium sand was placed to a depth of about 1 inch over each pipe inlet to form a reverse filter between the pipe inlets and the fine sand aquifer. Two horizontal drains were placed O. 2 foot below the sand surface (8 feet prototype) and covered with fine brass screen. The drains were surrounded with medium sand to form a reverse filter to prevent clogging. The distance between the drains was 15. 71 feet simulating a prototype distance of about 630 feet. On August 5, 1963, salt water dyed blue and having a concentration of approximately 4,000 ppm was introduced into the model. Because the results of previous tests had showed that the changes in concentration of sodium chloride in the effluent paralleled very closely the changes in the concentration of the potassium chloride tracer, no potassium chloride tracer was used for Tests 6, 7. and 8.
Specific gravity of the dyed salt water was 1. 0034 at 70. 5° F and for Denver tapwater 1. 0002 at 6 9° F, measured with precision hydrometers checked for accuracy by the National Bureau of Standards. Ten 55-gallon barrels full of dyed salt water were required to completely fill the aquifer with salt water. The salt water moved from the inflow pipes slowly through the fine sand of the upper aquifer. Difficulty was encountered in filling areas far from the inlet pipes because of the greater resistance to the inflow. To allow the salt water to rise uniformly across the entire fine sand aquifer would take a very long time; therefore, the filling operation was forced. This was Clone by drawing salt water off the aquifer surface between the inlet pipes, and ponding the blue salt water directly about the inlet pipes until it had completely saturated the areas farthest from the inflow pipes.
Test 6 was started at 10:05 a.m., August 12, 1963, using a new garden soaker. Because of pressure changes in the water supply line and the accumulation of foreign particles in the soaker hose pinholes, the application rate changed slightly during the test. At the beginning of the test
10

a uniform flow rate of approximately 2·. 36 gph was applied to the ·surface. The average discharge during the entire test was L 29 gph from Drain A, left, and 1. 14 gph from Drain C, right, giving a total of 2. 43 gph. Fig-' ure 22 is a graph showing the· dis:charge and concentration of the effluent from Drains A and C. The cohcentra'i:ion in Drain A was reduced from the original concentration (4,000 ppm) ·to approximately 400 ppm (1 /10 of the original concentration) in 7-1 /2 days. Drain Chad 1 /10 of the original concentration after operating 8-1 /2 days,. Figure 22.
Figure 23 shows the interface on August 20 and 21, 1963, when the effluent reached a concentration of 1/ 10 the original salt concentration in Drains A and C, respectively.
Timed sequence photographs were again:taken with a 16-mm motion picture camera. Single frames were exposed at 6-minute intervals and a motion picture of the entire operation of Test 6 (13 days) can by projected normally and viewed on a screen· in a period of approximately 5 minutes.
At the conclusion of Test 6 the interface had moved downward so far that it was below the bottom o~ the sand in the model. The only salt water remaining was contained in the. small wedges under each of Drains A and C, Figure 24. · · ·
Ghyben-Herzberg Relationship
More than 60 years ago, W. Baydon Ghybenl / and A. Herzberg2 / working independently along the European coast, discovered that salt water occurred underground, not at sea level but rather at a depth below sea level of about 40 times the height of the water table above sea level.· Dynamic equilibrium existing between the sea water and the fresh water supplied by precipitation influences the distribution of the saline and fresh water. Analytical studies3/. 4/. 5/ have disclosed the reason for this relationship. The equation derivea to explain the phenomenon is referred.to as the Ghyben-Herzberg relation shown below:
where
hs is the depth to salt water below the sea level (depth to fresh water-saline-water interface)
hf is height of the water table· above· sea level Pt is the specific gravity of the fresh water~- and P s is the specific gravity of sea water
If p = 1.025 f!Jll/cm3 and p = 1.00 g/cm3 then h = 40 ht 8 . f S
1 /Numbers refer to references listed at the end of the report. ·
11
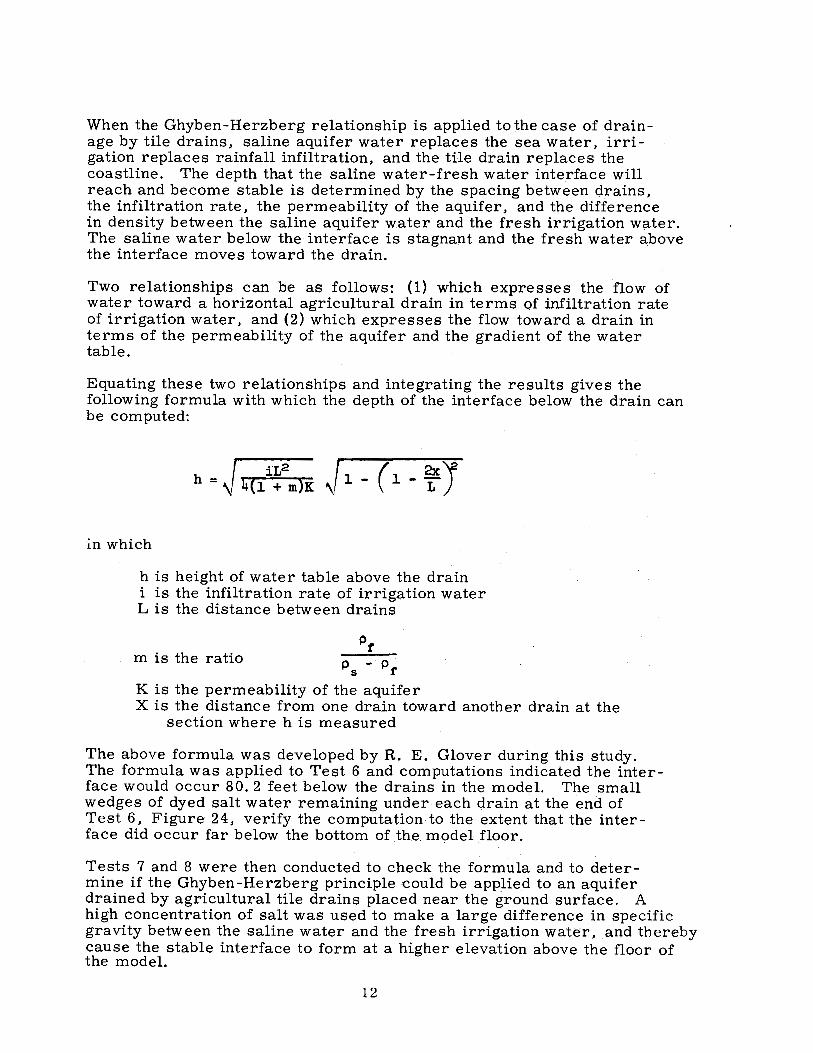
When the Ghyben-Herzberg relationship is applied to the case of drainage by tile drains, saline aquifer water replaces the sea water, irrigation replaces rainfall infiltration, and the tile drain replaces the coastline. The depth that the saline water-fresh water interface will reach and become stable is determined by the spacing between drains, the infiltration rate, the permeability of the aquifer, and the difference in density between the saline aquifer water and the fresh irrigation water. The saline water below the interface is stagnant and the fresh water above the interface moves toward the drain.
Two relationships can be as follows: (1) which expresses the flow of water toward a horizontal agricultural drain in terms of infiltration rate of irrigation water, and (2) which expresses the flow toward a drain in terms of the permeability of the aquifer and the gradient of the water table.
Equating these two relationships and integrating the results gives the following formula with which the depth of the interface below the drain can be computed:
h - / iL2 A. .. / 1 - (1 - 2xL \2 - \ 4(1 + m)K \ )
:in which
h is height of water table above the drain i is the infiltration rate of irrigation water L is the distance between drains
m is the ratio
K is the permeability of the aquifer X is the distance from one drain toward another drain at the
section where h is measured
The above formula was developed by R. E. Glover during this study. The formula was applied to Test 6 and computations indicated the interface would occur 80. 2 feet below the drains in the model. The small wedges of dyed salt water remaining under each drain at the ·end of Test 6, Figure 24, verify the computation to the extent that the interface did occur far below the bottom of the model floor.
Tests 7 and 8 were then conducted to check the formula and to deter-mine if the Ghyben-Herzberg principle ,could be applied to an aquifer drained by agricultural tile drains placed near the ground surface. A high concentration of salt was used to make a large difference in specific gravity between the saline water and the fresh irrigation water, and thereby cause the stable interface to form at a higher elevation above the floor of the model.
12
Results of Test 7
At the conclusion of Test 6 the fine sand single-part aquifer was charged with salt water having an average concentration of 79, 770 ppm. The salt water was again dyed blue with 250 ppm of patent blue dye. No potassium chloride tracer was used in Test 7. To reduce the depth of the saline water-fresh water interface, three drains were used giving a spacing of 7. 86 feet between drains, simulating a drain spacing in the field of 315 feet.
Blue salt water was introduced into the model beginning at 12:20 p. m. on September 4, 1963; and on September 27. 1963, after 13 barrels (55 gallons per barrel) of dyed salt water had been used, the sand aquifer was completely (as seen through the observation panels) filled with saline water. The perforated garden soaker was again used to add fresh water to the sand surface at a uniform rate. The test was started at 10:00 a. m. on October 2. 1963. The average total discharge from the three drains was 2. 76 gph divided as follows: 0. 53 gph from Drain A, 1. 67 gph from Drain B, and 0. 56 gph from Drain C.
The high concentration of salt caused the dyed water to have a light greenishblue color in the sand aquifer. As more fresh water became mixed with the highly concentrated salt water. the solution became darker and more blue in color. When this color washed out of the model, the sand cleared to its natural white color. The photograph in Figure 25A shows the dark blue color as the upper dark area on the black and white photograph and the lighter greenish-blue color in the lower part of the aquifer. Fig-ure 25B shows the dark blue band at the interface, with the lighter greenishblue color below the interface. Sand, washed clear of dyed salt water. may be seen above the interface.
Using the formula described previously. the position of the interface for an equUibrium condition was computed. A plot of this computed interface position is compared with the actual interface position in Figure 26 as the interface appeared on October 8, 1963, after 5. 9 days of model operation, Figure 27, and on October 15, 1963, after 12. 9 days of model operation, Figure 30. The slight displacement of the interface in 7 days of model operation in the interval between the times of the two photographs shows that the interface had reached a stable position. Inasmuch as the computed position of the interface is very close to the actual interface position, the validity of the formula has been demonstrated for a uniform aquifer.
Figure 28 shows the rate of discharge from the three drains measured at intervals throughout Test 7. Figure 29 shows the rate of change of salinity of effluent from Drains A, B, and C.
13
The time required for the effluent to be reduce_d to 1 /10 the original concentration was 5-1 /4 days for Drain A, 4-3 /4 days for Drain B. and 3-1 / 4 days for Drain C. Discharge from the garden soaker was higher between Drains B and C. causing the salt W8:ter to be flushed from that end of the model in a shorter time.
Figure 28 shows that there was some variations in discharge from the drains which was caused by variation in flow from the garden soaker. A pressure-reducing system was used to maintain a low pressure on the garden soaker but some of the fine holes in the plastic tube became partially clogged with foreign particles from the supply line, causing slight variations in discharge along the longitudinal axis of the model and some variation in average discharge with time. However, despite minor difficulties the garden soaker gave generally good results.
Figure 30 shows the position of the interface on October 15, 1963, 3-1 /2 hours before the application of irrigation water was stopped. Following this, no further movement of the interface could be detected except that the curved interface started to flatten as the heavy salt water began to form a level surface. Figure 31 shows the interface on October 18, 1963, 3 days after the application of irrigation water was stopped.
Results of Tests 8-1, 8-2, and 8-3
Test 8 was conducted in three parts (three rates of water application) for the purpose of checking the formula for predicting the position of the interface between salt and fresh water at equilibrium conditions when the time interval between additions of a given amount of w~ter was varied. The single-part aquifer of fine sand was used.
Salt water, dyed blue having an average concentration of 75. 190 ppm sodium chloride. was added to the sand aquifer until it was filled. Twelve barrels of salt water were used to replace the fresh water in the aquifer between October 24, 1963, and November 4. 1963, in the filling operation. The average specific gravity of the salt water. measured with a hydrometer. was 1. 0550 at 60° F compared to 1. 0002 at 60° F for tapwater.
To overcome the difficulties encountered in obtaining uniform discharges from the garden soaker, a flush tank was arranged to s·upply given quantities of water at any desired time interval. The interval between applications of replacement water is very short compared to the time required for the interface to level out when flow is stopped., Figure 31. The ref ore., the intermittent applications of replacement water are equivalent to steady flow. The system consisted of a tank and flushing mechanism, an assembly of plastic pipe and two perforated stainless steel troughs to distribute the water over the model surface. and a solenoid relay activated by an adjustable timer to trip the flushing mechanism.
14
For Test 8-1, 2. 77 gallons of -fresh water were applied to the aquifer surface every 2 hours. The troughs were perforated at 1-foot intervals to distribute the water uniformly over the aquifer surface. The holes were large enough so that they could not become clogged with foreign particles. The flush tank and distribution system had previously been calibrated to discharge equal quantities of water to all areas. -The time interval between applications could be varied to give different application rates. Figure 32 is a photograph of the automatic distributing system.
The interface between the saline water and fresh water formed soon after water was first applied to the surface. Test 8-1. at 8: 30 a. m .•. November 6. 1963. Figure 33 shows the position of the interface on November 8, 1963, on November 12, 1963, on November 14~ 1963 .• and on November 19, 1963.
Samples of effluents from the three .drains were taken at various time intervals and an analysis of their salt content wa:s made using the flame. photometer. A graph of the variation of salt content with time for Te.st 8-1 is shown on Figure 34. The salt concentration of the effluent was reduced to a value of 1 /10 the original salt concentration in the aquifer (75,190 ppm) in 5-5 /6 days for Drain A, 7 days for Drain B, and 5-1 /3 days for Drain-C. The time required for the interface to reach a stable .position_and to reach a concentration of 1/10 the original concentration in the aquifer does not vary appreciably whether a two-part aquifer or a single-part aquifer is used. The time required in either case for the interface to reacha stable position is influenced by the drain spacing and the.water application and/or effluent flow rate. The ratio, density .of the fresh irrigation water divided by tll~ difference in densities between the fresh and saline water. <let.ermines the position of the stable interface between the two liquids. The time to evacuate the required volume of saline water fo form a stable· interface . is influenced by the depth that the stable interface reaches stability. forms below the level of the drains, and the rate of application of fresh water.
Figure 35 shows the equilibrium· position of the interface for Test 8-1 as measured in the model and the comparative interface position as com -puted by the formula based on the Ghyben:-Her2}berg principle. The two lines show good agreement.
In Test 8-1. the irrigation water inflow was added intermittently,. producing transient conditions. whereas the formula for computing the interface assumes a steady state condition of _inflow and outflow. The good comparison between the compute·d and observed position of the interface in the model, Figure 35, shows tbat the stable interface forms at the same depth whether irrigation water is applied intermittently. or whether it is applied continuously. The pressures near the stable interface may vary slightly with time but it is quite obvious that the .variation is so slow for the conditions under which the model was operated that the location of the interface was the same for transient conditions as for steady state conditions.
15

Pressure variations in the ,field, at the depth that an interface would form would be even much slower for transient water applications. (The 79, 770 ppm salt solution does not exist in the field, the 6, 000 ppm in the field · aquifer would give an interface at a greater depth.) However, the position of the interface is very sensitive to the water table height and consequently to the long-time average irrigation application rate.
Variation in the water table elevation with time, between applications of irrigation water, was measured in the model, and a sample of the changing water table surface is shown in Figure 36. This relationship was developed from data obtained in Test 8-1 by making water table measurements at five points between adjacent drains on the ends of the model and at measured time intervals after an application of water was made through the flush tank and stainless steel trough equipment. Figure 3 7 shows the variation of water table surface a:t each observation well plotted against time. Figure 38 is a plot of the variation of discharge from Drains A, B, and C during a 30-minute period following the application of 2. 77 gallons of water. The data of Figures 37 and 38 were used to develop Figure 36.
To verify that the Ghyben-Herzberg principle could be applied to a singlepart aquifer and to show that the interface would move downward with an . increased water application rate, Tests 8'-2 and 8-3 were made as a continuation of Test 8-1. For Test 8-2, the intermittent irrigation appli-cation rate was roughly doubled by increasing the rate to 2. 8 9 gallons per hour. For Test 8-3, the rate was again roughly doubled by.applying 2. 77 gallons of fresh water to the model each one-half hour. Figure 3 9 shows the position of the interfaces that formed at the end of Tests 8-1, 8-2, and 8-3. The interface position was successively lower as the average rate of inflow and head of irrigation water increased in steps.
SALINE WATER DISPLACEMENT
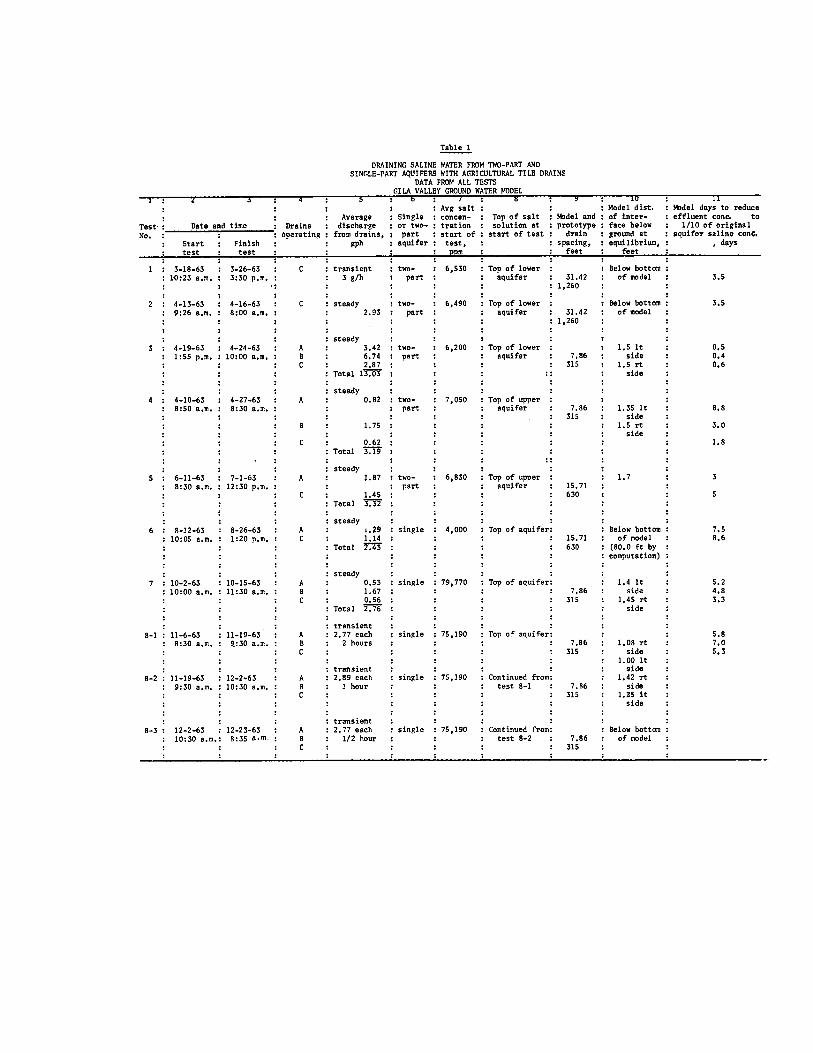
The rate at ~hich the saline water contained in an aquifer is replaced by fresh water is an important factor in the determination of quality of return flows. Table 1, Column 11, shows the model time required for each test to reduce the salinity of the drain effluent to 1 / 10 that originally placed in the aquifer.
This is based on a rigid water application schedule as described in each test and assumes that water is applied over the entire surface and may not represent the prototype conditions in areas where irrigation does not include the area above the entire aquifer.
The salt concentration in the drain effluent at the time one full water replacement volume and fractions of replacement volumes had been added
16

and drained from an aquifer would be significant information in understanding the process of fluslling of saline aquifer water by adding fresh irrigation water. A method of evaluating the dilution of saline water achieved by recharge would be to compute the percentage of saline water in the drain effluent and to plot the percentage of saline water versus the cumulative quantity of water discharged in relation to the total water stored in the aquifer. Figures 40 through 47 show these plots for Tests 1 through 8-1. When the cumulative discharge of the drain effluent equals one on the abcissa, the recharge added is equal in volume to the total water volume originally stored in the aquifer. The concentration of the effluent indicates the extent that salt water was forced ahead of the fresh water and the amount of the latter that moves directly to the drain.
A plot was made for each test relating percent of saline water in the drain effluent with cumulative discharge in units of volume of water stored in the aquifer. There are differences in cumulative discharge from test to test, depending on whether the test included a two-part aquifer (Tests 1 through 5), a single-part aquifer (Tests 6, 7, and 8), whether the saline water was placed to the top of the upper aquifer (Tests 4 to 8), or to the top of the lower aquifer at the beginning of the test (Tests 1, 2, and 3), what the concentration of salt solut1.on in. the aquifer was at the beginning of the test, the number of drains operating, and the rate of water application to the model and discharge from the drains. In Tests 1 and 2 the
permeability ratio of the upper aquifer to the lower aquifer :~ was 51, Figures 40 and 41 show the relationships resulting from Tests 1 and 2 in which the lower aquifer was charged with saline water with concentration of 6,530 and 6,490 ppm, respectively. These, in effect, give the same general curves although they are different in detail. The percent of salt water in the drain effluent reached a maximum for both Tests 1 and 2 of slightly above 70 percent when O. 2 of a model porosity volume had discharged from the drain. When 1. 0 model porosity volume of accumulated discharge had discharged from the drain, the effluent contained only about 10 percent of the original aquifer saline water in both tests. The com -parison is very good even though the water was applied to the model in two different ways, (1) by intermittent application of irrigation water using a 3-gallon sprinkler can giving an average rate which varied from 2. 10 to 3. 54 gph in Test 1, Figure 40, and (2) the irrigation recharge was applied continuously at an average rate of 24 93 gph using a garden soaker hose, Test 2. In this test the peak concretration of salt remained at a level slightly above 70 percent during the time required for 0. 1 to 0. 35 of a model porosity volume to be discharged from the drain. The salt water concentration then dropped rapidly. In Test 1 the peak concentration of salt continued for a shorter period but did not drop as rapidly as in Test 2. The differences between the two curves, Figures 40 and 41, is attributable to the different rates of applying the recharge water. The average recharge rate for Test 2 during the first 3 days of operation was higher than for Test 1 which accounts for the faster removal of salt water in Test 2. The overall average recharge rate for the entire tests was higher for Test 1 than for Test 2.
17

The materials which were used to form the aquifers were placed in the model in a dry condition and in a random manner and therefore it is believed that in all tests the horizontal permeability Ph and the vertical permeability Pv for both aquifers was the same making the ratio
Ph - = 1 p '
V
Test 3 was made in the same two-part aquifer model as were Tests 1 and 2. Salt water with a similar concentration, 6, 200 ppm, was placed to the top of the lower aquifer to start the test. In Test 3 the application rate of irrigation water varied between 12. 76 and 13. 35 gph; three drains, prototype spacing 315 feet, were used. The spacing was 1,260 feet for Tests 1 and 2. For these different conditions in Test 3, the curve of Figure 42 showed that more salt water was forced out of the lower aquifer with less total irrigation water being applied than for Tests 1 and 2. The concentration of salt water in the drain effluents reached a peak of approximately 45 percent of that placed in the lower aquifer at the time 0. 22 of a model porosity volume had been discharged through the three drains, and after 1. O model porosity volume of accumulative discharge had flowed through the model, the concentration of salt in the effluents was about 3. 0 percent.
The rate of removal of salt water from the two-part aquifer :model in Tests 4 and 5 are shown in Figures 43 and 44. The initial conditions for these two tests were very similar, except that in Test 4 three drains were used giving a prototype drain spacing of 315 feet; in Test 5 the prototype drain spacing was 630 feet. In both tests the upper and lower aquifers were filled with salt water to the top of the upper aquifer. At the beginning of each test the drain effluents therefore consisted of approximately 100 percent salt water. In both Tests 4 and 5 the percent of salt water in the drain effluents was reduced to 20 percent by the time 1. 0 model porosity volume had discharged through the drains. However, in Test 5 the saline water concentration did not d~op as rapidly as in Test 4 because of the closer drain spacing in Test 4. For example, at the time that 0. 2 of a model porosity volume had discharged through the drains the Test 5 drain effluents contained 85 percent salt water and the Test 4 effluents contained only 70 percent. At the time that 0. 6 of a model porosity volume had discharged through the drains in Test 5, there was 65 percent salt water in the effluent and in Test 4 only 38 percent. The differences between the curves plotted for Tests 4 and 5, Figures 43 and 44, are attributable to the different drain spacing in the two tests.
Test 6 was conducted using a single-part aquifer made from the same material as the upper aquifer for Tests 1 through 5. Sal,t water with 4, 000 ppm concentration was used to completely fill the aquifer. The average discharge for this test through two drains was 2. 43 gph. At the beginning of the test the drain effluents contained approximately 100 percent salt water and at the time 1. 0 model porosity volume had discharged through the drains, the effluent contained approximately 40 percent of saline water.
18
Figure 45 shows for Test 6 the relationship between percent of saline water in drain effluent and cumulative discharge from drains in terms of total amount of saline water placed in the model (model porosity volume).
Results of Tests 7 and 8-1 are shown on Figures 46 and 47. These two tests were conducted in the same single-part fine sand aquifer, filled with 79, 770 and 75, 190 ppm salt water, respectively, so that the salt water was to the top of the aquifer at the beginning of both tests. Test 7 had an application rate of 2. 76 gph with three drains being used and Test 8-1 had an application rate of 2. 77 gallons each 2 hours, with three drains being used. The percent of salt water in the combined drain effluents at the be ginning of Tests 7 and 8-1 was slightly less than 100 percent, probably because of the small amount of fresh water remaining on the sand particles of the aquifer when, it was charged with salt water. Test 7. Figure 46, showed that the percent of salt water in the drain effluents was about 20 percent at the time 1. 0 model porosity volume of effluent had discharged from the drains. Test 8, Figure 47, showed that at the time 1. 0 model porosity volume of effluent had discharged from the drains the percent of salt water in the effluent was about 10 percent. The difference in salt water content in the effluent for Tests 7 and 8 is attributable to the different fresh water recharge rate-s used in the tests.
Plots relating the percent of salt water in the drain effluent with accumulative discharges from the drains were not made for Tests 8-2 and 8-3 because these tests were a continuation of Test 8-1 and were not started with the aquifer full of salt water.
SUMMARY AND CONCLUSIONS
For the first series of tests a 1:40 scale model of an idealized portion of a valley was constructed and tested to determine the hydraulic action of tile drain(s) placed 8 feet below the ground surface. Two-part aquifer tests were made with an upper aquifer 40 feet thick, composed of fine sand placed over a lower aquifer 40 feet thick, composed of coarse sand and having a permeability about 50 times as great as the fine sand in a testing tank 15. 71 feet long and 2. 5 feet wide and deep. The lower aquifer (and in some tests the upper aquifer also) was charged with salt water, colored blue for visual identification. Fresh irrigation water was applied, continuously in some tests and intermittently in other tests, to the upper aquifer surface and the drain effluent was regularly sampled, analyzed, and used to determine the flow patterns in the model. The model was operated continuously for days, keeping a continuous supply of fresh irrigation water flowing into the upper aquifer and a continuous flow of drainage water from the drain(s). Five tests were made with the model containing a two-part aquifer. The two-part aquifer was then removed and replaced with a single-part aquifer made from the fine sand only.
19

Five single-part aquifer tests were made to check a formula developed to determine the position of the salt water-fresh water interface for an aquifer underlying irrigated lands and drained by horizontal title drains. The formula was based on the Ghyben-Herzbergl I. 2 /, 3 /, 4 /. 5 / principle discovered during studies of aquifers supplied by rainfall near sea coasts.
The statements below are conclusions based on analyses of data from 10 tests made in the Bureau of Reclamation Hydraulics Laboratory. No previous tests of this kind are known and the conclusions must. therefore. be based upon the present test series.
1. A tile drain(s) placed 8 feet below the top surface of a two-member aquifer (top member fine sand 40 feet thick; lower member coarse material 50 times as permeable and 40 feet thick) will not intercept and discharge fresh water if the lower aquifer contains salt water. The drain discharge will have a maximum salt concentration about two-thirds or three-fourths of the salt concentration of the lower part of the aquifer.
2. An interface will develop between the saline water (original aquifer water) and the fresh irrigation replacement water. This interface will reach a stable configuration which is determined by the geometry of the aquifer. the permeabilities of the aquifer materials. the inflow and outflow rates. and the difference in densities between the saline and fresh water. The saline water above the final configuration of the interface will move to the drain and will be replaced by fresh water. The saline water below the final position of the interface remains in semipermanent storage.
3. Decreasing the drain spacing will reduce the upper limit of salt concentration in the drain effluent and will increase the amount of saline water left in storage. but it does not appear that a substantial amount of salt storage could be realized unless the drain spacing is made comparable to the thickness of the upper part of the aquifer. Increasing the number of drains will reduce the time required to flush the aquifer free of the salt water that can be moved to the drains. Drain spacings ranging from protoype equivalents of about 1,260 to 315 feet have been investigated in the model.
4. The reduced quantity of salt water which flows to the drains from the lower aquifer. as a result of decreasing the drain spacing, is associated with a corresponding increase in the amount of salt water remaining in semipermanent storage in the aquifer. The reason that a portion of the original salt water contained in the aquifer remains in storage is that the saline water has a greater density than the fresh water and a balance of forces develops in which the saline water reaches a condition of complete stagnation with regard to motion. From visual estimates the salt
20

remaining in semipermanent storage for a 1, 260-foot drain spacing was very small for the aquifer assumed in the model, for 630 feet was about one-sixth of the original volume, and for 315-foot spacing was about one-fourth of the original volume.
5. The aquifer is flushed substantially free of salt water when the quantity (volume) of fresh water applied to the ground surface (irrigation water) becomes equal to the volume of salt water originally present in the aquifer. Based on model test results and on an estimated time correction factor to account for nonirrigated areas, the time necessary to flush the aquifer used in the tests would be of the order of 25 to 35 years. The time scale is one 24-hour model day represents 3. 0 prototype years.
6. In two-part aquifer tests the path followed, by fresh irrigation water applied on the ground surface, to the tile drain located in the upper aquifer is, in general, vertically downward through the upper aquifer, horizontally through the more permeable lower aquifer to an area beneath and extending out from the drain, then vertically upward to the drain. Only slight mixing of the fresh and salt waters occurs during the flushing process. The fresh water tends to drive the salt water ahead of it to the drain.
Data from Tests 6 through 8 with single-part aquifers, described in this report indicate that:
7. The stable interface, at the end of a test, between the moving fresh water applied as irrigation water and the stagnant salt water, can be determined very closely by using a formula based on the Ghyben-Herzberg principle. This principle explains why ground water flowing to the sea coast, and fed by precipitation, is found to extend about 40 feet below sea level for each 1 foot the ground-water table is above sea level.
8. Along the curved and sloping interface between the fresh and saline waters the greater hydrostati8 pressure of the saline water is counterbalanced by the dynamic forces producing flow along the interface on the fresh water side. A similar balance exists in coastal areas where the seaward-moving ground waters come in contact with the saline ocean water. This balance is a very delicate one and is influenced by the ratio of the densities of the salt and fresh waters, and by the rates at which water is supplied to the area between drains. There is only slight deviation between the observed and computed interface in the vicinity of the drains.
9. The path of the flow of irrigation water to the tile drain is different for every point on the ground surface and is different for
21
a uniform single-part aquifer than for the two-part aquifer. Close to the drain the flow is vertically downward for only a short distance, then along a curved path to the drain. Farther from the drain the flow penetrates deeper before turning toward the drain. Thus, the overall flow pattern can be described by a flow net which converges on the drain. The surface of the saline water body curves upward as it approaches the drain and the saline water below the interface remains stagnant at a very small depth directly below the drain.
Conclusions 10 and 11 are true for both single-part and two-part aquifers tested in the model.
10. The depth to which a stable interface forms below the ground surface between adjacent horizontal tile drains depends on the difference in density between the fresh and salt water and on the height to which the water table is maintained above the drains. The latter value depends on the rate of application of water and on the permeability of the aquifer.
11. After the interface has reached its semistable configuration, slowly acting mechanisms such as molecular diffusion and disturbances due to changing infiltration rates continue the removal of salt at a greatly reduced rate.
22

REFERENCES
1. Badon Ghyben, W., Nata in verband met de voorgenomen put boring nabij Amsterdam (notes on the probable results of the proposed well drilling near Amsterdam) Koninkl Inst Ing Tijdschr, 1888-89, The Hague, pp 8-22, 1889.
2.
3.
4.
Herzberg, Alexander, Die Wosserversorgung einiger Nordseebader (the water supply on parts of the north sea coast) J. Gasbeleucht U. Wasserversorg, Jahrg 44, Munich, 1901.
Glover, R. E., "The Pattern of Fresh-Water Flow on a Coastal Aquifer, " Journal of Geophysical Research, Volume 64, pp 457-459, April 1959.
Cooper, H. H., Jr., "A Hypothesis Concerning the Dynamic Balance of Fresh Water and Salt Water in a Coastal Aquifer, " Journal of Geophysical Research, Volume 64, pp 461-467, April 1959.
5. Todd, David K., "Ground Water Hydrology," John Wiley and Sons, Inc., 195 9, Third printing, August 1963.
m!!..!. DRAINING SALINE WATER FROM TWO-PART AND
SINGLE-PART AQUIFERS WI111 AGRICULTURAL TILE DRAINS DATA FROM ALL TESTS
GILA VALLEY GROUND WATER MODEL
Avg salt Model dist, Model days to reduce Average Single concen- Top of salt Model and of inter- effluent cone. to
Test· Date and time Drains discharge or two- tration solution at prototype face below 1/10 of original No, operatin~ from drains, part start of· start of test drain ground at aquifer saline cone.
Start Finish gph aquifer test, spacing, equilibrium, , days test test l!l!!!! feet feet
3-18-63 3-26-63 C transient two- 6,530 Top of lower Below bottom l·0:23 a,m, 3:30 p,m, 3 g/h part aquifer 31,42 of model 3,5
1,260
2 4-13-63 4-16-63 C steady two- 6,490 Top of lower Below bottom 3,5 9:26 a,m, 8:00 a,m, 2,93 part aquifer 31.42 of model
1,260
steady 3 4-19-63 4-24-63 A 3,42 two- 6,200 Top of lower 1,5 It 0,5
1:55 p,m, 10:00 a.m. B 6.74 part aquifer 7.86 side 0,4 C 2,87 315 1.5 rt 0,6
Total lr.61" .. side
steady 4 I 4-10-63 4-27-63 A 0,82 two- 7,050 Top of upper
8:50 a,m, 8:30 a,m, part aquifer 7.86 l. 35 1 t 8,8 315 side
B 1. 75 1.5 rt 3.0 side
C 0,62 1,8 Total Y.19 .. steady
5 6-11-63 7-1-63 A l,87 two- 6,830 Top of upper l, 7 3 8:30 a,m. 12:30 p.m. part aquifer 15, 71
C 1.45 630 5 Total 3.32
steady 6 8-12-63 8-26-63 A l,29 single 4,000 Top of aquifer: Below bottom 7,5
10:05 a.m. 1:20 p,m, C 1, 14 15, 71 of model 8,6 Total T.il3 630 (80.0 ft by
computation)
steady 7 10-2-63 10-15-63 A 0,53 single 79,770 Top of aquifer: 1,4 It 5.2
10:00 a.m. 11:30 a,m. B 1,67 7,86 side 4.8 C 0,56 315 1.45 rt 3,3
Total i7'i1i side
transient 8-1 11-6-63 11-19-63 A 2, 77 each single 75,190 Top of aquifer: 5.8
8:30 a.m. 9.:30 a.m. B 2 hours 7,86 1.08 rt 7.0 C 315 side 5,3
1.00 lt transient side
8-2 11-19-63 12-2•63 A 2,89 each single 75,190 Continued from: 1.42 rt 9:30 a.m. 10:30 a,m. B 1 hour test 8-1 7,86 side
C 315 1,15 lt side
transient 8-3 12-2-63 12-23-63 A 2. 77 each single 75,190 Continued from: Below bottom
10:30 a.m.: 8:35 iL,m. B 1/2 hour test 8-2 7,86 of model C 315
~
685
Salt Water Diagram shows sand layers of two part aquifer used in tests I through 5-For tests 6, 7 and e a single part aquifer made from fine sand placed throughout the full 2 foot depth was used __ _
' .... ,, ',
'\, ,, ,, \ \
\ \ \ \
\'
,,,,-G R O U N D W AT E R D R A I N A GROUND WATER DRAIN B----,
GROUND WATER DRAIN C----------Pipe from the drain extends through the
bu I kead where samples of the drain effluent are taken.
5 0 b s ervation We II s uniformly spaced :- ---,----.,,.,.,., ---- -
-----___________ 3.21 -----------------~ ·--1.01----
............. ,,
', \
\ I I I I
FIGURE 1
',· ~:.<tNhOwwVb<bo""4'."°''."'"°"'"'.7 : < .• : : . 7 ~ : ~ . I: ' .
. : \ \ < > > > < : . . . . • _. . . . : . . . . . . f ', ~wr-l)\--r----r
.. ·.·\:'\.·Fi.ne silnd layer_ .. . ·.:: .·._- -: ---~_,;,.f;·11~r layer-_·-: .. ·: :-:-:-:-:-.~---L . . . \ . . . . . . . . . . . . . . . / . . . . . . . ' . . ..... f , . . . e , \· . . . . . . . . . . . . . . '
o O .::, c\ o o O c:, ,c I
0<1co oooaco D O ('I \c 0 C> 0 ~ O o 0
0 0 ----.:,--;;, G> 0- 0--0 0 ci 5 Piezometer taps uniformly spaced and located symmetricaly from center of model.----~,-------
0 0 \ D • i. 0 ._ ._
-- o o o C>' 0 o C> C> o c d I o o o o o i:, o
I I I I I I I I .. ,
0 _, t\l
/. "'·_<-_.- _______ ___ 0 • Q i . 0
••
0 {>Coarse son ayer O ., o "' "' "' • 0
~---------------------- 3.7' ------------------------f_:_:_:.:-__________________ 3.7'-----------------------=~ oo o o O "0 ."' • o ~ o oo "'.," o,, o o ~ • ... o o .: <>co• o o ·~ .,o o: "'o., o u boo o o o O <>D < o o o o • • ~ : ______ ½_
'···-8 u I k he ad
/ /
, ,,
-------Pipe system to bring salt water into model.
Sand placed in model as shown in the right side of the diagram.
/ Bu I k head--/
DIAGRAM OF THE
,
GROUND WATER MODEL

Lower coarse sand part of aquifer is almost filled with blue salt water introduced through the bottom of the tank, and upper part of fine sand is partially wetted with fresh water introduced onto upper surface of the aquifer prior to start of Test 1. Center lighter colored areas are still dry. Manometer tubes indicate the level of the salt water.
GROUND-WATER MODEL
l"tj
~-'1 n, -Nl.

Flow pattern of salt water through aquifer to drain is well established only a few hours after the start of Test 1. Manometers indicate the level of the water table in the aquifer.
GROUND-WATER MODEL
l'tj .... (Jq
i= '"i (1)
w

Flow of salt water to the drain continues after 67 hours of operation, Test 1. Lower part of aquifer is being flushed with fresh water.
GROUND-WATER MODEL
l'%j .... ~ '1 Cl)
>f>.

4500 180
4000 160
,.oor "T
FIGURE 5
5401 I I I I I I I I I I I I I I I ___ L ~-+4',I I I I I I I I I I I I I I I I I I I I I I I I I I I I I I I I I I I I I I I I I I I I I I I I I I I i- -
D"
I ... ---- '
' ' ,!
' 480tJ I I t J I I L I /I L1 I I l LI I trl I 1'1 I I I I I I I I I I I I I 1 I I I l L1 I I l I I l Lt! I I I I L_t1 I I I I I :P-1 I I I
f+-1-- }NaCl Concentration of Effluent/'~ I I I I I I I I I I I I I I I I I I I I I I I I I I L I I I ] I I I I I I I Jr' , , 1 1 1 , , , 1 1 1 1 1 1 1 1 ~ 1 b 1 1 1 1 1 1 1 1 1 1 1 1 1 1 1 1 1 1 1 1 1 1 1 1 1- 1 1 1_1_ 1 1 1 1 1 vr
420 _\ I o1 't \V
l,..rr-'
X (/)
Q I ~ Lr ,..
z
:E ~:E ~3 a.. 3000 a.. 120 ....!'360 a.. a.. <t
(!)
\ \ ~ 1,rf
l.rl-' y
0 0 z
2500 z 0 -~ <t a::. ~
Z2000 II.I 0 z 0 0
1500 f--
1000
500
0
685
I I [ I i 0
0 II.I :.:: (!) LJ.
zlOO ~00 " 0 :I:
--'-~,--.-- 'r---- 0 ~ (/)
ct -a:: 0
~ z a:: / II.I 80 11.1240
~
''·1--KCI Concentration of Effluent
0 <t z 3 0 0 J
<t ~ 0
\
l ~
"'t: · .... ~,1---..
~ \ \IA ~ ~
I\. ..,
\ \ cl\. y
\
..,y V
V µ-"'
,.r
~1,
v --1-water Discharged A ccum u I at ive
Started operation of Model 10,23 o.m. 3 - 18 - 63
Water was added to model surface with a hand-sprinkler
at 3 gallons per application with approximately one
hour between applications .
60~ ~180 Original concentration of saline water in the coarse
sand layer in the model.
40
20
0
NaCl - 6530 parts per million by weight
KCI - 116 parts per million by weight
Concentrations measured by flame photometer. 120 l---+--+-+-ll-+--+--+-+--+--+-l--+--+~-+--+--+-l---+--+~r-+--+--+-+--+--+---11--+--+--+-r'+--+--+-l--"ll+--+~-+--+-.,.,.:c::--+--+---r--ir---r---.---,--r-~----r--ir---r---.-----,r--.-----r----.--r--~----r--,,---r---,---,--r---+--+-l--+---t
l-r-1 I I I I I I I~. I'\: ,-.. I I I I I , · 'I [;? -.....~~
I I I I I I I I [ NO WATER r ...,'" "'"' 60 r-- ADDED -~ ,I~ ' ......_
/,t'l.,,A I i t '_r- h.._ ~~. ~_NO WATER I '-"'""-(I"""-,.,. I " --/ I ADDED -~ u "-- ~ . I ,_ A ~
. : : Lr D-...L:" I 7 ~-I I~' __ NO WATER ~ ' ' • ' ,- I ~ I I I I l :r,,,.+-,,,!- .
0 · - : I ~07 ,-~~ tr I I I I I I I I I I I I I I I I I I I I I I I I I I I I I I I I I I I I I I I ITJTmtrt I 01 F IO 11 t I I I
,--,,J
:_"\..l .,.J L I _ I ~
-.~- -N N 20 N 21 N 22 N 23 N
MO DEL TIME IN DAYS OF MONTH - MARCH 1963 24 N 25 N 26 N
GROUND WATER MODEL
TEST NO. I
685
1.92
1.90
1.88
I- 1.86 w w LL
Z 1.84
z 0 j:: 1.82 <I > w ..J w 1.80
1.78
1.76
1.74
1-w 2.0 w LL
z
z 0 ~ 1.0
~ w ..J w
0.0
0
0
/ -WELL1
I'-' >-- -- - -= - I- - - ,__ - ,__ - ~- -- ->-- I--- - ~- I-- - I--- f--
,__ - -- ---- >-- - I- - - I- - - ,___ - - -- -
...-- TUBE TUBE--_ I I I
~ 1.0 2.0 3.0
--------PIEZOMETER TUBES--------
0
0
·-
0
/WELL[
~f - ~- - ,__ - --f---- ~--- I-- -
0
•O
---- - ~--- - r-- -- - --
I'-. 4.0 5.0 6.0
FIGURE 6
I I I I ' ZERO MINUTES
"' -~ -15 MINUTES -- !"-........ i---.. --- - r---..
'C,_
-r--,. r---.... ' r\.
30 MINUTES
' \ 0 "'" - t-- ~ \ r---- ~ .......... I\ \ i,.....
I"- ' ' w-a..
45 MINUTES ii:
"' ~ -- "\ .\ ' r--,._ ;L --c ......... ~ .t= ......
I'.... 60 MINUTES H-----!"-........ w ..._
~-r-,.. a.. (.:ti -
Elevation of water table at four 15 minute time intervo Is for one cycle of Test No. I (water at approximately one hour intervals.)
I I
I I ' l I I
,WELL ,- COARSE MATERIAL I I
L l.t - - -~ - -- - ~ - --- - ~- - ._ - - 1-- - -- --1--- 1-- t- - - - '"1- - I---~- ->---
' ' I I
\- FINE SAND I
I
c-- - >- - - 1--- >-- - r-- --I- ~- -- - -- >- - - -- --I
I
' ~- COARSE SAND
1 I I I I I ;- ITU~E • 70 A 0 QC) 10 f"l
DI STANCE FROM LE FT WALL IN FEET
applied
I I I
- --t---t--
- t--1-- -
TUBE-i I
II r'\
with sprinkler con
I I I
I
,-WELL '
t=--1--- ~ - -~- - 1--
0
,._
- ,__ -- -
', I ,.., ,...
I
/--WELL
,--ZERO 'READING 'f"=f-1--i--1-~~- - ~ - - ~- - f--
1----
I I .. , -60 MINUTE READING
1
-- - - >-- - r-- - - r- - - - -- -
TUBE-,, I I\
-~" '. - . - -
GROUND WATER MODEL
TEST NO. I
I
--f----
\
\ w ~-a.. >- -
r,
4500 I\.. ,,
1
J \ 0 \
4000 ~ ' i \
4.00 \ \
3500
I } \ a:: => ~ 0 I '
I ~ a:: Q. w Q. Q. 3000 A.
\,.. (/)
z
I (.) 0 C ..J z ..J
'\ ~~
<C 3.50 z (!) I
0
2500 ~
\ -w I- 1)
(!) <( a:: a:: <(
I-I z (.) 2000
/°' V' r I,.,
'L ' I " w (/)
0 0 lD y L\ ~ z
u.. 0 0
b"' (.)
w I-<( 1500 a::
3.00 ,r
1000
500
2.50 0 .,,"'I
-N 4 N
685
Initial concent.ration of so line solution in coarse (lower) sand layer NaCl - 6490 ppm.
Na Cl CONCENTRATION OF EFFLUENT
\
' I'.. \ N""'
\ L"'- , _,--RATE OF DISCHARGE
-- r, /
\. ' '- JU,.. /
' ... .... . ,. ...
I~ ..... "', -'e>-< - ..... .... ....
\ .... .. -
\_ ....... ....
'h. ....... ..... r-..., ..... ...... r"".,
- ..... ~ .... ,_ ~--.... - ....
i-..._
r"'",.h -
5 N 6 N 7 N MODEL TIME IN DAYS OF MONTH - APRIL 1963
-i-... .. ,. --\ \
- 1
8
FIGURE 7
4.63
I
N
J,
/ X'
V /
i' n
V ~ j
' \ V !
.... -~ 9 N
GROUND WATER MODEL
TEST NO. 2
4500
4000
3500 70
:!: a..>,,3000 a.
~60 a. a.
I I -
(.) -0 (.)
z ~
2500 Z 50 z 0 0 -- I-I-
~ ~ Q:: Q::
I-I- z Z 2000 w40 w u (.) z z 0 0 (.) (.)
1500 I- 30
1000 20
500 10
0 0
685
700
(/)
z 0 ....I ....1600 ~ (!)
0 w (!)
Q:: ~ 500 :x: 0 (/)
0
Q:: w 1-400 ~
3:
....I ~ lo 1- 300
I 200
100 l
~
l 0 3
' )
,--
! ~
._.
I\ ~ ---,v ) V \ \ /
V \ ' D
I\ I \ \
h I \ I \
\ ' ~
' /~ \ \ j \ ~
..
' ' ~ \
_/ ...--i 'ti \
~ \ \ \ , ,
). \ \ ,F \
I/ ' ~ " \ \ \ \ ' \ \ \
\ i\ ,
\ 'l>"
' \ ~ \.
\ \
h,
" " ... KCI Concentration " "-of Effluent------ -- -- -- ---1-r" '-
~ .......
--~--V -
----v~
V .......
v N 4 N 5
-~-
- --- --NaCl Concentration of Effluent ( Test **1)
\ _ -- --NaCl Concentration of Effluent (Test #2)
\ ---V
\ V -\. ... ---\ i----- --
\ i---- ---IQ \ i--...
-'p..( \
... , -- 1.--
I"-. -_, \ ~
,-~ ......
\ .... ... I"-. ._. ~
..... v- ~ --- '\ -, ' -- ' A A -- \. - ... _
~ ,...._ -,...._ ---r--~"-. -- -- ---- =---- - - ~ -..r -
N 6 N 7 N 8 N 9
MODEL TIME IN DAYS OF MONTH - APRIL 1963
I
----V
v v-
N
FIGURE 8
V
I___...... V
V ...--
----v -V ----
K ---- --->---Water Discharged (Accumulative)
---v~ ' --,,.,,,,.. v-
Started operation of Model at 9,260.m. 4-3-63
Water was added to model surface with a lawn soaker at
on average rote of 2.93 gallons per hour.
Original concentration of saline water in the coarse
sand layer.
NaCl - 6490 ports per million by weight
KCI - 117 parts per million by weight
Concentrations measured by flame photometer
- --10 N II N 12 N
GROUND WATER MODEL
TEST NO. 2
~
13
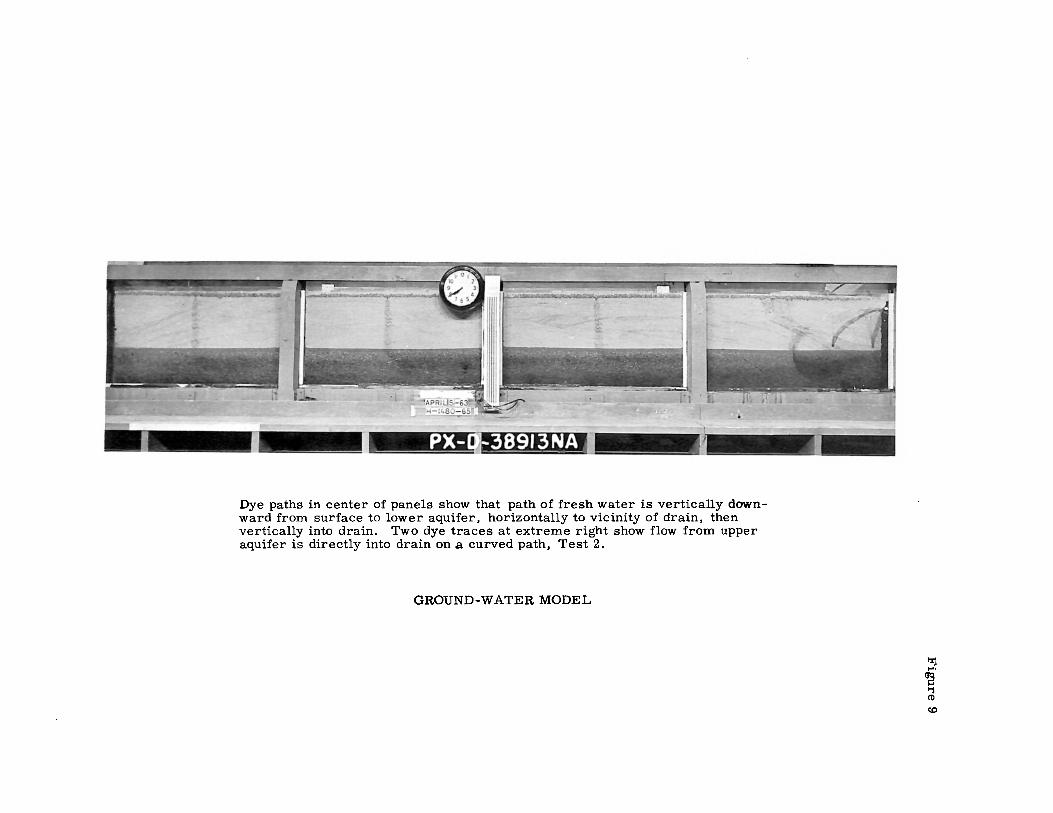
Dye paths in center of panels show that path of fresh water is vertically downward from surface to lower aquifer, horizontally to vicinity of drain, then vertically into drain. Two dye traces at extreme right show flow from upper aquifer is directly into drain on a curved path, Test 2.
GROUND-WATER MODEL
lzj .... ~ '1 Cl)
co
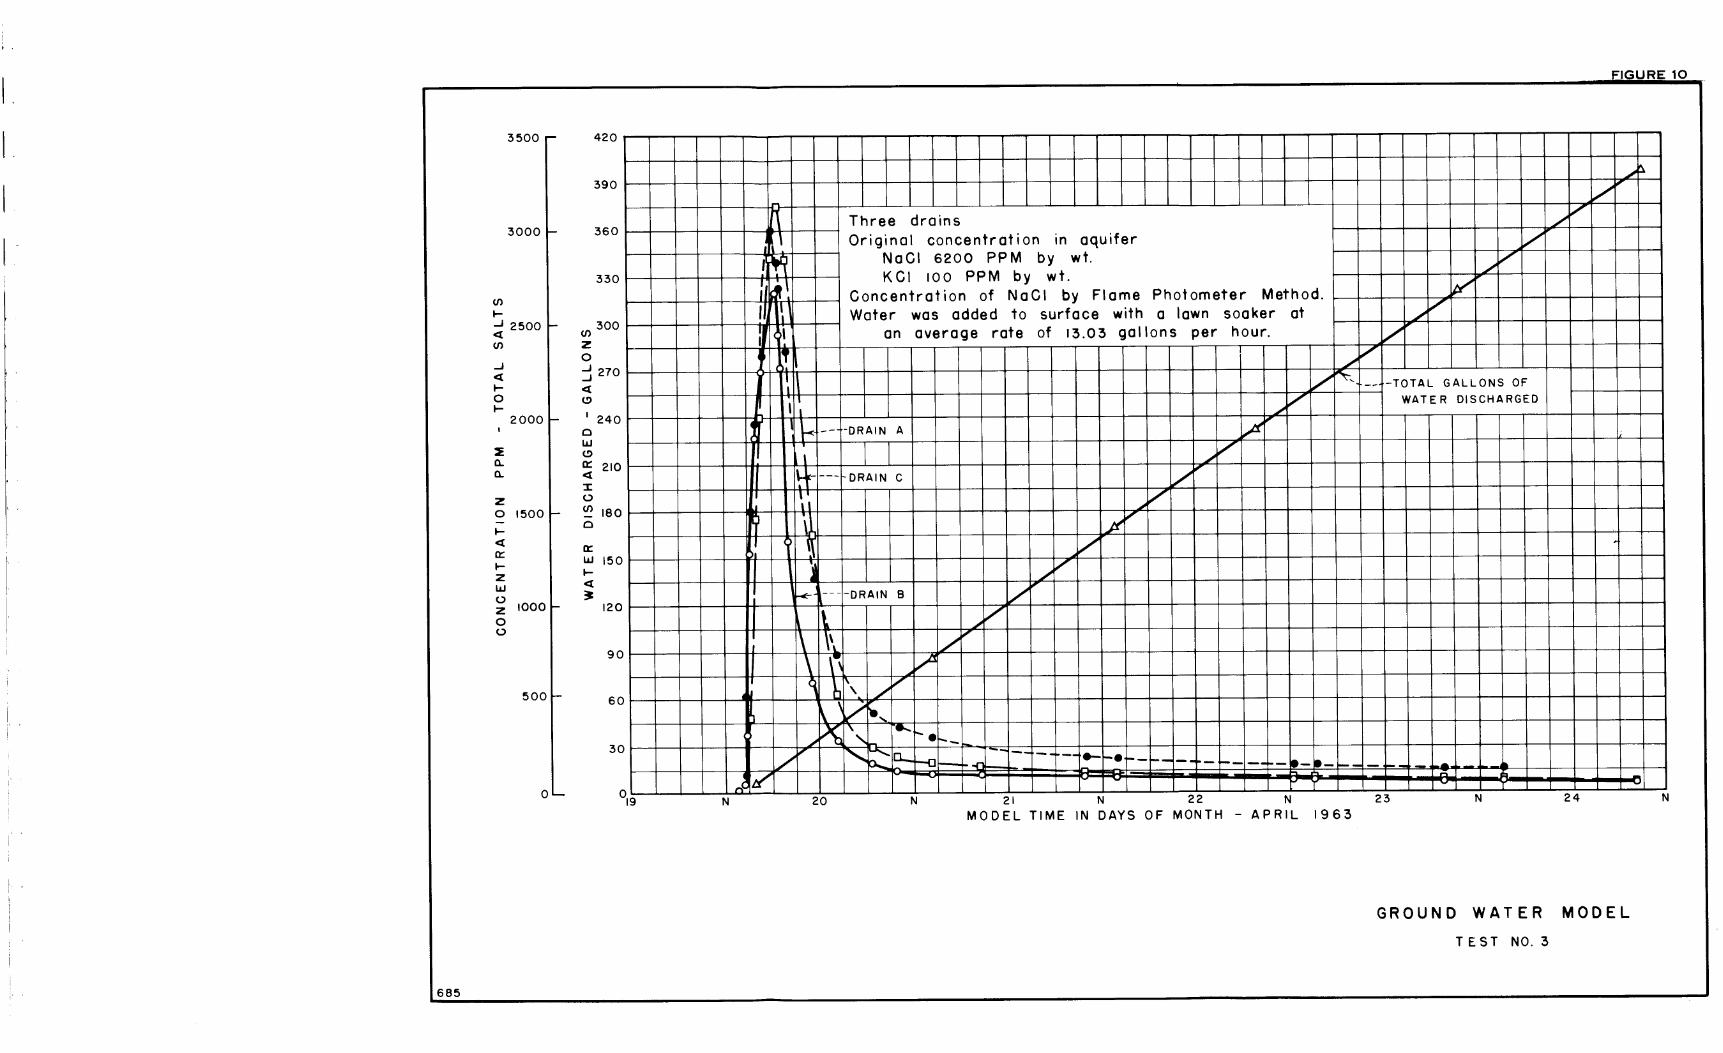
'
I
I 3500 420
390
3000 360
330 I
(/)
I-
~ 2500 (/) 300
(/) z 0
..J ..J 270 <t ..J
I- <t 0 (!) I-
2000 I 240 0
I w
~ (!)
a.. a:: 210 a.. <t :I:
z 1500 ~
(.)
0 ~ 180 - 0 I-<t
IOOJ
a:: a:: w 150 I-z I-
w <t (.) 3 z 120 0 (.)
90
500 60
30
0 019 N
685
FIGURE 10
....... ~ vi" r-, Three drains /
/
\ Original concentration in aquifer v .. I ·~ NaCl 6200 PPM by wt. V
KCI 100 PPM by wt. / I I p/" I Concentration of NaCl by Flame Photometer Method. I 11 Water was added to surface with a lawn soaker at /
V II
I , I an average rate of 13.03 gallons per hour. V ,! \ /
V
I! I\ V !"::-, -TOTAL GALLONS OF --
I ~ V WATER DISCHARGED ,,, I
1-<- -DRAIN A ~ ... --,,, ,
I \..~- --- rDRAIN C l/ .. l
' ..... v ' ) . v-\ ,If
,.V ,
/ V
~ -- - -DRAIN B v"'
~ l ~ V
\\ / ,,
1' ,.~
b\ / V
I
] \ ' ~ ., ..... ~
'\ ...... r---• ' - --/" 1, -...... lo.. a..... -0 r-
,-1' rlf' ,-
20 N
- -- -- --~-- --..... i-e ---i-- -- - -- ·-· --I"'"- -- - -- --- .. - " - - r- -21 N 22 N 23 N 24
MODEL TIME IN DAYS OF MONTH - APRIL 1963
GROUND WATER MODEL
TEST NO. 3
--N

1.960
1.940
e:55 A.M. 4 24 63--- -- --1.920
~ L&.I L&.I 1.90 0 u..
z -z 1.880 0 -~ <l > 1.860 L&.I ...J I.I.I
= -~ f--1; /. ---~ '
ff ,.,.. '
' --
1/2 1/
r 1.840
1.82 0
~,---p I PE
' I.BOO
I ~ 1.0 2.0 3.0
\ct. Drain
685
I
Water table elevations at three different times for Test No. 3.
(Water applied continuoulsy at an approximate rate of
13.03 gallons per hour.)
I I I I I /--1 0:00 A.M. 4-23-63 I 0:05 A.M. 4-23-63----
, , , ,
,
i- ~
~ ~ - -' ~\
~ g 1/"
---2:45 P. M. 4-1 9-63 '~
' f/ \ (/ \ \
-
FIGURE 11
I I I ,---8:55 A.M. 4-24-63 -
' ,
' ,
--
' \ /
\ ' : r
~ ..........;
" \
\ '
' ' ' ------2:45 P. M. 4-1 9-63
~
' ~ ,\ ,-
"'"~Location of wells for measuring ~ -;;::>·------p1 PE I
,,--"-- / water table.--------
I~
, /
' , - ' I
(' I t I I I I I 4.0 5.0 6.0 7.0 8.0 9.0 10.0 I 1.0
DISTANCE FROM LEFT WALL IN FEET
' ' '
' I 12.0
~
,
Pl PE-</
I I I ;\,,, 13.0 14.0 15.0 ~ ."
J Ct. Drain.,,
GROUND WATER MODEL
TE ST NO. 3
16, 0

One hour and five minutes after the start of Test 3, the blue salt water could be seen approaching the three drains, located at each end and the middle of model.
GROUND-WATER MODEL
lzj .... ~ 'i (1)
..... N

One hour and fifty-five minutes after start of Test 3, a well-developed flow pattern toward the drains is evident. Clearing of the lower aquifer has begun and a curved interface is evident.
GROUND-WATER MODEL
1-rj ..... ~ ""l (1)
.... c,;)

After only about 24 model hours of operation, Test 3, a large quantity of the salt water in the lower aquifer has been displaced and discharged through the drains. The characteristic sharp line of demarcation between fresh and salt water areas is evident.
GROUND-WATER MODEL
~
~-'i (I)
I-' ,i,.
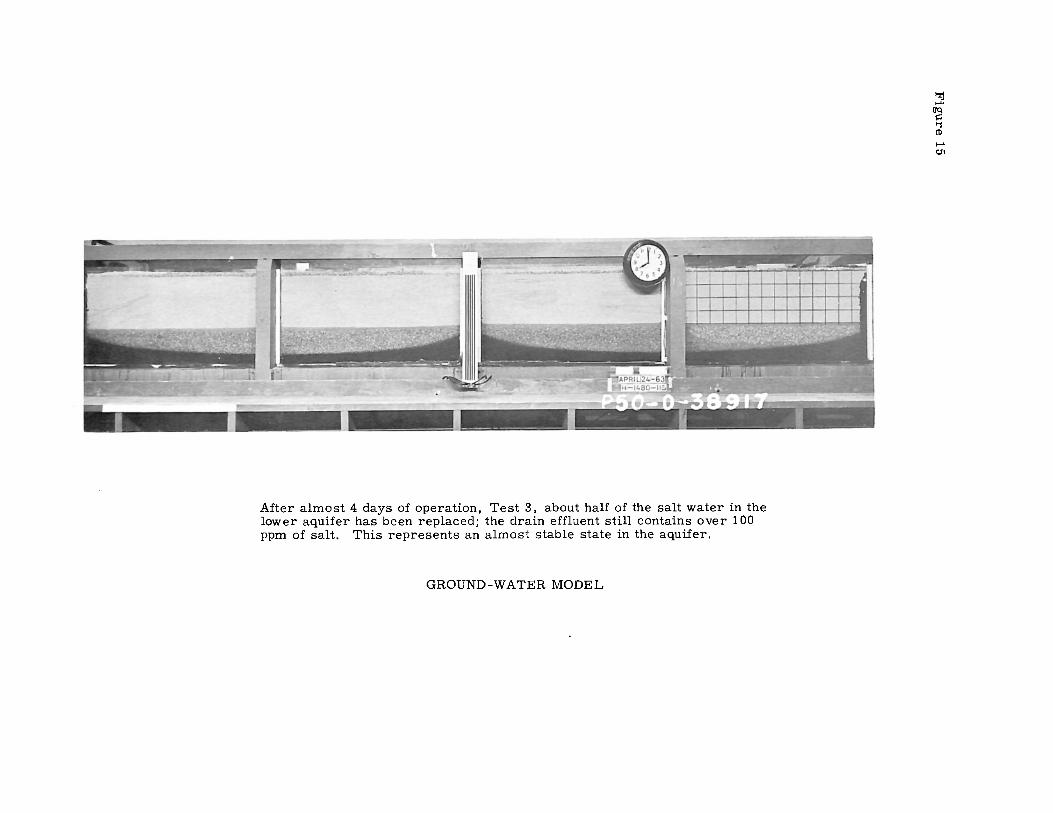
After almost 4 days of operation, Test 3, about half of the salt water in the lower aquifer has been replaced; the drain effluent still contains over 100 ppm of salt. This represents an almost stable state in the aquifer.
GROUND-WATER MODEL
tzj .... ~ '1 (I)
,..... tJ1

Test 4. Blue salt water which occupied entire volume of model at start of test is being cleared from the upper part of the aquifer, particularly in right-hand area. Flow patterns indicating path of salt water to drains is evident.
GROUND-WATER MODEL
rtj .... ~ "'l (1)
..... ~

End of Test 4. Permanent storage of salt water in lower part of the aquifer is indicated. Storage pattern in lower part is not symmetrical about centerline of model because water was inadvertently applied more rapidly to righthand side (in photograph).
GROUND-WATER MODEL
tzj ,.... ~ "'l CD ,_. -.1

I
I tl,.., 7000
' ~' ~
'~
6000 l\ 1
I'\
. ) ' :::!: a.. a.. 5000
I
q ....., ~ \
t \ ~'"' ...,. \ '\
f\.
-u o._ \ ' 0 z h.. \ ~ u. O 4000
...... t--\ ....
tl t----... - ---j..-0. 1-..\ z 0 'I',. ~r-o.
r-- --I-<(
a:: I- 3000 z w u z 0
'r--,._ I\ .... ___
1-C:}
J
'Q \
\ \ I\ \
\ \ u
2000 DRAIN C \ \
q ~ \ " "'-
\ LJ
~
1000
.... '"'-\
b_ . ""r---....
" n..__ -; .......
0 0 N 11 N 12 N 13
Concentration of NaCl in drain effluents determined by flame photometer .
Original concentration in aquifer Nae I 7050 ppm.
KCI 100 ppm.
DRAIN A
~
- -- r
.:., ~ -
........ p.._,_ ----.
I'-... ----.
' u. I'-....
I'--.. h r-.. t----...
r---- i----......,, DRAIN B r-.. IA...
~" ,.;~ -A---- ----~ A -- ... - A IA
A ~ - - ~ - - ,. - ;=: l"'I'
N 14 N 15 N 16 N 17 N
MODEL TIME IN DAYS OF MONTH - MAY 1963
-r---r---- --
18 N
FIGURE 18
r--- --~ -----i----19 N 20
GROUND WATER MODEL
TEST NO. 4
-N
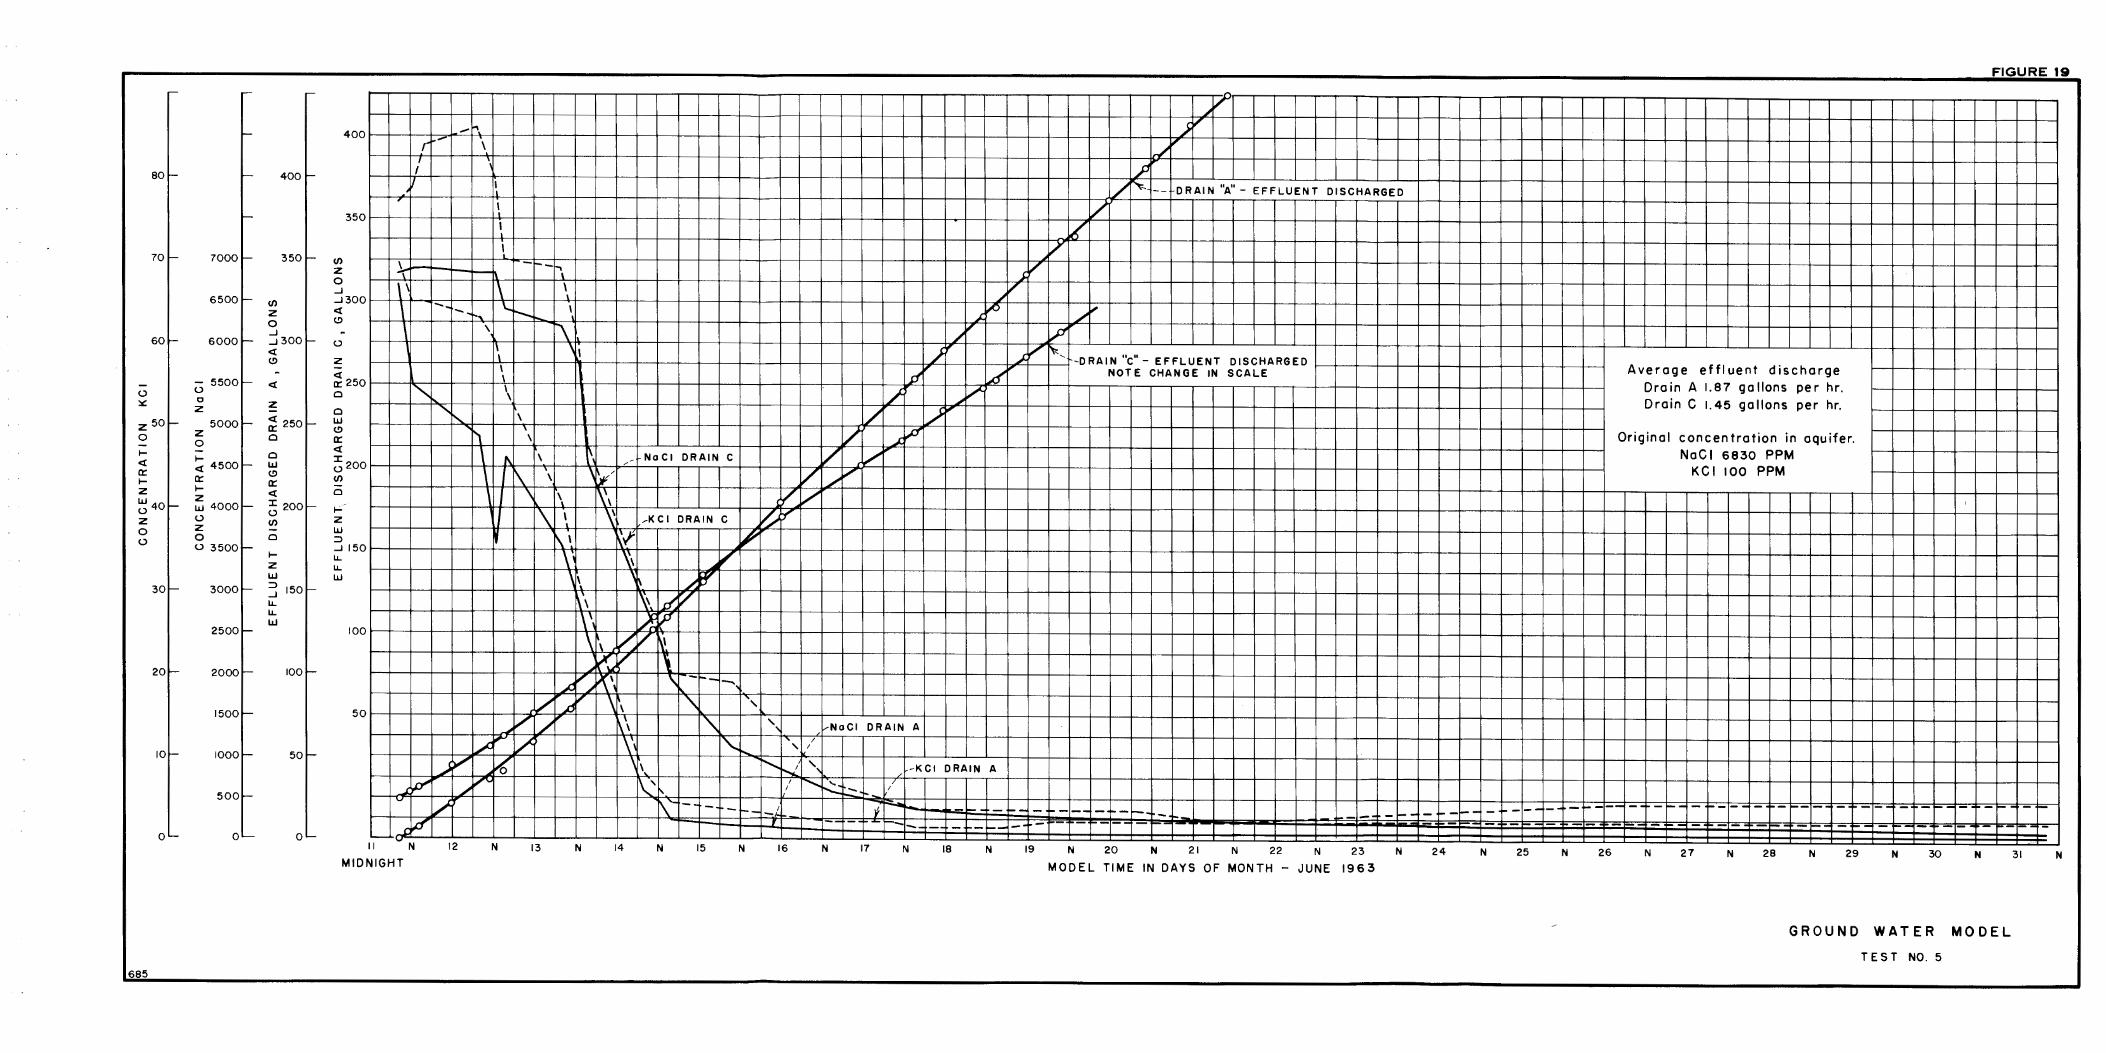
80 400
70I- 7001 350
6500 Cl)
z 0 ...J
60I- 6ooot- ...J300
"' C!)
0 5500 "' 0 :llC C z z z 50 5000 <I: 250
z a:: 0 0 - 0 I- - 0
"' ~ 4500 w a:: C!) I- 0:: a:: z I-
"' W 40 z
::i:: 200 0 w 4000 0
z 0 Cl)
0 z -0 0 Cl
O 3500 I-z w
30t- 3ooot- ::> 150 ...J LL LL w
2500
20L 20001-- 100
1500
IOL 1000 50
500
OL 0 0
685
400
350
(/)
z 0 ...J ...J300
"' C!)
0
z
"' a:: 250 Cl
Cl w C!)
a::
"' ::i:: 0200 Cl)
Cl
i-,;:-z w ::> ...J 150 LL LL w
100
50
FIGURE 19
-~v
-~ ~ r - \ 1...1'
j'~
, ' ~r-
,' I I/~ DRAIN 11A
11 EFFLUENT DISCHARGED
; I I / • I ~
~ / I /
I ~
~~~~~ -,--~ j, 1' \ ./V'
-. - \.. I ..,i:1,/Q /'rt' ·r-, r- ' \ \ i\ ~., .P
1
'I / ~v ~, -DRAIN "c" - EFFLUENT DISCHARGED l-+--+-+-----lf-----+--+--+---t-t----r--t---t-11 Average effluent discharge
\ JI" ~., NOTE CHANGE IN SCALE Drain A 1.87 gallons per hr.
""- \ / .,V Drain C 1.45 gallons per hr.
'I'. ' ./ / /., Original concentration in aquifer.
I'\ \ ~',,p NaC I 6830 PPM 1 I\ \ I\ / NaCl DRAIN C L V KCI 100 PPM
\ I\ \ 'i:ir/ V _......v , 1 \ \ ~, !vv
\ \ ~ ~KCI DRAIN C /_,,'if' \ I ~-/ ,
\' \\ .. v-'\ \. ..... ~ ,\ \ di' \' [A.P
I\ ,,.--:V \~ ~~' \
i, XI \ -,.._-. ~ ~-,, " '
/ A'" \ '\ ·,
,..V /., \\ '\ ', i--NoCI DRAIN A
1.,-C.,.. I/ \ 1 I"-... '' / ')II"' /
1\ r---.., ... -' ' -KCI DRAIN A ~ ,....0 ' ,_ /
.JI. I '- /
~ ,..r \', I ......... r,.__ I -- -- r---- r-- • --- --- -- -~p ,, '- . - - ... -
--,-~ - ~ - ~ -v,. I\ - . - ,- - - / ,; - - - - ~ . - - - ~. - ... - - - - . - - . - - - - ~ - - ~ - ~ - - - - -r -- -.-----..__,, -· -I""'" r- - ---
.L~ ·- ..,. ,----.., II N 12 N 13 N 14 N 15 N 16 N 17 N 18 N 19 N 20 N 21 N 22 N 23 N 24 N 25 N 26 N 27 N 28 N 29 30
MIDNIGHT MODEL TIME IN DAYS OF MONTH - JUNE 1963 N N 31 N
GROUND WATER MODEL
TEST NO. 5
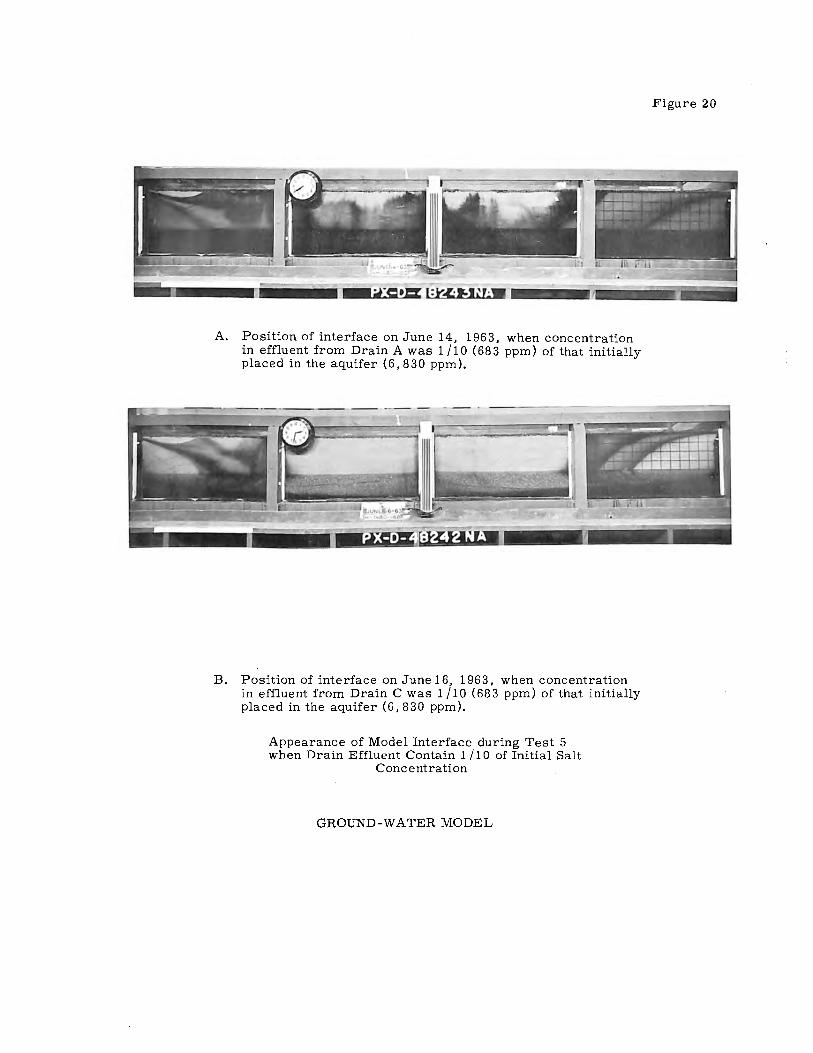
A. Position of interface on June 14, 1963, when concentration in effluent from Drain A was 1 /10 (683 ppm) of that initially placed in the aquifer (6,830 ppm) .
B. Position of interface on June 16, 1963, when concentration in effluent from Drain C was 1 / 10 ( 6 8 3 ppm) of that initially placed in the aquifer (6,830 ppm).
Appearance of Model Interface during Test 5 when Drain Effluent Contain 1 /10 of Initial Salt
Concentration
GROUND-WATER MODEL
Figure 20
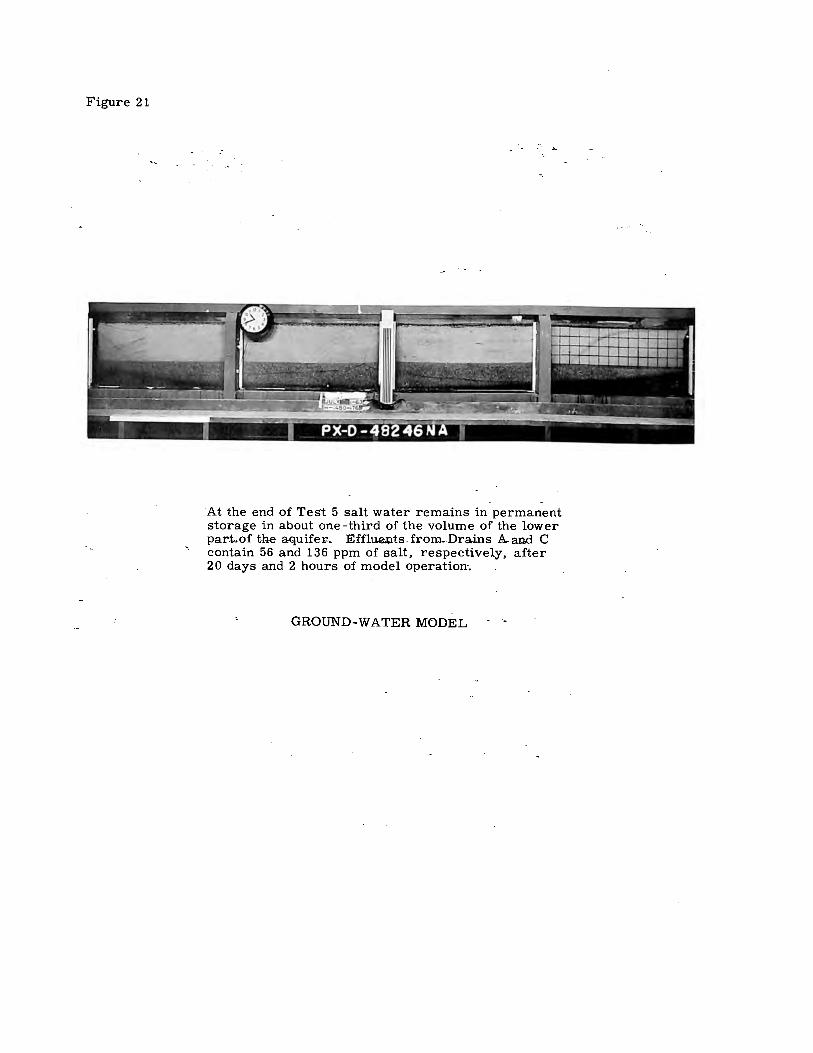
Figure 21
"At the end of Test 5 salt water remains in permanent storage in about one-third of the volume of the lower part.of the aquife:ti. Efflu.e.rJ.ts ... from.Drains A.and C contain 56 and 136 ppm of salt, respectively, after 20 days and 2 hours of model operation·.
GROUND-WATER MODEL

4500
4000
3500I-
~ 3000 a.. a..
I
-u 0
Z 2500
IJ... 0
z 0 -I-<t 2000 er I-z w u z 0 u 1500
1000~
500
0
685
400
350
~
(/)
z 0 J
J 300 <( (!) -u
z <t 250 er 0
w (!)
er <t 200 I u (/) -0
w > -I- 150 <t J :)
~ :)
u
100
50
0
400
350
(I) 300 z 0 J J <t (!)
<t 250
z <t er 0
I
W 200 (!)
er <t I u (/)
o 150
w > 1-<t J :)
~ 100 :)
u
50
0
\
1
\
--- - \· _,_ a
l
' " \ '~ \' \\
\ I\ I\ ',
\ \ \ '\
\ V"
\ \
'
,
I
,/·
,.,u ·"'
1..4'' r _,,, !f' /
,.A A1
(~ ,0 ........
,.,-_...,;>
~ 12 N 13 N 14
.
··- ----
In iti a I concentration of saline solution
in full depth of single part aquifer
NaCl - 4,ooo ppm.
Water added to surface continuously at
aver age rate of 2.43 go I. per. hr.
DISCHARGE - DRAIN A- ' '
.
i.......~ -l,...C ... ,).v.,
., / ,_
v.,... -,,,JJ ... -
i..,-/
\ ....... -
,.,.t. _ .. \ _, .... , j.'•/'
\ .. .,,," / J. , ... .._ / / .,,._ /
_,, \ \ /
.,,,, /
,,,.
'\ ., .... rol-
,)J .. r"-. ,A -
\ .... ,
-v" -~ -;
\ ..........
' ..,.., ---~
...... ~ "'
... ' ,ct" / '
J.v' " ............ ~ ..__ _,---- ·CONCENTRATION - DRAIN C , -> h --r-- Lf' .. " r--., .,,,,
' -- .._ n" ..... r--
,,IJ r---.. " _ .... ......... I'.. /> i""'-,.. ......... " ' ..t" ........
.......... .. ,
........ I"'-.... " CONCENTRATION - DRAIN -- f.,,.... i-....__
...._ r--A- --- - ------
N 15 N 16 N 17 N 18 N 19 N 20 N 21
MODEL TIME IN DAYS OF MONTH - AUGUST 1963
FIGURE 22
/' ".,
.. ....... ,.,-.,,.'
V er -' v.,.. ---
.... r_....,,-
/ 1/ ....
" ....... - / .,,, ,,,,
~
V /
'-"'
.......... /
_J'(' IC1' .,..-( .... -
,c ,
,,,; /
K .... ,,
DISCHARGE - DRAIN C
- --,.._ ~
N 22 N 23 N 24 N 25
GROUND WATER MODEL
TE ST NO. 6
N 26
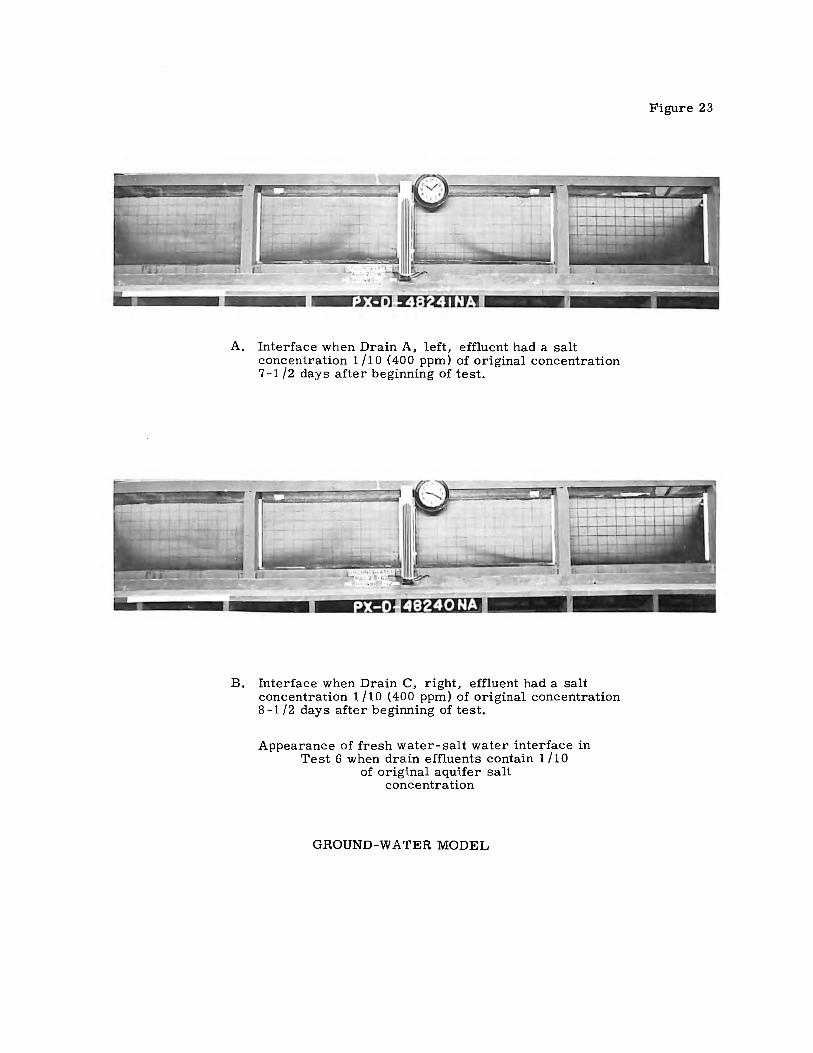
A. Interface when Drain A, left, effluent had a salt concentration 1 /10 (400 ppm) of original concentration 7-1 /2 days after beginning of test.
B. Interface when Drain C, right, effluent had a salt concentration 1 /10 (400 ppm) of original concentration 8 -1 /2 days after beginning of test.
Appearance of fresh water-salt water interface in Test 6 when drain effluents contain 1/10
of original aquifer salt concentration
GROUND-WATER MODEL
Figure 23

Figure 24
Only small wedges of salt water in the lower corners beneath the drains remain in the aquifer of Test 6 on August 2 6, 196 3, after 13 days (58-1 /2 prototype years) of model operation.
GROUND-WATER MODEL

A. The high concentration of salt (approximately 79,770 ppm) caused the blue dye to have a light bluish-green color (lower part of aquifer) at the beginning of Test 7. As fresh water mixed with the highly concentrated salt water the solution became dark blue,
B. The dark-blue band (interface) separates the fresh water above and the saline water below after 7 days of operation of Test 7. Original concentration of salt was approximately 79,770 ppm.
Test 7 at the beginning and after 7 days operation
GROUND-WATER MODEL
Figure 25
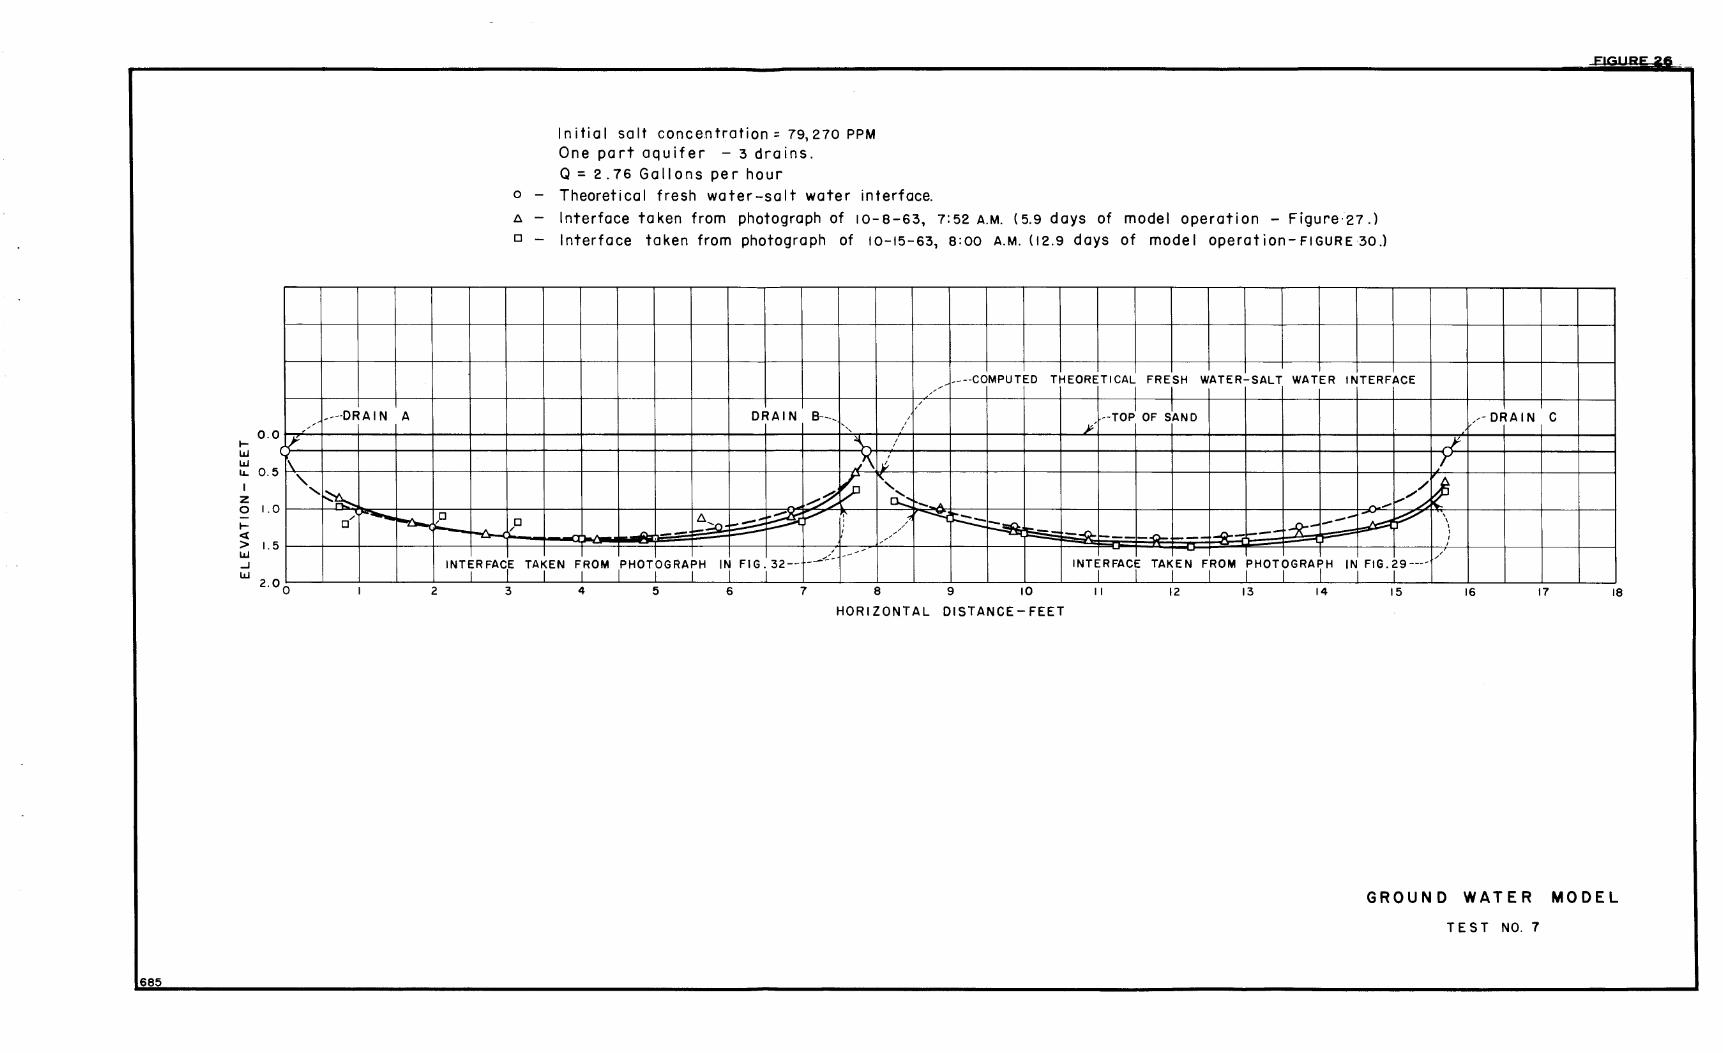
68-5-
1-w w
0.0
IL. 0. 5 I z 0 1.0
I-<(
> I. 5 w _J
w
-, ,
,r ' \
'\.
'
2.00
----DRAIN A
~ 0/
,.._.__ - ,o ----2
A
-
Initial salt concentration= 79,270 PPM
One part aquifer - 3 drains. Q = 2. 76 Gallons per hour
o - Theoretical fresh water-salt water interface.
Ll - Interface taken from photograph of 10-8-63, 7:52 A.M. (5.9 days of model operation - Figure-21 .) 0 - Interface taken from photograph of 10-15-63, a:oo A.M. (12.9 days of model operation-FIGURE 30.)
/-----COMPUTED THEORETICAL FRESH WATER-SALT WATER INTERFACE
, , I I I
/
--TOPI OF S~ND DRAIN 8---, I
' ' ;r,' ' ' I
\__ /
J>\. I
~
~ ", / ~ ci::- .,,...,,,,, ./ ........ ~
- A - ...
~'-1' -~ :.,,,,- ,...
/~ ~ ~ -- ~ 0 '--~ ' ~ --- ' -_,,..,_ --5?--: -/ ,.. -- I -/ -- -..J"..... ,...o.------ A / ,..r,_ ---,
I ---- -__ .,,, __ INTER FACIE TAKEN FROM rH0T0GRAPH IN FIG. 32-- INTERFACE TAKEN FROM PHOTOGRAPH IN FIG.29----
I I I I I I I I I I I I I I I I 3 4 5 6 7 8 9 10 11 12 13 14 15
HOR I ZONT AL DI STANCE - FEET
/-DRAIN C
J-,r
~ ' I
I I ,
I
I ,,
16 17 18
GROUND WATER MODEL
TEST NO. 7
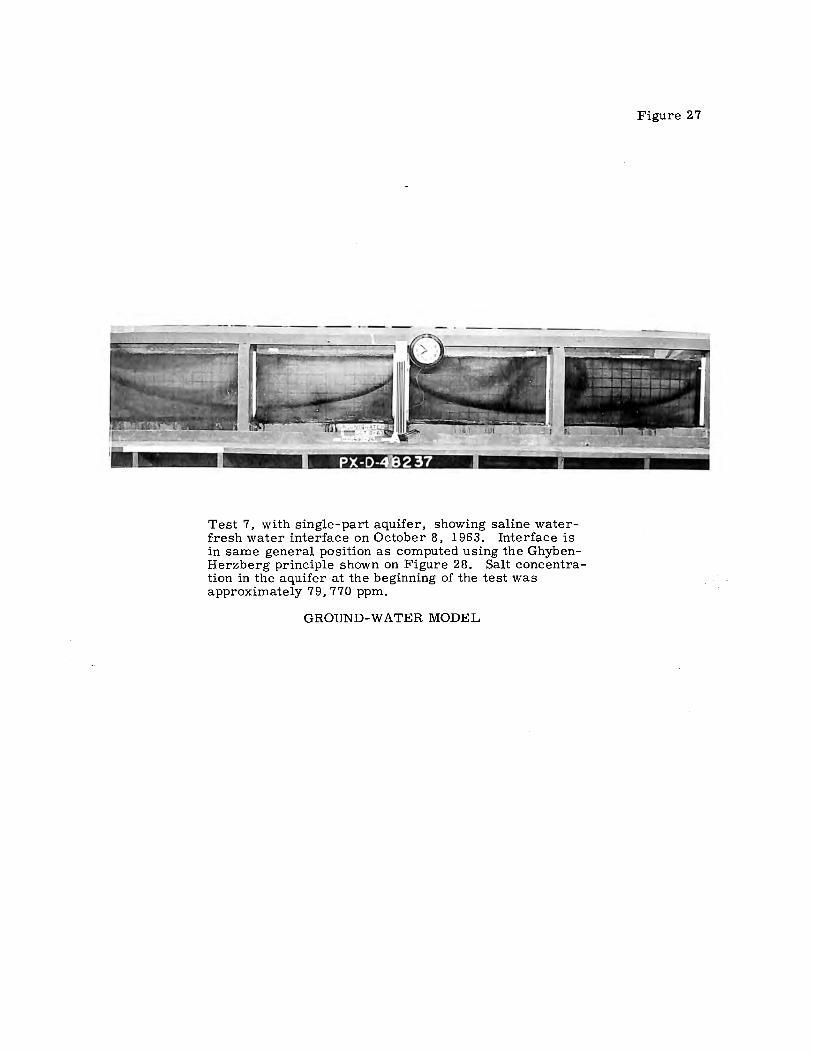
Test 7, with single-part aquifer, showing saline waterfresh water interface on October 8, 1963. Interface is in same general position as computed using the GhybenHerzberg principle shown on Figure 28. Salt concentration in the aquifer at the beginning of the test was approximately 79,770 ppm.
GROUND-WATER MODEL
Figure 27

685
a: ::, 0 ::i::
a:: w a.. (/)
z 0 __J
1.8
1.6
1.4
1,2
__.1 1.0 <l: <.!)
w <.!)
a:: <l: 0.8 ::i:: (.) (/)
0
0.6
0.4
0.2
----FIGURE 28
/ ~ -r--" ,..............- ' [',__ ---I r--......
""- v--r--,,, ,._
I/ ,-
"t--.. /' ., -~ /' '- I'-.. ORA IN "e" - / [V - r--, --
"', ~ -~ r--... .... -- r--,...
I'-..
r-----"---r-...
3 - DRAINS, ONE - PART AQUIFER
DISCHARGE MEASUREMENTS
DRAIN "c '!., I', '
\ _i----,. I
, -r, ~r--...... I
/' I -· ""- ..... -,-- I -.,_ ,,.. I"'.
,__ -- ' 1,
I ,_._
i--"" V ,, 'r-,....._ 1-.l J " ' I r--.. /
.... --.. ./ "' /:;" -- '-- - ---,... r--V ~ ..... ,,....
i---~ r - ,...._ -- - ,..- --~- "\\ I """- - _.,,,, -- --- -- - ------ ,4 i~ ~ " I ' I ~ I ' J I
ORA IN IIAU,., '- t-~ -- -r--.. '
12 N 12 N 12 N 12 N 12 N 12 N 12 N 12 N 12 N 12 N 12 N 12 N 12 N 12 N 12
I I I I I I I I I I I I I I I
~-OCT. 2-->+<--0CT. 3----0CT. 4-->+<--0CT. 5-->+<--0CT. 6-->-t<--OCT. 7-->-l-<--OCT. 8-->+<--0CT. 9-->+<-0CT. I0->+<-·0CT. 11-->+-<-0CT. I 2->+-<-0CT. 13->+<-0CT. 14---·0CT. 15->-t
I I I I I I I I I I I I I I I
GROUND WATER MODEL
TE ST NO. 7
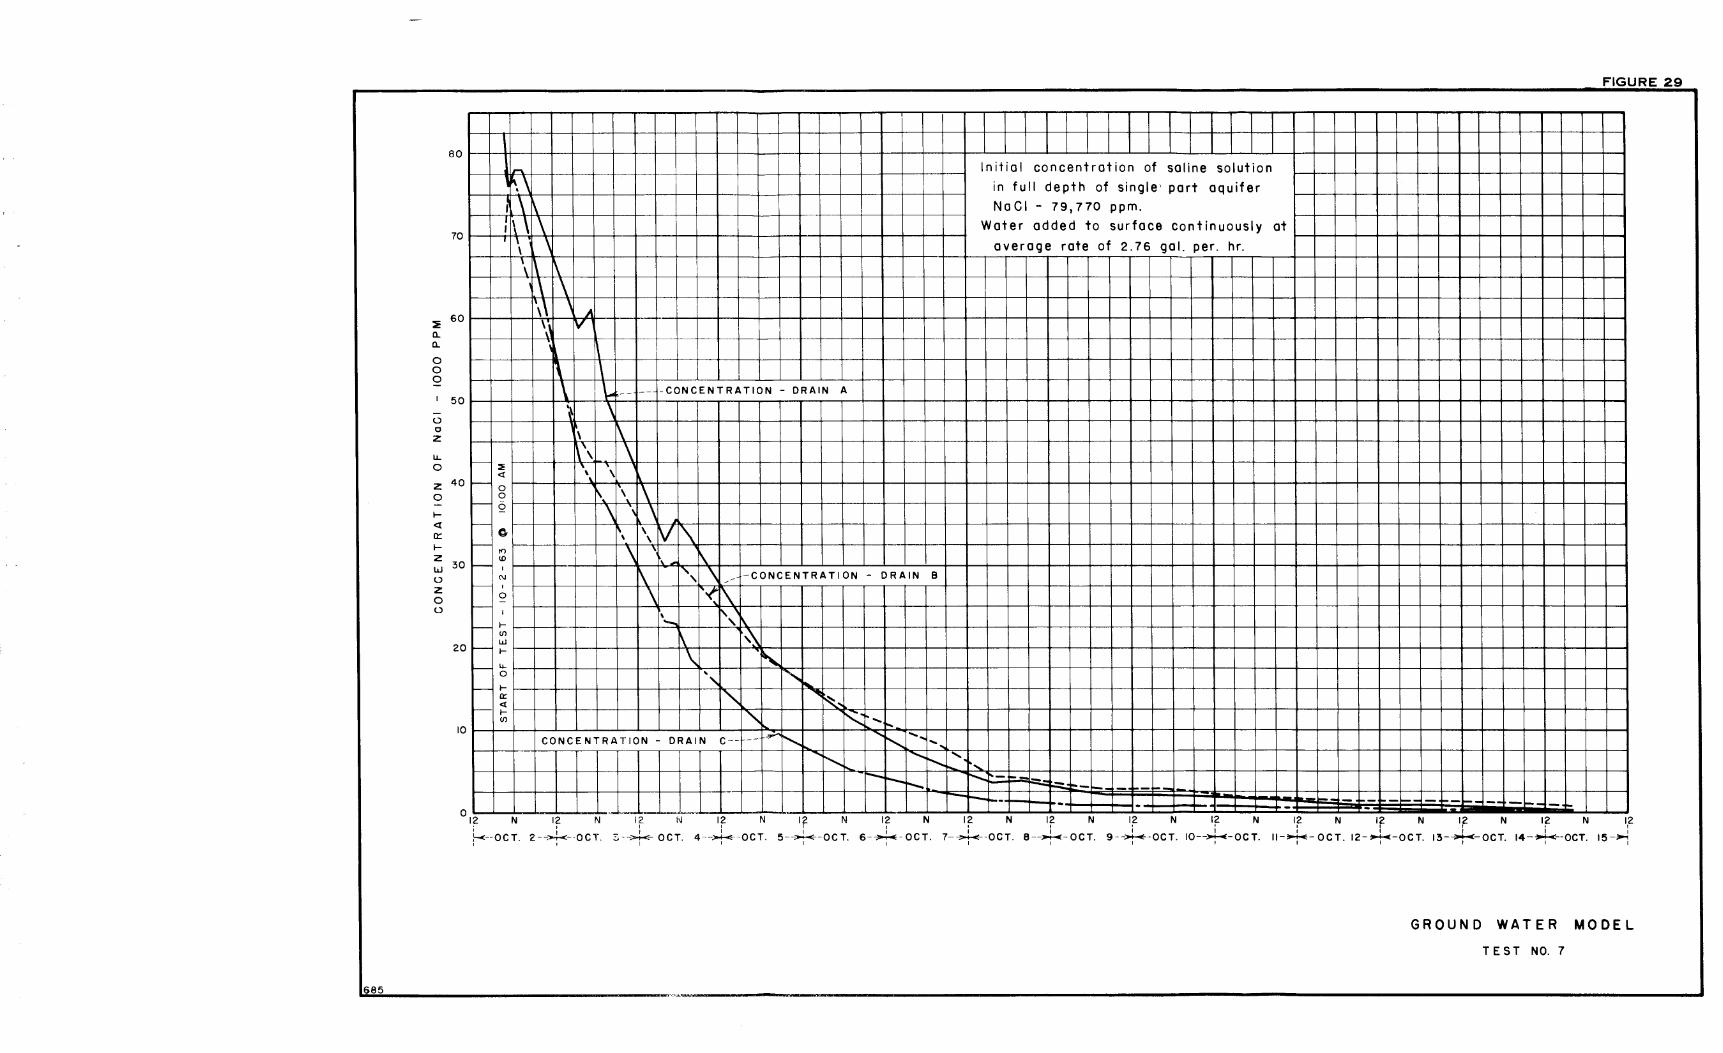
:I!: 0.. 0..
0 0 0
I
-0 0
z LL 0
z 0 -I-<[
a:: I-z w 0 z 0 0
§_85
FIGURE 29
80
- In iti a I concentration of saline solution
\\ in full depth of single· part aquifer
l \ \ NaCl - 79,770 ppm.
70 : 1\ ' \ Water added to surface continuously at I \
' average rate of 2.76 gal. per. hr. \
\\ \ \ \
60 \\ ' ),
'J V
I
I \
50 \ \.. ,-- --- -CONCENTRATION - DRAIN A
) ' ~ \ \
40
I-----\\ \
:!: ' . <( \ \ ,___ ' 0 ,.
\ 0 1\ \ - 0 ' \ ' ' - I\ V I'\ (I, \ \ \ -
30 \ ' r<)
i\ <D ·, -,...._ I ", \ (\J I\ -CONCENTRATION - DRAIN B
/ - I
\ r< i\ 0 -
20
.__ I'- " I ,_
I- ' I\ - ~ (/)
\ w .__ I- \ lJ_ '-,___ 0 ', " lo... - I-
" Cl:'. 'oi:~ .. <(
10
- I- "-.. "-: (/) ..... .... CONCENTRATION - DRAIN -- L_,,.;.-.
' ........
' ....... c-- ---~
-...I".. ........ r---.... '· ~ .....
~ r- ...... .. _ -- --i-- - ..:::..: ... _ --- .. ----- - _, - - - -- - --- -- - -- - -- - -. -O 12 N 12 N 12 I~ 12 N 12 N 12 N 12 N 12 N 12 N 12 N 12 N 12 N 12 N 12 N 12
I I I I I ' 1 I I I , 1 • I ' I f-c--oc T. 2-->-r<--0 CT. ' I
:)-~- OCT. I
I I I I I I I I I I I I 4--~-0CT. 5--~-0CT. 6-~-0CT. 7-~-0CT. 8--~-0CT. 9--~-0CT. I0--~-0CT. 11-~-0CT. 12-~-0CT. 13--~-0CT. 14-~--0CT. 15-~
GROUND WATER MODEL
TEST NO. 7

Saline water-fresh water interface of Test 7 after 12 days and 20 hours operation of model.
GROUND-WATER MODEL
Figure 30

Figure 31
Saline water-fresh water interface of Test 7, 3 days (13. 8 prototype years) after the application of irrigation water was stopped. Comparison with Figure 32 shows that the interface has not leveled completely.
GROUND-WATER MODEL

Figure 32
Sand tank model with automatically operated flush tank and stainless steel troughs installed for Test 8, to apply irrigation water at regular intervals and distribute it uniformly over the aquifer surface.
GROUND-WATER MODEL.
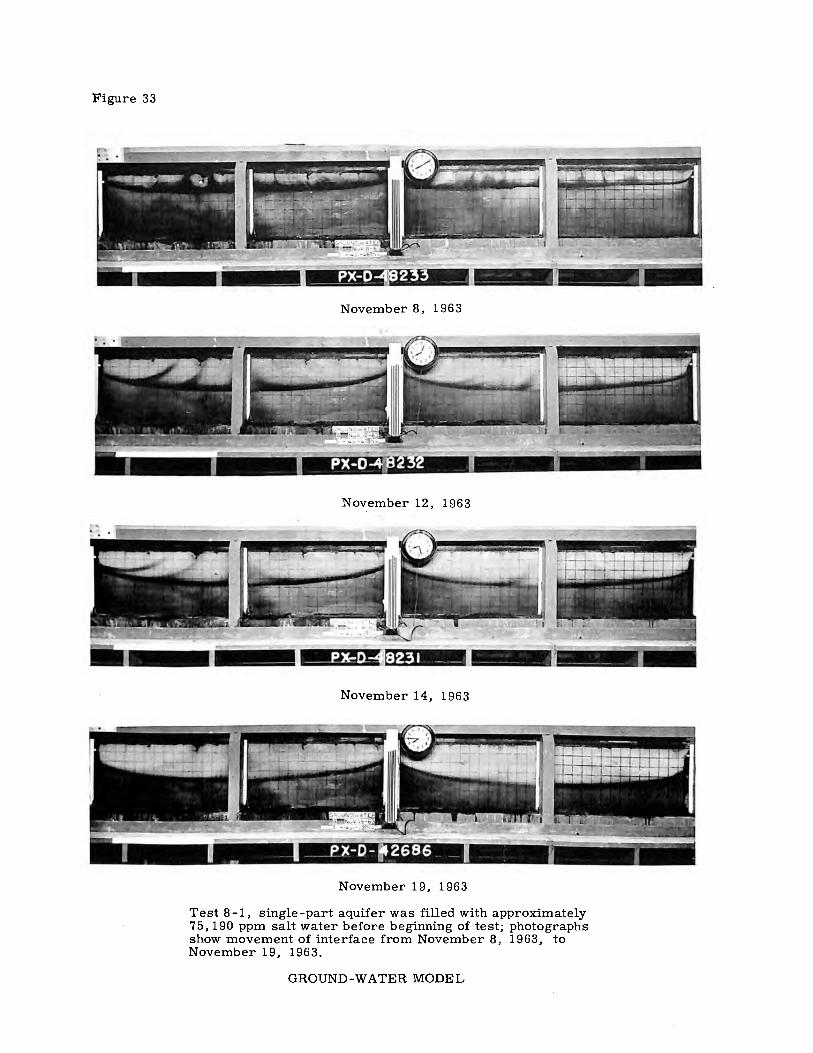
Figure 33
November 8, 1963
November 12, 1963
November 14, 1963
November 19, 1963
Test 8-1, single-part aquifer was filled with approximately 75,190 ppm salt water before beginning of test; photographs show movement of interface from November 8, 1963, to November 19, 1963.
GROUND-WATER MODEL

Figure 32
Sand tank model with automatically operated flush tank and stainless steel troughs installed for Test 8, to apply irrigation water at regular intervals and distribute it uniformly over the aquifer surface.
GROUND-WATER MODEL.
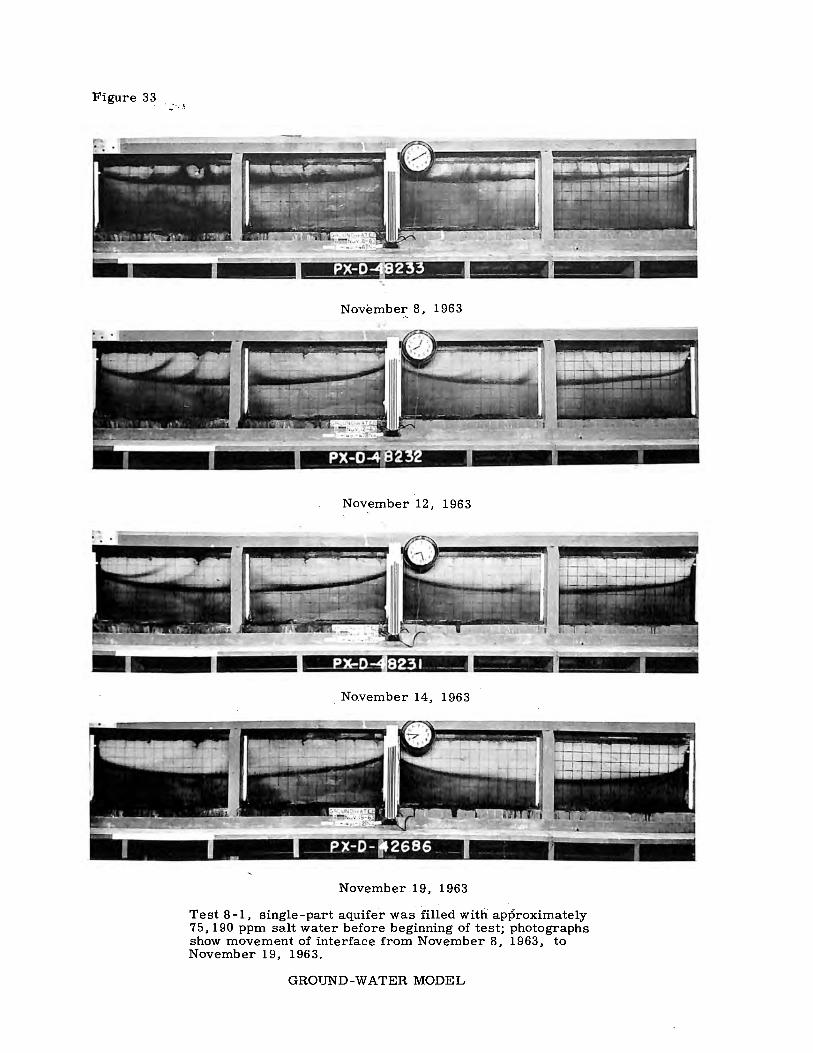
Figure 33
November 8, 1963
November 12, 1963
November 14, 1963
November 19, 1963
Test 8-1, single-part aquifer was filled with approximately 75,190 ppm salt water before beginning of test; photographs show movement of interface from November 8, 1963, to November 19, 1963.
GROUND-WATER MODEL

685
:E (l.
70
60
Cl. 50
0 0 0
0 0 z LL 0
z 0
~ ct ~
~
z w 0 z 0 0
40
30
20
10
------------.__
--
\ \ .
', ~ i \ ~ '
' \ " . . .. '
~ <(
IC) IC) .. 00
@ I')
CD I
CD I --I
I-(/)
w I-
11. 0
I-a:: <(
I-(/)
\ l ,,
~
\
\ \
~--~ -- -~~ .....
~ '\ ~ '
\ ~t..-'\ \ \ \
~
\ \ ~ \ \ '
' i\. i\ \ \ ~ . " ' ' V ""
" \ ~ • \' ........ \
' \
' ' I ', ... ' \ I ·,, ! "'
,._ ,,
'\ !i ,, '-..., ·, ....
~ , ... ' ' r--....
-CONCENTRATION - DRAIN c--- -
FIGURE 34
~ '
-
Single part aquifer of fine sand with three drains. Original concentration of saline water which
filled total depth of aquifer. NaCl - 75,190 ppm
Intermittent application of fresh irrigation water 2.77 gal.every 2 hours.
~- --CON CE NT RATION - DRAIN B
" i'... , ...
', ........ ~ ---CONCENTRATION - DRAIN A
I'' , ... / .,. ,
~~ ,..,
.( ....... r--.....
....... I', , ... ~ ....... , ... , .... ' r-J \ ' ....... ' "' ~ ', .I". '..., "' ,,,........
~
........ ' IV , ... ~ ' ... ,_
'
012 N 12 N IF N 12 N 12 l i I l I ~- NOV. 6--~--NOV. 7--~--NOV. 8--=,--,o:--N O V. 9 -->t<
GROUND WATER MODEL TEST NO. 8- I

I ~ i •
68_5_
0.0 1-w w ~ 0.5 I z 0 1.0
I<( > 1.5 w ...I
p
',
w 2.00
---/
.... -I\ -
ORAi N A
--~ -- -- - -< )-_ .r,_" i.- -- , - -... - ...
2 3 4 5 6
One part aquifer 3- Drains o = 2. 77 gal. in 2 hours
---COMPUTED -/ , /
THEORETICAL FRESH WATER-SALT
I I I I I ORAi N B ---
I -·TOP OF SAND I /-
I ' ', I ~
\.. I I
v' '~J ~ ~- ' ~ - -~ --- ~ r-- ,..;__- - ~.c -- 0.. ' - - .. f\ ... 1' - -
' - - - -' ' -- -oBSE RVE D INTERFACE I 11 - 19 - 63, 8•30 A.M.
TAKEN FROM PHOTOGRAPH IN FIG. 35
7 8 9 10 II 12 13
HORIZONTAL DISTANCE-FEET
WATER
... --.... -
14
FIGURE 35
INTERFACE
DRAIN C / /
I
,. J:,
.,.l,,',
f ...... .... -..,.,,,. ....
----~
15 16 17
GROUND WATER MODEL TEST NO. 8- I
18

(/)
z -
FIGURE 36
• I 6,-----,----,----,----,----,----,-----,-----,-----,---..,---..,---.-----r---.-----.-----r---.------.-------,------,--~----,-----,---.....,..-------r------,----,-----,---...---....... --
.14 3 MINUTES
Water table elevations are shown at given time intervals after a water application of 2.77 gals.
Dashed I ine gives computed water table for steady flow conditions based on Ghyben-Herzberg Principle Q =2.77 gal. every 2 hours .
3 MINUTES
• I 21---~1----~--~,£--~---+---+---l----l----l------+-----+----0~--+---+---+---+----1-----1----~l------,;tl!,.~---+----1----+---+~--l------l----+-----+-----+--~---t----+--~ 6 MINUTES
I I / I I /-I I I I I I I I~ I I \. I I I I /! I YI I I I 9 MINUTES
~ ~ .I 0 0
L&.. I I/ I/ I ~I I I I I ~ I "I ~ I I I / I/ I -~ I I 112 MINUTES
0
iool ~LIA~I I, 5 ;,~NUT:r::hL ~l"\I\ I I 'LLIAM4= I' 5 OM '1NUTES
I 8 M l,NUTES
m ~ I I II cf y 1..........-r- I I._ ... 1 ••• , ___ I ~ I °'-l. I'\. I\ \ I I / I / A ./T y I ~ l21 MI.NUTES
... I I A f I/ I /1 1-~·, -~ I l'---.... I "-. I '\...1\\1 I I II r I / I/~~ I l24 MINUTES Lu Lu L&.. I / /I / r% A' J./" I I 12 I M ~,Nu I Es I l~I 'i-.. I'\. 'l \ \I I I II I A /1/_Y ~I I 27 MINUTES
I .06 = .r::.
o.lt/¥ :~\ ll/#~=f-=~::I __ ~-=
. /717~ 30
.02 IHl/8 A'/ rt' I:.,,... I I I I I I I I ~, I'-.: ~ \.,\ I\\ I Hf/ fl/IV ~ I I I I I I I I I I I I I '· WIIII I
A -----1DR A IN B
1.0 2.0 3.0 4.0 5.0 6.0 7.0 8.0 9.0 10.0
DISTANCE - FEET FROM LEFT BULKHEAD
685
11.0 12.0
DRAIN
13.0 14.0 15.0
GROUND WATER MODEL
TEST NO. 8-1
16.0

0.1 60
0.1 50
0.1 40
0.1 30
0.1 20
0.11 0
z -c( ct: 0.1 00 0
...... ··. I'..
~ •.
~~ 'i--.... ~ ~~-t,,..J ~I 13 MIN.
'~~~--4. I •
°""r, I •• ~ . ··- ··- ~ "'-'l-~ "'l' I" ·
I\. I I '\J.-'1,1'.~ 1-.J·'< f\::k I ll~":~-1.:·r·, 1 16 MIN.
"'~ I l"'l :~~~ 1--~ ~ I l~J~~ 1·~.
"'l.'-..J I~, -,~l~~~ I ~ L _ I"... '"i-....'-...r.::;:t:~.. l~• . .J.. I I 9 MIN.
--~ I N I ~~:Ni~
FIGURE 37
Re I at ions h i p of water tab I• e I e v. t----+--+------t-----1-+--+--+----,-+-----t---i
with time-measured at Io wells after· one water application of 2.77 gal.
IL
O 0.09 c.,i
~....j l'i--....1 i'~T':t~~---L I I l12MIN.I I I I I i
ltltNJ~™~-<l.J !'" t'·I I I I I I I I I I I I I I I I I I I I I I I I I I I I I I I -~j....._~I I I l~T:_~l I ,--~·:r-··r---4. _ _p I IIBMIN. I.LI
~ 0.08 m c(
..,. 0.07 LI.I I.LI IL
I = ..c
0.06 ~
l I
I --.
= 0.05 w ~~~~ACE;, /
0.04 :: m WELLS, -----DRAINS--,
/ \ / - ' ' / ' I / \
~ /
0.0. E 0.02
E 0.01
0.0 0
12:30
685
~ ~t~ ~ I 2 3 4 5 6 7
FINE SAND AQUIFER
I
~ . ~ ~~ 8 9 10
it,!: u. 0
C\J ' I I
1 I_!_ I BOTTOM OF TANK .. _ _...-7 1
I l L<--------------- 15 71 FT--------------~ I . . I
SECTION OF GROUNDWATER MODEL
5 10 15
TIME-MINUTES
24 MIN. .. .. I I I !.27 MIN.
130MIN.
"1T-+-.l~o. 1s I 1-:·R:l;d.':\I i I T~h>-l I i~ l I l=ti---~~-1-l .. _l r~t:'i-.L I ,--r-~ ..
20
, ,·-~ n-··i"1:-t--Li'i~+-l l ,~ 'i-Q.!.._ 1~~ r··1--i......._"r-l,. --·i--
1 r-+- .. L ~ i I I ~--::-4--:
25
r--f-a1 . .:t::i--+-oJ___ I -1 1~ I ~--~ ,- , .. 1-+-=
30 1:00
GROUND WATER MODEL
TEST NO. 8-1

685
FIGURE 38
Q. ··~ ~ J
4.0 '-. I I I 11
", Single part aquifer with 3 drains.
, Graphs show how discharge rates
, vary with time after one application
~ of 2.77 gallons.
,.. 'N~ , , , , , , , , a:
:::> " " o 3 .0 ~ -0 RAIN B :I: ,/ a:
; .. ttIJ=~+=t-+~__:p~~d-t-t-t--f-t-tt-t-tt!=l=ttl=l~H .J .J
: ,.oLECil-++-++-+---t~~-FP~F=k±ttt1jjjJ=cr=q a: <l :I:
(.) " " ~ /-DRAIN A 0
l~~~::::~~k;;:--~--+---t::~~!llo,,,,bt~/t--1--,---1--t--r--1--1r--r--1 1.5 ,
0.5
-r---
... ..
0L----'---.......... ----'-----'----''-----'----"----'---.......... ----'-----'----''-----'---..__---'-__ .J....._-.J. __ _.__--''---......L.--..__---L. __ .......__-.1. __ ....L.. _ ___,.___......1... __ .L.,__--L.,_-J
0 5 10 15 20 25 30
TIME - MINUTES
GROUND WATER MODEL
TEST NO. 8-1
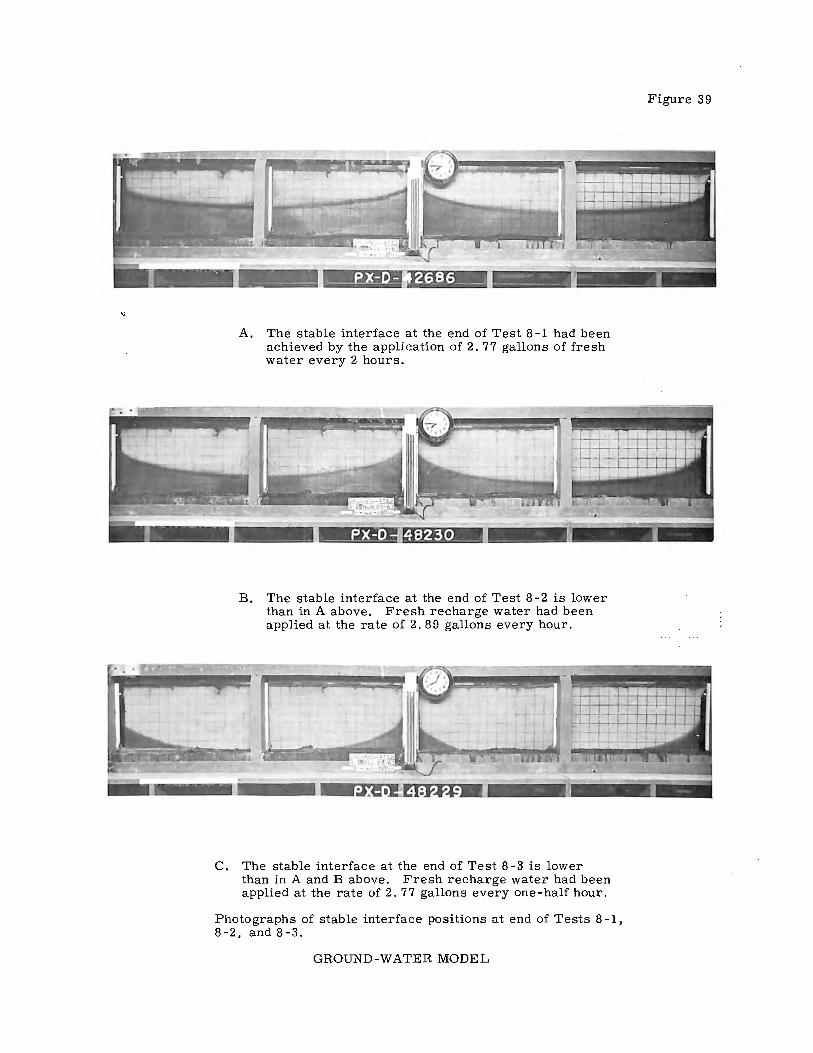
A. The stable interface at the end of Test 8 -1 had been achieved by the application of 2. 77 gallons of fresh water every 2 hours.
B. The stable interface at the end of Test 8-2 is lower than in A above. Fresh recharge water had been applied at the rate of 2. 8 9 gallons every hour.
C. The stable interface at the end of Test 8-3 is lower than in A and B above. Fresh recharge water had been applied at the rate of 2. 77 gallons every one-half hour.
Photographs of stable interface positions at end of Tests 8-1, 8-2, and 8-3.
GROUND-WATER MODEL
Figure 39
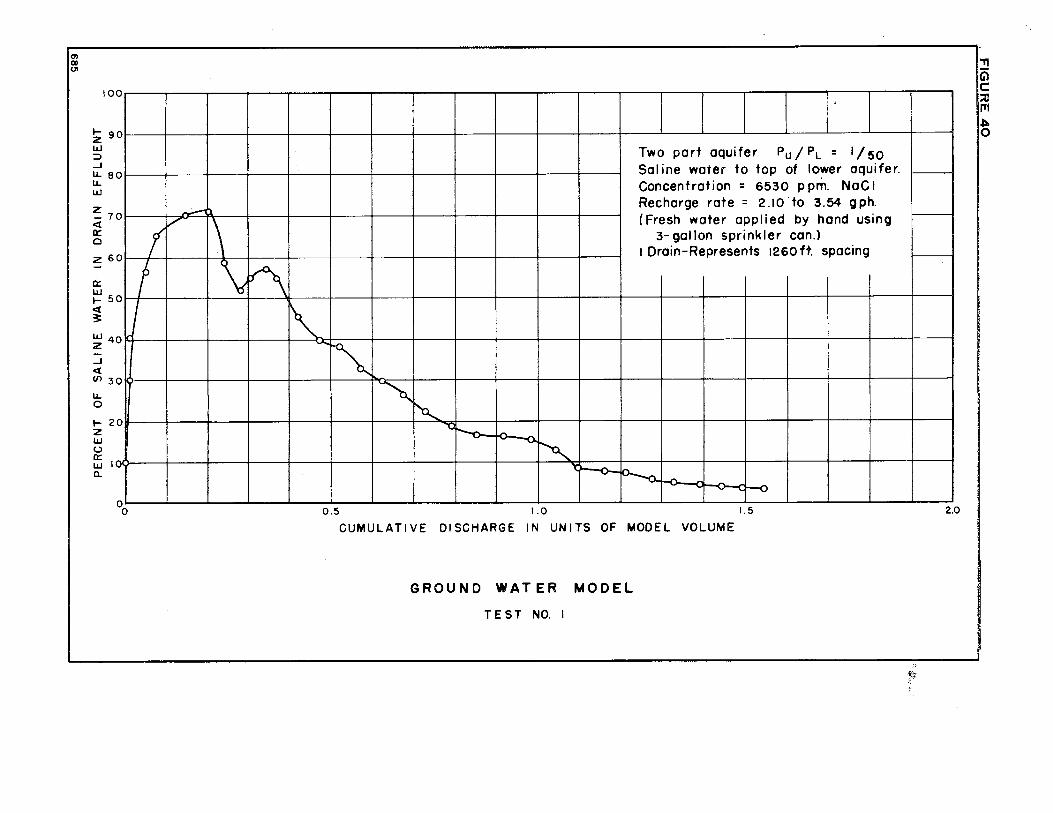
0) ClD UI
100 I
~ 90 UJ ::::> ...J u. 80 u. UJ
z <i 70 a:: 0
Z 60
Q: UJ I- 50
; UJ 40 z ...J <(
II> 30
u.. 0
' I- 20 2 LI.I 0
~ 10 a.
r
0 0
_;.....,,'.:).
/ \ f f \ I
·'
Two port aquifer Pu/ PL = l/50 Saline water to top of lower aquifer. Concentration = 6530 ppm. NaCl Recharge rate = 2.10 ·to 3.54 gph. (Fresh water applied by hand using
3-gol Ion sprinkler can.) 1 Drain-Represents 1260ft. spacing
~ ~ -~ ~ ~
"Cl ....._ - -- ~
~ ... -- --o.. _,.. - -- 'V
0.5 I .0 1.5
CUMULATIVE DISCHARGE IN UNITS OF MODEL VOLUME
GROUND WATER MODEL
TEST NO. I
2.0
.,, ,:
"Tl i5 C ::u 111
~

100
1-z 90 IJJ ::, _J
t!: 80 IJJ
z ~ 70 a: 0
~ 60
a: IJJ
~ 50 3r:
IJJ Z 40
_J
ct !J')
30 LL 0
\z 20 IJJ 0 a: ~ 10
0 0
0~ -- ""-.
I I \ I 0\
""
Two part aquifer Pu/ PL = l/50 Saline water to top of lower aquifer. Concentration = 6490 ppm. Na CI Recharge rate = 2.93 g ph. I Drain - Represents 1260 ft. spacing
" ~ ...... o -........:: ~ r--.. - r---.
-0.5 1.0 ' 1.5
CUMULATIVE DISCHARGE IN UN ITS OF MODEL VOLUME
GROUND WATER MODEL
TEST NO. 2
2.0
::!! Ci) C ::0 111 ~ ---

0) a, UI
100
._ 90 z "" ::> ..J
:!: 80
"" z ~ 70 0:: 0
Z 60
0::
"" ._ 50 ,,t 3
~ 40 -..J ,,t
w 30 LL 0
._ 20 z
/ ~
I \ I "' ' l
LI.I 0 0:: LI.I 10 a.
00
j
Two part aquifer Pu /PL = l/50 Saline water to top of lower aquifer. Concentration = 6200 ppm. NaCl Recharge rate = 12.76 to 13.35 gph. 3 Drains - Represents 315 ft. spacing
' '
"' ~ --......,,.. ------ - - - -
0.5 1.0 1.5
CUMULATIVE DISCHARGE IN UN I TS OF MODEL VOLUME
GROUND WATER MODEL
TE ST NO. 3
2.0
::!! Ci) C :0 11'1 ~ I\)

a, a, U1
100
1-z 90 I.LI :) ..J
:!: 80 I.LI
z ;;j: 70 Q:: C
~ 60
Q:: I.LI I- 50 ; I.LI Z 40 ..J <(
CJ> 30 LL 0
I- 20 z I.LI 0 Q::
~ 10
)
~
\ \
00
I\ " " \
\ '
Two part aquifer Pu/ PL = l/50
Saline water in upper and lower aquifers. - Cone 7200 ppm NaCl
Recharge rote 2.71 to 3.87 gph. 3 Drains - Represents 315 ft. spacing
~ -""O.. r---. ""' -U'"'O( ---- '
~- - ,.. -
1.0 2.0 3.0
CUMULATIVE DISCHARGE IN UNITS OF MODEL VOLUME
GROUND WATER MODEL
TEST NO. 4
4.0
"Tl c5 C ::u 111 ~ c..>
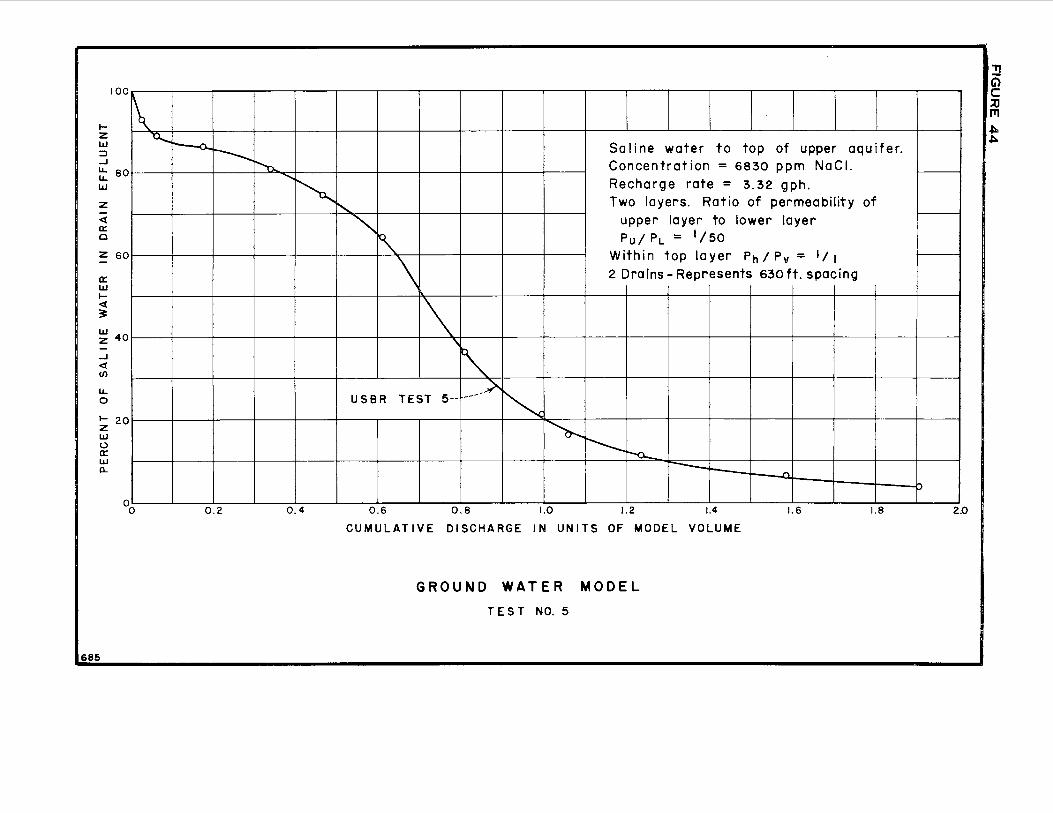
1-z ILi :::::, ..J
100
:!: 80 ILi
z <( a:: C
Z 60
a:: ILi I<(
~
~ 40 -..J <( (/)
u. 0
I- 20 z ILi 0 a:: ILi Q..
\
00
685
'Cl.... ---0.. --....... ............
0.2
'~
0.4
Sa Ii ne water to top of upper aquifer. Concentration = 6830 ppm NaCl. Recharge rate = 3.32 gph.
t--... Two layers. Ratio of permeability of
" upper layer to lower layer
~ Pu/PL= 1/50
\ Within top layer Ph/P 11 = l/1
2 Drains-Represents 630ft. spacing
"
\ '" USBR TEST 5--
___ />,
~ ~
I'-.. r-n.. ----~ -
0.6 0.8 1.0 1.2 1.4 1.6 1.8
CUMULATIVE DISCHARGE IN UN I TS OF MODEL VOLUME
GROUND WATER MODEL TEST NO. 5
2.0
:!! G) C ::u 111 .St, .Iii,.
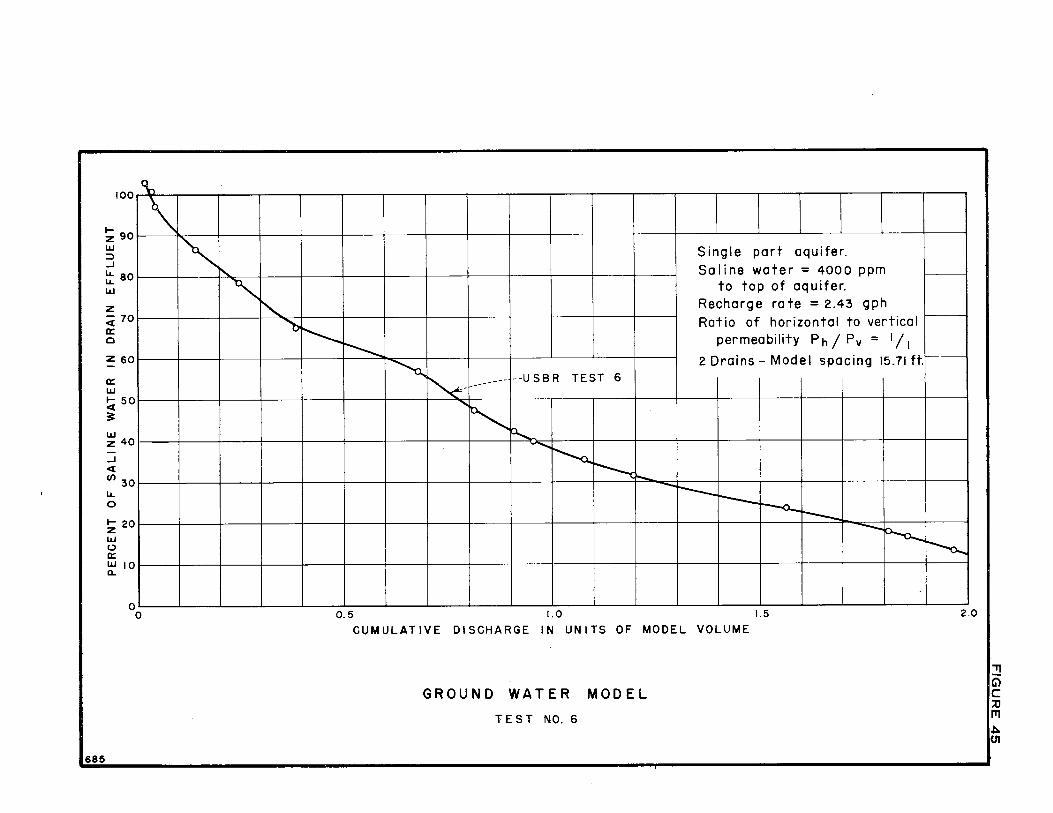
685
100
I- 90 z w ::::, ...J
:!: 80 w
z ~ 70 er:: 0
z 60
er:: w ~ 50 3';
~ 40
...J <t Cl) 30 LL 0
I- 20 z w 0 er:: W 10 a..
0 0
\
' '-
~ I'-...
'"b
Single part aquifer. Saline water= 4000 ppm
to top of aquifer. Recharge rate = 2.43 g ph
I'-... Ratio of horizontal to vertical
r-,....__ permeability Ph/ Pv = 1/ 1
~ 2 Drains - Model spacing 15.71 ft.
~-------- --US BR TEST 6
"~ 0....... --..... ~ ~ ..... ~r---
r-- r--a._ --- ----~
0.5 1.0 1.5
CUMULATIVE DISCHARGE IN UNITS OF MODEL VOLUME
GROUND WATER MODEL
TEST NO. 6
'--o....
2.0
:!! G) C ::ti IT1
.i:. (JI
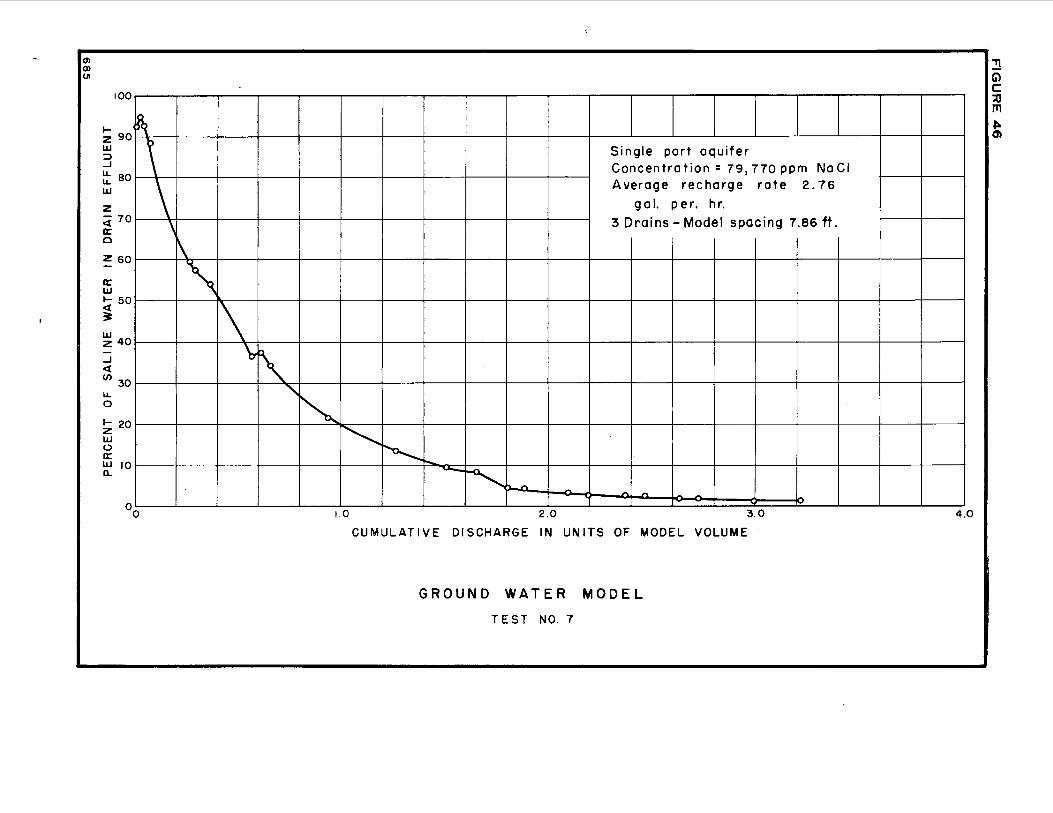
0) CD u,
100
~ 90 LIJ ::::, ...J
:!: 80 LIJ
z <C 70 a:
~
\ \ ' 0
Z 60
a: LIJ
\
~ I- 50 ~ 3 LIJ z 40 -...J ~ (/) 30 u..
I\ \
' " 0
I- 20 z LIJ 0 a: LIJ 10 a..
00
Single port aquifer Concentro tion = 79, 770 ppm No Cl Average recharge rote 2. 76
gal. per. hr. 3 Drains - Model spacing 7.86 ft.
~
"' ~ 1.0
~ -' - - - - - - -2.0 3.0
CUMULATIVE DISCHARGE IN UNITS OF MODEL VOLUME
GROUND WATER MODEL
TEST NO. 7
-4.0
"Tl Ci) C ::0 1'11 .ai.
°'

a, a, UI
100
~ 90 ILi :::::, ....J
:::: 80 ILi
z <t 70 cc: 0
~ 60
cc: ILi I- 50
1 ILi Z 40
....J <I II) 30 IL. 0
I- 20 z ILi (.) cc: ~ 10
0
~ ~ \
L ' i\ \ '
Single part aquifer Concentration= 75,190 ppm NaCl Average recharge rote = 2. 77
gallons each 2 hours -
3 Drains - Model spacing 7.86 ft.
"' "" ' "'~ " ~ ~ >-........_ - - --0.5 1.0 1.5
CUMULATIVE DISCHARGE IN UNITS OF MODEL VOLUME
GROUND WATER MODEL
TEST NO. 8-1
-~ 2.0
::!! G> C ::u ITI
.i:. ....,