Embed Size (px)
Citation preview

Bureau of Indian Affairs
ABC and Management Decision-Making
May 24, 2006

Agenda
Activity Based Costing in the BIA
Real Estate ABC Data Collection, Validation and Reporting and Use of the Data
How BIA uses their ABC and Performance Data
Example: Real Estate Central Office/HQ Data for December 2005 - Probates
Example: Real Estate Region Data for December 2005
3
Activity Based Costing (ABC) in the BIA
• Third Year of Program
• Current Use of Surveys to collect:
– Time Worked on Activities
– Outputs per Activity
• As of October 1, 2006 – Use Quicktime to Report Time and Labor cost by activity
– Over 600 activities reported under 17 Lines of Business and 36 Business Functions
– Non-Labor costs captured through analysis of FFS data
• Data Collected Monthly for Realty – First program to use formal reporting mechanism for decision-making

4
Real Estate Can Provide Accurate ABC/Performance Data
• Data Collection
– Employees have the ability to track their time daily in a "cuff sheet"
– Real Estate collects employee data monthly
– Collect "workload data" monthly
– Data only has one month lag for workload and time on task
• Data Validation
– Validation checks occur throughout the process to ensure accuracy of data
Daily "cuff sheet" alerts employees to key problems with data entered
Perseus Survey prevents monthly transmission of data until it is entered correctly
After data is collected, Central Office Program Manager produces validation reports for each office allowing managers to correct errors or attest to accuracy of data
• Reporting
– Can generate over 60 types of reports by various organization levels each month
– Data can be produced in a table format or PowerPoint Slides
– Aligned to the DOI mission areas and goals

5
How Real Estate is Using the ABC/Performance Data
• Produce accurate and valid cost data on a monthly basis
• Support management decision making to determine:– Resource requirements– Cost and FTE to fully support "real estate" workload requirements– Forecast budget and FTE in the out years
• Produce approximately 60 types of reports to include data on: • Workload Profiles
• Total Cost
• FTE Consumed
• Unit Cost
• FTE per Unit
• Assist Central Office and Regional Leadership in determining best and worst organizational performers by region and agency
• Support data requests for the DOI and BIA HQ, budget requests, PAR, PART, GPRA, etc (eliminates multiple data requests to field)

6
How BIA will Use their ABC and Performance Data
• Data Collection and Data Validation
– BIA will begin collecting ABC employee time data on a bi-monthly cycle until QuickTime implementation in Oct 1, 2006
– Workload data is being collected on a monthly basis
– BIA is currently developing a validation process for workload and performance measurement information
• Reporting
– BIA is developing a reporting template to review results for FY06
– BIA is developing a schedule for Senior Executive progress meetings. Meeting will be either bi-monthly or quarterly
– Results will include cost, FTE, and unit cost (where applicable) of Mission Areas, End Outcome Goals, outputs, and activities

Agenda
Real Estate ABC Data Collection, Validation and Reporting and Use of the Data
How BIA will Use their ABC and Performance Data
Example: Real Estate Central Office/HQ Data for December 2005 – Probates
Example: Real Estate Region Data for December 2005
8
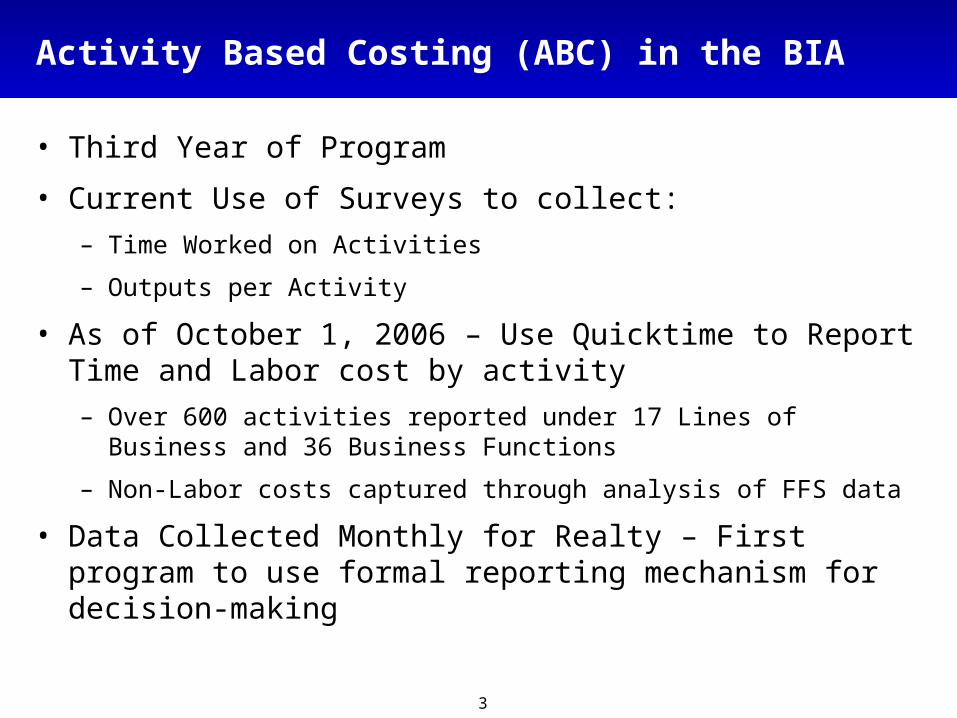
Cost Performance Management (CPM) Tool – Main Menu

9
CPM – BIA Summary Report Menu
10
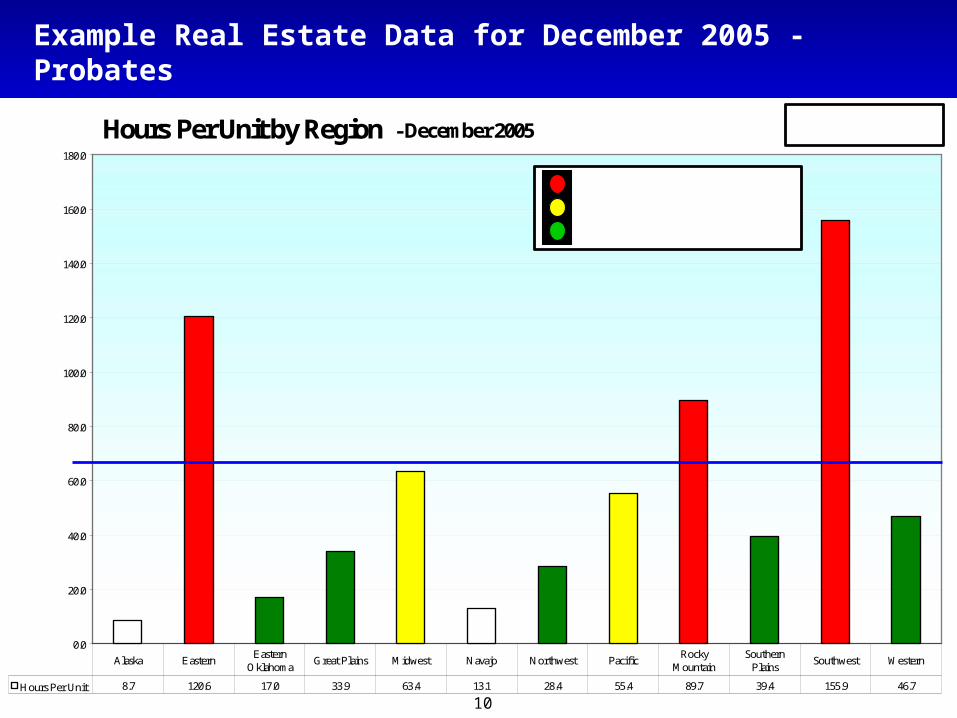
Hours Per Unit by Region - December 2005
0.0
20.0
40.0
60.0
80.0
100.0
120.0
140.0
160.0
180.0
Hours Per Unit 8.7 120.6 17.0 33.9 63.4 13.1 28.4 55.4 89.7 39.4 155.9 46.7
Alaska EasternEastern
OklahomaGreat Plains Midwest Navajo Northwest Pacific
Rocky Mountain
Southern Plains
Southwest Western
BIA Wide Average (65.1)
Poor: +20% above averageAverage: +/ - 20% of averageStrong: -20% below average
Probates
Example Real Estate Data for December 2005 - Probates

11
Direct Labor Unit Cost by Region - December 2005
$0
$500
$1,000
$1,500
$2,000
$2,500
$3,000
$3,500
$4,000
$4,500
Unit Cost $248 $3,130 $379 $760 $1,599 $364 $719 $1,360 $2,146 $1,134 $3,944 $1,374
Alaska EasternEastern
OklahomaGreat Plains Midwest Navajo Northwest Pacific
Rocky Mountain
Southern Plains
Southwest Western
BIA Wide Avg ($1,654)
Poor: +20% above averageAverage: +/ - 20% of averageStrong: -20% below average
Probates
Example Real Estate Data for December 2005 - Probates
12
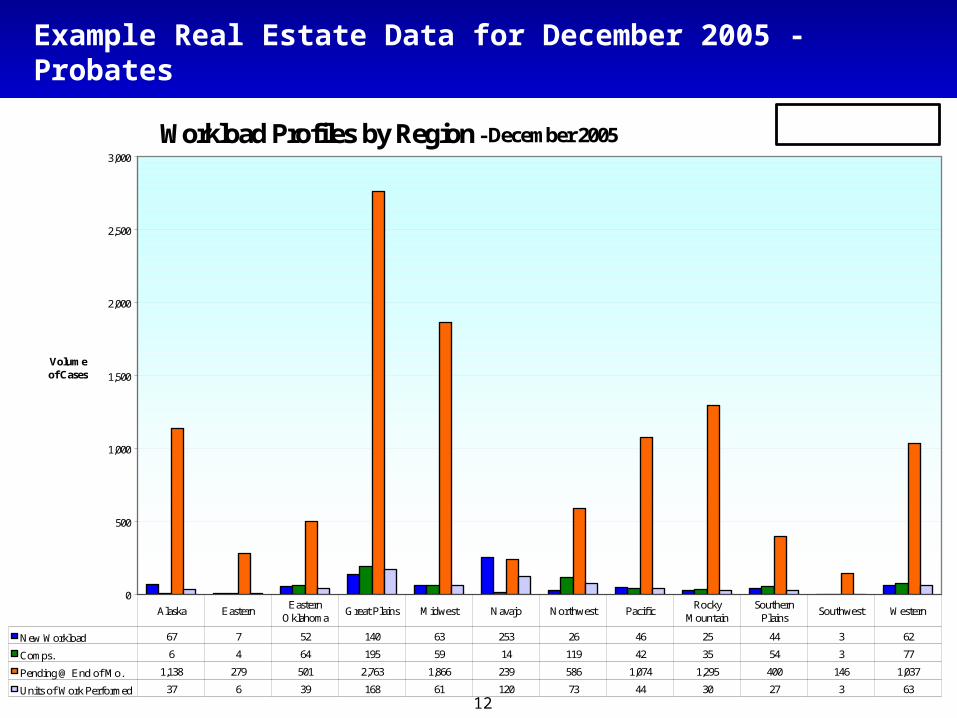
Example Real Estate Data for December 2005 - Probates
Workload Profiles by Region - December 2005
0
500
1,000
1,500
2,000
2,500
3,000
Volume of Cases
New Workload 67 7 52 140 63 253 26 46 25 44 3 62
Comps. 6 4 64 195 59 14 119 42 35 54 3 77
Pending @ End of Mo. 1,138 279 501 2,763 1,866 239 586 1,074 1,295 400 146 1,037
Units of Work Performed 37 6 39 168 61 120 73 44 30 27 3 63
Alaska EasternEastern
OklahomaGreat Plains Midwest Navajo Northwest Pacific
Rocky Mountain
Southern Plains
Southwest Western
Probates

13
Change in Pending Workload by Region - December 2005
0
500
1,000
1,500
2,000
2,500
3,000
Volume of Pending Cases
Pending - Begin of Month 1,199 282 489 2,708 1,870 0 493 1,078 1,285 390 146 1,022
Pending - End of Month 1,138 279 501 2,763 1,866 239 586 1,074 1,295 400 146 1,037
Alaska EasternEastern
OklahomaGreat Plains Midwest Navajo Northwest Pacific
Rocky Mountain
Southern Plains
Southwest Western
Probates
Example Real Estate Data for December 2005 - Probates

14
Total Hours by Region - December 2005
0
1,000
2,000
3,000
4,000
5,000
6,000
Total Hours 316 664 664 5,690 3,872 1,570 2,057 2,440 2,689 1,066 467 2,918
Alaska EasternEastern
OklahomaGreat Plains Midwest Navajo Northwest Pacific
Rocky Mountain
Southern Plains Southwest Western
Probates
Example Real Estate Data for December 2005 - Probates
15
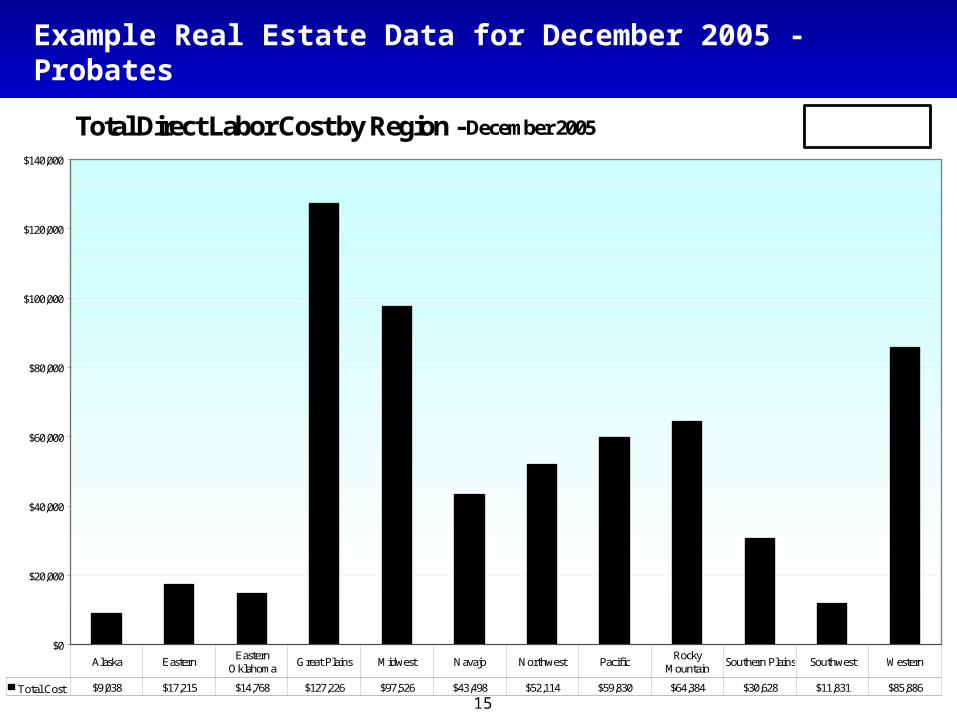
Example Real Estate Data for December 2005 - Probates
Total Direct Labor Cost by Region - December 2005
$0
$20,000
$40,000
$60,000
$80,000
$100,000
$120,000
$140,000
Total Cost $9,038 $17,215 $14,768 $127,226 $97,526 $43,498 $52,114 $59,830 $64,384 $30,628 $11,831 $85,886
Alaska EasternEastern
OklahomaGreat Plains Midwest Navajo Northwest Pacific
Rocky Mountain
Southern Plains Southwest Western
Probates

16
Direct Labor Cost Per Hour by Region - December 2005
$0.00
$5.00
$10.00
$15.00
$20.00
$25.00
$30.00
$35.00
Cost Per Hour $28.46 $25.96 $22.21 $22.39 $25.22 $27.70 $25.30 $24.54 $23.93 $28.77 $25.29 $29.42
Alaska EasternEastern
OklahomaGreat Plains Midwest Navajo Northwest Pacific
Rocky Mountain
Southern Plains Southwest Western
BIA Wide Avg ($25.30)
Probates
Poor: +10% above averageAverage: +/ - 10% of averageStrong: -10% below average
Example Real Estate Data for December 2005 - Probates

Agenda
Real Estate ABC Data Collection, Validation and Reporting and Use of the Data
How BIA will Use their ABC and Performance Data
Example: Real Estate Central Office/HQ Data for December 2005 – Probates
Example: Real Estate Region Data for December 2005

18
Total Labor Costs by Output Group - December 2005
Other Program Work0%
Case Reviews22%
Real Estate - Encumbrances
6%
Probates19%
Real Estate - Conveyances12%
Real Estate - Secondary Transactions
2%
LTRO23%
Mission Sustaining26%
ALASKA REGION
Total Reported Labor Costs for December 2005 = $119,616
Example Real Estate Data for December 2005 – Region Cost by Output Group

19
Total Hours Consumed by Output Group - December 2005
Real Estate - Conveyances11%
Mission Sustaining25%
Real Estate - Encumbrances
6%
Real Estate - Secondary Transactions
2%
Probates22%
Other Program Work0%
Case Reviews19% LTRO
15%
ALASKA REGION
Total Reported Hours Consumed During December 2005 = 3,925
Example Real Estate Data for December 2005 – Region Hours by Output Group

20
Example Real Estate Data for December 2005 – Agency Workload Detail for an Output Group Level
ALASKA REGION
Workload Profiles
0
1
2
3
4
5
6
7
Volume of Cases
Pending @ Begin of Mo. 6 0 2 4 0 0
New Workload 0 0 0 0 0 0
Completions 0 0 0 0 0 0
Pending @ End of Mo. 6 0 2 4 0 0
Units of Work Perf. 0 0 0 0 0 0
Region WideAlaska Regional
OfficeFairbanks Agency
West Central Field Office
Alaska Title Services Center
NW LTRO serving Alaska
Real Estate: Encumbrances
Note: Workload includes pending workload, new workload and completions

21
Example Real Estate Data for December 2005 – Agency Hours & Cost Detail for an Output Group Level
ALASKA REGION
Total Hours and Total Direct Labor Cost
0
5,000
10,000
15,000
20,000
25,000
Total Hours 848 495 131 222 0 0
Total Cost Direct Labor ($k) $22,238 $14,215 $2,055 $5,968 $0 $0
Region WideAlaska Regional
OfficeFairbanks Agency
West Central Field Office
Alaska Title Services Center
NW LTRO serving Alaska
Probates