Embed Size (px)
Citation preview


Buoyancy Considerations in a Fluidized Bed of Ground Particles by
Prakash R. Rao
A thesis submitted to the
Graduate School – New Brunswick
Rutgers, The State University of New Jersey
in partial fulfillment of the requirements
for the degree of
Master of Science
Graduate Program in Mechanical and Aerospace Engineering
Written under the direction of
Professor Michael R. Muller
And approved by
New Brunswick, New Jersey
October 2009
ii
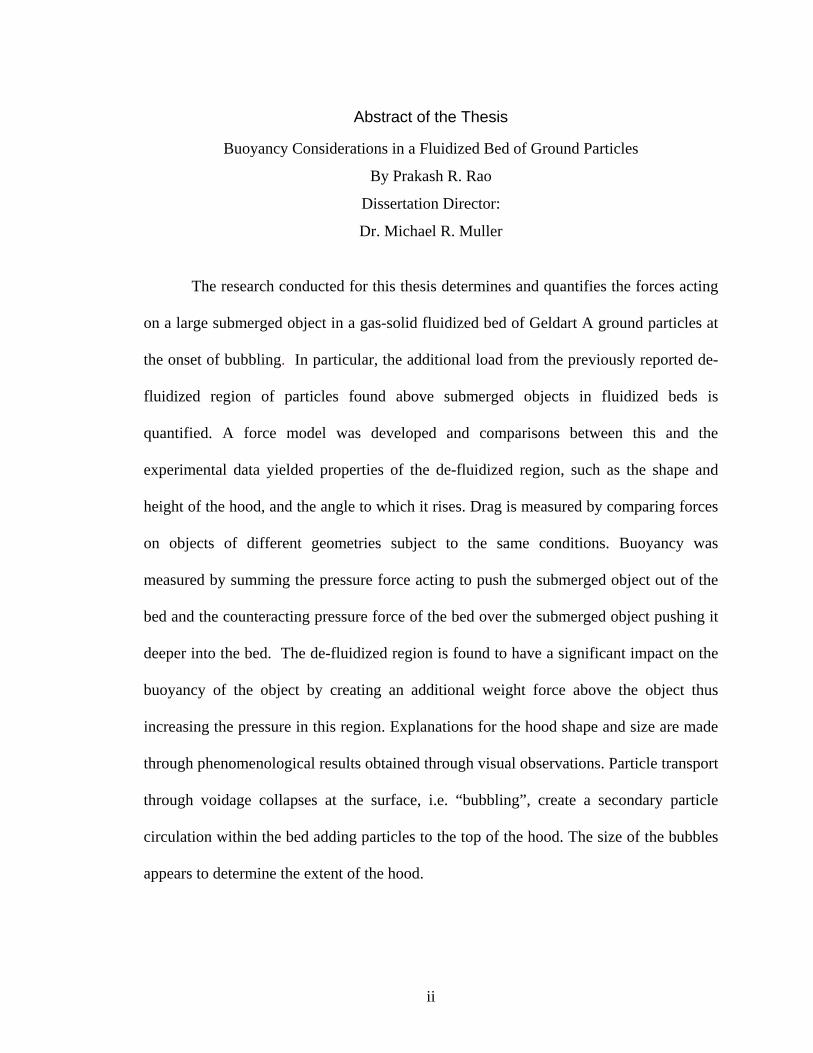
Abstract of the Thesis
Buoyancy Considerations in a Fluidized Bed of Ground Particles
By Prakash R. Rao
Dissertation Director:
Dr. Michael R. Muller
The research conducted for this thesis determines and quantifies the forces acting
on a large submerged object in a gas-solid fluidized bed of Geldart A ground particles at
the onset of bubbling. In particular, the additional load from the previously reported de-
fluidized region of particles found above submerged objects in fluidized beds is
quantified. A force model was developed and comparisons between this and the
experimental data yielded properties of the de-fluidized region, such as the shape and
height of the hood, and the angle to which it rises. Drag is measured by comparing forces
on objects of different geometries subject to the same conditions. Buoyancy was
measured by summing the pressure force acting to push the submerged object out of the
bed and the counteracting pressure force of the bed over the submerged object pushing it
deeper into the bed. The de-fluidized region is found to have a significant impact on the
buoyancy of the object by creating an additional weight force above the object thus
increasing the pressure in this region. Explanations for the hood shape and size are made
through phenomenological results obtained through visual observations. Particle transport
through voidage collapses at the surface, i.e. “bubbling”, create a secondary particle
circulation within the bed adding particles to the top of the hood. The size of the bubbles
appears to determine the extent of the hood.

iii
Acknowledgements First and foremost, I would like to thank my adviser Dr. Michael R. Muller whose
mentoring, efforts, dedication, guidance and patience led to the completion of this thesis.
I would also like to thank John Petrowski for all his help in building my several
experimental set-ups.
I would like to thank the CAES graduate students, Sachin Nimbalkar, Malik Khan, Sara
Salahi, Blake Boyer and Matt Schaefer as well as the CAES staff, Jill Mesonas, Josh
Kace, Mike B. Muller, Don Kasten and Siddika Pasi and the several CAES
undergraduates for all their support and good cheer.
Finally, I give grateful acknowledgment to my family – my lady and wife Simana Rao,
whose support and patience saw me through this work and my parents, Raghavendra and
Srivalli Rao and brother Prashant Rao whose guidance throughout led me here today.

iv
Table of Contents
ABSTRACT OF THE THESIS....................................................................................................................ii ACKNOWLEDGEMENTS........................................................................................................................ iii TABLE OF CONTENTS.............................................................................................................................iv LIST OF FIGURES ......................................................................................................................................v CHAPTER 1 INTRODUCTION .................................................................................................................1
1.1 DEFINITION OF TERMS...........................................................................................................................3 1.2 MOTIVATION FOR RESEARCH ................................................................................................................6 1.3 LITERATURE REVIEW: ...........................................................................................................................7
CHAPTER 2 EXPERIMENTAL SET-UP................................................................................................21 2.1 GENERAL SET-UP ................................................................................................................................22
2.1.1 Fluidized Bed ..............................................................................................................................22
2.1.2 Ground Particles.........................................................................................................................25
2.1.3 Large Submerged Objects...........................................................................................................26
2.2 DETERMINATION OF THE PRESSURE DROP THROUGH THE BED .............................................................27 2.3 BED HEIGHT RISE ASSOCIATED WITH SUBMERSION OF SPHERE.............................................................28 2.4 FORCES ON SUBMERGED OBJECTS IN A FLUIDIZED BED......................................................................33
CHAPTER 3: RESULTS............................................................................................................................38 3.1 DETERMINATION OF PRESSURE DROP THROUGH THE BED...................................................................38 3.3 FORCES ON AN OBJECT SUBMERGED IN A FLUIDIZED BED: ...................................................................44
CHAPTER 4 THEORETICAL MODEL..................................................................................................48 4.1 DETERMINATION OF FORM DRAG........................................................................................................48 4.2 DETERMINATION OF BUOYANT FORCE ................................................................................................51 4.3 SKIN FRICTION DETERMINATION.........................................................................................................54 4.4 DETERMINATION OF DE-FLUIDIZED HOOD WEIGHT AND SHAPE .........................................................60 4.5 SUMMATION OF MODEL FORCES .........................................................................................................65
CHAPTER 5 CONCLUSIONS ..................................................................................................................66 5.1 COMPARISON TO PAST WORK .............................................................................................................66 5.2 DISCUSSION ON HOOD SHAPE..............................................................................................................70
NOMENCLATURE....................................................................................................................................76 REFERENCES............................................................................................................................................78
v
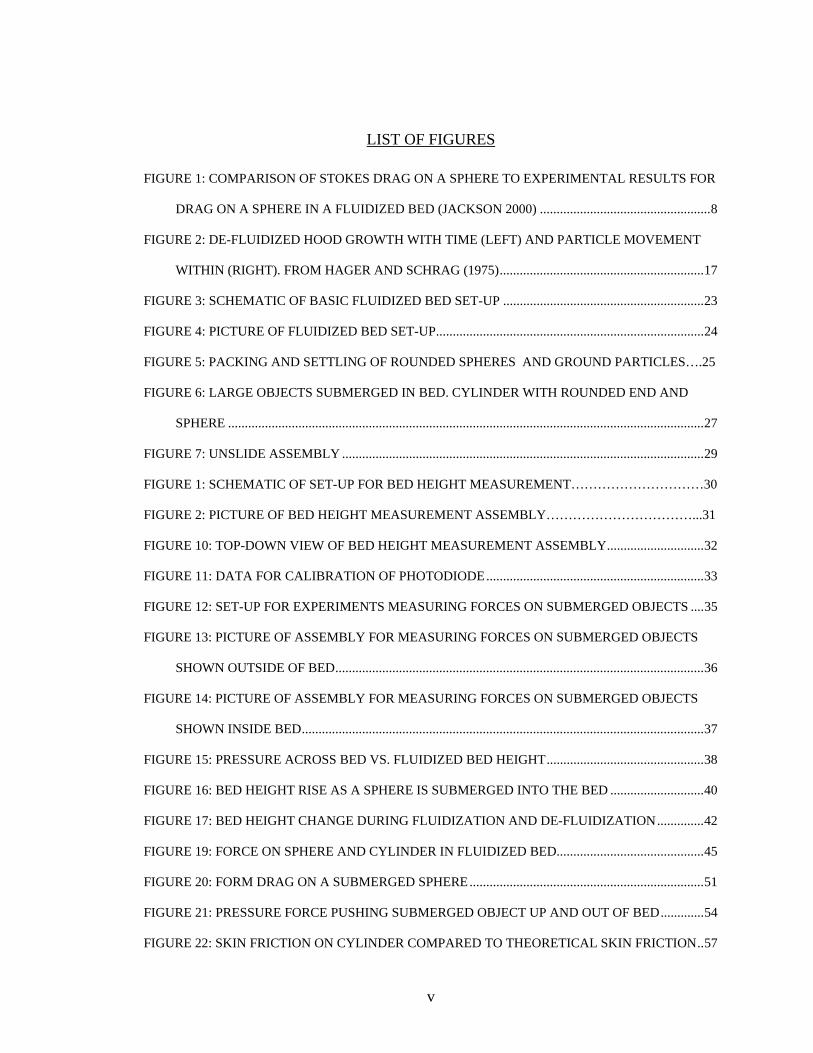
LIST OF FIGURES FIGURE 1: COMPARISON OF STOKES DRAG ON A SPHERE TO EXPERIMENTAL RESULTS FOR
DRAG ON A SPHERE IN A FLUIDIZED BED (JACKSON 2000) ...................................................8
FIGURE 2: DE-FLUIDIZED HOOD GROWTH WITH TIME (LEFT) AND PARTICLE MOVEMENT
WITHIN (RIGHT). FROM HAGER AND SCHRAG (1975).............................................................17
FIGURE 3: SCHEMATIC OF BASIC FLUIDIZED BED SET-UP ............................................................23
FIGURE 4: PICTURE OF FLUIDIZED BED SET-UP................................................................................24
FIGURE 5: PACKING AND SETTLING OF ROUNDED SPHERES AND GROUND PARTICLES….25
FIGURE 6: LARGE OBJECTS SUBMERGED IN BED. CYLINDER WITH ROUNDED END AND
SPHERE ..............................................................................................................................................27
FIGURE 7: UNSLIDE ASSEMBLY ............................................................................................................29
FIGURE 1: SCHEMATIC OF SET-UP FOR BED HEIGHT MEASUREMENT…………………………30
FIGURE 2: PICTURE OF BED HEIGHT MEASUREMENT ASSEMBLY……………………………...31
FIGURE 10: TOP-DOWN VIEW OF BED HEIGHT MEASUREMENT ASSEMBLY.............................32
FIGURE 11: DATA FOR CALIBRATION OF PHOTODIODE.................................................................33
FIGURE 12: SET-UP FOR EXPERIMENTS MEASURING FORCES ON SUBMERGED OBJECTS ....35
FIGURE 13: PICTURE OF ASSEMBLY FOR MEASURING FORCES ON SUBMERGED OBJECTS
SHOWN OUTSIDE OF BED..............................................................................................................36
FIGURE 14: PICTURE OF ASSEMBLY FOR MEASURING FORCES ON SUBMERGED OBJECTS
SHOWN INSIDE BED........................................................................................................................37
FIGURE 15: PRESSURE ACROSS BED VS. FLUIDIZED BED HEIGHT...............................................38
FIGURE 16: BED HEIGHT RISE AS A SPHERE IS SUBMERGED INTO THE BED ............................40
FIGURE 17: BED HEIGHT CHANGE DURING FLUIDIZATION AND DE-FLUIDIZATION..............42
FIGURE 19: FORCE ON SPHERE AND CYLINDER IN FLUIDIZED BED............................................45
FIGURE 20: FORM DRAG ON A SUBMERGED SPHERE......................................................................51
FIGURE 21: PRESSURE FORCE PUSHING SUBMERGED OBJECT UP AND OUT OF BED.............54
FIGURE 22: SKIN FRICTION ON CYLINDER COMPARED TO THEORETICAL SKIN FRICTION..57

vi
FIGURE 23: PREDICTED FORCE ON CYLINDER COMPARED TO EXPERIMENTAL FORCE .......58
FIGURE 24: PREDICTION OF SKIN FRICTION ON SPHERE AT 1.5UMF FLOW ..............................59
FIGURE 25: 10TH DEGREE POLYNOMIAL TREND LINE FIT TO AVERAGE DATA FOR 1.5 UMF
SPHERE ..............................................................................................................................................61
FIGURE 26: FORCE FROM ABOVE ON SPHERE ...................................................................................62
FIGURE 27: HOOD SHAPE EXTRACTED FROM HOOD WEIGHT DATA ..........................................64
FIGURE 28: COMPARISON OF MODEL TO DATA FOR 1.5 UMF FLOW SPHERE CASE ................65
FIGURE 29: COMPARISON OF HOOD SHAPES.....................................................................................67
FIGURE 30: COMPARISON OF MODEL TO GRACE AND HOSNEY FOR 1.5 UMF CASE ...............70
FIGURE 31: HOOD AT 1R, 2R, 2.94R, 3.34R, 3.61R, 4.16R.. ...................................................................72
FIGURE 32: DIAGRAM OF THE SECONDARY CIRCULATION LEADING THE DE-FLUIDIZED
HOOD GROWTH. ..............................................................................................................................74

1
Chapter 1 Introduction
A fluidized bed is a quasi-fluid made up of particles suspended by an upward flow of gas.
Fluidization deviates from percolation in that that fluid flow is sufficient enough to match
the particles terminal velocity, whereas in percolation the bed remains unmoved and the
air flows through interstitial space. Fluidized beds are created using cylindrical chambers
that hold a granular medium with an air flow passing through a perforated sheet and
rising through the medium. If there is an obstruction to the gas flow within the bed, such
as heat exchanger tubes or bubbles, then there is a tendency for a stagnant, dead region of
particles to form above these obstructions. This region can have a significant impact on
heat transfer coefficients (in the case of heat exchanger tubes), bubble rise time (in the
case of bubbles) and in general the apparent buoyancy of submerged objects. The goals
of the thesis are to experimentally determine the weight, size and shape of the stagnant
region, henceforth referred to as the “de-fluidized hood”.
Fluidized beds are not a new technology but have been studied and used for coal
combustion and particle drying since the 1940s. Fluidized beds represent a clean method
of burning coal efficiently. The particles are small enough to be suspended, thus exposing
more surface area than a lump of coal, but large enough such that they can be treated as a
lumped mass. The particles effectively act as a thermal mass keeping the fluidized bed
combustion chamber at a uniform temperature. This allows the operator to run the bed at
lower temperatures than those seen in pulverized coal plants. Fluidized bed temperatures
are on the order of 7000 C - 8000 C. This is below the temperature at which thermal NOx
forms. Additionally, limestone can easily be added to the fluidized coal particles to

2
remove SOx gases from the exhaust. The result of combining the limestone with SOx is
gypsum, which is a profitable by-product.
Due to static electric forces within the bed, particles can be drawn together and form
loose bonds [Mehrani 2004]. They can agglomerate thus reducing the particles capacity
to act as a thermal mass, in addition to altering the conditions under which the bed will
fluidize. The result is a fluidized bed operating under suboptimal conditions. A ‘mixer’
that could mechanically break up these agglomerations would reduce the negative effects
of particle agglomeration.
The agglomeration of particles is one manner in which a fluidized bed differs from a
fluid. However, in many other ways, the bed will behave like a fluid. For example, if the
bed is stirred with a pole, the pole will meet negligible resistance, akin to the resistance
felt when stirring a pot of water. Similarly, if the bed is tilted, the surface will remain
parallel to the floor and even. Likewise, an object denser than the fluid should sink, while
an object less dense should sit at the surface.
The last point, however, is a source of peculiarity. Some objects of a density slightly less
than that of the bed, if placed at the bottom of the bed will remain at the bottom of the
bed. If the same object is placed on the surface of the bed, it will stay at the surface.
In an attempt to create an object that could break up agglomerates in a fluidized bed, it
was hypothesized that an object of a density equivalent to that of the bed could be moved

3
up and down within the bed by changing the flow rate of gas to the bed thus altering the
buoyant force on the object. A decrease in flow rate would increase the density of the
bed, thus pushing the object towards the surface. Increasing the flow rate would do the
opposite and decrease the density of the bed, thus pushing the object to the bottom of the
bed. However, the hypothesis failed as objects that should float based on this idea did not
float but rather sank. Thus, buoyancy was not the only force acting on the object. Upon
further investigation, the role of the de-fluidized hood of settled particles accumulating
above the object was found to be significant. It was altering the effect of buoyancy on
submerged objects in fluidized beds by adding an additional mass to the object, and by
changing the density of the fluid above the object.
This thesis aims to identify the forces experienced by large objects within a fluidized bed
of ground particles, with a particular focus on the de-fluidized hood. Not only will an
understanding of these forces lead to the creation of a mixer that can break agglomerates
within the bed, it can also be used to help understand the motion of bubbles in a fluidized
bed and the decrease in heat transfer coefficients for regions above heat exchanger tubes
within a fluidized bed.
1.1 Definition of Terms
This section will serve to provide a short understanding of the relevant basic terms used
in this thesis when discussing fluidized beds.

4
Initially, the fluidized bed is filled with sand (in this case, alumina oxide) with the air
supply to the bed turned off. The height to which the sand fills the bed is referred to as
the ‘dead bed height’ – with the term dead bed used to refer to the fluidized bed with less
flow than that required to fluidize the sand.
As air is introduced to the bed, the bed of sand will slowly rise. It will first rise relatively
calmly and the surface will remain flat. In order for the bed to fluidize, the flow rate must
be sufficient enough to provide a pressure drop adequate to support the weight of the bed.
This pressure can be expressed as (Howard 1989):
gA
Mp gpp
b )( ρρρ
−=Δ
Equation 1
Where pb is the pressure drop through the bed, M is the mass of the particles, ρp is the
density of the particles, ρg is the density of the gas, and g is the acceleration due to
gravity.
The velocity at which the pressure drop condition is met is known as the ‘minimum
fluidization velocity’. At this point, the particles ‘interstitial distance’, or the distance
between each particle, will be at its final value. The term voidage, designated by the
symbol ε, is used to describe the amount of gas within the total volume of the fluidized
bed. The height to which the bed rises is referred to as the bed height. Any additionally
flow will not increase the voidage or the bed height. Rather, increasing the flow beyond
the minimum fluidization velocity will cause ‘bubbling’, or the escape of excess gas from

5
the bed through voids. At this point the bed surface will no longer behave calmly, but will
resemble a pot of boiling water. If the flow rate is increased past that required for
bubbling, the phenomenon of ‘slugging’ will occur, which is essentially large scale
bubbling where the bubbles grow to have the same diameter as the bed.
Increasing the flow rate further will spew sand particles out of the bed. Operating the bed
under conditions beyond gentle bubbling is of no value in the present work as the bed is
far too unsteady for any valuable measurements to be made.
Upon collapsing at the surface, the bubbles release particles entrained in its wake. These
particles are released towards the walls of the bed chamber. At the chamber walls, the gas
velocity is zero due to the no-slip boundary condition at the wall. Therefore, particles at
the wall, having no supporting force from the air, down-well to the bottom of the bed. At
the bottom, they are re-entrained in the bubble path and travel back to the bed surface
only to repeat their journey. This leads to a circulation of particles within a fluidized bed
that is a key mechanism of particle mixing within a bed.
As is evident, in order for fluidization to exist, the flow must be allowed to pass through
the sand. Any obstruction to the flow that would bring the flow locally to a value less
than the minimum fluidization velocity would create a region of de-fluidization. This de-
fluidized region will act as a packed bed, or dead bed.
6
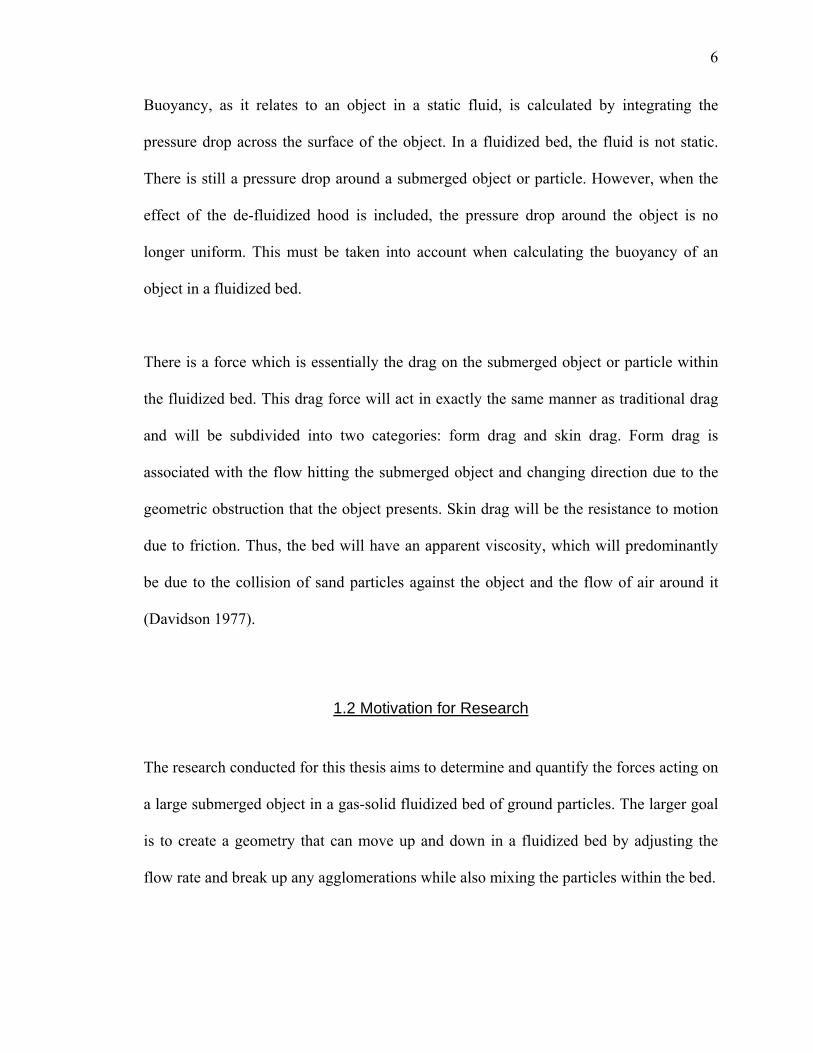
Buoyancy, as it relates to an object in a static fluid, is calculated by integrating the
pressure drop across the surface of the object. In a fluidized bed, the fluid is not static.
There is still a pressure drop around a submerged object or particle. However, when the
effect of the de-fluidized hood is included, the pressure drop around the object is no
longer uniform. This must be taken into account when calculating the buoyancy of an
object in a fluidized bed.
There is a force which is essentially the drag on the submerged object or particle within
the fluidized bed. This drag force will act in exactly the same manner as traditional drag
and will be subdivided into two categories: form drag and skin drag. Form drag is
associated with the flow hitting the submerged object and changing direction due to the
geometric obstruction that the object presents. Skin drag will be the resistance to motion
due to friction. Thus, the bed will have an apparent viscosity, which will predominantly
be due to the collision of sand particles against the object and the flow of air around it
(Davidson 1977).
1.2 Motivation for Research
The research conducted for this thesis aims to determine and quantify the forces acting on
a large submerged object in a gas-solid fluidized bed of ground particles. The larger goal
is to create a geometry that can move up and down in a fluidized bed by adjusting the
flow rate and break up any agglomerations while also mixing the particles within the bed.

7
Many studies have been conducted concerning forces on objects within a fluidized bed.
However, these works differ from the current work because they used perfectly spherical
particles, they did not take into account the de-fluidized hood, they used a rectangular
two dimensional bed, they operated the bed at higher flow rates, or they studied forces on
particles of equal size as the fluidizing medium.
Unlike in past works, experimental results will directly be used to calculate aspects of the
hood. These properties include the approximate position along the submerged object at
which the hood begins, the weight of the hood, the shape and height of the hood, and the
angle to which it rises.
The present work will hopefully shed more light on the nature of the de-fluidized hood as
there is limited available work on this topic. The current work hopes to enable future
researchers to better grasp the interactions between the fluidized medium and large
objects within the beds.
1.3 Literature Review:
Drag on particles in a fluidized bed has been well discussed in the literature. The most
common treatment for beds under low Reynolds number flows has been to look at the
well documented Stokes Drag on a sphere, where, for Re < 1, the drag coefficient, CD,
can be estimated as:

8
Re24
=DC
Equation 2
However, experimental data from studies on drag coefficients shows that the above does
not match well. In Crowe et al (1998) the data is summarized and compared to the
standard drag curve. This has been reprinted in Figure 3. The lines resembling scratches
are data points from previous researchers’ work.
Figure 3: Comparison of Stokes Drag on a sphere to experimental results for drag on a sphere in a fluidized bed (Jackson 2000)
A correction for drag coefficient, f, for a particle under steady state has been given:
24Re rDC
f =
Equation 3
where Rer is the Reynolds number based on the relative velocity of the gas to the
particles.
9
Clift and Gauvin (1970) give the following relation for f over the entire subcritical Re
range:
116.14687.0 )Re1025.41(Re0175.0Re15.01 −−×+++= rrrf
Equation 4
Other expressions for f have been made by other researchers. For example, Mostoufi and
Chaouki (1999) studied a liquid solid fluidized bed and assumed the following for f:
mf −= ε
Equation 5
The assumption here, which has been validated by others as will be described below, is
that the drag will be heavily dependent on the bed voidage, where ε is the bed voidage.
Through experimentation, an expression for the variable m was given:
40.033.022.0 )(Re02.3s
m
dd
Arm −=
Equation 6
Where dm is the particle diameter and ds is the diameter of a particle with the same
surface area as the actual particle. Here, they have expressed the drag coefficient as a
function of both the particle Archimedes number and Reynolds number.
When discussing drag in a fluidized bed, an understanding of viscosity within a fluidized
bed is necessary. Liu et al (1960) stirred a paddle in a fluidized bed of glass beads in an

10
attempt to measure the apparent viscosity of a gas-solid fluidized system. His results
showed that viscosity would decrease as the gas flow rate was increased. He attributes
this to particle number density. With low flow rates, the paddle would have to stir
through more particles than it would at higher flow rates since the bed is less fluidized.
This result is intuitive; a dense fluid is harder to stir through compared to a less dense
fluid. Batchelor (1988) states the same conclusion; that the apparent viscosity will change
with flow rate.
Davidson et al (1977) studied bubble rise in fluidized beds. The scenario is similar to the
current study in that there is a large object – in the case of Davidson a void of air and in
the present case a submerged sphere – experiencing forces from a fluidized bed. The
chief difference is of course that the bubbles are in motion whereas the sphere is fixed.
Davidson et al argued that traditional viscosity does not affect bubble rise in fluidized
beds. However, he continues, data demonstrates the obvious existence of an apparent
viscosity of a fluidized bed caused by particle collision from the dense phase on to other
objects. He proposed that an average viscosity over all types of fluidizing mediums could
be taken as being 1 kg/m-sec.
Buoyancy within a fluidized bed has been discussed at length in the literature as well but
with ambiguity, as discussed by Jackson in 2000. He defines a force f, which is the
average value of the force on a fluid by a particle in the fluid. For a fluid at rest, this force
is:

11
gf VpV fρ=∇= Equation 7
Where V is the volume of the object immersed in the fluid, ∇ p is the pressure gradient,
ρf is the density of the fluidized bed and g is the acceleration due to gravity. The right
hand side of the above equation is a statement of Archimedes principle, where the
buoyant force is equivalent to the weight of the displace fluid. The right hand side is also
equal to the integral of the pressure over the surface of an object submerged in a liquid.
Jackson continues modifying the conditions of the above equation and ultimately
describes the situation found in a fluidized bed where there is a flow through a uniform
bed of particles with voidage ε. The fluid is subject to an acceleration a, which is defined
as du/dt where u is the fluid velocity. The accelerating fluid exerts a force on the
immersed object. As Jackson explains, the ambiguity in defining buoyancy arises in the
treatment of the force contribution by the accelerating fluid; it can either be lumped
together with the buoyant force or it can be treated as a separate force onto itself.
Furthermore, greater debate in the calculation of buoyancy arises concerning the density
to be used in calculations. As Jackson explains, the bulk density, denoted here as the
density of the fluidized bed, should be used rather than the fluid density if: 1) the weight
of the particles is fully supported by the fluid flow and 2) the fluid is at rest or in uniform
motion. The usage of the bulk density is not valid if either condition is not met. Mostoufi
and Chaouki (1999) also summarize these arguments and state that one side believes the

12
bulk density should be used for all cases while the other side believes that bulk density
should only be used when the particles are much smaller than the submerged object.
Batchelor (1988) clarifies the above. In developing the force balance for particles in a
fluidized bed, he states that buoyancy is strictly the mean force exerted by particles on the
fluid. However, for the sake of simplicity, he includes it in a term meant to represent the
mean force on particles by gravity. Thus, he states the gravity force as:
∫=2
1
~x
x
ndxgAMg
Equation 8
Where A is the cross sectional area of the bed, M is the mass of the particles, n is the
particle number density and the limits of integration represent the positions of the upper
and lower surfaces of the fluidized bed cylinder. The gravitational acceleration, g~ , is:
p
gpggρρρ −
=~
Equation 9
Where ρp is the density of the particles, ρg is the density of the gas and g is the standard
gravitational acceleration. The correction to the acceleration is used to account for the
buoyant force.
Howard (1989) shows that the velocity at which particles will fluidize is based on the
buoyant force. He rewrites the commonly used Ergun Equation, which provides a relation

13
for the pressure drop through a fluidized bed, in non-dimensional terms and solves for the
Archimedes number, a non dimensional number that is essentially a balance between the
buoyant forces to the viscous forces. The Ergun Equation is as follows:
m
f
m
fb
dU
dU
Lp
ϕρ
εε
ϕμ
εε 2
222
2 )1(75.1)(
)1(150 −+
−=
Δ
Equation 10
Where Δpb is the pressure drop through the bed, L is the bed height, ε is the bed voidage,
μf is the fluid viscosity, U is the fluidization velocity, φ is the spherecity which is the
ratio of the surface area of a sphere of the same volume as the particle to the surface area
of the particle, ρf is the density of the fluidized bed and dm is the mean particle diameter.
Howard non-dimensionalizes Equation 10 and rewrites it at the minimum fluidization
velocity as
2332
Re75.1Re)1(
150 mfmf
mfmf
mfArϕεεϕ
ε+
−=
Equation 11
Where Ar is the Archimedes number:
2
3)(
f
mfpf gdAr
μ
ρρρ −=
Equation 12
And Remf is the Reynolds number at the minimum fluidization velocity:

14
f
mmffmf
dUμ
ρ=Re
Equation 13
With this, the Archimedes number, which is a measure of magnitude of the buoyant
forces, is expressed in terms of the Remf. The velocity at which Equation 11 is met will
fluidize the bed. Therefore, the minimum fluidization velocity is dependent on the
buoyant force on the particles.
The previous discussions on buoyancy dealt with it on theoretical terms. Many
researchers have tried to experimentally measure the buoyant forces in a fluidized bed.
Grace and Hosney in 1985 investigated the forces on horizontal tubes in a fluidized bed
of spherical and non-spherical objects as bubbles passed by the tubes. The tubes were
attached to the bed by two strain gauges at either end. The researchers were interested in
discerning the effects of superficial gas velocity, static bed height, particle diameter,
particle density, tube diameter and tube shape on the vertical forces on tubes. The
conclusions reached are that the buoyant force at times when bubbles are not present is
very nearly approximated by Archimedes Principle, but corrected by:
gVF mfsB )1(7.0 ερ −= Equation 14
Where FB is the buoyant force, ρs is the density of the dead bed, εmf is the voidage at the
minimum fluidization velocity and V is the displaced volume. Grace and Hosney
attribute the factor of 0.7 “to the tendency for a ‘stagnant cap’ of particles to form on top
of an immersed tube”. The coefficient of 0.7 was developed experimentally.

15
Additional studies on the apparent buoyancy of large spheres at several locations in
fluidized beds were carried out by Oshitani et al (2000). The fluidizing medium was
spherical glass beads. Their goal was to measure local particle flow velocities by
measuring the buoyancy of a submerged object at different locations. Their experimental
set-up was very similar to that of the present work, as will be explained later. However,
they did not consider the effect of the de-fluidized region above the sphere, as mentioned
by Grace and Hosney, and others (to be described forthcoming). Oshitani et al used the
following relation to determine the buoyancy:
Apparent Buoyant Force = |weight of sphere in atmosphere – weight of sphere in bed| /
weight of sphere in atmosphere
Equation 15
Their results showed marked variation in apparent buoyancy and thus flow velocity as
particle size, superficial gas velocity and bed height are increased. Therefore, it can be
assumed that the apparent buoyancy is a function of the studied parameters.
In relating buoyant forces to gas velocity, as Oshitani does, it may be pertinent to review
the work of Tee et al (2007). Here, it has been shown that velocity fluctuations can be
observed throughout a fluidized bed and can be attributed to density differences within a
bed. Tee et al hypothesize that this is due to polydispersity of the particles. As studied by
many researchers (Qiaoqun et al (2004), Marzochella et al (2000), Huilin et al (2003),
Gilbertson et al (2001), Asif (1997)), particles in a fluidized bed will segregate based on
their density differences with the denser particles settling to the bottom and less dense

16
particles rising to the top. If the particles are all of the same density but of different sizes,
then, based on the mass of the particles, the smaller particles will be located at the top of
the bed and the larger ones at the bottom of the bed. In the work of Tee et al, the
velocities of the interstitial flow vary because fluidization velocities will be dependent on
the density of the particles. He argued that the velocity fluctuations arise due to the
particles trying to regain the balance between buoyancy (which is density dependent) and
drag (which is velocity dependent). Implicit in this argument is the idea that the only two
forces acting on a particle are buoyancy and drag.
The final force exerted on a submerged object by the fluidized bed will be that of the de-
fluidized region. As stated by Grace and Hosney, a “stagnant cap” of particles sat on top
of their tubes within the fluidized bed. Many researchers had previously studied the flow
patterns and forces on objects immersed in a gas-solid fluidized bed.
Glass and Harrison (1964) studied the flow around solid obstacles in a fluidized bed. The
fluidized bed was comprised of sand and the gas velocity was held to 2-3 times that of
minimum fluidization. Their findings showed three regions of flow around the object: 1)
an area of air immediately below the object 2) a seemingly de-fluidized region above the
sphere and 3) chains of bubbles at the sides of the obstacle. They state that the de-
fluidized region would most likely disappear at high gas flow rates.
Hager and Schrag (1975) studied the de-fluidized hood on fixed cylinders in a rectangular
fluidized bed of uniform glass beads. The goal was to take photographs of the hood and

17
determine the particle motion within the hood. This was done by using tinted beads to
initially form the cap and then tracking the tinted beads over time. The bed was fluidized
under bubbling conditions. The resulting hood shape and growth with time is shown in
Figure 4.
As one can see, the work of Hager and Schrag indicates that the hood is similar in size to
a cone with a wide and rounded top (image on left of Figure 4). Also visible is the motion
of the top layer of the hood. Over time it erodes until it is all but gone. However, as is
evident from the image on right of Figure 4, the initial cap is replaced and “overturns”,
meaning that new particles replace the previous particles. This leads to a constant hood
shape. Thus, they report a secondary flow pattern within the bed causing particles to
move inward toward the center of the bed. This would appear to be the mechanism by
which the hood is sustained.
Figure 4: De-fluidized hood growth with time (left) and particle movement within (right). From Hager and Schrag (1975)

18
Hager and Schrag, based on their visual, found the ratio of the hood height to the object
diameter to be 0.80. Other researchers reported values of 1 to 4, but these works did not
have the benefit of tracking the hood.
Kulkarni (1986) also reported the same de-fluidized region. He looked at tubes immersed
in a rectangular fluidized bed of spherical glass beads with air as the fluidizing gas. His
objective was to study time averaged characteristics of properties of the hood such as
height and its relation to fluidizing gas velocities and particle size using long exposure
still photography. His photographs confirmed the existence of the de-fluidized hood. He
also confirms the gap of air, as reported by Glass and Harrison, below the object. From
his estimations of the hood height, Kulkarni proposes that the height of the hood is
related to the fluidizing velocity by:
035.1)(489.0mf
hood
UU
dH
=
Equation 16
With Hhood being the hood height, d being the diameter of the immersed object, U being
the gas velocity and Umf being the minimum fluidization velocity. The height of the hood
decreases with increasing minimum fluidization velocity.
Additionally, A.C. Rees et al (2004) studied the rise of spheres in fluidized beds with air
as the fluidizing medium. The bed was fluidized such that it was bubbling or slugging.
Ress et al found that the spheres rose faster when subjected to higher gas velocities.
Peculiarities were observed in that objects that were expected to rise based upon the

19
predicted density difference between the object and the fluidizing medium would sink.
Furthermore, rise velocities were lower than the predicted rise velocities. These
phenomena were attributed to the presence of the de-fluidized region above the spheres.
Shapes and relations for the dimensions of the hood were derived assuming Stokes’ flow.
Rees et al concludes that the rise of buoyant objects in a fluidized bed can be predicted
using Stokes’s Law for a sphere moving in a viscous liquid.
Rees et al assumed the shape of the de-fluidized hood was that of a cylinder with a
rounded end. The height of the hood was correlated to be:
2d
dV 42SPHERE
HOOD +=
πhoodH
Equation 17
where VHOOD is the volume of the hood and d is the diameter of the sphere. The volume
of the hood was not directly calculated by Rees, but rather it was inferred from other
calculations, such as relations he has given for the minimum fluidization velocity, total
volume of the particle, shape factors proposed by Bowen and Masliyah (1973), and wall
correction factors proposed by Perry and Green (1998). His relation for the minimum
fluidization velocity is:
dkgVol
Umff
wpmfgtmf
)(
)(
3)(
πμρρ
Δ
−=
Equation 18

20
Where Volt is the total volume of the particle and hood, kw is the wall correction factor,
and Δ is a shape correction factor for the total particle. Rees et al provide relations for all
of the unknowns in Equation 18 except μf(mf), the viscosity at minimum fluidization, and
the volume of the hood, which, along with the volume of the submerged object, make up
Volt. By taking two sets of data points, Rees et al can solve for these two unknowns. He
finds the viscosity to be 0.66 Pa-s, which is in good agreement with the value proposed
by Davidson (1977) and he finds that the hood height can be scaled with the diameter of
the immersed object, as proposed by Hager and Schrag.
Rees, et al (2007) also took previous data from Daniels 1959 of falling spheres in a
fluidized bed, introduced the concept of the de-fluidized hood and found good agreement
between experimental data and theory for calculating apparent viscosities of a fluidized
bed.
21
Chapter 2 Experimental Set-Up
Experiments were run to determine the pressure drop across the fluidized bed, the bed
height increase due to the submersion of the sphere into the bath, the forces exerted on
the sphere by the fluidized medium at different vertical positions within the bed, and the
forces exerted on a cylinder with a rounded end at different vertical positions within the
bed.
The basic experimental set-up consisted of a fluidized bed provided by the Techne
Corporation. Air was fed using compressed air provided by Rutgers University. The
volume flow rate of air and pressure were regulated through use of a rotameter and a
pressure regulator respectively. Ground alumina oxide particles of Geldart A size were
used as the fluidizing medium. Fluidization was maintained above the minimum
fluidization velocity and at the onset of bubbling. This level was visually determined.
The pressure drop across the bed was calculated by measuring the increase in pressure as
more alumina oxide was added to the bed. The increase in bed height due to the
submersion of the sphere in the fluidized bath was measured using a photodiode with a
strong light source and outputted to Labview software. The forces exerted by the
fluidized bath on the sphere were determined by weighing the sphere as it was slowly
submerged into the bed using a measuring system constructed out of two scales and a
support beam. The forces exerted by the fluidized bath on a cylinder with a rounded end
22
were measured using the same scale apparatus used for measuring the forces on the
sphere. A detailed explanation of all the components of the experiments follows.
2.1 General Set-up
2.1.1 Fluidized Bed
The fluidized bed, an FB-08 Fluidized Calibration Bath provided by the Techne
Corporation, is made of stainless steel and has an inside diameter of 23 cm and height of
43.2 cm. The bed was oriented vertically and open to the atmosphere at the top. Air was
fed into a plenum chamber through a 1/8” inlet. The inlet was located at the wall and air
was injected into the plenum in the radial direction. The plenum was approximately 3.5
cm high. The plenum chamber buffered the air flow and dispersed it evenly through a
perforated plate with holes less than 45 microns. Above the perforated plate was the
fluidized medium.
The compressed air was provided by Rutgers University and was set at 85 psi. A valve
first dropped the pressure to around 1 psi. The compressed air was then further regulated
by a rotameter. The rotameter is essentially a valve with a maximum volume flow rate of
40 scfh. It could be set through the use of a dial that would open or close the valve. The
instrument read out in percents of 40 scfh. A pressure gauge was located after the
rotameter and before the air inlet to the fluidized bed. For the present experiments, the
valve was opened one turn and air was turned on such that the rotameter read 100%. This
23
corresponded to a pressure of 0.79 psig and a flow rate of 40 scfh. Now the valve would
be reduced to the desired flow rate. Setting the flow rate in this manner guaranteed that
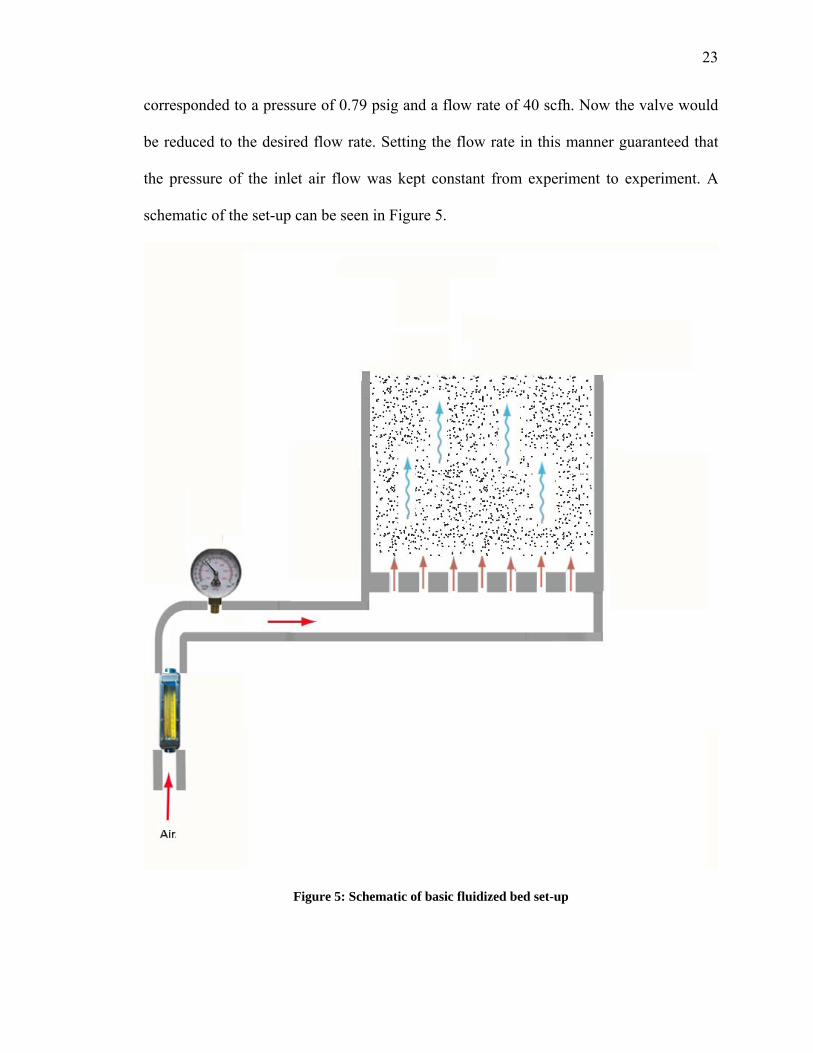
the pressure of the inlet air flow was kept constant from experiment to experiment. A
schematic of the set-up can be seen in Figure 5.
Figure 5: Schematic of basic fluidized bed set-up

24
A picture of the basic set-up can be seen inError! Reference source not found. Figure 4.
Figure 6: Picture of fluidized bed set-up

25
2.1.2 Ground Particles
Ground alumina oxide (ranging in diameters from 45 to 125 microns) with a density of
963.1 kg/m3 was used as the fluidizing medium. The particles were thus of Geldart size
A. The bed was filled with enough alumina oxide such that the aspect ratio (ratio of
height of the fluidized bed at incipient fluidization to the diameter of the bed) was kept at
1. This corresponded to 7.98 kg of sand. Ground particles rather than perfectly round
ones were used in order to simulate the shape of particles commonly used in fluidized
beds in industry. One difference between ground and round particles is the manner in
which they settle or pack. Round particles will eventually settle in a uniform fashion with
each particle touching four other particles at one contact point per adjacent particle.
Ground particles will settle in an unpredictable fashion. This will make the interstitial
distances between particles different locally, whereas the distance between adjacent
spherical particles will be the same for all particles. Figure 5 has been provided to clarify
this point:
Figure 7: Packing and settling of rounded spheres (left) and ground particles (right)

26
Another difference between ground and round particles is the manner in which the flow
moves around the particles. Ideally, the flow around each round particle should be the
same whereas with ground particles, since no two particles are alike, the flow around
each will be different.
Additionally, particles of different sizes were used. This allows for stratification of
particles, as is commonly seen in industrial applications. Big particles will reside at the
bottom of the bed while small particles will reside at the top. Although not studied in the
present work and as previously stated, it has been hypothesized that stratification leads to
variations in flow rate along the vertical axis of the bed and thus variations in bed density
(Tee et al 2007). Density has a large roll in the forces exerted on submerged objects in
fluidized beds. Using particles of varying sizes and shapes will better mimic real
fluidized bed operating conditions.
2.1.3 Large Submerged Objects
A hard, hollow plastic sphere of radius RSPHERE = 4.775 cm with negligible wall thickness
was used as the large object submerged in the bed. The sphere had an approximately
1/16” hole made during its manufacturing. The hole was used to stake the sphere and
attach it to various instruments that would move the sphere a measurable distance
vertically. The sphere weighed 36 grams.
27
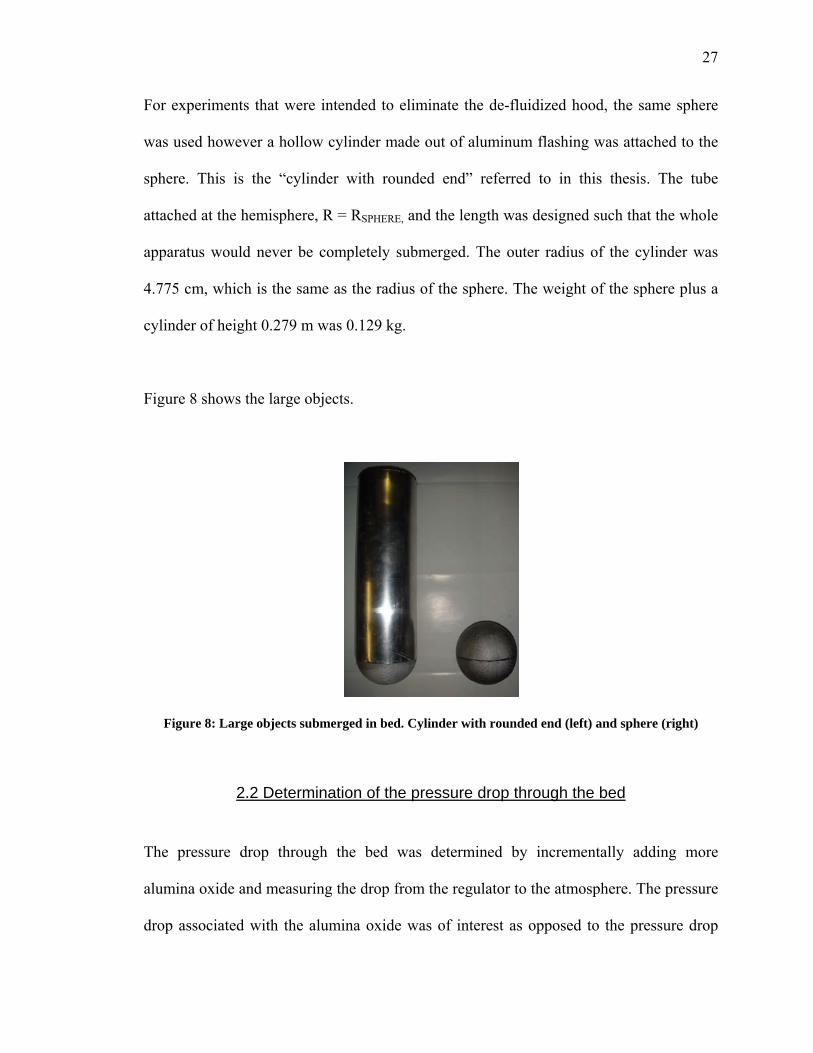
For experiments that were intended to eliminate the de-fluidized hood, the same sphere
was used however a hollow cylinder made out of aluminum flashing was attached to the
sphere. This is the “cylinder with rounded end” referred to in this thesis. The tube
attached at the hemisphere, R = RSPHERE, and the length was designed such that the whole
apparatus would never be completely submerged. The outer radius of the cylinder was
4.775 cm, which is the same as the radius of the sphere. The weight of the sphere plus a
cylinder of height 0.279 m was 0.129 kg.
Figure 8 shows the large objects.
Figure 8: Large objects submerged in bed. Cylinder with rounded end (left) and sphere (right)
2.2 Determination of the pressure drop through the bed
The pressure drop through the bed was determined by incrementally adding more
alumina oxide and measuring the drop from the regulator to the atmosphere. The pressure
drop associated with the alumina oxide was of interest as opposed to the pressure drop

28
associated with the plenum and perforated sheet. In order to determine the pressure drop
through the sand, dP/dz, the pressure drop was measured first while there was no sand in
the bed with the flow rate set to 24 scfh. This provided the pressure drop associated with
the plenum and the perforated plate. Next, the flow was shut off and a volume of sand
was added. The flow was turned back on to the same flow rate as before and the pressure
drop was measured again. This was repeated until several measurements were recorded.
By subtracting out the pressure drop associated with the plenum and the perforated plate
from the total pressure, the pressure drop through the sand could be determined. Taking
this value and dividing by the bed height yielded dP/dz. The pressure drop through the
sand was used to calculate the upwards component of the buoyant force exerted on the
sphere.
2.3 Bed height rise associated with submersion of sphere
For the experiments measuring the bed height, the sphere was attached to a Unislide
above the bed. The Unislide is an off the shelf product sold by Velmex Inc. It is made of
a fixed block marked with a ruler and sliding block. The fixed block has a threaded rod
that spans the block’s length. Attached to this rod is the sliding block. The threaded rod is
attached to a knob that when turned moves the sliding block along the fixed block (refer
to Figure 9 for clarity). The displacement of the sliding block can be measured against the
ruler marks on the fixed block. In order to tailor the Unislide for the purposes of the
present work, another block was added to the sliding block on the Unislide. The attached
block had a hole with a set screw. One end of a stake was inserted into the sphere
opening and the other end was placed through the hole on the block and tightened with

29
the set screw, thus fixing it to the Unislide. The Unislide was attached to the fluidized bed
by bolting it onto the outer rim of the bed, such that the slide would move vertically up
and down into and out of the bed. It was positioned such that the sphere aligned with the
center of the bed. Thus, the sphere could be moved along the vertical axis of the bed by
turning a knob. The ruler on the Unislide was subdivided into increments of 0.0254 cm.
The slide was moved slowly so that the sphere could be held in place at different vertical
positions along the bed.
Figure 9: Unslide assembly
Sphere
Unislide
Knob for moving unislide
30
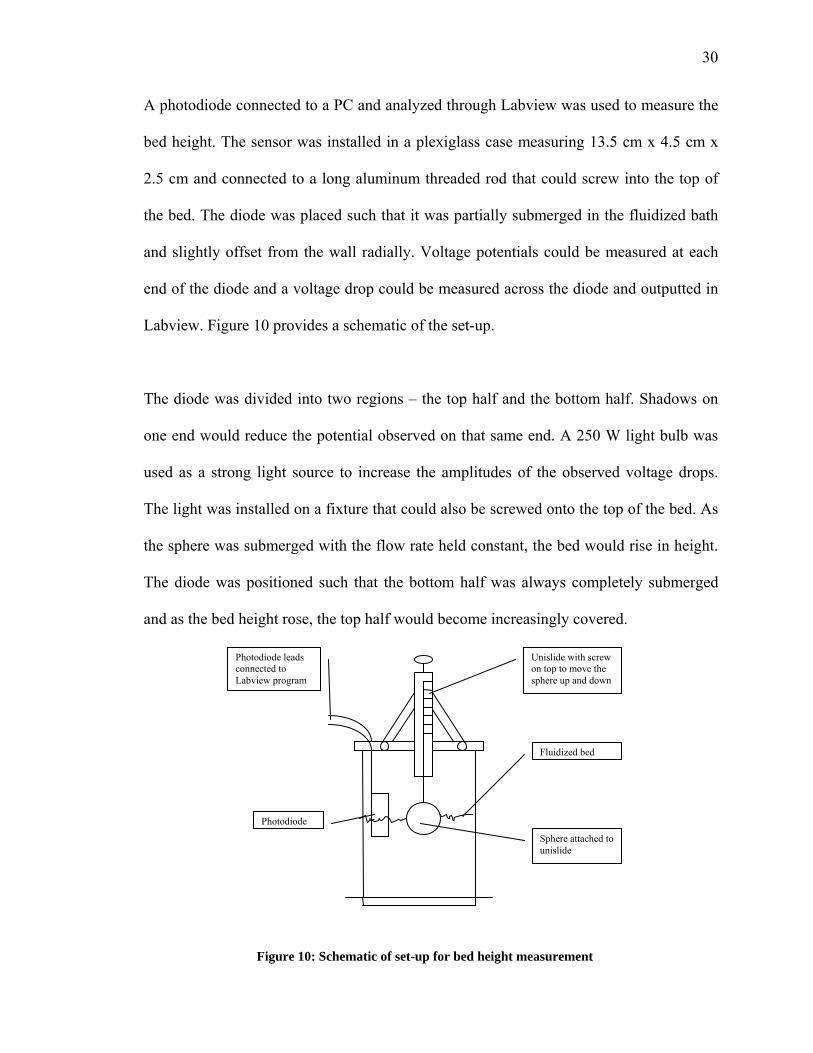
A photodiode connected to a PC and analyzed through Labview was used to measure the
bed height. The sensor was installed in a plexiglass case measuring 13.5 cm x 4.5 cm x
2.5 cm and connected to a long aluminum threaded rod that could screw into the top of
the bed. The diode was placed such that it was partially submerged in the fluidized bath
and slightly offset from the wall radially. Voltage potentials could be measured at each
end of the diode and a voltage drop could be measured across the diode and outputted in
Labview. Figure 10 provides a schematic of the set-up.
The diode was divided into two regions – the top half and the bottom half. Shadows on
one end would reduce the potential observed on that same end. A 250 W light bulb was
used as a strong light source to increase the amplitudes of the observed voltage drops.
The light was installed on a fixture that could also be screwed onto the top of the bed. As
the sphere was submerged with the flow rate held constant, the bed would rise in height.
The diode was positioned such that the bottom half was always completely submerged
and as the bed height rose, the top half would become increasingly covered.
Unislide with screw on top to move the sphere up and down
Sphere attached to unislide
Photodiode
Fluidized bed
Photodiode leads connected to Labview program
Figure 10: Schematic of set-up for bed height measurement

31
The diode was essentially a photovoltaic and therefore a decrease in exposed light would
decrease the potential on the side that was being covered.
Thus, as more of the diode was covered up, the voltage difference between the two ends
would change. Pictures of the set-up can be seen in figures 9 and 10.
Figure 11: Picture of bed height measurement assembly

32
Figure 120: Top-down view of bed height measurement assembly
In order to convert the voltage difference into a height reading, the diode was calibrated
by measuring the bed height with a ruler and comparing it to the voltage difference
outputted by Labview. In order for the calibration to be accurate for all measurements,
the number of lights on in the laboratory was kept constant, the experiment was kept
away from windows and the 250 W light source was located in the same position relative
to the diode for all experiments. It was determined that the voltage difference is linearly
proportional to an increase in bed height. The results of the calibration are show in Figure
13. For all bed height experiments, the flow rate was kept at 24 scfh.
Unislide assembly Light source
Photodiode

33
Calibration of Photodiode
9.6
9.7
9.8
9.9
10
10.1
10.2
10.3
10.4
0.55 0.552 0.554 0.556 0.558 0.56 0.562 0.564 0.566 0.568
Voltage difference
Bed
Hei
ght (
in)
Figure 13: Data for calibration of photodiode
2.4 Forces on Submerged Objects in a Fluidized Bed
For the experiments measuring the forces on the sphere, the sphere was held above the
bed by a support beam with two legs. The support essentially straddled the fluidized bed.
Either leg of the support was anchored to a base of sand which in turn stood on a
weighing scale. The sphere was attached to the support by a threaded rod (size 8-32)
staked through the top of the sphere. The other end of the rod was threaded through the
support so that when turned, the sphere would move in and out of the bed. The support
was placed such that the sphere would be located at the center of the bed. Initially, the
sphere was held above the level of the fluidized bed and the scales were zeroed. The
sphere was turned 0.4 cm into the bed and the mass as measured on the scales was

34
recorded. As the sphere was submerged, it would be subjected to the forces within the
bed. An increase in the magnitude of the force measured by the scales indicated an
increase in the net force on the sphere. Similarly, a decrease in the force on the scale
indicated a reduction in the net force. This was repeated and readings were taken until the
change in force on the sphere was unchanged with increased penetration. Experiments
were run at two flow rates: 40% and 60% of scfh of 40 scfh. This corresponds to 1.26 x
10-4 m3/sec and 1.89 x 10⁻⁴ m3/sec respectively. In terms of velocity, this corresponds to
3.5 x 10⁻³ m/sec and 5.28 x 10⁻³ m/sec respectively. At 40%, the bed was close to the
minimum fluidization velocity and therefore this velocity will be referred to as UMF. At
60%, the bed was at the onset of bubbling and will be referred to as 1.5 UMF (as it is 1.5
times the minimum fluidization velocity). The stage of fluidization at the flow rates was
determined through visual observation.
The same set up was used to measure the forces on the cylinder with a rounded end.
However, experiments for the cylinder were only run at 1.5 UMF.
A schematic of the set up is shown in Figure 14. Pictures of the assembly can be seen in
Figures 13 and 14.

35
Figure 14: Set-up for experiments measuring forces on submerged objects

36
Figure 15: Picture of assembly for measuring forces on submerged objects shown outside of bed

37
Figure 16: Picture of assembly for measuring forces on submerged objects shown inside bed

38
Chapter 3: Results
The following section will present the results of the experiments.
3.1 Determination of Pressure Drop through the Bed
Using the aforementioned methodology, the pressure drop through the bed was
determined. Figure 17 shows the data from the experiments.
Pressure Drop Across Bed
0
0.1
0.2
0.3
0.4
0.5
0.6
0.7
0 2 4 6 8 10 12 14
fluidized bed height (in)
pres
sure
(psi
g)
Pressure
Figure 17: Pressure across bed vs. fluidized bed height
As is clear, the pressure increases linearly as more alumina oxide is added. The equation
of the pressure increase with increased bed height obtained from the data is:

39
2669.00296.0 += hPb
Equation 19
Here Pb is the pressure in psig and h is the bed height in inches. The y-intercept of 0.2669
psig corresponds to the pressure drop through the plenum and perforated sheet. The slope
of 0.0269 psig/in is the pressure drop associated with the alumina oxide, dP/dz. This
value is used in later calculations of buoyancy.
In Howard 1989, it is suggested the drop through the distributor (the plenum and the
perforated sheet) should be at least 10% of the total pressure drop across the bed for
optimal design of a fluidized bed. In the present case, at the fluidized bed height of 10
inches (which is approximately the bed height used in the following experiments), the
drop through the distributor is 47% of the total drop across the bed. Therefore, we can
verify that the fluidized bed is functioning properly and our pressure drop calculations are
reasonable.
3.2 Bed height rise associated with submersion of sphere
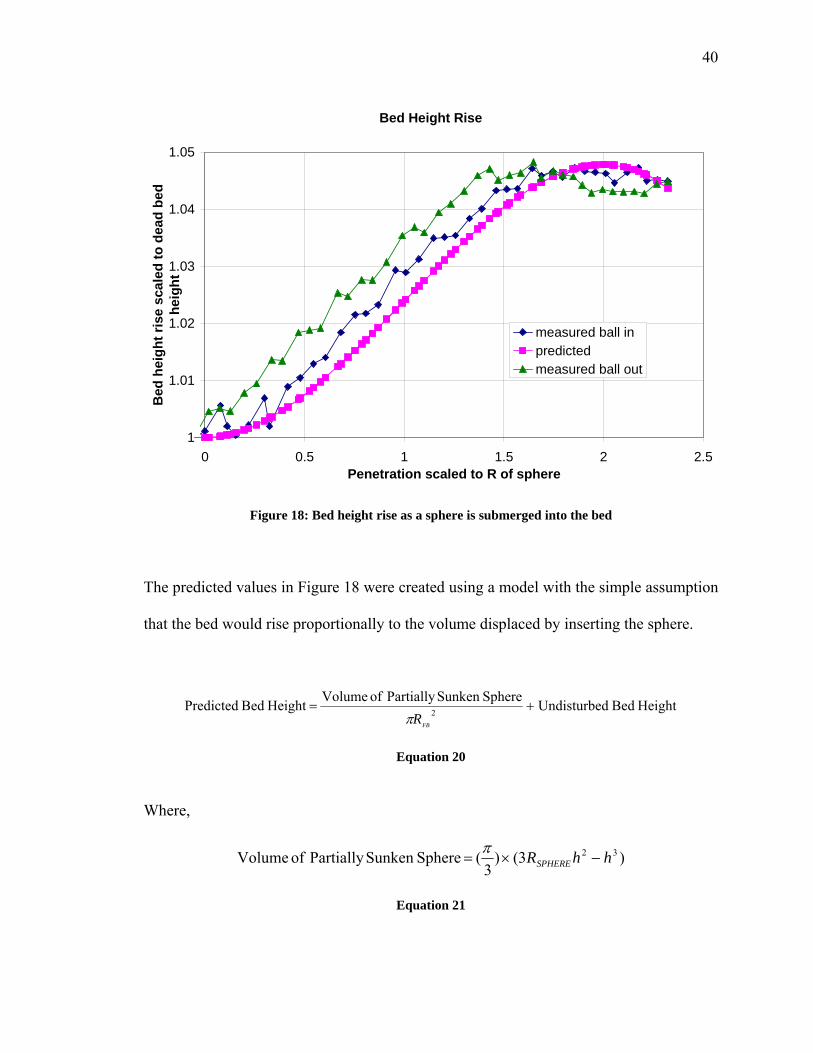
Figure 18 shows the measured bed height increase as the sphere was slowly lowered into
the bed. The horizontal axis has been scaled to one radius of the sphere, RSPHERE.
40
Bed Height Rise
1
1.01
1.02
1.03
1.04
1.05
0 0.5 1 1.5 2 2.5Penetration scaled to R of sphere
Bed
hei
ght r
ise
scal
ed to
dea
d be
d he
ight
measured ball inpredictedmeasured ball out
Figure 18: Bed height rise as a sphere is submerged into the bed
The predicted values in Figure 18 were created using a model with the simple assumption
that the bed would rise proportionally to the volume displaced by inserting the sphere.
Height Bed dUndisturbeSphereSunken Partially of VolumeHeight Bed Predicted 2 +=FBRπ
Equation 20
Where,
)3()3
( SphereSunken Partially of Volume 32 hhRSPHERE −×=π
Equation 21

41
In the above, RFB is the radius of the fluidized bed, while RSPHERE is the radius of the
sphere and h is the depth that the sphere has sunk. The impact of the de-fluidized hood on
the bed height has not been included in the model.
For all bed height experiments, the flow rate was kept constant and at the onset of
bubbling (determined by visual observation). The data matches fairly well until the
sphere sinks to around a height of 1.75 RSPHERE. At this point, the model continues to
grow, while the data starts to flatten. The de-fluidized region has sufficiently developed
such that there is a portion of the bed now dead. This can be visually observed because a
dead region on the surface of the fluidized bed above the sphere is apparent. This dead
bed portion leads to a less than predicted bed height. For times when the sphere is
submerged less than h = 1.75 RSPHERE, the bed height is slightly greater than the predicted
bed height. However, this under prediction is less than 1% of the total bed height on
average. From this, the conclusion can be made that the de-fluidized hood does not begin
at a penetration depth greater than h = 1.75 RSPHERE. Physically, it cannot begin before h
= RSPHERE.
Hysteresis occurs as the sphere is pulled out of the fluidized bed. At every point, the bed
height is higher – indicating higher levels of fluidization – while the sphere is being
pulled out than it is while being pushed in. However, this difference is very small. Even
still, hysteresis can be seen when fluidizing and de-fluidizing the bed. The case with the
sphere entering the bed can be considered de-fluidization because a portion of the bed is
being deadened whereas the bed is fluidized as the sphere is removed from the bed

42
because the deadened region created by the sphere is now being re-fluidized. Figure 19
taken from data presented by Jackson (2000) shows hysteresis when a bed is fluidized
and then de-fluidized. Arrows show the direction of bed height increase. As can be seen,
the bed height is higher when de-fluidizing than it is when fluidizing.
Figure 19: Bed height change during fluidization (right pointing arrows) and de-fluidization (left pointing arrows)
Visual observation of the sphere entering into the bed shows that once the sphere was
submerged half way, bubbles would form around the circumference of the sphere. Once
the sphere was submerged deeper than RSPHERE, the bubbles would still appear at the
surface of the bed. They would form a ring at the surface whose radius would grow as the
sphere was lowered deeper. The bubbles would also grow in size as the sphere was
lowered.

43
Figure 18 is a top view drawing of the bubbling ring around the sphere:
These bubbles are the result of the flow having to accelerate around the sphere at the
hemisphere in order to maintain a mass balance for air. Since the bed is already fluidized,
air in excess of that needed for fluidization would escape as bubbles. This caused the
formation of the ring of bubbles around the hemisphere. The bubbles also visually verify
another key phenomenon. If the flow did not separate from the sphere, as it would under
Stokes Flow, then the ring of bubbles would not have been observed. However, the
presence of bubbles indicates that the flow separates from the sphere at the hemisphere.
Therefore, the region above the sphere will have no flow, and this region would be de-
fluidized. Consequently, using Stokes’s Law for any predictive calculation concerning
the de-fluidized hood should be broached with caution. Rees et al (2004) calculated the
Reynolds number for their experiment and found it to be less than 1. Thus, the usage of
Sphere submerged to
the hemisphere at h ≥ RSPHERE
Bubbles forming around the hemisphere
Fluidized bed
Figure 20: Bubble formation around hemisphere of half submerged sphere
44
Stokes’s Law was said to be appropriate. However, visual observations of the sphere
sinking would seem to indicate that while the sphere may obey Stokes’s Law
mathematically, it reality, it may not obey it physically.
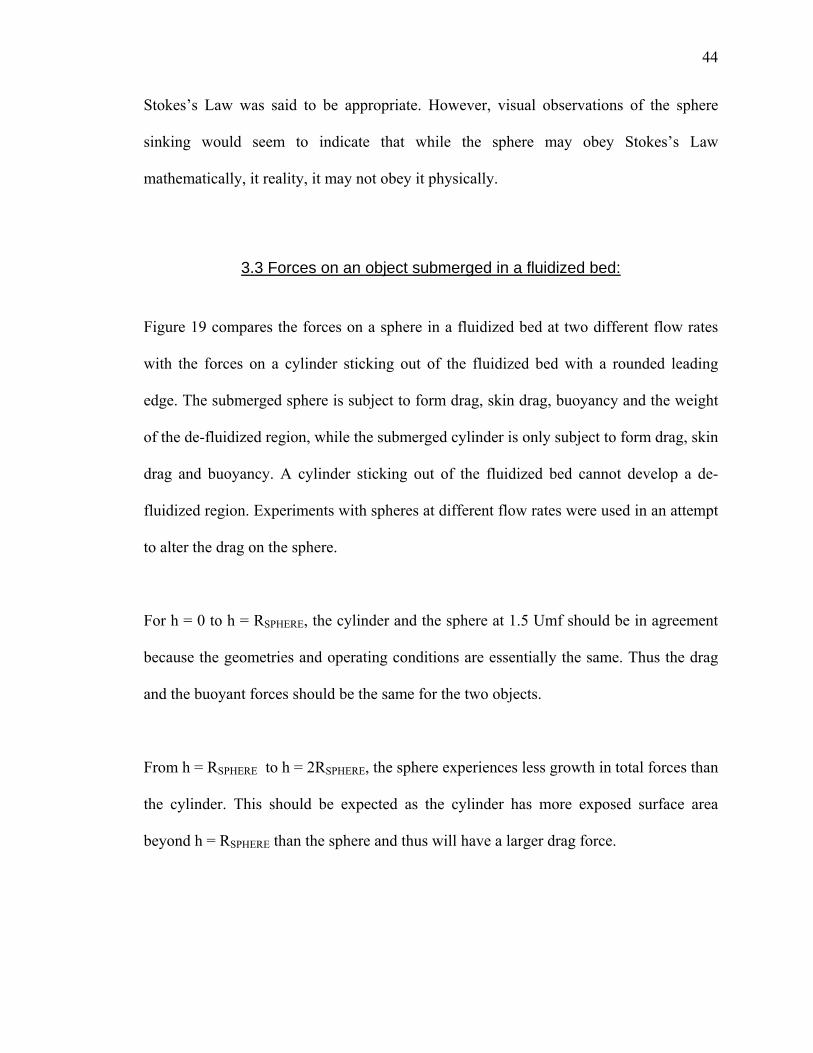
3.3 Forces on an object submerged in a fluidized bed:
Figure 19 compares the forces on a sphere in a fluidized bed at two different flow rates
with the forces on a cylinder sticking out of the fluidized bed with a rounded leading
edge. The submerged sphere is subject to form drag, skin drag, buoyancy and the weight
of the de-fluidized region, while the submerged cylinder is only subject to form drag, skin
drag and buoyancy. A cylinder sticking out of the fluidized bed cannot develop a de-
fluidized region. Experiments with spheres at different flow rates were used in an attempt
to alter the drag on the sphere.
For h = 0 to h = RSPHERE, the cylinder and the sphere at 1.5 Umf should be in agreement
because the geometries and operating conditions are essentially the same. Thus the drag
and the buoyant forces should be the same for the two objects.
From h = RSPHERE to h = 2RSPHERE, the sphere experiences less growth in total forces than
the cylinder. This should be expected as the cylinder has more exposed surface area
beyond h = RSPHERE than the sphere and thus will have a larger drag force.

45
0
2
4
6
8
10
12
14
16
0 1 2 3 4 5 6 7
Penetration scaled to radius of sphere (h)
Tota
l for
ce s
cale
d to
wei
ght f
orce
of b
all
Sphere at 1.5Umf
Sphere at Umf
Cylinder at 1.5Umf
Figure 21: Force on sphere and cylinder in fluidized bed

46
Once the cylindrical section starts to submerge at h = RSPHERE, the pressure force acting
normal and upwards on the body increases linearly with penetration depth. Therefore, the
buoyant force should grow at a constant rate with increased penetration. The linearity of
the forces on the cylinder beyond h = RSPHERE indicates that no additional forces, such as
a de-fluidized region, are created.
The total forces on the sphere begin to reduce at h = 1.8RSPHERE. This can be attributed to
the creation of the de-fluidized hood. This assertion is made because a sphere without a
de-fluidized section would experience no additional forces after it was completely
submerged (i.e. the forces for the sphere in Figure 21 would flatten out past h = 2
RSPHERE). In the current case, the force on the sphere begins to decrease once the sphere is
nearly submerged. Therefore, an additional downward force is now observed. After a
certain point (h = 4.41RSPHERE for 1.5 Umf flow and h = 4RSPHERE for Umf flow) the forces
in Figure 21 flatten out. At this point, it is hypothesized that the de-fluidized region is at
its maximum size.
A comparison between the sphere under Umf flow and 1.5Umf flow for h between 0 and
2RSPHERE yields the result that the sphere under Umf flow is subjected to larger forces.
Although the flow rate is lower, the density is higher. The increase in density is due to the
decrease in fluidization caused by the lower flow rate. The denser phase leads to more
collisions between the particle and the sphere. This would lead to an increase in viscosity.
The increase in viscosity with lower flow rates has been reported in the literature (Liu
47
1960, Davidson 1977). The buoyant force for the UMF case will also be increased since
the density increase will yield a greater pressure drop through the sand.

48
Chapter 4 Theoretical Model
An attempt to derive the force balance on the sphere can now be made and its accuracy
can be verified using the data. A model was developed for comparison to the data of the
sphere at 1.5 UMF.
The forces on the sphere are as follows, with h being the depth to which the sphere has
penetrated the bed surface:
⎩⎨⎧
>+≤<++
SPHERE
SPHERE
Rh Hood Fluidized-De ForceBuoyant Rh0 Force,Buoyant DragSkin Drag Form
4.1 Determination of Form Drag
Visual observation indicated that form drag would not be a major contributor to the force
on the sphere. In an empty bed, at the flow rate used in the aforementioned experiments,
the sphere would not move at all, thus indicating a small form drag force.
The form drag was determined through a momentum balance around the sphere. The
velocity around the sphere penetrating a distance h into the bed was determined using
Equation 22.
49
ε21 A
AUU =
Equation 22
Where:
2
32
21
2
22
And
)3
(
)2
(
hhRD
Ah
hhRAh
DAA
RA
AVU
SPHEREwetted
pred
FBpred
wetted
FB
−=
−−=
−=
=
=
πε
π
π
&
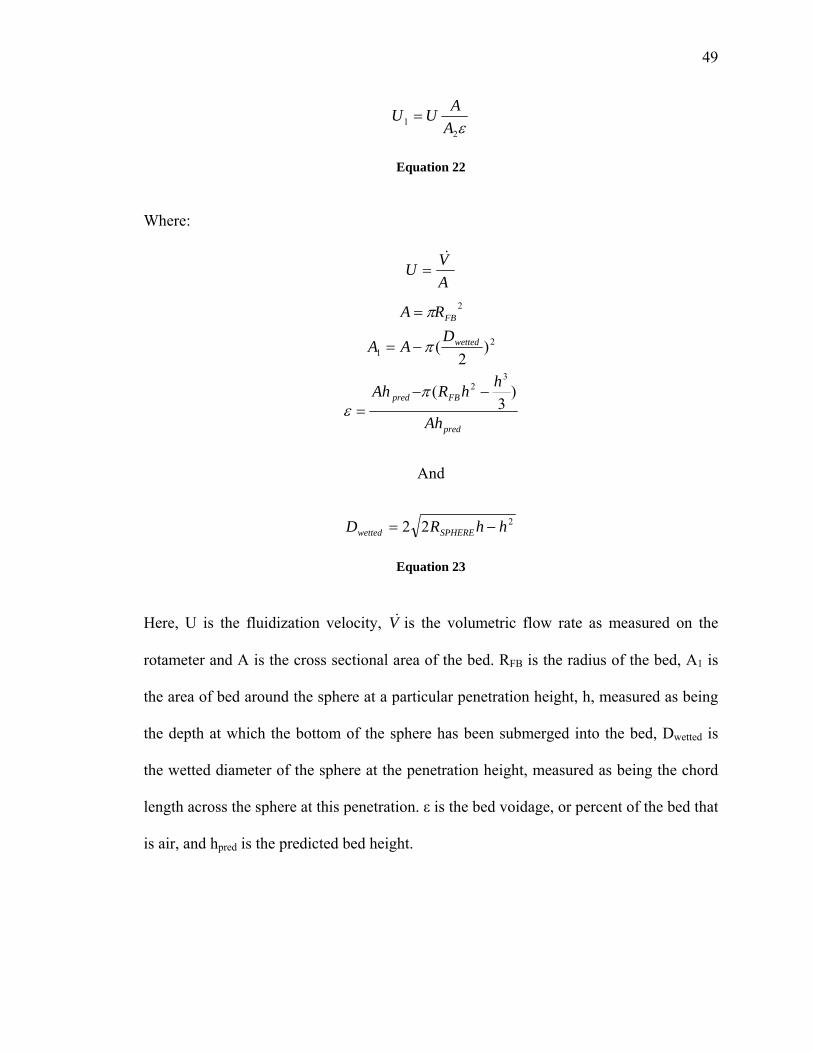
Equation 23
Here, U is the fluidization velocity, V& is the volumetric flow rate as measured on the
rotameter and A is the cross sectional area of the bed. RFB is the radius of the bed, A1 is
the area of bed around the sphere at a particular penetration height, h, measured as being
the depth at which the bottom of the sphere has been submerged into the bed, Dwetted is
the wetted diameter of the sphere at the penetration height, measured as being the chord
length across the sphere at this penetration. ε is the bed voidage, or percent of the bed that
is air, and hpred is the predicted bed height.

50
In order to calculate the momentum difference around the sphere, the bed density, ρf,
needs to be determined. Equation 24 was used for this purpose
bed
sandf V
M=ρ
Equation 24
Msand is the mass of alumina oxide in the bed and Vbed is the volume of the fluidized bed
using the predicted bed height.
By calculating the momentum deficit at a position along the sphere up to RSPHERE, we can
find the form drag along the sphere.
)(Drag Form 12
12 AUAUf −= ρ
Equation 25
For the experiments, the form drag was on the order of 10-2 N or 0.06 times the weight of
the sphere.
Figure 22 shows the form drag variation with penetration depth:

51
0
0.005
0.01
0.015
0.02
0.025
0.03
0.035
0.04
0.045
0 0.5 1 1.5 2 2.5penetration depth scaled to R of sphere
Form
Dra
g sc
aled
to w
eigh
t of s
pher
e
Form Drag
Figure 22: Form drag on a submerged sphere Past h = RSPHERE, the form drag remains constant since the air flow is no longer impacting
the sphere.
4.2 Determination of Buoyant Force
In a static fluid, the buoyant force is calculated using Archimedes Principle:
gdzdP
fρ=
Equation 26

52
The buoyant force is an effect of the pressure difference above and below the immersed
object. By integrating the pressure over the surface of the immersed object, the buoyant
force is attained for a submerged object in a static fluid.
From Equation 19, dP/dz, the pressure drop associated with the alumina oxide, is:
Pa/m7926
psi/in 0296.0
=
=dzdP
Now, calculating dP/dz through Archimedes Principle, using the density calculated in
Equation 24 of 843.4551 kg/m3, gives 8265.86 Pa/m (Equation 26). These two solutions
are within 4% of each other. The similarity in the two results gives confidence that
pressure drop observed is accurate.
Integrating dP/dz over the sphere yields the buoyant force on a sphere without a de-
fluidized hood:
dθ dφ dz )(sin R )( 2sphere0
0
2
0θ
dzdPForce
h
buoyant ∫∫∫Π
Π=
Equation 27
Where
Pa/m 7926== gdzdP
fρ

53
The pressure force will act normal to the surface of the object. Only the vertical
component (along the axis of the bed) of the force is of interest as the hood will act
purely vertically and the forces measured were all vertical. In order to obtain the vertical
component of the pressure force, Equation 27 is multiplied by cos(θ), where θ is the angle
swept from the bottom of the sphere to the bed surface. This can be expressed as:
)2(tan 1
hR
d wetted
−= −θ
Equation 28 In the case of an object with a de-fluidized hood, the pressure force acting downward for
h > Rsphere is difficult to attain through integration around the surface for a variety of
reasons. One such reason is that once the hood forms, the pressure drop felt by the top of
the sphere will be different than that felt by the bottom of the sphere because the region
above the sphere is not fluidized. Therefore, the dP/dz measured for the fluidized bed is
no longer valid for the upper half of the sphere. A similar argument would be that
Archimedes Principle assumes that the density of the fluid is uniform all around the
submerged object. In the case of objects with de-fluidized hoods, the density around the
object is different at the top and the bottom. The earliest the hood could begin is at h =
RSPHERE. Therefore, since the object under investigation has a de-fluidized hood, the
integration to calculate pressure force shown in Equation 27 was only calculated for 0 ≤ h
≤ RSPHERE. The result is the pressure force acting up on the bottom half of a submerged
object. As the object gets submerged deeper, this force increases because the pressure
increases with depth. The results are shown in Figure 23. The downward component of

54
the pressure force on the sphere will be determined by calculating the de-fluidized hood
weight in section 4.4.
0
5
10
15
20
25
30
35
40
0 1 2 3 4 5
Penetration Scaled to R of sphere
Forc
e Sc
aled
to S
pher
e W
eigh
t
Figure 23: Pressure Force Pushing Submerged Object Up and Out of Bed
Figure 23 also predicts the buoyant force on the cylinder since the cylinder is never fully
submerged and does not have a de-fluidized hood. In the case of the sphere, Figure 23
only predicts the upward component of the buoyant force.
4.3 Skin Friction Determination
Although the apparent viscosity has been estimated to be approximately 1 kg/m-sec by
previous researchers, calculating the skin friction on the sphere was still not obvious. Past
researchers have determined that the flow within fluidized beds can be modeled as
Stokes’ Flow and thus Stokes’ drag is applicable. However, in the present case, through

55
visual observation, it is clear that the flow separates from the sphere and is thus not
typical Stokes’ flow. The visual observations that led to this conclusion include:
1) The existence of the hood requires that there is no flow above the sphere, thus
allowing de-fluidization.
2) Bubbles around the hemisphere of the sphere are observed, thus indicating a flow
separation
In the present work, use of an alternate method of determining skin friction was
necessary.
The forces in the case of the cylinder are as follows:
⎩⎨⎧
>+<<++
SPHERE
SPHERE
R h Force,Buoyant DragSkin Rh0 Force,Buoyant DragSkin Drag Form
With the buoyant force on the cylinder determined, the experimental forces on the
cylinder can be used to determine a drag coefficient. This coefficient can then be applied
to the case of the sphere.
The common equation for drag force where it is related to the momentum of the flow is
used:
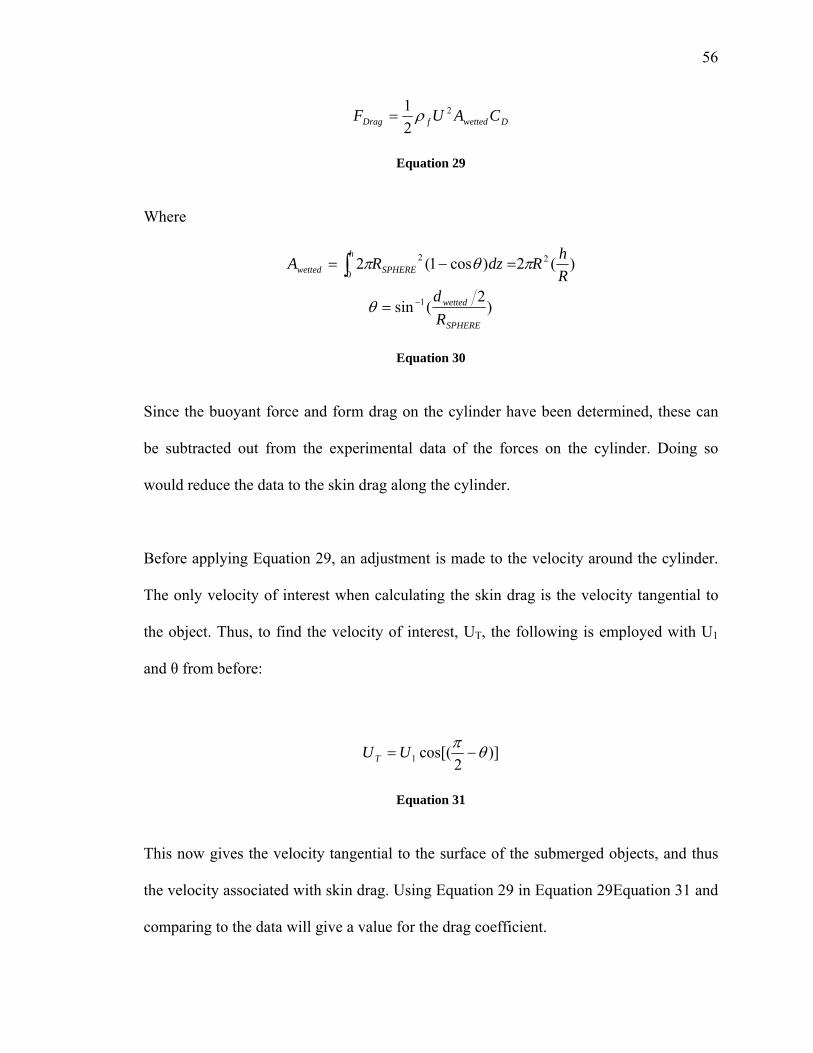
56
DwettedfDrag CAUF 2
21 ρ=
Equation 29
Where
)2
(sin
)(2)cos1(2
1
2
0
2
SPHERE
wetted
h
SPHEREwetted
Rd
RhRdzRA
−=
=−= ∫
θ
πθπ
Equation 30
Since the buoyant force and form drag on the cylinder have been determined, these can
be subtracted out from the experimental data of the forces on the cylinder. Doing so
would reduce the data to the skin drag along the cylinder.
Before applying Equation 29, an adjustment is made to the velocity around the cylinder.
The only velocity of interest when calculating the skin drag is the velocity tangential to
the object. Thus, to find the velocity of interest, UT, the following is employed with U1
and θ from before:
)]2
cos[(1 θπ−=UUT
Equation 31
This now gives the velocity tangential to the surface of the submerged objects, and thus
the velocity associated with skin drag. Using Equation 29 in Equation 29Equation 31 and
comparing to the data will give a value for the drag coefficient.

57
The experimental force less the buoyant force and the form drag for the cylinder is
graphed in Figure 24 (shown as “experimental skin friction”). The experimental data
shows variation. However, the variation is negligible when compared to the total forces
on the cylinder.
0
0.2
0.4
0.6
0.8
1
1.2
1.4
1.6
1.8
2
0 0.5 1 1.5 2 2.5Penetration scaled to R of sphere
Forc
e sc
aled
to w
eigh
t of s
pher
e
Experimental Skin Friction
Modeled Skin Friction with Cd= 20
Figure 24: Skin friction on cylinder compared to theoretical skin friction with Cd = 20 in equation 29
Using a drag coefficient of 20 in Equation 29, the data and the model for the cylinder are
compared in Figure 22. There is good agreement between the two. Figure 25 shows the
total experimental force on the cylinder compared to the model. The model is the sum of
the predicted form drag, buoyant force and skin drag

58
0
2
4
6
8
10
12
14
16
18
0 0.5 1 1.5 2 2.5Penetration scaled to sphere radius
Forc
e sc
aled
to w
eigh
t of s
pher
e
experimentmodel
Figure 25: Predicted force on cylinder compared to experimental force
Now, assuming the drag coefficient for the sphere and cylinder are the same, the skin
drag on the sphere is readily attainable through use of Equation 29. For regions past h =
RSPHERE, the flow is considered to have separated from the sphere. Therefore, the skin
drag will no longer grow.
Using the velocity in Equation 31 in Equation 29, Figure 26 for the skin friction on the
sphere is obtained.

59
Skin Friction on Sphere
0
0.1
0.2
0.3
0.4
0.5
0.6
0.7
0.8
0.9
0 0.5 1 1.5 2 2.5 3 3.5 4penetration scaled to sphere radius
forc
e sc
aled
to w
eigh
t of s
pher
e
Skin Friction on Sphere
Figure 26: Prediction of skin friction on sphere at 1.5Umf flow
In order to compare to the relations proposed by Crowe et al (Equation 12 and Equation
13) it is necessary to determine f (the friction factor) and the Reynolds number, Re. The
Reynolds number can be calculated using Equation 32 where ρf is the density of the
fluidized bed (calculated from Equation 24), U1 is the velocity around the sphere
(Equation 31), dsphere is the diameter of the sphere and μbed is the viscosity of the fluidized
bed (taken to be 1 kg/m-sec as recommended by Davidson 1977).
bed
spheref dUμ
ρ 1Re =
Equation 32

60
With the calculated values of Re, obtained by making the assumption that the particle
motion with respect to the interstitial gas velocity is negligible, the friction factor is
determined using Error! Reference source not found.. This will determine the drag
coefficient according to Equation 12. Using the velocity corresponding to when the
sphere is submerged up to the hemisphere, an Re of 4.26 and a drag coefficient of 7.9 is
obtained. Our drag coefficient of 20 based on the data from the cylinder is ~2.5 times the
value predicted by the literature. However, the value used in the literature is based on an
order of magnitude estimate of the viscosity being 1 kg/m-sec.
4.4 Determination of De-fluidized Hood Weight and Shape
The final force on the sphere is that created by the de-fluidized hood. From Figure 18, it
is apparent that this region begins no later than at h = 1.75RSPHERE. Also, intuitively, it
can occur no earlier than at h = RSPHERE. For regions at h < RSPHERE, the hood has no place
to grow.
In order to obtain a hood weight and shape, the experimental data over several runs was
averaged and a 10th degree polynomial curve was fit to the data. Using a trend line rather
than directly using the experimental data smoothed out any variations in the data caused
by voids or by the act of lowering the sphere deeper into the bed. Both of these would
disturb the hood, knocking it down and lowering its size for a short while until the hood
is rebuilt. Using the DataFit software, the following trend line was fit to the sphere at 1.5
UMF:
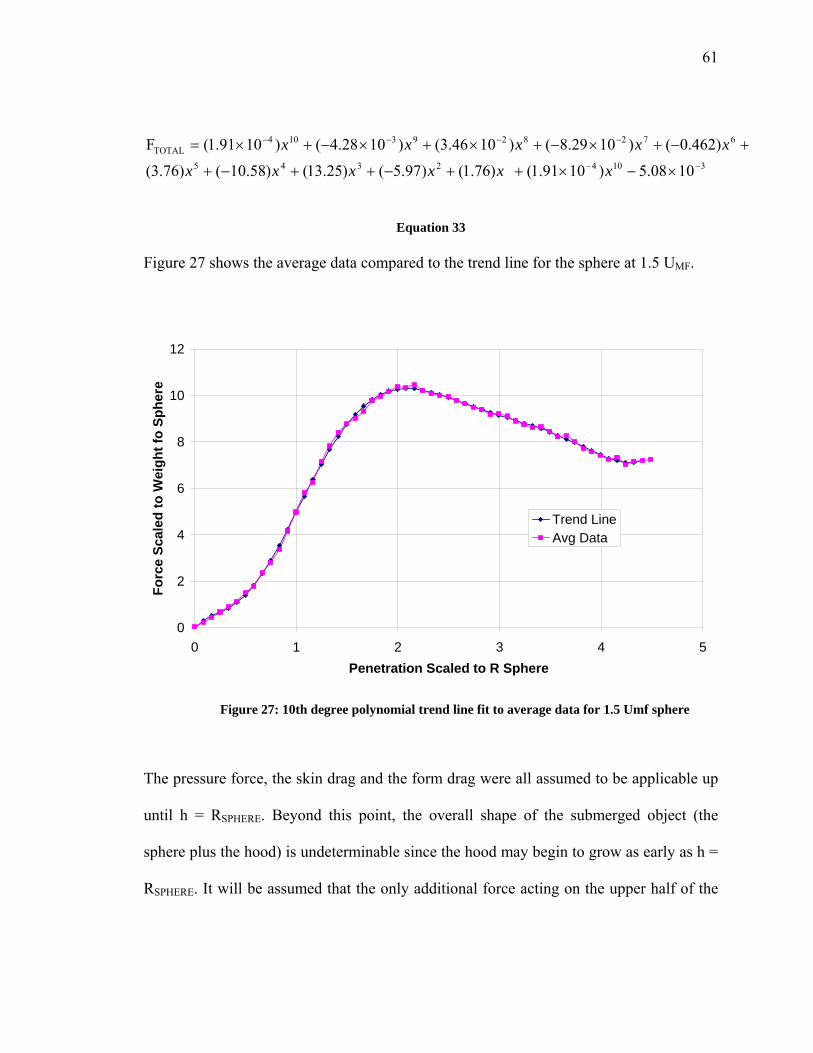
61
31042345
6728293104TOTAL
1008.5)1091.1()76.1()97.5()25.13()58.10()76.3(
)462.0()1029.8()1046.3()1028.4()1091.1(F−−
−−−−
×−×++−++−+
+−+×−+×+×−+×=
xxxxxx
xxxxx
Equation 33 Figure 27 shows the average data compared to the trend line for the sphere at 1.5 UMF.
0
2
4
6
8
10
12
0 1 2 3 4 5Penetration Scaled to R Sphere
Forc
e Sc
aled
to W
eigh
t fo
Sphe
re
Trend LineAvg Data
Figure 27: 10th degree polynomial trend line fit to average data for 1.5 Umf sphere
The pressure force, the skin drag and the form drag were all assumed to be applicable up
until h = RSPHERE. Beyond this point, the overall shape of the submerged object (the
sphere plus the hood) is undeterminable since the hood may begin to grow as early as h =
RSPHERE. It will be assumed that the only additional force acting on the upper half of the
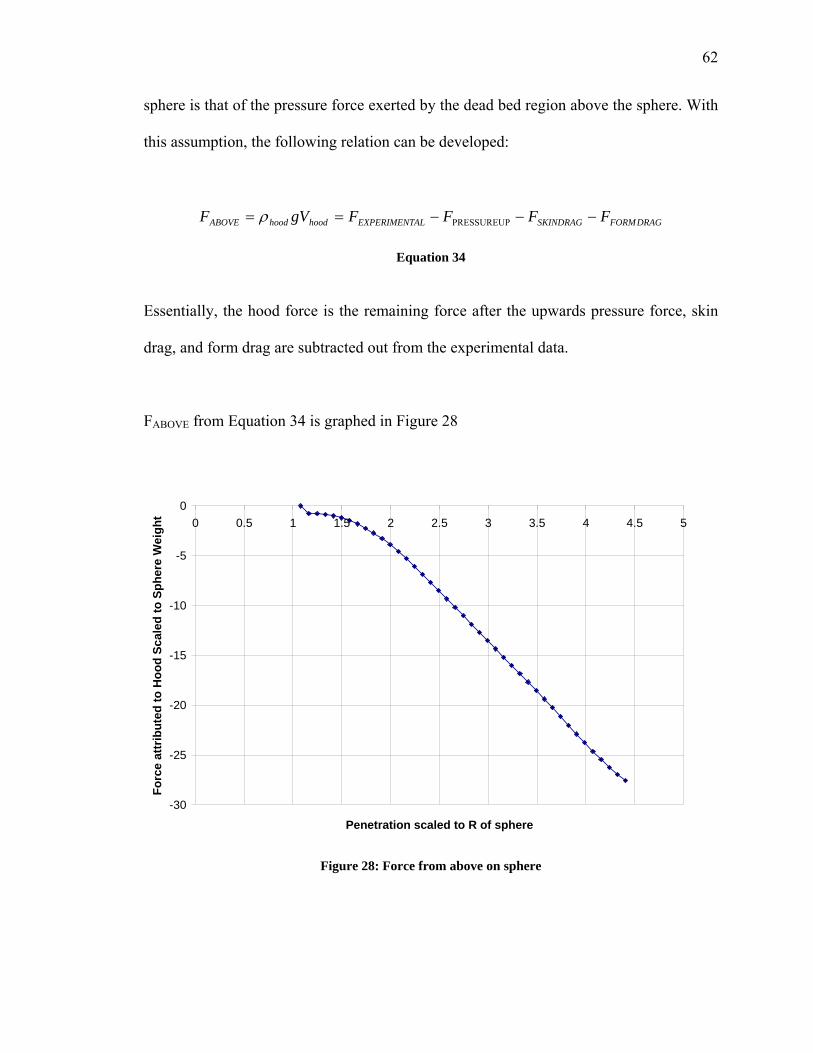
62
sphere is that of the pressure force exerted by the dead bed region above the sphere. With
this assumption, the following relation can be developed:
DRAGFORMSKINDRAGALEXPERIMENThoodhoodABOVE FFFFgVF −−−== UPPRESSUREρ
Equation 34
Essentially, the hood force is the remaining force after the upwards pressure force, skin
drag, and form drag are subtracted out from the experimental data.
FABOVE from Equation 34 is graphed in Figure 28
-30
-25
-20
-15
-10
-5
00 0.5 1 1.5 2 2.5 3 3.5 4 4.5 5
Penetration scaled to R of sphere
Forc
e at
trib
uted
to H
ood
Scal
ed to
Sph
ere
Wei
ght
Figure 28: Force from above on sphere

63
As can be seen, FABOVE is negative, indicating that the de-fluidized hood force acts to
push the sphere deeper into the bed.
In order to determine the shape of the hood, it can be assumed that the hood is comprised
of small cylinders with height dh stacked upon each other. The radius of each cylinder
would be dependent on the incremental increase in hood weight over a height, dh.
Applying this to Equation 34, the following equation is obtained:
)()( UPPRESSURE2
DRAGFORMSKINDRAGALEXPERIMENTcylinderhoodABOVE FFFFddhrgdF −−−== πρ
Equation 35
The density of the hood was taken to be that of the alumina oxide. In taking this to be the
density, it has been assumed that hood consists of completely un-fluidized alumina oxide.
By using Equation 35, the radius of each cylindrical element can be determined. With the
dimensions of each cylindrical section now known, the de-fluidized hood shape can be
determined. The results for the hood shape are shown in Figure 29. The hood has been
superimposed over the submerged sphere. The dashed line indicates the portion of the
sphere covered by the de-fluidized hood. For the most part, the hood resembles a cylinder
with a short and rounded top.

64
Figure 29: Hood Shape Extracted from Hood Weight Data
The maximum hood height was also studied. Experimentally, the data shows that the
hood ceases to grow at h = 4.41RSPHERE for the 1.5UMF case, or a hood height of
3.41RSPHERE (calculated from the center of the sphere). This hood height is 1.71 times the
diameter of the submerged sphere.

65
4.5 Summation of Model Forces
The summation of the models for form drag, buoyancy, skin drag and the hood weight
are shown in comparison to the experimental results for the sphere at 1.5 Umf in Figure
30.
0
2
4
6
8
10
12
0 1 2 3 4 5Penetration scaled to R of sphere
Forc
e Sc
aled
to W
eigh
t of S
pher
e
Force ModelDataDataData
Figure 30: Comparison of model to data for 1.5 Umf flow sphere case
The model fits the data well. While the model shows the force as being slightly higher
than the data values, the variation is at most 7% (occurring at 1.8RSPHERE).
66
Chapter 5 Conclusions
The goal of this study is to eventually create a geometry that could move up and down
within a fluidized bed, breaking up agglomerations, through the manipulation of the inlet
flow rate. Complications arose when objects that should sink based on densities did not
do so due to the development of a de-fluidized region of particles above the submerged
object. It was necessary to determine the properties of the de-fluidized region as to
minimize its effect. In this step, the forces acting on a sphere in a fluidized bed have been
predicted and verified. In doing so, the weight of the previously reported de-fluidized
hood has been directly measured. From these direct measurements a prediction of the
hood shape was extracted. The findings will now be compared to the results presented by
past researchers, most notably Grace and Hosney, Hager and Schrag, Kulkarni, and Rees.
Discussions on the causes and the meaning of the hood shape will follow.
5.1 Comparison to Past Work
Figure 31 compares this work’s hood shape with those used by Rees and Hager and
Schrag. The hood shown currently does vary from what has been previously observed.
The method by which the hood size and shape was attained here is quite different from
previous researchers’ work. By determining the hood weight first and back calculating
the associated volume, the current hood has been estimated through direct experimental
results. In all previously found cases, the hood size and shape were determined through
visual observation. Darkened fluidizing medium was placed on top of the bed such that

67
the hood top could be outlined. Pictures were then taken of the hood and estimates of the
hood size and shape were made. The direct measurement technique, rather than visual
observation, used in the current study could be a reason for the difference in hood shapes.
Figure 31: Comparison of hood shapes Additionally, the differences between the hood shape presented here and those presented
by Hager and Schrag could lie in the fact that they used perfectly spherical glass beads.
Compared to the ground particles used in the current study, the beads will exhibit
different packing characteristics as well as reduced friction between adjacent beads thus
allowing for beads to roll off the hood. This would lead to a lower sloped hood as well as
a shorter hood. Additionally, Hager and Schrag used a rectangular bed in their studies.
This could lead to asymmetric flow structures within the bed which may impact the shape

68
of the hood. The hood presented here is qualitatively in agreement with that proposed by
Rees. The difference in height could be attributed to the flow rates used. In Rees’ work,
bubbling to slugging flow rates were used, which are much higher than those used in the
present work.
The hood height reported here is 3.41RSPHERE above the centerline of the sphere or 1.7
times the diameter. This is within the range of reported hood heights in the literature.
Hager and Schrag reported 0.8 times the diameter of the sphere whereas Glass and
Harrison reported that it could be up to 4 times the diameter of the sphere. With a hood
height of 3.41RSPHERE, the angle to which the hood rises is approximately 74.250. This
angle, referred to as the incidence angle by Rees, is the angle occupied by the outer edge
of the submerged sphere at the equator to the center-top of the hood. Table 1 compares
the hood heights and incidence angles.
Hood Height Incident Angle
Current Work 3.41R 74.250 Rees (2005) 2.89R 70.690
Kulkarni (1987) 1.14R 62.120
Hager and Schrag (1976) 2.56R 68.660
Table 1: Comparison of hood heights and incidence angles
The differences between the current work and Hager and Schrag and Rees have already
been discussed. Kulkarni’s work differs from the current finding in that he uses a
rectangular bed with spherical beads. Also, the values taken from Kulkarni’s work were
69
measured off of pictures of the hood. As Kulkarni himself explains, determining the
boundary between the fluidized and de-fluidized regions in these pictures is very tough.
For the case of 40% flow, the hood ceased to grow at 4R. This made the hood height
2.25R. With a base diameter of 1.5R, this made the incidence angle 720. Thus, the hood
size reduced with reduced velocity. While increasing the flow rate past bubbling would
seem to reduce the hood size because it would agitate the hood, thus knocking it down,
decreasing the flow rate to the minimum fluidization velocity would also seem to
decrease the hood size because it would not allow for the bubbles to transport particles to
the top of the hood. As will be discussed in section 5.2, the flow pattern created by the
bubbles may be the method by which the hood grows.
Finally, with the hood weight now determined, we can verify Equation 14 as proposed by
Grace and Hosney. This equation was meant to alter the buoyant force to account for the
de-fluidized hood. The comparison is shown in Figure 32.

70
0
2
4
6
8
10
12
0 0.5 1 1.5 2 2.5 3 3.5 4 4.5 5
Penetration scaled to R of sphere
Forc
e sc
aled
to w
eigh
t of s
pher
e
Grace and HosneyModel
Figure 32: Comparison of model to Grace and Hosney for 1.5 Umf case
The final forces agree between the two models. However, there is discrepancy in the
manner in which the hood is shown to grow with increased penetration. However,
Grace and Hosney were studying the forces on a stationary object already submerged
in a fluidized bed. Therefore, the force of interest was the final force rather than the
growth of forces as the hood grows.
5.2 Discussion on Hood Shape
The hood shape extracted from the data shows a relatively abrupt change from de-
fluidized to fluidized. Before beginning the investigation into the hood shape, it was
anticipated that the hood would more closely resemble a cone, with the de-fluidized

71
hood tailing off as the flow around the sphere moves downstream of the sphere and
re-stabilizes. It was initially thought that the angle of repose of alumina oxide would
represent the highest incidence angle. Once the hood was built to this angle, any
additional alumina oxide accumulation would slide off of the hood. However, the
angle of repose was found to be 440. This is in agreement with the findings of Jaeger
(1989) who reported an angle of repose of 390 for alumina oxide. As stated, the angle
of incidence of the hood was found to be 74.250, much greater than the angle of
repose. The steep slope of the hood led to the question of why the hood would stop
abruptly and is it believable for this discontinuity in the flow past the sphere to exist.
An attempt to verify the latter was made through visual observations of the hood and
its growth as the sphere was lowered. Figure 33 shows a view of the top of the bed at
different sphere depths for the 1.5Umf case. The deadened de-fluidized area can
clearly be seen in the h = RSPHERE picture. The bubbles form a ring that encircles the
submerged sphere. The edge of the de-fluidized hood is outlined as the darkened
circle inside the bubble ring. Within this de-fluidized region, hills and valleys of
alumina oxide can be seen. As the submerged sphere is lowered, the darkened line
becomes fainter, the hills and valleys become flatter, and the bubbles become larger.
By the last picture, at 4.61 RSPHERE , the deadened area resembles the rest of the bed
and can be assumed to be fluidized.
However, the ring of bubbles that form around the sphere is evident throughout the
series of pictures.

72
Figure 33: From top left to Bottom Right: Hood at 1R, 2R, 2.94R, 3.34R, 3.61R, 4.16R. The bubbles form a ring that encircles the submerged sphere. The edge of the de-fluidized hood can be seen as the darkened circle inside the bubble ring. As the submerged sphere is lowered, the darkened line becomes fainter and the bubbles become larger.
The voidages pull material along with them as they rise. When these voidages reach
the surface, they “burst” and release the entrained material, “spewing” it over the bed
surface. The explosion of each bubble has a radius which is directly proportional to
the radius of the bubble. A larger bubble will lead to a larger explosion radius which
will spew particles further away from the explosion site.

73
In the current case, the sphere causes voidages by accelerating the flow of interstitial
gas around the sphere. These bubbles, upon collapsing at the surface would transport
particles in all directions. Since the bubbles were aligned in a ring, the region within
the ring would receive a high concentration of particles from the bubble explosions.
This region was dead and the particles transported here would remain still. This
transport would continue, adding more and more particles to the de-fluidized region,
until the bubbles reached a large enough size, such that upon collapse, the particles
were transported across the dead region. At this point, particle motion was created in
the de-fluidized region.
In the region between this bubble ring and the bed walls, particles would move up
with the bubbles, burst and then move out towards the bed wall. Upon hitting the
walls, particles would get pulled down back into the bed. Eventually, the particles
would be re-entrained in the bubbles and reappear in a bubble explosion. This
circulation is common for a bubbling fluidized bed. However, juxtaposed to the
inward circulation of particles on to the hood, a bed with two counteracting patterns
of particle circulation is created. An illustration of this phenomenon is provided in
Figure 34.
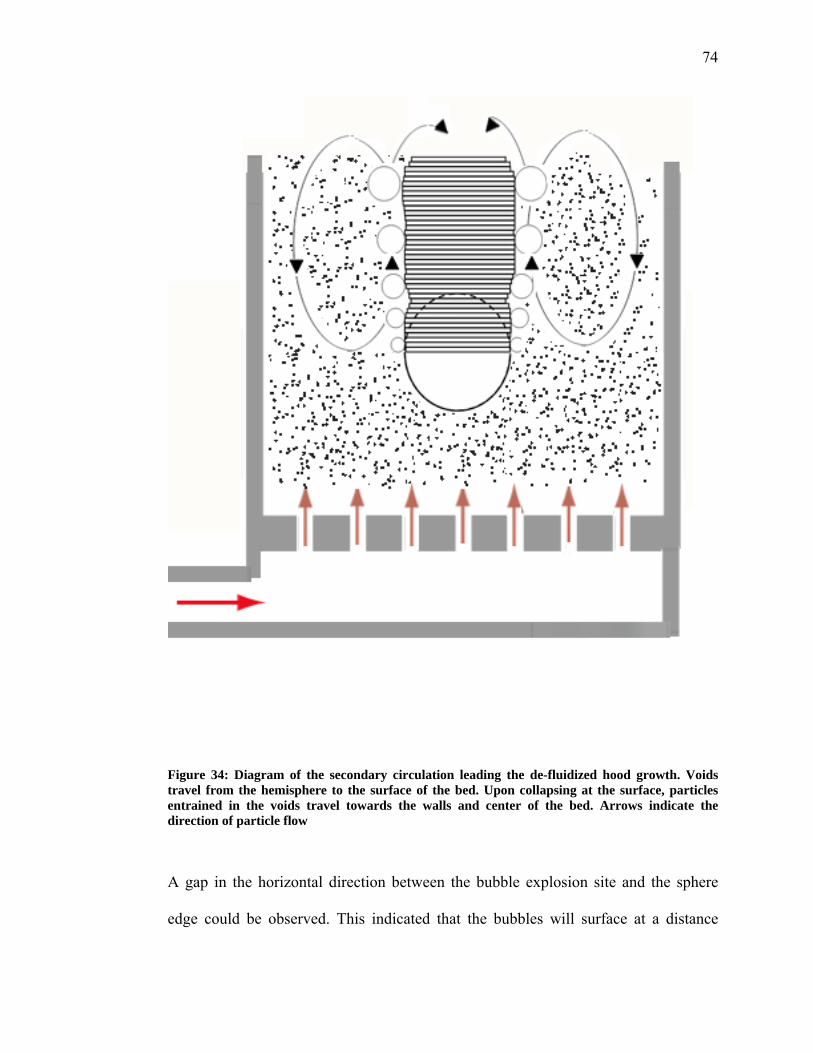
74
Figure 34: Diagram of the secondary circulation leading the de-fluidized hood growth. Voids travel from the hemisphere to the surface of the bed. Upon collapsing at the surface, particles entrained in the voids travel towards the walls and center of the bed. Arrows indicate the direction of particle flow
A gap in the horizontal direction between the bubble explosion site and the sphere
edge could be observed. This indicated that the bubbles will surface at a distance
75
away from the sphere circumference laterally. This could either mean that the bubbles
shoot out at an angle away from the sphere or that they exhibit preferential growth on
the side of the bubbles adjacent to the fluidized section of the bed. Assuming the
latter since there is no justification for the former, the bubbles would transport
particles from the fluidized section of the bed, rather than from the de-fluidized
section. This may be the means by which the hood grows: by bubbles created due to
the flow acceleration imposed by the submerged objects carrying particles from the
fluidized section to the top of the hood. This same pattern was observed by Hager and
Schrag as well (Figure 4). Furthermore, the hood ceases to grow once the bubbles are
large enough such that their explosion radius is sufficient to carry particles across the
dead hood. At this point, when REXPLOSION > RSPHERE, the hood will stop growing as
particles can be transported across the hood, thus giving motion to the top of the de-
fluidized region. This seems to explain the abrupt end in the hood growth – the hood
will stop growing once the bubbles caused by the submerged sphere are large enough
to re-fluidize the de-fluidized hood.

76
Nomenclature
Greek Symbols:
ε the bed voidage
ρp the density of the particles
ρg the density of the gas
ρf the density of the fluidized bed
ρs the density of the dead bed
μf the fluid viscosity
φ the spherecity which is the ratio of the surface area of a sphere of the same
volume as the particle to the surface area of the particle
Δ shape correction factor for the total particle
English Symbols:
A the cross sectional area of the bed
A(z) the submerged surface area of the sphere at the penetration depth z
Ar the Archimedes number
CD the drag coefficient
d the diameter of the immersed object
dm the mean particle diameter
ds the diameter of a particle with the same surface area as the actual particle
Dwetted the wetted diameter of the sphere at the penetration height, h
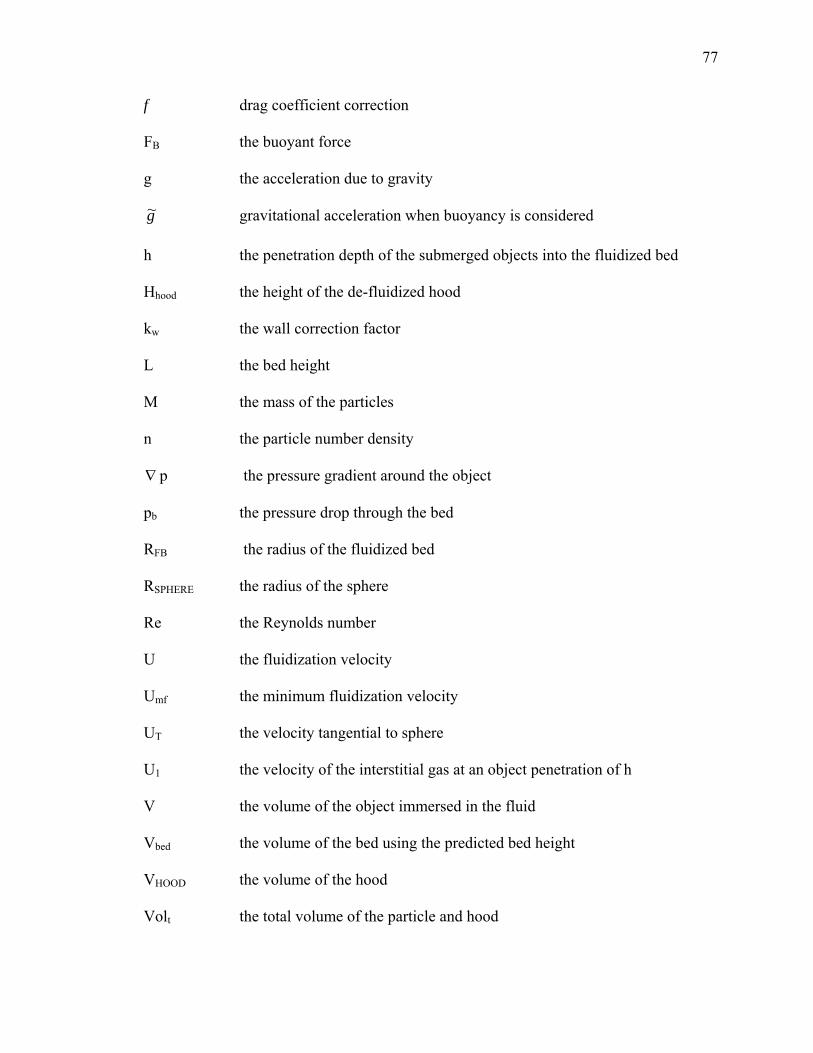
77
f drag coefficient correction
FB the buoyant force
g the acceleration due to gravity
g~ gravitational acceleration when buoyancy is considered
h the penetration depth of the submerged objects into the fluidized bed
Hhood the height of the de-fluidized hood
kw the wall correction factor
L the bed height
M the mass of the particles
n the particle number density
∇ p the pressure gradient around the object
pb the pressure drop through the bed
RFB the radius of the fluidized bed
RSPHERE the radius of the sphere
Re the Reynolds number
U the fluidization velocity
Umf the minimum fluidization velocity
UT the velocity tangential to sphere
U1 the velocity of the interstitial gas at an object penetration of h
V the volume of the object immersed in the fluid
Vbed the volume of the bed using the predicted bed height
VHOOD the volume of the hood
Volt the total volume of the particle and hood
78
References
Asif, M. (1998), “Segregation velocity model for fluidized suspension of binary mixture of particles,” Chemical Engineering and Processing, 37, pp. 279 – 2876. Batchelor, G.K. (1988), “A new theory of the instability of a uniform fluidized bed,” Journal of Fluid Mechanics, 193, pp. 75 – 110. Bowen, B.D. and Masliyah, J.H. (1973), “Drag force on axisymmetric particles in Stokes’ flow,” The Canadian Journal of Chemical Engineering, 51, pp. 8-15. Clift, R. and Gauvin, W.H. (1970), “The motion of particles in turbulent gas streams,” Proc. Chemeca, 1, pp. 14. Crowe, C., Sommerfield, M. and Tsuji, Y. (1998), Multiphase Flows with Droplets and Particles, CRC Press, New York. Davidson, J.F., Harrison, D. and Guedes de Carvalho, J.R.F. (1977), “On the Liquidlike Behavior of Fluidized Beds,” Annual Review of Fluid Mechanics, 9, pp. 55 – 86. Liu, F. and Orr, C. (1960), “Apparent Viscosity of Gas-Solid Fluidized Systems,” Journal of Chemical and Engineering Data, 5, pp. 430 – 432. Gilberson, M.A. and Eames, I. (2001), “Segregation patterns in gas-fluidized systems,” Journal of Fluid Mechanics, 433, pp.347 – 356. Glass, D.H., and Harrison, D. (1964), “Flow patterns near a solid obstacle in a fluidized bed,” Chemical Engineering Science, 19, pp. 1001 – 1002. Grace, J.R. and Hosney, N. (1985), “Forces on horizontal tubes in gas fluidised beds,” Chem. Eng. Res. Des., 63, pp. 191 – 198. Hager, W.R., and Schrag, S.D. (1976), “Particle circulation downstream from a tube immersed in a fluidized bed,” Chemical Engineering Science, 31, pp. 657 – 659. Howard, JR (1989), Fluidized Bed Technology: Principles and Applications, Adam Hilger, New York. Huilin, L., Yurong, H., Gidaspow, D., Lidan, Y. and Yukun, Q. (2003), “Size segregation of binary mixture of solids in bubbling fluidized beds,” Powder Technology, 134, pp. 86 – 97.

79
Jackson, Roy (2000), The Dynamics of Fluidized Particles, Cambridge University Press, New York. Jaeger, H.M., Liu C. and Nagel S.R. (1989), “Relaxation at the angle of repose,” Physical Review Letters, 62, pp. 40-43. Kulkarni, A. (1987), “Defluidized zone over a horizontally immersed tube in a fluidized bed,” Chemical Engineering Science, 42, pp. 1245 – 1247. Marzocchella, A., Salatino, P., Di Pastena, V. and Lirer, L. (2000), “Transient fluidization and segregation of binary mixtures of particles,” AIChe Journal, 46, 2175 – 2182. Mehrani, P. and Hsiaotao, T.B., Grace, J. (2005), “Electrostatic charge generation in gas-solid fluidized beds,” Journal of Electrostatics, 63, pp.165 – 173. Mostoufi ,N. and Chaouki, J. (1999), “Prediction of effective drag coefficient in fluidized beds,” Chemical Engineering Science, 54, pp. 851 – 858. Oshitani, J., Trisakti, B. and Tanaka, Z. (2001), “Evaluation of fluidized particle flow by measurement of apparent buoyancy,” Advanced Powder Technology, 12, pp. 95 – 104. Perry, R.H. and Green, D.W. (1998), Perry’s Chemical Engineers’ Handbook, McGraw-Hill, New York. Qiaoqun, S., Huilin, L., Wentie, L., Yurong, H., Lidan, Y. and Gidaspow, D., (2005), “Simulation and experiment of segregating/mixing of rice husk-sand mixture in a bubbling fluidized bed,” Fuel, 84, pp. 1739 – 1748. Rees, A.C., Davidson, J.F., Dennis, J.S. and Hayhurst, A.N. (2005), “The rise of a buoyant sphere in a gas-fluidized bed,” Chemical Engineering Science, 60, pp. 1143 – 1153. Rees, A.C., Davidson, J.F., Dennis, J.S. and Hayhurst, A.N. (2007), “The apparent viscosity of the particulate phase of the bubbling gas-fluidized beds: A comparison of the falling or rising sphere technique with other methods,” Chemical Engineering Research and Design, 85, pp.1341 – 1347. Tee, S., Mucha, P.J., Brenner, M.P. and Weitz, D.A. (2008), “Velocity fluctuations in a low Reynolds-number fluidized bed,” Journal of Fluid Mechanics, 596, pp. 467 – 475.