Embed Size (px)
Citation preview
Bumblebee flight distances in relation to the forage landscape
Juliet L. Osborne*; Andrew P. Martin*; Norman L. Carreck*; Jennifer L. Swain*; Mairi E.
Knight†; Dave Goulson‡; Roddy J. Hale¶ and Roy A. Sanderson**
* Department of Plant & Invertebrate Ecology, Rothamsted Research, Harpenden,
Hertfordshire, AL5 2JQ
† School of Biological Sciences, University of Plymouth, Drake Circus, Plymouth PL4 8AA;
‡ School of Biological & Environmental Sciences, University of Stirling, Stirling, FK9 4LA
¶ Bio-protection & Ecology Division, PO Box 84, Lincoln University, Canterbury, New
Zealand
**Institute for Research on Environment and Sustainability, Devonshire Building, University
of Newcastle, Newcastle-upon-Tyne, NE1 7RU.
Short title: Bumblebee flight range and foraging landscape
Corresponding Author: Dr Juliet Osborne, Department of Plant & Invertebrate Ecology,
Rothamsted Research, Harpenden, Hertfordshire, AL5 2JQ; phone: 01582 763133 ext 2738,
fax 01582 760981, email [email protected]
1

Summary
1. Foraging range is a key aspect of the ecology of “central place foragers”. Estimating how
far bees fly under different circumstances is essential for predicting colony success, and
for estimating bee-mediated gene flow between plant populations. It is likely to be
strongly influenced by forage distribution, something that is hard to quantify in all but the
simplest landscapes; and theories of foraging distance tend to assume a homogeneous
forage distribution.
2. We quantified the distribution of bumblebee (Bombus terrestris L.) foragers away from
experimentally positioned colonies, in an agricultural landscape, using two (mutually
reinforcing) methods. We mass-marked foragers as they left the colony, and analysed
pollen from foragers returning to the colonies. The data were set within the context of the
“forage landscape”: a map of the spatial distribution of forage as determined from
remote-sensed data. To our knowledge, this is the first time that empirical data on
foraging distances and forage availability, at this resolution and scale, has been collected
and combined for bumblebees.
3. The bees foraged at least 1.5 km from their colonies, and the proportion of foragers flying
to one field declined, approximately linearly, with radial distance. In this landscape there
was great variation in forage availability within 500 m of colonies but little variation
beyond 1 km, regardless of colony location.
4. The scale of B.terrestris foraging was large enough to buffer against effects of forage
patch and flowering crop heterogeneity, but bee species with shorter foraging range may
experience highly variable colony success according to location.
Keywords: borage, foraging range, pollen analysis, mass marking experiment
2

Introduction
Bumblebees have been widely used as model organisms for studying foraging economics and
behavioural strategies (Heinrich 1979; Pyke 1984; Goulson 1999). However, a key aspect of
their foraging behaviour, their foraging range, remains poorly understood. Estimating how
far bumblebees fly from their colonies to forage under different circumstances is essential for
understanding the spatial dynamics of forage resource use (Bronstein 1995; Osborne et al.
1999; Walther-Hellwig & Frankl 2000) and the potential for pollen transport between patches
or populations of plants (Schulke & Waser 2001). Resource usage is likely to affect the
success of the colonies (Schmid-Hempel & Schmid-Hempel 1998; Goulson et al. 2002;
Williams & Kremen 2007), so if we understand how bees respond to the spatial relationship
between nest and food resources, we can make predictions about colony survival and
distribution (Nakamura & Toquenaga 2002; Williams & Kremen 2007).
Theoretical models, predicting forager distributions for “Central Place Foragers” (deVries &
Biesmeijer 1998; Dukas & Edelstein-Keshet 1998; Cresswell, Osborne & Goulson 2000),
differ between those for species considered “social foragers” e.g. honeybees which
communicate information about resource location to nest mates, and those relying on
individual exploration to find resources e.g. bumblebees. Testing the models for honeybees
is feasible, because forager distributions can be documented by interpreting information from
the dances performed by bees returning to the colony (Visscher & Seeley 1982; Steffan-
Dewenter & Kuhn 2003). This technique cannot be used for bumblebees as they do not
appear to communicate information relating to the location of forage to their nestmates
(Dornhaus & Chittka 1999; Dornhaus & Chittka 2004). Therefore, although models exist
(Cresswell et al. 2000), there is limited empirical information on the distribution of
bumblebee foragers away from colonies.
3

There are estimates of the range over which bumblebees fly to forage made using mark-
reobservation techniques (Dramstad 1996; Walther-Hellwig & Frankl 2000), radar tracking
(Osborne et al. 1999), genetic analysis (Darvill, Knight & Goulson 2004; Knight et al. 2005)
or using statistical correlations (Westphal, Steffan-Dewenter & Tscharntke 2006). Greenleaf
et al (2007) provide a comprehensive review of foraging range studies for all bees, and
predict a strong relationship between maximum foraging range and body size; but from all
these studies it is not possible to determine the relationship between bee density (per unit area
of forage) and radial distance from the colony because of the limited number of bees
sampled, lack of quantification of the forage distribution, or differences in sampling effort
with distance from the colonies. If the method for recording bee distributions relies on
searching for bees at different distances from the nest (e.g. if they are marked), then the area
of the annulus to be searched (area of a ring centred on the nest) increases with the square of
the radial distance from the nest. So, even if the same number of bees flies to each distance
from a colony, the density of bees foraging at each distance will decline with the reciprocal of
the square of radial distance i.e. the bees will be spread more thinly, and thus be more
difficult to find (Schaffer 1996). To allow for this “annulus effect”, the area of forage at the
different distances needs to be taken into account.
The aim of our experiment was to quantify the spatial distribution of B.terrestris nectar and
pollen foragers away from experimental colonies in an arable landscape, using a novel mass-
marking technique and pollen analysis (Martin et al. 2006); and relate this to the spatial
distribution of habitats providing forage.
4

What shape would we expect the spatial distribution of bumblebee foragers away from a
colony to take? Hypotheses based on energy and time budgets have been used to make
predictions (Heinrich 1975; Heinrich 1979; Goulson 2003) and to develop spatially explicit
models (Dukas & Edelstein-Keshet 1998; Cresswell et al. 2000). Necessarily, such
predictions are based on simplified assumptions of resource distribution and bee behaviour.
If the distribution of forage patches (quantity and quality) is relatively homogeneous across
the landscape, then optimal foraging theory predicts that bumblebees will have a higher
probability of foraging close to the colony, thus reducing the energetic and time costs
associated with travel (Heinrich 1979). In this scenario, we expect the absolute number of
bees foraging in each annulus to decline with distance, and the density of bees on forage
patches also to decline with distance in a steeply exponential fashion.
Field studies have shown that some bumblebee species (including B. terrestris) forage at least
several hundred metres (Dramstad 1996; Osborne et al. 1999); and even kilometres from the
nest (2.2km in Kreyer et al. 2004). Walther-Hellwig & Frankl (2000) found 25% of
resightings between 1500 and 1750 m from the colony. These studies do not necessarily
conflict with the above prediction, because forage availability was not homogeneous at
different distances from the colonies (although suitable forage was noted as being available
near the colonies). One explanation for such long distance foraging is that the energy and
time spent travelling to patches are not costly enough to restrict the distances travelled in
proportion to the rewards gained during a foraging trip. B. terrestris fly at speeds of up to
15.7 km h-1 (Osborne et al. 1999; Riley et al. 1999), and flight uses approximately 1.2 kJh-1
(Ellington, Machin & Casey 1990), so travelling considerable distances is possible within a
few minutes and for little energetic cost. Dukas & Edelstein-Keshet (1998) have developed
spatially explicit models to predict the optimal distribution of social food provisioners away
5

from a colony, comparing three different foraging currencies (energy intake rate, efficiency
and lifetime fitness) and they predict that the proportion of foragers going to different
distances from the colony declines relatively slowly, regardless of currency in the model.
Similarly, Cresswell et al. (2000) predict, using realistic parameters for time and energy
expenditure, that if forage resources are meagre then bumblebees can forage profitably at
rewarding flower patches > 4 km distant from their nest.
A different scenario would arise if worker behaviour results in an Ideal Free Distribution of
foragers in the landscape (reviewed in Dukas & Edelstein-Keshet 1998; Goulson 2003). This
predicts that foragers will distribute themselves evenly over the good forage available
(assuming equivalent quantity and quality), regardless of distance from the colony. The
result of such behaviour would be that the absolute number of foraging bees in each annulus
actually increases with distance, as the density remains constant.
None of these scenarios take into account either the heterogeneity in the spatial distribution of
forage (which is considered in our experiment) or behavioural parameters unrelated to energy
/ time budgets (but see Dukas & Edelstein-Keshet 1998). Such parameters include the
likelihood that the bees will find patches of forage at some distance from the colony, the
likelihood that they will stop to forage when they find a patch, the difference between nectar
and pollen foragers (Peat & Goulson 2005), and the possibility that they may forage away
from the colony to reduce competition, predation and parasitism pressure (Dramstad 1996;
Dukas & Edelstein-Keshet 1998).
One difficulty in demonstrating the spatial distribution of bumblebees has been finding a
technique to allow sufficient data collection at long distances from the colonies. We describe
6

an experiment to examine the relationship between the distribution of B. terrestris and
distance from the colony in an arable landscape using a mass-marking technique, and a novel
forager trapping technique to analyse pollen being brought into the colony (Martin et al.
2006). The new equipment allowed marking and re-observation of far more bees than have
previously been examined, and collection of incoming pollen loads, giving two methods for
estimating forager distribution for the same set of bumblebee colonies. We then set this
within the context of all the forage available to the experimental colonies in the landscape.
Methods
STUDY AREA
The experiment was carried out on the Rothamsted estate (Hertfordshire, UK) comprising
approximately 260 ha of arable farmland, and 60 ha of woodland. A 2 ha field of borage,
Borago officinalis L. (cv. Kings Gladiator) was sown on the north-east edge of the farm
(Fig.1), bordered on its northern edge by houses with gardens. Bumblebee colonies were
arranged along a transect 1.5km in length, originating at the borage field and running towards
the south-west. A month earlier, Knight et al. (2005) used the same transect to estimate
foraging range and nest density for four bumblebee species, including B.terrestris.
Borage was used as the target forage source because it provides copious nectar and pollen for
bumblebees (Osborne 1994) and has a distinctive, cream coloured pollen grain which is
unlikely to be mistaken for another species. The habitat survey (Appendix S1) showed there
was very little, if any, other borage growing in the surrounding landscape, except possibly a
small number of plants in gardens, so it could be confidently assumed that foragers returning
to the colony with borage pollen had been foraging on the sown field.
7
BUMBLEBEE COLONIES
Twenty eight bumblebee (B. terrestris audax) colonies were reared (by Koppert BV, The
Netherlands) using queens captured on and around Rothamsted Farm while they were
searching for nest sites during Spring 2002. On 1st July, when the borage crop had begun to
flower, four colonies (one small with <50 workers, two medium with 50 – 100 workers and
one large with >100 workers) were placed at each of seven transect points, placed at
approximately 250 m intervals along its length, and coinciding with field boundaries where
wild bumblebee colonies could have established (Fig. 1). At each site the colonies (each in a
small honeybee hive described in Martin et al. 2006) were placed 2 m apart, with their
entrances facing into the field on whose boundary they were sited (Table 1). They were left in
place for ten days before beginning the experiment to allow the bees to settle and orientate.
Colonies were fitted with modular entrances (Martin et al. 2006), enabling us to trap foragers
as they entered the hive, or automatically mark bees with coloured dye powder as they
walked through the hive entrance. When not trapping or marking bees (i.e. most of the time),
a standard entrance was fitted.
At the end of the experiment (2nd August) colonies were collected after sunset and killed by
freezing. The nest weight, nest volume and final number of workers were recorded.
TRAPPING OF INCOMING FORAGERS
On 7 occasions (between 12th and 30th July) during borage flowering, foragers returning to
the colonies were captured using the forager trap modules, so that pollen loads being brought
into the colony could be sampled (Martin et al. 2006). The traps were placed in the hive
entrances for 20 or 30 minutes, depending on forager activity, so that they caught around 20
8
foragers, and traps were placed on the colonies at all sites over a period of about 2 hours.
After narcotising the bees in a trap with CO2 for 30 seconds, the total number of bees, the
number of bees carrying pollen loads and the colours of the pollen loads were recorded, and a
sample of each colour load was taken for later microscopic identification. The foragers were
then returned to their colony, within an hour of being caught.
OBSERVATION OF MARKED BEES
The dye dispenser modules allowed bees to be marked with site-specific colours as they left
their colonies, and they were then observed foraging on the borage field. Seven different
powder dye colours (Stirling Industrial Colours Ltd., Ciba Speciality Chemicals Ltd) were
used to distinguish between bees from the different sites. All four colonies at each site had
the same colour dye, so marked bees could be identified to site but not to colony. Site A used
violet, B red, C orange, D yellow, E green, F blue and G pink. The dispensers were fitted to
the colonies for 2 - 3 days each week, during four weeks of flowering (normally starting on
the day after the forager traps were used). They were fitted to the colonies the day before
marked bee observations were to be made, so that all the foragers, including overnight
absentees, were likely to be marked; and they were removed after 2 - 3 days.
Whilst the dispensers were on the colony, observers searched for marked bees on the borage
field by walking a 1km “strip” (20 x 50 m parallel lengths, each separated by ca. 12 m)
covering the whole field, at a speed of ca. 10 m per minute. Marked bees seen in a 1m wide
strip on one side of the observer were recorded. These walks were done over four 2 day
periods when dispensers were in place (between 12th July and 2nd August), and the number of
marked bees recorded was summed for all transects walked on each sampling occasion. Each
sampling occasion was a morning or afternoon when 2 or 3 transect walks were carried out
9

simultaneously (by different observers starting at different points). There were 11 sampling
occasions, comprising a total of 31 x 1 km walks. All observations were performed in dry
weather between 10.00 and 17.30 h when the temperature was above 15 °C.
THE “FORAGE LANDSCAPE”
Remote-sensed data derived from the Ikonos satellite (Space Imaging Inc.) and NERC
compact airborne spectrographic imagery (CASI) air photography, both taken in June 2002,
were used to create a high resolution map(1 pixel represents 2 x 2 m) of a 10 x 10km area in
Hertfordshire, centred on Rothamsted Research. Standard supervised classification of the
georectified raw multi-spectral imagery was undertaken using Erdas Imagine (Erdas
Software, 2004). Ground truth data, for the training areas needed in the supervised
classification, were collected using the NCC Phase 1 habitat survey technique (Nature
Conservancy Council 1990), modified to make it relevant to bumblebee resource
requirements by recording the species and number of flowering plants available to bees in
each habitat. The methodology for the surveys and calculation of forage scores is described
in Appendix S1. In summary, field surveys were undertaken in spring, early summer and late
summer so that variation in the abundance of flowering plants could be monitored over time.
The final classified map contained 25 land cover types and each was given a forage rank of 0
to 3 (Table S1) on the basis of flower density and the likely usage of the plant families
present by B.terrestris; summarised from comparative studies and reviews (Fussell & Corbet
1991; Fussell & Corbet 1992; Dramstad & Fry 1995; Carvell et al. 2001; Goulson et al.
2005; Benton 2006) (Table S2). The land cover types providing most forage during the
experiment (forage rank = 2 or 3 equating to habitats with at least 250 flower units per 40m2
of good forage for bumblebee feeding, and usually substantially more: Appendix S1) were
the borage field itself, spring oilseed rape (Brassica napus L.) fields, field bean (Vicia faba
10
L.) fields, gardens, hedgerows, ruderal habitat and scrub. To put the results into the context
of the overall “forage landscape”, the proportion of the classified landscape (Fig. 1)
containing these land cover types, known to be particularly good for foraging bumblebees,
was calculated by placing circles of increasing radii (by 250 m) centred on each colony site
onto the map. This allowed us to build a picture of the “forage landscape” available to each
set of bumblebee colonies; and also to calculate the relative contribution of the borage field to
the forage available in annuli at different distances from each colony.
ANALYSIS
Interpretation of the distribution of bees away from the colonies relies on the colonies at the
different sites having similar foraging activity, and the efficiency of the dye dispensers being
similar for all colonies (confirmed in Martin et al 2006). To confirm that foraging activity
was similar, a two-way ANOVA was performed on the number of foragers caught in each
trap (log10 (x+1)) to compare forager activity between sites and trapping occasion. To
confirm whether colony performance at different sites could be assumed to be similar
throughout the experiment, a one-way ANOVA was performed on the following log10
transformed variables: final number of workers collected in the colonies; final nest weight (g)
and final estimated nest volume (cm3).
Generalised Linear Models (GLM), with binomial error structure and logit link (Genstat
version 9, VSN, Hemel Hempstead), were used to test the effect of sampling occasion and
distance (between borage field and colony site) on: a) the number of pollen foragers as a
proportion of total bees caught in forager traps and; b) the number of pollen foragers
returning with borage pollen loads as a proportion of the total number of pollen foragers
caught in the forager traps (i.e. the proportion of pollen foragers reaching the target field).
11

A Generalised Linear Model, with Poisson error structure and log link, was used to explain
the relationship between distance (between borage field and colony site) and the number of
marked bees of each colour seen on the borage field on each sampling occasion. The number
of marked bees leaving the colonies at each site (over a 10 min period) on each sampling
occasion was included as a co-variate, accounting for any differences in colony activity
(including effects of vandalism at site A). With regard to dye dispenser efficiency, Martin et
al (2006) showed (for the same colonies) that the dye dispensers marked 87% of the bees
leaving the nests, and there was no difference in their effectiveness between sites or sampling
occasions. They showed there was a significant effect of colony position on the persistence
of dye on the returning bees so “persistence” (= average percentage of bees returning with a
mark / average percentage of bees leaving with a mark per site per week) was used as a
second covariate in the GLM, before adding distance. A variable describing the proportion of
forage available that was borage at a given distance from the colony was also included to
account for the fact that the colonies were placed at different sites, and therefore experienced
the borage in different contexts, and the area available to search for forage increased with
distance from the colony. This variable (borage%forage250) was calculated by estimating
(from the classified landscape) the number of 2 m cells within a 250 m wide annulus which
contained habitat with good forage (borage, spring oilseed rape, field bean, hedgerows,
gardens, scrub or ruderal vegetation) and the percentage of those that were borage. For each
colony site, this variable was calculated for an annulus of the radius at which the borage field
occurred e.g. for site A it was calculated for a 0-250 m around this site, and for site B it was
calculated for a 250-500 m annulus around site B (Table 1, Fig. 1).
Results
12
COLONY COMPARISONS
Bees from all colony sites along the transect foraged for both nectar and pollen on the borage
field. Of the 28 colonies, two were vandalised at site A during the third week of the
experiment, but many workers from these colonies joined the un-vandalised colonies at this
site (Table 1). The effects of this vandalism at site A on the marked bee counts (Fig 2b) was
taken into account by using colony activity as a co-variate in the GLM (see below).
Counts of bees caught in the forager traps over different dates showed that the foraging
activity levels were significantly different between sites (2 way anova: effect of site: F6,139 =
3.9; P = 0.001) (Table 1; Fig 2a),. There were no significant differences between sites in the
final number of workers collected in the colony (F5, 23 = 2.29; P = 0.09 when site A removed),
nest weight (g) after the colonies had been collected (F6, 25 = 2.29; P = 0.08) or estimated nest
volume (cm3; F6, 25 = 1.12; P = 0.39) (Table 1).
TRAPPING OF INCOMING FORAGERS
On all sampling occasions, bees returned to all colonies with pollen. The number of pollen
collectors as a proportion of the number of bees caught did not vary with distance of the
colony from the borage field (F1,171 = 3.67, P > 0.05), but varied significantly with sampling
occasion (F6,171 = 5.87, P < 0.001).
Figure 2a shows the number of pollen foragers trapped at each site (all colonies) carrying
different coloured pollen loads over the whole experiment. The cream coloured pollen was
microscopically confirmed to be 99% borage. Bees at all sites returned with borage pollen.
The non-borage pollen was a mixture of types: primarily oilseed rape and bramble, Rubus
spp. L. At site A, next to the borage field, an average of 62.9% of pollen foragers returned
13

with borage pollen (represented as a proportion 0.63 on Fig 3). At site G, 1.5 km from the
borage field, an average of 16.9% of pollen foragers brought back borage pollen. The best
fitting binomial GLM for the proportion of incoming pollen foragers with borage pollen loads
per colony, included distance from the borage field (F1,153 =63.56, P < 0.001, Fig. 3), and
sampling occasion (F6,153=7.56, P < 0.001; the interaction was not significant; percentage
deviance accounted for by this model was 41.6%). The average proportion of borage
foragers returning to a colony was 14.0% for the first occasion, which was significantly lower
than for the other six occasions, when average proportions of borage foragers ranged from 31
- 46% (see Fig. 4 in Martin et al, 2006). At the range of distances tested, the negative
relationship between distance and borage pollen foraging was approximately linear (Fig. 3).
OBSERVATION OF MARKED BEES
A total of 297 marked bees were seen foraging on the borage field on the 31 km walked over
the 11 sampling occasions (Fig 2b). The maximal GLM (Poisson, log link) for the number of
marked bees found on the borage had terms fitted for 3 covariates (colony activity, dye
persistence, borage%forage250) and distance, and interactions of the three co-variates with
distance. Dye persistence, and its interaction with distance, gave no significant change in
deviance when dropped from the model. The other terms were all significant and retained in
the model (percentage deviance accounted for by this model was 70.1%). So, having
accounted for colony activity levels (F1,71 = 12.85, P < 0.001) and the relative area covered by
the borage field compared to other forage (borage%forage250: F1,71 = 93.93, P < 0.001) there
was still a significant negative effect of distance from the colony on the number of marked
bees found on the borage (F1,71 = 45.82, P < 0.001: Fig. 4).
THE “FORAGE LANDSCAPE”
14

The colonies at sites A to G experienced landscapes with differing proportions of suitable
foraging habitat particularly close to the nests (Fig. 5). Bees at sites A and F had forage
available on most of the land within about 300 m of their nests; because site A was next to
the borage field and site F was next to a field bean field. In contrast, bees at the other sites
had forage available over 5 - 20% of the land within 300 m of their nests. Interestingly, Fig.
5 also shows that, if we consider the forage landscape available to bees within 1 - 3 km from
their nest, colonies sited in different places all had similar prospects with 20 - 30% of land
providing suitable forage within 1 - 3 km of each nest.
Discussion
The results of this experiment provide the first empirical demonstration of where bumblebees
travel to forage, in the context of the spatial distribution of all the foraging habitats available
to them in the landscape. B. terrestris travelled routinely to collect nectar and pollen from the
field of borage at least 1.5 km away from their colonies, in a landscape providing forage
resources at all distances (Fig. 5). Unfortunately, it was not possible to use a longer transect,
to find the maximal foraging range. The model fitted to the results (Fig. 3) predicted that the
percentage of borage pollen foragers would be close to zero (< 0.5 %) for colonies positioned
4 km from the borage field.
One might have expected the colonies to perform differently from each other since they were
placed in different locations but, although foraging activity differed between colonies (Table
1), the number of workers in the non-vandalised colonies at the end of the experiment and the
weight of these colonies did not vary between sites (Table 1). This could be a reflection of
the fact that each colony was able to provision from similar “forage landscapes” (Fig. 5) at
the scale of kilometres, although availability of forage habitats differed at the local scale.
15
The borage field did represent a varying proportion of the forage available to each colony at
the measured distances, and this was accounted for as a covariate in the marked bee analysis.
FORAGER DISTRIBUTIONS WITH DISTANCE
We used new equipment to gather two forms of data on forager distributions, and the results
were mutually reinforcing. Trapping returning pollen foragers showed bees collected borage
pollen at all distances, and the proportion declined with distance in an approximately linear
fashion (Fig. 3). There was not a steep exponential decline, suggesting that,the energetic or
time costs of travelling over such distances were not prohibitive compared to the rewards
gained (Heinrich 1979; Cresswell et al. 2000) for B. terrestris in this environment. Marked
bees from all distances (0-1.5 km) were seen on the borage. Looking at all marked bees seen
from each colony site (Fig 2b), the decline with distance was quite steep, but once colony
activity, area surveyed and contribution of borage to forage landscape were taken into
account, the relationship between marked bee numbers and distance (Fig. 4) showed a
shallow decline in forager density with radial distance. Both these relationships (Fig. 3, 4)
are comparable with the prediction made by Dukas & Edelstein-Keshet (1998) for “solitary”
provisioners (i.e. not communicating with each other) of a single nest site, when food
parameters do not change with distance and direction from the nest, and rate of energy intake
is maximised.
The distribution of foragers with distance may also be affected by the probability of bees
finding the borage field in the first place, and the chances of stopping at it. If searching for
food away from the nest, there is presumably a higher probability that they will find a patch
close to the colony and stop there before exploring further afield. Reynolds et al. (2007; in
press) have mathematically characterised search strategies of individual honeybees, but there
16

is little published information on the strategies used by bumblebees to search for food
resources in relation to their colony; and then which of those patches they choose to exploit.
THE EFFECT OF FORAGE LANDSCAPE ON FLIGHT DISTANCES
Borage is known to be highly attractive to the bees and it is possible that, because of its high
visibility and copious nectar and pollen, the field attracted more bees from longer distances
than would have been the case for other large forage patches in the landscape. Colonies at
site F had plentiful local forage (Fig. 5), but approximately 30% of the pollen foragers still
travelled 1.4 km to forage on the borage (Fig. 3). However, in terms of area, the borage field
only represented a very small proportion of the foraging landscape for colonies at the far end
of the transect (column 3 in Table 1). The other major forage patches in this landscape were
spring-sown flowering oilseed rape fields, field bean fields and gardens. When B. terrestris
were given a choice of flowering crop plant species (growing in patches in a Latin Square
design in a cage) the bees showed a strong preference for oilseed rape, followed by borage
and then field bean (Osborne et al. unpublished). In terms of quantity and quality of
resources, both these pieces of evidence suggest that it is unlikely that the borage field
provided a foraging resource to over-ride the attractiveness of any other source.
Nevertheless, the density-distance curves should be interpreted with caution, because the
slope will vary depending on the relative attractiveness of rewards available in different plant
species (Cresswell et al. 2000). It is also likely that bees foraging on the borage were
providing chemical cues to their fellow nest mates, signalling the presence of a good food
source in the landscape (Dornhaus & Chittka 2001; Dornhaus & Chittka 2004), potentially
increasing the chances of the bees finding the borage as a result of responding to olfactory
cues learnt within the colony.
17

The experiment was performed in just one landscape, dominated by arable agriculture and
some suburban areas. The results are therefore specific to this environment, although the
proportions of different landcover types are not untypical of the South of England. If
classified maps of other areas were available (created using a similar methodology to that
described in Appendix S1) then estimates of spatial forage availability could be made (like
Fig. 5) to establish the scale at which bumblebees are likely to experience resource variation
in the landscape.
Within this arable landscape, the “forage landscape” within 1 to 3 km of the colonies was
similar, regardless of the position of those colonies within the landscape (Fig. 5). So, for B.
terrestris, the location of the colonies may not limit their success in terms of forage
availability because this species can clearly forage at the appropriate range. Our results
support the conclusion of Westphal et al. (2006) that the scale at which landscape context
affects bee populations will depend on the species’ foraging range. In contrast to Westphal et
al. (2006) our experiment shows the response of individual colonies to the landscape, rather
than making statistical correlations between landscape elements and forager numbers from
unknown colony locations. Walther-Hellwig & Frankl (2000) described B.terrestris as a
spatial generalist, making the most of temporary large-scale resources. Species like B.
terrestris, with substantial foraging ranges (over thousands of metres), will be buffered from
variation in forage habitat availability which may be more evident and limiting at a smaller
scale (over a few hundred metres). In this experiment, the colonies did not perform
differently at the different sites (Table 1), and Fig. 5 shows, since they foraged to the ranges
measured, the amount of forage might not affect relative colony success in this landscape
because all have similar “forage landscapes”. This is not to say that forage availability does
not limit colony success; B. terrestris colonies have been found to grow faster when placed in
18

extensive suburban areas compared to agricultural landscapes, probably because more forage
is available (Goulson et al. 2002). Our results suggest that, within this landscape, and for a
species with a relatively long foraging range such as B. terrestris, there is little variance in the
quality of nest site locations (Osborne et al. 2007) with regard to forage availability.
It would be interesting to perform the same experiment using species such as Bombus
pascuorum Scopoli, Bombus sylvarum L. or Bombus muscorum L. which are believed to be
“doorstep foragers”, only flying within a few hundred metres of the nest (Walther-Hellwig &
Frankl 2000; Darvill et al. 2004; Knight et al. 2005). The positioning of colonies of these
species, and the variability in availability of local forage between sites that we have
demonstrated (Fig. 5), may potentially have more serious consequences on the foraging
behaviour and ultimate success of their populations. It seems probable that differences in
foraging range between bumblebee species may provide a partial explanation as to why a
small number of species (including B. terrestris) remain common in arable landscapes while
many other species have disappeared from intensively farmed areas.
The results presented here, linking the spatial availability of resources with bumblebee flight
distances, will inform the current debate about whether distribution of food resources is the
prime cause of rarity in bumblebee species (Goulson et al, 2005; Williams 2005). They can
also be utilised to parameterise models of gene flow between fields of crops (Cresswell,
Osborne & Bell 2002; Damgaard, Simonson & Osborne in press), or populations of plants,
which are based on a mechanistic understanding of how bees move across landscapes to
utilise patches of plants providing nectar and pollen, whilst effecting pollination in the
process.
19

Acknowledgements
We thank Ashley Tuck for help with fieldwork, and Suzanne Clarke for statistical advice.
This work was funded by the Biotechnology and Biological Sciences Research Council, from
which Rothamsted Research receives grant aided support.
References
Benton, T. (2006) Bumblebees. HarperCollins, London.
Bronstein, J.L. (1995) The plant-pollinator landscape. In: Mosaic landscapes and ecological
processes (eds L. Hansson, L. Fahrig & G. Merriam), pp. 256-288. Chapman and Hall,
London.
Carvell, C., Pywell, R., Smart, S. & Roy, D. (2001) Restoration and management of
bumblebee habitat on arable farmland: literature review. Report on Defra project
BD1617, CEH Publication, UK.
Cresswell, J.E., Osborne, J.L. & Goulson, D. (2000) An economic model of the limits to
foraging range in central place foragers with numerical solutions for bumblebees.
Ecological Entomology, 25, 249-255.
Cresswell, J.E., Osborne, J.L. & Bell, S. (2002) A model of pollinator-mediated gene flow
between plant populations, with numerical solutions for bumble bees pollinating oilseed
rape. Oikos, 98, 375-384.
Damgaard, C., Simonsen, V. & Osborne, J.L. (in press) Prediction of pollen-mediated gene
flow between red clover (Trifolium pratense) fields. Environmental Modeling and
Assessment
Darvill, B., Knight, M.E. & Goulson, D. (2004) Use of genetic markers to quantify
bumblebee foraging range and nest density. Oikos, 107, 471-478.
deVries, H. & Biesmeijer, J.C. (1998) Modelling collective foraging by means of individual
behaviour rules in honey-bees. Behavioral Ecology and Sociobiology, 44, 109-124.
Dornhaus, A. & Chittka, L. (1999) Evolutionary origins of bee dances. Nature, 401, 38.
Dornhaus, A. & Chittka, L. (2001) Food alert in bumblebees (Bombus terrestris): possible
mechanisms and evolutionary implications. Behavioral Ecology and Sociobiology, 50,
570-576.
Dornhaus, A. & Chittka, L. (2004) Information flow and regulation of foraging activity in
bumble bees (Bombus spp.). Apidologie, 35, 183-192.
20

Dramstad, W. & Fry, G. (1995) Foraging activity of bumblebees (Bombus) in relation to
flower resources on arable land. Agriculture, Ecosystems & Environment, 53, 123-135.
Dramstad, W.E. (1996) Do bumblebees (Hymenoptera, Apidae) really forage close to their
nests? Journal of Insect Behavior, 9, 163-182.
Dukas, R. & Edelstein-Keshet, L. (1998) The spatial distribution of colonial food
provisioners. Journal of Theoretical Biology, 190, 121-134.
Ellington, C.P., Machin, K.E. & Casey, T.M. (1990) Oxygen consumption of bumblebees in
forward flight. Nature, 347, 472-473.
Fussell, M. & Corbet, S.A. (1991) Forage for bumble bees and honey bees in farmland: A
case study. Journal of Apicultural Research, 30, 87-97.
Fussell, M. & Corbet, S.A. (1992) Flower usage by bumble-bees: A basis for forage plant
management. Journal Applied Ecology, 29, 451-465.
Goulson, D. (1999) Foraging strategies for gathering nectar and pollen in insects.
Perspectives in Plant Ecology, Evolution and Systematics, 2, 184-209.
Goulson, D. (2003) Bumblebees; their behaviour and ecology. Oxford University Press,
Oxford.
Goulson, D., Hughes, W.O.H., Derwent, L.C. & Stout, J.C. (2002) Colony growth of the
bumblebee, Bombus terrestris, in improved and conventional agricultural and suburban
habitats. Oecologia, 130, 267-273.
Goulson, D., Hanley, M.E., Darvill, B., Ellis, J.S. & Knight, M.E. (2005) Causes of rarity in
bumblebees. Biological Conservation, 122, 1-8.
Greenleaf, S.S., Williams, N.M., Winfree, R. & Kremen, C. (2007) Bee foraging ranges and
their relationship to body size. Oecologia, DOI 10.1007/s00442-007-0752-9
Heinrich, B. (1975) Energetics of pollination. Annual Review of Ecology and Systematics, 6,
139-170.
Heinrich, B. (1979) Bumblebee economics. Harvard University Press, Cambridge, Mass.
Knight, M.E., Bishop, S.E., Martin, A.P., Osborne, J.L., Hale, R.J., Sanderson, R.A. &
Goulson, D. (2005) An interspecific comparison of foraging range and nest density of
four bumblebee (Bombus) species. Molecular Ecology, 14, 1811-1820.
Kreyer, D., Oed, A., Walther-Hellwig, K. & Frankl, R. (2004) Are forests potential
landscape barriers for foraging bumblebees? Landscape scale experiments with Bombus
terrestris agg. and Bombus pascuorum (Hymenoptera, Apidae). Biological Conservation,
116, 111-118.
21
Martin, A.P., Carreck, N., Swain, J.L., Goulson, D., Knight, M.E., Hale, R.J., Sanderson,
R.A. & Osborne, J.L. (2006) A modular system for trapping and mass-marking
bumblebees: applications for studying food choice and foraging range. Apidologie, 37,
341-350.
Nakamura, H. & Toquenaga, Y. (2002) Estimating colony locations of bumble bees with
moving average model. Ecological Research, 17, 39-48.
Nature Conservancy Council (1990) Handbook for Phase 1 habitat survey: a technique for
environmental audit. NCC Publications Division, UK.
Osborne, J.L. (1994) Evaluating a pollination system: Borago officinalis and bees. PhD
Thesis, University of Cambridge, Cambridge
Osborne, J.L., Clark, S.J., Morris, R.J., Williams, I.H., Riley, J.R., Smith, A.D., Reynolds,
D.R. & Edwards, A.S. (1999) A landscape scale study of bumble bee foraging range and
constancy, using harmonic radar. Journal of Applied Ecology, 36, 519-533.
Osborne, J.L., Martin, A.P., Shortall, C.R., Todd, A.D., Goulson, D., Knight, M.E., Hale, R.J.
& Sanderson, R.A. (2007) Quantifying and comparing bumblebee nest densities in
gardens and countryside habitats. Journal of Applied Ecology, doi: 10.1111/j.1365-
2664.2007.01359.x,
Peat, J. & Goulson, D. (2005) Effects of experience and weather on foraging efficiency and
pollen versus nectar collection in the bumblebee, Bombus terrestris. Behavioural
Ecology and Sociobiology, 58, 152-156.
Pyke, G.H. (1984) Optimal foraging: A critical review. Annual Review of Ecology and
Systematics, 15, 523-575.
Reynolds, A.M., Smith, A.D., Menzel, R., Greggers, U., Reynolds, D.R. & Riley, J.R. (2007)
Displaced honey bees perform optimal scale-free search flights. Ecology, 88, 1955-1961.
Reynolds, A.M., Smith, A.D., Reynolds, D.R., Carreck, N.L. & Osborne, J.L. (in press)
Honeybees perform optimal scale-free searching flights when attempting to locate a food
source. Journal of Experimental Biology, in press
Riley, J.R., Reynolds, D.R., Smith, A.D., Edwards, A.S., Osborne, J.L., Williams, I.H. &
McCartney, H.A. (1999) Compensation for the wind by foraging bumble bees. Nature,
400, 126.
Schaffer, M.J. (1996) Spatial aspects of bumble bee (Bombus spp: Apidae) foraging in farm
landscapes. M. Ap. Sci Thesis, Lincoln University, New Zealand.
22

Table S2. Plant families recorded during the habitat survey, and assigned “family Forage Quality
Value” (FQV).
Table S1. Table S1. Landcover types recorded during the habitat survey, together with their
overall rank as foraging sources.
Appendix S1. A habitat survey technique for quantifying bumblebee “forage landscapes”
The following material is available for this article online:
Supplementary Material
Williams, N.M. & Kremen, C. (2007) Resource distributions among habitats determine
solitary bee offspring production in a mosaic landscape. Ecological Applications 17, 910-
921.
Williams, P. (2005) Does specialization explain rarity and decline British bumblebees? - A
response to Goulson et al. Biological Conservation, 122, 33-43.
Westphal, C., Steffan-Dewenter, I. & Tscharntke, T. (2006) Bumblebees experience
landscapes at different spatial scales: possible implications for coexistence. Oecologia,
149, 289-300.
Walther-Hellwig, K. & Frankl, R. (2000) Foraging habitats and foraging distances of
bumblebees, Bombus spp. (Hym., apidae), in an agricultural landscape. Journal of
Applied Entomology, 124, 299-306.
Visscher, P.K. & Seeley, T.D. (1982) Foraging strategy of honeybee colonies in a temperate
deciduous forest. Ecology, 63, 1790-1801.
Steffan-Dewenter, I. & Kuhn, A. (2003) Honeybee foraging in differentially structured
landscapes. Proceedings of the Royal Society of London Series B-Biological Sciences,
270, 569-575.
Schulke, B. & Waser, N.M. (2001) Long-distance pollinator flights and pollen dispersal
between populations of Delphinium nuttallianum. Oecologia, 127, 239-245.
Schmid-Hempel, R. & Schmid-Hempel, P. (1998) Colony performance and
immunocompetence of a social insect, Bombus terrestris, in poor and vairable
environments. Functional Ecology, 12, 22-30.
23

24
Table 1 Details of colonies placed at each site on the transect (Fig. 1), with distance to centre of borage field, calculated borage%forage250
(covariate for percentage of “forage landscape” occupied by the borage field) and average (±s.e.)parameters to compare nest activity. n = 4 for
each site. Results of ANOVAs to compare colony performance between sites are presented (sampling occasion was included in the ANOVA
for forager activity).
Site Distance (m)to mid-borage field
neighbouring boundary borage%forage250 @ annular range
Av. forager trap count / 20mins-1, n=28
Av. Final no. workers collected
Av. nest weight (g)
Av. estimated nest vol (cm3)
A 125 fenceline, low vegetation, no hedge
24.8 @ 0-250 m 19.10 ± 2.69 * 140.0 ± 32 † 140.7 ± 28.4 † 490 ± 227 b
B 375 1-2m hedge and trees
13.19 @ 250-500 m 16.11 ± 1.99 38.5 ± 11.4 115.5 ± 21.7 628 ± 156
C 625 grass by cereal field, no hedge
6.85 @ 500-750 m 18.21 ± 1.71 82.3 ± 17.9 197.8 ± 18.4 787 ± 39
D 875 fenceline with unmown grass
2.82 @ 750-1000 m 17.75 ± 2.09 34.8 ± 9.8 151.7 ± 21.0 649 ± 177
E 1125
woodland edge
3.34 @ 1000-1250 m 8.25 ± 1.43 17.3 ± 1.5 105.8 ± 11.7 444 ± 82
F 1375 woodland hedge
5.16 @ 1250-1500 m 14.21 ± 1.42 39.3 ± 12.8 129.5 ± 22.1 522 ± 98
G 1625 tall hedge
3.83 @ 1500-1750 m 12.04 ± 1.64 28.8 ± 10.2 125.8 ± 16.6 646 ± 75
F values from ANOVA
:
Occasion F6,139 = 3.91
Site F6,139 = 3.90
O*S F36,139 = 0.91
F6,25 = 4.80
‡ F5,23 = 2.29
F6,25 = 2.29 F6,25 = 1.12
Probability : Occasion P = 0.001
Site P = 0.001
O*S P = 0.615
P = 0.004
‡ P = 0.09
P = 0.08 P = 0.39
* N = 20 for site A because of vandalised colonies † N = 2 for site A because of vandalised colonies ‡ Without including site A where colonies were vandalised, and workers transferred to remaining colonies

Figure legends
Figure 1 Central 4 x 4 km area of classified landcover map (from satellite image) showing
layout of experiment and forage available in surrounding landscape A - G = 7 sites on
transect, each with four bumblebee colonies. Black area = field of borage. Grey pixels =
habitat providing nectar and pollen during the experiment (spring-sown oilseed rape fields,
field bean fields, hedgerows, gardens, ruderal and scrub). Gridlines = kilometre squares (UK
National Grid reference of bottom left corner: TL1012).
Figure 2 Summary of samples over the whole experiment a) Total pollen loads collected at
each colony site, separated by colour of load. Cream loads were 99 % borage, yellow loads
were primarily oilseed rape, Brassica napus; grey pollen was primarily bramble, Rubus spp.;
and black pollen was primarily poppy, Papaver rhoeas L.. b) Total marked bees seen on
borage, arriving from each colony site.
Figure 3 Relationship between colony - borage distance and the proportion of pollen-
foraging bees collecting borage pollen (converted to percentages in text). Fitted line is for the
best GLM model (distance + sampling occasion). Points are back-transformed observed
values, adjusted for the effect of sampling occasion.
Figure 4 Relationship between colony - borage distance and the number of marked bees
seen per sampling occasion on the borage field. Fitted line is for the best GLM model
(distance + two co-variates: colony activity level and borage%forage250 ). Points are back-
transformed observed values, adjusted for the effect of the two covariates.
Figure 5 Forage landscape for colonies at each site A – G, estimated by calculating the
proportion of the landscape containing good forage habitats at different radial distances from
each site (see text).
25

Figure 1
N
1 km
26

Figure 2
a)
0
50
100
150
200
250
A B C D E F GColony site along transect
No.
pol
len
load
s
mixedotheryellowgreyblackcream
b)
0
20
40
60
80
100
120
A B C D E F GColony site along transect
No.
mar
ked
bees
see
n on
bor
age
27
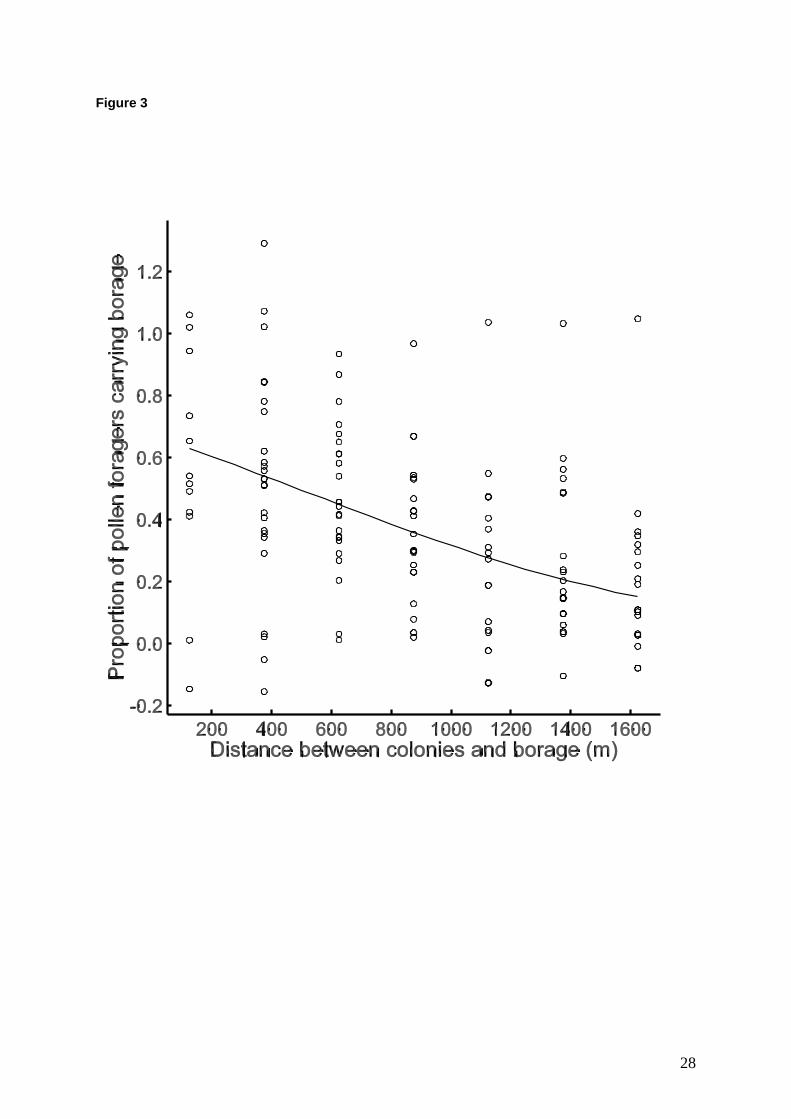
Figure 3
28
Figure 4
29

Figure 5
0
0.1
0.2
0.3
0.4
0.5
0.6
0.7
0.8
0.9
0 500 1000 1500 2000 2500 3000Radius of circle, centred on each site (m)
Prop
ortio
n of
circ
le w
ith g
ood
fora
ging
hab
itat
Site ASite BSite CSite DSite ESite FSite G
30