Embed Size (px)
Citation preview

University of South Florida University of South Florida
Scholar Commons Scholar Commons
Graduate Theses and Dissertations Graduate School
10-27-2003
Bullying and Victimization in Middle School: The Role of Individual Bullying and Victimization in Middle School: The Role of Individual
Characteristics, Family Functioning, and School Contexts Characteristics, Family Functioning, and School Contexts
Christine Marie Wienke Totura University of South Florida
Follow this and additional works at: https://scholarcommons.usf.edu/etd
Part of the American Studies Commons
Scholar Commons Citation Scholar Commons Citation Totura, Christine Marie Wienke, "Bullying and Victimization in Middle School: The Role of Individual Characteristics, Family Functioning, and School Contexts" (2003). Graduate Theses and Dissertations. https://scholarcommons.usf.edu/etd/1494
This Thesis is brought to you for free and open access by the Graduate School at Scholar Commons. It has been accepted for inclusion in Graduate Theses and Dissertations by an authorized administrator of Scholar Commons. For more information, please contact [email protected].

Bullying and Victimization in Middle School: The Role of Individual Characteristics,
Family Functioning, and School Contexts
by
Christine Marie Wienke Totura
A thesis submitted in partial fulfillment of the requirements for the degree of
Master of Arts Department of Psychology
College of Arts and Sciences University of South Florida
Major Professor: Ellis L. Gesten, Ph.D. Vicky Phares, Ph.D.
Michael Brannick, Ph.D.
Date of Approval: October 27, 2003
Keywords: school violence, aggression, school climate, assessment, adolescence
© Copyright 2003, Christine Marie Wienke Totura

Acknowledgements
I would like to thank my faculty advisor, Dr. Ellis Gesten, and the members of my
Master’s committee, Dr. Vicky Phares and Dr. Michael Brannick, for their time, support,
and constructive comments. I particularly appreciate Dr. Michael Brannick’s assistance
with data analysis. I am deeply grateful to Demy Kamboukos, M.A. for her friendship,
support, guidance, and insight in the development of this project, and to Nathan Totura,
Marianne Wienke, and Dr. H. Richard Wienke for their never-ending patience,
sensitivity, and support throughout the process. This study would not have been possible
without the assistance and coordination of Ray Gadd, M.A. in Pasco County Student
Services. His confidence that the study would improve middle schools in the area made
the process a rewarding and remarkable experience. Additionally, Sherri Dunham and
Amelia Van Name Larson have been integral to the success of the study. I am
furthermore indebted to the teachers, students, and administrators in Pasco County
Middle Schools for their participation in providing information and helping coordinate
data collection. Finally, I would like to acknowledge and thank those who helped in the
time consuming and, at times, frustrating tasks of data collection and data entry and/or
verification: Vounette Deus, Laurel Jorgenson, Gina DiPasqua, Lisa Strother, Danielle
Short, and Kelly Genske.

i
Table of Contents List of Tables iii List of Figures iv Abstract v Chapter One Introduction 1 Prevalence of Bullying and Victimization 1 Categorizing Children and Correlates of Bullying
and Victimization 2 Bullies 2 Victims 4 Bully/Victims 5
Age and Gender Differences 6 Summary 7 Hypothesis 1 8 Hypothesis 2 8 Hypothesis 3 9 Hypothesis 4 9 Hypothesis 5 9 Chapter Two Method 10 Participants 10 Measures 10 Child Report Surveys 10 Teacher Report Surveys 12 Records Data 13 Procedure 13 Data Reduction 14 Chapter Three Results and Discussion 15 Results 15 Individual Domain Variables 16 Anxiety, Depression, Anger, and

ii
Behavioral Misconduct 16 Family Domain Variables 16 Family Cohesion and Adaptability 16 School Domain Variables 17 School Adjustment 17 School Environment 17 Achievement 18 Teacher Report Domain Variables 18 Acting-Out, Moodiness, and Learning 18 Discriminant Function Analysis 19 Discussion 27 References 34 Appendices 47 Appendix A: Definitions of Bullying Behaviors 48 Appendix B: Assessment of Bullying Behaviors 51 Appendix C: Hypothesis 1 54 Appendix D: Hypothesis 2 55 Appendix E: Hypothesis 3 56 Appendix F: Hypothesis 4 57 Appendix G: Olweus Bully/Victim Questionnaire-Revised 58 Appendix H: Center for Epidemiological Studies-Depression Scale
(CES-D) 67 Appendix I: State-Trait Anxiety Inventory for Children (STAIC) 69 Appendix J: State-Trait Anger Expression Inventory for Children and Adolescents (STAXI-C/A) 70 Appendix K: School Adjustment Survey (SAS) 72 Appendix L: Middle School/High School Student Survey (MS/HS Student Survey) 75 Appendix M: Adult Supervision at School (ASAS) 77 Appendix N: Family Adaptability and Cohesion Evaluation Scales
(FACES-II) 78 Appendix O: Acting-Out, Moodiness, and Learning Scale-Revised
(AML-R) 81 Appendix P: Florida Comprehensive Achievement Tests (FCAT) 83 Appendix Q: Multivariate and Follow-Up Univariate Analysis Tables 84 Appendix R: Discriminant Function Analysis Matrices 111 Appendix S: Multivariate, Univariate, and Post Hoc Study Findings by
Domain and Hypotheses 123 Appendix T: Number (and Percentage) of Categorized Students per School 124

iii
List of Tables Table 1: Group Frequencies (and Percentages) by Grade and Gender 42 Table 2: Intercorrelations between Scales for Total Sample 43 Table 3: Group Means (and Standard Deviations) for Survey Data with MANOVA,
ANOVA, and Group Post Hoc Findings 44 Table 4: Means (and Standard Deviations) by Gender and Grade for Significant Interactions 45 Table 5: Means (and Standard Deviations) by Grade for Significant Interactions 46

iv
List of Figures Figure 1: Group Centroids by Function for Total Sample 20 Figure 2: Group Centroids by Function for Males 21 Figure 3: Group Centroids by Function for Females 22 Figure 4: Group Centroids by Function for 6th Graders 23 Figure 5: Group Centroids by Function for 7th Graders 24 Figure 6: Group Centroids by Function for 8th Graders 25

v
Bullying and Victimization in Middle School: The Role of Individual Characteristics, Family Functioning, and School Contexts
Christine Marie Wienke Totura
ABSTRACT
The present study examined the relationship between individual, family, and
school variables and both bullying and victimization. Approximately equal numbers of
males and females (N = 1185 and 1174, respectively) were randomly selected from
classrooms in 11 middle schools across 6th, 7th, and 8th grades. Students completed
questionnaires including items from each domain. Questionnaires assessed bullying and
victimization, internalizing and externalizing behaviors, family factors, and school
variables. In addition, teachers of the selected classrooms completed a brief rating scale
on each of the students, which assessed student moodiness, behavioral difficulties, and
learning problems. Achievement and discipline records data were obtained. Based on
their responses to critical items, participants were categorized into Bully, Victim,
Bully/Victim, and comparison Control groups. Multivariate analyses, with follow-up
univariate and discriminant function analyses, tested the association of variables within
the individual, family, teacher report, and school domains with bullying group
membership. Analyses were examined by grade and gender effects as well. Results
indicated that variables within each of the domains significantly contributed to
differences between bullying groups, by grade and gender. Specifically, bullies and
bully/victims appeared to have the poorest reported adjustment in terms of behavioral
difficulties, family functioning, and school variables, while both victims and
bully/victims experienced greater internalizing difficulties. Bullies and bully/victims

vi
tended to have the poorest outcomes; however, victims reported poorer peer relationships
and perceptions of school. Overall, depression, anxiety, and the expression of anger
accounted for the majority of group differences. School variables, particularly peer
relationships, a sense of school spirit, and perceptions of climate and adult availability at
school, played a secondary role in explaining differences among groups. These findings
varied by gender and grade. Illustratively, bullying intervention programs could, in part,
focus on those characteristics that are more strongly related to certain groups of students
(i.e., anger expression for females and school conditions for younger students).
1
Chapter One
Introduction
Prevalence of Bullying and Victimization
Bullying behaviors and their contexts have been assessed in several countries
demonstrating that exposure to and involvement in bullying behaviors are significant risk
factors to healthy psychological and physical development (Haynie, Nansel, Eitel,
Crump, Saylor, Yu, & Simons-Morton, 2001; Olweus, 1997; Roland, 2000). Multiple
variables influence the frequency of bullying behaviors, and the likelihood of a student
becoming a bully and/or victim of bullying (Haynie et al., 2001; Nansel, Overpeck, Pilla,
Ruan, Simons-Morton, and Schiedt, 2001). Studies have identified variables in three
general domains-- individual, family relationships, and school-- which contribute to
students’ involvement in and experience of bullying behavior. Research, however, has
generally focused on a few variables from each domain, and most examine variables in a
single domain (Haynie et al., 2001; Kumpulainen et al., 1998; Nansel et al., 2001; Rigby,
1993).
Estimates of bullying problems, either experienced as the perpetrator or the
victim, vary across nations and studies. Percentages range from 15% in Norway
(Olweus, 1997) to 18%-20% in England (Boulton & Underwood, 1992) to 25% in
Australia (Slee, 1994). Within the United States, studies report differing frequencies of
victimization, with 15% to 20% of students in the U.S. reporting being bullied (Batsche
& Knoff, 1994). More current estimates of bullying frequency report higher levels than
those in past studies, suggesting that bullying and victimization are on the rise in certain
populations. A recent study, using somewhat different criteria, found much different

2
proportions of middle school population involvement in bullying situations. Seven
percent of students were categorized as bullies, bullied others three or more times in the
past year, while 31% of 6th through 8th grade students were considered victims, bullied
three or more times in the past year (Haynie et al., 2001). Nansel and associates (2001)
found that 30% of 6th through 10th grade students were involved in moderate to frequent
bullying. Of those students, 13% were classified as bullies, 11% were classified as
victims, and 6% were classified as both bullies and victims.
Categorizing Children and Correlates of Bullying and Victimization
When assessing bullying behaviors, students were traditionally classified into
three major groups: bully, victim, and uninvolved. More recent literature suggests the
inclusion of an additional category, bully/victims, who are both perpetrators and victims
of bullying (Haynie et al., 2001; Nansel et al., 2001).
Bullies
At the individual level, bullies tend to have more impaired psychosocial
functioning (with regard to problem behavior, attitudes toward deviancy, and
competency) compared with victims and students uninvolved in bullying behavior
(Haynie et al., 2001). They exhibit more hostile intentions and little anxiety in general
(Olweus, 1995). A common misconception is that bullies are inadequate or anxious, and
that their behavior is an attempt to compensate for these feelings. In fact, bullies do not
have above average levels of anxiety regarding their bullying behavior, and moreover,
view their interactions with peers as reasonable and not “wrong” in some sense (Boulton
& Underwood, 1992).
Also, bullies tend to have higher levels of depressive symptoms than students not
involved in bullying, and lower levels than victims (Haynie et al., 2001; Nansel et al.,
2001, Slee, 1995). Similarly, bullies report more externalizing behaviors and victims
report more internalizing difficulties (Kumpulainen et al., 1998). In fact, greater feelings
of anger were found to be a powerful predictor of high levels of bullying (Bosworth,
Espelage, & Simon, 1999). In addition, bullies and their friends engage in more deviant
and problem behaviors and have greater acceptance for misconduct than victims and

3
students uninvolved in bullying (Haynie et al., 2001, Nansel et al., 2001). Perhaps
surprisingly, bullies often have a greater ability to make friends than students who are
victimized (Nansel et al., 2001). While in earlier grades bullies tend to be somewhat
popular amongst their classmates, as they progress through school bullies become less
popular (Olweus, 1997).
Many bullies demonstrate social cognitive information processing deficits, such
that they believe the actions of potential victims are hostile in nature (Dodge & Crick,
1990). In addition, many may exhibit an information processing deficit in which they are
not as likely to identify prosocial alternatives to what are perceived as threatening
situations. Bullies are generally more easily angered than other students and are more
likely to use force in response to their anger (Bosworth, et al., 1999; Edmonson, 1988).
Researchers have found that students who bully others at school are more likely to
have difficult family environments (Rigby, 1993). Bullies usually come from families
where parents prefer physical and harsh discipline, are more authoritarian, are less warm
and involved, are inconsistent in their parenting practices, and advocate aggressive
behaviors from their children. Bullies’ families tend to be less cohesive and
characterized by disengagement and conflict. Supervision of child activity is minimal
and parents typically lack empathy and problem-solving skills (Batsche & Knoff, 1994;
Bowers, Smith, & Binney, 1992; Carney, 2000; Hazler, 1996; Oliver, Oaks, & Hoover,
1994; Olweus, 1978; Olweus, 1991a, 1991b). It is suspected that these students learn
poor coping and socialization skills from their home environment, and use them in social
settings (Carney & Merrell, 2001). Parents do not present as good role models for
learning how to get along with others and solve problems (Hazler, 1996). Parental
maltreatment places children at-risk for both bullying and victimization (Shields &
Cicchetti, 2001).
In school, bullies are less likely to be bonded and engaged in education and the
school environment than victims and students uninvolved in bullying. Bullies tend to
dislike school, are less popular with peers and teachers than those uninvolved in bullying,
and have higher levels of behavioral misconduct (Rigby & Slee, 1991; Slee & Rigby,

4
1993). Academically, students recognized as bullies are usually disengaged with
schoolwork, even though they present with average intellectual abilities (Lagerspetz,
1982). Engagement in bullying behaviors is further associated with poorer academic
outcomes for students (Nansel et al., 2001). Bullies generally have poorer perceptions of
their school climate (Nansel et al., 2001). Bullies are more likely to take part in
delinquent behaviors both in and outside school, such as vandalism, truancy, substance
use, and stealing (Olweus, Limber, & Mihalic, 1999).
Victims
Victims usually have exploitable individual characteristics (Carney & Merrell,
2001). Physically, these students tend to be younger, smaller, and weaker than their
counterparts. Psychologically, they are more anxious, depressed, withdrawn, and have
lower self-esteem (Craig, 1998; Haynie et al., 2001; Olweus, 1995; Rigby & Slee, 1991).
Male victims are generally exploitable due to their physical stature, while female victims
are typically exploited by peers due to their style of dress and attractiveness (Hoover,
Oliver, & Hazler, 1992). Student victims tend to have more interpersonal difficulties and
poorer social skills than other students (Besag, 1989; Haynie et al., 2001). Victims are
less popular in school than other students, including bullies (Smith, 1991). Compared to
students uninvolved in bullying, victims bond and adjust more poorly to school and
classmates, although more positively than bullies (Haynie et al., 2001). Students who are
victims often are isolated, shy, and uninvolved or uninterested in others (Besag, 1989;
Hazler, 1996). Victims also report more behavioral misconduct of themselves and
acceptance of misconduct than students uninvolved in bullying, although not to the
degree as bullies (Haynie et al., 2001).
Victims may experience inconsistent parenting, abuse, and overprotectiveness of
family members (Oliver, Oaks, & Hoover, 1994; Stephenson & Smith, 1989). However,
some victims could also have parents who are more involved and supportive than other
students, but their parents are not as appropriately involved and supportive as the parents
of students uninvolved in bullying situations (Haynie et al., 2001). In particular, an
association has been found between male victimization and maternal overprotectiveness

5
(Olweus, 1991a). This pattern of familial support could prevent children from building
adaptive interpersonal skills and becoming independent individuals, consequently
increasing the potential for victimization by others (Baldry & Farrington, 1998).
Bully/Victims
Recent studies have found that the bully/victim represents a distinct group of
children, although typically much smaller in size and frequency (Haynie et al., 2001;
Nansel et al., 2001). Bully/victims are students who frequently engage in bullying
behaviors as well as regularly experience victimization and were found to have greater
behavioral misconduct, poorer social and emotional functioning, and less parental support
than bullies, victims, and uninvolved students (Haynie et al., 2001; Nansel et al., 2001;
Solberg & Olweus, 2002).
Bully/victims have lower scholastic competency, behavioral conduct, social
acceptance, and self-worth than bullies, victims, and students uninvolved in bullying.
Academically, bully/victims also have the poorest functioning (Nansel et al., 2001).
Bully/victims have poor adjustment and bonding with school, teachers, and classmates
(Austin & Joseph, 1996; Haynie et al., 2001; Nansel et al., 2001). Similar to bullies,
bully/victims were found to demonstrate greater levels of aggression, both verbally and
physically, compared with noninvolved children and victims (Craig, 1998). However,
bully/victims are involved in more problem behaviors and misconduct, such as cigarette
and alcohol use and cutting classes, and have more deviant peer influences and
acceptance of involvement in deviant behaviors than bullies, victims, and uninvolved
students (Haynie et al., 2001). They also report increased levels of depressive symptoms
and loneliness and tend to feel more saddened and moody than other students (Austin &
Joseph, 1996; Nansel et al., 2001).
Bully/victims experience the least parental support and involvement in their daily
lives and increased difficulties with their parents (Bowers, Smith, & Binney, 1994;
Haynie et al., 2001). In fact, bully/victims report higher frequency of overprotective as
well as neglectful parents who display lower warmth, involvement, and supervision than
other students’ parents (Smith & Myron-Wilson, 1998). Other researchers have found

6
that bully/victims receive more parental involvement in school issues, although the nature
of the involvement is unclear, whether due to positive or negative events (Nansel et al.,
2001). The parental involvement experienced by these students may be in response to
their negative behaviors at school. Overall, bully/victims are believed to have the poorest
reported family functioning compared with their peers (Rigby, 1993).
Overall, much less is known about the psychosocial, school, and familial factors
related to bully/victims compared with the magnitude, diversity, and importance of
correlates found for bullies and victims. Children who are identified as both bullies and
victimized may seemingly be the most at-risk group for future maladjustment, especially
considering their increased likelihood to befriend others who engage in deviant behaviors
(Haynie et al., 2001).
Age and Gender Differences
Bullying occurs at all age levels, but peaks in late childhood to middle
adolescence, ages 9-15, and begins to decrease after these peak periods (Hazler, 1996).
Usually, younger students are victimized by older students (Carney & Merrell, 2001;
Pellegrini & Long, 2002). Bullying and victimization are more prevalent among boys
(Haynie et al., 2001).
Bullying behavior varies across gender as well as by age and grade. Baldry &
Farrington (1998) found that victims were primarily girls, bullies were primarily boys,
and bully/victims and uninvolved students were evenly distributed between boys and
girls. Haynie et al. (2001) suggest that boys and girls may engage in and experience
different types of bullying behavior. Girls tend to organize their bullying in a more social
manner, around rumor spreading and manipulation of friendships, while boys exhibit
more physically aggressive activities (verbal abuse, physical attacks, and threats). The
only form of bullying that is more prevalent among girls is that of social intimidation
(Batsche & Knoff, 1994; Carney & Merrell, 2001). Additionally, female victims are
more concerned with being ignored at school and negatively evaluated by peers than
male victims (Slee, 1995). In general though, less is known about the characteristics of
female bullies (Baldry & Farrington, 2000).

7
Several studies examined the correlation between bullying and victimization and
other adjustment variables, both by gender and age. Mood, family environment, and
social interactions were found to differ by gender and grade for students in various
bullying groups. Middle school males showed a greater positive relationship between
loneliness and bullying (Nansel et al., 2001). High school girls did not demonstrate a
relationship between being bullied and inability to make friendships; however, students in
other grades did demonstrate this relationship (Nansel et al., 2001). For both middle and
high school boys, parental involvement was related to victimization and concurrent
bullying/victimization, but not for females. More specifically, lower levels of parental
involvement were related to being a bully for high school males (Nansel et al., 2001). A
greater correlation between poor family functioning and the experience of victimization
existed for female than for male experience of victimization (Rigby, 1993). In families
with low warmth and support, boys are likely to become bullies and girls are likely to
become bullies or victims (Rigby, 1996). Bullies and bully/victims, who were mostly
boys, differed from non-bullies in being less pro-social, having more authoritarian and
punitive parents, and having parents who were less supportive and more disagreeable
with each other (Baldry & Farrington, 1998). Pure bullies differed from non-bullies by
being male and less prosocial in their actions. Victims and bully/victims differed from
non-victims in being younger (in first year of middle school), having low self-esteem,
and having authoritarian parents. Pure victims compared to non-victims were more likely
to be female and have low self-esteem and authoritarian parents (Baldry & Farrington,
1998). Bully/victims compared to uninvolved students were more likely to be in the first
year of middle school, to be less pro-social, and to have low self-esteem and parents who
are authoritarian, punitive, and unsupportive (Baldry & Farrington, 1998). Some risk-
taking behaviors are also associated with bullying involvement, depending on grade.
Smoking is related to being bully or bully/victim for middle school students, while
alcohol use is related to being a high school bully/victim (Nansel et al., 2001).
Summary
This study examined behavioral, academic, and psychosocial variables in the

8
individual, family, and school domains and determined variables or combinations of
variables most relevant to bullying and victimization (see Appendices A and B for more
information). Within the individual domain, variables were examined that measured
specific child internalizing and externalizing difficulties. Variables related to family
support, bonding, and cohesion were assessed within the family domain. Of particular
importance was the addition of the school environment variables, many of which have
not been assessed in combination with individual and family variables to determine their
contribution to bullying and victimization. Within the school domain, variables were also
examined that were directly related to academic achievement and the quality of the
learning environment. Finally, teacher ratings were obtained as an additional measure of
child internalizing, externalizing, and learning difficulties (Gellespie & Durlak, 1995).
For the present study, student reports may be more useful in assessing emotionality and
psychosocial dysfunction, while teacher report is a valid measure of externalizing
problems. A unique aspect of the present study is the inclusion of differential sources of
data that assess several dimensions, a method which past studies have suggested is ideal
(Holmbeck, Westhoven, Shapera Phillips, Bowers, Gruse, Nikolopoulos, Wienke Totura,
& Davison, 2003; Pellegrini & Long, 2002). Additionally, the present study built on past
research by identifying those variables which discriminate bullies and victims from
bully/victims (Haynie et al., 2001; Nansel et al., 2001).
Hypothesis 1
A main effect for bullying groups (Bully, Victim, Bully/Victim, and uninvolved
students/comparison Control) was expected on domain combinations of the dependent
variables (Individual, Family, School, and Teacher Report) and on separate dependent
variables in each domain (see Appendix C).
Hypothesis 2
An interaction between gender and bullying group membership was hypothesized
for domain combinations of dependent variables and for separate dependent variables
within each domain (see Appendix D).

9
Hypothesis 3
An interaction between grade and bullying group was expected on domain
combinations of the dependent variables and on separate dependent variables in each
domain. Research has often examined differences across middle school and high school
on few of the dependent variables presented in the current study; therefore, the nature of
grade effects on several individual, family, and school variables as a function of bullying
group membership was unclear for students in 6th through 8th grade. Some effects could
be hypothesized, although analyses were generally exploratory for most of the individual,
family, school, and teacher report variables (see Appendix E).
Hypothesis 4
A three-way interaction was expected among bullying group, gender, and grade
on domain combinations of the dependent variables and on separate dependent variables
in each domain. As an expansion of Hypotheses 2 and 3, the nature of the three-way
interaction for specific dependent variables was uncertain and explored in the current
study (see Appendix F).
Hypothesis 5
A distinct linear combination of the dependent variables (Individual, Family,
School, and Teacher Report ratings) was expected to describe differences among bullying
groups. It was expected that the linear combination of dependent variables may differ by
gender and grade.

10
Chapter Two
Method
Participants
Each of the eleven middle schools in a large school district (approximately 55,000
students), which included urban, suburban, and rural areas, was recruited for
participation. The total number of participants (N = 2509) was divided into bullying
group, gender, and grade subgroups. Participants were deleted from analyses if they had
missing grade and/or gender data. The resulting number of participants (N = 2359)
included 6th (N = 760, 32.2%), 7th (N = 899, 38.1%), and 8th (N = 701, 29.7%) grade
students and their teachers. There were approximately equal numbers of males and
females (N = 1174, 1185). Within each school, four classes per grade, with
approximately 30 students each, were randomly selected to complete student and teacher
surveys. Teachers provided completed behavior surveys on a subgroup of 1474 students.
The majority of the sample was White/Caucasian (N = 1751, 74.3%), while 11.1% was
Latino/Latina/Hispanic (N = 261), 3.9% Black/African-American (N = 93), 2.0%
Asian/Indian (N = 48), and 8.6% as other (N = 203).
Measures
Child Report Surveys
The Revised Olweus Bully/Victim Questionnaire (Olweus, 1996) is a 39-item
scale covering aspects of bully/victim problems (see Appendix G). Following
convention, two items were used from the questionnaire to determine bullying group
membership (i.e., “How often have you been bullied at school in the past couple of
months,” and “How often have you taken part in bullying other students at school in the

11
past couple of months”). Bullies indicated that they have taken part in bullying “2 to 3
times a month” or more, without indicating having been bullied. Victims indicated that
they have been bullied at school “2 or 3 times a month” or more, without indicating
having bullied others. Bully/victims indicated that they have taken part in bullying others
“2 to 3 times a month” or more and that they have been bullied “2 to 3 times a month” or
more. Comparison control, or uninvolved, students are those students who responded
that they have been bullied/bullied others “only once or twice” or less. Cronbach’s alpha
for the victimization items scale from this sample is .87, while alpha for the bullying
items scale is .71.
The Center for Epidemiological Studies-Depression Scale (Radloff, 1977) is a 20-
item scale (Cronbach’s alpha = .86) used to measure self-reported depressive
symptomotology (see Appendix H).
The State/Trait Anxiety Inventory for Children (STAIC) (Spielberger, 1973) is a
40-item questionnaire that assesses self-reported anxiety (see Appendix I). Two 20-item
scales comprise the questionnaire: State, related to current estimated levels of anxiety,
and Trait, related to consistent and cross-situational levels of anxiety. Only the Trait
Anxiety subscale was used in order to remain consistent with past literature’s assessment
of child mood in relation to behavior (Cronbach’s alpha = .93).
The State/Trait Anger Expression Inventory for Children and Adolescents
(STAXI-C/A) (Spielberger, Jacobs, Brunner, & Lunsford, 2002) is a 53-item survey that
assesses self-reported anger (see Appendix J). The STAXI-C/A was developed based on
the adult version of the Revised State/Trait Anger Expression Inventory (STAXI-2),
which contains six major scales: State Anger, Trait Anger, Anger Out, Anger In, Anger
Control/Out, and Anger-Control/In (Spielberger, 1998). For this study, the Trait Anger
(Cronbach’s alpha = .86) and Anger Expression (Cronbach’s alpha = .77) scales were
used.
The School Adjustment Survey (SAS) (Santa Lucia & Gesten, 2000) is a 34-item
scale assessing self-reported student bonding and adjustment to school, classmates, and
teachers (see Appendix K). The scale consists of five scales: School Spirit (Cronbach’s

12
alpha = .85), Goal-Orientation (Cronbach’s alpha = .79), Child-Peer Relations
(Cronbach’s alpha = .63), Child-Teacher Relations (Cronbach’s alpha = .84), and
Alienation (Cronbach’s alpha = .63).
The Middle School/High School Student Survey (Safe Community-Safe School
Project, 2002) is a 131-item questionnaire that measures various components of parental
influences, peer relationships, exposure to school violence, teacher relations, beliefs
about aggression and substance use, risk taking behaviors, and school bonding (see
Appendix L). The 22 items used for the present study were grouped into scales assessing
Diversity, Condition of Campus, Knowledge of Fairness and Discipline Policies,
Presence of Gangs, Witnessing Fighting at School, Staff Response to Bullying, and
Witnessing Other Problem Behaviors. Some of the above scales were further aggregated
into the factors used: School Climate (Diversity, Presence of Gangs, Witnessing Fighting,
and Witnessing Other Problem Behaviors; Cronbach’s alpha = .53) and Adult
Intervention (Knowledge of Fairness and Discipline Policies and Staff Response to
Bullying; Cronbach’s alpha = .64). Condition of Campus remained its own factor
(Cronbach’s alpha = .56).
The Adult Supervision in School scale (see Appendix M) is comprised of six items
(Cronbach’s alpha = .49) developed for this study, and added to assess adult supervision
within schools (e.g., “in my school teachers are in the hall when we change classes,”).
The Family Adaptability and Cohesion Evaluation Scales (FACES-II) (Olson,
Russell, & Sprenkle, 1983) is a 30-item measure assessing familial bonding, support,
involvement, and environment (see Appendix N). Two scales comprise the FACES-II:
Adaptability, a family’s adaptive capacity and flexibility during times of stress, and
Cohesion, the degree of emotional bonding and individuality within a family unit. This
study’s Cronbach’s alpha for the Cohesion scale was .80, while alpha for the Adaptability
scale was .83.
Teacher Report Surveys
The AML Behavior Rating Scale – Revised (AML-R) is a 12-item survey, revised
from the original 11-item scale (Cowen et al., 1973) used to assess elementary school

13
student maladjustment (see Appendix O). Three scales comprise the AML-R: Acting-out
(A), Moodiness (M), and Learning (L). Cronbach’s alpha for the scales are as follows:
.91 for Acting-Out, .87 for Moodiness, and .93 for Learning.
Records Data
The standardized Florida Comprehensive Achievement Tests (FCAT) were
included in the present study as a measure of academic achievement in reading, writing,
and mathematics (see Appendix P). Internal reliabilities for the total test battery range
from .86 to .91 for grades 4 through 10 (Florida Department of Education, 2000). The
Developmental Scale Scores for reading comprehension and math problem solving tests
were used as an assessment of academic achievement that could be compared across
school years. The range of FCAT Developmental Scale Scores is 86-3008.
Total number of Discipline Referrals was obtained for each participant as a
measure of student behavioral misconduct. Referrals are an indicator of misbehavior in
schools by means of a disciplinary report for individual students sent to school
administration and aggregated by the district.
Procedure
This study was developed in collaboration with the school district as part of a
broader assessment of school environment. Students were administered survey packets
by teachers with the help of school psychologists, guidance counselors, and study
research assistants in a group format within randomly selected classes during the second
half of the school year. The following definition of bullying was read to guide responses:
“We define or explain the word bullying. We say a student is being bullied when another
student, or several other students
• Say mean and hurtful things or make fun of him or her or call him or her mean
and hurtful names
• Completely ignore or exclude him or her from their group of friends or leave him
or her out of things on purpose
• Hit, kick, push, shove around, or lock him or her inside a room

14
• Tell lies or spread false rumors about him or her or send mean notes and try to
make other students dislike him or her
• And other hurtful things like that.
When we talk about bullying, these things happen repeatedly, and it is difficult for
the student being bullied to defend himself or herself. We also call it bullying, when a
student is teased repeatedly in a mean and hurtful way.
But we don’t call it bullying when the teasing is done in a friendly and playful
way. Also, it is not bullying when two students of about equal strength or power argue or
fight (Olweus, 1991, pg. 7).”
This definition was also included in written format in the student survey packets.
Student and teacher surveys were coded to maintain child confidentiality. Since
this survey was part of a district mandated needs assessment, consent procedures were
determined by the school administration consistent with district policy. A letter was sent
to their parent or guardian informing them that their child will be involved in a survey to
improve school climate. Those who chose to decline participation in the study were
asked to contact the school.
Data Reduction
Prior to conducting any analyses, the data was verified and cleaned. Impossible
scores outside of scale ranges were corrected. Participants with missing data were
eliminated from analyses on a case-wise basis. Participants were classified into groups:
Bullies (N = 164, 6.7%), Victims (N = 295, 12.0%), Bully/Victims (N = 44, 1.8%),
Controls (N = 2006, 81.4%). Table 1 presents frequencies for group membership by
grade and gender. Older students and males were more likely categorized as bullies,
younger males as victims, and roughly equal numbers of males and females across grades
as bully/victims. Middle school of attendance was entered into preliminary multivariate
analyses of variance (MANOVAs) to test the data’s adherence to the assumption of
independence of observations and assess dependence of student responses on school of
attendance. Each follow-up univariate design was nested within school.

15
Chapter Three
Results and Discussion
Results
Pearson Product-Moment correlation analyses were conducted between dependent
variables in order to assess the degree of association among the individual, family, school
environment, school adjustment, achievement, and teacher report variables. Several
associations among variables were noted (see Table 2). Generally, each domain was
significantly related to each other. More specifically, individual mood and externalizing
factors were highly correlated with all measured aspects of students’ lives, family
functioning, perceptions of school, and teacher perceptions of student adjustment.
Achievement data had fewer associations with the other domain variables.
Factorial Multivariate Analyses of Variance (MANOVA) were used to test for
differences among the Bully, Victim, Bully/Victim and comparison Control groups by
gender and grade on subsets of the dependent variables. This included by domain:
Individual (Depression, Anxiety, Anger, and Discipline Referrals), Family (Cohesion and
Adaptability), School Environment (School Climate, Condition of Campus, Adult
Intervention, and Adult Supervision in School), adjustment toward school (Goal-
Orientation, School Spirit, Child-Peer Relations, Child-Teacher Relations, and
Alienation), Achievement (FCAT standardized test scores), and Teacher Report (Acting-
Out, Moodiness, and Learning difficulties). In order to correct for heterogeneous
covariance matrices, a robust statistic, Pillai-Bartlett Trace was used. Due to extreme
sample size differences, harmonic means were used for follow-up analyses. Table 3
presents the multivariate and follow-up univariate results.

16
Individual Domain Variables
Anxiety, depression, anger, and behavioral misconduct. A main effect for
bullying group membership occurred on the combination of the Individual variables,
F(15, 5601) = 23.45, p = .000, as well as the gender by group interaction, F(15, 5601) =
2.57, p = .001. A follow-up main effect for bullying group resulted on Depression, F(33,
1936) = 6.60, p = .000, Anxiety, F(33, 1734) = 4.44, p = .000, Trait Anger, F(33, 2101) =
4.98, p = .000, Anger Expression, F(33, 2107) = 3.26, p = .000, and Discipline Referrals,
F(33, 2134) = 2.25, p = .000. The Control group had lower Depression than the Bully,
Victim, and Bully/Victim groups. The Bully group also had lower levels of Depression
than those in the Victim group. For Anxiety, the Bully, Victim, and Bully/Victim groups
reported significantly higher levels of anxiety than the Control group. The Victim and
Bully/Victim groups also had greater Anxiety levels than the Bully group. For Trait
Anger, the Control group reported significantly lower levels of anger than the Bully,
Victim, and Bully/Victim groups. Both the Control and Victim groups had significantly
lower levels of reported Anger Expression than those in the Bully and Bully/Victim
groups. Bully/Victims have lower reported levels of Anger Expression than Bullies,
although these findings are not significant. For Discipline Referrals, the Control group
had lower levels of behavioral misconduct than Bullies and Bully/Victims. Bullies and
Bully/Victims have higher levels of referrals than Victims.
Family Domain Variables
Family cohesion and adaptability. A main effect for bullying group membership
occurred on the combination of the Cohesion and Adaptability variables, F(6, 3890) =
7.44, p = .000. The two-way interaction of gender and bullying group membership was
also significant, F (6, 3890) = 4.19, p = .000. On each variable, bullying group
membership had significant main effects, F(43, 1864) = 2.01, p = .000 for Cohesion and
F(43, 1777) = 1.44, p < .05 for Adaptability. The gender by bullying group two-way
interaction was significant for Adaptability, F(33, 1777) = 1.68, p = .01. For Cohesion,
those in the Control group reported greater levels of Cohesion compared with those in the

17
Victim group. Members of the Control and Victim groups reported higher levels of
connectedness, or Cohesion, within families than those in the Bully group. Overall, the
Control group reported higher levels of Adaptability than the Bully group. More
specifically, male Controls (see Table 4) had greater Adaptability in their families, while
female Bullies reported the least.
School Domain Variables
School adjustment. A main effect for bullying group membership occurred on the
combination of the School Adjustment variables, F(15, 6480) = 17.23, p = .000. The
two-way interaction of bullying group membership and gender was significant, F(15,
6480) = 2.10, p < .01. A bullying group main effect occurred for School Spirit, F(43,
2026) = 2.79, p = .000, Goal-Orientation, F(43, 1987) = 2.37, p = .000, Child-Peer
Relations, F(43, 2051) = 5.13, p = .000, Child-Teacher Relations, F(43, 2046) = 2.74, p =
.000, and Alienation, F(43, 2050) = 2.38, p = .000. The interaction between bullying
group and gender was significant for Goal-Orientation, F(38, 1987) = 1.54, p < .05, and
Child-Teacher Relations, F(38, 2046) = 1.44, p < .05. For School Spirit, members of the
Control group reported greater means than those in the other groups. Those in the Victim
group reported significantly greater levels of school spirit compared with those in the
Bully group. Overall for Goal-Orientation, the Control and Victim groups reported
greater levels compared with Bullies. Female Control students (see Table 4) had the
highest Goal-Orientation, while male Bullies had the lowest. For Child-Peer Relations,
those in the Victim group reported the lowest levels compared with the Bully, Control,
and Bully/Victim groups. Bullies reported lower levels of Child-Teacher Relations
compared with Control and Victim group members. Female Controls had the highest
levels of Child-Teacher Relations (see Table 4), while female Bullies have the lowest
levels. For Alienation, those in the Bully, Victim, and Bully/Victim groups reported
greater levels compared with those in the Control group.
School environment. A main effect for bullying group membership occurred on
the combination of the Condition of Campus, School Climate, Adult Intervention, and
Adult Supervision at School variables, F(12, 5421) = 10.66, p = .000. The two-way

18
interaction of bullying group membership and grade was significant, F(24, 7232) = 1.53,
p < .05. Finally, the three-way interaction of bullying group membership, grade, and
gender was also significant, F(24, 7232) = 1.94, p < .01. Significant main effects for the
nested group variable occurred for several variables: Condition of Campus, F(32, 1660) =
1.66, p < .05; School Climate, F(33, 1674) = 3.08, p = .000; Adult Intervention, F(32,
1680) = 1.97, p = .001; and Adult Supervision, F(33, 2054) = 1.75, p < .01. The two-way
interaction between bullying group and grade was significant for Condition of Campus,
F(44, 1660) = 1.76, p = .002), and Adult Supervision, F(50, 2054) = 1.43, p < .05. For
School Climate, those in the Control group reported fewer difficulties with diversity,
gang presence, and other problem behaviors compared with members of the other groups.
Overall for Condition of Campus, Control students reported higher levels of Condition of
Campus compared with other students. Sixth grade students in the Control group (see
Table 5) reported the most positive Condition of Campus, while sixth grade
Bully/Victims reported the lowest. For Adult Intervention, the Control group reported
greater levels of adult intervention compared with all of the other groups. For Adult
Supervision, the Control group reported greater levels of supervision at school compared
with the other groups. The Bully and Victim group members reported significantly
greater levels of supervision compared with those in the Bully/Victim group. For the
two-way interaction, 8th grade Bully/Victims reported the lowest levels of supervision,
while 8th grade Control students reported the highest levels.
Achievement. No significant hypothesized multivariate effects occurred.
Teacher Report Domain Variables
Acting-out, moodiness, and learning. A main effect for bullying group
membership occurred on the combination of the AML-R variables, F(9, 4110) = 3.29, p =
.001. The three-way interaction of bullying group membership, grade, and gender was
significant, F(18, 4110) = 1.67, p < .05. For Acting-Out, a main effects for bullying
group, F(33, 1220) = 1.82, p < .01, as well as a three-way interaction among group,
grade, and gender, F(11, 1220) = 2.72, p < .01, occurred. For Moodiness, a main effect
occurred for group, F(33, 1220) = 2.38, p = .000. For the Learning variable, only the

19
three-way interaction was significant, F(11, 1220) = 2.31, p < .01. Teachers reported
greater levels of Acting-Out behaviors for students in the Bully group compared with
those in the Control and Victim group. Bully/Victims had greater levels of Acting-Out
behaviors than Control students. Male Bullies in the 7th grade (see Table 4) were
reported to have the greatest levels of acting-out behaviors, while 8th grade female
Bully/Victims had the lowest levels. For Moodiness, the Bully group had greater levels
of reported mood disruptions compared with the Control and Victim students. For
Learning, 8th grade female Bully/Victims had the lowest reported levels of Learning
problems. Seventh grade male Bullies had the highest reported levels of Learning
difficulties.
Discriminant Function Analysis
A descriptive Discriminant Function Analysis revealed that three function
equations explained the difference among bullying groups on the combination of
Individual domain, Family domain, School domain, and Teacher Report domain variables
for the total sample. The canonical correlation that assessed the relationship between the
first discriminant function and the set of dependent variables is .388, while the canonical
correlation between the second discriminant function and the set of dependent variables is
.324 (Wilk’s Lambda = .741, p = .000 for the test of functions 1 through 3). The first
function accounted for the majority of the variance, specifically 55.3%, while the second
function accounted for 36.7%. Examination of the first function structure matrix revealed
that Depression (r = .668), Trait Anger (r = .632), Anxiety (r = .614), Child-Peer
Relations (r = -.540), School Climate (r = .499), School Spirit (r = -.469), Adult
Intervention (r = -.459), Cohesion (r = -.387), Adult Supervision (r = -.386), Alienation
(r = .359), Child-Teacher Relations (r = -.353), and Moodiness (r = .273) had significant
associations with the discriminant function (see Appendix R). Examination of the
structure matrix for function 2 revealed that Anger Expression (r = .634), Referrals (r =
.372), Acting-Out (r = .321), Goal-Orientation (r = -.263), and Learning (r = .193) had
significant associations with the function (see Appendix R). Group centroids were
graphed on both Function 1 (Control = -.201, Bully = .784, Victim = .872, and

20
Bully/Victim = 1.18) and 2 (Control = -.0037, Bully = .947, Victim = -.705, and
Bully/Victim = .491).
Figure 1: Group Centroids by Function for Total Sample
For males, three discriminant functions resulted, the first two as significant. The
canonical correlation that assessed the relationship between the first discriminant function
and the set of dependent variables was .447, while the canonical correlation between the
second discriminant function and the set of dependent variables was .344 (Wilk’s
Lambda = .674, p = .000 for the test of functions 1 through 3). The first function
accounted for the majority of the variance (58.2%) and the second accounted for 31.2%
of the variance. Examination of the first function structure matrix revealed that
Depression (r = -.666), Child-Peer Relations (r = -.665), Anxiety (r = .629), Child-
Teacher Relations (r = .397), Adult Supervision (r = .305), and School Spirit (r = -.263)
had the largest correlations with the discriminant function. Examination of the second
function revealed that Goal-Orientation (r = .629), Cohesion (r = .579), Adaptability (r =
.461), Adult Intervention (r = .416), Condition of Campus (r = .383), FCAT Math (r = -
.368), FCAT Reading (r = .358), Trait Anger (r = -.305), Moodiness (r = -.235), and
Function 2
Function 1
B
V
B/V
C0 |
1
1--

21
Anger Expression (r = .168) had the greatest association with the function. Group
centroids were graphed on both Function 1 (Control = .219, Bully = -.038, Victim = -
1.298, and Bully/Victim = -.772) and 2 (Control = -.106, Bully = 1.224, Victim = -.172,
and Bully/Victim = .305).
Figure 2: Group Centroids by Function for Males
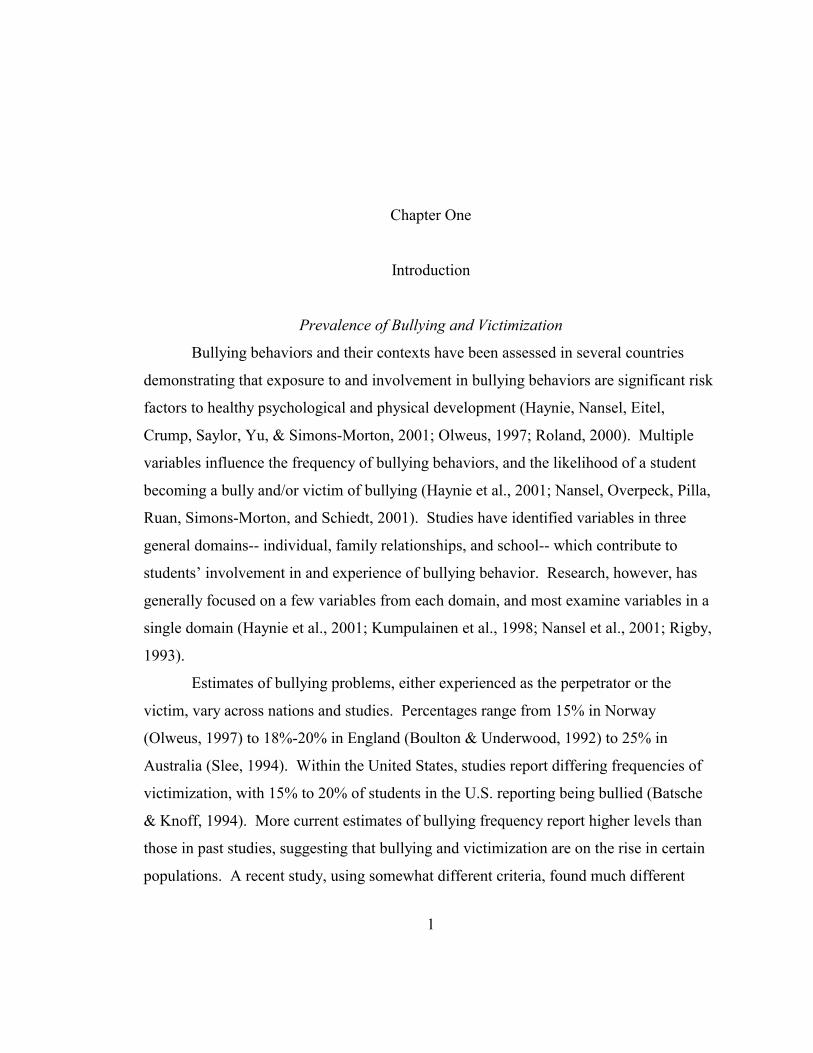
For females, three discriminant functions explained group differences with the
first two functions being significant. The canonical correlation that assessed the
relationship between the first discriminant function and the set of dependent variables is
.439, while the canonical correlation between the second discriminant function and the
set of dependent variables is .319 (Wilk’s Lambda = .683, p = .000 for the test of
functions 1 through 3). The first function accounted for 57.6% of the variance, while the
second function accounted for 27.3%. Examination of the first function structure matrix
revealed that Anger Expression (r = .716), Cohesion (r = .621), School Spirit (r = .525),
Goal-Orientation (r = .518), Trait Anger (r = -.518), Adaptability (r = ,516), Acting-Out
(r = -.490), Alienation (r = -.457), Adult Intervention (r = -.416), Adult Supervision (r
= -.408), Child-Teacher Relations (r = .390), Learning (r = -.336), Condition of
Function 2
Function 1
B
V
B/V
C
|1
1--
0
22
Campus (r = .325), Depression (r = .269), and Anxiety (r = .228) had the largest
associations with the discriminant function (see Appendix S). The structure matrix for
function 2 revealed that Child-Peer Relations (r = -.551), School Climate (r = .470),
Discipline Referrals (r = .298), and Moodiness (r = .173) had the largest significant
associations with the function. Group centroids were graphed on both Function 1
(Control = -.180, Bully = 1.458, Victim = .332, and Bully/Victim = 2.053) and 2 (Control
= -.074, Bully = -.435, Victim = 1.076, and Bully/Victim = -.055).
Figure 3: Group Centroids by Function for Females
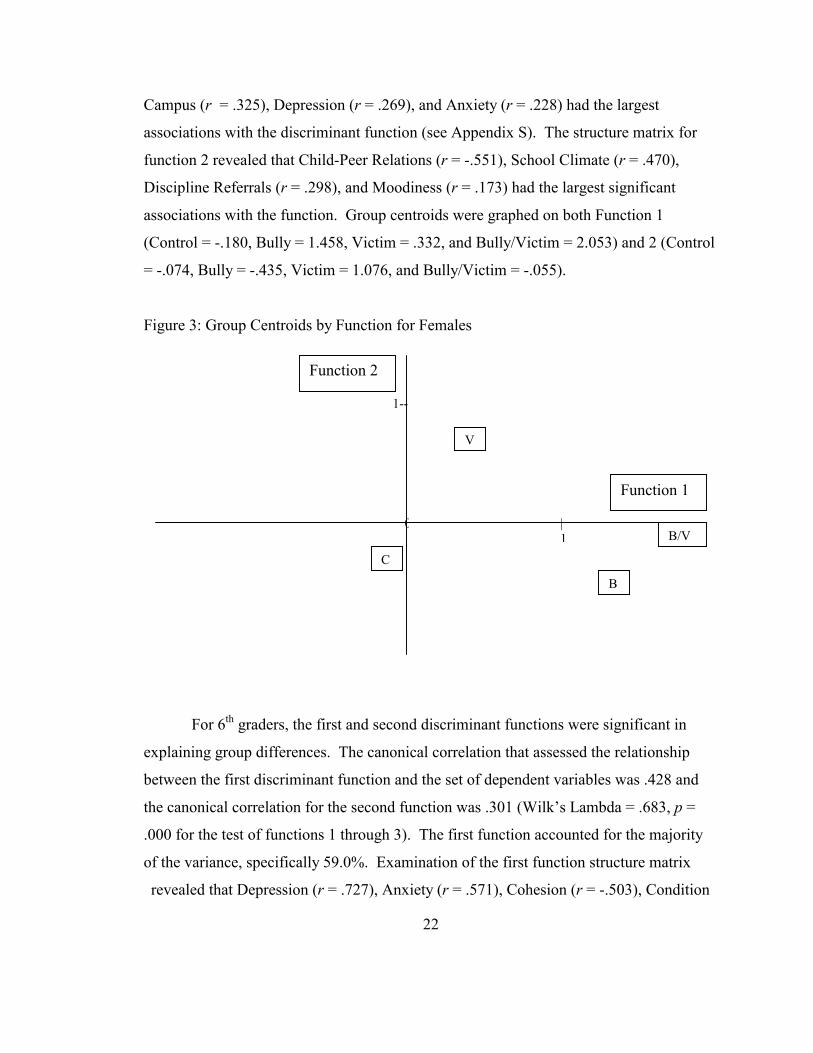
For 6th graders, the first and second discriminant functions were significant in
explaining group differences. The canonical correlation that assessed the relationship
between the first discriminant function and the set of dependent variables was .428 and
the canonical correlation for the second function was .301 (Wilk’s Lambda = .683, p =
.000 for the test of functions 1 through 3). The first function accounted for the majority
of the variance, specifically 59.0%. Examination of the first function structure matrix
revealed that Depression (r = .727), Anxiety (r = .571), Cohesion (r = -.503), Condition
Function 2
Function 1
B
V
B/V
C
0 |1
1--
23
of Campus (r = .478), FCAT Reading (r = -.447), Adult Intervention (r = .418), Child-
Peer Relations (r = -.276), Goal-Orientation (r = -.276), Child-Teacher Relations (r =
.219), and Moodiness (r = -.169) had the largest correlations with the discriminant
function. Examination of the second function revealed that Adult Supervision at School
(r = -.542), Anger Expression (r = .491), Acting-Out (r = -.411), Trait Anger (r = .400),
Alienation (r = .302), and School Climate (r = -.195) had a significant relationship with
the function. Group centroids were graphed on both Function 1 (Control = -.202, Bully =
.294, Victim = 1.073, and Bully/Victim = 1.600) and 2 (Control = -.0372, Bully = 1.701,
Victim = -.222, and Bully/Victim = .230).
Figure 4: Group Centroids by Function for 6th Graders
For the 7th grade sample, three discriminant functions resulted. The first and
second discriminant functions were significant in explaining group differences. The
canonical correlation that assesses the relationship between the first discriminant function
and the set of dependent variables was .495 and the canonical correlation for the second
function was .421 (Wilk’s Lambda = .586, p = .000 for the test of functions 1 through 3).
The first function accounted for the majority of the variance, specifically 54.2%, while
Function 2
Function 1
B
V
B/V
C
1--
|1
0

24
the second accounted for 35.8% of the variance. Examination of the first function
structure matrix revealed that Anxiety (r = .682), Depression (r = .474), Child-Peer
Relations (r = -.499), Trait Anger (r = .472), Adult Intervention (r = -.390), Adult
Supervision (r = -.320), Alienation (r = .318), Moodiness (r = .286), and Acting-Out (r =
.266) had the largest correlations with the discriminant function. Examination of the
second function revealed that Anger Expression (r = .546), Cohesion (r = -.357), FCAT
Math (r = -.323), FCAT Reading (r = -.250), and Learning (r = .242) had significant
relationships with the function. Group centroids were graphed on both Function 1
(Control = -.287, Bully = .772, Victim = 1.216, and Bully/Victim = 1.695) and 2 (Control
= -.0347, Bully = 1.061, Victim = -.994, and Bully/Victim = .604).
Figure 5: Group Centroids by Function for 7th Graders
For the 8th grade sample, the canonical correlation that assesses the relationship
between the first discriminant function and the set of dependent variables was .417 and
the canonical correlation between the second function and the set of dependent variables
was .305 (Wilk’s Lambda = .692, p = .000 for the test of functions 1 through 3). The first
function accounted for the majority of the variance, specifically 53.3%, while the second
Function 2
Function 1
B
V
B/V
C
0 |1
1--

25
accounted for 26.0%. Examination of the first function structure matrix revealed that
Child-Peer Relations (r = .744), Depression (r = .517), School Climate (r = -.422), Adult
Supervision at School (r = -.385), School Spirit (r = -.370), Anxiety (r = .360), Child-
Teacher Relations (r = .358), Cohesion (r = .353), Adaptability (r = .340), Learning (r =
.331), Anger Expression (r = -.319), and Alienation (r = .127) had the largest associations
with the discriminant function. Examination of the second function revealed that Trait
Anger (r = -.628), Goal-Orientation (r = .642), and Adult Intervention (r = .558) had
significant relationships with the function. Group centroids were graphed on both
Function 1 (Control = -.181, Bully = 1.465, Victim = .300, and Bully/Victim = .295) and
2 (Control = -.0762, Bully = -.320, Victim = 1.014, and Bully/Victim = .0614).
Figure 6: Group Centroids by Functions for 8th Graders
In summary, the combination of variables for the whole sample appeared to pull
the Control group apart from the Bully, Victim, and Bully/Victim groups. Those
variables that had the most influence in describing differences among the Bully, Victim,
Bully/Victim, and Control groups were internalizing (depression and anxiety) and
Function 2
Function 1
B
V
B/V
C
0 |1
1--

26
externalizing (anger and referrals) factors, primarily, followed by relationships with
peers, bonding with school (school spirit, relationships with teachers, and feelings of
belonging at school), school environmental factors (adult intervention and supervision
and perception of school climate), and connectedness with family members. Linear
combinations were then created by gender and group. The profile for female varied from
that of the total sample, Bullies and Bully/Victims differentiated from Control and Victim
students. While similar individual (depression, anxiety, and mostly expression of anger)
and school variables continued to be primarily responsible for defining the group
differences, family flexibility, and appearance of school campuses also emerged as
important in explaining group differences. For males, Bullies were strikingly
discriminated from the other groups, which appeared to be due to mainly depression,
anxiety, family connectedness and flexibility, orientation toward educational goals,
quality of peer and teacher relationships, teacher reported mood difficulties, and
performance on standardized tests. Functions that resulted for 6th and 8th grade students
presented a patterns of group differences in which Bullies were separated from Controls,
Victims, and Bully/Victims. Functions for 7th grade participants appeared to separate
Bullies, Victims, and Bully/Victims from Control students. Depression, anger, and
anxiety continued to play a primary role in differentiating among groups, while familial
adaptability became important for 8th grade students. Academic achievement emerged as
responsible for discrimination among groups for both 6th and 7th grade students. School
adjustment variables appeared to be less important for 7th grade students, while the
condition of school campus played a significant role for 6th graders. The presence of and
intervention on the part of adults at school were important in describing group differences
across the board. Interestingly, while anger and teacher reported behavioral difficulties
were significant in describing bullying group differences at all grade levels, discipline
referrals were not. However, referral data was significant for female and total sample
group differences.

27
Discussion
The present study examined variables related to bullying and victimization in
middle school. Several factors within the individual, family, and school domains were
related to bullying and victimization. Group effects accounted for the majority of the
associations. As expected, the participants who were categorized as comparison Control
had the best outcomes with respect to individual characteristics, family functioning, and
school adjustment. Contrary to past research, those categorized as bully/victims did not
consistently have the poorest psychosocial and academic adjustment in comparison with
bullies and victims (Haynie et al., 2001; Nansel et al., 2001).
Specifically, within the Individual domain, group differences generally did not
vary as a function of grade or gender. Overall, the multivariate tests of significance
revealed group differences, as well as gender by group interaction, for the combination of
individual variables (Depression, Anxiety, Trait Anger, Anger Expression, and Discipline
Referrals). However, the gender by group interactions did not reach significance in
follow-up univariate analyses. Bullies, victims, bully/victims, and comparison control
participants differed on each individual variable, with the comparison controls generally
having the best adjustment. Victims were more likely to report symptoms of depression
and anxiety compared with bullies, while bullies and bully/victims presented with
externalizing profiles (trait anger, anger expression, and referrals). In part, these
findings are supported by past research, with the unique addition of anger variables
(Bosworth et al., 1999; Haynie et al., 2001; Kumpulainen, et al., 1998; Nansel et al.,
2001, Olweus, 1995). While statistical significance was not achieved for all
hypothesized findings, a trend in bully/victim reports emerged. Bully/victims appeared
similar to victims with respect to depression and anxiety reports. However, bully/victim
externalizing reports were more similar to that of bullies. Bully/victims presented the
same individual characteristics as both victims and bullies. Interestingly, anger was
reported by each group; however, bullies and bully/victims were more likely to express it.
Research should further examine the specific function of anger with bullying and
victimization.

28
With respect to family functioning, the group effects were significant on the
Cohesion and Adaptability variables. Victims reported lower connectedness in their
families compared with comparison control participants; however, victims felt their
families were more cohesive than bullies’ families. These findings are consistent with
literature that suggests victims have more involved, even overprotective, parents (Haynie
et al., 2001). For Adaptability, the trends of student reports suggested poorer family
functioning for bullies compared with victims and bully/victims. Female bullies reported
the least flexibility within their families. Overall, victims and bully/victims reported
similar levels of connectedness and adaptability within their families. The specific
constructs of Cohesion and Adaptability have not previously been studied in relation to
bullying and victimization; yet, parental involvement, support, and practices have been
found to be associated with bullying and victimization (Bowers et al., 1992; Carney,
2000; Hazler, 1996; Oliver et al., 1994; Olweus, 1991a; 1991b). These results suggest
that the degree of intimacy, connection, and flexibility among family members may be
important in explaining differences among groups of students involved in bullying
situations.
A number of significant findings resulted in the school domain. Specifically,
control participants reported greater adjustment toward school than other students.
Victims, too, tended to report more bonding with school, except for quality of peer
relationships. Consistent with the literature, victims had increased difficulty with peer
interactions, yet relationships with teachers appeared positive (Besag, 1998; Nansel et al.,
2001). Bullies, as expected, were less bonded to school and reported more difficulties
with teachers. Overall, female comparison control students typically had positive goal
directed perceptions and relationships with teachers, while male bullies generally had
poor perceptions of each. Interestingly, both bullies and victims reported feeling
alienated from school. This finding is contrary to past research that suggests victims may
bond less successfully to school than control students, but do adjust to school more
readily than bullies (Haynie et al., 2001). The Alienation factor in this study, however,
includes a number of items salient to bullies and victims. While Alienation is defined on

29
the one hand by student-teacher relationships, on the other hand, the factor also includes a
perception of safety and belonging at school. Bullies may report feeling alienated at
school due to poorer teacher relationships, and victims may report feeling alienated due
to safety and peer group issues at school. Bully/victims also had similar alienation scores
with bullies and victims indicating considerable teacher, peer, and safety concerns.
The comprehensive assessment of school environment relationships within a
multivariate design was another unique contribution of this study to the current body of
literature. A main effect for group, as well as a two-way interaction between group and
grade and the group by gender by grade three-way interaction, resulted for the
combination of environmental factors (Condition of Campus, School Climate, Adult
Intervention, and Adult Supervision). In univariate follow-up analyses, control
participants reported the most positive school climates with regard to witnessing problem
behaviors, gang activity, or diversity tensions, and reported to experience the greatest
frequency of supervision and intervention by adults at school. In addition, both bullies
and victims indicated that adults are more readily available and actively supervising their
school campuses than bully/victims. Bully/victims in the sixth grade reported the most
negative conditions in their schools. This finding, as well as the finding for adult
supervision, is consistent with past research, which indicates that bully/victims, and
younger students, may have the poorest perceptions of their schools (Haynie et al., 2001).
Interestingly, no significant findings resulted for academic achievement, although
bully/victims tended to have the lowest standardized test scores. This contradicts past
studies that have typically reported considerable differences in achievement within this
type of sample. Notably, the present study used statewide composite achievement test
scores as the academic achievement construct. Course grades were not used due to their
dependence on school and teacher factors, and their far less standardized application.
Past studies have reported the importance of scholastic differences among bullies,
victims, and bully/victims (Austin & Joseph, 1996; Lagerspetz, 1982; Nansel et al.,
2001). However, many of these studies examined academic achievement in terms of
students’ perceptions of ability in, competency in, or engagement toward academics. The

30
current findings suggest that when an alternate method for measuring academic
achievement is used (i.e., standardized test scores), the associations with bullies, victims,
and bully/victims may not hold up. In fact, it may be students’ perceptions of their ability
that differs, while their actual performance remains equivalent. This implies that all
students, regardless of their bullying status, can succeed in school (Lagerspetz, 1982).
Yet, when examined in combination with other variables, FCAT scores became important
in describing group differences for males and 6th and 7th grade students.
Another significant contribution of the present study was the use of cross-
informant data, specifically from teachers. Bullies were reported to have greater
externalizing behavior difficulties than victims and controls, although they did not differ
from the reported behavior of bully/victims. As for internalizing problems, bullies were
reported to have more than controls and victims, yet were not significant when compared
with bully/victims. Overall, group differences varied by gender and grade for reported
Acting-Out behaviors. Not surprising, females had the lowest levels of teacher reported
behavior difficulties and males had the greatest. Specifically, 8th grade female
bully/victims had the lowest levels of problem behaviors, while 7th grade males had the
highest levels. For learning difficulties, a gender by grade by group interaction also
occurred. Seventh grade male bullies were reported to have the greatest problems, while
female bully/victims had the least. As was suggested by the achievement results,
perceptions of behavior can diverge vastly from each other. While bully/victims
appeared like victims in terms of self-reported internalizing and mood, teacher reports
suggested that bully/victims looked much more like bullies in both internalizing and
externalizing behavioral realms. This may speak to teachers’ difficulties in adequately
identifying mood related characteristics, especially with respect to those students who
engage in behavioral misconduct (Gillespie & Durlak, 1995; Green at al., 1980). These
findings did not generally hold up when teacher reports were examined by gender and
grade given that older female bully/victims had the lowest levels of behavioral and
learning problems. However, female bully/victims constituted a considerably small
portion of the total sample of students, at times only 2-3 students.

31
Examination of the linear combinations of the dependent variables from the
discriminant function analyses identified the domains and variables most responsible for
group differences. Generally, individual factors were most responsible for differentiating
among groups, independent of gender and grade, followed by certain school factors.
Anger and expression of anger, as well as school adjustment and environmental factors,
emerged as significantly associated with group differences. Both anger and school
environment variables have not previously been examined in the literature in this type of
design (Bosworth et al., 1999; Boulton & Smith, 1994; Haynie et al., 2001; Nansel et al.,
2001; Pellegrini et al., 1999; Pellegrini & Long, 2002; Simon-Morton et al., 1999).
However, achievement, family flexibility, and the quality of campus conditions
minimally related to group differences overall, but did contribute when special groups
were examined (i.e., females and younger students). These contributions to
understanding the differences among students involved in bullying and victimization are
considerable. The addition of family factors added another facet of student life for the
purpose of further evaluation and intervention. The inclusion of family connectedness
and flexibility has shown the important secondary relationships between child adjustment
and functioning at home and at school, and suggests that child experiences at home have
an impact on experiences at school. Other studies have further suggested that both
gender and grade may play an important role in the understanding of bullying and
victimization (Haynie et al., 2001). The present study found that, depending on gender
and grade, the importance of significant constructs in describing group profiles varies.
Male and older student, primarily 8th grade, group differences were driven more by
mood, peer relationships, and achievement variables. Female group differences were
described primarily by anger, discipline referrals, and teacher reported behavior and
mood problems. The experience of behavior difficulties appeared to distinguish among
students involved in bullying, while mood difficulties and relationships with peers drove
differences for males and older students. Both 6th and 8th grade student group differences
were described best by school climate and condition.
The present study has several strengths and represents a compilation of unique

32
assessments that help further the field of bulling and school violence research. Several
previous studies examined a single factor in separate studies where the contributions of
each factor could not be measured with each other (Baldry & Farrington, 1998; 2000;
Craig, 1998; Rigby, 1993; Simons-Morton et al., 1999). Those studies that have included
various domains of child development still failed to examine the impact of school
environment on child behavior (Boulton & Smith, 1994; Haynie et al., 2001; Nansel et
al., 2001, Pellegrini & Long, 2002). Sample sizes within this study were larger than most
clinical studies, which indicated adequate representation of both district and national
phenomena as well as allowed the feasibility of assessing numerous variable associations.
Group frequencies for bullies, victims, and bully/victims, in particular, were
representative of national levels (Olweus et al., 1999; Solberg & Olweus, 2002).
Of most importance, this study assessed a number of factors in children’s lives in
multiple dimensions with separate raters and data collected in various formats (Holmbeck
et al., 2003; Pellegrini & Long, 2003). Typically, past research has focused on obtaining
student self-report for individual, family, and school factors (Haynie et al., 2001; Nansel
et al., 2001). Within the present study’s comprehensive design, variables that were not
previously examined were included and resulted in significant relationships in describing
group differences. Specifically, trait anger, anger expression, and school environment
were among those that emerged in unique patterns of prediction. Additionally, teacher
report and records data were collected to strengthen the study design. Both teacher report
and records data resulted in associations contrary to the literature, suggesting that
obtaining information from other sources can produce an alternate pattern of influences,
thus emphasizing the need for a multi-informant evaluation. Analyses were conducted by
grade and gender, which added further understanding to the profiles of bullies, victims,
and bully/victims.
Just as the examination of grade and gender was a strength, it also presented as a
limitation. The percentage of students categorized as bully/victims was small, given the
strict Olweus Bully/Victim Questionnaire criteria for forming groups, and became even
further reduced when broken down into six grade by gender categories (Olweus, 1996).

33
The difference among group sample sizes within analyses was large, which could have
negative implications in examination of group comparisons and especially interaction
effects. In addition, the study was limited in terms by its cross-sectional nature. While
several significant relationships were found in understanding bullying and victimization,
causality could not be assumed. The present study could not answer the question of
which comes first, child adjustment variables or bullying involvement. Recent literature
has begun to examine longitudinal aspects of bullying and victimization, suggesting the
importance of examining trends of behavior across time (Pellegrini & Long, 2002). The
present study only assessed behavior and perceptions from in middle school children,
while other studies have looked at transitions from grad school to middle school or
middle school to high school (Nansel et al., 2001; Pellegrini & Long, 2002).
The results in this study have important implications in terms of understanding
school violence, specifically bullying and victimization, and speculating the direction of
preventive interventions. The most fundamental finding is that of group differences, by
gender and grade, for associations of variables. This speaks to the need to tailor
intervention and prevention programming in order to address the specific characteristics
of each category of students. For example, programs should be developed to focus on
those individual, family, and school factors that are related to being categorized as a
middle school male victim of bullying. This type of focus has the potential to bring
school violence intervention programming outside the school and into students’ homes.
This method of intervention can improve communication and support between families
and school personnel and emphasize the continuity of care among each system children
encounter. Several results speak to the importance of maintaining positive home and
school environments. Although some unique findings emerged, the contradictions of few
associations with results previously reported in the literature begs further examination of
multi-informant and multi-method data that would provide additional explanations to
several of these conflicting findings. Future research should explore the assessment of
various constructs by rater to further comprehend differential associations.

34
References
Achenbach, T.M. (1991). Teacher’s report form for ages 5-18. Burlington, VT: University of Vermont, Center for Children, Youth, & Families.
Arora, C.M.J. (1996). Defining Bullying. School Psychology International, 17,
317-329.
Austin, S. & Joseph, S. (1996). Assessment of bully/victim problems in 8 to 11 year-olds. British Journal of Educational Psychology, 66, 447-456.
Baldry, A.C. & Farrington, D.P. (1998). Parenting influences on bullying and victimization. Legal and Criminological Psychology, 3, 237-254.
Baldry, A. & Farrington, D.P. (2000). Bullies and delinquents: Personal characteristics and parental styles. Journal of Community and Applied Social Psychology, 10, 17-31.
Batsche, G.M. & Knoff, H.M. (1994). Bullies and their victims: Understanding a pervasive problem in the schools. School Psychology Review, 23(2), 165-174.
Besag, V.E. (1989). Bullies and victims in schools. Milton Keynes: Open University Press.
Bjorkvist, K., Ekman, K., & Lagerspetz, K. (1982). Bullies and victims. Their
ego picture, ideal ego picture, and normative ego picture. Scandinavian Journal of Psychology, 23, 307-313.
Bosworth, K., Espelage, D.L., & Simon, T.R. (1999). Factors associated with
bullying behavior in middle school students. Journal of Early Adolescence, 19(3), 341-362.
Boulton, M.J. (1993). A comparison of adults' and children's abilities to
distinguish between aggressive and playful fighting in middle school pupils: Implications for playground supervision and behavior management. Educational Studies, 19(2), 193-203.

35
Boulton, M.J. & Smith, P.K. (1994). Bully/victim problems in middle-school children: Stability, self-perceived competence, peer perceptions, and peer acceptance. British Journal of Developmental Psychology, 12, 315-329.
Boulton, M.J. & Underwood, K. (1992). Bully/victim problems among middle school children. British Journal of Educational Psychology, 62, 73-87.
Bowers, L.S., Smith, P.K., & Binney, V. (1992). Cohesion and power in the
families of children involved in bully/victim problems at school. Journal of Family Therapy, 14(4), 371-387.
Carberry, A., & Handel, P.J. (1980). The use of the AML Scale with a Headstart
population: Normative and validation studies. American Journal of Community Psychology. 8(3), 353-363.
Carney, J.V. (2000). Bullied to death. School Psychology International, 21(2), 213-223.
Carney, A.G. & Merrell, K.W. (2001). Bullying in schools: Perspectives on understanding and preventing an international problem. School Psychology International, 22(3), 364-382.
Cowen, E.L., Dorr, D., Clarfield, S.P., Kreling, B., McWilliams, S.A., Pokracki, F., Pratt, D.M., Terrell, D.L., & Wilson, A.B. (1973). The AML: A quick screening device for early identification of school maladaptation. American Journal of Community Psychology, 1, 12-35.
Craig, W.M. (1998). The relationship among bullying, victimization, depression,
anxiety, and aggression in elementary school children. Personality & Individual Differences, 24(1), 123-130.
Craig, W.M., Pepler, D., & Atlas, R. (2000). Observations of bullying in the playground and in the classroom. School Psychology International, 21(1), 22-36.
Crick, N.R. & Dodge, K.A. (1994). A review and reformulation of social information-processing mechanisms in children’s social adjustment. Psychological Bulletin, 115(1), 74-101.
Dodge, K.A. (1991). The structure and function of reactive and proactive aggression. In D.J. Pepler & K.H. Rubin (Eds.). The development and treatment of childhood aggression. (pp. 201-216). Hillsdale, NJ: Lawetance Erlbaum.

36
Dodge, K.A. & Crick, N.R. (1990). Social information-processing bases of aggressive behavior in children. Personality and Social Psychology Bulletin, 16(1), 8-22.
Dorr, D., Stephens, J., Pozner, r., & Klodt, W. (1980). Use of the AML scale to identify adjustment problems in fourth-, fifth-, and sixth-grade children. American Journal of Community Psychology, 8, 341-352.
Durlak, J. A. & Jason, L. A. (1984). Preventive programs for school-aged
children and adolescents. In M. C. Roberts & L. Peterson (Eds.), Prevention of problems in childhood: Psychological research and applications (pp. 103-132). New York: Wiley.
Durlak, J.A., Stein, M.A., & Mannarino, A.P. (1980). Behavioral validity of a
brief teacher rating scale (the AML) in identifying high-risk acting-out schoolchildren. American Journal of Community Psychology, 8(1), 101-115.
Edman, S.O., Cole, D.A., & Howard, G.S. (1990). Convergent and discriminant
validity of FACES-III: Family adaptability and cohesion. Family Process, 29(1), 95-103. Edmonson, B. (1988). Disability and sexual adjustment. In Van Hasselt, Vincent
B., Strain, & Phillip S., et al. (Eds.) Handbook of developmental and physical disabilities. (pp. 91-106) Pergamon general psychology series, 148.
Elliott, D.S., Hamburg, B.A, & Williams, K.R. (1999). Violence in American
schools: A new perspective. Cambridge University Press: Cambridge, UK. Florida Department of Education (2000). Curriculum, Instruction and
Assessment [On-line]. Available: www.firn.edu/doe/sas/fcat. Gesten, E.L., Cowen, E.L., DeStephano, M.A., Weisz, P.V., & Milling, L.S.
(1979). A teacher measure for the assessment of primary grade class environments. American Journal of Community Psychology, 7(1), 117-122.
Gillespie, J. F. & Durlak, J. A. (1995). Screening children at risk for school
maladjustment: Further evidence for the value of the AML. Journal of Community Psychology, 23, 18-27.
Glover, D., Gough, G., Johnson, M., & Cartwright, N. (2000). Bullying in 25
secondary schools: Incidence, impact, and intervention. Educational Research, 42(2), 141-156.
Green, S. (2001). Systemic vs. individualistic approaches to bullying. Journal of the American Medical Association, 286(7), 787-788.

37
Green, K.D., Beck, S.J., Forehand, R., & Vosk, B. (1980). Validity of teacher nominations of child behavior problems. Journal of Abnormal Child Psychology, 8(3), 397-404.
Haynie, D.L., Nansel, T., Eitel, P., Crump, A.D., Saylor, K., Yu, K., & Simons-Morton, B. (2001). Bullies, victims, and bully/victims: Distinct groups of at-risk youth. Journal of Early Adolescence, 21(1), 29-49.
Hazler, R.J. (1996). Breaking the Cycle of Violence: Interventions for Bullying and Victimization. Athens, OH: Ohio University.
Holmbeck, G.N., Westhoven, V.C., Shapera Phillips, W., Bowers, R., Gruse, C.,
Nikolopoulos, T., Wienke Totura, C.M., & Davison, K. (2003). A multimethod, multi-informant, and multi-dimensional perspective on psychosocial adjustment in preadolescents with spina bifida. Journal of Consulting and Clinical Psychology, 71(4), 782-796.
Hoover, J.H., Oliver, R., & Hazler, R.J. (1992). Bullying: Perceptions of adolescent victims in the Midwestern USA. School Psychology International, 13, 5-16.
Kumpulainen, K., Rasanen, E., Henttonen, I., Almqvist, F., Kresanov, K., Linna,
S.L., Moilanen, I., Piha, J., Tamminen, T., & Puura, K (1998). Bullying and psychiatric symptoms among elementary school-aged children. Child Abuse and Neglect, 22, 705-717.
Lagerspetz, K.M., Bjoerkqvist, K., Berts, M., & King, E. (1982). Group
aggression among school children in three schools. Scandinavian Journal of Psychology, 23(1), 45-52.
Lane, D.A. (1989). Bullying in school: The need for an integrated approach. School Psychology International, 10, 211-215.
Nansel, T.R., Overpeck, M., Pilla, R.S., Ruan, W.J., Simons-Morton, B., &
Scheidt, P. (2001). Bullying behaviors among US youth: Prevalence and association with psychosocial adjustment. Journal of the American Medical Association, 285(16), 2094-2100.
Oliver, R., Oaks, I.N., & Hoover, J.H. (1994). Family issues and interventions in bully and victim relationships. The School Counselor, 41, 199-202.
Olson, D. H., Russell, C. S., & Sprenkle, D.H. (1983). Circumplex Model of
marital and family systems: VI. Theoretical update. Family Process, 22, 69-83.

38
Olweus, D. (1978). Aggression in the schools: Bullies and whipping boys. Washington, DC: Hemisphere (Wiley).
Olweus, D. (1991a). Bully/victim problems among schoolchildren: Basic facts and effects of a school based intervention program. In D. Pepler & K.H. Rubin (Eds.), The development and treatment of childhood aggression (pp. 411-448). Hillsdale, NJ: Lawrence Erlbaum.
Olweus, D. (1991b). Victimization among school children. In R. Baenniger (Ed.), Targets of violence and aggression (pp. 45-102). Holland: Elsevier Science Publishers B.V.
Olweus, D. (1992). Bullying among schoolchildren: Intervention and prevention. In R.D. Peters, R.J. McMahon, & V.L. Quincy (Eds.), Aggression and violence throughout the life span (pp.100-125). Newbury Park, CA: Sage.
Olweus, D. (1993a). Bullying at school: What we know and what we can do. Oxford, UK and Cambridge, MA: Blackwell Publishers.
Olweus, D. (1993b). Bully/victim problems among schoolchildren: Long-term consequences and effective intervention program. In S. Hodgins (Ed.), Mental disorder and crime (pp. 317-349). Newbury Park, CA: Sage.
Olweus, D. (1993c). Victimization by peers: Antecedents and long-term outcomes. In K.H. Rubin & J.B. Asendorpf (Ed.), Social withdrawal, inhibition, and shyness in childhood (pp. 315-341). Hillsdale, N.J.: L. Erlbaum Associates.
Olweus, D. (1994a). Annotation: Bullying at school: Basic facts and effects of a school based intervention program. Journal of Child Psychology and Psychiatry, 35(7), 1171-1190.
Olweus, D. (1994b). Bullying at school: Long-term outcomes for the victims and
an effective school-based intervention program. In L.R. Huesmann (Ed.), Aggressive behavior: Current perspectives. New York: Plenum Press.
Olweus, D. (1995). Bullying or peer abuse at school: Facts and intervention. Current Directions in Psychological Science, 4(6), 196-200.
Olweus, D. (1996). The Revised Olweus Bully/Victim Questionnaire. Bergen,
Norway: Research Center for Health Promotion (HEMIL), University of Bergen, N-5015 Bergen, Norway.
Olweus, D. (1997a). Bully/victim problems in school: Facts and intervention.
European Journal of Psychology of Education, 12(4), 495-510.

39
Olweus, D. (1997b). Bully/victim problems in school: Knowledge base and effective intervention program. The Irish Journal of Psychology, 18(2), 170-190.
Olweus, D., Limber, S. & Mihalic, S.F. (1999). Blueprints for violence prevention, book nine: Bullying prevention program. Boulder, CO: Center for the Study and Prevention of Violence.
Pearce, J. (1991). What can be done about the bully? In M. Elliot (Ed.), Bullying: A practical guide to coping for schools. Harlow: Longman.
Pellegrini, A.D. (1998). Bullies and victims in school: A review and call for
research. Journal of Applied Developmental Psychology, 19(2), 165-176.
Pellegrini, A.D., Bartini, M., & Brooks, F. (1999). School bullies, victims, and aggressive victims: Factors relating to group affiliation and victimization in early adolescence. Journal of Educational Psychology, 91(2), 216-224.
Pellegrini, A.D., & Long, J.D. (2002). A longitudinal study of bullying,
dominance, and victimization during the transition from primary school through secondary school. British Journal of Developmental Psychology, 20, 259-280.
Perry, D.G., Kusel, S.J., & Perry, L.C. (1988). Victims of peer aggression.
Developmental Psychology, 24(6), 807-814. Radloff, L.S. (1977). A CES-D scale: A self-report depression scale for research
in the general population. Applied Psychological Measurement, 1, 385-401.
Rigby, K. (1993). School children’s perceptions of their families & parents as a function of peer relations. The Journal of Genetic Psychology, 154(4), 501-513.
Rigby, K. (1996). Bullying in schools and what to do about it. London: Jessica
Kingsley. Rigby, K., & Slee, P. (1991). Bullying among Australian school children:
Reported behavior and attitudes toward victims. Journal of Social Psychology, 131(5), 615-627.
Robert, R.E., Lewinsohn, P.M., & Seeley, J.R. (1991). Screening for adolescent
depression: A comparison of depression scales. Journal of the American Academy of Child and Adolescent Psychiatry, 30, 58-66.
Roland, E. (2000). Bullying in school: Three national innovations in Norwegian
schools in 15 years. Aggressive Behavior, 26, 135-143.

40
Safe Community-Safe School Project (2002). The middle school/high school
survey revised. The Center for the Study and Prevention of Violence, University of Colorado, Boulder.
Santa Lucia, R.C. & Gesten E.L. (2000). Adjustment across the middle school
transition: Gender and race considerations. Poster presentation at the annual meeting of the American Psychological Association, Washington D.C.
Santa Lucia, R.C., Gesten, E.L., Rendina-Gobioff, G., Epstein, M., Kaufmann, D.,
Salcedo, O., & Gadd, R. (2000). Children’s school adjustment: A developmental transactional systems perspective. Journal of Applied Developmental Psychology, 21 (4), 429-446.
Schwartz, D., Dodge, K.A., Pettit, G.S., & Bates, J.E. (1997). The early
socialization of aggressive victims of bullying. Child Development, 68(4), 665-675.
Sheilds, A. & Cicchetti, D. (2001). Parental maltreatment and emotion dysregulation as risk factors for bullying and victimization in middle childhood. Journal of Clinical Child Psychology, 30(3), 349-363.
Simons-Morton, B.G., Crump, A.D., Haynie, D.L., & Saylor, K.E. (1999). Student-school bonding and adolescent problem behavior. Health Education Research: Theory & Practice, 14(1), 99-107.
Slee, P.T. (1994). Situational and interpersonal correlates of anxiety associated
with peer victimization. Child Psychiatry & Human Development, 25(2), 97-107.
Slee, P.T. (1995). Peer victimization and its relationship to depression among Australian primary school students. Personality & Individual Differences, 18, 57-62.
Slee, P.T. & Rigby, K. (1993). The relationship of Eysenck’s personality factors
and self-esteem to bully-victims behavior in Australian school boys. Personality & Individual Differences, 14, 371-373.
Smith, P.K. (1991). The silent nightmare: Bullying and victimization in school
peer groups, The Psychologist. Smith, P.K. & Myron-Wilson, R. (1998). Parenting and school bullying. Clinical
Child Psychology and Psychiatry, 3(3), 405-417.
Smith, P.K. & Sharp, S. (1994). School bullying—insights and perspectives. London, Routledge.

41
Solberg, M.E. & Olweus, D. (2002). Prevalence estimation of school bullying with the Olweus bully/victim questionnaire. Aggressive Behavior (in print).
Spielberger, C.D. (1973). Preliminary test manual for the state-trait anxiety
inventory for children. Palo Alto, CA: Consulting Psychologists Press, Inc. Spielberger, C.D. (1998). The revised state-trait anger expression inventory-2
(STAXI-2). Psychological Assessment Resources, Inc. Spielberger, C.D., Jacobs, G.A., Brunner, T.M., & Lunsford, G.D. (2002). The
state-trait anger expression inventory for children and adolescents (STAXI-C/A). Psychological Assessment Resources, Inc.
Stanford Achievement Test Series: Technical data report. (1999). San Antonio, TX: Harcourt Brace Educational Measurement.
Stephenson, P., & Smith, D. (1989). Bullying in the junior school. In D.P.
Tattum & D.A. Lane (Eds.), Bullying in schools (pp. 45-57). Stroke-on-Trent, England: Trentham.
Swain, J. (1998). What does bullying really mean? Educational Research, 40(3),
358-364.
Tattum, D. & Tattum, E. (1992). Bullying: A whole-school response. In N. Jones & E.B. Jones (Eds.), Learning to behave: Curriculum and whole school management approaches to discipline (pp. 68-84). London: Kogan Page.
Verhulst, F. C. & Van Der Ende, J. (1991). Four-year follow-up of teacher-
reported problem behaviours. Psychological Medicine, 21, 965-977. Whitney, I., Nabuzoka, D., & Smith, P.K. (1992). Bullying in schools:
Mainstream and special needs. Support for Learning, 7(1), 3-7.
Wolke, D., Woods, S., Bloomfield, L., & Karstadt, L. (2000). The association between direct and relational bullying and behavior problems among primary school children. Journal of Child Psychology & Psychiatry & Allied Disciplines, 41(8), 989-1002.

42
Table 1 Group Frequencies (and Percentages) by Grade and Gender Gender Grade Group Males Females 6th 7th 8th Bully 87(7.4) 64(5.4) 28(3.7) 68(7.6) 55(7.8) Victim 169(14.4) 106(8.9) 98(12.9) 119(13.2) 59(8.4) Bully/Victim 20(1.7) 22(1.9) 13(1.7) 16(1.8) 13(1.9) Control 898(76.5) 993(83.8) 621(81.7) 696(77.4) 574(81.9) Note. Total N = 2359.

Tabl
e 2
Inte
rcor
rela
tions
bet
wee
n Sc
ales
for T
otal
Sam
ple
Scal
e 1
2 3
4 5
6 7
8 9
10
11
12
13
14
15
16
17
18
19
20
21
Indi
vidu
al D
omai
n
1. D
epre
ssio
n 1.
0
.57
.45
.2
1
.08
-.1
3
-.11
-.26
.37
-.25
-.1
8
-.24
-.31
-.2
8
-.37
.3
8
-.41
-.2
7
.11
.1
5 .1
3
2. A
nxie
ty
1.
0
.49
.0
9 -.0
1
-.07
-.0
4 -.1
3
.22
-.1
4
-.04
-.0
1 -.0
7 -.0
6
-.27
.2
0 -.2
6
-.17
.0
2 .0
9 .0
4 3.
Tra
it A
nger
1.
0
.35
.1
3
-.02
.0
3 -.1
8 .3
0 -.2
3 -.1
5 -.0
9
-.25
-.20
-.24
.2
5
-.27
-.1
7
.19
.1
6 .1
2 4.
Ang
er E
xpre
ssio
n
1.0
.18
-.1
6 -.1
7 -.1
6 .2
6
-.21
-.22
-.3
7 -.3
9
-.33
-.1
9
.23
-.3
1
-.25
.2
6
.21
.21
5. R
efer
rals
1.0
-.1
3 -.1
4 -.0
8
.16
-.1
0 -.1
1
-.18
-.17
-.1
6
-.06
.1
1
-.11
-.0
7
.38
.2
7
.32
Sc
hool
Dom
ain
6.
FC
AT-
Mat
h
1.0
.7
2
-.03
-.0
6
-.08
.
03
-.17
.0
0
.03
-.1
0
-.10
.1
1
.08
-.21
-.1
9
-.41
7.
FC
AT-
Rea
ding
1.
0
.01
-.1
0
-.06
.0
3
.20
.0
3
.05
.1
0
-.13
.1
3
.09
-.21
-.1
8
-.42
8. C
ondi
tion
of C
ampu
s
1.0
-.44
.5
0
.26
.2
4
.41
.3
8
.26
-.2
9
.27
.18
-.04
-.0
6
-.06
9. S
choo
l Clim
ate
1.0
-.4
4 -.3
2 -.3
0 -.4
0
-.40
-.2
7
.33
-.3
1
-.16
.2
4
.18
.1
7 10
. Adu
lt In
terv
entio
n
1.0
.3
4
.23
.4
3
.43
.2
4
-.29
.2
9
.20
-.09
-.0
8 -.0
4 11
. Adu
lt Su
perv
isio
n
1.
0
.33
.4
5
.42
.2
7
-.21
.2
3
.18
-.08
-.0
4
-.07
12. G
oal-O
rient
atio
n
1.0
.6
1
.54
.3
4
-.35
.4
1
.33
-.21
-.2
0
-.23
13. S
choo
l Spi
rit
1.0
.7
6
.36
-.3
8
.40
.3
3 -.2
1
-.15
-.1
6 14
. Chi
ld-T
each
er
Rel
atio
ns
1.
0
.37
-.4
1
.38
.3
1
-.20
-.1
7
-.20
15. C
hild
-Pee
r Rel
atio
ns
1.0
-.3
9
.29
.2
4
-.05
-.11
-.1
0 16
. Alie
natio
n
1.0
-.34
-.1
9
.14
.1
6
.17
Fam
ily D
omai
n
17. C
ohes
ion
1.0
.7
1
-.13
-.1
6
-.16
18
. Ada
ptab
ility
1.0
-.0
7 -.1
2
-.10
Tea
cher
Rep
ort D
omai
n
19. A
ctin
g-O
ut
1.0
-.6
8
.67
20. M
oodi
ness
1.0
.6
7 21
. Lea
rnin
g
1.
0 N
ote.
Und
erlin
ed c
orre
latio
ns a
re si
gnifi
cant
at t
he p
= .0
5 le
vel.
Bol
ded
corr
elat
ions
are
sign
ifica
nt a
t the
p =
.01
leve
l. N
’s ra
nge
from
124
5 to
247
3 fo
r ana
lyse
s (N
for T
otal
Sam
ple
= 25
09).
43

44
Table 3 Group Means (Standard Deviations) for Survey Data with MANOVA, ANOVA, and Group Post Hoc Findings Group Statistical Test Variable B V B/V C Multi Uni Individual Domain G***, GxS***
Depression 17.83 (11.25)C,V 22.30 (12.99)C,B19.84 (10.17)C 13.09 (9.35) G*** Anxiety 33.53 (9.40)C,V 37.96 (10.32)C,B38.68 (10.39)C,B31.19 (8.84) G*** Trait Anger 25.14 (5.43)C 23.92 (5.56)C 25.90 (5.29)C 20.75 (5.30) G*** Anger Expression 52.73 (8.31)C,V 44.09 (9.06)B,B/V52.58 (8.86)C,V 44.16 (8.69) G*** Referrals 4.27 (3.92)C,V 2.10 (3.49) B,B/V 4.73 (3.88)C,V 2.01 (3.48) G***
Family Domain G***, GxS***
Cohesion 48.73 (9.67)V,C 52.59 (11.15)B,C52.16 (8.49) 54.74 (10.49) G*** Adaptability 38.99 (10.28)C 40.94 (11.55) 41.78 (9.86) 42.54 (10.09) G*,
GxS**† Achievement ns FCAT Reading DSS 1762.0 (285.2) 1733.5 (327.4) 1701.0 (337.2) 1743.0 (285.2)
FCAT Math DSS 1770.5 (206.0) 1756.2 (229.6) 1699.4 (250.4) 1768.1 (214.3) School Adjustment G***, GxS** School Spirit 2.72 (0.83)C,V 3.13 (0.85)C,B 2.90 (0.98)C 3.38 (0.81) G***
Goal-Orientation 3.47 (0.84)C,V 3.82 (0.88)B 3.68 (1.00) 3.96 (0.77) G***, GxS*† Child-Peer Relations 3.51 (0.51)V 3.04 (0.61)B,B/V,C3.39 (0.74)V 3.58 (0.57) G*** Child-Teacher
Relations 2.92 (0.74)V,C 3.24 (0.74)B 3.13 (0.76) 3.38 (0.72) G***, GxS*†
Alienation 2.57 (0.62)C 2.51 (0.65)C 2.57 (0.66)C 2.27 (0.65) G*** School Environment G***, GxY*, GxYxS**
Condition of Campus 2.64 (0.65)C 2.67 (0.72)C 2.39 (0.92) C 2.83 (0.69) G*,GxY*†
School Climate 1.70 (0.53)C 1.62 (0.52)C 1.81 (0.61)C 1.37 (0.47) G*** Adult Intervention 2.66 (0.63)C 2.72 (0.67)C 2.53 (0.60)C 2.95 (0.61) G*** Adult Supervision 3.06 (0.55)C,B/V 3.09 (0.56)C,B/V 2.66 (0.61)C,B,V 3.23 (0.55) G**, GxY*†
Teacher Report Domain G***, GxYxS*
Acting-Out 9.27 (4.64)V,C 7.78 (4.00)B 9.20 (3.30)C 7.01 (3.50) G**, GxSxY**†
Moodiness 8.56 (4.04)C,V 7.43 (3.42)B 8.24 (3.88) 6.91 (3.04) G** Learning 9.85 (4.52) 8.93 (4.30) 9.68 (4.20) 8.23 (3.95) GxSxY**†
________________________________________________________________________ Note. B = Bully; V = Victim; B/V = Bully/Victim; C = Control; Multi = Multivariate; Uni/Post = Univariate/Post Hoc; G = group; Y = grade/year; S = gender/sex; FCAT = Florida Comprehensive Achievement Tests; DSS = Developmental Scale Score. Superscripts indicate Post Hoc group differences. *p < .05. **p < .01. ***p < .001. N’s range from 1394 to 2202 for analyses. † See text and Tables 4 and 5 for Post Hoc interactions.

Tabl
e 4
Mea
ns (a
nd S
tand
ard
Dev
iatio
ns) b
y G
ende
r and
Gra
de fo
r Sig
nific
ant I
nter
actio
ns
M
ales
Fe
mal
es
Grd
B
V
B
/V
C
Mal
e M
B
V
B
/V
C
Fem
ale
M
Gra
nd M
A
dapt
abili
ty
6th
46.4
7(10
.58)
42
.75(
15.5
1)
40.5
0(17
.74)
43
.37(
10.6
2)
43.3
9(11
.56)
31
.43(
8.64
) 41
.39(
9.26
) 39
.33(
4.93
) 43
.37(
9.97
) 42
.87(
9.98
) 43
.12(
10.7
8)
7th
40.4
8(7.
80)
39.9
8(9.
69)
42.0
0(8.
08)
42.2
7(10
.74)
41
.79(
10.3
3)
34.0
7(10
.33)
43
.14(
11.8
6)
41.8
6(6.
18)
42.2
2(9.
87)
41.6
7(10
.26)
41
.73(
10.2
9)
8th
41.7
1(9.
75)
39.6
6(10
.25)
43
.00(
15.4
9)
41.8
8(9.
99)
41.6
5 (1
0.09
) 36
.80(
9.84
) 36
.45(
8.65
) 42
.40(
6.35
) 42
.13(
9.35
) 41
.44(
9.45
) 41
.54(
9.76
) M
42
.19(
9.36
) 40
.92(
12.2
7)
42.0
0(12
.63)
42
.51(
10.4
7)
42.2
6(10
.69)
34
.71(
9.96
) 40
.97(
10.4
7)
41.5
3(5.
72)
42.5
7(9.
75)
41.9
8(9.
93)
42.1
2(10
.31)
G
oal-O
rient
atio
n 6th
3.
83 (.
739)
3.
82 (.
834)
4.
15 (.
526)
3.
92 (.
784)
3.
91 (.
786)
3.
47 (1
.02)
4.
16 (.
639)
3.
60 (1
.48)
4.
19 (.
688)
4.
16 (.
717)
4.
04 (.
762)
7th
3.
21 (.
848)
3.
50 (1
.02)
4.
17 (1
.01)
3.
68 (.
922)
3.
62 (.
942)
3.
66 (.
827)
3.
97 (.
726)
3.
60 (.
812)
4.
05 (.
669)
4.
00 (.
698)
3.
82 (.
847)
8th
3.
42 (.
722)
3.
71 (1
.02)
3.
33 (1
.26)
3.
82 (.
764)
3.
76 (.
812)
3.
46 (.
952)
4.
07 (.
671)
3.
43 (.
533)
4.
08 (.
679)
4.
03 (.
713)
3.
90 (.
775)
M
3.
41 (.
804)
3.
67 (.
960)
3.
81 (1
.09)
3.
80 (.
835)
3.
76 (.
862)
3.
56 (.
891)
4.
06 (.
681)
3.
56 (.
920)
4.
11 (.
681)
4.
06 (.
712)
3.
91 (.
804)
C
hild
-Tea
cher
Rel
atio
ns
6th
2.94
(.80
1)
3.26
(.61
3)
3.28
(1.3
9)
3.35
(.74
1)
3.32
(.73
6)
2.36
(.80
7)
3.46
(.69
9)
3.56
(.85
0)
3.56
(.69
3)
3.52
(.72
0)
3.42
(.73
4)
7th
2.91
(.58
7)
3.12
(.71
4)
3.46
(.60
3)
3.19
(.73
4)
3.16
(.72
0)
2.99
(.72
2)
3.40
(.74
1)
3.01
(.52
9)
3.46
(.69
4)
3.41
(.70
8)
3.29
(.72
5)
8th
3.00
(.71
5)
2.97
(.83
6)
2.71
(.73
0)
3.26
(.65
6)
3.19
(.69
3)
2.92
(.89
9)
3.29
(.89
2)
3.04
(.52
5)
3.43
(.71
5)
3.39
(.74
6)
3.29
(.72
6)
M
2.95
(.67
4)
3.14
(.71
5)
3.11
(.88
0)
3.26
(.71
5)
3.22
(.72
0)
2.87
(.81
5)
3.40
(.75
6)
3.16
(.63
6)
3.48
(.70
1)
3.44
(.72
5)
3.33
(.73
0)
Con
ditio
n of
Cam
pus
6th
2.78
(.78
3)
2.68
(.70
4)
2.08
(1.3
2)
2.89
(.71
8)
2.84
(.73
3)
2.07
(.86
3)
3.14
(.61
2)
1.67
(.57
7)
2.97
(.68
7)
2.96
(.70
3)
2.90
(.72
0)
7th
2.60
(.62
9)
2.59
(.76
6)
2.62
(.82
1)
2.79
(.70
1)
2.74
(.70
8)
2.58
(.65
5)
2.41
(.65
0)
2.94
(.90
5)
2.83
(.66
2)
2.77
(.67
6)
2.76
(.69
1)
8th
2.73
(.59
5)
2.67
(.68
4)
2.48
(.90
0)
2.76
(.66
1)
2.74
(.66
2)
2.72
(.61
4)
2.53
(.66
1)
1.83
(.57
7)
2.75
(.66
7)
2.72
(.67
0)
2.73
(.66
5)
M
2.68
(.63
9)
2.64
(.71
7)
2.44
(.93
4)
2.81
(.69
5)
2.77
(.70
3)
2.57
(.67
4)
2.71
(.71
5)
2.31
(.92
8)
2.85
(.67
7)
2.82
(.69
0)
2.79
(.69
6)
Adu
lt Su
perv
isio
n 6th
3.
04 (.
611)
2.
95 (.
551)
2.
78 (.
786)
3.
11 (.
691)
3.
07 (.
669)
3.
15 (.
693)
3.
26 (.
597)
2.
79 (1
.16)
3.
34 (.
514)
3.
32 (.
535)
3.
20 (.
616)
7th
2.
92 (.
496)
3.
03 (.
559)
2.
66 (.
644)
3.
04 (.
533)
3.
02 (.
537)
3.
08 (.
567)
3.
07 (.
539)
2.
90 (.
348)
3.
29 (.
480)
3.
25 (.
498)
3.
14 (.
529)
8th
3.
17 (.
591)
3.
00 (.
531)
2.
41 (.
619)
3.
19 (.
527)
3.
15 (.
549)
3.
06 (.
512)
3.
37 (.
513)
2.
50 (.
270)
3.
34 (.
473)
3.
32 (.
487)
3.
24 (.
524)
M
3.
04 (.
561)
2.
99 (.
546)
2.
59 (.
644)
3.
11 (.
589)
3.
08 (.
587)
3.
08 (.
551)
3.
21 (.
563)
2.
75 (.
571)
3.
33 (.
489)
3.
29 (.
507)
3.
19 (.
558)
A
ctin
g-O
ut
6th
10.0
0 (4
.11)
7.
97 (3
.70)
7.
25 (2
.50)
7.
86 (3
.85)
7.
97 (3
.83)
6.
40 (4
.83)
6.
79 (2
.72)
11
.20
(3.3
5)
6.03
(2.6
3)
6.22
(2.7
9)
7.09
(3.4
6)
7th
11.5
7 (.5
11)
7.50
(4.1
1)
9.33
(1.5
3)
7.95
(4.0
1)
8.25
(4.2
4)
7.08
(3.5
5)
9.04
(5.1
5)
10.8
6 (3
.13)
6.
43 (2
.93)
6.
85 (3
.40)
7.
50 (3
.87)
8th
9.
33 (4
.28)
8.
42 (4
.44)
9.
33 (2
.08)
7.
78 (3
.90)
8.
02 (3
.98)
10
.00
(5.0
6)
6.75
(.3.
44)
4.33
(.57
7)
6.41
(3.1
7)
6.60
(3.3
8)
7.28
(3.7
4)
M
10.3
5 (4
.62)
7.
90 (4
.00)
8.
50 (2
.17)
7.
86 (.
391)
8.
08 (4
.01)
7.
85 (4
.32)
7.
63 (4
.05)
9.
67 (3
.89)
6.
28 (2
.91)
6.
56 (3
.21)
7.
29 (3
.69)
Le
arni
ng
6th
10.7
5 (4
.99)
9.
61 (4
.36)
10
.50
(1.2
9)
9.00
(3.9
1)
9.20
(4.0
1)
9.40
(6.5
0)
8.46
(4.0
5)
10.8
0 (6
.06)
7.
64 (3
.66)
7.
82 (3
.83)
8.
51 (3
.98)
7th
11
.05
(4.8
8)
8.00
(3.8
7)
9.33
(2.0
8)
8.83
(4.1
4)
8.93
(4.2
0)
9.00
(4.0
9)
10.2
1 (4
.92)
10
.71
(4.9
6)
7.89
(3.9
2)
8.39
(4.1
2)
8.58
(4.1
7)
8th
9.05
(4.4
4)
9.42
(4.6
0)
9.00
(4.3
6)
8.81
(4.2
4)
8.89
(4.2
7)
10.1
7 (3
.64)
7.
44 (3
.67)
5.
33 (1
.15)
7.
47 (3
.70)
7.
59 (3
.71)
8.
21 (4
.04)
M
10
.20
(4.7
4)
8.98
(4.2
6)
9.70
(2.5
0)
8.89
(4.0
8)
9.02
(4.1
5)
9.39
(4.2
1)
8.86
(4.3
9)
9.67
(5.1
2)
7.67
(3.7
6)
7.91
(3.9
1)
8.44
(4.0
6)
Not
e. B
= B
ullie
s, V
= V
ictim
s, B
/V =
Bul
ly/V
ictim
s, C
= C
ontro
l, G
rd =
Gra
de, M
= M
ean.
45
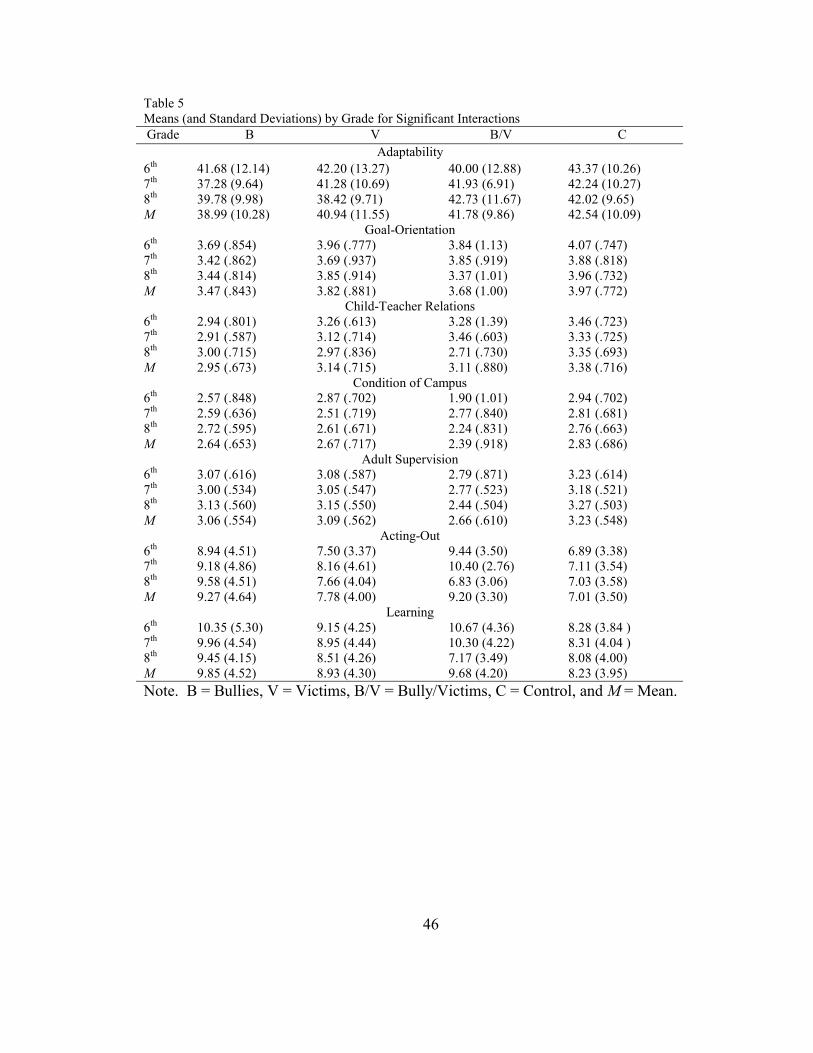
46
Table 5 Means (and Standard Deviations) by Grade for Significant Interactions Grade B V B/V C
Adaptability 6th 41.68 (12.14) 42.20 (13.27) 40.00 (12.88) 43.37 (10.26) 7th 37.28 (9.64) 41.28 (10.69) 41.93 (6.91) 42.24 (10.27) 8th 39.78 (9.98) 38.42 (9.71) 42.73 (11.67) 42.02 (9.65) M 38.99 (10.28) 40.94 (11.55) 41.78 (9.86) 42.54 (10.09)
Goal-Orientation 6th 3.69 (.854) 3.96 (.777) 3.84 (1.13) 4.07 (.747) 7th 3.42 (.862) 3.69 (.937) 3.85 (.919) 3.88 (.818) 8th 3.44 (.814) 3.85 (.914) 3.37 (1.01) 3.96 (.732) M 3.47 (.843) 3.82 (.881) 3.68 (1.00) 3.97 (.772)
Child-Teacher Relations 6th 2.94 (.801) 3.26 (.613) 3.28 (1.39) 3.46 (.723) 7th 2.91 (.587) 3.12 (.714) 3.46 (.603) 3.33 (.725) 8th 3.00 (.715) 2.97 (.836) 2.71 (.730) 3.35 (.693) M 2.95 (.673) 3.14 (.715) 3.11 (.880) 3.38 (.716)
Condition of Campus 6th 2.57 (.848) 2.87 (.702) 1.90 (1.01) 2.94 (.702) 7th 2.59 (.636) 2.51 (.719) 2.77 (.840) 2.81 (.681) 8th 2.72 (.595) 2.61 (.671) 2.24 (.831) 2.76 (.663) M 2.64 (.653) 2.67 (.717) 2.39 (.918) 2.83 (.686)
Adult Supervision 6th 3.07 (.616) 3.08 (.587) 2.79 (.871) 3.23 (.614) 7th 3.00 (.534) 3.05 (.547) 2.77 (.523) 3.18 (.521) 8th 3.13 (.560) 3.15 (.550) 2.44 (.504) 3.27 (.503) M 3.06 (.554) 3.09 (.562) 2.66 (.610) 3.23 (.548)
Acting-Out 6th 8.94 (4.51) 7.50 (3.37) 9.44 (3.50) 6.89 (3.38) 7th 9.18 (4.86) 8.16 (4.61) 10.40 (2.76) 7.11 (3.54) 8th 9.58 (4.51) 7.66 (4.04) 6.83 (3.06) 7.03 (3.58) M 9.27 (4.64) 7.78 (4.00) 9.20 (3.30) 7.01 (3.50)
Learning 6th 10.35 (5.30) 9.15 (4.25) 10.67 (4.36) 8.28 (3.84 ) 7th 9.96 (4.54) 8.95 (4.44) 10.30 (4.22) 8.31 (4.04 ) 8th 9.45 (4.15) 8.51 (4.26) 7.17 (3.49) 8.08 (4.00) M 9.85 (4.52) 8.93 (4.30) 9.68 (4.20) 8.23 (3.95) Note. B = Bullies, V = Victims, B/V = Bully/Victims, C = Control, and M = Mean.

47
Appendices

48
Appendix A Definitions of Bullying Behavior
Several studies have focused primarily on defining behaviors that constitute
bullying. Early definitions concentrate on individual or group violence toward an unpopular individual that begins and ends suddenly. One of the field’s prominent researchers initially suggested that bullies are males who physically and emotionally harass their victims, whether the victims are males or females (Olweus, 1978). Olweus was the first to introduce the notion of emotional, or “mental” bullying, making it considerably more difficult to observe and agree upon all forms of definable bullying behaviors. Since his early definition, several other definitions of bullying also have included the notion of mental or psychological attacks in addition to physical behaviors.
Besag (1989) stressed the importance of long-term and systematic violence as integral in considering bullying behaviors. However, other researchers have not always found this element to be necessary. Arora (1996) argues that a single event of a physical or psychological attack or threat delivered to a less powerful individual for the purpose of frightening and upsetting that individual is no less bullying than long-term and sustained attacks or threats. This definition also builds upon others by introducing a power differential between perpetrator and victim.
Scandinavian researchers Bjorkvist, Ekman, and Lagerspetz (1982) emphasize that the long-term nature of bullying behaviors is indicative of the social system occurring amongst students, which tends to be resistant to change. They suggest that bullying is a social form of aggression that occurs among individuals who encounter each other regularly. The emphasis in this definition is on the ongoing interaction between members in the group of students within which the bullying takes place. Other researchers, however, continue to consider the long-term aspect to be an important characteristic of bullying behaviors while also emphasizing the social and psychological aspects. For instance, Hazler (1996) defined bullying as repeated behaviors that affect individuals physically, emotionally, and psychologically through words, attacks, or social isolation. Some of the literature discusses the effect of the long-term element of bullying on the victims, in addition to the severity and duration of the single bullying act. Perhaps the accumulation of bullying behaviors over time may be as relevant as or more relevant to the experience of victimization than the impact of each individual bullying behavior.
Besag (1989) introduced the concept of intentionality to bullying, which suggests a moral dimension to the behavior. Bullying by this definition is intended to cause distress to others for the purpose of gratifying the aggressor. This definition suggests that it is not just the nature of the behavior that is important in determining what is bullying; the physical, psychological, and emotional impact of the behavior on others is of particular concern as well.
Olweus (1996) recently developed a more comprehensive definition of bullying and victimization that has been widely used in international studies. This definition identifies several concepts established in earlier definitions and reads as follows: “We define or explain the word bullying. We say a student is being bullied when another student,

49
Appendix A (Continued) or several other students
• Say mean and hurtful things or make fun of him or her or call him or her mean and hurtful names
• Completely ignore or exclude him or her from their group of friends or leave him or her out of things on purpose
• Hit, kick, push, shove around, or lock him or her inside a room • Tell lies or spread false rumors about him or her or send mean notes and try to make
other students dislike him or her • And other hurtful things like that.
When we talk about bullying, these things happen repeatedly, and it is difficult for the student being bullied to defend himself or herself. We also call it bullying, when a student is teased repeatedly in a mean and hurtful way. But we don’t call it bullying when the teasing is done in a friendly and playful way. Also, it is not bullying when two students of about equal strength or power argue or fight (Olweus, 1991, pg. 7)”
Smith and Sharp (1994) adapted and translated Olweus’s definition of bullying
into English as a preface to their self-report evaluation of bullying and victimization (Olweus, 1996) for the Sheffield/DES Bullying Project in the United Kingdom, an intervention program that takes a whole school approach to student behavior and adjustment.
Olweus (1996) emphasizes that behavior is considered bullying if it (1) occurs frequently either one-on-one or in a group, (2) involves a range of behaviors from physical aggressiveness to spreading rumors, and (3) involves a power differential between aggressor and victim. The gender of perpetrators is not specified by Olweus, as it had been in previous definitions, suggesting that both girls and boys can be bullies. Olweus’s current definition has been used to guide self-report of behaviors for the U.S. National Blueprints Model Bullying Prevention Program, which aims at decreasing bully and victim problems among primary and secondary school children through techniques to increase awareness of students, school administrators, and parents of difficulties within the school environment (Olweus, Limber, & Mihalic, 1999).
Of note, Olweus’s definition considers teasing a form of bullying behavior as well. He indicates that repeated teasing, name-calling, or generally saying unpleasant things to others constitutes a form of bullying. Pearce (1991) also developed a definition for bullying that incorporates teasing behavior. Teasing could be considered bullying if it includes methods of intimidation that lead to distress in victims. Therefore, it is appropriate to suggest that racist and sexist attacks would be considered bullying behaviors, as long as they have deliberate intent to harm others, are unprovoked, and are

50
Appendix A (Continued) frequent (Swain, 1998). In other words, victims are not believed to induce bullying behavior against them.
No single definition has been clearly established as the gold standard for determining bullying behavior. However, several common elements emerge: physical, verbal or psychological aggression intended to hurt others and cause distress in a victim, the existence of a power differential between bully and victim, and that the bullying typically is not provoked by aggressive acts (Swain, 1998). Each definition is ultimately based on individual researchers’ opinions of what constitutes bullying behavior, thus confounding the interpretation of results between studies. In searching for a more complete definition, types of behaviors have been further categorized as direct and indirect forms of bullying (Olweus, 1996). Direct bullying behaviors are considered those overtly focused at a victim, and which tend to be easily observed. These behaviors include hitting, pushing, verbal abuse, stealing, and threats. Indirect bullying behaviors are those that are covert in their focus on the victim. These behaviors include spreading rumors, ostracizing students, and purposefully ignoring or excluding students (Olweus, 1996). This distinction between direct and indirect behaviors has implications for how behavior is reported and observed as bullying.
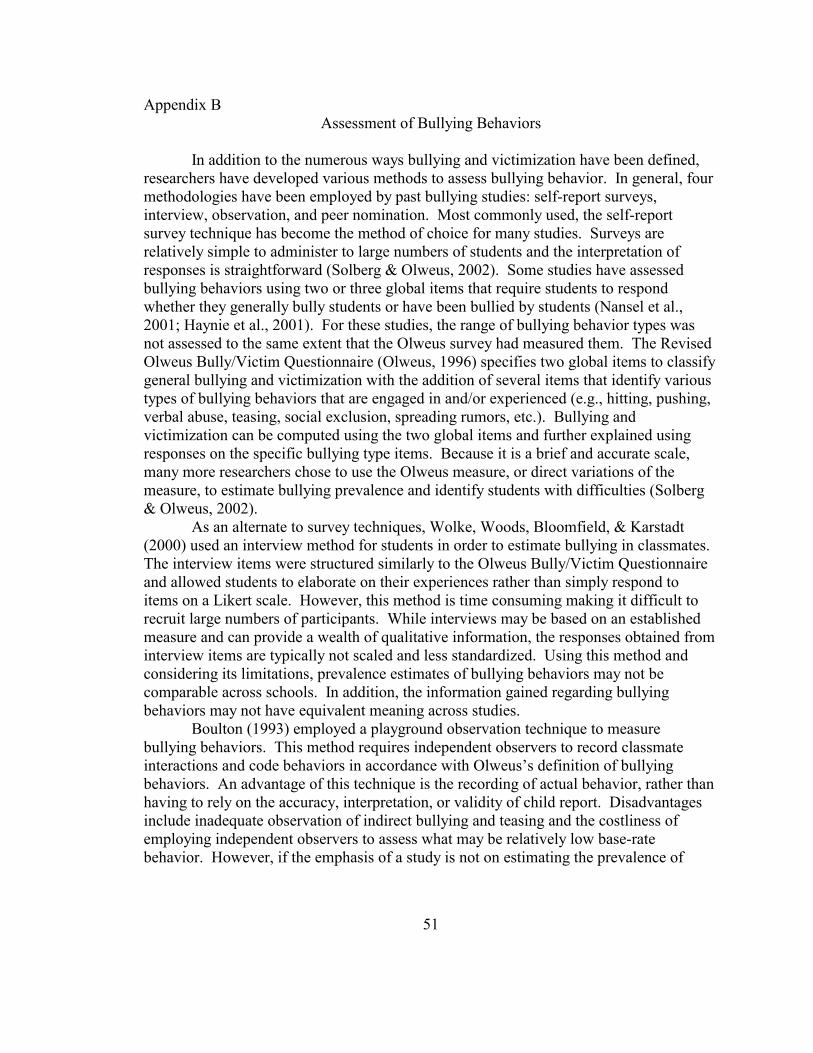
51
Appendix B Assessment of Bullying Behaviors
In addition to the numerous ways bullying and victimization have been defined,
researchers have developed various methods to assess bullying behavior. In general, four methodologies have been employed by past bullying studies: self-report surveys, interview, observation, and peer nomination. Most commonly used, the self-report survey technique has become the method of choice for many studies. Surveys are relatively simple to administer to large numbers of students and the interpretation of responses is straightforward (Solberg & Olweus, 2002). Some studies have assessed bullying behaviors using two or three global items that require students to respond whether they generally bully students or have been bullied by students (Nansel et al., 2001; Haynie et al., 2001). For these studies, the range of bullying behavior types was not assessed to the same extent that the Olweus survey had measured them. The Revised Olweus Bully/Victim Questionnaire (Olweus, 1996) specifies two global items to classify general bullying and victimization with the addition of several items that identify various types of bullying behaviors that are engaged in and/or experienced (e.g., hitting, pushing, verbal abuse, teasing, social exclusion, spreading rumors, etc.). Bullying and victimization can be computed using the two global items and further explained using responses on the specific bullying type items. Because it is a brief and accurate scale, many more researchers chose to use the Olweus measure, or direct variations of the measure, to estimate bullying prevalence and identify students with difficulties (Solberg & Olweus, 2002).
As an alternate to survey techniques, Wolke, Woods, Bloomfield, & Karstadt (2000) used an interview method for students in order to estimate bullying in classmates. The interview items were structured similarly to the Olweus Bully/Victim Questionnaire and allowed students to elaborate on their experiences rather than simply respond to items on a Likert scale. However, this method is time consuming making it difficult to recruit large numbers of participants. While interviews may be based on an established measure and can provide a wealth of qualitative information, the responses obtained from interview items are typically not scaled and less standardized. Using this method and considering its limitations, prevalence estimates of bullying behaviors may not be comparable across schools. In addition, the information gained regarding bullying behaviors may not have equivalent meaning across studies.
Boulton (1993) employed a playground observation technique to measure bullying behaviors. This method requires independent observers to record classmate interactions and code behaviors in accordance with Olweus’s definition of bullying behaviors. An advantage of this technique is the recording of actual behavior, rather than having to rely on the accuracy, interpretation, or validity of child report. Disadvantages include inadequate observation of indirect bullying and teasing and the costliness of employing independent observers to assess what may be relatively low base-rate behavior. However, if the emphasis of a study is not on estimating the prevalence of

52
Appendix B (Continued) bullying, but on identification within a school of at-risk students, interview and observation methods may be useful (Solberg & Olweus, 2002).
In addition to the survey, interview, and observation methods, The Peer Nomination Inventory, developed by Perry, Kusel, and Perry (1988), requires respondents to nominate which of their classmates are bullies or victims. A benefit of this method is that students will be more likely to validly report bullying if they have to report about others’ behavior. A disadvantage is that direct behaviors will be observed more readily than indirect, making those students who are physically aggressive more likely to be identified as bullies. Other students may not observe those who engage in such indirect bullying behaviors as isolation or rumor spreading, unless the reporting student experiences the bullying him or herself. In addition, the procedures one researcher uses to categorize student ratings resulting from peer nominations are usually complex and difficult to reproduce (Solberg & Olweus, 2002). Further, the prevalence estimates obtained through peer nomination depend on factors within the school (e.g., number of students in the classroom, problem levels in the classroom, standardization method of nominations, etc.), increasing the difficulty for other researchers to duplicate the procedures of others and extract similar meaning from prevalence estimates (Solberg & Olweus, 2002).
Olweus’s paradigm for assessing bullying has been used in several international and national intervention strategies, including the National Model Blueprints Bullying Prevention Program in the United States (Olweus, Limber, & Mihalic, 1999). The definition of bullying behaviors accompanying the Revised Olweus Bully/Victim Questionnaire incorporates most components of bullying behavior that have been found important in past research. Assessment techniques have been developed as a result of several author-formulated definitions, as previously discussed. Additionally, these assessment tools have been created to accomplish the goal of gathering information on child behaviors via varying methods and each has pros and cons. Many have found self-report survey techniques to be among the easiest to administer and comprehend. The Olweus Bully/Victim Questionnaire is an example of a comprehensive self-report survey that provides distinct criteria for reporting one’s behavior. This survey has been used in several studies in which information was obtained from students regarding their own behavior. Using Teacher Reports to Identify At-Risk Children
Assessment of child behavior can incorporate information from several sources. Ideally, a comprehensive assessment of child adjustment within the schools should utilize multiple informants. Oftentimes, obtaining reliable information from several raters in a single environment proves too costly and time consuming. Many studies, therefore, rely on a single rater, commonly, teacher report. Such assessment of large student populations is more cost effective and efficient method for obtaining information on school environments and individual students.

53
Appendix B (Continued)
Past research has shown the stability of teacher report of behavioral difficulties in school aged children. For example, moderate stability was found for the Achenbach Teacher Report Form (TRF), specifically for scales related to externalizing behaviors (Achenbach, 1991; Verhulst & Van der Ende, 1991). Of specific interest for the current study, the AML-R measure has displayed high reliability and validity for screening and evaluation purposes (Cowen, Dorr, Clarfield, Kreling, McWilliams, Pokracki, Pratt, Terrell, & Wilson, 1973). Multiple studies have confirmed the AML-R’s ability to identify children at-risk for subsequent adjustment and academic problems (Carberry & Handal, 1980; Durlak & Jason, 1984). In addition, teacher completed AML-R scores were consistent with independent observation of disruptive behaviors and psychological and attention difficulties (Durlak, Stein, & Mannarino, 1980).
While studies have shown teacher report to be a stable and effective method of assessment, reliability of teacher reports may differ between externalizing and internalizing difficulties (Green, Beck, Forehand, & Vosk, 1980). In situations with large numbers of students, teachers may have more difficulty identifying internalizing behaviors, such as anxiety, depression, and withdrawal, than externalizing behaviors, such as aggression and inattention (Gillespie & Durlak, 1995). In reporting troublesome behaviors in the classroom, teachers are likely more concerned with students who present with very overt and aggressive behaviors rather than the students who are exceedingly quiet and withdrawn. Therefore, it is important to consider teacher report surveys as a part of a larger constellation of measurement tools in order to explain child behaviors.
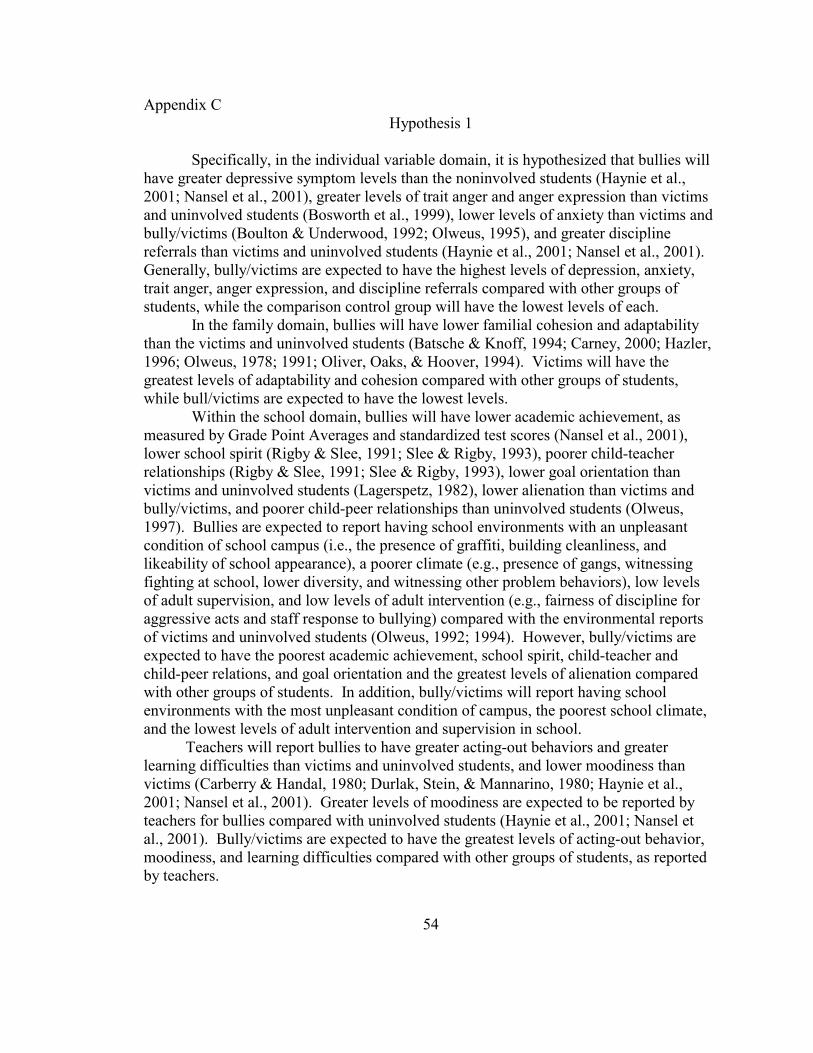
54
Appendix C Hypothesis 1
Specifically, in the individual variable domain, it is hypothesized that bullies will
have greater depressive symptom levels than the noninvolved students (Haynie et al., 2001; Nansel et al., 2001), greater levels of trait anger and anger expression than victims and uninvolved students (Bosworth et al., 1999), lower levels of anxiety than victims and bully/victims (Boulton & Underwood, 1992; Olweus, 1995), and greater discipline referrals than victims and uninvolved students (Haynie et al., 2001; Nansel et al., 2001). Generally, bully/victims are expected to have the highest levels of depression, anxiety, trait anger, anger expression, and discipline referrals compared with other groups of students, while the comparison control group will have the lowest levels of each.
In the family domain, bullies will have lower familial cohesion and adaptability than the victims and uninvolved students (Batsche & Knoff, 1994; Carney, 2000; Hazler, 1996; Olweus, 1978; 1991; Oliver, Oaks, & Hoover, 1994). Victims will have the greatest levels of adaptability and cohesion compared with other groups of students, while bull/victims are expected to have the lowest levels.
Within the school domain, bullies will have lower academic achievement, as measured by Grade Point Averages and standardized test scores (Nansel et al., 2001), lower school spirit (Rigby & Slee, 1991; Slee & Rigby, 1993), poorer child-teacher relationships (Rigby & Slee, 1991; Slee & Rigby, 1993), lower goal orientation than victims and uninvolved students (Lagerspetz, 1982), lower alienation than victims and bully/victims, and poorer child-peer relationships than uninvolved students (Olweus, 1997). Bullies are expected to report having school environments with an unpleasant condition of school campus (i.e., the presence of graffiti, building cleanliness, and likeability of school appearance), a poorer climate (e.g., presence of gangs, witnessing fighting at school, lower diversity, and witnessing other problem behaviors), low levels of adult supervision, and low levels of adult intervention (e.g., fairness of discipline for aggressive acts and staff response to bullying) compared with the environmental reports of victims and uninvolved students (Olweus, 1992; 1994). However, bully/victims are expected to have the poorest academic achievement, school spirit, child-teacher and child-peer relations, and goal orientation and the greatest levels of alienation compared with other groups of students. In addition, bully/victims will report having school environments with the most unpleasant condition of campus, the poorest school climate, and the lowest levels of adult intervention and supervision in school. Teachers will report bullies to have greater acting-out behaviors and greater learning difficulties than victims and uninvolved students, and lower moodiness than victims (Carberry & Handal, 1980; Durlak, Stein, & Mannarino, 1980; Haynie et al., 2001; Nansel et al., 2001). Greater levels of moodiness are expected to be reported by teachers for bullies compared with uninvolved students (Haynie et al., 2001; Nansel et al., 2001). Bully/victims are expected to have the greatest levels of acting-out behavior, moodiness, and learning difficulties compared with other groups of students, as reported by teachers.

55
Appendix D Hypothesis 2
Specifically, it is expected that male bullies will report the lowest levels of
depression and anxiety compared with male bully/victims, male victims, female bully/victims, and female victims. However, males in the comparison control group are expected to have the lowest levels of depression, anger, anxiety, and discipline referrals compared with other group. Male bully/victims are expected to have the greatest levels of trait anger, anger expression, and discipline referrals. Within the family domain, female bully/victims are expected to report the lowest levels of cohesion and adaptability compared with other groups of students. Family adaptability and cohesion are expected to decrease from greatest to lowest levels by group and gender in the following order: uninvolved students, male victims, female victims, male bullies, male bully/victims, and female bully/victims. Essentially, uninvolved students will have the greatest family adaptability and cohesion, while female bully/victims will have the poorest family functioning. In the school setting, male bully/victims are expected to report the lowest levels of school spirit, child-teacher relationships, child-peer relationships, academic achievement, and goal orientation, the poorest perception of school climate, adult intervention and supervision in schools, condition of school campus, and the greatest levels of alienation compared with other groups of students (Santa Lucia & Gesten, 2000). Male bully/victims are expected to have the highest teacher ratings of acting-out and learning difficulties and female bully/victims are expected to have the highest moodiness ratings compared with other students.

56
Appendix E Hypothesis 3
Specifically, 8th grade bully/victims are expected to experience the highest levels
of depression, anxiety, behavioral misconduct, and anger compared with other groups of students. Uninvolved 6th grade students are expected to have the lowest levels of anxiety, depression, anger, and discipline referrals. For family factors, adaptability and cohesion are hypothesized to be the poorest for bully/victims in 8th grade compared with other groups of students. In school, some effects can be hypothesized based on past research, while others will be further explored through results from the present study. Child-peer relations, child-teacher relations, goal orientation, and school spirit are expected to be the lowest for bullies and bully/victims in 8th grade. Alienation is likely to be the greatest for victims and bully/victims in 8th grade. Teachers are expected to report the greatest levels of acting-out, learning difficulties, and moodiness for 8th grade bully/victims.

57
Appendix F Hypothesis 4
Some effects can be hypothesized based on past research. Levels of depression
and anxiety are expected to increase for female victims and bully/victims from 6th to 8th grade compared with male victims and bully victims, in that 8th grade female bully/victims will have the greatest reports of depression and anxiety. Anger and discipline referrals are expected to increase more for male bullies and bully/victims from 6th to 8th grade than for other groups of students such that 8th grade male bully/victims will have the highest levels of anger, anger expression, and behavioral misconduct. Family levels of cohesion and adaptability are expected to decrease more so for male bullies and bully/victims from 6th to 8th grade than for other groups of students. However, 8th grade female bully/victims will overall have the lowest reported levels of family functioning. Child-peer relations are expected to increase for female victims from 6th to 8th grade, but decrease for other groups of students across grades. Eighth grade male bully/victims will have the greatest teacher reported levels of acting-out and learning difficulties, and 8th grade female bully/victims will have the greatest reports of moodiness.

58
Appendix G Olweus Bully/Victim Questionnaire-Revised
Along with assessing general involvement in bullying behaviors, the Bully/Victim
Questionnaire assesses exposure to and engagement in different types of bullying (direct and indirect methods), the location of bullying, student attitudes toward bullying, and the perceived reactions of classmates and school administrators to bullying and victimization (Olweus, 1991a). Each of the global bullying and victimization items are followed by a series of eight items asking students to indicate participation in or experience of various types of bullying behaviors (name calling, teasing, social exclusion, physical aggression, spreading rumors, stealing, and threatening). Each of the 18 items is rated on a 5-point scale: 1 = “I haven’t been bullied at school in the past couple of months,” 2 = “it has only happened once or twice,” 3 = “2 or 3 times a month,” 4 = “about once a week,” and 5 = “several times a week.” Olweus Bully/Victim Questionnaire Items: You will find questions about your life in school. There are several answers next to each question. Each answer has a number by it. Darken in the circle on the scantron form that matches the answer that best describes you for each statement. Here are some questions about being bullied by other students. First, we define or explain the word bullying. We say a student is being bullied when another student, or several other students:
• Say mean and hurtful things or make fun of him or her or call him or her hurtful names
• Completely ignore or exclude him or her from their group of friends or leave him
or her out of things on purpose
• Hit, kick, push, shove around, or lock him or her inside a room
• Tell lies or spread false rumors about him or her or send mean notes and try to make other students dislike him or her
• And other hurtful things like that, including being teased in a mean and hurtful
way.
When we talk about bullying, these things happen repeatedly, and it is difficult for the student being bullied to defend himself or herself. Note that we also call it bullying when a student is teased repeatedly in a mean and hurtful way.

59
Appendix G (Continued)
But, we don’t call it bullying when the teasing is done in a friendly and playful way. Also, it is not bullying when students of about equal strength or power argue or fight.
ABOUT BEING BULLIED BY OTHER STUDENTS Have you been bullied at school in the past couple of months in one or more of the following ways? Please answer all of the questions. I haven’t
been bullied in the past couple of months
It has only happened
once or twice
2 or 3 times a month
About once a week
Several times a week
4. How often have you been bullied at school in the past couple of months?
1 2 3 4 5
5. I was called mean names, was made fun of, or teased in a hurtful way.
1 2 3 4 5
6. Other students left me out of things on purpose, excluded me from their group of friends, or completely ignored me.
1 2 3 4 5
7. I was hit, kicked, pushed, shoved around, or locked indoors.
1 2 3 4 5
8. Other students told lies or spread false rumors about me and tried to make others dislike me.
1 2 3 4 5
9. I had money or other things taken away from me or damaged.
1 2 3 4 5
10. I was threatened or forced to do things I didn’t want to do.
1 2 3 4 5

60
Appendix G (Continued)
I haven’t been bullied in the past couple of months
It has only happened
once or twice
2 or 3 times a month
About once a week
Several times a week
11. I was bullied with mean names or comments about my race or color.
1
2
3
4
5
12. I was bullied with mean names, comments, or gestures with a sexual meaning.
1 2 3 4 5
13. I was bullied in another way. In this case, please write where:_________________
1 2 3 4 5
14. In which classes is the student or students who bully you? I haven’t been bullied in the last couple of
months
In my class In a different class but same
grade
In a higher grade
In a lower grade
In different grades
1 2 3 4 5 6 15. Have you been bullied by boys or girls? I haven’t been bullied in the last couple of
months
Mainly by one girl
By several girls
Mainly by one boy
By several boys
By both boys and girls
1 2 3 4 5 6 16. By how many students have you usually been bullied? I haven’t been bullied in the last couple of
months
Mainly by one student
By a group of 2-3 students
By a group of 4-9 students
By a group of more than 9
students
By several different
students of groups
1 2 3 4 5 6

61
Appendix G (Continued) 17. How long has the bullying lasted? I haven’t been bullied in the last couple of
months
It lasted one or two weeks
It lasted about a month
It has lasted about 6 months
It has lasted about a year
It has gone on for several
years
1 2 3 4 5 6
I haven’t been bullied in the last couple of months
I have been bullied in one or more of the following places in the past couple of months
18. Where have you been bullied? 1 2 Continue here if you have been bullied in the past couple of months: Have you been bullied: No Yes 18a. on the playground/athletic field (during recess or break times)? 1 2 18b. in the hallways/stairwells? 1 2 18c. in class (with the teacher present)? 1 2 18d. in the classroom (without the teacher present)? 1 2 18e. in the bathroom? 1 2 18f. in gym class or the gym locker room/shower? 1 2 18g. in the lunch room? 1 2 18h. on the way to and from school? 1 2 18i. at the school bus stop? 1 2 18j. on the school bus? 1 2 18k. somewhere else in school? In this case, please write where:_________________
1 2

62
Appendix G (Continued)
Have you told (that you have been bullied): No Yes 19a. your class (homeroom) teacher? 1 2 19b. another adult at school (a different teacher, the principal, the school nurse, the custodian, the school psychologist, etc.)? 1 2
19c. your parents/guardians? 1 2 19d. your brothers or sisters? 1 2 19e. your friends? 1 2 19f. somebody else? In this case, please write who:_______________
1 2
Almost
Never Once in a while
Some-times
Often Almost Always
20. How often do the teachers or other adults try to put a stop to it when a student is being bullied at school?
1 2 3 4 5
21. How often do other students try to put a stop to it when a student is being bullied at school?
1 2 3 4 5
I haven’t
been bullied in the last couple of months
No, they haven’t
contacted the school
Yes, they have
contacted the school
once
Yes they have
contacted the school
several times
22. Has any adult at home contacted the school to try to stop your being bullied at school in the past couple of months?
1 2 3 4
I haven’t been bullied in the last couple of months (skip the next 6
questions)
I have been bullied but I have not told
anyone (skip the next 6
questions)
I have been bullied and I
have told somebody
19. Have you told anyone that you have been bullied at school in the past couple of months?
1 2 3

63
Appendix G (Continued) That is
probably what he or
she deserves
I don’t feel much
I feel a bit sorry for
him or her
I feel sorry for him or
her and want to help him
or her 23. When you see a student your age being bullied at school, what do you feel or think?
1 2 3 4
ABOUT BULLYING OTHER STUDENTS
I haven’t
bullied another
student(s) in the past couple of months
It has only happened
once or twice
2 or 3 times a month
About once a week
Several times a week
24. How often have you taken part in bullying another student(s) at school in the past couple of months?
1 2 3 4 5
Have you bullied another student(s) at school in the past couple of months in one or more of the following ways? Please answer all of the questions.
I haven’t
bullied another
student(s) in the past couple of months
It has only happened
once or twice
2 or 3 times a month
About once a week
Several times a week
25. I called another student mean names, made fun of or teased him or her in a hurtful way.
1 2 3 4 5

64
Appendix G (Continued)
I haven’t bullied another
student(s) in the past couple of months
It has only happened
once or twice
2 or 3
times a month
About once
a week
Several times a week
26. I kept him or her out of things on purpose, excluded him or her from their group of friends, or completely ignored him or her.
1 2 3 4 5
27. I hit, kicked, pushed, shoved him or her around or locked him or her indoors.
1 2 3 4 5
28. I spread false rumors about him or her and tried to make others dislike him or her.
1 2 3 4 5
29. I took money or other things from him or her or damaged his or her belongings.
1 2 3 4 5
30. I threatened or forced him or her to do things he or she didn’t want to do.
1 2 3 4 5
31. I bullied him or her with mean names or comments about his or her race or color.
1 2 3 4 5
32. I bullied him or her with mean names, comments, or gestures with a sexual meaning.
1 2 3 4 5
33. I bullied him or her in another way. In this case, please write in what way:_____________
1 2 3 4 5

65
Appendix G (Continued) I haven’t
bullied other
student(s) at school in
the past couple of months
No, they haven’t
walked with me about it
Yes, they have talked
with me about it
once
Yes, they have
talked with me about it
several times
34. Has your class (homeroom) teacher talked with you about your bullying other students at school in the past couple of months?
1 2 3 4
35. Has any adult at home talked with you about your bullying other students at school in the past couple of months?
1 2 3 4
Yes Yes,
maybe I don’t know
No, I don’t
think so
No Definitely No
36. Do you think you could join in bullying a student whom you didn’t like?
1 2 3 4 5 6
I have never noticed that students my
age are bullied
I take part in
the bullying
I don’t do anything
but I think the bullying
is OK
I just watch what
goes on
I don’t do anything
but I think I
ought to help the bullied student
I try to help the bullied student in one way or another
37. How do you usually react if you see or understand that a student your age is being bullied by other students?
1 2 3 4 5 6
Never Seldom Some-times
Fairly Often Often Very
Often 38. How often are you afraid of being bullied by other students in your school?
1 2 3 4 5 6

66
Appendix G (Continued) Little
or Nothing
Fairly Little
Some-what
A good deal
Much
39. Overall, how much do you think your class teacher has done to counteract bullying in the past couple of months?
1 2 3 4 5

67
Appendix H
Center for Epidemiological Studies-Depression Scale (CES-D)
Items are rated on a 4-point scale, 0 = Never to 3 = Most of the time and the reference period is within the last week. The scale has been shown to have adequate internal consistency reliability, Cronbach’s alpha = .88 (Robert, Lewinsohn, & Seeley, 1991). Additionally, the CES-D scale showed concordant validity in identifying depressive symptomotology compared with the Beck Depression Inventory, with an 88% agreement between the two scales (Robert, Lewinsohn, & Seeley, 1991). DIRECTIONS: For each statement below, darken in the circle on the scantron form for the number that best describes how often you felt or behaved this way for each following statement-DURING THE PAST WEEK. Rarely or
none of the time (Less than 1 day)
Some or a little of the time (1-2 Days)
Occasionally or a moderate amount of time (3-4 Days)
Most or all of the time (5-7 Days)
DURING THE PAST WEEK: 1. I was bothered by things that usually don't bother me 0 1 2 3
2. I did not feel like eating; my appetite was poor 0 1 2 3
3. I felt that I could not shake off the blues even with help from my family or friends
0 1 2 3
4. I felt that I was just as good as other people 0 1 2 3
5. I had trouble keeping my mind on what I was doing 0 1 2 3
6. I felt depressed 0 1 2 3 7. I felt that everything I did was an effort 0 1 2 3
8. I felt hopeful about the future 0 1 2 3
9. I thought my life had been a failure 0 1 2 3
10. I felt fearful 0 1 2 3 11. My sleep was restless 0 1 2 3 12. I was happy 0 1 2 3 13. I talked less than usual 0 1 2 3 14. I felt lonely 0 1 2 3

68
Appendix H (Continued)
Rarely or none of the time (Less than 1 day)
Some or a little of the time (1-2 Days)
Occasionally or a moderate amount of time (3-4 Days)
Most or all of the time (5-7 Days)
15. People were unfriendly 0 1 2 3 16. I enjoyed life 0 1 2 3 17. I had crying spells 0 1 2 3 18. I felt sad 0 1 2 3 19. I felt that people disliked me 0 1 2 3
20. I could not get "going" 0 1 2 3

69
Appendix I
State-Trait Anxiety Inventory for Children (STAIC)
The Trait Anxiety subscale is rated on a 3-point scale, 1 = Hardly ever to 3 = Often. The STAIC evidenced adequate internal consistencies for the State Anxiety scale, alpha = .87 for females and alpha = .82 for males, and for the Trait Anxiety scale, alpha = .81 for females and alpha = .78 for males (Spielberger, 1973). Trait Anxiety Scale items: DIRECTIONS: A number of statements that boys and girls use to describe themselves are given below. Read each statement carefully and decide if it is hardly ever, sometimes, or often true for you. Then darken the scantron circle with the same number as the statement that describes you best. There are no right or wrong answers. Do not spend too much time on any one statement. Remember to darken the circle for each statement that best describes how you usually feel. Hardly
Ever Sometimes Often
1. I worry about making mistakes. 1 2 3 2. I feel like crying. 1 2 3 3. I feel unhappy. 1 2 3 4. I have trouble making up my mind. 1 2 3 5. It is difficult for me to face my problems. 1 2 3 6. I worry too much. 1 2 3 7. I get upset at home. 1 2 3 8. I am shy. 1 2 3 9. I feel troubled. 1 2 3 10. Unimportant thoughts run through my mind and bother me. 1 2 3
11. I worry about school. 1 2 3 12. I have trouble deciding what to do. 1 2 3 13. I notice my heart beats fast. 1 2 3 14. I am secretly afraid. 1 2 3 15. I worry about my parents. 1 2 3 16. My hands get sweaty. 1 2 3 17. I worry about things that may happen. 1 2 3 18. It is hard for me to fall asleep at night. 1 2 3 19. I get a funny feeling in my stomach. 1 2 3 20. I worry about what others think of me. 1 2 3

70
Appendix J
State-Trait Anger Expression Inventory for Children and Adolescents (STAXI-C/A)
Pilot data is current being collected on this scale and further information regarding reliability and validity must be obtained. Items are rated on a 3-point scale (1 = Hardly Ever, 2 = Sometimes, and 3 = Often). Trait Anger items: DIRECTIONS: A number of statements that boys and girls use to describe themselves are given below. Read each statement carefully and decide if it is hardly ever, sometimes, or often true for you. Then darken the scantron circle with the same number as the statement that describes you best. There are no right or wrong answers. Do not spend too much time on any one statement. Remember to darken the circle for each statement that best describes how you usually feel. Hardly
Ever Sometimes Often
1. I am annoyed. 1 2 3 2. I feel annoyed when I do a good job and no one notices me. 1 2 3
3. I get mad when I am punished unfairly. 1 2 3 4. I feel grouchy. 1 2 3 5. I get mad. 1 2 3 6. I get angry when I do well and am told I did something wrong. 1 2 3
7. I feel angry when I’m blamed for something I did not do. 1 2 3
8. I am hotheaded. 1 2 3 9. I get angry quickly. 1 2 3 10. I feel like yelling when I do something good and someone says I did bad. 1 2 3
11. I get furious when scolded in front of others. 1 2 3 12. I feel angry. 1 2 3 Anger Expression items: DIRECTIONS: A number of statements that boys and girls use to describe themselves are given below. Read each statement carefully and decide if it is hardly ever, sometimes, or often true for you. Then darken the scantron circle with the same number as the statement which describes how you respond or behave when you are angry or very angry. There are no right or wrong answers. Do not spend too much time on any one

71
Appendix J (Continued) statement. Remember to darken the circle on the scantron form for the answer that best describes how you usually respond or behave when angry or very angry. Hardly
Ever Sometimes Often
13. I am patient with others. 1 2 3 14. I show my anger. 1 2 3 15. If I don’t like someone, I keep it a secret. 1 2 3 16. I try to calm my angry feelings. 1 2 3 17. I keep cool. 1 2 3 18. I say mean things. 1 2 3 19. I hide my anger. 1 2 3 20. I try to relax. 1 2 3 21. I don’t tell anyone I am angry. 1 2 3 22. I lose my temper. 1 2 3 23. I keep my anger in. 1 2 3 24. I try to calm down. 1 2 3 25. I control my temper. 1 2 3 26. I get into arguments. 1 2 3 27. I have more anger than I show. 1 2 3 28. I take a deep breath. 1 2 3 29. I control my angry feelings. 1 2 3 30. I get into fights. 1 2 3 31. I am afraid to show my anger. 1 2 3 32. I try to reduce my anger. 1 2 3 33. I stop myself from losing my temper. 1 2 3 34. I do things like slam doors. 1 2 3 35. I get mad inside, but don’t show it. 1 2 3 36. I do something to relax and calm down. 1 2 3

72
Appendix K School Adjustment Survey (SAS)
Each item is rated on a 5-point scale (1 = Strongly Disagree to 2 = Strongly
Agree). The domains assessed are school spirit (alpha = .85), alienation (alpha = .62), goal orientation (alpha = .69), child-teacher relations (alpha = .86), and child-peer relations (alpha = .69), which each presented with adequate reliability when administered to a 6th grade sample. DIRECTIONS: Read each sentence carefully and darken the circle on the scantron form for the number that sounds most like you for each statement. Strongly
Disagree Disagree I don’t
know Agree Strongly
Agree 1. Students usually get along well with each other in this school. 1 2 3 4 5
2. Making friends is very difficult in this school. 1 2 3 4 5
3. I am in the wrong group to feel a part of this school. 1 2 3 4 5
4. A student can be himself/herself and still be accepted by other students in this school.
1 2 3 4 5
5. Most students at school like to include me in their activities. 1 2 3 4 5
6. I always seem to be left out of important school activities. 1 2 3 4 5
7. I think my teachers care about me. 1 2 3 4 5
8. Teachers are not usually available before class to talk with students.
1 2 3 4 5
9. My teachers often get to know me well. 1 2 3 4 5
10. Most teachers like my friends and me. 1 2 3 4 5
11. I care what most of my teachers think about me. 1 2 3 4 5
12. Some teachers would choose me as one of their favorite students.
1 2 3 4 5
13. I like school. 1 2 3 4 5

73
Appendix K (Continued) Strongly Disagree
Disagree
I don’t know
Agree
Strongly
Agree 14. My teachers don’t pay much attention to me. 1 2 3 4 5
15. I get a lot of encouragement at my school. 1 2 3 4 5
16. Other kids in my class have more friends than I do. 1 2 3 4 5
17. I feel a sense of school spirit. 1 2 3 4 5 18. I don’t feel safe at this school. 1 2 3 4 5 19. I have friends who are of different racial and ethnic backgrounds at this school.
1 2 3 4 5
20. Discipline is fair at this school. 1 2 3 4 5
21. I feel like I’m learning a lot in school. 1 2 3 4 5
22. School is important to me. 1 2 3 4 5 23. I believe that I’m learning important things in school. 1 2 3 4 5
24. I liked school more last year than I do this year. 1 2 3 4 5
25. I feel that I can go to my teacher for advice or help with schoolwork.
1 2 3 4 5
26. I feel that I can go to my teacher for advice or help with non-school related problems.
1 2 3 4 5
27. Most of my teachers don’t really expect very good work from me.
1 2 3 4 5
28. I don’t care how well I do in school. 1 2 3 4 5
29. I try as hard as I can to do my best at school. 1 2 3 4 5
30. I am an important member of this school. 1 2 3 4 5
31. It bothers me when I don’t do something well. 1 2 3 4 5
32. Education is important for success in life. 1 2 3 4 5
33. I feel prepared for middle school. 1 2 3 4 5

74
Appendix K (Continued) Strongly Disagree
Disagree
I don’t know
Agree
Strongly
Agree 34. I think I will go to college. 1 2 3 4 5

75
Appendix L
Middle School/High School Student Survey (MS/HS Student Survey)
Several factors from the original MS/HS Student Survey were combined for the present study’s analyses. Witnessing other Problem Behaviors, Witnessing Fighting at School, Presence of Gangs, and Diversity were aggregated to comprise the School Climate factor. Knowledge of Fairness and Discipline Policies and Staff Response to Bullying comprise the Adult Intervention factor. Condition of Campus is its own factor. These questions ask you how you feel about your school and people in your school. Please fill in the circle for the answer that most closely matches the way you feel. YES! indicates that the statement is always or almost always true for you, yes indicates that it is usually true for you, no indicates that the statement is not usually true for you, and
NO! indicates the statement is never or almost never true for you. YES! yes no NO!
1. Adults at my school teach us not to pick on other students.
4 3 2 1
2. Adults at my school try hard to keep students from bullying or picking on each other.
4 3 2 1
3. People in my school respect students of all races.
4 3 2 1
4. People of my race can succeed in my school. 4 3 2 1 5. There is graffiti at my school. 4 3 2 1 6. There is pressure to join gangs at my school. 4 3 2 1 7. My school building is clean. 4 3 2 1 8. I like the way my school looks. 4 3 2 1 9. Students in my school obey the rules. 4 3 2 1 10. There are gang fights at my school. 4 3 2 1 11. All students at my school who break the rules
are treated the same, no matter who they are. 4 3 2 1
12. When someone breaks the rules here, administrators take appropriate action.
4 3 2 1
13. There is gang activity at my school. 4 3 2 1
These questions ask you about things that go on at your school. Please fill in the circles to answer whether or not the following things have happened in the past month.
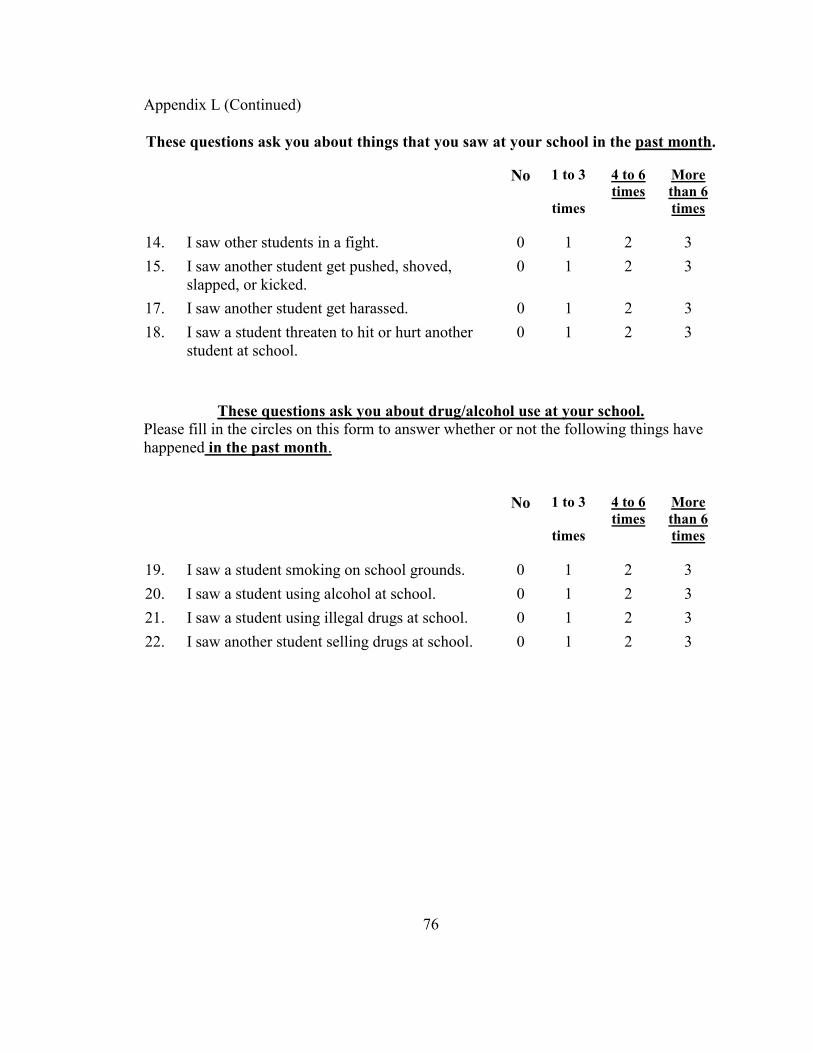
76
Appendix L (Continued) These questions ask you about things that you saw at your school in the past month. No 1 to 3
times
4 to 6 times
More than 6 times
14. I saw other students in a fight. 0 1 2 3 15. I saw another student get pushed, shoved,
slapped, or kicked. 0 1 2 3
17. I saw another student get harassed. 0 1 2 3 18. I saw a student threaten to hit or hurt another
student at school. 0 1 2 3
These questions ask you about drug/alcohol use at your school. Please fill in the circles on this form to answer whether or not the following things have happened in the past month. No 1 to 3
times
4 to 6 times
More than 6 times
19. I saw a student smoking on school grounds. 0 1 2 3 20. I saw a student using alcohol at school. 0 1 2 3 21. I saw a student using illegal drugs at school. 0 1 2 3 22. I saw another student selling drugs at school. 0 1 2 3

77
Appendix M
Adult Supervision at School (ASAS) DIRECTIONS: Read each sentence carefully and darken the circle on the scantron form for the number that sounds most like you for each statement. Strongly
Disagree Disagree I don’t
know Agree Strongly
Agree 1. In my school, teachers and administrators are in the hall when we change classes.
1 2 3 4 5
2. In my school, teachers and administrators are in the halls when we are in class.
1 2 3 4 5
3. In my school, there are lots of places where teachers and administrators cannot see what is going on.
1 2 3 4 5
4. In my classroom, teachers walk around while students are working.
1 2 3 4 5
5. In my school, there are a lot of open areas where teachers and administrators can supervise students.
1 2 3 4 5
6. In my school there are a lot of walls and barriers that make it hard for adults to supervise students.
1 2 3 4 5

78
Appendix N
Family Adaptability and Cohesion Evaluation Scales (FACES-II)
Each item is rated on a 5-point scale (1 = Almost Never, 2 = Once in a While, 3 = Sometimes, 4 = Frequently, 5 = Almost Always). Internal consistencies for each scale are good, alpha = .87 for Cohesion, alpha = .78 for Adaptability, and alpha = .90 for the whole scale. Edman, Cole, & Howard (1990) found convergent and discriminant validity between the FACES-II subscales and other measures of family functioning. DIRECTIONS: Describe your family. How often does each behavior happen in your family according to the following scale? Almost
Never Once in a
while Sometimes Frequently Almost
Always 1. Family members are supportive of each other during difficult times.
1 2 3 4 5
2. In our family, it is easy for everyone to express his/her opinion.
1 2 3 4 5
3. It is easier to discuss problems with people outside the family than with other family members.
1 2 3 4 5
4. Each family member has input regarding major family decisions.
1 2 3 4 5
5. Our family gathers together in the same room. 1 2 3 4 5
6. Children have a say in their discipline. 1 2 3 4 5
7. Our family does things together. 1 2 3 4 5
8. Family members discuss problems and feel good about the solutions.
1 2 3 4 5
9. In our family, everyone gets his/her own way. 1 2 3 4 5
10. We shift household responsibilities from person to person.
1 2 3 4 5

79
Appendix N (Continued)
Almost Never
Once in a while
Sometimes
Frequently
Almost Always
11. Family members know each other’s close friends. 1 2 3 4 5
12. It is hard to know what the rules are in our family. 1 2 3 4 5
13. Family members consult other family members on personal decisions.
1 2 3 4 5
14. Family members say what they want. 1 2 3 4 5
15. We have difficulty thinking of things to do as a family.
1 2 3 4 5
16. In solving problems, the children’s suggestions are followed.
1 2 3 4 5
17. Family members feel very close to each other. 1 2 3 4 5
18. Discipline is fair in our family. 1 2 3 4 5
19. Family members feel closer to people outside the family than to other family members.
1 2 3 4 5
20. Our family tries new ways of dealing with problems.
1 2 3 4 5
21. Family members go along with what the family decides to do.
1 2 3 4 5
22. In our family, everyone shares responsibilities. 1 2 3 4 5
23. Family members like to spend their free time with each other.
1 2 3 4 5
24. It is difficult to get a rule changed in our family. 1 2 3 4 5
25. Family members avoid each other at home. 1 2 3 4 5

80
Appendix N (Continued)
Almost Never
Once in a while
Sometimes
Frequently
Almost Always
26. When problems arise, we compromise. 1 2 3 4 5
27. We approve of each other’s friends. 1 2 3 4 5
28. Family members are afraid to say what is on their minds.
1 2 3 4 5
29. Family members pair up rather than do things as a total family.
1 2 3 4 5
30. Family members share interests and hobbies with each other.
1 2 3 4 5

81
Appendix O
Acting-Out, Moodiness, and Learning Scale-Revised (AML-R)
Each item is rated on a 5-point scale, 1 = Never to 5 = Most or all of the time. Higher scores on the scales indicate significant disturbance. The AML-R has adequate validity and test-retest reliabilities ranges over a two week period, alpha = .80 to alpha = .86 (Carberry & Handal, 1980; Cowen et al., 1973; Durlak et al., 1980; Gillespie & Durlak, 1995). Internal consistency is high (alpha = .93) (Santa Lucia, Gesten, Rendina-Gobioff, Epstein, Kaufmann, Salcedo, & Gadd, 2000). This screening device has demonstrated good concurrent and discriminant validity (Cowen et al., 1973; Gillespie & Durlak, 1995). Scores on the AML-R have been correlated with personality and academic achievement (Dorr, Stephens, Pozner, & Klodt, 1980) and have distinguished between children who were referred for mental health services and those who were not (Cowen et al., 1973). In addition, Gillespie and Durlak (1995) report a 93% true positive hit rate for the AML-R in identifying children who are at-risk. The AML-R had been developed for use with primary grade children, but has been administered to students in 6th grade with good results (Dorr, et al., 1980). Two items were added to the AML-R to assess student bullying and victimization. Child’s Name: _____________________ D.O.B.: _______________ Child’s Gender: ___ Male ___ Female Is this child in Exceptional Education? : ___ Yes ___ No
If yes, please specify ________________________ This child is in a: ___ Self-Contained ___ Continuous Progress -classroom. Instructions: Please rate the child’s behavior, as you have observed and experienced it since the beginning of school according to the following scale, by circling the appropriate number: (1) Never - You have literally never observed this behavior in this child. (2) Seldom - You have observed this behavior once or twice. (3) Moderately often - You have seen this behavior more often than once a month but less often than once a week. (4) Often - You have seen this behavior more often than once a week but less often than daily.

82
Appendix O (Continued) (5) Most or all of the time - You have seen this behavior with great frequency, averaging once a day or more often. This child: 1. gets into fights or quarrels with classmates 1 2 3 4 5 2. has to be coaxed to play or work with peers 1 2 3 4 5 3. is confused with school work 1 2 3 4 5 4. is restless 1 2 3 4 5 5. is unhappy 1 2 3 4 5 6. gets off-task 1 2 3 4 5 7. disrupts class discipline 1 2 3 4 5 8. feels hurt when criticized 1 2 3 4 5 9. needs help with school work 1 2 3 4 5 10. is impulsive 1 2 3 4 5 11. is moody 1 2 3 4 5 12. has difficulty learning 1 2 3 4 5 This Child: Not in the
past couple of months
It has only
happened once or twice
2 or 3 times a month
About once a week
Several times a week
13. has been bullied at school in the past couple of months? 1 2 3 4 5
14. has taken part in bullying another student(s) at school in the past couple of months?
1 2 3 4 5

83
Appendix P
Florida Comprehensive Achievement Tests (FCAT)
Students’ scores are compared with benchmarks defined by the state of Florida (Florida Department of Education, 2000). In addition, Florida students’ performance on the FCAT is compared with the performance of students across the nation using a norm-referenced test. The FCAT is comprised of the reading comprehension and mathematics problem-solving portions of the Stanford Achievement Test battery, 9th Edition (Stanford 9; “Stanford Achievement Test Series”, 1999). The Stanford Achievement Tests are national tests that measure students’ achievement in based reading, language arts, mathematics, science, and social science curriculum. These tests are administered to 3rd through 10th grade students in Florida school districts. The reading comprehension and math problem solving achievement tests provide a scale score and a national percentile rank. Students who receive a national percentile rank (NPR) of 50 perform at the national average. All students in grades 3 through 10 take the Norm-Referenced Test section of the FCAT and receive scale scores that range from 424-863 across all grades (Florida Department of Education, 2000). Reading and Math Developmental Scale Scores were examined for the present study since they are used to determine student achievement level. The range of Developmental Scale Scores is 86-3008.

84
Appendix Q
Multivariate and Follow-Up Univariate Analysis Tables Table 1 Multivariate Tests for Individual Domain Variables
Effect Value F Hypothesis df Error df Sig. Intercept Pillai's Trace .885 2878.12 5 1865 .000
Group Pillai's Trace .177 23.446 15 5601 .000
Gender
Pillai's Trace .016 5.953 5 1865 .000
Grade Pillai's Trace .009 1.594 10 3732 .102
Gender * Group Pillai's Trace .021 2.575 15 5601 .001
Grade * Group Pillai's Trace .019 1.158 30 9345 .252
Gender * Grade Pillai's Trace .004 .703 10 3732 .722
Gender * Grade * Group
Pillai's Trace .021 1.288 30 9345 .135
Note. Alpha level = .05.
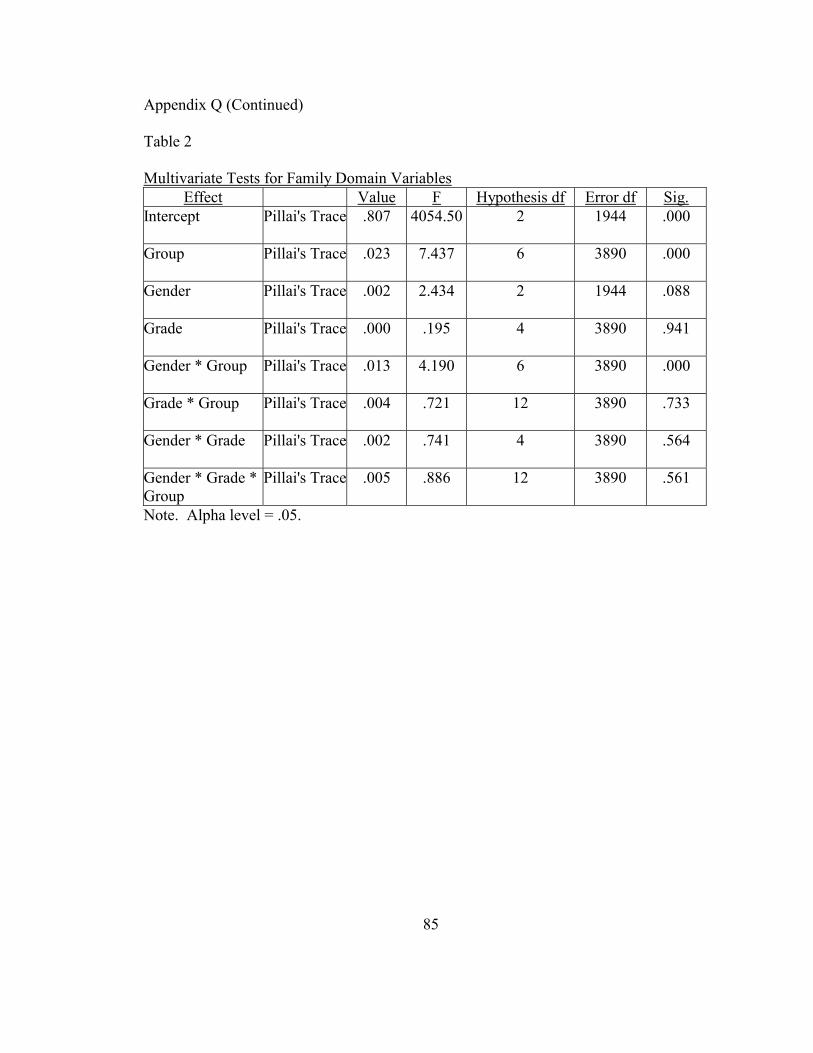
85
Appendix Q (Continued) Table 2 Multivariate Tests for Family Domain Variables
Effect Value F Hypothesis df Error df Sig. Intercept
Pillai's Trace .807 4054.50 2 1944 .000
Group
Pillai's Trace .023 7.437 6 3890 .000
Gender
Pillai's Trace .002 2.434 2 1944 .088
Grade
Pillai's Trace .000 .195 4 3890 .941
Gender * Group
Pillai's Trace .013 4.190 6 3890 .000
Grade * Group
Pillai's Trace .004 .721 12 3890 .733
Gender * Grade
Pillai's Trace .002 .741 4 3890 .564
Gender * Grade * Group
Pillai's Trace .005 .886 12 3890 .561
Note. Alpha level = .05.

86
Appendix Q (Continued) Table 3 Multivariate Tests for School Adjustment Variables
Effect Value F Hypothesis df Error df Sig. Intercept
Pillai's Trace .951 8310.94 5 2158 .000
Group
Pillai's Trace .115 17.234 15 6480 .000
Gender
Pillai's Trace .004 1.912 5 2158 .089
Grade
Pillai's Trace .007 1.516 10 4318 .127
Gender * Group
Pillai's Trace .015 2.103 15 6480 .008
Grade * Group
Pillai's Trace .015 1.061 30 10810 .376
Gender * Grade
Pillai's Trace .006 1.269 10 4318 .242
Gender * Grade * Group
Pillai's Trace .019 1.350 30 10810 .096
Note. Alpha level = .05.

87
Appendix Q (Continued) Table 4 Multivariate Tests of School Environment Variables
Effect Value F Hypothesis df Error df Sig. Intercept Pillai's Trace .937 6753.29
4 1805 .000
Group
Pillai's Trace .069 10.662 12 5421 .000
Gender
Pillai's Trace .007 3.190 4 1805 .013
Grade
Pillai's Trace .007 1.671 8 3612 .100
Group * Gender
Pillai's Trace .006 .965 12 5421 .481
Group * Grade
Pillai's Trace .020 1.531 24 7232 .047
Grade * Gender
Pillai's Trace .010 2.218 8 3612 .023
Group * Grade * Gender
Pillai's Trace .026 1.943 24 7232 .004
Note. Alpha level = .05.

88
Appendix Q (Continued) Table 5 Multivariate Tests for Achievement Variables
Effect Value F Hypothesis df Error df Sig. Intercept Pillai's Trace .934 15303.3
2 2177 .000
Group
Pillai's Trace .004 1.371 6 4356 .222
Gender
Pillai's Trace .003 2.730 2 2177 .065
Grade
Pillai's Trace .050 27.793 4 4356 .000
Gender * Group
Pillai's Trace .000 .158 6 4356 .987
Grade * Group
Pillai's Trace .007 1.233 12 4356 .253
Gender * Grade
Pillai's Trace .000 .222 4 4356 .926
Gender * Group * Grade
Pillai's Trace .004 .777 12 4356 .675
Note. Alpha level = .05.

89
Appendix Q (Continued) Table 6 Multivariate Tests for Teacher Report Variables
Effect Value F Hypothesis df Error df Sig. Intercept
Pillai's Trace .555 569.094 3 1368 .000
Group
Pillai's Trace .021 3.285 9 4110 .001
Gender
Pillai's Trace .004 1.918 3 1368 .125
Grade
Pillai's Trace .020 4.607 6 2738 .000
Group * Gender
Pillai's Trace .012 1.872 9 4110 .052
Group * Grade
Pillai's Trace .021 1.578 18 4110 .057
Gender * Grade
Pillai's Trace .003 .668 6 2738 .675
Group * Gender * Grade
Pillai's Trace .022 1.667 18 4110 .038
Note. Alpha level = .05.

90
Appendix Q (Continued) Table 7 Nested Analysis of Variance for Trait Anxiety
Source Numerator df Denominator df F Sig. Intercept
1 1734 4824.728 .000
Group (school)
33 1734 4.438 .000
Gender (school)
11 1734 2.077 .019
Grade
2 1734 .570 .566
Group * Gender (school)
23 1734 .604 .929
Group * Grade (school)
43 1734 1.040 .401
Grade * Gender (school)
21 1734 1.097 .343
Group * Gender * Grade (school)
24 1734 1.308 .145
Note. Alpha level = .05.

91
Appendix Q (Continued) Table 8 Nested Analysis of Variance for Depression
Source Numerator df Denominator df F Sig. Intercept 1 1936 1102.204 .000
Group (school)
33 1936 6.603 .000
Gender (school)
11 1936 1.766 .055
Grade
2 1936 1.718 .180
Group * Gender (school)
28 1936 1.442 .063
Group * Grade (school)
46 1936 1.404 .039
Grade * Gender (school)
21 1936 1.334 .142
Group * Grade * Gender (school)
26 1936 1.229 .197
Note. Alpha level = .05.

92
Appendix Q (Continued) Table 9 Nested Analysis of Variance for Trait Anger
Source Numerator df Denominator df F Sig. Intercept
1 2101 6860.031 .000
Group (school)
33 2101 4.984 .000
Gender (school)
11 2101 .249 .994
Grade
2 2101 1.355 .258
Group * Gender (school)
28 2101 .650 .920
Group * Grade (school)
51 2101 .823 .809
Grade * Gender (school)
21 2101 .944 .533
Group * Gender * Grade (school)
26 2101 .799 .753
Note. Alpha level = .05.

93
Appendix Q (Continued) Table 10 Nested Analysis of Variance for Anger Expression
Source Numerator df Denominator df F Sig. Intercept
1 2107 9940.040 .000
Group (school)
33 2107 3.257 .000
Gender (school)
11 2107 .692 .747
Grade
2 2107 2.823 .060
Group * Gender (school)
28 2107 .629 .934
Group * Grade (school)
50 2107 .894 .683
Grade * Gender (school)
21 2107 .882 .616
Group * Gender * Grade (school)
26 2107 1.328 .124
Note. Alpha level = .05.

94
Appendix Q (Continued) Table 11 Nested Analysis of Variance for Discipline Referrals
Source Numerator df Denominator df F Sig. Intercept
1 2134 314.220 .000
Group (school)
33 2134 2.245 .000
Gender (school)
11 2134 2.836 .001
Grade
2 2134 2.229 .108
Group * Gender (school)
28 2134 .924 .580
Group * Grade (school)
51 2134 1.019 .438
Grade * Gender (school)
21 2134 1.035 .416
Group * Gender * Grade (school)
26 2134 1.366 .103
Note. Alpha level = .05.

95
Appendix Q (Continued) Table 12 Nested Analysis of Variance for Cohesion
Source Numerator df Denominator df F Sig. Intercept
1 1864 7707.704 .000
Group (school)
43 1864 2.013 .000
Gender
1 1864 .560 .454
Grade
2 1864 2.733 .065
Group * Gender (school)
33 1864 1.437 .052
Group * Grade (school)
62 1864 1.205 .133
Grade * Gender
2 1864 1.725 .178
Group * Gender * Grade (school)
43 1864 .841 .759
Note. Alpha level = .05.

96
Appendix Q (Continued) Table 13 Nested Analysis of Variance for Adaptability
Source Numerator df Denominator df F Sig. Intercept
1 1777 4988.346 .000
Group(school)
43 1777 1.444 .032
Gender
1 1777 .767 .381
Grade
2 1777 .372 .690
Group * Gender (school)
33 1777 1.677 .010
Group * Grade (school)
62 1777 1.224 .115
Grade * Gender
2 1777 3.137 .044
Group * Gender * Grade (school)
43 1777 1.148 .237
Note. Alpha level = .05.

97
Appendix Q (Continued) Table 14 Nested Analysis of Variance for School Spirit
Source Numerator df Denominator df F Sig. Intercept
1 2026 5431.284 .000
Group(school)
43 2026 2.787 .000
Gender
1 2026 11.470 .001
Grade
2 2026 8.486 .000
Group * Gender (school)
38 2026 1.217 .171
Group * Grade (school)
68 2026 1.706 .000
Grade * Gender
2 2026 .461 .630
Group * Grade * Gender (school)
45 2026 .929 .607
Note. Alpha level = .05.

98
Appendix Q (Continued) Table 15 Nested Analysis of Variance for Goal-Orientation
Source Numerator df Denominator df F Sig. Intercept
1 1987 8292.502 .000
Group(school)
43 1987 2.368 .000
Gender
1 1987 10.121 .001
Grade
2 1987 6.765 .001
Group * Gender (school)
38 1987 1.535 .020
Group * Grade (school)
66 1987 2.185 .000
Grade * Gender
2 1987 1.617 .199
Group * Gender * Grade (school)
45 1987 .604 .983
Note. Alpha level = .05.

99
Appendix Q (Continued) Table 16 Nested Analysis of Variance for Child-Peer Relations
Source Numerator df Denominator df F Sig. Intercept 1 2051 12503.80
4 .000
Group(school)
43 2051 5.125 .000
Gender
1 2051 12.774 .000
Grade
2 2051 1.332 .264
Group * Gender (school)
38 2051 .992 .484
Group * Grade (school)
68 2051 1.329 .039
Grade * Gender
2 2051 .651 .522
Group * Gender * Grade (school)
45 2051 .905 .652
Note. Alpha level = .05.

100
Appendix Q (Continued) Table 17 Nested Analysis of Variance for Child-Teacher Relations
Source Numerator df Denominator df F Sig. Intercept
1 2046 7063.004 .000
Group (school)
43 2046 2.736 .000
Gender
1 2046 7.983 .005
Grade
2 2046 1.498 .224
Group * Gender (school)
38 2046 1.439 .041
Group * Grade (school)
68 2046 1.425 .014
Grade * Gender
2 2046 .825 .438
Group * Gender * Grade (school)
45 2046 1.010 .454
Note. Alpha level = .05.

101
Appendix Q (Continued) Table 18 Nested Analysis of Variance for Alienation
Source Numerator df Denominator df F Sig. Intercept
1 2050 4984.920 .000
Group(school)
43 2050 2.376 .000
Gender
1 2050 11.379 .001
Grade
2 2050 1.214 .297
Group * Gender (school)
38 2050 .779 .831
Group * Grade (school)
68 2050 1.046 .377
Grade * Gender
2 2050 1.677 .187
Group * Grade * Gender (school)
45 2050 1.135 .250
Note. Alpha level = .05.

102
Appendix Q (Continued) Table 19 Nested Analysis of Variance for Condition of Campus
Source Numerator df Denominator df F Sig. Intercept
1 1660 4923.446 .000
Group(school)
32 1660 1.662 .012
Gender(school)
11 1660 .816 .624
Grade
2 1660 1.018 .362
Group * Grade (school)
44 1660 1.761 .002
Group * Gender (school)
25 1660 1.246 .186
Gender * Grade (school)
21 1660 1.174 .264
Group * Grade * Gender (school)
23 1660 1.211 .224
Note. Alpha level = .05.

103
Appendix Q (Continued) Table 20 Nested Analysis of Variance for School Climate
Source Numerator df Denominator df F Sig. Intercept
1 1674 3378.845 .000
Group(school)
33 1674 3.079 .000
Gender(school)
11 1674 1.529 .115
Grade
2 1674 2.118 .121
Group * Grade (school)
44 1674 1.329 .074
Group * Gender (school)
25 1674 1.146 .281
Gender * Grade (school)
21 1674 .814 .705
Group * Grade * Gender (school)
24 1674 1.138 .292
Note. Alpha level = .05.
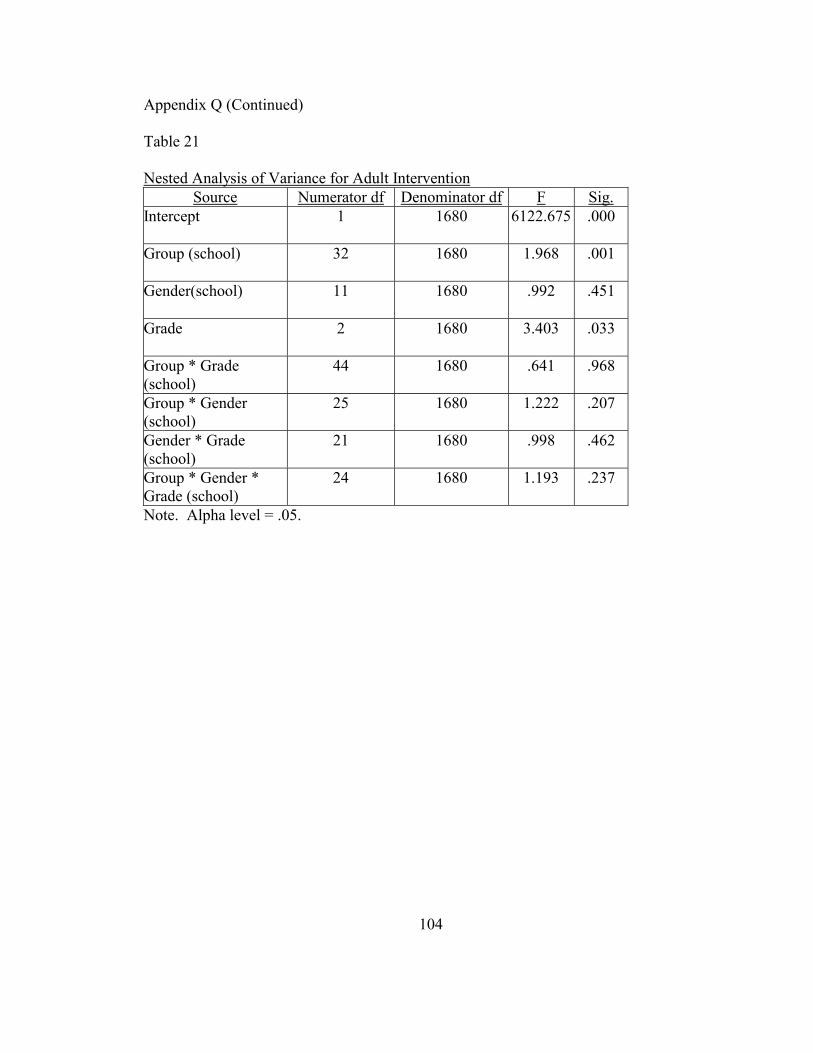
104
Appendix Q (Continued) Table 21 Nested Analysis of Variance for Adult Intervention
Source Numerator df Denominator df F Sig. Intercept
1 1680 6122.675 .000
Group (school)
32 1680 1.968 .001
Gender(school)
11 1680 .992 .451
Grade
2 1680 3.403 .033
Group * Grade (school)
44 1680 .641 .968
Group * Gender (school)
25 1680 1.222 .207
Gender * Grade (school)
21 1680 .998 .462
Group * Gender * Grade (school)
24 1680 1.193 .237
Note. Alpha level = .05.

105
Appendix Q (Continued) Table 22 Nested Analysis of Variance for Adult Supervision
Source Numerator df Denominator df F Sig. Intercept
1 2054 11530.19 .000
Group(school)
33 2054 1.747 .005
Gender(school)
11 2054 2.552 .003
Grade
2 2054 3.819 .022
Group * Grade (school)
50 2054 1.433 .026
Group * Gender (school)
28 2054 1.154 .264
Gender * Grade (school)
21 2054 .958 .514
Group * Grade * Gender (school)
25 2054 .921 .576
Note. Alpha level = .05.

106
Appendix Q (Continued) Table 23 Nested Analysis of Variance for FCAT Developmental Reading Scale Scores
Source Numerator df Denominator df F Sig. Intercept
1 2005 12672.511 .000
Group
3 2005 1.064 .363
Gender
1 2005 1.965 .161
Grade(school)
31 2005 4.875 .000
Group * Grade (school)
83 2005 1.293 .041
Group * Gender
3 2005 .562 .640
Gender * Grade (school)
31 2005 .808 .765
Group * Gender * Grade (school)
51 2005 .957 .560
Note. Alpha level = .05.

107
Appendix Q (Continued) Table 24 Nested Analysis of Variance for FCAT Developmental Math Scale Scores
Source Numerator df Denominator df F Sig. Intercept
1 2005 24141.245 .000
Group
3 2005 2.382 .068
Gender
1 2005 .036 .849
Grade(school)
31 2005 5.856 .000
Group * Grade (school)
83 2005 .903 .721
Group * Gender
3 2005 .504 .679
Gender * Grade (school)
31 2005 .799 .777
Group * Gender * Grade (school)
50 2005 1.050 .379
Note. Alpha level = .05.

108
Appendix Q (Continued) Table 25 Nested Analysis of Variance for Acting-Out
Source Numerator df Denominator df F Sig. Intercept
1 1220 1505.511 .000
Group(school)
33 1220 1.823 .003
Grade(school)
21 1220 2.136 .002
Gender
1 1220 20.044 .000
Group * Gender (school)
23 1220 1.194 .240
Group * Grade (school)
40 1220 1.038 .408
Gender * Grade (school)
20 1220 1.355 .135
Group * Grade * Gender (school)
11 1220 2.716 .002
Note. Alpha level = .05.

109
Appendix Q (Continued) Table 26 Nested Analysis of Variance for Moodiness
Source Numerator df Denominator df F Sig. Intercept
1 1220 1725.853 .000
Group (school)
33 1220 2.381 .000
Grade(school)
21 1220 2.899 .000
Gender(school)
1 1220 5.879 .015
Group * Gender (school)
23 1220 1.778 .013
Group * Grade (school)
40 1220 1.107 .299
Gender * Grade (school)
20 1220 1.319 .156
Group * Grade * Gender (school)
11 1220 1.574 .101
Note. Alpha level = .05.

110
Appendix Q (Continued) Table 27 Nested Analysis of Variance for Learning
Source Numerator df Denominator df F Sig. Intercept
1 1220 1446.454 .000
Group (school)
33 1220 .942 .563
Grade(school)
21 1220 2.808 .000
Gender
1 1220 7.882 .005
Group * Gender (school)
23 1220 .791 .746
Group * Grade (school)
40 1220 1.099 .312
Gender * Grade (school)
20 1220 1.371 .127
Group * Grade * Gender (school)
11 1220 2.311 .008
Note. Alpha level = .05.

111
Appendix R
Discriminant Function Analysis Matrices Table 28 Standardized Canonical Discriminant Function Coefficients for Total Sample
Function Scale 1 2 3
Condition of Campus .216 -.148 -.693 Adult Supervision at School
-.166 .043 -.519
Adult Intervention -.253 -.005 .019 School Climate .168 .008 -.217 Trait Anger .169 .202 -.150 Anger Expression .165 .572 .096 Depression .255 -.304 .174 Anxiety .304 -.165 .018 Discipline Referrals .166 .239 .197 School Spirit -.197 .044 .234 Child-Teacher Relations .175 -.172 .488 Goal-Orientation .031 -.085 .052 Alienation -.035 .057 .264 Child-Peer Relations -.294 .622 .021 Cohesion .071 -.232 .097 Adaptability -.004 .066 .407 Acting-Out .123 .037 .137 Moodiness .030 .147 -.066 Learning -.008 -.151 -.099 FCAT Reading Developmental Scaled Score
.201 .048 .051
FCAT Math Developmental Scaled Score
-.015 -.102 -.332

112
Appendix R (Continued) Table 29 Structure Matrix for Total Sample Discriminant Function Analysis
Function Scale 1 2 3 Depression .668* -.200 .037 Trait Anger .632* .170 -.047 Anxiety .614* -.228 .028 Child-Peer Relations -.540* .437 .045 School Climate .499* .192 .002 School Spirit -.469* -.234 .212 Adult Intervention -.459* -.143 -.060 Cohesion -.387* -.207 .268 Adult Supervision at School
-.386* -.071 -.286
Alienation .359* .069 .128 Child-Teacher Relations -.353* -.233 .298 Moodiness .273* .233 -.034 Anger Expression .429 .634* -.044 Discipline Referrals .273 .372* .186 Acting-Out .310 .321* .028 Goal-Orientation -.262 -.263* .162 Learning Scale .182 .193* .032 Condition of Campus -.205 -.153 -.410 Adaptability -.288 -.077 .410 FCAT Math Developmental Scaled Score
-.012 -.101 -.288
FCAT Reading Developmental Scaled Score
.067 -.103 -.149

113
Appendix R (Continued) Table 30 Standardized Canonical Discriminant Function Coefficients for Males
Function Scale 1 2 3 Condition of Campus -.249 .196 -.580 Adult Supervision at School
.253 .104 -.272
Adult Intervention .352 -.100 -.074 School Climate -.009 .137 -.069 Trait Anger .009 .250 .050 Anger Expression .175 .439 .315 Depression -.364 -.107 -.118 Anxiety -.439 -.045 -.072 Discipline Referrals .118 .540 -.130 School Spirit .228 -.211 .337 Child-Teacher Relations -.154 .017 .107 SAS Goal-Orientation Scale
-.099 -.144 .500
Alienation .013 .060 .028 Child-Peer Relations .433 .099 -.053 Cohesion -.078 -.049 -.277 Adaptability .005 .161 .454 AML-R Acting-Out .039 .107 -.270 AML-R Moodiness -.036 .412 .553 AML-R Learning .052 -.464 -.084 FCAT Reading Developmental Scaled Score
-.040 .146 .210
FCAT Math Developmental Scaled Score
.077 -.113 -.513

114
Appendix R (Continued) Table 31 Structure Matrix for Male Discriminant Function Analysis
Function Scale 1 2 3
Depression -.666* .130 -.055 Child-Peer Relations -.665* .094 .024 Anxiety .629* -.024 .032 Child-Teacher Relations .397* -.224 -.138 Adult Supervision at School
.305* -.102 -.161
School Spirit -.263* .176 .132 Goal-Orientation .054 .629* -.055 Cohesion -.011 .579* .102 Adaptability .024 .461* .016 Adult Intervention -.050 .416* .271 Condition of Campus -.365 .383* .136 FCAT Math Developmental Scaled Score
.284 -.368* .303
FCAT Reading Developmental Scaled Score
-.210 .358* .054
Trait Anger .223 -.305* .232 Moodiness .214 -.235* .095 Anger Expression .001 .168* .140 Discipline Referrals .082 -.298 .379 School Climate .152 -.040 -.343 Acting-Out .045 -.069 -.326 Alienation .200 -.088 .276 Learning -.025 .029 -.088

115
Appendix R (Continued) Table 32 Standardized Canonical Discriminant Function Coefficients for Females
Function Scale 1 2 3
Condition of Campus -.026 .288 -.383 Adult Supervision at School
-.154 .107 -.366
Adult Intervention -.219 .106 .176 School Climate .112 .253 -.080 Trait Anger .147 .003 -.200 Anger Expression .445 -.168 -.109 Depression .109 .401 .155 Anxiety .186 .186 .020 Discipline Referrals .124 -.005 .543 School Spirit .027 .019 -.013 Child-Teacher Relations .039 .166 .452 Goal-Orientation -.192 .209 -.180 Alienation -.128 .000 .219 Child-Peer Relations .149 -.663 -.135 Cohesion -.129 .204 .231 Adaptability -.022 -.033 .322 AML-R Acting-Out .377 .076 .529 AML-R Moodiness -.332 .191 -.491 AML-R Learning Scale .139 -.053 -.253 FCAT Reading Developmental Scaled Score
.146 .408 -.049
FCAT Math Developmental Scaled Score
.010 -.001 -.080

116
Appendix R (Continued) Table 33 Structure Matrix for Female Discriminant Function Analysis
Function Scale 1 2 3
Anger Expression .716* -.190 -.133 Cohesion .621* .274 -.179 School Spirit -.525* -.028 .389 Goal-Orientation .518* .496 -.031 Trait Anger -.518* .080 .032 Adaptability .516* .181 -.004 Acting-Out -.490* .063 .141 Alienation -.457* .199 -.064 Adult Intervention -.416* .044 -.193 Adult Supervision at School
-.408* .100 .240
Child-Teacher Relations .390* .136 .164 Learning -.336* .113 -.132 Condition of Campus .325* .085 .051 Depression .269* -.006 -.078 Anxiety .228* .191 -.134 Child-Peer Relations -.165 -.551* -.005 School Climate .466 .470* -.087 Discipline Referrals -.028 .298* -.081 Moodiness -.056 .173* -.102 FCAT Math Developmental Scaled Score
.306 -.040 .515
FCAT Reading Developmental Scaled Score
-.360 -.047 .388

117
Appendix R (Continued) Table 34 Standardized Canonical Discriminant Function Coefficients for 6th Graders
Function Scale 1 2 3
Condition of Campus .128 .100 .726 Adult Supervision at School
-.142 .152 .098
Adult Intervention -.395 -.023 -.057 School Climate .157 .352 -.095 Trait Anger .271 .028 -.007 Anger Expression -.124 .388 -.369 Depression .616 -.418 -.031 Anxiety .007 .028 .262 Discipline Referrals .001 .185 -.306 School Spirit -.295 -.113 .055 Child-Teacher Relations .463 -.562 -.459 Goal-Orientation .097 .136 .002 Alienation -.313 -.344 .112 Child-Peer Relations -.372 -.089 -.319 Cohesion -.057 .199 .170 Adaptability .156 -.146 -.135 AML-R Acting-Out .145 .402 .366 AML-R Moodiness -.099 -.703 -.526 AML-R Learning .138 .411 .457 FCAT Reading Developmental Scaled Score
.134 .223 .086
FCAT Math Developmental Scaled Score
-.098 -.146 .325

118
Appendix R (Continued) Table 35 Structure Matrix for 6th Grade Discriminant Function Analysis
Function Scale 1 2 3
Depression .727* -.154 .012 Anxiety .571* .204 .005 Cohesion -.503* -.019 -.233 Condition of Campus .478* -.091 .099 FCAT Reading Developmental Scaled Score
-.447* -.243 .139
Adult Intervention .418* .345 -.245 Goal-Orientation -.276* -.050 .099 Child-Peer Relations -.276* -.185 .112 Child-Teacher Relations .219* .007 .072 Moodiness -.169* -.089 -.004 Adult Supervision at School
-.143 -.542* -.125
Anger Expression .194 .491* -.285 Acting-Out -.332 -.411* .056 Trait Anger .179 .400* -.046 Alienation .152 .302* -.038 School Climate -.083 -.195* .114 Learning -.279 -.193 .504 FCAT Math Developmental Scaled Score
.101 .321 -.375
Adaptability -.074 -.090 .339 School Spirit .001 -.026 .232 Discipline Referrals .138 .022 -.200

119
Appendix R (Continued) Table 36 Standardized Canonical Discriminant Function Coefficients for 7th Graders
Function Scale 1 2 3
Condition of Campus .205 -.001 -.080 Adult Supervision at School
-.130 -.011 -.371
Adult Intervention -.199 -.016 .225 School Climate .122 .077 -.376 Trait Anger .037 .364 -.224 Anger Expression .151 .457 .324 Depression -.171 -.320 .152 Anxiety .757 -.073 .074 Discipline Referrals .134 .200 .491 School Spirit -.234 .069 .496 Child-Teacher Relations .134 -.281 .040 Goal-Orientation -.030 .082 .324 Alienation .077 .036 .368 Child-Peer Relations -.296 .693 -.092 Cohesion .105 -.446 .020 Adaptability -.127 .086 .355 AML-R Acting-Out .282 .035 .281 AML-R Moodiness .166 -.123 .015 AML-R Learning -.194 -.007 -.129 FCAT Reading Developmental Scaled Score
.186 .068 -.086
FCAT Math Developmental Scaled Score
.081 -.351 -.068

120
Appendix R (Continued) Table 37 Structure Matrix for 7th Grade Discriminant Function Analysis
Function Scale 1 2 3 Anxiety .682* -.093 .055 Child-Peer Relations -.499* .411 .045 Depression .474* -.044 -.063 Trait Anger .472* .302 -.001 Adult Intervention -.390* -.138 .350 Adult Supervision at School
-.320* -.073 .009
Alienation .318* .063 .116 AML-R Moodiness .286* .181 .147 AML-R Acting-Out .266* .250 .228 Anger Expression .329 .546* .088 Cohesion -.322 -.357* .313 FCAT Math Developmental Scaled Score
.041 -.323* -.113
FCAT Reading Developmental Scaled Score
.094 -.250* -.128
AML-R Learning .138 .242* .105 School Spirit -.364 -.203 .458 Discipline Referrals .262 .318 .401 Adaptability -.304 -.172 .387 Child-Teacher Relations -.313 -.178 .386 School Climate .338 .244 -.348 Goal-Orientation -.240 -.181 .291 Condition of Campus -.205 -.086 .213

121
Appendix R (Continued) Table 38 Standardized Canonical Discriminant Function Coefficients for 8th Graders
Function Scale 1 2 3 Condition of Campus .205 .190 -.366 Adult Supervision at School
-.135 -.097 -.570
Adult Intervention -.186 .055 -.154 School Climate .027 .216 -.004 Trait Anger .243 -.047 -.086 Anger Expression .604 -.220 -.040 Depression .215 .436 .231 Anxiety -.136 .174 -.138 Discipline Referrals .235 -.182 -.328 School Spirit .089 .023 .028 Child-Teacher Relations .075 -.273 .266 Goal-Orientation -.277 .473 -.017 Alienation .108 -.148 .464 Child-Peer Relations .232 -.562 .190 Cohesion -.134 -.036 .144 Adaptability .098 -.129 .372 AML-R Acting-Out .023 -.096 .248 AML-R Moodiness .416 .041 -.352 AML-R Learning -.390 .136 .207 FCAT Reading Developmental Scaled Score
.138 .163 .357
FCAT Math Developmental Scaled Score
.034 -.085 -.001

122
Appendix R (Continued) Table 39 Structure Matrix for 8th Grade Discriminant Function Analysis
Function Scale 1 2 3
Child-Peer Relations .744* -.103 -.091 Depression .517* .360 .015 School Climate -.422* .081 -.084 Adult Supervision at School
-.385* -.349 .192
School Spirit -.370* -.209 -.197 Anxiety .360* -.128 -.187 Child-Teacher Relations .358* .141 .344 Cohesion .353* -.018 -.023 Adaptability .340* .317 .224 Learning .331* .086 -.190 Anger Expression -.319* -.220 -.164 Alienation .127* .040 -.033 Goal-Orientation .417 .642* .040 Trait Anger -.149 -.628* -.028 Adult Intervention .240 .558* -.084 FCAT Math Developmental Scaled Score
-.264 -.241 -.515
Condition of Campus -.021 -.001 -.383 Moodiness -.169 -.292 .361 Discipline Referrals -.247 -.150 -.339 Acting-Out .018 .167 .302 FCAT Reading Developmental Scaled Score
-.045 .046 .161

123
Appendix S Table 40 Multivariate, Univariate, and Post Hoc Study Findings by Domain and Hypothesis
Note. Shaded areas indicate significant findings. T = Total sample, M = Males, F = Females, 6 = 6th Graders, 7 = 7th Graders, 8 = 8th Graders.
Hypothesis 5: Distinct Variable Associations
Domain Hypothesis 1: Group Main Effect
Hypothesis 2: Group x Gender Interaction
Hypothesis 3: Group x Grade Interaction
Hypothesis 4: Group x Gender x Grade Interaction
T M F 6 7 8Individual Domain
Depression Anxiety Anger Anger Expression Referrals Family Domain Cohesion Adaptability School Domain School Adjustment
School Spirit Goal-Orientation Child-Peer Relations
Child-Teacher Relations
Alienation School Environment
Condition of Campus
School Climate Adult Intervention
Adult Supervision Achievement FCAT Reading FCAT Math Teacher Report Domain
Acting-Out Moodiness Learning

124
Appendix T Table 41 Number (and Percentage) of Categorized Students per School School N Sampled
(%) Bullies N (%)
Victims N (%)
Bully/Victims N (%)
Control N (%)
1 260 (10.4) 24 (14.6) 34 (11.5) 5 (11.4) 197 (9.8) 2 166 (6.6) 7 (4.3) 19 (6.4) 3 (6.8) 137 (16.7) 3 191 (7.6) 7 (4.3) 24 (8.1) 2 (4.5) 158 (7.9) 4 266 (10.6) 23 (14.0) 33 (11.2) 8 (18.2) 202 (10.1) 5 206 (8.2) 17 (10.4) 23 (7.8) 2 (4.5) 164 (8.2) 6 164 (6.5) 6 (3.7) 16 (5.4) 3 (6.8) 138 (6.9) 7 228 (9.1) 10 (6.1) 27 (9.2) 5 (11.4) 186 (9.3) 8 196 (7.8) 17 (10.4) 19 (6.4) 1 (2.3) 159 (7.9) 9 216 (8.6) 16 (9.8) 25 (8.5) 6 (13.6) 169 (8.4) 10 283 (11.3) 23 (14.0) 33 (11.2) 3 (6.8) 224 (11.2) 11 334 (13.3) 14 (8.5) 42 (14.2) 6 (13.6) 272 (13.6) Total 2509 (100) 164 (100) 295 (100) 44 (100) 2006 (100)