Embed Size (px)
Citation preview

Full Terms & Conditions of access and use can be found athttp://www.tandfonline.com/action/journalInformation?journalCode=ueqe20
Download by: [EPFL Bibliothèque] Date: 24 November 2015, At: 14:46
Journal of Earthquake Engineering
ISSN: 1363-2469 (Print) 1559-808X (Online) Journal homepage: http://www.tandfonline.com/loi/ueqe20
Modelling the seismic response of modern URMbuildings retrofitted by adding RC walls
Alessandro Paparo & Katrin Beyer
To cite this article: Alessandro Paparo & Katrin Beyer (2015): Modelling the seismic responseof modern URM buildings retrofitted by adding RC walls, Journal of Earthquake Engineering,DOI: 10.1080/13632469.2015.1091798
To link to this article: http://dx.doi.org/10.1080/13632469.2015.1091798
Accepted author version posted online: 24Nov 2015.
Submit your article to this journal
View related articles
View Crossmark data

Accep
ted M
anus
cript
1
Modelling the seismic response of modern URM buildings retrofitted by adding RC walls Alessandro Paparo a), Katrin Beyer b)*
a) Earthquake Engineering and Structural Dynamics Laboratory (EESD), School of Architecture, Civil and Environmental Engineering (ENAC), École Polytechnique Fédérale de Lausanne (EPFL), Switzerland. EPFL ENAC IIC EESD, GC B2 515, Station 18, CH – 1015 Lausanne Tel: +41 21 6936321 [email protected]
b) Earthquake Engineering and Structural Dynamics Laboratory (EESD), School of Architecture, Civil and Environmental Engineering (ENAC), École Polytechnique Fédérale de Lausanne (EPFL), Switzerland. EPFL ENAC IIC EESD, GC B2 504, Station 18, CH – 1015 Lausanne Tel: +41 21 6936234 Tel: +41 21 6935706 [email protected]
* Corresponding author
Abstract
Modern unreinforced masonry buildings with reinforced concrete slabs are often retrofitted by
inserting reinforced concrete walls. The main advantages of this technique are the increase in
strength and displacement capacity with respect to masonry structures. The paper presents two
modelling approaches for evaluating such structures: a shell-element model and a macro-element
one. The objective is to formulate practical recommendations for setting up a macro-element
model using as input the geometry of the structure and results from standard material tests.
Structural configurations of masonry buildings, in which the insertion of reinforced concrete
walls is an efficient retrofit technique, are also investigated.
Keywords Seismic behaviour Modern mixed masonry and reinforced concrete wall structures
Non-linear analyses Shell-element model Macro-element model Equivalent frame
Dow
nloa
ded
by [
EPF
L B
iblio
thèq
ue]
at 1
4:46
24
Nov
embe
r 20
15
Accep
ted M
anus
cript
2
1. Introduction
In recent years, the seismic hazard in several countries of Europe was re-evaluated, leading, in
particular for countries of low to moderate seismicity to an increase of the seismic design
spectra. As a result, many modern residential unreinforced masonry (URM) buildings no longer
fulfil the seismic design check for the new spectra and have to be retrofitted. Adding RC walls to
the existing structure or replacing selected URM walls with RC ones can be an effective retrofit
strategy if RC slabs allow a redistribution of the forces. This retrofit approach might not only
increase the strength but also modify the global deformed shape of the structure, leading to an
increase in the system’s displacement capacity. For new constructions, it is pertinent to conceive
similar structures directly as mixed RC-URM systems because they show an improved seismic
behaviour when compared to buildings with URM walls only. In addition, when compared to
buildings with RC walls only, such mixed structures have better thermal and insulation
properties at a lower construction cost.
Mixed RC-URM construction varies significantly from region to region [Magenes, 2006; Cattari
and Lagomarsino, 2013]. In this paper, the examination is limited to the most common building
configurations of modern mixed RC-URM systems built in Switzerland. Such configurations are
characterised by the following features:
i) The RC-URM systems are modern buildings of three to five storeys with masses evenly
distributed over the height. Both masonry and concrete walls are continuous over the height and
Dow
nloa
ded
by [
EPF
L B
iblio
thèq
ue]
at 1
4:46
24
Nov
embe
r 20
15
Accep
ted M
anus
cript
3
connected at each floor by 20 to 30 cm thick RC slabs which provide an efficient rigid
diaphragm.
ii) The length of the RC walls varies between 2 and 5 m and their aspect ratio is between 1.5 and
3. The RC walls are 20 to 30 cm thick and designed according to modern codes to develop a
stable flexural behaviour with displacement capacities larger than those of URM walls. The
mean concrete cylinder compressive strength at 28 days is between 20 and 50 MPa and the
reinforcement bars have mean yield strengths between 500 and 600 MPa. The total longitudinal
reinforcement ratio of the RC walls varies between 0.2% and 4.0% [EN 1992-1, 2004]. In the RC
slabs the longitudinal reinforcement ratio varies between 0.13% and 4.0% [EN 1992-1, 2004].
iii) The URM walls have typically lengths up to 7 m and aspect ratios between 0.5 and 3. The
URM walls, which always outnumber the RC ones, are built with hollow clay 20 to 30 cm thick
bricks in combination with standard cement mortar. URM walls are characterised by mean
masonry compressive strengths (fcM) between 4 and 8 MPa and axial stress ratios (σ0/fcM)
between 0.05 and 0.25. Since in such structures the URM walls are connected by RC slabs which
introduce an important framing effect [Lang, 2002], the URM walls generally exhibit a dominant
shear behaviour.
Despite the popularity of this construction and retrofitting technique, very little research has been
carried out [Magenes, 2006] and there are several open issues to be addressed:
i) Response of mixed RC-URM wall structures: Vertical and horizontal forces are resisted by the
combined contribution of the existing URM walls and the new RC walls. Hence the retrofitted
Dow
nloa
ded
by [
EPF
L B
iblio
thèq
ue]
at 1
4:46
24
Nov
embe
r 20
15

Accep
ted M
anus
cript
4
structure will behave differently from the uncoupled systems since each type of wall results in a
different displaced shape when subjected to horizontal forces (Fig. 1).
ii) Lack of experimental data: There are only few experimental tests on mixed RC-URM
structural buildings. Tomaževič et al. [1990] conducted a shake table test on a URM wall
building with one RC column. However, the latter had no influence on the behaviour of the
structure under lateral loads since the URM walls were considerably stiffer. Jurukovsky et al.
[1992] conducted shake table tests of 1/3-scale models. They investigated several strengthening
techniques for a mixed structure composed of URM walls and one RC frame at the ground floor.
In one case they added a central RC core wall to the URM building and they tested this
retrofitted solution up to the near collapse limit state, but the presence of the RC frame at the
ground floor added a vertical irregularity. Hence, none of the experimental studies addressed the
seismic behaviour of mixed structures where RC and URM walls are regular and continuous over
the height.
iii) Numerical modelling: Numerical results on RC-URM wall structures are sensitive to
mechanical and geometrical assumptions [Casoli, 2007; Paparo and Beyer, 2012] but models
could not be validated as experimental results of such mixed structures were missing. For these
buildings, the parameters which most influence the distribution of reaction forces among the
walls are those defining the strength and stiffness of the elements.
iv) Scarce numerical investigations: Recently non-linear numerical investigations [Cattari and
Lagomarsino, 2013] studied the interaction of RC and URM walls. They simulated the response
of buildings where the RC walls were not capacity-designed and failed before the URM walls.
Dow
nloa
ded
by [
EPF
L B
iblio
thèq
ue]
at 1
4:46
24
Nov
embe
r 20
15

Accep
ted M
anus
cript
5
The study presented herein targets structures where the RC members are designed to fail for
larger displacement demands than the URM walls.
In order to address the aforementioned issues, a research programme was initiated at EPFL with
the objective to understand better the seismic behaviour of mixed RC-URM wall structures. Both
experimental (Fig. 2 and 3) and numerical investigations were carried out. The objective of this
paper is to provide some indications for the modelling and analysis of structures with both RC
and URM walls. Two modelling approaches will be investigated: a shell-element model and a
macro-element approach; the latter is commonly used in engineering practice for analysing such
structures. Sec. 2 will present the main characteristics of the seismic behaviour of mixed RC-
URM wall structures and will outline advantages and drawbacks of coupling URM walls with
RC walls. In Sec. 3 the two modelling approaches will be presented and validated against
experimental results. The paper concludes with the discussion of four case studies (Sec. 4),
outlining for which structural configurations of URM buildings adding RC walls can be an
efficient retrofit measure.
2. Seismic behaviour of interacting URM and RC
walls
Retrofitting a modern URM building by replacing some URM walls with RC ones does not only
increase the strength of the structure, but can also improve the system’s displacement capacity.
The section describes qualitatively the interaction of URM and RC walls connected by RC slabs
Dow
nloa
ded
by [
EPF
L B
iblio
thèq
ue]
at 1
4:46
24
Nov
embe
r 20
15

Accep
ted M
anus
cript
6
when subjected to lateral forces (Sec. 2.1) and outlines the resulting advantages and
disadvantages of this retrofit technique (Sec. 2.2).
2.1. Deformation pattern of mixed RC-URM wall structures
subjected to lateral loading
URM walls have a dominant flexural or shear response depending on several parameters such as
the axial load ratio, the pier geometry and the coupling moment introduced by RC slabs or
masonry spandrels. RC walls are designed to have a dominant flexural behaviour and a
displacement capacity larger than that of URM walls. The RC slabs are assumed to provide a
rigid diaphragm action, allowing an effective force redistribution between walls of one plane.
Under lateral loading, uncoupled URM walls which deform primarily in shear lead to larger
inter-storey drifts at the bottom storeys (Fig. 1a). Single slender RC walls display instead
primarily flexural deformations, with larger inter-storey drifts at top storeys (Fig. 1b). At the
height of the RC slabs, URM and RC walls need to displace by the same amount because of the
rigid diaphragm action provided by the RC slabs. Hence, the deformed shape of mixed RC-URM
wall structures lies in between that of buildings with RC and URM walls alone (Fig. 1c). As a
consequence, for such mixed structures the damage in the URM walls is not concentrated in the
first storey—as for URM buildings—but it also spreads to the storeys above. This behaviour was
noted in quasi-static and dynamic tests on mixed RC-URM wall structures (Fig. 2 and 3) and
also Jurukovsky et al. [1992] observed that the presence of the pin-based RC wall “distributed
the failure mechanism all over the structure”.
Dow
nloa
ded
by [
EPF
L B
iblio
thèq
ue]
at 1
4:46
24
Nov
embe
r 20
15

Accep
ted M
anus
cript
7
Mixed RC-URM wall structures present similarities to dual RC frame-wall buildings. Slender
wall elements, which display mainly flexural deformations, are coupled to frames, which
globally deform—as do most URM piers—in a predominant shear mode [Smith and Coull,
1991]. As a consequence, and similar to mixed RC-URM wall structures, the deformed shape of
dual RC frame-wall buildings is modified and tends to be rather linear over the height of the
structure [Paulay and Priestley, 1992].
If the masonry walls have a dominant flexural response, in the URM walls the inter-storey drift
profile is rather constant over the height and the modification of the deformed shape is less
accentuated. For modern URM buildings with RC slabs such a behaviour is, however,
uncommon since the RC slabs connecting the walls feature a significant out-of-plane stiffness
and strength and introduce therefore an important framing effect which leads to a more shear
critical behaviour of the URM walls [Lang, 2002].
2.2. Advantages and drawbacks of adding RC walls in URM wall
buildings
Fig. 4 compares failure mechanisms of a mixed RC-URM structure versus that of a URM
building where shear deformations prevail. The presence of the RC wall in the retrofitted
configuration leads, for the same level of inter-storey drift δ* at the ground floor, to larger top
displacements: Δmixed > ΔURM. Consequently, the displacement capacity of mixed RC-URM wall
structures is larger than that developed by shear dominated URM wall buildings. Furthermore, in
Dow
nloa
ded
by [
EPF
L B
iblio
thèq
ue]
at 1
4:46
24
Nov
embe
r 20
15
Accep
ted M
anus
cript
8
retrofit design, the URM walls with the smallest displacement capacity can be replaced by RC
walls.
In addition, in such mixed systems, the strength degradation of shear dominated URM walls
generally starts at drifts of around 0.3%-0.5%. At these drift levels, RC walls that are designed to
develop a stable flexural behaviour are still in the pre-peak response. As a consequence, in mixed
RC-URM wall structures the strength degradation of the URM walls can be somewhat
compensated by the presence of the RC walls.
A drawback of the strategy is the increase in seismic mass related to the addition of RC walls to
the structure. However, since large parts of the dead loads result from the weight of the RC slabs
and the added RC walls in the retrofitted systems are usually few, the increase in total weight is,
generally, less than 5%.
3. Numerical analysis of modern RC-URM wall
buildings with RC slabs
Several modelling approaches are used for evaluating the seismic behaviour of mixed RC-URM
wall structures, ranging from sophisticated strategies (shell-models) to more simplified
approaches (macro-models). Although computer power increases continuously, it seems unlikely
that shell-models will become a standard tool for the practically oriented analyses, as they
require too much computational time.
Dow
nloa
ded
by [
EPF
L B
iblio
thèq
ue]
at 1
4:46
24
Nov
embe
r 20
15

Accep
ted M
anus
cript
9
Previous studies [Casoli, 2007; Paparo and Beyer, 2012] have also shown that numerical
investigations using macro-models are sensitive to some modelling assumptions, such as the
assumed effective stiffness of the members or the effective length of the coupling RC beams. In
this paper, to validate two modelling approaches, a two-step validation procedure is used: (i)
first, a detailed shell-model is assessed against the results from quasi-static cyclic tests. This
model is then used to study additional parameters. (ii) The results of the macro-model are then
compared and recommendations for the analysis of such mixed structures formulated. Before the
presentation and comparison of the two modelling approaches, a brief overview of two quasi-
static tests on two mixed RC-URM wall structures is outlined.
3.1. EPFL tests
Two mixed RC-URM substructures were tested under a quasi-static cyclic loading regime at the
structural engineering laboratory at EPFL. Each of the two specimens comprised a two-storey
RC wall coupled to a two-storey URM wall through two RC beams. The RC beams connecting
the two walls represented the slabs in the reference structure.
The main difference between the two systems was the axial load applied at the top of the URM
walls. For the first specimen (TU1), an axial load of 400 kN was applied and led to a shear
dominant behaviour of the masonry. For the second test (TU2) the axial load was reduced to
200 kN in order to achieve a prevalent rocking behaviour. Fig. 2 shows the crack pattern of the
two specimens after failure. In Sec. 3.4, the global force-displacement characteristics, as well as
the inter-storey drift profile, will be introduced and compared with the analysis results. For
further details on the EPFL tests, the reader is referred to Paparo and Beyer [2014].
Dow
nloa
ded
by [
EPF
L B
iblio
thèq
ue]
at 1
4:46
24
Nov
embe
r 20
15
Accep
ted M
anus
cript
10
3.2. Shell-element model
In the shell-element model, (i) URM walls are simulated by using the simplified micro-
modelling approach [Lourenço, 1996] and (ii) RC walls and beams are represented by shell
elements for the concrete, shell elements for the transverse reinforcements and trusses for the
longitudinal reinforcements. The simulations are carried out using the software ATENA
[Červenka et al., 2010]. The mechanical properties, summarised in Table 1, were obtained from
standard material tests, Paparo and Beyer [2014]. In the following, a description of the adopted
mechanical properties is provided.
i) URM walls: Shell elements to which the SBETA constitutive model [Červenka et al., 2008] is
assigned are used to simulate the bricks as elastic in compression. Their tensile strength ftb
instead is limited to 1.4 MPa and the fracture energy GIb is set equal to 0.08 N/mm [Lourenço,
1996]. The mortar joints are modelled by zero-thickness contact interfaces with a Mohr-
Coulomb failure criterion. The interface friction μ and cohesion c between mortar and bricks
were obtained from standard triplet tests [EN 1052-3, 2002]. The interface tensile strength ftm is
calculated by considering a parabolic tension cut off:
µ2cftm = (3.1)
The constitutive law assigned to the interfaces does not account for compression failure. As a
consequence, the crushing of the masonry is not represented by the shell element model and,
Dow
nloa
ded
by [
EPF
L B
iblio
thèq
ue]
at 1
4:46
24
Nov
embe
r 20
15
Accep
ted M
anus
cript
11
therefore, the failure of the masonry cannot be fully captured. Thus, the shell element model is
used to investigate the behaviour before failure, i.e. the shear-flexure interaction which develops
between the RC and URM walls (Sec. 2.1) and the effective length of the RC beams.
As the software can only account for isotropic material behaviour, an equivalent E-modulus of
the bricks, which lies in between the E-modulus of the bricks for loading parallel (Ebx) and
orthogonal (Eby) to the perforations, is adopted (Eb). The different masonry E-modulus in the
two directions of loading (Emv and Emh) can be matched by varying the normal and tangent
interface stiffnesses (Knn and Ktt). In the experimental program [Paparo and Beyer, 2014] the
vertical masonry E-modulus Emv was obtained from standard compression tests on masonry
wallettes [EN 1052-1, 1998]. Compression tests in horizontal direction were not carried out.
According to Beyer and Dazio [2012], who tested similar masonry walls under horizontal and
vertical loads, the ratio Emh / Emv is estimated as 0.25. Hence it was assumed that Emh = 0.25 Emv.
As the investigated URM walls had dry head joints, the vertical masonry E-modulus (Emv) can be
related to the normal interface stiffness (Knn) and the horizontal masonry E-modulus (Emh) can
be related to the tangent interface stiffness (Ktt). Simple compression tests with loading
orthogonal and parallel to bed joints are simulated, allowing the calibration of Knn and Ktt to
obtain the two desired masonry E-moduli Emh and Emv.
The fracture energies of the joint interfaces (GIf and GII
f) were not determined within this project
[Paparo and Beyer, 2014]. The interface Mode II fracture energy GIIf is assumed to be equal to
0.50 N/mm, according to Beyer and Dazio [2012]. Since for the interface Mode I fracture energy
GIf no experimental results for hollow clay bricks were found, it is assumed that the ratio GI
f/GIIf
Dow
nloa
ded
by [
EPF
L B
iblio
thèq
ue]
at 1
4:46
24
Nov
embe
r 20
15
Accep
ted M
anus
cript
12
is equal to the ratio ftm/c [Reyes et al., 2008]. Since GIf and GII
f were not determined directly
from material tests, sensitivity analyses of their influence to the response of single URM walls
were carried out. Also according to Lourenço [1996], it was found that the assumed values of GIf
and GIIf are parameters which do not strongly affect the results of the analyses.
ii) RC walls and beams: The concrete behaviour of RC walls and beams is modelled using shell
elements in conjunction with the SBETA model [Červenka et al., 2008]. The concrete behaviour
in compression is parabolic up to the cylinder compressive values fc and fcc. The cylinder
compressive value fc is used for modelling the unconfined concrete in the RC walls. In the
boundary elements of the RC walls and in the RC beams, the concrete compressive strength
adopted is fcc. This value accounts for the effect of the confinement and is calculated according
to Mander et al. [1988]. After the peak stresses fc and fcc, the softening law of the concrete would
be linearly descending but this was not reached in any of the analyses. The concrete behaviour in
tension is modelled using a linear-elastic relation until the tensile strength (ftc). After the stress
peak ftc, the concrete is modelled with an exponential tension softening law. The concrete tensile
strength ftc was experimentally determined from double punch tests on half cylinders [Chen,
1970]. A bilinear stress-strain relation is adopted for the reinforcing bars in conjunction with (i)
truss elements for representing longitudinal reinforcements and (ii) shells for representing
transverse smeared reinforcements. Perfect bond between steel and concrete is always assumed.
3.3. Macro-element model
The macro-model strategy consists of modelling each structural member as single elements
which are then assembled to an equivalent frame. The macro-element developed by Penna et al.
Dow
nloa
ded
by [
EPF
L B
iblio
thèq
ue]
at 1
4:46
24
Nov
embe
r 20
15

Accep
ted M
anus
cript
13
[2013] is used to describe the behaviour of masonry walls. Timoshenko beams characterised by
an elasto-plastic law represent RC members [Cattari and Lagomarsino, 2013]. The simulations
are carried out with the software TREMURI [Lagomarsino et al., 2009; Lagomarsino et al.;
2013, Penna et al., 2013].
The adopted mechanical properties are summarised in Table 2. The equivalent friction and
cohesion parameters for masonry piers (μeq and ceq) are computed as follows:
Step1) Calculation of the shear strength: For single masonry walls, Penna et al. [2013] proposed
to set the equivalent friction and cohesion (i) on the basis of the strength criterion which is
representative of the expected failure and (ii) assuming the axial force N acting on the section.
For multi-storey (mixed RC-URM and plain URM) wall buildings with RC slabs, Mandirola
[2014] used the same approach and set μeq and ceq (i) on the basis of the shear criterion which
represents the expected shear failure and (ii) assuming the axial force N at the base of the URM
walls considering the gravity loads only. The latter assumption means that the calibration is
made without taking into account the variation of the axial force in the URM walls due to the
floor level and the load transferred by the RC slabs.
As the objective of the paper is to provide practical guidelines for setting up models by using
standard material tests only, the approach proposed by Mandirola [2014] is followed herein.
Note that, in a multi-storey building, the approach would require different values of μeq and ceq
depending on the floor level to account for the variation of axial force over the height of the
building. However, since in the top storeys the URM walls are dominated by rocking
Dow
nloa
ded
by [
EPF
L B
iblio
thèq
ue]
at 1
4:46
24
Nov
embe
r 20
15

Accep
ted M
anus
cript
14
deformations because of the low axial force acting on the URM walls, a variation of μeq and ceq
is unlikely to affect the results significantly.
Step 2) Calculation of μeq and ceq: In the macro-element developed by Penna et al. [2013], the
shear strength of a masonry wall Vsh is the sum of the friction component Vµ and the cohesion
component Vc:
csh VVV += µ (3.2)
The equivalent friction and cohesion parameters μeq and ceq can be found by assigning half of the
shear strength to the friction component Vμ and half of the shear strength to the cohesion
component Vc:
NVV eqsh ⋅==⋅ µµ5.0 (3.3a)
grosseqcsh AcVV ⋅==⋅5.0 (3.3b)
Note that (i) the cohesion component Vc is determined considering the gross section area Agross
and that (ii), for URM walls with shear behaviour, plastic displacements occur when the shear
force V is bigger than the friction component (Vμ). The assignment of 50% of the total shear
(Vsh) to cohesive and friction components is chosen on the basis of the experimental results. In
fact, in the hysteretic behaviour of TU1 and TU2, the stiffness degradation in the masonry walls
Dow
nloa
ded
by [
EPF
L B
iblio
thèq
ue]
at 1
4:46
24
Nov
embe
r 20
15

Accep
ted M
anus
cript
15
starts for values of shear forces V equal to around 50% Vsh. The force-displacement results of
two quasi-static cyclic tests [Petry and Beyer, 2014a] on URM walls exhibiting dominant shear
behaviour are used to validate the approach for the calculation of μeq and ceq. The comparison
(Fig. 5) shows that the TREMURI models with the proposed values of μeq and ceq provide good
estimates of the stiffness degradation in the pre-peak response and of the dissipated energy (β =
0.25).
Concerning the calculation of the shear strength of the masonry wall, Penna et al. [2013] propose
to use the strength criterion which is representative of the expected failure. In this case, the
strength of the masonry panel is calculated by using the shear strength criterion which accounts
for the brick tensile strength [Mann and Müller, 1982]:
tbv
tbsh ltf
NfltV ++
= 1)1(3.2 α
(3.4)
where l and t are the length and the thickness of the masonry wall, N the axial force acting on
section and ftb the brick tensile strength. (1+αv) = (1+HCF/l) is a correction coefficient proposed
by Magenes and Calvi [1997] to account for the effect of complex stress distribution. HCF is the
height of the contra-flexure point of the masonry wall. According to such a calibration, for TU1
the shear strength Vsh is equal to 141 kN (N = 460 kN) and for TU2 the shear strength Vsh is
equal to 123 kN (N = 260 kN). The experiments have shown that, for TU1 and TU2, HCF can be
assumed equal to the storey height. The tensile strength of the brick, ftb, is set equal to 1.27 MPa
Dow
nloa
ded
by [
EPF
L B
iblio
thèq
ue]
at 1
4:46
24
Nov
embe
r 20
15

Accep
ted M
anus
cript
16
according to Petry and Beyer [2014a] who tested masonry walls similar to those herein
considered.
In Table 2, the adopted E-modulus corresponds to the vertical masonry E-modulus (Emv)
obtained from standard compression tests on masonry wallettes [EN 1052-1, 1998], see Sec. 3.2.
The shear modulus (Gm) is calculated from the E-modulus Emh (compression parallel to bed-
joints, see Sec. 3.2):
)1(2)25.0(
)1(2 M
mv
M
mhm
EEG
νν +⋅⋅
=+⋅
= (3.5)
νM is the Poisson ratio of the masonry wall which was found to be equal to 0.18 according to EN
1052-1 [1998].
For the construction of the macro-model, additional assumptions on the stiffness and
deformation capacity of the elements are required:
i) Stiffness of URM walls: The stiffness of URM walls corresponds to the uncracked stiffness of
the section. For the shear damage model, non-linear plastic deformations in the pre-peak
response are taken into account by the effect of the shear deformability parameter Gct [Penna et
al., 2013]. The latter is set equal to one so that, at peak strength (Vsh), the total horizontal
displacement utot is 1.5 times the elastic one uel:
Dow
nloa
ded
by [
EPF
L B
iblio
thèq
ue]
at 1
4:46
24
Nov
embe
r 20
15

Accep
ted M
anus
cript
17
eltot uu 5.1= (3.6)
with )/( ltGhVu mshel = . h, l, t are the height, length, thickness of the wall. For the flexural
behaviour, non-linear elastic deformations are taken into account in terms of kinematic variables
(rotation and vertical displacement of the section). A no tension model is attributed to the zero-
length springs in which flexural and axial deformations are lumped [Penna et al., 2013].
ii) Softening parameter β: The parameter β, which describes the softening post-peak response of
the URM walls, is here set equal to zero. This means that the macro-element does not display
any strength degradation after the peak.
iii) Failure criterion for URM walls: The failure criterion follows the formulation proposed by
EN 1998-3 [2005] in which the near collapse (NC) inter-storey drift δu of a masonry wall
depends on its failure mechanism:
For shear failure %53.0=uδ (3.7a)
For flexural failure )/(%07.1 LH CFu ⋅=δ (3.7b)
For flexural failure, the near collapse drift is also dependant on the ratio HCF/L (height of the
contra-flexure point over length of the pier). Although the pier’s displacement capacity is defined
as horizontal load failure, tests have shown that URM walls lose their vertical load bearing
capacity soon after the horizontal load failure [Petry and Beyer, 2014b]. Once the first URM pier
Dow
nloa
ded
by [
EPF
L B
iblio
thèq
ue]
at 1
4:46
24
Nov
embe
r 20
15

Accep
ted M
anus
cript
18
fails, it is assumed that the system reaches its ultimate displacement capacity. The inter-storey
drift δ is calculated as follows:
hji ∆−∆
=δ (3.8)
where Δi and Δj are the horizontal displacements of the beams below and above the considered
wall and h the height of the wall.
iv) Stiffness of RC members: Experiments on mixed RC-URM wall structures [Paparo and Beyer,
2014; Beyer et al., 2014] have shown that the RC walls crack only in the first storey, while the
above storeys feature just thin cracks, mainly in the construction joints connecting walls and
slabs (or beams). As a consequence, the reduction of stiffness according to Priestley et al. [2007]
is applied to the first storey of the RC walls and to the RC beams. This reduction is taken into
account by considering the effective stiffness EIe:
y
Ne
MEIϕ
= (3.9)
where MN is the nominal yield moment, calculated considering the axial force acting at the base
of the wall before applying the horizontal load, and φy is the nominal yield curvature, which is
equal to Cεy/lw. C is a constant depending on the geometrical properties of the section; εy is the
yield strain of the longitudinal reinforcing bars and lw is the length of the wall. To account for
the presence of thin cracks in construction joints between the RC walls above the first storey and
Dow
nloa
ded
by [
EPF
L B
iblio
thèq
ue]
at 1
4:46
24
Nov
embe
r 20
15
Accep
ted M
anus
cript
19
the slabs (or beams), the concrete E-modulus of the RC walls above the first storey is reduced by
50%. The latter assumption is considered applicable if (i) the mean longitudinal reinforcement
ratio of the RC walls is within the range of 0.2% and 4.0% and if (ii) the RC walls are built
between floor levels and their longitudinal reinforcements pass across the slabs, as it is generally
the case for mixed RC-URM structures representative for residential buildings in Switzerland.
v) Axial stiffness of RC beams: The RC beams are modelled with infinite axial stiffness to
guarantee that the walls at each floor displace horizontally by the same amount.
vi) Failure criterion for RC members: All RC elements are designed to form a ductile flexural
mechanism. The ultimate chord rotation θu of RC members is estimated according to EN 1998-3
[2005]. However, the deformation capacity of RC members developing a stable flexural response
is much larger than that of URM walls. In all the analyses presented in this paper, the RC
elements do not reach their deformation capacity.
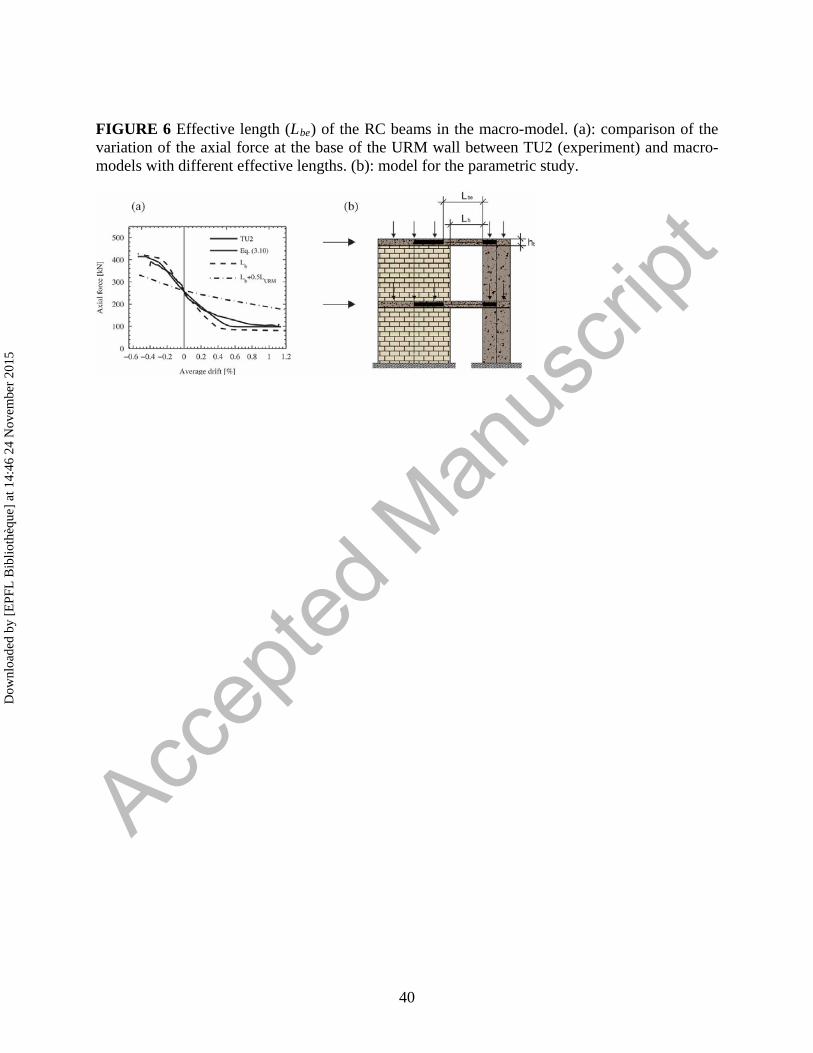
vii) Effective length of the RC beams: In the macro-model the user can control the effective
length of the RC beams (Lbe) by introducing rigid offsets. To account for the curvature
penetration of RC beams into URM walls, the deformable part is increased by its section depth
hb where the beam spans into an URM wall [Priestley et al., 2007]. In case of beams connecting
two URM walls one obtains as length of the deformable part of the beam:
bbbbe hLhL ++= (3.10a)
Dow
nloa
ded
by [
EPF
L B
iblio
thèq
ue]
at 1
4:46
24
Nov
embe
r 20
15

Accep
ted M
anus
cript
20
where Lb is the clear distance between the ends of the two walls. If the beam spans one URM
and one RC wall (as represented in Fig. 6bone obtains:
bbbe LhL += (3.10b)
The effective length of the beams influences their stiffness and therefore their shear force, which
lead to the variation of axial force at the base of the walls. Fig. 6a compares the variation of the
axial force at the base of the URM wall for macro-models with different effective lengths to the
data obtained from TU2. Results indicate that the best match in terms of variation of axial force
at the base of the URM wall is, indeed, obtained for Lbe according to Eq. (3.10).
A parametric study comparing the response between the shell-model and the macro-model is
carried out. The investigated parameters are (i) the axial load applied at the top of the two storeys
of the URM wall and (ii) the strength of the RC beams (Fig. 6b and 7). The objective is to
ascertain if the estimation of Lbe according to Eq. (3.10) in the macro-model can be used also for
different configurations of masonry structures. The study is carried out by comparing the
variation of axial stress at the base of the URM wall since such a variation is directly related to
the assumed deformable length of the RC beams (Lbe). The results confirm that in the macro-
model the effective length of the RC beams is accurately estimated by Eq. (3.10) also for
different strengths of the RC beams (ρb = 0.6% - 1.2%) and different axial load ratios of the
URM walls (σ0/fcM = 0.2 - 0.6).
Dow
nloa
ded
by [
EPF
L B
iblio
thèq
ue]
at 1
4:46
24
Nov
embe
r 20
15
Accep
ted M
anus
cript
21
3.4. Comparison of the numerical and experimental results
Comparison between the two numerical models and the experiments is made by analysing:
i) The distribution of the base shear among the walls, to assess the influence of the relative
stiffness of the members;
ii) The distribution of the axial force between the walls, to check the assumptions of the effective
length of the RC beams;
iii) The inter-storey drift profile over the height of the structure, to ascertain the predicted
deformed shapes.
When comparing the numerical to the experimental results, it is assessed which of the two
models predicts the experimentally obtained values better. Further it is assessed whether the
numerical models can capture the trends of the experimental results with increasing displacement
demand. The numerical results are not benchmarked against the experimental results in absolute
terms since, for example, small unintended variations in the axial load that was applied during
the test might falsify the picture.
Fig. 8a and 8b show that the shear carried by the walls is estimated rather accurately by both
numerical approaches. Note, however, that with regard to the shear carried by the RC walls, the
two models performed differently. (i) The macro-model approximates the force-displacement
response of the RC walls with a bilinear relation which initial slope corresponds to the effective .
As a consequence, it does not capture the stiffness degradation of the RC members due to
Dow
nloa
ded
by [
EPF
L B
iblio
thèq
ue]
at 1
4:46
24
Nov
embe
r 20
15
Accep
ted M
anus
cript
22
cracking and the onset of yielding of the longitudinal bars and therefore underestimates the shear
forces carried by the RC walls before yielding. (ii) The shell-model, instead, captures the
stiffness degradation of the RC members.
For TU1 there are some discrepancies in the distribution of the axial force between the models
and the experimental results (Fig. 8c). During testing of TU1, the total axial load applied at the
top of the URM wall varied with around 30 kN while in the numerical analyses the axial load
was kept constant. As a consequence, the variation of axial force that is due to the variation of
the axial load applied at the top of the URM wall is not taken into account in the simulations. On
the other hand, for TU2 (Fig. 8d), the axial load applied at the top of the URM wall was constant
throughout the testing procedure and the difference between experiments and analytical results is
small.
During the testing of TU1 and TU2, the inter-storey drift δ of the first storey was almost equal to
that of the second storey and the same trend is found from the simulations (Fig. 9a and 9b). Fig.
9c and 9d represent the ratio between the inter-storey drift and the average drift. Except for
absolute average drifts smaller than 0.1%, the comparison between experiments and simulations
is satisfactory and differences smaller than 15% are found. The evaluation of the displacement
capacity, calculated only with the macro-model, gives good results although the displacement
capacity of the structure is somewhat overestimated for the negative direction of loading. In Fig.
8 and 9 the numerical simulations performed with the macro-model are stopped when the failure
criterion is attained. In addition, the two numerical strategies are able to capture the prevailing
shear and flexure damage modes that occurred over the height of the URM walls.
Dow
nloa
ded
by [
EPF
L B
iblio
thèq
ue]
at 1
4:46
24
Nov
embe
r 20
15
Accep
ted M
anus
cript
23
The macro-model can be used for practically oriented analyses of complete mixed RC-URM
wall structures and, following the indications proposed in Sec. 3.3, relative accurate results with
a limited computational effort can be obtained. The shell-element approach instead, can be
adopted for detailed analyses of the mechanical behaviour of small substructures to give a better
understanding about their local behaviour. Moreover, the shell-element approach can be used
when an irregular arrangement of openings does not allow the definition of an equivalent frame
in the macro-model approach or when the URM walls have not sufficiently large dimensions to
be treated as macro-elements [Lourenço, 1996]. However, due to the regularity of the herein
analysed mixed buildings, the macro-modelling technique can be generally used and is the most
suitable tool for practically oriented analyses of such buildings.
4. Application to four buildings
One reference structure and three retrofit solutions (Fig. 10) are compared to exemplify the
benefits of retrofitting URM buildings by replacing or adding RC walls. The reference structure
is a four-storey building composed of three URM walls. The adopted geometrical configuration
leads to a shear failure mechanism at the bottom storey. In case study 1 one URM wall is
replaced by one RC wall of the same length. Case study 2 represents the retrofit design made by
the insertion of one RC wall which is parallel but not in the same plane of the other URM walls.
As a consequence, in the numerical simulations the RC wall is connected to the URM structure
with axially rigid links with zero moment capacity at each floor as represented in Fig. 10c. In
case study 3 two slender RC walls are added to the original URM building. Fig. 10 shows the
elevation of the four structures and the lateral load pattern applied. The thickness of the walls is
Dow
nloa
ded
by [
EPF
L B
iblio
thèq
ue]
at 1
4:46
24
Nov
embe
r 20
15

Accep
ted M
anus
cript
24
always equal to 0.20 m. Two-dimensional simulations are carried out and RC beams 0.25x0.60
m represent the slabs. The thickness of the RC beams is three times that of the walls [Priestley et
al., 2007] and the free span of the RC beams is 1.05 m. The axial stress ratio σ0/fcM at the base of
the URM walls is around 0.14. All RC walls and slabs are designed such that the URM walls fail
before any RC element. RC member’s longitudinal reinforcement ratios are listed in Table 3; the
shear reinforcement of RC walls and beams are designed to prevent shear failure. The total
masses of the buildings are proportional to the sum of the length of the walls, that is 180 t for the
reference structure and case study 1; 240 t for case studies 2 and 3.
The reference structure and case study 1 (Fig. 10a and 10b) are also analysed considering a lower
coupling provided by the RC beams (ρb equal to 0.20%). The objective is to decrease the
coupling effect provided by the RC beams and achieve dominant rocking behaviour of the URM
walls. This configuration will show that for buildings with rocking URM walls the increase in
displacement capacity after the retrofitting is smaller than for buildings where the URM walls
develop a dominant shear behaviour.
The analyses are carried out with the macro-model following the indications described in Sec.
3.3. μeq and ceq, the equivalent friction and cohesion coefficients, are equal to 0.18 [-] and 0.17
MPa respectively. The analyses are performed until the structures reach their Significant Damage
(SD) limit state, which corresponds to the instant when the first URM wall reaches the target
inter-storey drift capacity δcap. For walls failing in shear, the inter-storey drift capacity at the SD
limit state is assumed as 0.4% [EN 1998-3, 2005]. For URM walls failing in flexure, their inter-
Dow
nloa
ded
by [
EPF
L B
iblio
thèq
ue]
at 1
4:46
24
Nov
embe
r 20
15

Accep
ted M
anus
cript
25
storey drift capacity δcap is set equal to 0.8% HCF/L [EN 1998-3, 2005]. The inter-storey drift
demand of each wall (δD) is calculated as follows:
iji
D hθδ −
∆−∆= (4.1)
where Δi and Δj are the horizontal displacements of the beams below and above the considered
wall, h the height of the wall and θi the rotation of beam below the wall. Comparisons will be
carried out by analysing the capacity curves (Sec. 4.1) and the results from the N2 method (Sec.
4.2).
4.1. Capacity curves
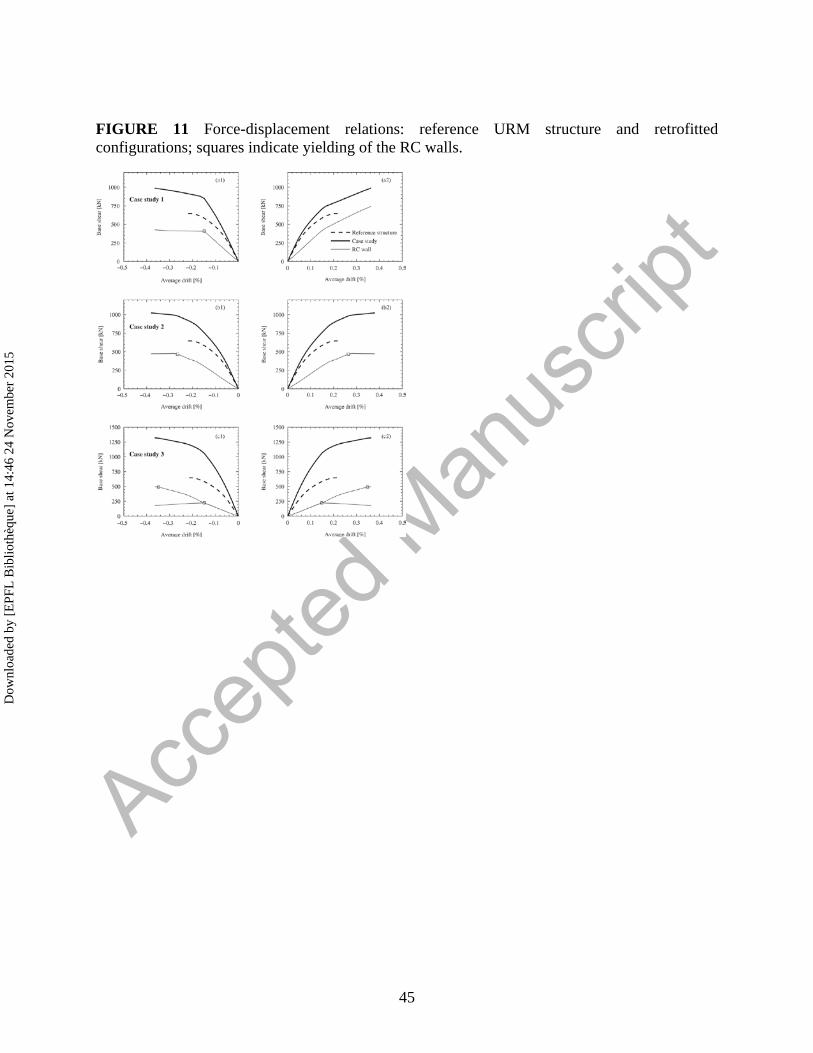
Fig. 11 represents the capacity curves of the four case studies for the two directions of loading.
Besides the augmentation in strength, there is an increase in average drift capacity between
approximately 50-60% (see also Table 4). As outlined in Sec. 2, the RC walls change the
deformed shape and avoid a concentration of damage in the first storey.
Case study 1 is not plan-symmetric and its response changes whether the structure is pushed
towards one direction or another (Fig. 11a). URM walls are, in fact, much more sensitive to the
variation of the axial force if compared to RC walls with respect to their stiffness, displacement
and strength capacity. Since URM wall 1 and the RC wall are flanked by beams only from one
direction (Fig. 10b), the axial force at their base changes depending on the loading direction.
Dow
nloa
ded
by [
EPF
L B
iblio
thèq
ue]
at 1
4:46
24
Nov
embe
r 20
15

Accep
ted M
anus
cript
26
Fig. 12 represents the force-displacement relation for the reference structure and case study 1
when the longitudinal reinforcement ratio ρb of the beams is reduced to 0.20%. This
configuration represents the effect of the retrofitting technique when the URM walls develop
mainly a rocking behaviour. Since the addition of the RC wall does not particularly change the
deformed shape of the structure, there is no significant increase in displacement capacity. In Fig.
12, the displacement and strength capacities of the retrofitted configuration change depending on
the loading direction since the retrofitted configuration is not plan symmetric (Fig. 10a).
4.2. N2 method
The objective of structural engineers designing a retrofit intervention is that the retrofitted
structure can withstand a larger seismic hazard than the original building. In codes the seismic
hazard is typically expressed by the peak ground acceleration (PGA), which scales the shape of
the design spectrum. Since retrofit interventions affect stiffness, strength and deformation
capacity, the resulting increase in maximum peak ground acceleration (PGAmax) that the
structure can withstand is evaluated by the N2 method. The method evaluates the so called
“performance point”, which is found by comparing the capacity curve of the equivalent bi-linear
single-degree of freedom (SDOF) system with the seismic demand [Fajfar, 2000]. From the
pushover curve of the multi-degree of freedom system (actual MDOF response), the force-
displacement response of the SDOF system (actual SDOF response) is computed according to
EN 1998-1 [2004], Fig. 13a. The bi-linear approximation of the SDOF’s force-displacement
response is then constructed using the proposed criteria of Table 5 (see also Fig. 13b) and the
performance point of the structures is computed according to EN 1998-1 [2004].
Dow
nloa
ded
by [
EPF
L B
iblio
thèq
ue]
at 1
4:46
24
Nov
embe
r 20
15

Accep
ted M
anus
cript
27
Besides the comparison of PGAmax, the other quantities representing the seismic behaviour of the
bilinear approximation of the equivalent SDOF systems (T*, Δ*y, Δ*
u, μ*, F*b) are summarised in
Table 6. In the analyses, the seismic demand is represented by an acceleration design spectrum
of soil class C (Tb = 0.2 s; Tc = 0.6 s and Td = 2 s [EN 1998-1, 2004]). Note that for all the
structures the equivalent period T* (period of the equivalent SDOF system) is lower than Tc, as it
is generally the case for URM structures. As for all the configurations T* < Tc = 0.6 s, the
performance point of the equivalent SDOF system Δ*u is calculated as follows [EN 1998-1,
2004]:
( ) etc
uu
etu
TTq
q*
*
** 11 ∆≥
−+
∆=∆ (4.2)
where Δ*et is the performance point of the SDOF system with period T* and unlimited elastic
behaviour:
2***
2)(
=∆
πTTSaet (4.3)
qu is the ratio between the peak acceleration in the structure with unlimited elastic behaviour and
in that with limited strength. Sa(T*) is the elastic acceleration response spectrum at the equivalent
period T*. Fig. 14a shows the used acceleration design spectrum for PGA = 1 m/s2, whereas Fig.
14b to 14f represent the identification of the performance point in the acceleration-displacement
response spectra for the maximum PGA that the structures withstand (PGAmax).
Dow
nloa
ded
by [
EPF
L B
iblio
thèq
ue]
at 1
4:46
24
Nov
embe
r 20
15

Accep
ted M
anus
cript
28
For the three case studies, the system’s yield displacements Δ*y are between 1.15 to 1.45 times
the one of the reference structure. The ultimate displacements Δ*u increase between 1.50 and
1.60 times, mainly because of the change in displacement profile due to the insertion of RC
walls. As a result, the ductility of the system μ* increases between 5% and 30%. The base shear
capacity of the equivalent SDOF system (F*b) rises for all the case studies. In case study 3 the
increase in base shear is larger than for the other configurations due to the larger frame effect
developed by the presence of the two RC walls. As a result of the increase displacement and
force capacity, the maximum PGA that the structures can sustain (PGAmax) rises between 140-
170%.
5. Conclusions and outlook
The article presented a retrofit technique for modern URM buildings connected by RC slabs by
adding or replacing RC walls to the original structure. The study targeted structures where the
RC members are designed to fail for larger displacement demands than the URM walls. Mixed
RC-URM buildings in which the RC members are not capacity-designed were not herein
considered. The advantages of this retrofitting technique are related to (i) an increase in strength
capacity and (ii) a change of the deformed shape. The latter provides a failure mechanism with
larger top displacements for the same level of inter-storey drift at the ground floor (Fig. 4).
In order to analyse such structures, two computational strategies were presented, namely a shell-
model and a macro-model approach. The results of the two techniques were compared against
experimental results and judged satisfactory. The macro-model, although requiring limited
Dow
nloa
ded
by [
EPF
L B
iblio
thèq
ue]
at 1
4:46
24
Nov
embe
r 20
15

Accep
ted M
anus
cript
29
computational efforts, was capable of representing all the main features of the seismic behaviour
of mixed RC-URM wall structures: (i) distribution of the reaction forces between the walls at
peak strength, (ii) evaluation of the inter-storey drift profile over the height of the structure, (iii)
evaluation of the ultimate displacement capacity and (iv) damage modes that occurred in the
URM walls. As a consequence a macro-element model, which follows the indications proposed
in Sec. 3.3, is particularly recommended for practically oriented analysis of complete mixed RC-
URM wall structures. A shell-model approach, instead, can be adopted for analysing in detail the
mechanical behaviour of small substructures where more refined analyses are needed.
The case studies evaluated the benefits in terms of design quantities: the increase in displacement
capacity ranged between 50% and 60% and the increase in PGAmax was between 40% and 70%.
The displacement ductility μ* increased between 5% and 30%.
The RC wall length, as well as its reinforcement ratio, was kept constant. Further studies will
address the effects of varying the RC wall length and its reinforcement ratio with the objective of
optimising the efficiency of the retrofitting technique.
Acknowledgements
The authors thank Chris Genis for proofreading the manuscript.
Dow
nloa
ded
by [
EPF
L B
iblio
thèq
ue]
at 1
4:46
24
Nov
embe
r 20
15
Accep
ted M
anus
cript
30
References
Beyer, K. and Dazio, A. [2012] “Quasi-Static Cyclic Tests on Masonry Spandrels,” Earthquake
spectra, 28(3), 907-929.
Beyer, K., Tondelli, M., Petry, S. and Peloso, S. [2014] “Dynamic testing of a 4-storey building
with reinforced concrete and unreinforced masonry walls”, submitted to Bulletin of Earthquake
Engineering.
Casoli, D. [2007] “Assessment of existing mixed RC-Masonry structures and strengthening by
RC shear walls,” Pavia, Italy.
Cattari, S. and Lagomarsino, S. [2013] “Seismic design of mixed masonry-reinforced concrete
buildings by non-linear static analyses,” Earthquakes and Structures, Vol. 4, N°3.
Červenka, J. and Papanikolaou, V.K. [2008] “Three dimensional combined fracture-plastic
material model for concrete,” International Journal of Plasticity, 24, 2192-2220.
Červenka, V., Jendele, L. and Červenka, J. [2010] “Atena - Computer Program for Nonlinear
Finite Element Analysis of Reinforced Concrete Structures,” Theory and User Manual, Prague,
Czech Republic.
Chen, W. [1970] “Double punch test for tensile strength of concrete,” ACI Journal, 67, 993-995.
EN 1052-1 [1998] Eurocode 6: Methods of test for masonry – Part 1: Determination of the
compressive strength, CEN, Brussels.
Dow
nloa
ded
by [
EPF
L B
iblio
thèq
ue]
at 1
4:46
24
Nov
embe
r 20
15

Accep
ted M
anus
cript
31
EN 1052-3 [2002] Eurocode 6: Methods of test for masonry – Part 3: Determination of the
initial shear strength, CEN, Brussels.
EN 1992-1-1 [2004] Eurocode 2: Design of concrete structures – Part 1-1: General rules and
rules for buildings, CEN, Brussels.
EN 1996-1 [2005] Eurocode 6: Design of masonry structures – Part 1: General rules for
reinforced and unreinforced masonry structures, CEN, Brussels.
EN 1998-1 [2004] Eurocode 8: Design of structures for earthquake resistance – Part 1: General
rules, seismic actions and rules for buildings, CEN, Brussels.
EN 1998-3 [2005] Eurocode 8: Design of structures for earthquake resistance – Part 3:
Assessment and retrofitting of buildings, CEN, Brussels
Fajfar, P. [2000] “A non linear analysis method for performance-based seismic design,”
Earthquake Spectra, 16(3), 573-591.
Jurukovski, D., Krstevska, L., Alessi, R., Diotallevi, P.P., Merli, M. and Zarri, F. [1992]
“Shaking table tests of three four-storey brick masonry models: original and strengthened by RC
core and by RC jackets,” Proc. of 10th World Conference on earthquake Engineering, Madrid,
Spain.
Lagomarsino, S., Penna, A., Galasco, A. and Cattari, S. [2009] “Tremuri User Guide,” Genova,
Italy.
Dow
nloa
ded
by [
EPF
L B
iblio
thèq
ue]
at 1
4:46
24
Nov
embe
r 20
15

Accep
ted M
anus
cript
32
Lagomarsino, S., Penna, A., Galasco, A. and Cattari S. [2013] “TREMURI program: an
equivalent frame model for the non-linear seismic analysis of masonry buildings,” Engineering
Structures, 6, 1787–1799.
Lang, K. [2002] “Seismic vulnerability of existing buildings,” Ph.D. thesis, ETH Zurich, Zurich,
Switzerland.
Lourenço, P.B. [1996] “Computational Strategies for Masonry Structures,” Ph.D. thesis, Delft
University, Delft, The Netherlands.
Magenes, G. and Calvi, G.M. [1997] “In-plane seismic response of brick masonry walls,”
Earthquake Engineering and Structural Dynamics, 26, 1091-1112.
Magenes, G. [2006] “Masonry building design in seismic areas: recent experiences and prospects
form and european standpoint,” Keynote address, Proc of 1st European Conference on
Earthquake Engineering and Seismology, Geneva, Switzerland.
Mander, J.B., Priestley, M.N.J. and Park, R. [1988] “Theoretical stress-strain model for confined
concrete,” ASCE Journal of Structural Engineering, 114(8), 1804-1826.
Mandirola, M. [2014] “Non-linear macroelement modelling of experimental tests on masonry
building specimens with rigid diaphragms,” Pavia, Italy.
Mann, W. and Müller, H. [1982] “Failure of shear-stressed masonry: an enlarged theory, tests
and application to shear walls,” Proc. of the British Ceramic Society, 30, 223-235.
Paparo, A. and Beyer, K. [2012] “Pushover Analyses of Mixed RC-URM wall structures,” Proc.
of 15th World Conference on earthquake Engineering, Lisbon, Portugal.
Dow
nloa
ded
by [
EPF
L B
iblio
thèq
ue]
at 1
4:46
24
Nov
embe
r 20
15

Accep
ted M
anus
cript
33
Paparo, A. and Beyer, K. [2014] “Quasi-static tests of two mixed reinforced concrete –
unreinforced masonry wall structures,” Engineering Structures, 71, 201–211.
Paulay, T. and Priestley, M.N.J. [1992] Seismic design of reinforced concrete and masonry
buildings, John Wiley & Sons, Inc., New York.
Penna, A., Lagomarsino, S. and Galasco, A. [2013] “A nonlinear macro-element model for the
seismic analyses of masonry buildings,” Earthquake Engineering and Structural Dynamics,
10.1002/eqe.2335.
Petry, S. and Beyer, K. [2014a] “Cyclic test data of six unreinforced masonry walls with
different boundary conditions,” Earthquake Spectra.
Petry, S. and Beyer, K. [2014b] “Influence of boundary conditions and size effect on the drift
capacity of URM walls,” Engineering Structures, 65, 76-88.
Reyes, E., Casati, M.J. and Galvez, J.C [2008] “Cohesive crack model for mixed mode fracture
of brick masonry,” International Journal of Fracture, 151:29-55.
Priestley, M.J.N., Calvi, G.M. and Kowalsky, M.J. [2007] Displacement-Based Seismic Design
of Structures, IUSS Press, Pavia, Italy.
SIA 162/1 [1995] Building code, Swiss Society of Engineers and Architects (SIA): Ouvreages en
béton – Essais des matériaux, SIA, Zurich.
Smith, B.S. and Coull, A. [1991] Tall building structures: analysis and design, John Wiley &
Sons, Inc., New York.
Dow
nloa
ded
by [
EPF
L B
iblio
thèq
ue]
at 1
4:46
24
Nov
embe
r 20
15

Accep
ted M
anus
cript
34
Tomaževič, M., Modena, C., Velechovsky, T. and Weiss, P. [1990] “The effect of reinforcement
on the seismic behaviour of masonry buildings with mixed structural systems: an experimental
study,” Proc. of 9th European Conference on earthquake Engineering, Moscow, Russia.
Dow
nloa
ded
by [
EPF
L B
iblio
thèq
ue]
at 1
4:46
24
Nov
embe
r 20
15

Accep
ted M
anus
cript
35
FIGURE 1 Deformation pattern and inter-storey drift profile due to lateral forces of a single URM wall with dominant shear behaviour (a), a single RC wall with dominant flexure behaviour (b) and a mixed RC-URM structure (c).
Dow
nloa
ded
by [
EPF
L B
iblio
thèq
ue]
at 1
4:46
24
Nov
embe
r 20
15

Accep
ted M
anus
cript
36
FIGURE 2 EPFL tests on two mixed RC-URM wall substructures: crack pattern after failure. (a): TU1. (b): TU2 [Paparo and Beyer, 2014].
Dow
nloa
ded
by [
EPF
L B
iblio
thèq
ue]
at 1
4:46
24
Nov
embe
r 20
15

Accep
ted M
anus
cript
37
FIGURE 3 Crack pattern in a four-storey mixed RC-URM wall structure, from Beyer et al. [2014].
Dow
nloa
ded
by [
EPF
L B
iblio
thèq
ue]
at 1
4:46
24
Nov
embe
r 20
15

Accep
ted M
anus
cript
38
FIGURE 4 Deformation capacity, for the same level of inter-storey drift δ*, of a mixed RC-URM structure (a) and a shear dominated URM building (b).
Dow
nloa
ded
by [
EPF
L B
iblio
thèq
ue]
at 1
4:46
24
Nov
embe
r 20
15

Accep
ted M
anus
cript
39
FIGURE 5 Comparison of the force-displacement curves obtained from in-plane cyclic tests [Petry and Beyer, 2014a] and numerical simulations.
Dow
nloa
ded
by [
EPF
L B
iblio
thèq
ue]
at 1
4:46
24
Nov
embe
r 20
15
Accep
ted M
anus
cript
40
FIGURE 6 Effective length (Lbe) of the RC beams in the macro-model. (a): comparison of the variation of the axial force at the base of the URM wall between TU2 (experiment) and macro-models with different effective lengths. (b): model for the parametric study.
Dow
nloa
ded
by [
EPF
L B
iblio
thèq
ue]
at 1
4:46
24
Nov
embe
r 20
15

Accep
ted M
anus
cript
41
FIGURE 7 Effective length (Lbe) to be adopted in the macro-model, parametric study. Variation of axial stress ratio for different axial loads applied to the URM wall (σ0/fn) and different beam reinforcement ratios (ρb).
Dow
nloa
ded
by [
EPF
L B
iblio
thèq
ue]
at 1
4:46
24
Nov
embe
r 20
15

Accep
ted M
anus
cript
42
FIGURE 8 Distribution of the reaction forces between the two walls. (a), (b): base shear; (c), (d): axial force.
Dow
nloa
ded
by [
EPF
L B
iblio
thèq
ue]
at 1
4:46
24
Nov
embe
r 20
15

Accep
ted M
anus
cript
43
FIGURE 9 (a), (b): inter-storey drift profile over the height of the structure; (c), (d): ratio inter-storey drift-average drift.
Dow
nloa
ded
by [
EPF
L B
iblio
thèq
ue]
at 1
4:46
24
Nov
embe
r 20
15

Accep
ted M
anus
cript
44
FIGURE 10 (a): reference URM structure; (b): case study 1; (c): case study 2; (d): case study 3. All dimensions in m. All RC beams have a clear span of 1.05 m.
Dow
nloa
ded
by [
EPF
L B
iblio
thèq
ue]
at 1
4:46
24
Nov
embe
r 20
15
Accep
ted M
anus
cript
45
FIGURE 11 Force-displacement relations: reference URM structure and retrofitted configurations; squares indicate yielding of the RC walls.
Dow
nloa
ded
by [
EPF
L B
iblio
thèq
ue]
at 1
4:46
24
Nov
embe
r 20
15

Accep
ted M
anus
cript
46
FIGURE 12 Force-displacement relations: reference structure and case study 1 when the URM walls have a dominant flexural behaviour. Squares indicate yielding of the RC walls.
Dow
nloa
ded
by [
EPF
L B
iblio
thèq
ue]
at 1
4:46
24
Nov
embe
r 20
15

Accep
ted M
anus
cript
47
FIGURE 13 Mixed RC-URM wall structure, force-displacement curve. (a): actual MDOF and SDOF responses; (b): actual SDOF response and equivalent SDOF system.
Dow
nloa
ded
by [
EPF
L B
iblio
thèq
ue]
at 1
4:46
24
Nov
embe
r 20
15

Accep
ted M
anus
cript
48
FIGURE 14 (a) Design acceleration spectrum adopted for the evaluation of the N2 method; (b-f) identification of the performance points in the acceleration-displacement response spectra diagram for the maximum PGA that the structures withstand.
Dow
nloa
ded
by [
EPF
L B
iblio
thèq
ue]
at 1
4:46
24
Nov
embe
r 20
15

Accep
ted M
anus
cript
49
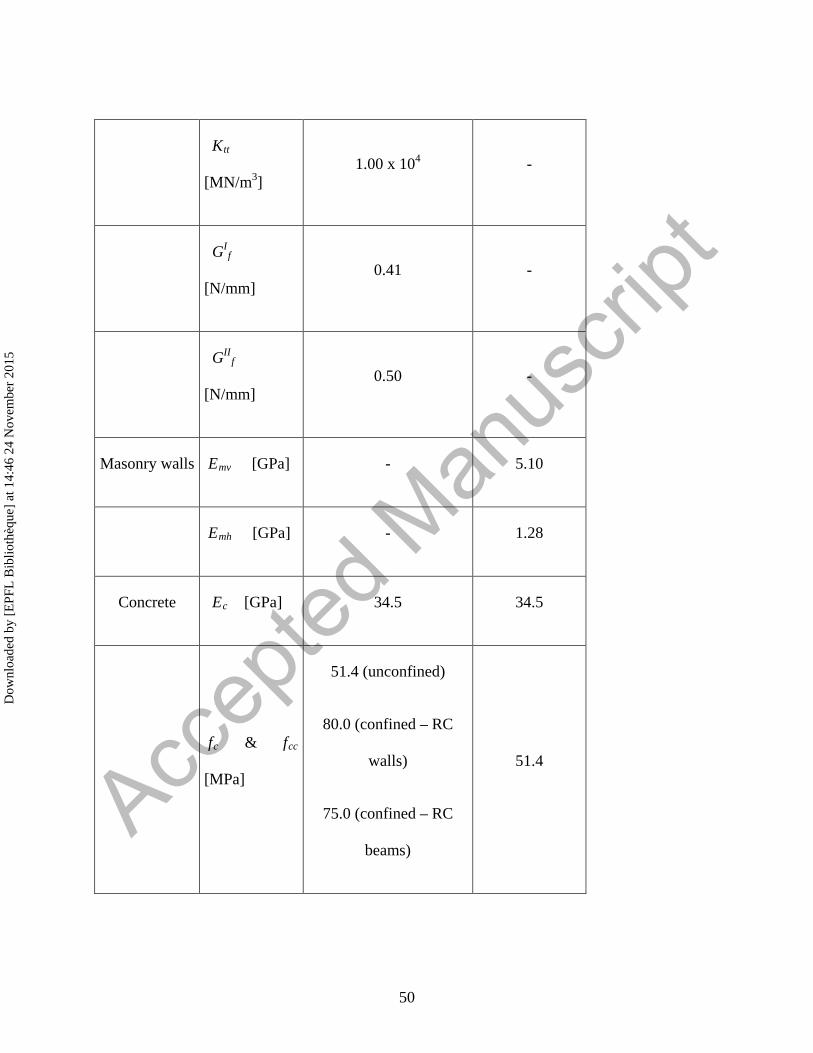
TABLE 1 Mechanical properties adopted for shell-model.
Materials Material
properties Shell-model
Material test
results
Bricks Ebx [GPa] 5.60 9.80
Eby [GPa] 5.60 4.70
ftb
[MPa] 1.4 -
GI
b
[N/mm] 0.08 -
Mortar joints μ [-] 0.63 0.63
c [MPa] 0.38 0.38
ftm [MPa] 0.30 ftm = c/(2μ)
Knn
[MN/m3] 3.00 x 10⁵ -
Dow
nloa
ded
by [
EPF
L B
iblio
thèq
ue]
at 1
4:46
24
Nov
embe
r 20
15
Accep
ted M
anus
cript
50
Ktt
[MN/m3] 1.00 x 10⁴ -
GIf
[N/mm] 0.41 -
GIIf
[N/mm] 0.50 -
Masonry walls Emv [GPa] - 5.10
Emh [GPa] - 1.28
Concrete Ec [GPa] 34.5 34.5
fc & fcc
[MPa]
51.4 (unconfined)
80.0 (confined – RC
walls)
75.0 (confined – RC
beams)
51.4
Dow
nloa
ded
by [
EPF
L B
iblio
thèq
ue]
at 1
4:46
24
Nov
embe
r 20
15

Accep
ted M
anus
cript
51
ftc [MPa] 3.00 3.00
Reinforcing
bars fy [MPa] 540 537
fu [MPa] 600 625
Ebx: brick E-modulus for loading along the brick’s height;
Eby: brick E-modulus for loading along the brick’s length;
ftb: brick tensile strength;
GIb: brick fracture energy;
μ and c: interface friction and cohesion coefficient;
ftm: interface tensile strength;
Knn and Ktt: interface normal and tangent stiffness;
GIf and GII
f: interface Mode I and II fracture energy;
Emv and Emh: vertical and horizontal masonry E-modulus;
Ec: concrete E-modulus;
fc and fcc: confined and unconfined concrete compressive strength;
Dow
nloa
ded
by [
EPF
L B
iblio
thèq
ue]
at 1
4:46
24
Nov
embe
r 20
15
Accep
ted M
anus
cript
52
fy and fu: reinforcing bar yield and ultimate tensile strength, [SIA162/1, 1995].
Dow
nloa
ded
by [
EPF
L B
iblio
thèq
ue]
at 1
4:46
24
Nov
embe
r 20
15

Accep
ted M
anus
cript
53
TABLE 2 Adopted material properties for macro-model.
Materials Material
properties Macro-model
Material test
results
URM
members μ* / μ [-]
0.15 (TU1)
0.24 (TU2)
0.63
c* / c [MPa]
0.23 (TU1)
0.20 (TU2)
0.38
fm [MPa] 6.30 6.30
Emv [GPa] 5.10 5.10
Gm [GPa] 0.54 -
Gct [-] 1.00 -
β [-] 0.00 -
RC members Ec [GPa] Eeff (1st storey & beams) 36.0
Dow
nloa
ded
by [
EPF
L B
iblio
thèq
ue]
at 1
4:46
24
Nov
embe
r 20
15

Accep
ted M
anus
cript
54
18.0 (above storeys) 36.0
Gc [GPa]
Eeff/2.4 (1st storey & beams)
7.50 (above storeys)
7.50
7.50
fy [MPa] 550 537
μ* and c*: equivalent friction and cohesion coefficients;
μ and c: friction and cohesion coefficient from triplet tests;
fm: masonry compressive strength;
Emv: E- modulus of masonry panels subjected to compression orthogonal to bed-joints;
Gm: masonry shear modulus;
Gct: shear deformability parameter;
β: softening parameter;
Ec and Gc: RC member’s Young’s and shear modulus;
fy: reinforcing bar yield tensile strength adopted in RC members.
Dow
nloa
ded
by [
EPF
L B
iblio
thèq
ue]
at 1
4:46
24
Nov
embe
r 20
15

Accep
ted M
anus
cript
55
TABLE 3 RC member’s reinforcement ratios.
RC walls ρmean (case studies 1 & 2) 0.26 %
ρmean(case study 3) 0.35 %
RC beams ρb,top = ρb,bot = ρb 0.90 %
ρmean: longitudinal reinforcement ratio in RC walls;
ρb,top = ρb,bot = ρb: top and bottom longitudinal reinforcement ratios (RC beams).
Dow
nloa
ded
by [
EPF
L B
iblio
thèq
ue]
at 1
4:46
24
Nov
embe
r 20
15
Accep
ted M
anus
cript
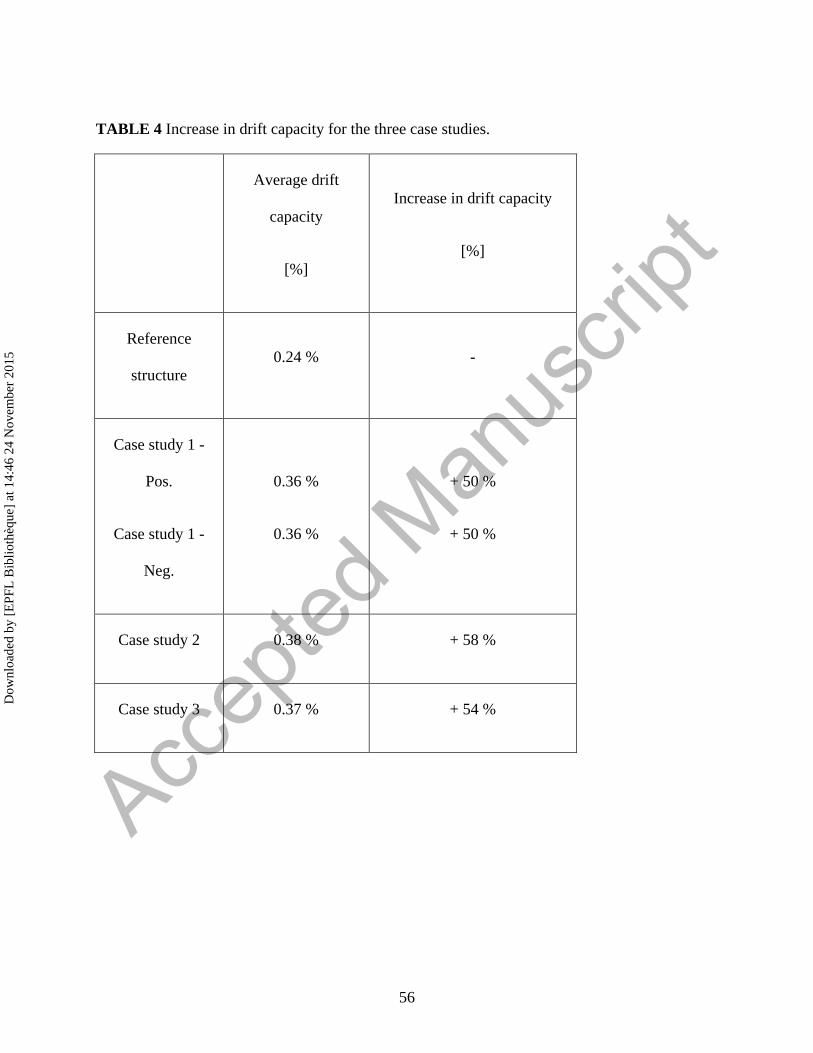
56
TABLE 4 Increase in drift capacity for the three case studies.
Average drift
capacity
[%]
Increase in drift capacity
[%]
Reference
structure 0.24 % -
Case study 1 -
Pos.
Case study 1 -
Neg.
0.36 %
0.36 %
+ 50 %
+ 50 %
Case study 2 0.38 % + 58 %
Case study 3 0.37 % + 54 %
Dow
nloa
ded
by [
EPF
L B
iblio
thèq
ue]
at 1
4:46
24
Nov
embe
r 20
15

Accep
ted M
anus
cript
57
TABLE 5 Definition of the bi-linear envelope of the equivalent SDOF.
Parameters for
the bi-linear
envelope
Proposed criteria
(i) Maximum
shear
F*b
F*b is determined so that the energy dissipated by the
equivalent SDOF and the actual SDOF systems are
equal (Fig. 13b)
(ii) Initial
stiffness
kin
kin is the secant stiffness at 0.70 Vmax/Γ (Fig. 13b)
(iii) Ultimate
drift
δu
δu corresponds to the displacement Δ*u divided the
height of the structure
Vmax: maximum shear force (actual MDOF response);
F*b: maximum shear force (equivalent SDOF system);
Dow
nloa
ded
by [
EPF
L B
iblio
thèq
ue]
at 1
4:46
24
Nov
embe
r 20
15

Accep
ted M
anus
cript
58
kin: initial stiffness (equivalent SDOF system);
δu: ultimate average drift (equivalent SDOF system);
Δ*u= Δmax,top /Γ: ultimate displacement (actual SDOF response);
Δmax,top: ultimate top displacement (actual MDOF response);
Γ: transformation factor calculated according to EN 1998-1 [2004].
Dow
nloa
ded
by [
EPF
L B
iblio
thèq
ue]
at 1
4:46
24
Nov
embe
r 20
15

Accep
ted M
anus
cript
59
TABLE 6 Comparison between the reference structure and the three case studies (except for the equivalent period T* and PGAmax,abs values of the reference structure taken as unit).
Reference
structure
Case
study 1-
Pos.
Case study 1-
Neg.
Case
study 2
Case
study 3
T* 0.38 s 0.38 s 0.34 s 0.41 s 0.35 s
PGAmax,abs 2.0 m/s2 3.0 m/s2 3.4 m/s2 2.8 m/s2 3.4 m/s2
Δ* y 1.00 1.45 1.15 1.31 1.28
Δ*u 1.00 1.50 1.50 1.58 1.52
μ* 1.00 1.04 1.30 1.21 1.19
F*b 1.00 1.42 1.45 1.50 2.02
PGAmax 1.00 1.50 1.70 1.38 1.68
T*: equivalent period (equivalent SDOF system);
PGAmax,abs: absolute maximum PGA the structures can sustain;
Dow
nloa
ded
by [
EPF
L B
iblio
thèq
ue]
at 1
4:46
24
Nov
embe
r 20
15
Accep
ted M
anus
cript
60
Δ*y: normalised yield displacement (equivalent SDOF system);
Δ*u: normalised ultimate displacement (equivalent SDOF system);
μ*: normalised system’s displacement ductility (equivalent SDOF
system);
F*b: normalised total base shear (equivalent SDOF system);
PGAmax: normalised maximum PGA the structures can sustain.
Dow
nloa
ded
by [
EPF
L B
iblio
thèq
ue]
at 1
4:46
24
Nov
embe
r 20
15