Embed Size (px)
Citation preview
Philipp Rode, Ricky Burdett and Joana Carla Soares Gonçalves Buildings: investing in energy and resource efficiency Book section
Original citation: Originally published in United Nations Environment Programme, (corp. ed.) Towards a green economy: pathways to sustainable development and poverty eradication. United Nations Environment Programme, pp. 331-373. © 2011 United Nations Environment Programme This version available at: http://eprints.lse.ac.uk/47895/ Available in LSE Research Online: May 2013 LSE has developed LSE Research Online so that users may access research output of the School. Copyright © and Moral Rights for the papers on this site are retained by the individual authors and/or other copyright owners. Users may download and/or print one copy of any article(s) in LSE Research Online to facilitate their private study or for non-commercial research. You may not engage in further distribution of the material or use it for any profit-making activities or any commercial gain. You may freely distribute the URL (http://eprints.lse.ac.uk) of the LSE Research Online website.
Buildings
iSto
ckph
oto/
Arp
ad B
ened
ek
BuildingsInvesting in energy and resource efficiency
Towards a green economy
AcknowledgementsChapter Coordinating Authors: Philipp Rode, Senior Research Fellow and Executive Director, LSE Cities, London School of Economics and Political Science, UK; Ricky Burdett, Professor of Urban Studies and Director, LSE Cities, London School of Economics and Political Science, UK; Joana Carla Soares Gonçalves, Professor, Departamento de Tecnologia da Arquitetura, University of São Paolo, Brazil.
Vera Weick and Moustapha Kamal Gueye (in the initial stages of the project) of UNEP managed the chapter, including the handling of peer reviews, interacting with the coordinating authors on revisions, conducting supplementary research and bringing the chapter to final production. Derek Eaton reviewed and edited the modelling section of the chapter. Sheng Fulai conducted preliminary editing of the chapter.
Contributing authors: Ludger Eltrop, Head of Department, Institute of Energy Economics and Rational Use of Energy, Dep. SEE, IER, University of Stuttgart, Germany/ Visiting Professor, University of Johannesburg, South Africa; Duygu Erten, City Director-Istanbul, Clinton Climate Initiative (CCI), Istanbul, Turkey; Jose Goldemberg, Professor, Universidade de São Paulo, Brazil; Andreas Koch, Researcher, European Institute for Energy Research (EIFER), Karlsruhe, Germany; Tom Paladino, President, LEED AP, PE, Paladino and Company; Brinda Viswanathan, Associate Professor, Madras School of Economics, Chennai, India; Gavin Blyth, LSE Cities, London School of Economics and Political Science, UK.
Additional authors: Sebastien Girard, European Institute for Energy Research (EIFER), Karlsruhe, Germany; Barbara Erwine, Senior Consultant, Paladino and Company, Seattle, U.S.A.; Klaus Bode, Founding Partner, BDSP Partnership of Environmental Engineers, London, UK; Sandro Tubertini, BDSP Partnership, London, UK; Ishwarya Balasubramanian, Madras School of Economics, Chennai, India; Marlies Härdtlein, Institute of Energy Economics and Rational Use of Energy, Dep. SEE, IER, University of Stuttgart, Germany; Till Jenssen, Institute of Energy Economics and Rational Use of Energy, Dep. SEE, IER, University of Stuttgart, Germany; Leonardo Marques Monteiro, PhD researcher, Departamento de Tecnologia da Arquitetura, University of São Paulo, Brazil; Roberta Consentino Kronca Mulfarth, Professor, Departamento de Tecnologia da Arquitetura, University of São
Paulo, Brazil; Renata Sandoli, Researcher, Departamento de Tecnologia da Arquitetura, University of São Paulo, Brazil; Etienne Cadestin, James Schofield, London School of Economics and Political Science, UK; Cornis van der Lugt (UNEP); Jacob Halcomb (UNEP SBCI); Peter Graham (UNEP SBCI); Andrea M. Bassi, John P. Ansah and Zhuohua Tan (Millennium Institute); Edmundo Werna (ILO); Abdul Saboor (ILO); and Ana Lucía Iturriza (ILO).
Project coordinators: Daniela Tanner and Gesine Kippenberg, LSE Cities, London School of Economics and Political Science, UK.
We would like to thank the many colleagues and individuals who commented on the Review Draft, including Laura Altinger (UNECE), Christopher Beaton (IISD), Karin Buhren (UN Habitat), Chia-Chin Cheng (UNEP Risoe), Matthew French (UN Habitat), Greg Kats (Capital e), Robert Kehew (UN Habitat), Kian Seng Ang (Building and Construction Authority Singapore), Christophe Lalande (UN Habitat), Robert McGowan, Donna McIntire (UNEP), Kevin Mo (The Energy Foundation), Jeffery Kwei Sung Neng (Building and Construction Authority Singapore), Synnove Lyssand Sandberg, Niclas Svenningsen (UNEP), Mark Swilling (University of Stellenbosch, South Africa), Tan Tian Chong (Building and Construction Authority Singapore), Kaarin Taipale (Marrakech Task Force on Sustainable Buildings and Construction), Oesha Thakoerdin (Building and Construction Authority Singapore), Benjamin Henry Towell (Building and Construction Authority of Singapore), and the following members of the UNEP FI Property Working Group and the UNEP Sustainable Buildings & Climate Initiative (SBCI) who commented in their personal capacity: members of UNEP FI Property Working Group: Paul McNamara (PRUPIM), Blaise Debordes (Caisse de Dépôts), and Preston R. Sargent (Kennedy Associates); and members of UNEP SBCI: Maria Atkinson (Lend Lease Corporation, Australia), Robert Beauregard (Canada Wood), Caroline Frenette (Canada Wood), Paravasthu Jagannathan (EHS, UAE), Sylvain Labbé (Canada Wood), Rodney Milford (CIDB, South Africa), Dominik Oetiker (SIKA, Switzerland), and Sarah Turner (Lend Lease Corporation, Australia).
We also would like to thank the individuals who assisted in the research and/or editing process, including Omer Cavusoglu (LSE), Miranda Iossifidis (LSE), Hanif Kara (AKT), Irina Kraicheva (LSE), Emma Rees (LSE), Guido Robazza (LSE), Liz Rusbridger (LSE), and Natza Tesfay (LSE).
Copyright © United Nations Environment Programme, 2011Version -- 02.11.2011
332
ContentsList of acronyms 335
Key messages 336
1 Introduction 3381.1 The aim of this chapter . . . . . . . . . . . . . . . . . . . . . . . . . . . . . . . . . . . . . . . . . . . . . . . . . . . . . . . . . . . . . . . . . . . . . . . 3381.2 Scope and definition . . . . . . . . . . . . . . . . . . . . . . . . . . . . . . . . . . . . . . . . . . . . . . . . . . . . . . . . . . . . . . . . . . . . . . . . . 3381.3 Structure of the chapter . . . . . . . . . . . . . . . . . . . . . . . . . . . . . . . . . . . . . . . . . . . . . . . . . . . . . . . . . . . . . . . . . . . . . . 338
2 Challenges and opportunities 3392.1 Challenges . . . . . . . . . . . . . . . . . . . . . . . . . . . . . . . . . . . . . . . . . . . . . . . . . . . . . . . . . . . . . . . . . . . . . . . . . . . . . . . . . . . 3392.2 Opportunities . . . . . . . . . . . . . . . . . . . . . . . . . . . . . . . . . . . . . . . . . . . . . . . . . . . . . . . . . . . . . . . . . . . . . . . . . . . . . . . . 341
3 The case for investment in green buildings 3473.1 Investment needs . . . . . . . . . . . . . . . . . . . . . . . . . . . . . . . . . . . . . . . . . . . . . . . . . . . . . . . . . . . . . . . . . . . . . . . . . . . . 3473.2 Measuring the costs and benefits . . . . . . . . . . . . . . . . . . . . . . . . . . . . . . . . . . . . . . . . . . . . . . . . . . . . . . . . . . . . . 3493.3 Economic, environmental and social impacts. . . . . . . . . . . . . . . . . . . . . . . . . . . . . . . . . . . . . . . . . . . . . . . . . . 3503.4 Investment scenarios for increased energy efficiency in buildings . . . . . . . . . . . . . . . . . . . . . . . . . . . . . . 358
4 Enabling conditions and policy instruments 3614.1 Barriers to green buildings. . . . . . . . . . . . . . . . . . . . . . . . . . . . . . . . . . . . . . . . . . . . . . . . . . . . . . . . . . . . . . . . . . . . 3614.2 Policy instruments and tools . . . . . . . . . . . . . . . . . . . . . . . . . . . . . . . . . . . . . . . . . . . . . . . . . . . . . . . . . . . . . . . . . . 362
5 Conclusions 369
References 371
Buildings
333
Towards a green economy
List of figuresFigure 1: Commercial and residential floor space in China, the EU, Japan and the USA (2003) . . . . . . . . . . 340Figure 2: IPCC projections of CO2 mitigation potential in 2030 . . . . . . . . . . . . . . . . . . . . . . . . . . . . . . . . . . . . . . . . 342Figure 3: Investment potential for new construction and building retrofits relative to the current sustainability level of building construction in representative countries . . . . . . . . . . . . . . . . . . . . . . . . . . . . . . 345Figure 4: Fuel consumption and greenhouse gas emissions in the building sector: current, reference and mitigation scenarios . . . . . . . . . . . . . . . . . . . . . . . . . . . . . . . . . . . . . . . . . . . . . . . . . . . . . . . . . . . . . . . . . . . . . . . . . . . 352Figure 5: Total power demand per year in buildings sector 2010–2050. . . . . . . . . . . . . . . . . . . . . . . . . . . . . . . . 358Figure 6 : Total CO2 emissions per year in buildings sector 2010–2050 . . . . . . . . . . . . . . . . . . . . . . . . . . . . . . . . 358
List of tablesTable 1: Projected CO2 emissions from buildings to 2030 . . . . . . . . . . . . . . . . . . . . . . . . . . . . . . . . . . . . . . . . . . . . . 341Table 2: Summary of the major opportunities for green buildings in different sectors . . . . . . . . . . . . . . . . . 345Table 3: The economics of global building transformation. . . . . . . . . . . . . . . . . . . . . . . . . . . . . . . . . . . . . . . . . . . . 347Table 4: Financial benefits of green buildings (US$ per sq.m) . . . . . . . . . . . . . . . . . . . . . . . . . . . . . . . . . . . . . . . . . 355Table 5: Twenty-year net economic impact of a US$ 1 million investment in green building improvements: Illustrative examples . . . . . . . . . . . . . . . . . . . . . . . . . . . . . . . . . . . . . . . . . . . . . . . . . . . . . . . . . . . . . . . . 357Table 6: Emissions intensity in the GER model simulations. . . . . . . . . . . . . . . . . . . . . . . . . . . . . . . . . . . . . . . . . . . . 359
List of boxesBox 1: Life cycle cost for a commercial office in a tropical climate . . . . . . . . . . . . . . . . . . . . . . . . . . . . . . . . . . . . . 348Box 2: Residential construction in China . . . . . . . . . . . . . . . . . . . . . . . . . . . . . . . . . . . . . . . . . . . . . . . . . . . . . . . . . . . . . 350Box 3: Retrofitting existing office buildings in the USA . . . . . . . . . . . . . . . . . . . . . . . . . . . . . . . . . . . . . . . . . . . . . . . 351Box 4: Water savings in a 4-person single house . . . . . . . . . . . . . . . . . . . . . . . . . . . . . . . . . . . . . . . . . . . . . . . . . . . . . 353Box 5: The social dimension of green buildings: implications for decent work and poverty reduction . . . . 356Box 6: The rebound effect . . . . . . . . . . . . . . . . . . . . . . . . . . . . . . . . . . . . . . . . . . . . . . . . . . . . . . . . . . . . . . . . . . . . . . . . . . 359Box 7: Reliable measurement and accounting . . . . . . . . . . . . . . . . . . . . . . . . . . . . . . . . . . . . . . . . . . . . . . . . . . . . . . . 363Box 8: Tools to promote the greening of buildings . . . . . . . . . . . . . . . . . . . . . . . . . . . . . . . . . . . . . . . . . . . . . . . . . . . 366
334
Buildings
List of acronymsADB Asian Development BankADEME French Environment and Energy
Management AgencyBAU Business-as-usualBCA Building and Construction Authority
(Singapore)CDM Clean Development MechanismCEDEFOP European Centre for the Development
of Vocational TrainingCEU Central European UniversityCFL Compact fluorescent lampCHP Combined heat and power CO2 Carbon dioxideCRC Carbon Reduction Commitment CSIR Council of Scientific and Industrial
Research DVD Digital versatile discEC European CommissionEEFS Energy Efficiency Co-Financing
Scheme EPBD Energy Performance of Buildings
Directive (EU)EPC Energy performance contracting ESCO Energy service companyEU European UnionFIDE Fund for Electric Energy Savings
(Mexico)G2 Green Scenario 2GBC Green Building CouncilGDP Gross Domestic ProductGER Green Economy ReportGHG Greenhouse gasGRIHA Green Rating for Integrated Habitat
AssessmentHVAC Heating ventilation and air
conditioningICT Information & Communication
TechnologyIEA International Energy AgencyILO International Labour OrganizationINFONAVIT National Workers’ Housing Fund
Institute (Mexico)IOE International Organisation of
Employers
IPCC Intergovernmental Panel on Climate Change
ITUC International Trade Union Confederation
KfW German Development BankLCA Life-cycle assessment LED Light emitting diodeLEED Leadership in Energy and
Environmental DesignLPG Liquefied petroleum gasLTCR Lost time case ratesMEPS Minimum efficiency performance
standards MURE Mesures d’Utilisation Rationnelle de
l’EnergieNPV Net Present ValueO&M Operation and managementOECD Organisation for Economic Co-
operation and DevelopmentOSHA Occupational Safety and Health
Administration (USA)PV Photovoltaic PwC PricewaterhouseCoopersRIRs Recordable incident ratesSB Sustainable BuildingsSEEP Serbian Energy Efficiency Programme TBL Triple bottom line TCO Total cost of ownershipUN DESA United Nations Department of
Economic and Social AffairsUN Habitat United Nations Human Settlements
ProgrammeUNEP United Nations Environment
ProgrammeUNEP SBCI United Nations Environment
Programme Sustainable Buildings and Climate Initiative
UNFCCC United Nations Framework Convention on Climate Change
WBCSD World Business Council for Sustainable Development
WHO World Health Organization
335

Towards a green economy
Key messages
1. The Buildings sector of today has an oversized ecological footprint. The buildings sector is the single largest contributor to global greenhouse gas emissions (GHG), with approximately one third of global energy end use taking place within buildings. Furthermore, the construction sector is responsible for more than a third of global resource consumption, including 12 per cent of all fresh water use and significantly contributes to the generation of solid waste, estimated at 40 per cent of the total volume. Therefore, the building sector is central to any attempt to use resources more efficiently.
2. Constructing new green buildings and retrofitting existing energy- and resource intensive buildings stock can achieve significant savings. There are significant opportunities to improve energy-efficiency in buildings, and the sector has the greatest potential, out of those covered in this report, to reduce global GHG emissions. Various projections indicate that investments, ranging from US$ 300 billion to US$ 1 trillion (depending on assumptions used) per year to 2050, can achieve savings of about one-third in energy consumption in buildings worldwide. In addition, these investments can significantly contribute to the reduction in CO2 emissions needed to attain the benchmark 450 ppm concentration of GHGs. Emission reductions through increased energy efficiency in buildings can be achieved at an average abatement cost of -US$ 35 per tonne, reflecting energy cost savings, compared to -US$ 10 per tonne costs in the transport sector or positive abatement costs on the power sector of US$ 20 per tonne.
3. Greening buildings also brings significant health and productivity benefits. Greening buildings can also contribute significantly to health, liveability and productivity improvements. The increased productivity of workers in green buildings can yield savings higher than those achieved from energy-efficiency. In residential buildings in many developing countries, indoor pollution from poorly-combusted solid fuels (e.g. coal or biomass), combined with poor ventilation, are a major cause of serious illness and premature death. Lower respiratory infections such as pneumonia and tuberculosis linked to indoor pollution are estimated to cause about 11 per cent of human deaths globally each year. Women and children tend to be most at risk due to their daily exposure. Improved access to water and basic sanitation are other significant benefits that come with green building programmes.
4. Greening the building sector can lead to an increase in jobs. Investments in improved energy-efficiency in buildings could generate additional employment in developed countries where there is little growth in building stock. It is estimated that every US$ 1 million invested in building efficiency
336
Buildings
retrofits creates ten to 14 direct jobs and three to four indirect jobs. If the demand for new buildings that exists in developing countries is considered, the potential to increase the number of green jobs in the sector is still higher. Various studies point to job creation through different types of activities, such as new construction and retrofitting, production of resource-efficient materials and appliances, the expansion of renewable energy sources and services such as recycling and waste management. Greening the building industry also provides an opportunity to engage the informal sector and improve working conditions across the industry, by implementing training programmes targeting new skill requirements and improving inspection approaches.
5. Developing countries have the opportunity to lay the foundation of energy-efficient building stocks for decades to come. Significant new construction is expected in the developing world in order to provide adequate housing for over 500 million people, while providing access to electricity for some 1.5 billion people. Urbanisation and economic growth in emerging economies also point to the rapid growth of new building stock. In developing countries, taking into account sustainable building considerations at the time of design and construction makes good economic sense. Green retrofitting at a later stage invariably carries higher costs, both financially and environmentally, than integrating sustainability considerations already at the early stages of design and construction. For developed countries, which account for the majority of the existing building stock, the priority is to put in place measures and incentives that will enable large-scale investments in retrofitting programmes.
6. The role of public policy and leadership by example is vital in triggering the greening of the building sector. A life-cycle approach is required covering the building design, the manufacturing of material supplies, the construction process, buildings operation and maintenance as well as the disposal, recycling and reuse of building, construction and demolition waste. Considering, in particular, the hidden costs and market failures that characterise the building industry, regulatory and control measures are likely to be the most effective and cost-efficient in bringing about a green transformation of the sector. These need to be combined with other pricing instruments for greater impact, given realities such as the level of development of the local market and household income-levels. Additionally, government-owned buildings such as public schools, hospitals and social housing units are ideal locations to begin implementing greener building policies, including green public procurement. At the same time, the role of progressive private sector actors organised, for example, through Green Building Councils can drive the transition to lower carbon and more resource-efficient buildings.
337
Towards a green economy
1 Introduction
1 1 The aim of this chapter
This chapter makes a case – focusing on economic arguments – for greening the building sector. It also provides guidance on policies and instruments that can bring about this transformation. The broader goal is to enable public- and private-sector actors to seize environmental and economic opportunities, such as the efficient use of energy, water and other resources, to improve health, boost productivity and create jobs that reflect decent work and reduce poverty.
1 2 Scope and definition
This chapter encompasses both new construction and the retrofitting of existing buildings, with the focus on urban areas, which are expanding and now home to more than half the world’s population. The chapter covers an environmental and socio-economic agenda, with special consideration given to climate, health and employment. The analysis of resource use focuses mainly on energy, given its importance to the building sector and the relative abundance of data at the global scale. While efficiency in the use of water and land as well as recycling and waste is considered, covering a comprehensive environmental agenda of all life-cycle impacts is beyond the scope of this analysis.
According to the International Energy Agency (Laustsen 2008), green buildings are characterised by increased energy efficiency, reduced water and material consumption, and improved health and environment. The International Organization for Standardization’s definition of sustainable buildings combines a minimum
adverse environmental impact with economic and social aspects across various geographic scales. In this chapter, the concept of green buildings is similarly broad, including not only the environmental dimensions, but also economic dimensions (such as energy savings, the cost of greening, payback periods, productivity and job creation) and social dimensions (such as indoor pollution and health).
1 3 Structure of the chapter
This chapter has three main parts. Firstly, it introduces the sector and highlights key challenges and opportunities it faces today. Developmental, energy and environmental challenges are highlighted. The section notes trends in population growth and urbanisation, drivers for growth in the industry, and its resource use and environmental impact. Secondly, the next section sets out the case for investment in green buildings. This starts with a description of investment needs, cost benefit analysis and efficiencies to be gained. An overview of benefits covers energy and water, waste and materials, productivity and health, as well as job creation. Special consideration is given to the policy target of reducing GHG emissions from the building sector, based on 450 parts per million (ppm) as climate bench mark used by the International Energy Agency (IEA) in its climate change mitigation scenarios. Modelling by the Millennium Institute provides a green investment scenario for the sector, quantifying the implications of going beyond business-as-usual (BAU). Thirdly, the chapter gives an overview of policy instruments and tools that can be used by Government or regulatory institutions at different levels to advance green building.
338
Buildings
2 Challenges and opportunities
2 1 Challenges
The last 40 years have seen much experimentation and significant progress with low-energy building design strategies and technologies. However, in most countries, green buildings are still at a nascent phase of development. Yet they are expected to become the norm in future. Experimentation with net-zero-carbon buildings, passive houses and energy-plus buildings are emerging worldwide. The main challenges facing green buildings are discussed with special reference to the sector’s significant use of resources and emissions of CO2. This covers both existing building stock and the projected growth of new construction. A key component of green buildings is related to their location and how they interact with other components of urban and regional systems, which is covered in the Cities chapter.
Sizing the building sectorDriven by population growth and urbanisation, the building sector itself is a significant contributor to economic growth, both globally and at the national level. Globally, it is estimated to be worth US$ 7.5 trillion per year or approximately 10 per cent of global GDP (Betts and Farrell 2009) and the construction sector employs more than 111 million people (ILO 2001). At the national level, the sector generates 5-10 per cent of employment (UNEP SBCI 2007a).
There are important differences between developed and developing countries in both the current building stock and projected building-sector growth. Developed country populations are broadly more urbanised and more economically reliant on the service sector than on industry or agriculture. They also have higher household incomes than developing country populations. Developed countries currently account for the majority of the world’s existing building-related energy demand and CO2 emissions.
This picture is changing rapidly. Projected economic growth is modest and projected population growth flat or even negative in Western Europe, Russia and Japan. Thus building-related energy demand and CO2 emissions in these countries will see little growth in the coming decades. There are some exceptions among richer countries such as the United States of America, where higher fertility and immigration rates are expected. In contrast, developing countries are fast-growing, rapidly
urbanising and are projected to add 2.3 billion to global population over the coming four decades (UN DESA 2009). Of the 9 billion people predicted to live on Earth in 2050, 70 per cent are expected to live in urban areas (UN-HABITAT 2010).
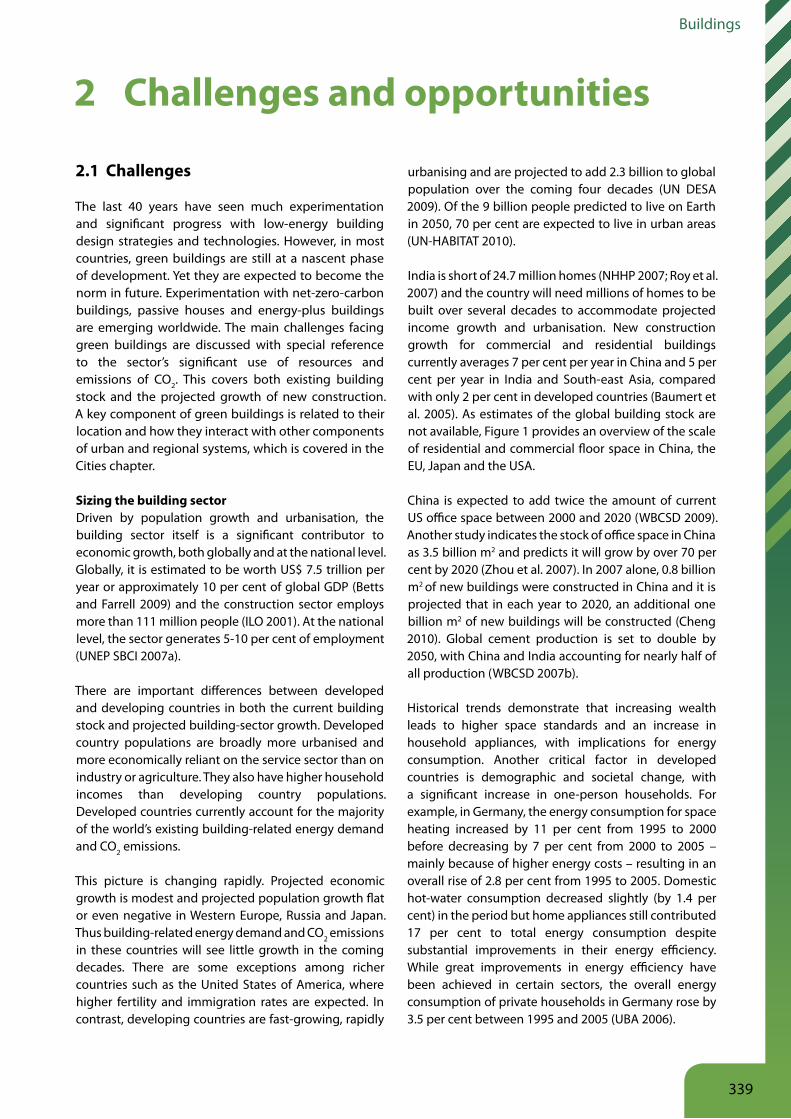
India is short of 24.7 million homes (NHHP 2007; Roy et al. 2007) and the country will need millions of homes to be built over several decades to accommodate projected income growth and urbanisation. New construction growth for commercial and residential buildings currently averages 7 per cent per year in China and 5 per cent per year in India and South-east Asia, compared with only 2 per cent in developed countries (Baumert et al. 2005). As estimates of the global building stock are not available, Figure 1 provides an overview of the scale of residential and commercial floor space in China, the EU, Japan and the USA.
China is expected to add twice the amount of current US office space between 2000 and 2020 (WBCSD 2009). Another study indicates the stock of office space in China as 3.5 billion m2 and predicts it will grow by over 70 per cent by 2020 (Zhou et al. 2007). In 2007 alone, 0.8 billion m2 of new buildings were constructed in China and it is projected that in each year to 2020, an additional one billion m2 of new buildings will be constructed (Cheng 2010). Global cement production is set to double by 2050, with China and India accounting for nearly half of all production (WBCSD 2007b).
Historical trends demonstrate that increasing wealth leads to higher space standards and an increase in household appliances, with implications for energy consumption. Another critical factor in developed countries is demographic and societal change, with a significant increase in one-person households. For example, in Germany, the energy consumption for space heating increased by 11 per cent from 1995 to 2000 before decreasing by 7 per cent from 2000 to 2005 – mainly because of higher energy costs – resulting in an overall rise of 2.8 per cent from 1995 to 2005. Domestic hot-water consumption decreased slightly (by 1.4 per cent) in the period but home appliances still contributed 17 per cent to total energy consumption despite substantial improvements in their energy efficiency. While great improvements in energy efficiency have been achieved in certain sectors, the overall energy consumption of private households in Germany rose by 3.5 per cent between 1995 and 2005 (UBA 2006).
339
Towards a green economy
Developmental challengesDeveloping countries are urbanising at a rate two to three times faster than developed countries, resulting in massive informal settlements and slums (UNEP, ILO, IOE, ITUC 2008). In the majority of the developing world, the scale of informal and low-cost housing is vast. In some cities, the informal city is bigger than the formal city. In Indonesia, an estimated 70-80 per cent of housing construction is informal (Malhotra 2003). In Brazil, more than half of all low-cost homes are built by the informal sector (UNEP SBCI 2010b).
In this context, providing affordable green housing for the poor is a considerable challenge when so many already face major economic barriers to afford conventional housing. Analysis of social housing, however, does not lead to clear results as to whether green social housing is more expensive at the point of construction; environmental design features may be but do not have to be, more expensive than the conventional features. For example, a detached social housing project Casa Alvorada (48.50 m2) in the city of Porto Alegre, Rio Grande do Sul, in Brazil, was 12 per cent more expensive per square metre than the typical housing solution of similar size implemented by the municipality, but still 18 per cent cheaper per square metre compared to another municipal typical model of about half of the floor area per unit (23 m2) (Sattler 2007). Further, if the environmental features are more expensive at the point of construction, they may yield benefits in terms of savings on water and energy during the occupation of the building.
Poverty and housing raises other unique challenges for sustainable building and construction in developing societies. Slums, be they informal settlements or run-down and overcrowded housing estates, are associated with social and environmental challenges including
lack of access to electricity, fresh water, health-care and effective waste management. Marginal locations poorly connected to public transport services are an additional obstacle in that they constrain access to employment opportunities (see Cities chapter).
Greening of buildings can be one of a series of strategies that improve access to basic services and reduce vulnerability and, more broadly, contribute to better living conditions of the poor. Facing this challenge, India, for example, is experimenting with three approaches, namely vernacular building (which focuses on local solutions and traditional knowledge), green building (supported by the internationally recognised Indian GRIHA rating systems, developed by TERI) and; energy- efficient building (focused on energy-use in commercial buildings) (UNEP SBCI 2010a). New approaches can contribute to providing electricity to the 1.5 billion people in the developing world currently living without it (IEA 2010a), and to lifting 100 million people from slum conditions and providing them with safe water and sanitation – a distinct Millennium Development Goal.
Cleaner and more efficient energy use will be critical to avoid any possible lock-in effect for poorer segments of society. Savings on energy costs can also free resources for investment in other basic needs. A recent study by the CSIR for the ILO (Van Wyk et al. 2009) provides several examples of energy-related projects in Africa: the installation of solar PV systems on schools, clinics and community centres in Zambia, the introduction of solar lighting and electricity into homes by local solar entrepreneurs in Malawi, the electrification of 60 health centres using solar energy in Mozambique, and the construction of windmills and solar-powered water systems as well as 10,000 improved cooking stoves for more than 250,000 people in Somalia.
China EU-15 Japan US
Floo
r spa
ce (b
illio
n m
2 ) 40
35
30
25
20
15
10
5
0
Commercial Residential
China EU-15 Japan US
Floo
r spa
ce p
er p
erso
n (m
2 ) 100
80
60
40
20
0
Commercial Residential
Figure 1: Commercial and residential floor space in China, the EU, Japan and the USA (2003)Source: WBCSD (2011)
340

Buildings
Some aspects of improved well-being (e.g. health, water, sanitation and energy access) can be linked to building design and technology. Yet developmental challenges have to be seen in a broader context and go beyond the construction of housing to consider social and economic inclusion and the link to other urban activities (see Cities chapter). The poverty relevance of green buildings in this context is closely linked to the impacts of electrification programmes (see discussion in the Energy chapter) as well as the impacts of city structure and transport systems on poverty (see Transport and Cities chapters).
Energy and environmental challengesWhether existing building stock or projected growth of building stock, this sector is already the single-largest contributor to global greenhouse gas emissions. Approximately one-third of global energy end-use takes place within buildings (IEA 2010a). Nearly 60 per cent of the world’s electricity is consumed in residential and commercial buildings, although this usage varies widely according to geographical location, climate and consumption patterns (IEA 2009b). For developed countries located in cooler regions of the world, space heating, on average, represents 60 per cent of residential energy consumption, followed by water heating at 18 per cent (UNEP SBCI 2007a).
Projections for 2030 based on IPCC scenarios suggest CO2 emissions from buildings will continue to account for around one-third of total CO2 emissions. Table 1 summarises these projections for CO2 emissions under two scenarios (IPCC 2007). In the high-growth scenario, the largest contribution is from developing countries while in the low-growth scenario the largest share is from North America and developing Asia, which includes China and India. If per-capita CO2 emissions are considered, both scenarios suggest that by 2030 the greater share of emissions will still be from OECD countries.
GHG emissions are the single most important negative externality from excessive fossil fuel consumption but the burning of fossil fuels also causes other externalities such as air pollution and health problems. Approximately 3 billion people world-wide rely on bio-mass and coal to meet cooking and other energy needs (IPCC 2007). Indoor air pollution in residential buildings in developing
countries from poorly combusted solid fuels combined with poor ventilation is a major cause of serious illness and premature death. Lung infections such as pneumonia and tuberculosis linked to indoor pollution are estimated to cause about 11 per cent of all human deaths globally each year (UNEP SBCI 2010b). The WHO (2009) estimates that every year about 1.3 million people (mostly women and children) die prematurely owing to indoor air pollution from biomass. Estimates by the WHO (2009) further attribute 76 per cent of all lung cancer deaths to the indoor use of solid fuels.
Apart from energy use and emissions, the building sector is responsible for more than a third of global resource consumption annually, including 12 per cent of all fresh water use. The manufacture of building materials consumes about 10 per cent of the global energy supply. Building construction and demolition waste contributes about 40 per cent of solid waste streams in developed countries, with most waste associated with the demolition phase (UNEP SBCI 2010b).
Data challengesWhen considering the environmental credentials of buildings, the true measure of their performance only becomes evident with occupation, given the impact of factors such as behaviour (cultural habits, environmental expectations and life-style), climatic changes and particularities of the control of technical systems in buildings. The only realistic way to rate the energy efficiency of a building is by measuring how much energy has been consumed during a period of occupation, ideally, a minimum of two years. A dearth of accurate data is hampering our understanding of impacts such as occupation, design and technological components.
2 2 Opportunities
The major opportunities for greening the building sector are the relatively low cost of the process, be it retrofitting or new construction, the availability of technologies, and the green evolution of energy supply and demand. These trends are encouraging the effort to transform the building sector.
Table 1: Projected CO2 emissions from buildings to 2030Source: IPCC (2007)
High-growth scenario (A1) Low-growth scenario (B2)
CO2 emissions (in GtCO2) 8.6 → 15.6 (2004) (2030)
8.6 → 11.4(2004) (2030)
Largest share from Developing Asia, Middle East/North Africa, Latin America, sub-Saharan Africa
North America anddeveloping Asia
Average annual CO2 emissions growth rate (2004-2030) 2.4% 1.5%
341
Towards a green economy
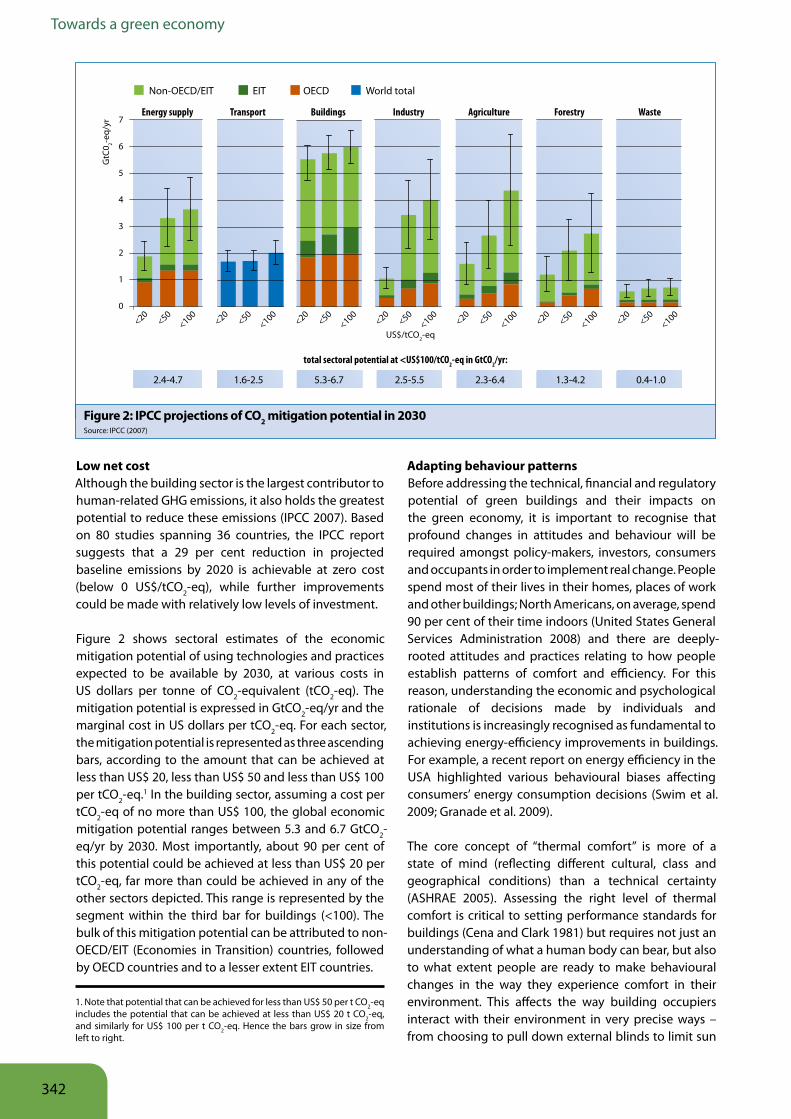
Low net cost Although the building sector is the largest contributor to human-related GHG emissions, it also holds the greatest potential to reduce these emissions (IPCC 2007). Based on 80 studies spanning 36 countries, the IPCC report suggests that a 29 per cent reduction in projected baseline emissions by 2020 is achievable at zero cost (below 0 US$/tCO2-eq), while further improvements could be made with relatively low levels of investment.
Figure 2 shows sectoral estimates of the economic mitigation potential of using technologies and practices expected to be available by 2030, at various costs in US dollars per tonne of CO2-equivalent (tCO2-eq). The mitigation potential is expressed in GtCO2-eq/yr and the marginal cost in US dollars per tCO2-eq. For each sector, the mitigation potential is represented as three ascending bars, according to the amount that can be achieved at less than US$ 20, less than US$ 50 and less than US$ 100 per tCO2-eq.1 In the building sector, assuming a cost per tCO2-eq of no more than US$ 100, the global economic mitigation potential ranges between 5.3 and 6.7 GtCO2-eq/yr by 2030. Most importantly, about 90 per cent of this potential could be achieved at less than US$ 20 per tCO2-eq, far more than could be achieved in any of the other sectors depicted. This range is represented by the segment within the third bar for buildings (<100). The bulk of this mitigation potential can be attributed to non-OECD/EIT (Economies in Transition) countries, followed by OECD countries and to a lesser extent EIT countries.
Adapting behaviour patternsBefore addressing the technical, financial and regulatory potential of green buildings and their impacts on the green economy, it is important to recognise that profound changes in attitudes and behaviour will be required amongst policy-makers, investors, consumers and occupants in order to implement real change. People spend most of their lives in their homes, places of work and other buildings; North Americans, on average, spend 90 per cent of their time indoors (United States General Services Administration 2008) and there are deeply-rooted attitudes and practices relating to how people establish patterns of comfort and efficiency. For this reason, understanding the economic and psychological rationale of decisions made by individuals and institutions is increasingly recognised as fundamental to achieving energy-efficiency improvements in buildings. For example, a recent report on energy efficiency in the USA highlighted various behavioural biases affecting consumers’ energy consumption decisions (Swim et al. 2009; Granade et al. 2009).
The core concept of “thermal comfort” is more of a state of mind (reflecting different cultural, class and geographical conditions) than a technical certainty (ASHRAE 2005). Assessing the right level of thermal comfort is critical to setting performance standards for buildings (Cena and Clark 1981) but requires not just an understanding of what a human body can bear, but also to what extent people are ready to make behavioural changes in the way they experience comfort in their environment. This affects the way building occupiers interact with their environment in very precise ways – from choosing to pull down external blinds to limit sun
1. Note that potential that can be achieved for less than US$ 50 per t CO2-eq includes the potential that can be achieved at less than US$ 20 t CO2-eq, and similarly for US$ 100 per t CO2-eq. Hence the bars grow in size from left to right.
GtC
0 2-eq/
yr 7
6
5
4
3
2
1
0
<20<50
<100<20
<50<100
<20<50
<100<20
<50<100
<20<50
<100<20
<50<100
<20<50
<100
Energy supply Transport Buildings Industry Agriculture Forestry Waste
2.4-4.7 1.6-2.5 5.3-6.7 2.5-5.5 2.3-6.4 1.3-4.2 0.4-1.0
Non-OECD/EIT EIT OECD World total
total sectoral potential at <US$100/tCO2-eq in GtCO2/yr:
US$/tCO2-eq
Figure 2: IPCC projections of CO2 mitigation potential in 2030Source: IPCC (2007)
342
Buildings
penetration at certain times of day (rather than switching on the air conditioning) to putting on a sweater when the external temperature drops (rather than turning up the thermostat). On balance, green buildings require a more proactive engagement between occupier and the environment, which reflects the degree of “active” or “passive” environmental design techniques available in individual buildings, to which the report now turns.
Design and technologyThe greatest opportunities to achieve a higher environmental performance for buildings can be found in the early stages of their design. An integrated design methodology of green buildings combines environmental principles and technological inputs at various design stages. It requires a multidisciplinary approach and broadens conventional building design by including rigorous assessment procedures to comply with performance targets (Baker and Steemers 1999). Designing buildings based on environmental considerations implies continuous feedback between different design components, as decisions regarding building form, orientation, components, other architectural aspects as well as building systems are entirely integrated.
There are two basic paradigms of green building. The first is based on the concept of “passive” design where buildings respond to their local site context by using natural elements (such as air-flow and sunlight) to limit the effect of external conditions on the internal environment. Many traditional buildings with thick walls and small windows in hot climates, or with natural through-ventilation with courtyards and terraces in humid areas, belong to this category. Passive design aims to provide a comfortable environment while eliminating or reducing the need for space heating, cooling, ventilation or artificial lighting. The second paradigm is based on a more “active” approach that uses newer technology and state-of-the-art building management systems to reduce the energy load of buildings. Solar screens, lighting scoops, environmental flues, photovoltaic cells (PV), wind turbines and other devices are found in most state-of-the-art high-tech buildings. Both paradigms can be applied to new buildings as well as retrofitting existing building stock.
Many passive design techniques are finding their way into a new generation of building designs across the developed world, while new forms of green energy generation are being integrated in building projects in the developing world (Baker and Steemers 1999; Hawkes 1996; Herzog 1996). The field is littered with examples of how both passive design and technology have successfully reduced the energy footprint of buildings. A recent study of 5,375 commercial buildings in the USA showed that in new buildings the use of energy-efficient
lighting, heating, ventilation, air conditioning and shading can achieve a 64 per cent reduction in energy use (Griffith et al. 2006). In the UK, energy consumption guidelines indicate that the introduction of natural ventilation can achieve 55-60 per cent reduction in energy consumption in office buildings, compared with fully air-conditioned and fully glazed office buildings (CIBSE 2004).
Greater attention is now given to the impact of sustainable environmental design solutions on the running costs of buildings and how much energy is embodied in construction materials and processes. Increasingly, life-cycle assessments (LCA)2 are being applied, which include not only operation and maintenance, but also the manufacture of construction materials (McDonough and Braungart 2002). In addition, a new generation of building guidance is focussing on the total energy costs of buildings, from the design stage through to completion, including considerations about their recyclability (Anderson et al. 2009; Hammond and Jones 2008).
Beyond the fabric and construction of the building, a more holistic approach to the design of buildings and their use also requires consideration of all energy-related components, including appliances and equipment used in buildings. Their relative energy use varies from country to country, based on climatic and cultural differences. The following listing of appliances and equipment by residential and public or commercial categories demonstrates the range of supplier industries involved.
Residential building sector Office and commercial building sector
• Space heating and cooling• Mechanical ventilation• Hot water systems• Appliances (incl. cooking, washing,
refrigeration, entertainment and cleaning)
• Indoor lighting
• Space heating, cooling and ventila-tion, air conditioning (HVAC)
• Indoor lighting• Outdoor lighting • Office equipment• Servers and data centres
In commercial buildings, office equipment comprises the fastest-growing area of energy consumption. In residential buildings world-wide, a growing proportion of energy consumption is associated with household appliances, including televisions, DVD players and home computers. Implementing the best available technologies can reduce their energy consumption by
2. Life-Cycle Assessment (LCA) is a tool devised for evaluating the environmental impact of a product, process or a service across its life cycle, also referred to as the “environmental footprint”. All inputs and outputs of material, energy, water and waste over the entire product life cycle and their relative impacts are accounted for, including the extraction of raw materials, processing, manufacturing, transport, use and disposal. The main objective of a LCA is to compare the impacts of several alternative processes in order to chose the least damaging one.
343
Towards a green economy
more than 50 per cent. The household-appliance share of energy consumption in residential homes vary from 21 per cent in China in 2000, to 25 per cent in the EU in 2004 and 27 per cent in the USA in 2005 (von Weizsäcker et al. 2009).
Managing energy supply and demandEnergy use and emission patterns are affected by a building’s environmental performance and its energy load (on the demand side) or by the extent of its use of green sources of energy (on the supply side). Recent developments in design and technology offer significant potential to change the way energy demand and supply is managed in buildings.
On the demand side, there is growing evidence that energy consumption can be reduced by modifying the specification of technologies, appliances and fittings within buildings – in addition to designing the built form in a more sustainable way. Leading Information & Communication Technology (ICT) Infrastructure firms produce software for command centres, which can actively help to reduce a building’s carbon footprint by monitoring and controlling all components of a building’s energy use, from heating/cooling demand, to lighting and printing.
But the pattern of energy use in buildings varies considerably among regions and countries according to geographical location, climate, consumption patterns and state of development and urbanisation (IPCC 2007). Space heating is a dominant component of energy use in Europe and northern China, while water heating is of great significance in Japan (WBCSD 2009). In these areas, effective means of controlling energy demand and emissions include the improvement of heat-recovery systems, optimising daylight penetration with shallower buildings, substituting incandescent lighting with more energy-efficient systems such as CFL and LED lamps and introducing solar shading to reduce overheating.3 In addition to these design solutions, smart metering, which provides utility customers with information in real-time about their domestic energy consumption, has also proved effective at reducing overall household electricity consumption, with a 5-10 per cent drop recorded in private households in Germany and the UK (Luhmann 2007). In contrast, buildings located in warmer regions do not usually require space heating and require less hot water. Energy needs in low-income rural communities are largely determined by cooking (70 per cent) and other household activities (15 per cent) (Nekhaev 2004). In these locations, the impact of energy use will be more radically affected by introducing greener and cleaner fuel sources and
more efficient domestic appliances than by introducing green building technologies.
On the supply side, there has been a significant shift in some countries in favour of renewable energies with bio-fuel and solar heating technologies becoming competitive with conventional sources (European Renewable Energy Council 2008). Photovoltaic (PV) technology is still relatively expensive but with the increasing volume of installed capacity and improvements in production, prices are lowering steadily.4 District heating and cooling systems5 that link buildings are also proving effective at reducing energy costs, notably in Iceland, where 94 per cent of heat demand is now provided by these technologies (Euro Heat & Power 2009).
Retrofitting and new constructionIn developed countries, opportunities for greening the building sector are found mainly in retrofitting existing buildings to render them more environmentally efficient by reducing energy demand and using renewable energy sources. The urbanised regions of northern Europe and North America are no longer increasing their building stock rapidly. In the UK, for example, 75 per cent of the existing building stock is expected to be in use in 2050. In such circumstances, retrofitting existing buildings becomes a critical area of intervention to reduce energy demands and thus GHG emissions (Ravetz 2008).
For the majority of non-OECD countries, which have a significant housing deficit, the greatest potential to reduce energy demand will come from new generations of buildings with more efficient design performance standards (WBCSD 2007a). It follows that the major environmental and business case for the OECD residential and commercial sector will depend on retrofitting existing buildings, while non-OECD countries will have to invest heavily in new forms of sustainable design that goes beyond the performance of individual buildings (as discussed in the Cities chapter). Nonetheless, there are significant opportunities for retrofitting buildings in some of the bigger cities of the developing world by adopting energy efficiency design measures such as solar technology, clean water supplies and reducing
4. Grid parity, where the electricity produced by PV panels is available at the same cost level as electricity provision from the grid, is predicted to be achievable by 2013-14 based on data from Germany (Bhandari and Stadler 2009).
5. District heating and cooling describes systems distributing heat and/or cold generated in a centralised location for heating and combined heat and power respectively. District heating serves both, space and domestic water heating. Moreover, commercial and industrial as well as public buildings can be supplied with process heat. The heat often comes from combined heat and power plants (CHP) and therefore has the ability to achieve higher efficiencies and lower emissions than a separate heat and power production. Historically, district heating stations are dependent on fossil fuels but in the last years renewable sources were introduced.
3. For example, as part of the Serbian Energy Efficiency Programme (SEEP 1) (IDA Credit and IRBD loan), 28 schools and hospitals were refurbished in Belgrade in 2005-09 with average energy savings of 39 per cent.
344
Buildings
dependency on air-conditioning through technical improvements.6 In India, for example, potential energy savings of 25 per cent have been estimated through cost-effec tive retrofitting of existing commercial buildings (UNEP SBCI 2010a).
The pros and cons of constructing a new building or retrofitting an existing structure have to be individually examined and compared. In some cases, retrofitting allows a further reduction of the energy load by preserving building materials, which can contain high levels of embodied energy7, expended in the extraction of resources, the manufacture of materials and their transportation. Both new building construction and
retrofitting are fundamental for catalysing a green building transformation. Retrofitting in developed countries can yield significant energy savings as the design, construction and technology of older buildings is often significantly less efficient than current best practices. In addition, retrofits that address daylight or on-demand ventilation to improve air quality can bring benefits through lower health care costs and higher productivity levels.
While less significant in terms of volume compared with new construction, retrofits can play an important role in addressing energy poverty in developing countries. At least 20 per cent of the world’s population lack access to electricity and it is expected that 1.2 billion people will still be without electricity in 2030; 87 per cent of them living in rural areas (IEA 2010a). Equipping households with electrical appliances, heating and cooling systems and either on-site renewable energy generation (such as rooftop solar panels) or a connection to the power grid may increase overall energy demand. Yet it will come in a far cleaner form than the coal, dung or wood many
Table 2: Summary of the major opportunities for green buildings in different sectors Source: Based on WBCSD analysis (2007a)
6. In Brazil, for example, refrigerators are responsible for 33 per cent of all electricity use in residential buildings over the year, with electric showers, lighting and air conditioning accounting for 20, 11 and 10 per cent respectively (Ghisi, Gosch and Lamberts 2007).
7. Embodied energy is energy needed for the production and processing of materials, transport and demolition as well as for manufacturing of furniture, appliances and the provision of infrastructure services such as water and sanitation. Embodied energy is highly dependent on the design and construction technique of buildings.
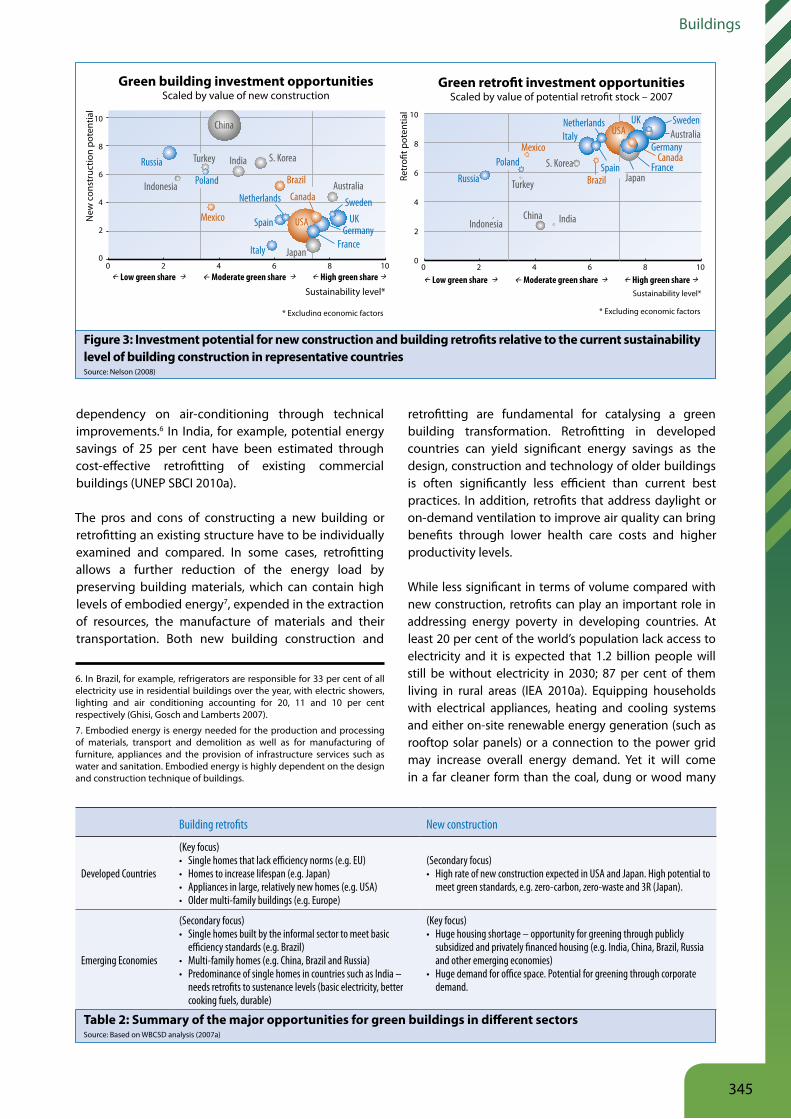
Figure 3: Investment potential for new construction and building retrofits relative to the current sustainability level of building construction in representative countries Source: Nelson (2008)
Building retrofits New construction
Developed Countries
(Key focus)• Single homes that lack efficiency norms (e.g. EU)• Homes to increase lifespan (e.g. Japan)• Appliances in large, relatively new homes (e.g. USA)• Older multi-family buildings (e.g. Europe)
(Secondary focus)• High rate of new construction expected in USA and Japan. High potential to
meet green standards, e.g. zero-carbon, zero-waste and 3R (Japan).
Emerging Economies
(Secondary focus)• Single homes built by the informal sector to meet basic
efficiency standards (e.g. Brazil)• Multi-family homes (e.g. China, Brazil and Russia)• Predominance of single homes in countries such as India –
needs retrofits to sustenance levels (basic electricity, better cooking fuels, durable)
(Key focus)• Huge housing shortage – opportunity for greening through publicly
subsidized and privately financed housing (e.g. India, China, Brazil, Russia and other emerging economies)
• Huge demand for office space. Potential for greening through corporate demand.
China
S. Korea
USA
Japan
IndiaTurkey
Indonesia AustraliaBrazil
Canada
Mexico
Russia
Poland
Netherlands
Spain
Italy FranceGermany
UKSweden
0 2 4 6 8 10Low green share Moderate green share High green share
Sustainability level*
New
con
stru
ctio
n po
tent
ial
* Excluding economic factors
Green building investment opportunitiesScaled by value of new construction
10
8
6
4
2
0
China
S. Korea
USA
Japan
India
Turkey
Indonesia
Australia
Brazil
CanadaMexico
Russia
Poland
Netherlands
Spain
Italy
France
Germany
UK Sweden
0 2 4 6 8 10
Sustainability level*
Retr
o�t p
oten
tial
* Excluding economic factors
Green retro�t investment opportunitiesScaled by value of potential retro�t stock – 2007
10
8
6
4
2
0
Low green share Moderate green share High green share
345
Towards a green economy
households currently use for lighting, heating and cooking. Replacing these traditional fuel sources will produce significant environmental and public-health benefits.
Table 2 summarises elements that describe the retrofitting and new construction potential in greening the building sector in developed countries and emerging economies. It is clear that there is a strong case for retrofitting buildings in developed countries. In emerging economies, retrofitting and new construction both have compelling cases although the potential for new construction is much greater than retrofitting. Figure 3 correlates the expected value of new construction and retrofitting potential with its level of sustainability (from low to high share of green construction). It can be seen that emerging economies such as China and India have a great potential for new construction, but it is not
expected to be particularly green. Developed countries have a high potential for retrofitting, with a high level of sustainability. The new construction potential in these countries is very low.
A conscious effort is needed to turn new construction green in developing countries and emerging economies, given that buildings generally last for decades and often centuries, whereas a country’s car fleet may be turned over in as little as 12 years. If a building is constructed to low standards of efficiency, retrofitting it later is an unnecessary complication compared with getting it right the first time. Retrofitting existing buildings, however, reduces energy demand compared with new-builds through a lower demand for building materials such as steel, glass and cement, which themselves require considerable amounts of energy to produce.
346
Buildings
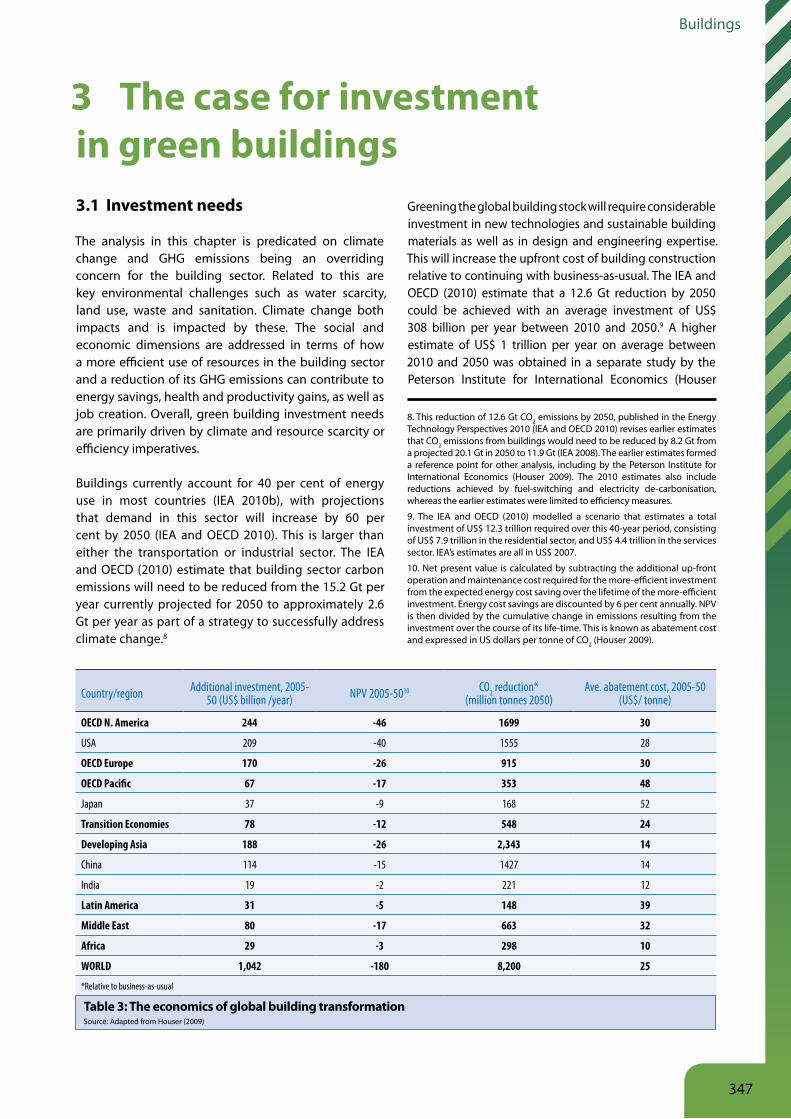
3 The case for investment in green buildings3 1 Investment needs
The analysis in this chapter is predicated on climate change and GHG emissions being an overriding concern for the building sector. Related to this are key environmental challenges such as water scarcity, land use, waste and sanitation. Climate change both impacts and is impacted by these. The social and economic dimensions are addressed in terms of how a more efficient use of resources in the building sector and a reduction of its GHG emissions can contribute to energy savings, health and productivity gains, as well as job creation. Overall, green building investment needs are primarily driven by climate and resource scarcity or efficiency imperatives.
Buildings currently account for 40 per cent of energy use in most countries (IEA 2010b), with projections that demand in this sector will increase by 60 per cent by 2050 (IEA and OECD 2010). This is larger than either the transportation or industrial sector. The IEA and OECD (2010) estimate that building sector carbon emissions will need to be reduced from the 15.2 Gt per year currently projected for 2050 to approximately 2.6 Gt per year as part of a strategy to successfully address climate change.8
Greening the global building stock will require considerable investment in new technologies and sustainable building materials as well as in design and engineering expertise. This will increase the upfront cost of building construction relative to continuing with business-as-usual. The IEA and OECD (2010) estimate that a 12.6 Gt reduction by 2050 could be achieved with an average investment of US$ 308 billion per year between 2010 and 2050.9 A higher estimate of US$ 1 trillion per year on average between 2010 and 2050 was obtained in a separate study by the Peterson Institute for International Economics (Houser
8. This reduction of 12.6 Gt CO2 emissions by 2050, published in the Energy Technology Perspectives 2010 (IEA and OECD 2010) revises earlier estimates that CO2 emissions from buildings would need to be reduced by 8.2 Gt from a projected 20.1 Gt in 2050 to 11.9 Gt (IEA 2008). The earlier estimates formed a reference point for other analysis, including by the Peterson Institute for International Economics (Houser 2009). The 2010 estimates also include reductions achieved by fuel-switching and electricity de-carbonisation, whereas the earlier estimates were limited to efficiency measures.
9. The IEA and OECD (2010) modelled a scenario that estimates a total investment of US$ 12.3 trillion required over this 40-year period, consisting of US$ 7.9 trillion in the residential sector, and US$ 4.4 trillion in the services sector. IEA’s estimates are all in US$ 2007.
10. Net present value is calculated by subtracting the additional up-front operation and maintenance cost required for the more-efficient investment from the expected energy cost saving over the lifetime of the more-efficient investment. Energy cost savings are discounted by 6 per cent annually. NPV is then divided by the cumulative change in emissions resulting from the investment over the course of its life-time. This is known as abatement cost and expressed in US dollars per tonne of CO2 (Houser 2009).
Table 3: The economics of global building transformationSource: Adapted from Houser (2009)
Country/region Additional investment, 2005-50 (US$ billion /year) NPV 2005-5010 CO2 reduction*
(million tonnes 2050)Ave. abatement cost, 2005-50
(US$/ tonne)
OECD N. America 244 -46 1699 30
USA 209 -40 1555 28
OECD Europe 170 -26 915 30
OECD Pacific 67 -17 353 48
Japan 37 -9 168 52
Transition Economies 78 -12 548 24
Developing Asia 188 -26 2,343 14
China 114 -15 1427 14
India 19 -2 221 12
Latin America 31 -5 148 39
Middle East 80 -17 663 32
Africa 29 -3 298 10
WORLD 1,042 -180 8,200 25
*Relative to business-as-usual
347
Towards a green economy
2009) in order to reduce emissions in the building sector by 8.2 Gt per year by 2050 (see Table 3).11
Retrofits in developed countries will account for a meaningful share of this additional investment, particularly in the early years of greening the buildings.
But the bulk of the incremental investment will occur through greening new buildings, an opportunity firms and households are already starting to take advantage of.
For the USA, a recent study predicts that the green retrofits of non-residential buildings will grow to a US$ 6.6 billion market by 2013, targeting the third of the US commercial building stock that could benefit from such a retrofit – a US$ 400 billion market (Pike Research 2009). For new commercial construction and new residential
11. The analysis by Houser (2009) uses a different approach to estimating the costs of achieving the emissions reduction of 8.2 Gt/year, which corresponds to the earlier estimated necessary reduction from IEA (2008) – see footnote 8 above. Houser’s estimates use data and an investment cost model developed by WBCSD (2009) and notes various explanations for the higher cost estimates, including the assumptions on the cost of solar photovoltaic technology, as well as future projections of energy prices.
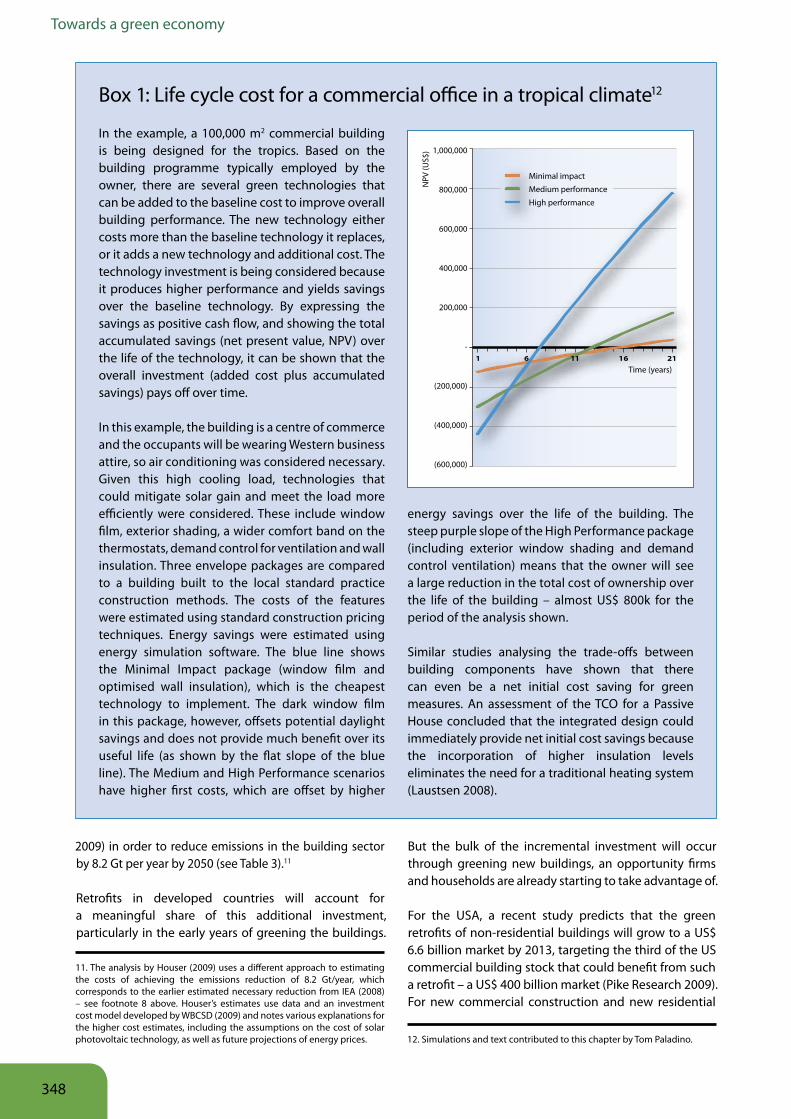
Box 1: Life cycle cost for a commercial office in a tropical climate12
In the example, a 100,000 m2 commercial building is being designed for the tropics. Based on the building programme typically employed by the owner, there are several green technologies that can be added to the baseline cost to improve overall building performance. The new technology either costs more than the baseline technology it replaces, or it adds a new technology and additional cost. The technology investment is being considered because it produces higher performance and yields savings over the baseline technology. By expressing the savings as positive cash flow, and showing the total accumulated savings (net present value, NPV) over the life of the technology, it can be shown that the overall investment (added cost plus accumulated savings) pays off over time.
In this example, the building is a centre of commerce and the occupants will be wearing Western business attire, so air conditioning was considered necessary. Given this high cooling load, technologies that could mitigate solar gain and meet the load more efficiently were considered. These include window film, exterior shading, a wider comfort band on the thermostats, demand control for ventilation and wall insulation. Three envelope packages are compared to a building built to the local standard practice construction methods. The costs of the features were estimated using standard construction pricing techniques. Energy savings were estimated using energy simulation software. The blue line shows the Minimal Impact package (window film and optimised wall insulation), which is the cheapest technology to implement. The dark window film in this package, however, offsets potential daylight savings and does not provide much benefit over its useful life (as shown by the flat slope of the blue line). The Medium and High Performance scenarios have higher first costs, which are offset by higher
energy savings over the life of the building. The steep purple slope of the High Performance package (including exterior window shading and demand control ventilation) means that the owner will see a large reduction in the total cost of ownership over the life of the building – almost US$ 800k for the period of the analysis shown.
Similar studies analysing the trade-offs between building components have shown that there can even be a net initial cost saving for green measures. An assessment of the TCO for a Passive House concluded that the integrated design could immediately provide net initial cost savings because the incorporation of higher insulation levels eliminates the need for a traditional heating system (Laustsen 2008).
Minimal impact
Medium performance
High performance
Time (years)
NPV
(US$
)
1 6 11 16 21
1,000,000
800,000
600,000
400,000
200,000
-
(200,000)
(400,000)
(600,000)
12. Simulations and text contributed to this chapter by Tom Paladino.
348

Buildings
construction, an estimated 10-12 per cent and 6-10 per cent is green, representing a US$ 24-29 billion and US$ 12-20 billion market, respectively. By 2013, the green commercial construction market is expected to grow to US$ 56-70 billion annually and the green residential market is expected to grow to US$ 40-70 billion (McGraw Hill 2009).
Although impressive, this market-driven change is not sufficient to meet the US$ 209 billion average annual investment required in the USA alone to reduce the building sector’s carbon footprint in line with the IEA’s projected low-carbon pathway (Houser 2009). Increasing investment in green buildings will require policies, and smart policy design requires an accurate appraisal of the costs and benefits of green building investments.
3 2 Measuring the costs and benefits
A correct evaluation of green building economics requires a Total Cost of Ownership (TCO) approach, where the differences in upfront investment costs (known as first costs) are considered alongside long-term costs and benefits. While certain green buildings may cost more to construct than a conventional alternative, the first cost premium may be recouped through lower energy bills, avoided climate change impacts, improved public health or increases in worker productivity. Box 1 describes the economic benefits of green buildings technologies and how these can offset their investment costs over time.
Looking only at the cost differential between constructing green and conventional buildings, a recent study by Greg Kats (2010) suggests that cost premiums are considerably lower than generally perceived. Data from 170 green buildings in the USA showed that they cost on average only 1.5 per cent more than conventional buildings, while public perception of the average additional costs of going green were 17 per cent. Per square metre the green premium ranged from US$ 0/m² to US$ 764.2/m² with a median of US$ 36.6/m².13 While Kats found the premium to be often greater for buildings achieving higher green standards, these same high standards were in many cases achieved with minimal or zero additional cost. This suggests that the green-cost premium depends to a great extent on the skill of the designers and builders, rather than on the level of greenness per se. The study also indicated that green retrofits have a slightly higher average green premium than new construction.
13. Original text indicates per square foot a green premium ranging from US$ 0/sf to US$ 71/sqf with a median of US$ 3.40/sqf.
Comparative efficiency by sector and regionThe economic benefit of green building investment is backed up by low or even negative costs of greening the building sector. One study estimates that 3.5 gigatons of CO2 emissions could be reduced through investment in green buildings by 2030 at an average abatement cost of
-US$ 35 per tonne.14 This compares with -US$ 10 per tonne in transportation, US$ 17 per tonne in steel production or US$ 20 per tonne in the power sector (McKinsey 2009). Going beyond 2030, the Peterson Institute study Houser (2009) found that achieving the 8.2 Gt (i.e. aiming at 450 ppm) of emission reductions from the building sector by 2050 would cost US$ 25 per tonne, but it would still be among the cheapest sources of abatement. Failure to transform the building sector and reliance on more costly emission reductions from the transport, power and industrial sectors would increase the economic cost of combating climate change by at least US$ 500 billion per year globally between 2010 and 2050.
Boxes 2 (China) and 3 (US) show the challenge of weighing short- and longer-term costs and benefits, as well as the tendency for growing energy consumption to undermine efficiency gains in commercial and residential buildings. Box 2 presents a case study of residential construction in China and illustrates the energy savings from design and management interventions. From this and other studies, it is clear that green buildings have a significant economic return on investment, and should occupy centre stage for long-term policies that aim to change patterns of production and consumption behaviour.
Although a wealth of energy efficiency measures and their attendant carbon emission reductions come at zero or even negative cost, policy intervention is needed to transform the global building stock in line with what the IEA sees as necessary to put the world on a low-carbon pathway. They also show the need for approaches that are regionally specific to reflect local building industry and local economic realities, mindful that the urban challenge in green building shows many similarities across regions.
An example of new policy and regulatory intervention comes from the EU’s Energy Performance of Buildings Directive15 (EPBD), which has generated debate about time frames for meeting requirements, the level of harmonisation across countries and the possible administrative burden imposed (e.g. compulsory
14. The reduction of 3.5 Gt of CO2 emissions from buildings through increased energy efficiency is part of a larger emission reduction of 38 Gt in 11 sectors, which aims to bring CO2 emissions close to the 450 ppm target by 2030.
15. The EPDB directive combines regulatory (energy performance requirements) and information-based (certification and inspection) measures and provides a holistic approach to emissions reduction, which encompasses the energy needs for space and water heating, cooling, ventilation and lighting.
349
Towards a green economy
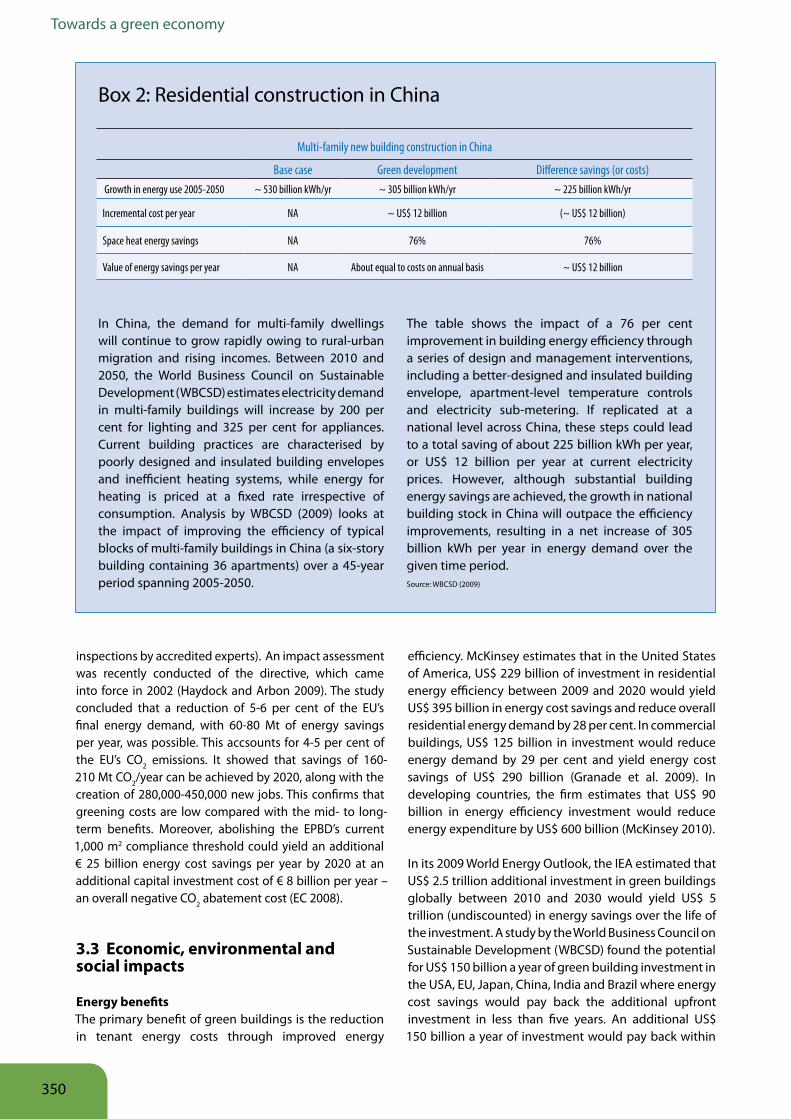
Box 2: Residential construction in China
In China, the demand for multi-family dwellings will continue to grow rapidly owing to rural-urban migration and rising incomes. Between 2010 and 2050, the World Business Council on Sustainable Development (WBCSD) estimates electricity demand in multi-family buildings will increase by 200 per cent for lighting and 325 per cent for appliances. Current building practices are characterised by poorly designed and insulated building envelopes and inefficient heating systems, while energy for heating is priced at a fixed rate irrespective of consumption. Analysis by WBCSD (2009) looks at the impact of improving the efficiency of typical blocks of multi-family buildings in China (a six-story building containing 36 apartments) over a 45-year period spanning 2005-2050.
The table shows the impact of a 76 per cent improvement in building energy efficiency through a series of design and management interventions, including a better-designed and insulated building envelope, apartment-level temperature controls and electricity sub-metering. If replicated at a national level across China, these steps could lead to a total saving of about 225 billion kWh per year, or US$ 12 billion per year at current electricity prices. However, although substantial building energy savings are achieved, the growth in national building stock in China will outpace the efficiency improvements, resulting in a net increase of 305 billion kWh per year in energy demand over the given time period. Source: WBCSD (2009)
Multi-family new building construction in China
Base case Green development Difference savings (or costs) Growth in energy use 2005-2050 ~ 530 billion kWh/yr ~ 305 billion kWh/yr ~ 225 billion kWh/yr
Incremental cost per year NA ~ US$ 12 billion (~ US$ 12 billion)
Space heat energy savings NA 76% 76%
Value of energy savings per year NA About equal to costs on annual basis ~ US$ 12 billion
inspections by accredited experts). An impact assessment was recently conducted of the directive, which came into force in 2002 (Haydock and Arbon 2009). The study concluded that a reduction of 5-6 per cent of the EU’s final energy demand, with 60-80 Mt of energy savings per year, was possible. This accsounts for 4-5 per cent of the EU’s CO2 emissions. It showed that savings of 160-210 Mt CO2/year can be achieved by 2020, along with the creation of 280,000-450,000 new jobs. This confirms that greening costs are low compared with the mid- to long-term benefits. Moreover, abolishing the EPBD’s current 1,000 m2 compliance threshold could yield an additional € 25 billion energy cost savings per year by 2020 at an additional capital investment cost of € 8 billion per year – an overall negative CO2 abatement cost (EC 2008).
3 3 Economic, environmental and social impacts
Energy benefitsThe primary benefit of green buildings is the reduction in tenant energy costs through improved energy
efficiency. McKinsey estimates that in the United States of America, US$ 229 billion of investment in residential energy efficiency between 2009 and 2020 would yield US$ 395 billion in energy cost savings and reduce overall residential energy demand by 28 per cent. In commercial buildings, US$ 125 billion in investment would reduce energy demand by 29 per cent and yield energy cost savings of US$ 290 billion (Granade et al. 2009). In developing countries, the firm estimates that US$ 90 billion in energy efficiency investment would reduce energy expenditure by US$ 600 billion (McKinsey 2010).
In its 2009 World Energy Outlook, the IEA estimated that US$ 2.5 trillion additional investment in green buildings globally between 2010 and 2030 would yield US$ 5 trillion (undiscounted) in energy savings over the life of the investment. A study by the World Business Council on Sustainable Development (WBCSD) found the potential for US$ 150 billion a year of green building investment in the USA, EU, Japan, China, India and Brazil where energy cost savings would pay back the additional upfront investment in less than five years. An additional US$ 150 billion a year of investment would pay back within
350
Buildings
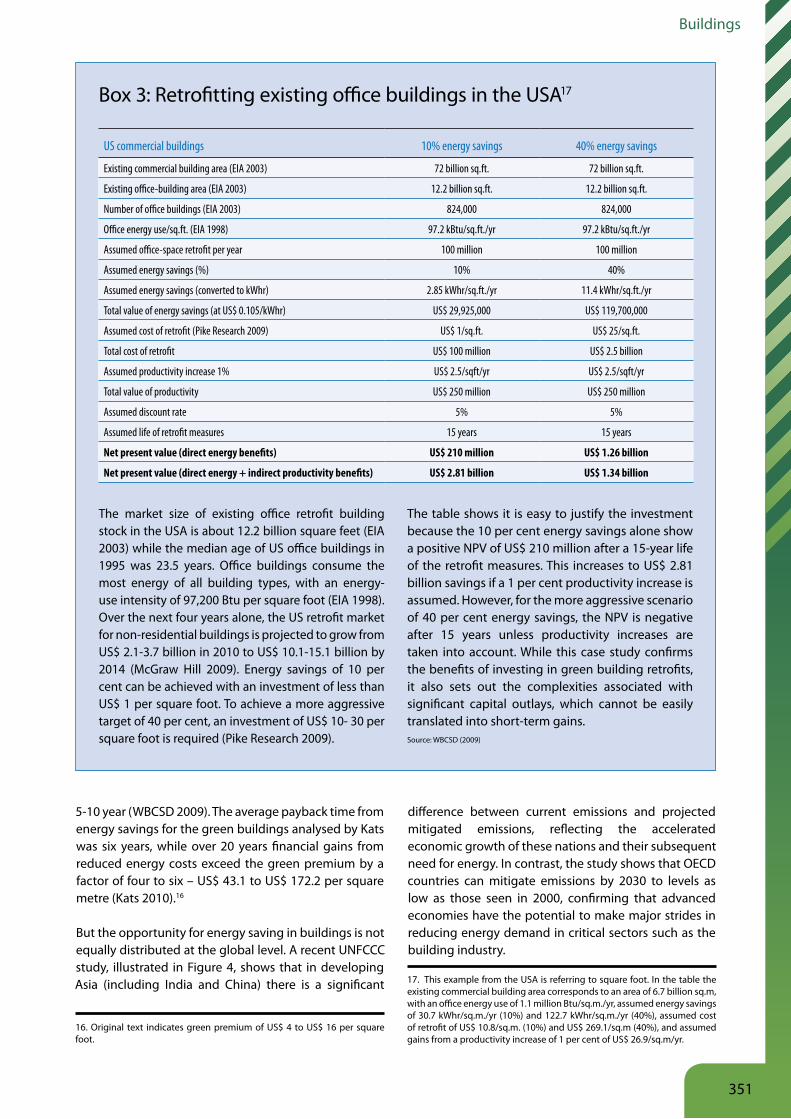
Box 3: Retrofitting existing office buildings in the USA17
The market size of existing office retrofit building stock in the USA is about 12.2 billion square feet (EIA 2003) while the median age of US office buildings in 1995 was 23.5 years. Office buildings consume the most energy of all building types, with an energy-use intensity of 97,200 Btu per square foot (EIA 1998). Over the next four years alone, the US retrofit market for non-residential buildings is projected to grow from US$ 2.1-3.7 billion in 2010 to US$ 10.1-15.1 billion by 2014 (McGraw Hill 2009). Energy savings of 10 per cent can be achieved with an investment of less than US$ 1 per square foot. To achieve a more aggressive target of 40 per cent, an investment of US$ 10- 30 per square foot is required (Pike Research 2009).
The table shows it is easy to justify the investment because the 10 per cent energy savings alone show a positive NPV of US$ 210 million after a 15-year life of the retrofit measures. This increases to US$ 2.81 billion savings if a 1 per cent productivity increase is assumed. However, for the more aggressive scenario of 40 per cent energy savings, the NPV is negative after 15 years unless productivity increases are taken into account. While this case study confirms the benefits of investing in green building retrofits, it also sets out the complexities associated with significant capital outlays, which cannot be easily translated into short-term gains. Source: WBCSD (2009)
US commercial buildings 10% energy savings 40% energy savings
Existing commercial building area (EIA 2003) 72 billion sq.ft. 72 billion sq.ft.
Existing office-building area (EIA 2003) 12.2 billion sq.ft. 12.2 billion sq.ft.
Number of office buildings (EIA 2003) 824,000 824,000
Office energy use/sq.ft. (EIA 1998) 97.2 kBtu/sq.ft./yr 97.2 kBtu/sq.ft./yr
Assumed office-space retrofit per year 100 million 100 million
Assumed energy savings (%) 10% 40%
Assumed energy savings (converted to kWhr) 2.85 kWhr/sq.ft./yr 11.4 kWhr/sq.ft./yr
Total value of energy savings (at US$ 0.105/kWhr) US$ 29,925,000 US$ 119,700,000
Assumed cost of retrofit (Pike Research 2009) US$ 1/sq.ft. US$ 25/sq.ft.
Total cost of retrofit US$ 100 million US$ 2.5 billion
Assumed productivity increase 1% US$ 2.5/sqft/yr US$ 2.5/sqft/yr
Total value of productivity US$ 250 million US$ 250 million
Assumed discount rate 5% 5%
Assumed life of retrofit measures 15 years 15 years
Net present value (direct energy benefits) US$ 210 million US$ 1.26 billion
Net present value (direct energy + indirect productivity benefits) US$ 2.81 billion US$ 1.34 billion
5-10 year (WBCSD 2009). The average payback time from energy savings for the green buildings analysed by Kats was six years, while over 20 years financial gains from reduced energy costs exceed the green premium by a factor of four to six – US$ 43.1 to US$ 172.2 per square metre (Kats 2010).16
But the opportunity for energy saving in buildings is not equally distributed at the global level. A recent UNFCCC study, illustrated in Figure 4, shows that in developing Asia (including India and China) there is a significant
difference between current emissions and projected mitigated emissions, reflecting the accelerated economic growth of these nations and their subsequent need for energy. In contrast, the study shows that OECD countries can mitigate emissions by 2030 to levels as low as those seen in 2000, confirming that advanced economies have the potential to make major strides in reducing energy demand in critical sectors such as the building industry.
16. Original text indicates green premium of US$ 4 to US$ 16 per square foot.
17. This example from the USA is referring to square foot. In the table the existing commercial building area corresponds to an area of 6.7 billion sq.m, with an office energy use of 1.1 million Btu/sq.m./yr, assumed energy savings of 30.7 kWhr/sq.m./yr (10%) and 122.7 kWhr/sq.m./yr (40%), assumed cost of retrofit of US$ 10.8/sq.m. (10%) and US$ 269.1/sq.m (40%), and assumed gains from a productivity increase of 1 per cent of US$ 26.9/sq.m/yr.
351
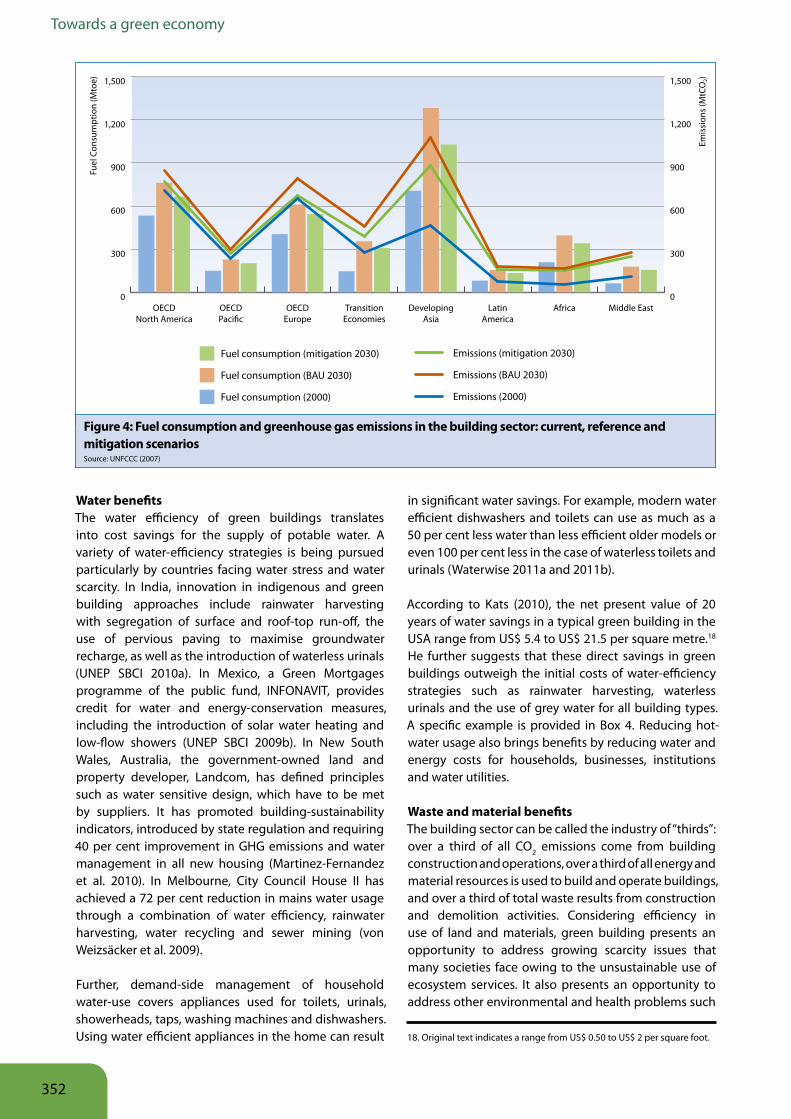
Towards a green economy
Water benefitsThe water efficiency of green buildings translates into cost savings for the supply of potable water. A variety of water-efficiency strategies is being pursued particularly by countries facing water stress and water scarcity. In India, innovation in indigenous and green building approaches include rainwater harvesting with segregation of surface and roof-top run-off, the use of pervious paving to maximise groundwater recharge, as well as the introduction of waterless urinals (UNEP SBCI 2010a). In Mexico, a Green Mortgages programme of the public fund, INFONAVIT, provides credit for water and energy-conservation measures, including the introduction of solar water heating and low-flow showers (UNEP SBCI 2009b). In New South Wales, Australia, the government-owned land and property developer, Landcom, has defined principles such as water sensitive design, which have to be met by suppliers. It has promoted building-sustainability indicators, introduced by state regulation and requiring 40 per cent improvement in GHG emissions and water management in all new housing (Martinez-Fernandez et al. 2010). In Melbourne, City Council House II has achieved a 72 per cent reduction in mains water usage through a combination of water efficiency, rainwater harvesting, water recycling and sewer mining (von Weizsäcker et al. 2009).
Further, demand-side management of household water-use covers appliances used for toilets, urinals, showerheads, taps, washing machines and dishwashers. Using water efficient appliances in the home can result
in significant water savings. For example, modern water efficient dishwashers and toilets can use as much as a 50 per cent less water than less efficient older models or even 100 per cent less in the case of waterless toilets and urinals (Waterwise 2011a and 2011b).
According to Kats (2010), the net present value of 20 years of water savings in a typical green building in the USA range from US$ 5.4 to US$ 21.5 per square metre.18 He further suggests that these direct savings in green buildings outweigh the initial costs of water-efficiency strategies such as rainwater harvesting, waterless urinals and the use of grey water for all building types. A specific example is provided in Box 4. Reducing hot-water usage also brings benefits by reducing water and energy costs for households, businesses, institutions and water utilities.
Waste and material benefitsThe building sector can be called the industry of “thirds”: over a third of all CO2 emissions come from building construction and operations, over a third of all energy and material resources is used to build and operate buildings, and over a third of total waste results from construction and demolition activities. Considering efficiency in use of land and materials, green building presents an opportunity to address growing scarcity issues that many societies face owing to the unsustainable use of ecosystem services. It also presents an opportunity to address other environmental and health problems such
18. Original text indicates a range from US$ 0.50 to US$ 2 per square foot.
Fuel
Con
sum
ptio
n (M
toe)
Emis
sion
s (M
tCO
2)
0
300
600
900
1,200
1,500
Fuel consumption (mitigation 2030)
Fuel consumption (BAU 2030)
Fuel consumption (2000)
Middle EastAfricaLatinAmerica
DevelopingAsia
TransitionEconomies
OECDEurope
OECDPaci�c
OECDNorth America
0
300
600
900
1,200
1,500
Emissions (mitigation 2030)
Emissions (BAU 2030)
Emissions (2000)
Figure 4: Fuel consumption and greenhouse gas emissions in the building sector: current, reference and mitigation scenarios Source: UNFCCC (2007)
352
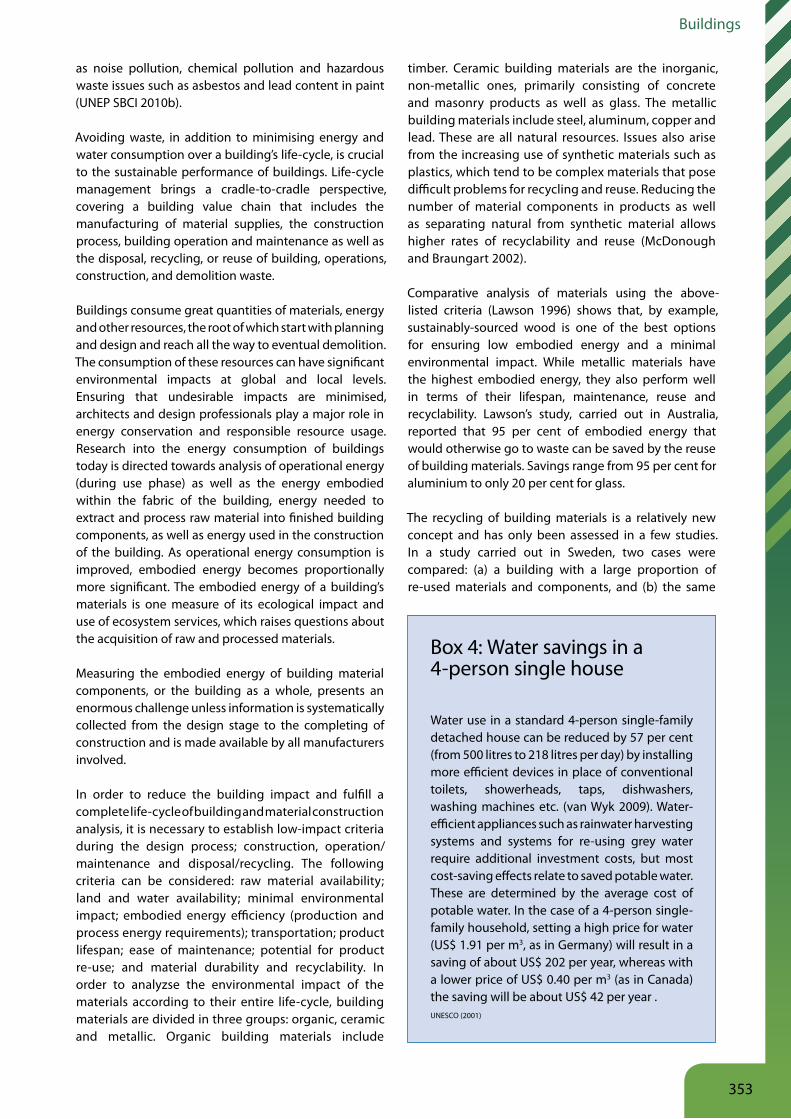
Buildings
as noise pollution, chemical pollution and hazardous waste issues such as asbestos and lead content in paint (UNEP SBCI 2010b).
Avoiding waste, in addition to minimising energy and water consumption over a building’s life-cycle, is crucial to the sustainable performance of buildings. Life-cycle management brings a cradle-to-cradle perspective, covering a building value chain that includes the manufacturing of material supplies, the construction process, building operation and maintenance as well as the disposal, recycling, or reuse of building, operations, construction, and demolition waste.
Buildings consume great quantities of materials, energy and other resources, the root of which start with planning and design and reach all the way to eventual demolition. The consumption of these resources can have significant environmental impacts at global and local levels. Ensuring that undesirable impacts are minimised, architects and design professionals play a major role in energy conservation and responsible resource usage. Research into the energy consumption of buildings today is directed towards analysis of operational energy (during use phase) as well as the energy embodied within the fabric of the building, energy needed to extract and process raw material into finished building components, as well as energy used in the construction of the building. As operational energy consumption is improved, embodied energy becomes proportionally more significant. The embodied energy of a building’s materials is one measure of its ecological impact and use of ecosystem services, which raises questions about the acquisition of raw and processed materials.
Measuring the embodied energy of building material components, or the building as a whole, presents an enormous challenge unless information is systematically collected from the design stage to the completing of construction and is made available by all manufacturers involved.
In order to reduce the building impact and fulfill a complete life-cycle of building and material construction analysis, it is necessary to establish low-impact criteria during the design process; construction, operation/maintenance and disposal/recycling. The following criteria can be considered: raw material availability; land and water availability; minimal environmental impact; embodied energy efficiency (production and process energy requirements); transportation; product lifespan; ease of maintenance; potential for product re-use; and material durability and recyclability. In order to analyzse the environmental impact of the materials according to their entire life-cycle, building materials are divided in three groups: organic, ceramic and metallic. Organic building materials include
timber. Ceramic building materials are the inorganic, non-metallic ones, primarily consisting of concrete and masonry products as well as glass. The metallic building materials include steel, aluminum, copper and lead. These are all natural resources. Issues also arise from the increasing use of synthetic materials such as plastics, which tend to be complex materials that pose difficult problems for recycling and reuse. Reducing the number of material components in products as well as separating natural from synthetic material allows higher rates of recyclability and reuse (McDonough and Braungart 2002).
Comparative analysis of materials using the above-listed criteria (Lawson 1996) shows that, by example, sustainably-sourced wood is one of the best options for ensuring low embodied energy and a minimal environmental impact. While metallic materials have the highest embodied energy, they also perform well in terms of their lifespan, maintenance, reuse and recyclability. Lawson’s study, carried out in Australia, reported that 95 per cent of embodied energy that would otherwise go to waste can be saved by the reuse of building materials. Savings range from 95 per cent for aluminium to only 20 per cent for glass.
The recycling of building materials is a relatively new concept and has only been assessed in a few studies. In a study carried out in Sweden, two cases were compared: (a) a building with a large proportion of re-used materials and components, and (b) the same
Box 4: Water savings in a 4-person single house
Water use in a standard 4-person single-family detached house can be reduced by 57 per cent (from 500 litres to 218 litres per day) by installing more efficient devices in place of conventional toilets, showerheads, taps, dishwashers, washing machines etc. (van Wyk 2009). Water-efficient appliances such as rainwater harvesting systems and systems for re-using grey water require additional investment costs, but most cost-saving effects relate to saved potable water. These are determined by the average cost of potable water. In the case of a 4-person single-family household, setting a high price for water (US$ 1.91 per m3, as in Germany) will result in a saving of about US$ 202 per year, whereas with a lower price of US$ 0.40 per m3 (as in Canada) the saving will be about US$ 42 per year .UNESCO (2001)
353
Towards a green economy
building for which new materials and components were used. The results showed that the environmental impacts caused by reused materials are at 55 per cent of the impact caused if all materials had been new (Thormark 2000 and 2006). Other studies show that by using recycled materials between 12 per cent and 40 per cent of the energy used for material production could be saved. Reasons for the mixed results between studies include differences in recycling rates and the material composition in buildings.
Although recycling building materials requires energy consumption, studies show that recycling materials still delivers net emissions savings. Following a life-cycle approach (Sára 2001), compared CO2 emissions from produced recycled clay/gravel with and without selective dismantling and classification. The research indicates that CO2 emissions were reduced from 107.7 kg to 6 kg per tonne of recycled clay/gravel produced. Recycling rates of specific materials that are significant in construction and demolition waste streams can be significant indicators of sustainability. In developing societies, recycled building components are often cheaper and of higher quality than conventional materials, providing benefits to the urban poor (UNEP SBCI 2010a).
Productivity and health benefitsGreen buildings provide benefits beyond environmental advantages at a low or negative cost. These include improved worker productivity and work quality resulting from a more comfortable office environment as well as improved public health resulting from reduced indoor air pollution (after replacing biomass with electricity or clean burn biomass in developing countries), reduced noise pollution and reduced overall air pollution (owing to reduced use of fossil fuels in developed countries and emerging markets).
These benefits can rival, if not supersede, the energy cost and climate benefits outlined above. For example, a recent study for the US Green Building Council estimated that greening an average US commercial office building saves US$ 5.6 per square metre per year in energy costs (Booz Allen Hamilton 2009).19 While significant in absolute terms, energy costs for most businesses pale in comparison to labour costs, particularly in developed countries. Even a 1 per cent increase in productivity resulting from investment in green buildings yields a labour-cost saving several times higher than the energy-cost savings noted above. Results from a series of research studies on the effects of environmental conditions within workplaces show that productivity savings can be significantly greater than 1 per cent:
■ Indoor air quality: 6-9 per cent productivity gain (Wyon 2004);
■ Natural ventilation: 3-18 per cent productivity gain (NSF/IUCRC 2004);
■ Local thermal control: 3.5-37 per cent productivity gain (Loftness et al. 2003);
■ Daylighting: 3-40 per cent productivity and sales gain (Loftness et al. 2003); and
■ Rent premium: up to a 36 per cent increase (Baker et al. 2008).
Increased day lighting, views and contact with nature have also been linked to positive health and productivity impacts beyond commercial workplaces, for example, in hospitals and schools. Enhanced environments within school buildings are linked to improved student performance (Aumann et al. 2004) and those in hospitals have been associated with faster patient recovery (Ulrich 1984). Of 13 studies linking improved access to the natural environment with gains in individual and organisational productivity, seven identified 3-18 per cent increases in individual productivity (including student test results) and 40 per cent increases in sales (an organisational productivity measure) as a result of the introduction of daylight to workplaces (Loftness et al. 2003).
One of the earliest and most widely-cited studies on economies from green buildings documented 33 commercial buildings with green certification in California (Kats 2003). The report found an average green-building cost premium of US$ 32.3-53.8 per square metre.20 The total benefits of the investment are highlighted in Table 4, which measured net-present value (NPV) over a 20-year period, showing net benefits of between US$ 516.7-721.2 per square metre, depending on level of certification.21
In developing countries, the health benefits of investment in the green buildings, specifically in technologies and appliances for heating and cooking, are directly contributing to improved human well-being. Indoor pollution is a major cause of serious illness and premature death in developing countries. Greening the building sector, in this context, is expected to derive its main benefits from reducing indoor pollution and improving the health of the poor, particularly women and children. Studies conducted by Ezzati and Kammen (2002) showed that the cost-effectiveness of measures
19. Original text indicates saving of US$ 0.52 per square foot per year in energy costs.
20. Original text indicates an average green-building cost premium of US$ 3-5 per square foot.
21. Original text indicates net benefits of between US$ 48-67 per square foot.
354
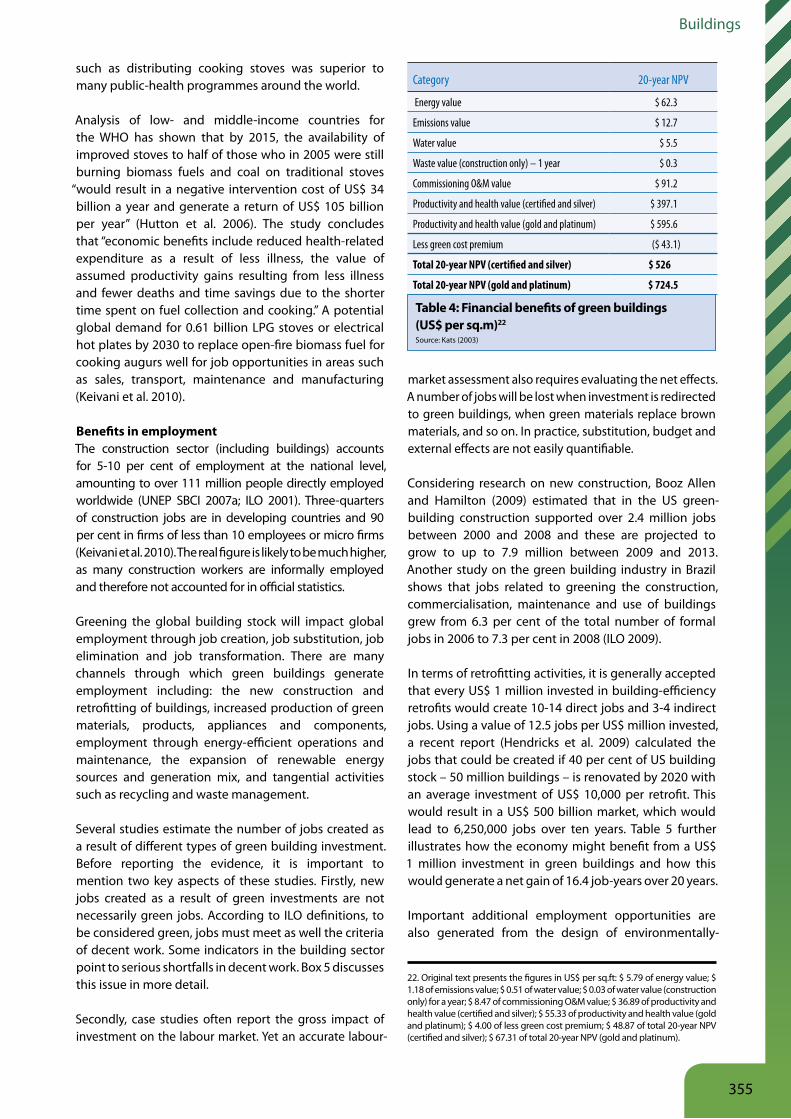
Buildings
such as distributing cooking stoves was superior to many public-health programmes around the world.
Analysis of low- and middle-income countries for the WHO has shown that by 2015, the availability of improved stoves to half of those who in 2005 were still burning biomass fuels and coal on traditional stoves
“would result in a negative intervention cost of US$ 34 billion a year and generate a return of US$ 105 billion per year” (Hutton et al. 2006). The study concludes that “economic benefits include reduced health-related expenditure as a result of less illness, the value of assumed productivity gains resulting from less illness and fewer deaths and time savings due to the shorter time spent on fuel collection and cooking.” A potential global demand for 0.61 billion LPG stoves or electrical hot plates by 2030 to replace open-fire biomass fuel for cooking augurs well for job opportunities in areas such as sales, transport, maintenance and manufacturing (Keivani et al. 2010).
Benefits in employment The construction sector (including buildings) accounts for 5-10 per cent of employment at the national level, amounting to over 111 million people directly employed worldwide (UNEP SBCI 2007a; ILO 2001). Three-quarters of construction jobs are in developing countries and 90 per cent in firms of less than 10 employees or micro firms (Keivani et al. 2010). The real figure is likely to be much higher, as many construction workers are informally employed and therefore not accounted for in official statistics.
Greening the global building stock will impact global employment through job creation, job substitution, job elimination and job transformation. There are many channels through which green buildings generate employment including: the new construction and retrofitting of buildings, increased production of green materials, products, appliances and components, employment through energy-efficient operations and maintenance, the expansion of renewable energy sources and generation mix, and tangential activities such as recycling and waste management.
Several studies estimate the number of jobs created as a result of different types of green building investment. Before reporting the evidence, it is important to mention two key aspects of these studies. Firstly, new jobs created as a result of green investments are not necessarily green jobs. According to ILO definitions, to be considered green, jobs must meet as well the criteria of decent work. Some indicators in the building sector point to serious shortfalls in decent work. Box 5 discusses this issue in more detail.
Secondly, case studies often report the gross impact of investment on the labour market. Yet an accurate labour-
market assessment also requires evaluating the net effects. A number of jobs will be lost when investment is redirected to green buildings, when green materials replace brown materials, and so on. In practice, substitution, budget and external effects are not easily quantifiable.
Considering research on new construction, Booz Allen and Hamilton (2009) estimated that in the US green-building construction supported over 2.4 million jobs between 2000 and 2008 and these are projected to grow to up to 7.9 million between 2009 and 2013. Another study on the green building industry in Brazil shows that jobs related to greening the construction, commercialisation, maintenance and use of buildings grew from 6.3 per cent of the total number of formal jobs in 2006 to 7.3 per cent in 2008 (ILO 2009).
In terms of retrofitting activities, it is generally accepted that every US$ 1 million invested in building-efficiency retrofits would create 10-14 direct jobs and 3-4 indirect jobs. Using a value of 12.5 jobs per US$ million invested, a recent report (Hendricks et al. 2009) calculated the jobs that could be created if 40 per cent of US building stock – 50 million buildings – is renovated by 2020 with an average investment of US$ 10,000 per retrofit. This would result in a US$ 500 billion market, which would lead to 6,250,000 jobs over ten years. Table 5 further illustrates how the economy might benefit from a US$ 1 million investment in green buildings and how this would generate a net gain of 16.4 job-years over 20 years.
Important additional employment opportunities are also generated from the design of environmentally-
22. Original text presents the figures in US$ per sq.ft: $ 5.79 of energy value; $ 1.18 of emissions value; $ 0.51 of water value; $ 0.03 of water value (construction only) for a year; $ 8.47 of commissioning O&M value; $ 36.89 of productivity and health value (certified and silver); $ 55.33 of productivity and health value (gold and platinum); $ 4.00 of less green cost premium; $ 48.87 of total 20-year NPV (certified and silver); $ 67.31 of total 20-year NPV (gold and platinum).
Table 4: Financial benefits of green buildings (US$ per sq m)22
Source: Kats (2003)
Category 20-year NPV
Energy value $ 62.3
Emissions value $ 12.7
Water value $ 5.5
Waste value (construction only) – 1 year $ 0.3
Commissioning O&M value $ 91.2
Productivity and health value (certified and silver) $ 397.1
Productivity and health value (gold and platinum) $ 595.6
Less green cost premium ($ 43.1)
Total 20-year NPV (certified and silver) $ 526
Total 20-year NPV (gold and platinum) $ 724.5
355
Towards a green economy
sound materials, products and renewable energy. A study conducted by ADEME (2008) in France displays the number of jobs directly involved in carrying out
insulation work of opaque walls, which involve interior insulation of the walls, ceilings and floors and the use of associated materials. In 2006 the industry accounted for 9,700 jobs related to these activities and 7,150 jobs related to the production and application of related
Box 5: The social dimension of green buildings: implications for decent work and poverty reduction23
The building sector has high potential for pro-poor economic growth through its high labour absorption capacity in developing countries. The sector employs a wide range of workers with different levels of education and has the ability to absorb the excluded (de Souza 2000). This has strong implications for income generation and poverty reduction. Take the example of the Johannesburg Housing Company project in South Africa (Keivani et al. 2010). This project involves the introduction of energy-efficient light bulbs and day-night sensors, solar energy systems for heating water and the insulation of boilers. It provides jobs for over 1,000 contractors in maintenance, cleaning and security services and even more in specialised functions such as plumbing and electrical services. The Watergy Soweto project for the rehabilitation of plumbing fixtures has provided 1,500 temporary jobs.
Despite this potential, workers of the construction industry are often subject to poor working conditions. High informality, low wages, instability, gender discrimination, frequent accidents and occupational diseases characterise the working conditions of a large share of workers in the building sector around the world, especially in developing economies where construction work is more precarious and less formalised.
Where the employment relationship of contractors, subcontractors and workers is casual or informal, workers’ rights are often unclear and they enjoy less protection from the law than those directly employed. In recent years it has become the norm for workers to be employed on a short-term basis, and instability of work is one of the major problems facing the building industry.
Construction is also one of the most dangerous occupations. Workers in this sector are 3-4 times more likely than other workers to die from accidents at work. Many others suffer and die from diseases arising from exposure to dangerous substances at the workplace, such as asbestos. In regard to social
protection, there is evidence that many employers do not pay into social security funds for workers who are on temporary contracts, depriving them from health care, holiday pay, and compensation owing to unemployment, ill health, accidents or old age.
For a long time the ongoing dialogue with employers as well as the government has been a successful approach for workers to collectively negotiate better wages and working conditions. However, nowadays a large workforce of temporary, casual, informal and unemployed workers find it very difficult to organise themselves to engage in such dialogue. The greening of buildings may provide a new opportunity for social dialogue. Many employers and government authorities have shown enthusiasm for green construction. This may open a new door to dialogue with workers on labour issues in the context of greening of the industry, involving workers in green management, resource efficiency and safety improvements.
In the area of working conditions, greening the building sector will have an impact on health and safety. Green construction is however not safer per se, as is shown in research by the American Society of Civil Engineers. With data collected through a structured questionnaire survey, the study tested the presence of a difference in Occupational Safety and Health Administration (OSHA) recordable incident rates (RIRs) and lost time case rates (LTCRs) between green and non-green projects. There was suggestive, but inconclusive evidence of a statistically significant difference in the RIRs of the green and non-green building projects that were examined. Also, no statistically significant difference was found between the respective LTCRs.
These considerations provide further cause to turn the role of labour inspectors to one of education and prevention, as opposed to mere inspection and prosecution. The greening of the industry brings the opportunity to create synergies between inspection about the environmental and the health & safety components of construction.
23. This Box was prepared based on contributions from ILO to this chapter.
356
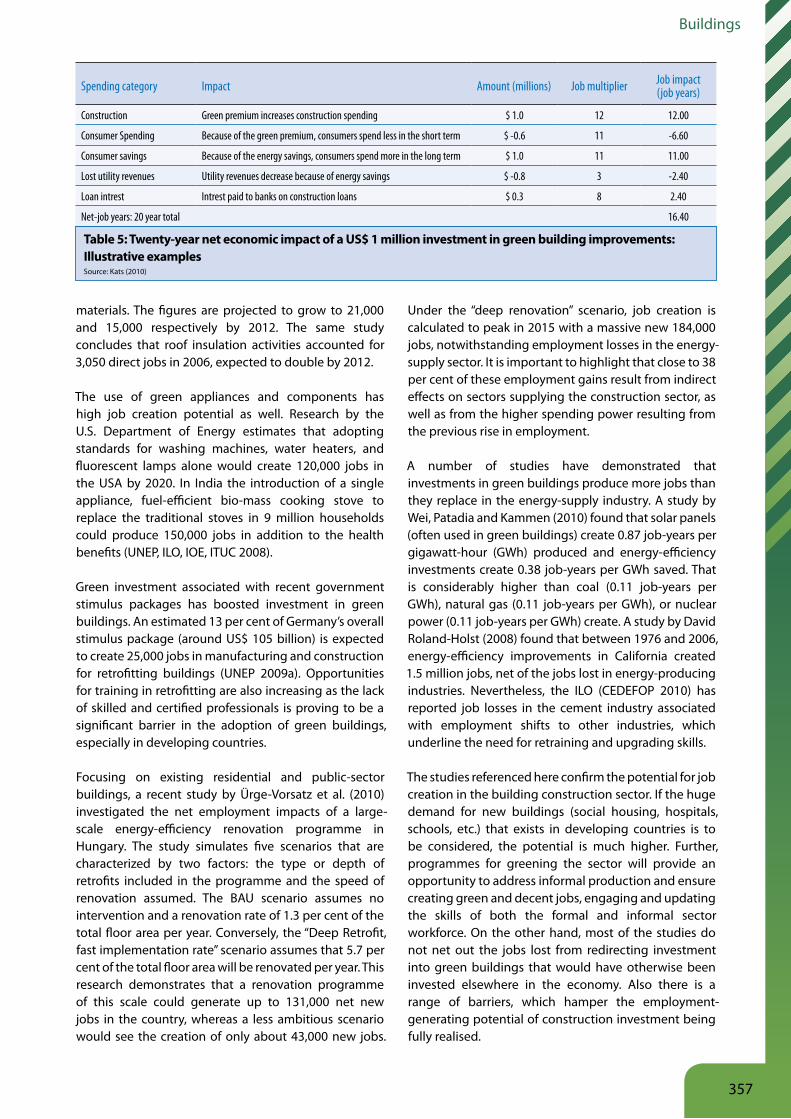
Buildings
Table 5: Twenty-year net economic impact of a US$ 1 million investment in green building improvements: Illustrative examples Source: Kats (2010)
Spending category Impact Amount (millions) Job multiplier Job impact (job years)
Construction Green premium increases construction spending $ 1.0 12 12.00
Consumer Spending Because of the green premium, consumers spend less in the short term $ -0.6 11 -6.60
Consumer savings Because of the energy savings, consumers spend more in the long term $ 1.0 11 11.00
Lost utility revenues Utility revenues decrease because of energy savings $ -0.8 3 -2.40
Loan intrest Intrest paid to banks on construction loans $ 0.3 8 2.40
Net-job years: 20 year total 16.40
materials. The figures are projected to grow to 21,000 and 15,000 respectively by 2012. The same study concludes that roof insulation activities accounted for 3,050 direct jobs in 2006, expected to double by 2012.
The use of green appliances and components has high job creation potential as well. Research by the U.S. Department of Energy estimates that adopting standards for washing machines, water heaters, and fluorescent lamps alone would create 120,000 jobs in the USA by 2020. In India the introduction of a single appliance, fuel-efficient bio-mass cooking stove to replace the traditional stoves in 9 million households could produce 150,000 jobs in addition to the health benefits (UNEP, ILO, IOE, ITUC 2008).
Green investment associated with recent government stimulus packages has boosted investment in green buildings. An estimated 13 per cent of Germany’s overall stimulus package (around US$ 105 billion) is expected to create 25,000 jobs in manufacturing and construction for retrofitting buildings (UNEP 2009a). Opportunities for training in retrofitting are also increasing as the lack of skilled and certified professionals is proving to be a significant barrier in the adoption of green buildings, especially in developing countries.
Focusing on existing residential and public-sector buildings, a recent study by Ürge-Vorsatz et al. (2010) investigated the net employment impacts of a large-scale energy-efficiency renovation programme in Hungary. The study simulates five scenarios that are characterized by two factors: the type or depth of retrofits included in the programme and the speed of renovation assumed. The BAU scenario assumes no intervention and a renovation rate of 1.3 per cent of the total floor area per year. Conversely, the “Deep Retrofit, fast implementation rate” scenario assumes that 5.7 per cent of the total floor area will be renovated per year. This research demonstrates that a renovation programme of this scale could generate up to 131,000 net new jobs in the country, whereas a less ambitious scenario would see the creation of only about 43,000 new jobs.
Under the “deep renovation” scenario, job creation is calculated to peak in 2015 with a massive new 184,000 jobs, notwithstanding employment losses in the energy-supply sector. It is important to highlight that close to 38 per cent of these employment gains result from indirect effects on sectors supplying the construction sector, as well as from the higher spending power resulting from the previous rise in employment.
A number of studies have demonstrated that investments in green buildings produce more jobs than they replace in the energy-supply industry. A study by Wei, Patadia and Kammen (2010) found that solar panels (often used in green buildings) create 0.87 job-years per gigawatt-hour (GWh) produced and energy-efficiency investments create 0.38 job-years per GWh saved. That is considerably higher than coal (0.11 job-years per GWh), natural gas (0.11 job-years per GWh), or nuclear power (0.11 job-years per GWh) create. A study by David Roland-Holst (2008) found that between 1976 and 2006, energy-efficiency improvements in California created 1.5 million jobs, net of the jobs lost in energy-producing industries. Nevertheless, the ILO (CEDEFOP 2010) has reported job losses in the cement industry associated with employment shifts to other industries, which underline the need for retraining and upgrading skills.
The studies referenced here confirm the potential for job creation in the building construction sector. If the huge demand for new buildings (social housing, hospitals, schools, etc.) that exists in developing countries is to be considered, the potential is much higher. Further, programmes for greening the sector will provide an opportunity to address informal production and ensure creating green and decent jobs, engaging and updating the skills of both the formal and informal sector workforce. On the other hand, most of the studies do not net out the jobs lost from redirecting investment into green buildings that would have otherwise been invested elsewhere in the economy. Also there is a range of barriers, which hamper the employment-generating potential of construction investment being fully realised.
357
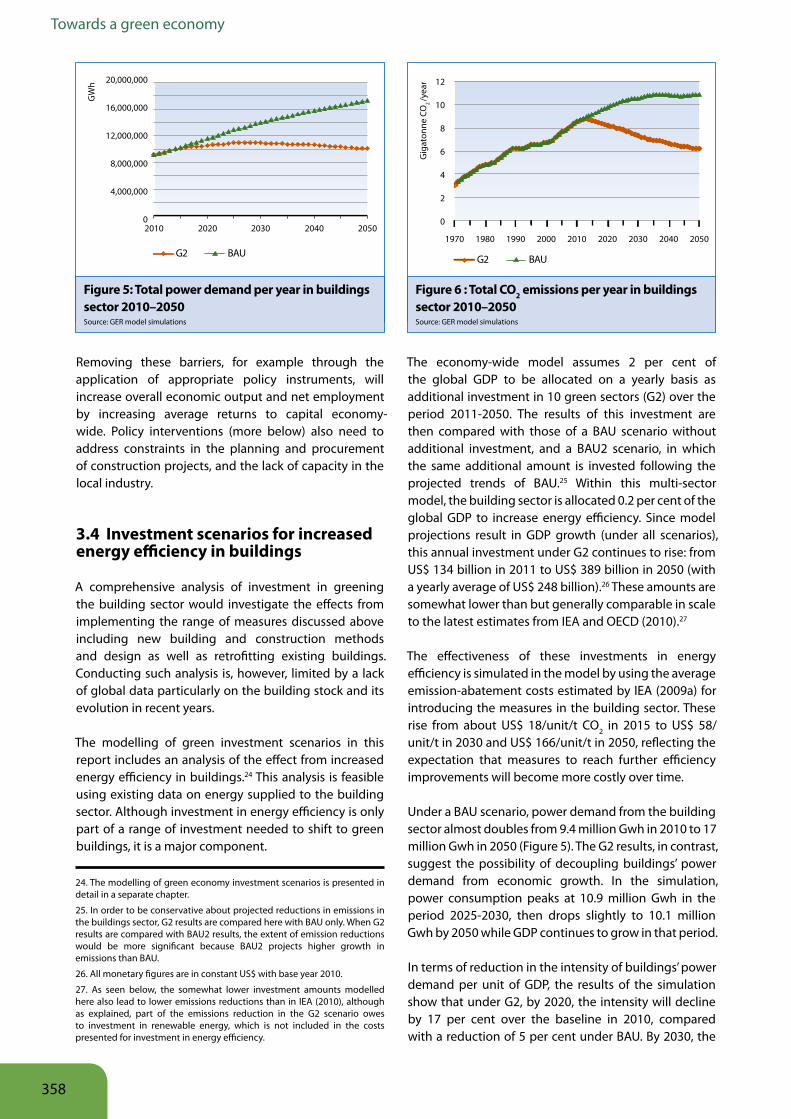
Towards a green economy
Removing these barriers, for example through the application of appropriate policy instruments, will increase overall economic output and net employment by increasing average returns to capital economy-wide. Policy interventions (more below) also need to address constraints in the planning and procurement of construction projects, and the lack of capacity in the local industry.
3 4 Investment scenarios for increased energy efficiency in buildings
A comprehensive analysis of investment in greening the building sector would investigate the effects from implementing the range of measures discussed above including new building and construction methods and design as well as retrofitting existing buildings. Conducting such analysis is, however, limited by a lack of global data particularly on the building stock and its evolution in recent years.
The modelling of green investment scenarios in this report includes an analysis of the effect from increased energy efficiency in buildings.24 This analysis is feasible using existing data on energy supplied to the building sector. Although investment in energy efficiency is only part of a range of investment needed to shift to green buildings, it is a major component.
The economy-wide model assumes 2 per cent of the global GDP to be allocated on a yearly basis as additional investment in 10 green sectors (G2) over the period 2011-2050. The results of this investment are then compared with those of a BAU scenario without additional investment, and a BAU2 scenario, in which the same additional amount is invested following the projected trends of BAU.25 Within this multi-sector model, the building sector is allocated 0.2 per cent of the global GDP to increase energy efficiency. Since model projections result in GDP growth (under all scenarios), this annual investment under G2 continues to rise: from US$ 134 billion in 2011 to US$ 389 billion in 2050 (with a yearly average of US$ 248 billion).26 These amounts are somewhat lower than but generally comparable in scale to the latest estimates from IEA and OECD (2010).27
The effectiveness of these investments in energy efficiency is simulated in the model by using the average emission-abatement costs estimated by IEA (2009a) for introducing the measures in the building sector. These rise from about US$ 18/unit/t CO2 in 2015 to US$ 58/unit/t in 2030 and US$ 166/unit/t in 2050, reflecting the expectation that measures to reach further efficiency improvements will become more costly over time.
Under a BAU scenario, power demand from the building sector almost doubles from 9.4 million Gwh in 2010 to 17 million Gwh in 2050 (Figure 5). The G2 results, in contrast, suggest the possibility of decoupling buildings’ power demand from economic growth. In the simulation, power consumption peaks at 10.9 million Gwh in the period 2025-2030, then drops slightly to 10.1 million Gwh by 2050 while GDP continues to grow in that period.
In terms of reduction in the intensity of buildings’ power demand per unit of GDP, the results of the simulation show that under G2, by 2020, the intensity will decline by 17 per cent over the baseline in 2010, compared with a reduction of 5 per cent under BAU. By 2030, the
24. The modelling of green economy investment scenarios is presented in detail in a separate chapter.
25. In order to be conservative about projected reductions in emissions in the buildings sector, G2 results are compared here with BAU only. When G2 results are compared with BAU2 results, the extent of emission reductions would be more significant because BAU2 projects higher growth in emissions than BAU.
26. All monetary figures are in constant US$ with base year 2010.
27. As seen below, the somewhat lower investment amounts modelled here also lead to lower emissions reductions than in IEA (2010), although as explained, part of the emissions reduction in the G2 scenario owes to investment in renewable energy, which is not included in the costs presented for investment in energy efficiency.
G2 BAU
20,000,000
16,000,000
12,000,000
8,000,000
4,000,000
0
GW
h
2010 2020 2030 2040 2050
G2 BAU
12
10
8
6
4
2
0
Gig
aton
ne C
O2/y
ear
1980 20101990 20001970 2020 2030 2040 2050
Figure 5: Total power demand per year in buildings sector 2010–2050Source: GER model simulations
Figure 6 : Total CO2 emissions per year in buildings sector 2010–2050Source: GER model simulations
358
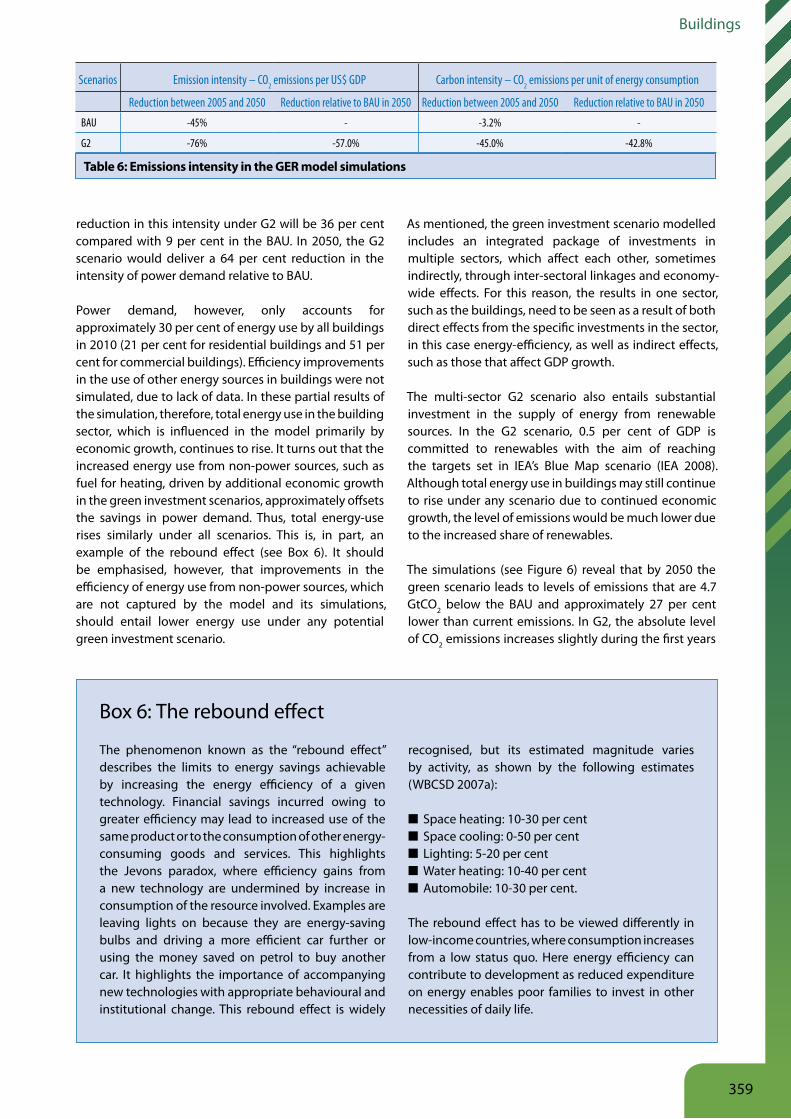
Buildings
reduction in this intensity under G2 will be 36 per cent compared with 9 per cent in the BAU. In 2050, the G2 scenario would deliver a 64 per cent reduction in the intensity of power demand relative to BAU.
Power demand, however, only accounts for approximately 30 per cent of energy use by all buildings in 2010 (21 per cent for residential buildings and 51 per cent for commercial buildings). Efficiency improvements in the use of other energy sources in buildings were not simulated, due to lack of data. In these partial results of the simulation, therefore, total energy use in the building sector, which is influenced in the model primarily by economic growth, continues to rise. It turns out that the increased energy use from non-power sources, such as fuel for heating, driven by additional economic growth in the green investment scenarios, approximately offsets the savings in power demand. Thus, total energy-use rises similarly under all scenarios. This is, in part, an example of the rebound effect (see Box 6). It should be emphasised, however, that improvements in the efficiency of energy use from non-power sources, which are not captured by the model and its simulations, should entail lower energy use under any potential green investment scenario.
As mentioned, the green investment scenario modelled includes an integrated package of investments in multiple sectors, which affect each other, sometimes indirectly, through inter-sectoral linkages and economy-wide effects. For this reason, the results in one sector, such as the buildings, need to be seen as a result of both direct effects from the specific investments in the sector, in this case energy-efficiency, as well as indirect effects, such as those that affect GDP growth.
The multi-sector G2 scenario also entails substantial investment in the supply of energy from renewable sources. In the G2 scenario, 0.5 per cent of GDP is committed to renewables with the aim of reaching the targets set in IEA’s Blue Map scenario (IEA 2008). Although total energy use in buildings may still continue to rise under any scenario due to continued economic growth, the level of emissions would be much lower due to the increased share of renewables.
The simulations (see Figure 6) reveal that by 2050 the green scenario leads to levels of emissions that are 4.7 GtCO2 below the BAU and approximately 27 per cent lower than current emissions. In G2, the absolute level of CO2 emissions increases slightly during the first years
Box 6: The rebound effect
The phenomenon known as the “rebound effect” describes the limits to energy savings achievable by increasing the energy efficiency of a given technology. Financial savings incurred owing to greater efficiency may lead to increased use of the same product or to the consumption of other energy-consuming goods and services. This highlights the Jevons paradox, where efficiency gains from a new technology are undermined by increase in consumption of the resource involved. Examples are leaving lights on because they are energy-saving bulbs and driving a more efficient car further or using the money saved on petrol to buy another car. It highlights the importance of accompanying new technologies with appropriate behavioural and institutional change. This rebound effect is widely
recognised, but its estimated magnitude varies by activity, as shown by the following estimates (WBCSD 2007a):
■ Space heating: 10-30 per cent ■ Space cooling: 0-50 per cent ■ Lighting: 5-20 per cent ■ Water heating: 10-40 per cent ■ Automobile: 10-30 per cent.
The rebound effect has to be viewed differently in low-income countries, where consumption increases from a low status quo. Here energy efficiency can contribute to development as reduced expenditure on energy enables poor families to invest in other necessities of daily life.
Table 6: Emissions intensity in the GER model simulations
Scenarios Emission intensity – CO2 emissions per US$ GDP Carbon intensity – CO2 emissions per unit of energy consumption
Reduction between 2005 and 2050 Reduction relative to BAU in 2050 Reduction between 2005 and 2050 Reduction relative to BAU in 2050
BAU -45% - -3.2% -
G2 -76% -57.0% -45.0% -42.8%
359
Towards a green economy
of the projection. In 2015, it drops back to the 2010 level, which represents a 5.5 per cent reduction compared with BAU. In 2050, worldwide CO2 emissions in the building sector are slightly below the level of 1990 and 43 per cent lower than BAU.
The most important result of these projections is that the green investment scenario for the building sector reaches substantial emission reductions compared with BAU, although the additional investment in the building sector and across the economy leads to an increase in GDP and energy demand. This shows the potential of the integrated investment package to reduce carbon intensity by decoupling economic growth from CO2 emissions.
Table 6 illustrates the general trend for emissions intensity relative to GDP in the building sector and the significant projected reduction of carbon intensity per unit of energy consumption resulting from the additional investment in greening the sector. The investments modelled in G2 result in a reduction of 45 per cent of carbon intensity compared with 2005, reflecting the stabilisation of energy demand through enhanced energy efficiency.
When considering the enactment of a cap and trade mechanism with carbon prices aligned with the 2009 US domestic proposal (reaching US$ 77 per tonne of CO2 by 2030 and US$ 221 by 2050, in constant US$ 2010), the
reduction in emissions in the building sector as a result of the green investment scenario would translate to about US$ 330 billion per year on average between 2012 and 2050.
Finally, energy efficiency will have an impact on job creation and employment. Energy-efficiency investments are estimated to create 0.38 job-years per GWh saved (Wei et al. 2010). The GER model simulations thus estimate that these investments would generate more than 1.2 million jobs by 2030, and a total of 2.6 million jobs by 2050 in the G2 scenario. Additional investments in greening the buildings and construction sector in other ways, such as more sustainable building materials, also have the potential to generate employment. It was not possible to include these in the model simulations, but it is important to note that such a shift will likely also require investments in workers’ education and training in addition to other transitional measures.
In summary, the green investment scenarios are limited in terms of specific investments in the building sector to energy efficiency, and have not been able to capture a wider range of possible measures. However, the results of even these limited simulations reveal the potential savings in buildings’ power demand. When the effects of rising renewable energy use are included, substantial reductions in GHG emissions are projected.
360
Buildings
4 Enabling conditions and policy instruments
The climate and resource-use challenges in the building sector are clear. Technological solutions exist to green the sector at low or even negative average cost. The socio-economic case for greening the sector is strong. But the greening of buildings has not taken place on a large scale in either developed or developing countries.
Besides more general constraints in advancing green building policy and regulation such as those related to governance and capacity, two key barriers relate to (a) financial constraints and (b) market and industry structures. These are discussed below, following which an overview of available instruments and tools is given. The latter will build on research done by the Central European University (CEU) for the UNEP Sustainable Buildings and Construction Initiative (UNEP SBCI 2007b), considering evaluation studies or reviews of policy instruments implemented in countries all over the world. Of key consideration is the relative effectiveness of instruments and tools in achieving high energy savings and GHG reductions, and their cost effectiveness.
4 1 Barriers to green buildings
Barriers to environmental and energy-efficiency improvements in buildings can be economic or financial, resulting from hidden costs and benefits, market failures or a specific market and industry structure. They can also be political or structural, associated with behavioural or organisational constraints, or linked to information and capacity limitations (UNEP SCBI 2007b). Recognising the latter two barriers is of particular importance in a developing-world context. Hidden costs include transaction costs associated with securing energy-efficient solutions and risks associated with replacement technologies (Westling 2003; Vine 2005). Transaction costs are often high owing to the fragmented structure of the building sector with many small owners and agents. Market failures can take the form of misplaced incentives, such as when building tenants (as bill-payers) have an interest in environmental improvements that are not shared by the building owners. While low energy prices may give little incentive for affluent households and businesses in developed countries to change their behaviour, subsidies often keep energy prices in developing countries artificially low and again take away any incentive to change.
Financial constraintsKey financial constraints relate to upfront costs and payback periods, misalignment between investors and beneficiaries, the ability of households to pay, and investors’ policies on what to include in their investment portfolios.
Upfront investment cost and payback period: Although buildings can be greened at low or zero net cost over the lifetime of the investment, the initial additional capital outlay, the so-called “first cost”, could be a deterrent for those who demand finance for greening buildings (home owners, construction firms, and small businesses). In developing countries with acute housing shortages, actual or perceived high upfront costs are often a key barrier. Furthermore, energy-efficient multi-family housing is still widely perceived to be much more expensive to build than is actually the case (in new construction, 20 per cent improvements in energy consumption are achievable with modest financial costs (Brown and Wolfe 2007)).
Moreover, although investments in greening buildings tend to have relatively short payback period (say 5-10 years), many private investors may not proceed unless the net benefit stream starts flowing in within a couple of years. For large-scale green-building programmes, governments usually need to raise significant funds.
Split incentives: A related barrier is that the benefits of energy savings may not go directly to the person making the investment. For example, the owner of a building is likely to be responsible for making energy-efficiency investments, but the occupier may receive the benefit of lower energy bills (although landlords could benefit from higher rents if regulations so allow). On the other hand, if the landlord is responsible for the energy bills, the tenant has no direct incentive to invest in saving energy.
Household ability to pay: Financial capacity is an impediment particularly in multi-family housing where residents often have low incomes. While this group stands to save the highest percentage of income, they are likely to have the greatest difficulty in paying for effective investments, especially as the best results are achieved through a comprehensive retrofitting approach, which encompasses the modernisation
361
Towards a green economy
of the building envelope (insulation and windows), together with the replacement of heating and air-conditioning systems. The benefits of such an approach are clear, with efficiency improvements of 50-75 per cent documented, and savings of 30 per cent routinely achieved.
Institutional investor offering: For financial institutions, energy-efficiency projects in buildings are often associated with the following major hurdles: low financial returns, credit risks, uncertainty, and difficulty in evaluating the added financial value of green buildings. If the projects are small-scale, they do not fit into the traditional financial toolbox. But this situation is also changing. After the recent financial crisis, some long-term institutional investors such as pension funds have started searching for new asset classes to rebalance their portfolios. Green buildings – retrofitted or newly constructed, as well as the manufacturing of related materials and equipment – may become an asset class that can help diversify portfolios and generate steady growth of earnings. Additional discussion on this can be found in the Finance chapter of this report, which includes the case study: “The emergence of responsible property as an asset class”.
Market and industry structureThe building market is highly fragmented with many small landlords, corporate property owners managing multiple buildings, usually in local or regional markets, and public housing authorities, which are also mostly local. Coordination between all these stakeholders in the building and construction value chain is uncommon. By example, decisions taken during the feasibility assessment and design phases will have a major impact on the level of emissions during the building use or operational phase, but feasibility assessments tend not to account for the life-time running costs of the building since these are not paid for by the property developer (UNEP SBCI 2009b).
Owing to the fragmentation of the building market, it is difficult to make use of the Clean Development Mechanism (CDM) as building projects often do not provide sufficient carbon emission reduction pay-off and stakeholder commitment. In addition, the fragmentation also makes it difficult to comply with baselines and additionality requirements. Other obstacles include the CDM methodologies and procedures (see below).
Another aspect of the fragmentation is reflected in the differing interests of individual households and utilities. While householders may be intrigued by the prospect of greening their homes and reaping energy savings and health benefits, utilities face a potential reduction in their sales revenue and therefore may have little interest in supporting investment in green buildings.
4 2 Policy instruments and tools
Following the analysis of UNEP SBCI (2007b), policy instruments and tools for greening buildings can be classified as follows:
■ Regulatory and control mechanisms, which cover
• Regulatory-normative mechanisms such as standards and
• Regulatory-informative mechanisms when the end-user is informed but not obliged to follow the advice (e.g. labelling);
■ Economic or market-based instruments;
■ Fiscal instruments and incentives; and
■ Information and voluntary action.
These categories of instruments and tools are analysed below in terms of their use, efficiency and likely effectiveness in different contexts.
Regulatory and control mechanismsRegulatory and control mechanisms have to be monitored, evaluated and updated regularly to remain in touch with technological developments and market trends. They are easier to enforce with respect to new rather than existing buildings. Examples of such measures are appliance standards, building codes, procurement regulations, energy-efficiency obligations or quotas, mandatory audit programmes and utility demand-side management programmes. Examples of their cost-effectiveness expressed in US$/tCO2 for most of the cases are the following (UNEP SBCI 2007b):
■ Appliance standards: – US$ 65/tCO2 in 2020 (USA), – US$ 194/tCO2 in 2020 (EU);
■ Building codes: from – US$ 189/tCO2 to – US$ 5/tCO2 for end-users (Netherlands);
■ Procurement regulations: US$ 1 million in purchases saves US$ 726,000 per year (Mexico);
■ Energy Efficiency Obligations: – US$ 139/tCO2 (UK);
■ Mandatory certification and labelling: – US$ 30/tCO2
(Australia); and
■ Utility Demand-side Management Programmes: – US$ 35/tCO2 (USA), – US$ 255/tCO2 (EU).
Complications in the use of these regulatory instruments relate mainly to lack of enforcement and the rebound effect, where the end-user buys more of or uses the more efficient technology more extensively than before and
362
Buildings
causes emission reductions to be offset by increased consumption. The latter provides an example of where the instrument needs to be combined with other instruments to guide users to more efficient use of technologies.
Improved enforcement requires adequate education and training, for example, of building-inspection and procurement officers. This is confirmed by recent examples of energy-efficiency improvement measures introduced in the public sector in Mexico, China, Thailand, South Africa, Kenya and Ghana. The case of Mexico has shown how introducing public procurement regulation at the city level may be a more effective point of departure before launching a programme nationally.
In the case of building codes applied to new buildings in developing countries, the basis for improved enforcement can be laid through starting with voluntary schemes, the use of incentives and improved inspection. China is showing how building regulations, together with voluntary and self-regulating market systems for green buildings can become key drivers in ensuring a higher level of energy-efficient construction and the deployment of environmentally-responsive technologies. Anderson, Iyer and Huang (2004) propose with regards to developing countries a structured implementation phase, including the necessary provisions for building code administration and enforcement structures, the development of and conduction of training programmes and the construction of multiple demonstration buildings.
Control and regulatory mechanisms, especially codes and standards, can be a rapid way to implement effective technology and best practices and lure risk-averse investors (Granade et al. 2009). In the general assessment of energy efficiency in building codes two mayor types of energy codes can be identified:
“prescriptive” and “performance-based” (Hitchin 2008; Laustsen 2008). Although performance-based codes are more complex in their application, they yield a number of benefits, These, according to Hitchin (2008), consist in the flexibility for policy makers to weight different aspects of the building’s energy balance, even after the first implementation of the legislation; and also in the possibility of using the calculation procedure to integrate an energy performance labelling scheme or energy audits.
Mandatory energy audits are an extension of building codes and commissioning processes (UNEP SBCI 2009b) and underline the importance of reliable measurement and accounting (Box 7). In many European countries, governments have made energy audits mandatory for their public buildings as well as other major energy consuming sectors. The EU’s Energy Performance in Buildings Directive (EPBD) requires mandatory energy performance certificates to be presented to the customer during any sale or lease transaction of a building. It also requires public buildings of a certain size to publicly display their energy certificates, although critics point out that it does not account for the energy used by buildings’ occupants, which constitutes a large part of overall performance (Ries et al. 2009).
Economic and market-based instrumentsThese instruments include energy performance contracting, cooperative procurement, efficiency
Box 7: Reliable measurement and accounting
To ensure that information is accurate, there is a need to collect robust data on the performance of green buildings and their subsequent costs. Current methods of accounting mainly include energy audits and labelling, Triple Bottom Line28 indicators and sustainability certificates. These tools can be effective, but must be tailored to target group needs. Energy audits and labelling identify opportunities to upgrade built environments and track the progress of existing energy efficiency investments. Recent evidence on the performance gap in one of the certification systems (LEED) has highlighted the importance of such measures (Murphy 2009), triggering renewed discussion on their efficiency. Building certification systems can
be static, i.e. based on engineering design estimates and assumptions, or dynamic, being updated as building-use patterns change. A wide range of audit systems are available, many of which are voluntary, although governments are increasingly favouring mandatory audits as opportunities to collect data and enable interventions. An important challenge posed by energy audits is the significant administrative cost posed by their implementation, including energy consultants, monitoring, and time and resource burdens on the owner. Energy benchmarking, as opposed to auditing, can serve as a lower burden alternative to identify energy-saving potential. In the benchmarking process, energy use is measured and compared with related values.
28. The concept of the Triple Bottom Line (TBL), also known as “people, planet, profit” or “the three pillars” represents a comprehensive set of criteria for evaluating the development of organisations and societies – economically, ecologically and socially.
363
Towards a green economy
certificate schemes and credit schemes such as flexible mechanisms29 introduced under the UNFCCC and most recently, cap-and-trade schemes. Examples of their cost-effectiveness are the following (UNEP SBCI 2007b):
■ Cooperative procurement: – US$ 118/tCO2 saved (USA);
■ Energy efficiency/white certificate schemes: US$ 0.013/kWh expected (France); and
■ Kyoto flexibility mechanisms: – US$ 10/tCO2 (Latvia).
Energy performance contracting involves an energy service company (ESCO) as an implementing agent, guaranteeing certain energy savings over a period of time, implementing improvements and getting paid out of the energy savings. They are already used in the USA, Germany, China and Brazil. They do require supportive legal, financial and business environments and the absences of subsidies that send the wrong energy-price signals. Analysis of the experience in the Netherlands (Keivani et al. 2010) has shown the importance of institutional support for ESCOs that can facilitate measures that reduce energy consumption costs for all stakeholders, particularly households.
Advanced institutional structures are also required for the running of efficiency certificate schemes. The Fund for Electric Energy Savings (FIDE) in Mexico offers a “seal of quality” to certify energy efficient equipment, materials and technologies. FIDE is a joint initiative of the state-owned electric power utility, the Mexican electric workers union and members of the business community (Martinez-Fernandez et al. 2010). The UK Carbon Reduction Commitment (CRC) programme, a cap-and-trade scheme, aims to reduce greenhouse gases by 2050 by at least 80 per cent compared with the 1990 baseline (DECC 2010). Now called the CRC Energy Efficiency Scheme, it applies to organisations that have an electricity consumption measured through half-hourly metering greater than 6,000 MWh per year (equivalent to an annual electricity bill of about £ 400,000-£ 500,000). This covers organisations that fall below the threshold for the European Union Emissions Trading Scheme, yet account for some 10 per cent of the carbon emissions in the UK. These tend to be organisations such as hotels, supermarkets, banks, national and local public authorities. Organisations will purchase their first allowances in 2011, and the more each consumes over 6,000 MWh per year, the more each organisation will have to pay. Participant organisations will report progress annually and pay penalties for non-compliance.
Carbon credit trading schemes crucially require reliable measurement and baselines. One of the reasons that the CDM under the Kyoto Protocol attracted so few building energy-efficiency projects was the fragmentation of the building market with few baselines and reference cases that could be used to determine additionality. High transaction costs and the absence of a sector-specific methodology was another reason for so few CDM projects in developing countries involving the building sector. The accumulative impact of change at the level of many small units has been a further complication. Energy-efficiency projects for buildings are often small in scale and use a variety of measure to decrease overall consumption. The necessity to validate, audit, monitor and verify each measure generates tremendous effort and extra costs that strongly impact the viability of the projects. Other limitations include the methodology to assess the impact of soft or non-technological measures (building design, occupants’ behavior). Finally, CDM has its limitation for the low-income housing sector where energy poverty induces low-energy consumption and carbon emission (Cheng et al. 2008; Schneider 2007; Ellis and Kamel 2007).
Considering ways of improving the use of an international credit scheme for the building sector, industry partners of the UNEP SBCI (2007a) made six recommendations for a post-Kyoto agreement. These underlined the need for using performance-based indicators (eg energy consumption per square metre) along with technology-based indicators, as well as the need for common baselines and national building energy-efficiency standards. In addition, it called for special recognition of energy-efficient housing for low-income groups, providing the poor with access to energy in an efficient manner even while absolute levels of energy consumption may be increasing (Ellis and Kamel 2007).
In April 2010 the Tokyo Metropolitan Government introduced the world’s first cap-and-trade scheme for urban buildings, covering 1,400 buildings, including commercial office buildings and industrial facilities (World Bank and Padeco Co. LTD. 2010)30. At the same time, the Seoul Metropolitan Government started a three-year trial of a carbon-trading system among 47 state-run public agencies, with a goal to achieve a 10 per cent reduction in GHG emissions (Hee-sung 2010).
Common carbon metrics are a recent international initiative to promote sustainability in the building sector. It is being developed by UNEP SBCI, the World Green Building Council (World GBC31) and the Sustainable Building Alliance (SB Alliance32). The focus has been on energy GHG emissions, but the metrics will address waste,
29. Among the flexible mechanisms (sometimes referred to as flexibility or Kyoto mechanisms) introduced under the Kyoto Protocol: Emissions trading, Joint Implementation and Clean Development Mechanism only the latter two are considered in the building sector.
30. It sets a 2020 target of reducing carbon emissions by 25 per cent (below 2000 levels), with a cap set at a level of 6 per cent below base emissions for the first compliance period (2010-14), and then approximately 17 per cent below base emissions from 2014 to 2020.
364
Buildings
water, indoor air quality and financial performance (UNEP SBCI and WRI 2009; UNEP SBCI 2009a).
Fiscal instruments and incentivesThese instruments include energy or carbon taxes, tax exemptions and reductions, public benefits charges, and capital subsidies, grants, subsidised loans and rebates. Further details as well as examples are provided in Box 8. They target energy consumption and/or upfront investment costs. Examples of their cost-effectiveness include (UNEP SBCI 2007b):
■ Tax exemptions: Benefit/Cost Ratio 1:6 for new houses (USA);
■ Public benefits charges: - US$ 53/tCO2 to - US$ 17/tCO2 (USA); and
■ Subsidies: Benefit/Cost Ratio 12:1 (Brazil), - US$ 20/tCO2 (Denmark).
Taxes can reinforce the impact of other instruments such as standards and subsidies, affecting the whole building life cycle and making energy efficiency investments more profitable. They offer governments the possibility of investing tax revenues into green-building improvements. A challenge in their implementation remains low price-elasticity of demand, depending on how households spend their disposable income and the availability of substitute technologies.
Grants and subsidies are well suited to low-income households, which tend not to make investments in energy efficiency even if they have access to capital. By providing unconditional grants and subsidies, governments can provide direct capital rather than access to capital (UNEP 2009b). Grants are also best suited to encourage innovators and small businesses who would like to invest in R&D but find it difficult to access capital from the market. For example, the Danish energy authority made an agreement with the glass industry to develop highly-efficient double-glazed windows (de T’Serclaes 2007). Under the Energy Premium Scheme, the Dutch energy agency provided grants to evaluated buildings for introducing energy-saving measures (Keivani et al. 2010).
For middle- and upper-income households, preferential loans may be more appropriate for those wishing to carry out energy-efficiency improvements. These can be granted through public-private partnerships in which governments give some fiscal incentives to banks, which
in turn establish low interest rates for their customers. For example, KfW, a German development bank, launched preferential loans using a double-edged mechanism to finance them through public tax exemption for investments in efficiency projects coupled with direct public subvention (de T’Serclaes 2007).
For larger-scale, commercial greening efforts, the introduction of reduced fees and waivers can significantly aid the uptake of green building measures. Ordinarily, building and permit fees are significant barriers to new development projects – green or otherwise – as they are non-trivial and have to be paid upfront. Reducing or waiving these fees if a building meets certain green criteria helps stimulate green building development.
Another effective measure for developers is a reduction or temporary freeze in property taxes tied to the energy performance of buildings. These rewards can be used to cover any additional costs that green-building measures incur, meaning that building green need not cost any more than conventional construction. For example, the Oregon Department of Energy offers energy tax credits to businesses that invest in energy conservation, recycling, renewable energy resources and reductions in transportation related energy use on both retrofit and new construction projects. The Business Energy Tax Credit is 35 per cent of eligible project costs, the increased project cost above industry standard. Since the scheme has been introduced more than 7,400 energy tax credits have been awarded (Oregon Department of Energy 2010). Tax exemptions and reductions are efficient in stimulating initial sales of alternative technologies. Important is that the tax credits are sufficiently high to create a real incentive.
Public benefits charges are a special form of energy tax, whose revenues are invested in efficiency improvements. In Brazil for example, all distribution utilities are required to spend at least 1 per cent of their revenue on energy-efficiency improvements. Governments can also require utilities to adopt a business model based on the delivery of energy service (including efficiency improvements) rather than the delivery of energy per se.
Finally, and across several of the categories above, public-sector financial institutions have an important role to play in addressing credit barriers. Backed by governments they also help local financial institutions to share the risk related to energy-efficiency projects. For example, the Asian Development Bank (ADB) has supported green buildings and other energy efficiency programmes through partial credit-guarantee schemes (UNEP 2009b). The total investments towards new energy-efficient green buildings and building retrofits supported by guaranteed loans is expected to exceed US$ 150 million by 2012 (ADB 2009).
31. World GBC is a worldwide union of national Green Building Councils: Available at http://www.worldgbc.org/
32. SB Alliance is an international organisation that regroups key actors from the property and construction industries, standard-setting organisms and national building research centres: Available at http://www.sballiance.org/
365
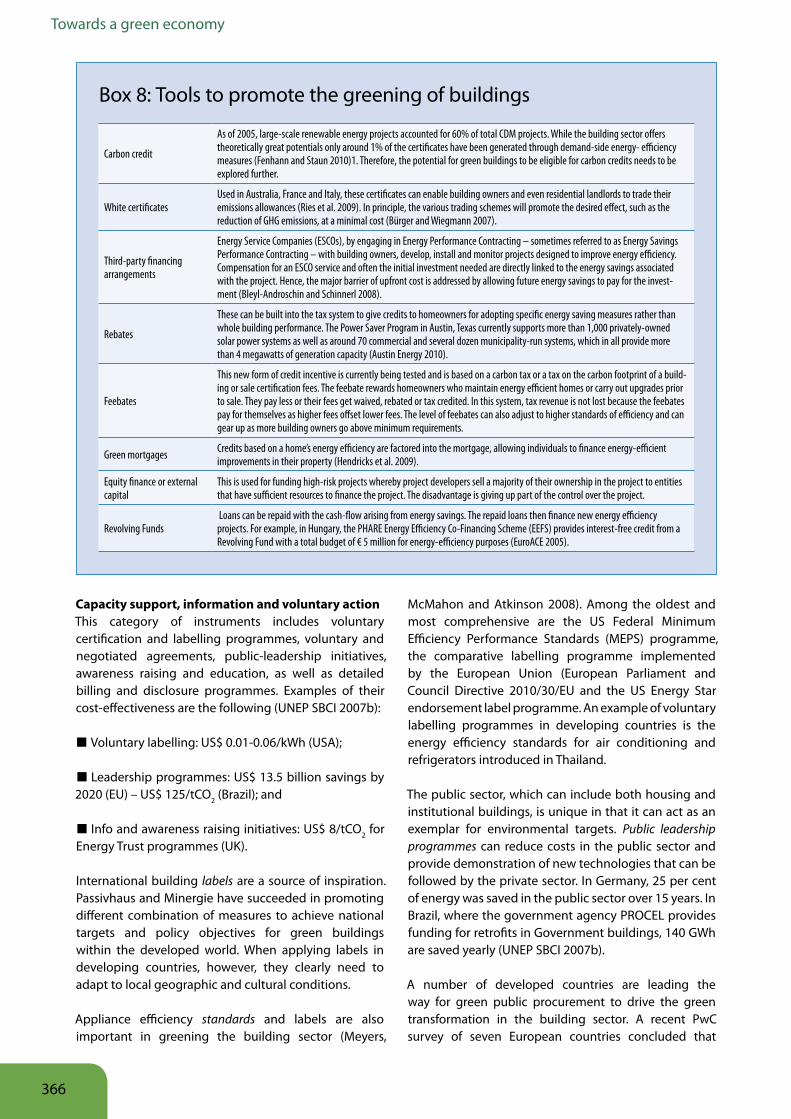
Towards a green economy
Capacity support, information and voluntary actionThis category of instruments includes voluntary certification and labelling programmes, voluntary and negotiated agreements, public-leadership initiatives, awareness raising and education, as well as detailed billing and disclosure programmes. Examples of their cost-effectiveness are the following (UNEP SBCI 2007b):
■ Voluntary labelling: US$ 0.01-0.06/kWh (USA);
■ Leadership programmes: US$ 13.5 billion savings by 2020 (EU) – US$ 125/tCO2 (Brazil); and
■ Info and awareness raising initiatives: US$ 8/tCO2 for Energy Trust programmes (UK).
International building labels are a source of inspiration. Passivhaus and Minergie have succeeded in promoting different combination of measures to achieve national targets and policy objectives for green buildings within the developed world. When applying labels in developing countries, however, they clearly need to adapt to local geographic and cultural conditions.
Appliance efficiency standards and labels are also important in greening the building sector (Meyers,
McMahon and Atkinson 2008). Among the oldest and most comprehensive are the US Federal Minimum Efficiency Performance Standards (MEPS) programme, the comparative labelling programme implemented by the European Union (European Parliament and Council Directive 2010/30/EU and the US Energy Star endorsement label programme. An example of voluntary labelling programmes in developing countries is the energy efficiency standards for air conditioning and refrigerators introduced in Thailand.
The public sector, which can include both housing and institutional buildings, is unique in that it can act as an exemplar for environmental targets. Public leadership programmes can reduce costs in the public sector and provide demonstration of new technologies that can be followed by the private sector. In Germany, 25 per cent of energy was saved in the public sector over 15 years. In Brazil, where the government agency PROCEL provides funding for retrofits in Government buildings, 140 GWh are saved yearly (UNEP SBCI 2007b).
A number of developed countries are leading the way for green public procurement to drive the green transformation in the building sector. A recent PwC survey of seven European countries concluded that
Box 8: Tools to promote the greening of buildings
Carbon credit
As of 2005, large-scale renewable energy projects accounted for 60% of total CDM projects. While the building sector offers theoretically great potentials only around 1% of the certificates have been generated through demand-side energy- efficiency measures (Fenhann and Staun 2010)1. Therefore, the potential for green buildings to be eligible for carbon credits needs to be explored further.
White certificatesUsed in Australia, France and Italy, these certificates can enable building owners and even residential landlords to trade their emissions allowances (Ries et al. 2009). In principle, the various trading schemes will promote the desired effect, such as the reduction of GHG emissions, at a minimal cost (Bürger and Wiegmann 2007).
Third-party financing arrangements
Energy Service Companies (ESCOs), by engaging in Energy Performance Contracting – sometimes referred to as Energy Savings Performance Contracting – with building owners, develop, install and monitor projects designed to improve energy efficiency. Compensation for an ESCO service and often the initial investment needed are directly linked to the energy savings associated with the project. Hence, the major barrier of upfront cost is addressed by allowing future energy savings to pay for the invest-ment (Bleyl-Androschin and Schinnerl 2008).
Rebates
These can be built into the tax system to give credits to homeowners for adopting specific energy saving measures rather than whole building performance. The Power Saver Program in Austin, Texas currently supports more than 1,000 privately-owned solar power systems as well as around 70 commercial and several dozen municipality-run systems, which in all provide more than 4 megawatts of generation capacity (Austin Energy 2010).
Feebates
This new form of credit incentive is currently being tested and is based on a carbon tax or a tax on the carbon footprint of a build-ing or sale certification fees. The feebate rewards homeowners who maintain energy efficient homes or carry out upgrades prior to sale. They pay less or their fees get waived, rebated or tax credited. In this system, tax revenue is not lost because the feebates pay for themselves as higher fees offset lower fees. The level of feebates can also adjust to higher standards of efficiency and can gear up as more building owners go above minimum requirements.
Green mortgages Credits based on a home’s energy efficiency are factored into the mortgage, allowing individuals to finance energy-efficient improvements in their property (Hendricks et al. 2009).
Equity finance or external capital
This is used for funding high-risk projects whereby project developers sell a majority of their ownership in the project to entities that have sufficient resources to finance the project. The disadvantage is giving up part of the control over the project.
Revolving Funds Loans can be repaid with the cash-flow arising from energy savings. The repaid loans then finance new energy efficiency projects. For example, in Hungary, the PHARE Energy Efficiency Co-Financing Scheme (EEFS) provides interest-free credit from a Revolving Fund with a total budget of € 5 million for energy-efficiency purposes (EuroACE 2005).
366
Buildings
energy reduction targets had been put in place by at least two-thirds of all those procurement agencies surveyed in each country, with the UK and Germany reaching 100 per cent. The most common requirements were double-glazing and insulation standards. The study further suggests that where green procurement is applied, a 70 per cent reduction in CO2 emissions per functional unit is achieved while life-cycle costs are reduced by 10 per cent (PricewaterhouseCoopers, Significant and Ecofys 2009).
An example of billing and disclosure programmes is the smartcard meter for prepayment of electricity. Similar to information instruments, these can be particularly effective in targeting households. The use of smartcard meters in households have proven their value recently in South Africa, when electricity supply-shortages have caused the government and the power utility to pay closer attention to demand-side management. Moreover, smart metering providing customers with information on a real-time basis may help reducing energy demand by 5-10 per cent.
With respect to education and training, it is evident that the green transformation the building sector necessitates large numbers of skilled professionals. While in developed countries, there is already a critical mass of such professionals, many developing countries still lack the necessary expertise in the development and implementation of building codes and standards, standards for appliances, green building design, energy auditing, labelling and certification, and energy efficient operation & management (O&M). CEDEFOP (2010) listed the following new skills required for the building industry:
■ Knowledge of new materials, technologies and energy efficiency-adapted technical solutions;
■ Cross-cutting knowledge of energy issues;
■ Understanding other occupations related to building renovation; and
■ Client counselling/advice to meet new market demands.
A Green Skills Checklist prepared for the UK Government (DEFRA, UK and Pro Enviro Ltd 2009) noted the following areas of need for the building sector: building energy management, integration of renewable energy, energy-efficient construction, facilities management (including water and waste management), as well as building energy auditing and carbon rating. Based on its Strategy for Reduction of Energy Consumption in Buildings Denmark is developing a strategic skills development response for the building and construction value chain (CEDEFOP 2010). In Thailand, the Ministry of Energy has launched an initiative to train technicians in energy management, technology and end-use systems in buildings and companies. The Brussels Capital Region has created a Construction
Reference Centre, anticipating possible skills shortages and initiating training programmes to increase the supply of trained labour in the eco-construction industry (Martinez-Fernandez et al. 2010). Courses are offered in, for example, isolation and water proofing, energy efficiency and handling of materials. As part of its Second Green Building Masterplan the Singapore Building and Construction Authority (Singapore BCA 2009) announced a comprehensive training framework aimed at educating around 18,000 green building-design, construction and maintenance professionals over the next 10 years.33
Evaluation of policy instrumentsThe analysis in UNEP SBCI (2007b) of 80 case studies world-wide conclude that regulatory and control measures are probably the most effective as well as the most cost-effective category, at least in developed countries. Grants and rebates are especially needed in developing countries because the first cost-barrier often completely prevents energy efficiency improvements there. Tax exemptions appeared to be the most effective tool in the category of fiscal instruments. Subsidies, grants and rebates can also achieve high savings, but can be costly to society. It was concluded that financial instruments are typically most effective if they are applied in a package with other instruments, such as labelling combined with a tax exemption.
The results of the UNEP SBCI study as well as of the MURE database34 appear to contradict general expectations, especially the high effectiveness and cost effectiveness of regulatory instruments compared with economic ones. These findings are probably specific to the building sector, considering which barriers specific policy instruments address. Regulatory and control instruments are particularly effective in addressing two key barriers in the building sector, namely hidden costs (transaction costs) and market failures.
Governments would be well-advised to consider combinations of policy instruments, an approach likely to result in synergistic impacts and higher savings. Appliance standard are, for example, often combined with labelling and rebates to give incentives for investments beyond the minimum level required by the energy-efficiency standard. Also, labelling of energy-efficient products can be critical in enabling financial incentives such as loans, subsidies and tax credits to be more effective. In the USA, mandatory energy-efficiency
33. For further information and case studies please see Second Green Building Masterplan and Inter-Ministerial Committee on Sustainable Development (2009); A lively and liveable Singapore: Strategies for sustainable growth. Ministry of the Environment and Water Resources (MEWR) and Ministry of National Development (MND), Singapore.
34. The MURE (Mesure d’Utilisation Rationnelle de l’Energy) database, developed by European experts, provides online a description and brief assessment of policy measures for energy efficiency in EU member states. Available at http://www.isisrome.com/mure/
367
Towards a green economy
regulations are coupled with voluntary labels and tax credits for both manufacturers and consumers. This combination eliminates the least efficient products while compensating manufacturers for some of the increased production costs through tax credits and premiums charged for Energy Star designs.
Barriers that are particularly prominent in developing countries are “subsidised, not cost-reflective energy prices, lack of awareness on the importance and the potential of energy efficiency improvements, lack of financing, lack of qualified personnel and insufficient energy service levels” (UNEP SBCI 2007b). Several developing countries have enacted legislation on energy efficiency in buildings. Special enabling factors to support measures for green buildings in developing countries are the need for:
■ Getting the energy price right, so that more efficiency investments become profitable;
■ Technical assistance and training;
■ Demonstration projects and information to build trust;
■ Financial assistance or funding mechanisms;
■ Regulatory measures, such as mandatory audits, combined with incentives such as subsidies or awards;
■ Monitoring and evaluation (requiring baseline data);
■ Institutionalisation (e.g. establishing energy agencies independent of utilities); and
■ Adaptation to local circumstances, including climate and culture.
Clearly, adjusting the priorities of enabling instruments to their context is critical. In developing countries the first step might introduce non-mandatory standards that act as educational platforms. The next move could include mandatory standards, which exclude less efficient products from the market. Subsidies or rebates that provide an incentive to replace old equipment with new, more efficient products are yet a further possible step. At the same time, public leadership and energy-performance contracting can play a key role in public housing projects. In developed countries mandatory standards and regulatory actions are the way to start, followed by rebates for retrofitting and green mortgages.
An integrated policy framework that combines regulatory instruments, such as standards or mandatory audits in certain buildings, capacity-building, training and information campaigns as well as demonstration projects coupled with (fiscal or other) incentives is most likely to effectively reduce GHG emissions in developing countries. The following policy instruments, for example, can be effectively combined (UNEP SBCI 2007b):
■ Standards, labelling and financial incentives;
■ Regulatory instruments and information programmes; and
■ Public leadership programmes and energy performance contracting (EPC) in the public sector.
In assessing the impact of instruments in developing countries, it is important to note that initiatives to address restricted energy services aim not to reduce energy consumption, but rather to ensure more energy services can be accessed and afforded with the available resources.
368
Buildings
5 ConclusionsThe building sector should be central to any attempt to use resources more efficiently. Buildings consume a large proportion of the global energy supply but opportunities to improve efficiency are huge and the sector has the greatest potential – more than any other covered in this report – to reduce global GHG emissions. Great gains can also be achieved from a broader, more holistic approach to buildings; a life-cycle perspective that covers each stage from the building design and the extraction of resources to construction and usage and through to disuse and eventual demolition and the recycling or disposal of the building materials. The most significant environmental impact of buildings lies in their energy demand over decades or even centuries of use. As a result, the design and use of energy efficient buildings has a key part to play in mitigating climate change and the transformation to a global green economy.
Whether construction of new or retrofitting existing buildings, they both offer a high GHG reduction potential and environmental benefits at low cost.
Patterns of energy consumption and emissions, as well as the predicted future trends, vary widely across the developed and developing world. Major regions of the world need to pursue green building strategies that are appropriate to their respective circumstances. For developed countries, which account for most of the existing building stock, the priority is to put in place measures and incentives that will enable large-scale investments in retrofitting programmes. Those will come not only with the benefits of energy savings but also a high potential of net job creation. For developing countries, particularly fast-growing economies that are experiencing a construction boom, the priority is to ensure that new buildings will be green by investing in the most appropriate available technology, whether traditional or high-tech, and design options and avoiding any possible lock-in to an inefficient building stock with long-term consequences.
In both cases, retrofitting and new construction, pay-back periods of investments in energy efficiency are reasonably short and they offer a significant return on investment in the medium- and long-term. On a global scale, aggregated investments in energy efficiency in buildings pay back two fold in energy savings over 20 years. These savings are, in most cases, sufficient to justify investments in greening, beyond the positive externalities associated with mitigating climate change. Greening also brings the opportunity to improve efficiency in use of water, materials and land, and avoid
risks associated with climate change and hazardous substances.
The process of greening buildings and their subsequent use provides a wide range of direct social benefits, including the improved health, productivity and wellbeing of those who live and work in them and the creation of jobs in construction, maintenance and the supply of energy, water and sanitation.
The increase in the productivity of employees working in green buildings can yield labour-cost savings that may be higher than energy-cost savings, which are themselves substantial. The construction of new, green buildings, retrofitting and accompanied use of resource-efficient construction materials, products and energy supply and maintenance can provide net jobs gains and decent work. While the construction industry in many countries has a poor image with respect to meeting workers’ rights, green building offers an opportunity to use improved training, skills management and inspection to improve the quality of employment.
Improved health and quality-of-life benefits of green buildings are equally significant. In developing communities, where most household energy is used for cooking, more efficient appliances (cleaner stoves) can bring extensive economic benefits in the form of reduced health-related expenditure as a result of less illness, associated productivity gains and time-savings. The benefits of simple measures, such as replacing solid fuels with electricity in informal and low-cost housing, are particularly striking when considering the devastating health impacts of indoor air pollution on women and children.
Improved regulation and control, adjusting energy prices to internalise external costs and other policy instruments such as tax exemptions and grants are required to overcome persistent barriers such as market failure and non-cost reflective energy prices in particular:
Despite these opportunities, investment in green buildings is held back owing to assumed cost premiums that are exaggerated and a range of barriers that range from financial constraints to the fragmented structure of the industry. While some barriers relate to hidden costs or benefits and market failure, others relate to behavioral culture, lack of awareness and capacity.
Seeking to address these and create an enabling environment, governments need to take stock and
369
Towards a green economy
determine the most appropriate mix of policy instruments, considering regulatory and control mechanisms, economic or market-based instruments, fiscal instruments and incentives, as well as information and voluntary action. Considering in particular the hidden costs and market-failure barriers the building industry faces, analysis of cases world-wide suggests that regulatory and control measures are likely to be most effective and cost-efficient when adequately implemented. This is particularly the case in developed countries.
Regulatory and control instruments can be combined with other instruments for greater impact, considering local realities such as the level of development of the local market and income-level of households involved. Among fiscal instruments, tax exemptions appear to be the most effective, while subsidies, grants and rebates can achieve high energy savings in developing countries by helping organisations or families overcome upfront investment or first-cost barriers. Examples from Brazil and Thailand have shown high cost-benefit ratios in the use of subsidies and grants to support energy efficiency improvements, combined with mandatory audits, awareness raising, training and demonstration to build capacity and trust in the use of new technologies.
A particular challenge in developing countries, at the same time, is doing away with subsidised, non-cost-reflective energy prices.
Facing global demand for more and better housing and facilities, governments at all levels can lead by example through public procurement and green housing schemes:
Finally, governments can set a leadership example by using public procurement in the construction and management of their facilities to drive the greening of the building sector. Experience from Mexico and China has shown how energy-efficiency improvement programmes in the public sector can also be boosted by the immediate pressure of high energy prices and energy shortages. Public assets, be they in the form of government buildings, hospitals or schools, hold wide-ranging opportunities of greening measures that result in a more efficient use of resources, reduced GHG emissions, improved productivity and avoided illness resulting from indoor air pollution. In addition, government-supported social housing schemes provide an opportunity to combine socio-economic and environmental gains in designing and building single or multi-family homes.
370

Buildings
ADB. (2009). Investing in sustainable infrastructure: Improving lives in Asia and the Pacific. Asian Development Bank, Manila. Available at: http://www.adb.org/Documents/Reports/Sustainable-Infrastructure/pdf.
ADEME. (2008). “Activities related to renewable energy and energy efficiency. Markets, employment and energy stakes 2006-2007. Projections 2012.”
Anderson, J., Iyer, M. and Huang, Y.J. (2004). “Transferred just on paper? Why doesn’t the reality of transferring/adapting energy efficiency codes and standards come close to the potential?” Proceedings of the 2000 ACEEE Summer Study on Energy Efficiency in Buildings. USA.
Anderson, J., Shiers, D. and Steele, K. (2009). The green guide to specification: an environmental profiling system for building materials and components. IHS BRE Press; Wiley-Blackwell, UK; USA.
ASHRAE. (2005). Handbook of fundamentals. American Society of Heating Refrigerating and Air-Conditioning Engineers, Atlanta.
Aumann, D., Heschong, L., Wright, R. and Peet, R. (2004). “Windows and classrooms: Student performance and the indoor environment.” Proceedings of the 2004 ACEEE Summer Study. 7-1.
Austin Energy. (2010). “Energy Efficiency.” [Online] Available at: http://www.austinenergy.com/Energypercent20Efficiency/index.htm. (Accessed 9 January 2011).
Baker, N., Spivey, J., and Florance, A. (2008). “Does green pay off?” Journal of Real Estate Portfolio Management, 14, 4, 385-400.
Baker, N. and Steemers, K. (1999). Energy and environment in architecture: A technical design guide. E&FN Spon, New York.
Ball, M. and Wood, A. (1995). “How many jobs does construction expenditure generate?” Construction Management and Economics, 13, 4, 307-318.
Baumert, K., Herzog, T., and Pershing, J. (2005). “Navigating the numbers: Greenhouse gas data and international climate policy.” World Resources Institute, Washington, D.C.
Betts, M. and Farrell, S. (2009). “Global construction 2020: A global forecast for the construction industry over the next decade.” Global Construction Perspectives and Oxford Economics, London.
Bhandari, R. and Stadler, I. (2009). “Grid parity analysis of solar photovoltaic systems in Germany using experience curves.” Solar Energy, 83, 9, 1634-1644.
Bleyl-Androschin, J.W. and Schinnerl, D. (2008). Comprehensive refurbishment of buildings through energy performance contracting: A guide for building owners and ESCos. Grazer Energieagentur, Graz.
Booz Allen Hamilton (2009). “Green jobs study.” U.S. Green Building Council, Washington, D.C. Available at: http://www.usgbc.org/ShowFile. aspx?DocumentID=6435. [Accessed 10 January 2011].
Brown, M. and Wolfe, M. (2007). “Energy efficiency in multi-family housing: A profile and analysis.” Energy Programs Consortium, Washington, D.C.
Bürger, V. and Wiegmann, K. (2007). “Energieeinsparquote und Weiße Zertifikate. Potenziale und Grenzen einer Quotenregelung als marktorientiertes und budgetunabhängiges Lenkungsinstrument zur verstärkten Durchdringung von nach-frageseitigen.” Energieeinsparmaßnahmen. Öko Institut, Freiburg/Darmstadt.
CEDEFOP. (2010). “Skills for green jobs: European synthesis report”. European Centre for the Development of Vocational Training. Publications Office of the European Union, Luxembourg.
Cena, K. and Clark, J.A. (1981). Bioengineering, thermal physiology and comfort. Elsevier, Amsterdam; New York.
Cheng, C. (2010). “A new NAMA framework for dispersed energy end- use sectors.” Energy Policy, 38, 10, 5614-5624.
Cheng, C., Pouffary, S., Svenningsen, N. and Callaway, M. (2008). “The Kyoto protocol, the clean development mechanism, and the building and construction sector.” A report for the UNEP Sustainable Buildings and Construction Initiative. United Nations Environment Programme, Paris.
CIBSE. (2004). Energy efficiency in buildings. 2nd Edn. Chartered Institution of Building Services Engineers, London.
DECC. (2010). The Carbon Reduction Commitment Order 2010: Summary of main points. Available at: http://www.decc.gov.uk/ publications/basket.aspx?FilePath=188_20090312092018_e_per cent40per cent40_crcdraftordersummary.pdf&filetype=4.
DEFRA, UK and Pro Enviro Ltd. (2009). “Skills for a low carbon and resource efficient economy.” Available at: http://skills4lowcarboneconomy.co.uk/Skills-Checklist.aspx.
EC. (2008). “Summary of the impact assessment.” Accompanying document to the proposal for a recast of the energy performance of buildings directive (2002/091/EC). Commission staff working document, Commission of the European Communities. Available at: http://eur-lex.europa.eu/SECMonth.do?year=2008&month=11.
EIA. (1998). A look at commercial buildings in 1995: characteristics, energy consumption, and energy expenditures. Energy Information Administration, Office of Energy Markets and End Use, U.S. Dept. of Energy, Washington, D.C.
EIA. (2003). “Households, Buildings, Industry & Vehicles end-use energy consumption data & analyses.” [Online]. U.S. Energy Information Administration, Independent Statistics and Analysis, U.S. Dept. of Energy, Washington, D.C. Available at: http://www.eia.doe.gov/emeu/ consumption/index.html. [Accessed 11 January 2011].
EIA. (2010). “International Energy Outlook – Highlights”. U.S. Energy Information Administration, Office of Integrated Analysis and Forecasting, U.S. Dept. of Energy, Washington, D.C. Available at: http:// www.eia.doe.gov/oiaf/ieo/highlights.html
Ellis, J. and Kamel, S. (2007). “Overcoming Barriers to Clean Development Mechanism Projects.” Organisation for Economic Cooperation and Development and the International Energy Agency, Paris.
EuroACE. (2005). “Investing in building energy efficiency in the enlarged European Union.” Klinckenberg Consultants for European Alliance of Companies for Energy Efficiency in Buildings. Available at: ht tp : / /w w w.euroace.org/M ediaPubl icat ions/News/tabid/69/currentpage/10/Default.aspx.
Euro Heat & Power. (2009). “District heating and cooling. Country by country 2009 survey.” Euro Heat & Power, Brussels.
European Renewable Energy Council (2008). Renewable energy technology roadmap: 20 per cent by 2020. Available at: http://www. e re c . o r g / f i l e a d m i n / e re c _ d o c s / D o c u m e n t s / Pu b l i c a t i o n s /Renewable_ Energy_Technology_Roadmap.pdf.
Ezzati, M. and Kammen, D.M. (2002). “Evaluating the health benefits of transitions in household energy technologies in Kenya.” Energy Policy, 30, 10, 815-826.
Fenhann, J. and Staun, F. (2010). “An analysis of key issues in the Clean Development Mechanism based on the UNEP Risoe Clean Development Mechanism pipeline.” Carbon Management, 1, 1, 65-77.
Ghisi, E., Gosch, S. and Lamberts, R. (2007). “Electricity end-uses in the residential sector of Brazil.” Energy Policy, 35, 8, 4107-4120.
Granade, H.C., Creyts, J., Derkach, A., Farese, P., Nyquist, S., and Ostrowski, K. (2009). “Unlocking energy efficiency in the U.S. economy”. McKinsey. Available at: http://www.mckinsey.com/mgi/publications/.
Griffith B., Torcellini P., Long N., Crawley D., and Ryan J. (2006) “Assessment of the technical potential for achieving zero-energy commercial buildings.” National Renewable Energy Laboratory. Conference Paper NREL/CP-550-39830, June 2006 Available at: http:// www.nrel.gov/docs/fy06osti/39830.pdf.
Hammond, G.P. and Jones, C.I. (2008). “Embodied energy and carbon in construction materials.” Proceedings of the Institution of Civil Engineers-Energy, 161, 2, 87-98.
Hawkes, D. (1996). Environmental tradition: Studies in the architecture of environment. 1st Edn. E & FN Spon, London; New York.
Haydock, H. and Arbon, J. (2009). “Study on energy performance of buildings.” European Parliament, Policy Department: Economic and Scientific Policy, Brussels.
References
371
Towards a green economy
Hee-sung, K. (2010). “Seoul hosts carbon emission trade.” Korea.net. [Online]. Available at: http://www.korea.net/detail.do?guid=50220. (Accessed 9 January 2011).
Hendricks, B., Goldstein, B., Detchon, R. and Shickman, K. (2009). “Rebuilding America: A national policy framework for investment in energy efficiency retrofits.” Center for American Progress and Energy Future Coalition, USA.
Herzog, T. (1996). Solar energy in architecture and urban planning. Prestel, Munich; New York.
Hitchin, R. (2008). Can building codes deliver energy efficiency? Defining a best practice approach. A report for the Royal Institution of Chartered Surveyors by the Building Research Establishment, UK.
Houser, T. (2009). “The economics of energy efficiency in buildings.” Peterson Institute for International Economics, Washington, D.C. Available at: http://www.www.piie.com/publications/pb/pb09-17.pdf.
Hutton, G., Rehfuess, E., Tediosi, F. and Weiss, S. (2006). “Evaluation of the costs and benefits of household energy and health interventions at global and regional levels.” World Health Organization, Geneva.
IEA. (2001). Dealing with climate change: Policies and measures in IEA member countries. International Energy Agency, Paris.
IEA. (2008). Energy technology perspectives 2008: Scenarios and strategies to 2050. International Energy Agency, Paris.
IEA. (2009a). World energy outlook 2009. International Energy Agency, Paris.
IEA. (2009b). Key World Energy Statistics. International Energy Agency, Paris.
IEA. (2010a). World energy outlook 2010. International Energy Agency, Paris.
IEA. (2010b). Policy pathways: Energy performance certification of buildings. International Energy Agency, Paris. Available at: http://www.iea.org/publications/free_new_Desc.asp?PUBS_ID=2295.
IEA and OECD. (2010). Energy technology perspectives 2010: scenarios and strategies to 2050. International Energy Agency and the Organisation for Economic Co-operation and Development, Paris.
ILO. (2001). “The construction industry in the twenty-first century: Its image, employment prospects and skill requirements.” TMIC, ILO, Geneva.
ILO. (2009). “Empregos Verdes no Brasil: Quantos são, onde estão e como evoluirão nos próximos anos.” Organização Internacional do Trabalho, Escritorio no Brasil.
IPCC. (2007). “Climate change 2007: Mitigation of climate change.” Contribution of Working Group III to the Fourth Assessment Report of the Intergovernmental Panel on Climate Change. Cambridge University Press, Cambridge; New York.
Jones Lang Lasalle and CoreNet (2009). “Results of the 2009 CoreNet Global and Jones Lang LaSalle global survey on corporate real estate and sustainability.” Available at: http://www.joneslanglasalle.com/ResearchLevel1/JLL_Perspectives_on_Sustainability_CRE_2009_Final.pdf.
Kats, G.H. (2003). “Green building costs and financial benefits.” Massachusetts Technology Collaborative, USA. Available at: http://www.nhphps.org/docs/documents/GreenBuildingspaper.pdf.
Kats, G. (2010). Greening our built world: Costs, benefits, and strategies. Island Press, Washington, D.C. Available at: http://www. cap-e.com/Capital-E/Resources_per cent26_Publications.html.
Keivani, R., Tah, J.H.M., Kurul, E., and Abanda, F.H. (2010). “Green jobs creation through sustainable refurbishment in the developing countries. A literature review and analysis conducted for the International Labour Organization (ILO).” International Labour Office, Geneva. Available at: http://www.ilo.org/public/english/dialogue/ sector/papers/construction/wp275.pdf.
Laustsen, J. (2008). Energy efficiency requirements in building codes, energy efficiency policies for new buildings. International Energy Agency, Paris. Available at: http://www.iea.org/g8/2008/Building_ Codes.pdf
Lawson, B. (1996). “Building materials energy and the environment: Towards ecologically sustainable development.” Royal Australian Institute of Architects.
Loftness, V., Hartkopf, V. and Gurtekin, B. (2003). “Linking energy to health and productivity in the built environment.” Available at: http:// www.usgbc.org/Docs/Archive/MediaArchive/207_Loftness_PA876.pdf.
Luhmann, H.J. (2007). “Smart metering als neue Energie-(effizienz) quelle.” Energie & Management, 6.
Malhotra, M. (2003). “Financing her home, one wall at a time.” Environment and urbanization, 15, 2, 217.
Martinez-Fernandez, C., Hinojosa, C. and Miranda, G. (2010). Greening jobs and skills labour market implications of addressing climate change. OECD Publishing, Paris.
McDonough, W. and Braungart, M. (2002). Cradle to cradle: Remaking the way we make things. 1st Ed. North Point Press, New York.
McGraw Hill (2009). “Green building retrofit and renovation: rapidly expanding market opportunities through existing building.” Smart market report. McGraw Hill Construction, Bedford. Available at: http://construction.ecnext.com/coms2/summary_0249-323452_ITM_analytics.
McKinsey (2009). “Pathways to a Low-Carbon Economy: Version 2 of the Global Greenhouse Gas Abatement Cost Curve.” McKinsey & Company. Available at: https://solutions.mckinsey.com/ClimateDesk/default.aspx
McKinsey (2010). “Energy efficiency: A compelling global resource.” McKinsey & Company. Available at: http://www.mckinsey.com/ clientservice/sustainability/.
Meyers, S., McMahon, J. and Atkinson, B. (2008). “Realized and projected impacts of U.S. energy efficiency standards for residential and commercial appliances.” Environmental Energy Technologies Division, Lawrence Berkeley National Laboratory, University of California, Berkeley. Murphy, P. (2009). The green tragedy: LEED’s lost decade. 1st Ed. Arthur
Morgan Institute for Community Solutions, Yellow Springs, Ohio. Nekhaev, E.V. (2004). “The energy access situation: The nature of the problems ahead.” Presented at the World Energy Technologies Summit, Paris, February 10, 2004.
Nelson, A.J. (2008). “Globalization and global trends in Green real estate investment.” RREEF Research. [Online] Available at: http://www. capitalmarketspartnership.com/ (accessed 5 Jan 2011).
NHHP. (2007). “National urban housing and habitat policy 2007.” Government of India Ministry of Housing & Urban Poverty Alleviation, New Delhi, India. Available at: http://mhupa.gov.in/policies/owingpa/HousingPolicy2007.pdf.
NSF/IUCRC. (2004). “Guidelines for high performance buildings.” Available at: http://cbpd.arc.cmu.edu/ebids/pages/home.aspx
Oregon Department of Energy. (2010). “Business energy tax credits.” Oregon Department of Energy – Conservation Division. [Online] Available at: http://www.oregon.gov/ENERGY/CONS/BUS/BETC.shtml. (Accessed 9 January 2011).
Pike Research. (2009). “Energy efficiency retrofits for commercial and public buildings.” Pike Research, Cleantech Market Intelligence. Available at: http://www.pikeresearch.com/research/energy-efficiency-retrofits- for-commercial-and-public-buildings.
PricewaterhouseCoopers, Significant and Ecofys. (2009). “Collection of statistical information on green public procurement in the EU. PwC Netherlands.” Available at: http://ec.europa.eu/environment/gpp/pdf/ statistical_information.pdf
Ravetz, J. (2008). “State of the stock – What do we know about existing buildings and their future prospects?” Energy Policy, 36, 12, 4462-4470.
Ries, C., Jenkins, J. and Wise, O. (2009). “Improving the energy performance of buildings: Learning from the European Union and Australia.” RAND Corporation, Santa Monica CA.
Roland-Holst, D. (2008). “Energy efficiency, innovation, and job creation in California.” University of California, Berkeley.
Roy, A.U.K., Ahadzi, M., and Saha, S. (2007). “Mass-industrialized housing to combat consistent housing shortage in developing countries: Towards an appropriate system for India.” World Congress on Housing. Available at: http://atiwb.gov.in/U4.pdf.
Sára, B. (2001). “Application of life-cycle assessment (LCA) methodology for valorization of building demolition materials and products.” Proceedings of SPIE: Environmentally conscious manufacturing. Boston, 382-390. Available at: http://link.aip.org/ link/?PSI/4193/382/1&Agg=doi.
Sattler, M.A. (2007). “Habitações de baixo custo mais sustentáveis: A casa alvorada e o centro experimental de tecnologias habitacionais sustentáveis.” Coleção HABITARE / FINEP, volume 8. Associação Nacional de Tecnologia do Ambiente Construído (ANTAC), Porto Alegre.
372
Buildings
Schneider, L. (2007). “Is the CDM fulfilling its environmental and sustainable development objectives? An evaluation of the CDM and options for improvement.” Prepared for the World Wildlife Fund, Berlin.
Singapore BCA (2009). “2nd green building masterplan”. Building and Construction Authority, Singapore.
de Souza, U. (2000). “Managing workers in production: Overview of labour in the building industry.” Translation of a presentation (TG-007), University of Sao Paolo.
Swim, J., Clayton, S., Doherty, T., Gifford, L.L.C.R., Howard, G., Reser, J., Stern, P., and Weber, E. (2009). “Psychology and global climate change: Addressing a multi-faceted phenomenon and set of challenges.” A report by the American Psychological Association’s Task Force on the interface between psychology and global climate change. Available at: http://www.apa.org/science/about/publications/climate-change.pdf.
de T’Serclaes, P. (2007). “Financing energy efficient homes: Existing policy responses to financial barriers.” International Energy Agency, Paris. Thormark, C. (2000). “Environmental analysis of a building with reused building materials.” International Journal of Low Energy and Sustainable Buildings, 1.
Thormark, C. (2006). “The effect of material choice on the total energy need and recycling potential of a building.” Building and Environment, 41, 8, 1019-1026.
UBA. (2006). “Wie private Haushalte die Umwelt nutzen – höherer Energieeffizienz trotz Effizienzsteigerung.” Umweltbundesamt, Germany. Available at: http://www.destatis.de/jetspeed/portal/cms/Sites/destat is/ I nternet/DE/Presse/pk/2006/UGR/UBA-Hintergrundpapier,property=file.pdf.
Ulrich, R.S. (1984). “View through a window may influence recovery from surgery.” Science, 224, 4647, 420.
UN DESA. (2009). “World Population Prospects: The 2008 revision.” United Nations, Department of Economic and Social Affairs, Population Division, New York. Available at: http://www.un.org/esa/population/publications/wpp2008/wpp2008_highlights.pdf.
UNEP. (2009a). “Global green new deal: An update for the G20 Pittsburgh Summit.” United Nations Environment Programme, Pittsburgh. Available at: http://www.unep.org/greeneconomy/LinkClick.aspx?fileticket=ciH9RD7XHwcpercent3d&tabid=1394&language=en-US.
UNEP (2009b). “Energy Efficiency in the Finance Sector: A survey on lending activities and policy issues.” United Nations Environment Programme, Finance Initiative, Geneva. Available at: www.unepfi.org/ fileadmin/documents/Energy_Efficiency.pdf.
UNEP, ILO, IOE, ITUC. (2008). “Green Jobs: Towards decent work in a sustainable, low carbon world.” United Nations Office at Nairobi (UNON), Nairobi.
UNEP SBCI. (2007a). Buildings and climate change: Status, challenges, and opportunities. United Nations Environment Programme, Sustainable Buildings and Construction Initiative, Paris.
UNEP SBC.I (2007b). “Assessment of policy instruments for reducing greenhouse gas emissions from buildings.” United Nations Environment Programme, Sustainable Buildings and Construction Initiative and the Central European University, Budapest. Available at: http://www.unepsbci.org/SBCIRessources/Brochures/documents/Assessment_of_Policy_Instruments_for_Reducing_Greenhouse_Gas_Emissions_from_Buil/SBCI_CEU_Policy_Tool_Report.pdf.
UNEP SBCI. (2009a). “Common carbon metric for measuring energy use and reporting greenhouse gas emissions from building operations.” United Nations Environment Programme, Sustainable Buildings and Climate Initiative, Paris. Available at: http://www.unep.org/sbci/pdfs/ UNEPSBCICarbonMetric.pdf.
UNEP SBCI. (2009b). “Greenhouse gas emission baselines and reduction potentials from buildings in Mexico. A discussion document.” United Nations Environment Programme Sustainable Buildings and Climate Initiative, Paris. Available at: http://www.unep.org/sbci/pdfs/ SBCI-Mexicoreport.pdf
UNEP SBCI. (2010a). “The ‘State of Play’ of sustainable buildings in India.” United Nations Environment Programme, Sustainable Buildings and Climate Initiative, Paris. Available at: http://www.unep.org/sbci/ pdfs/State_of_play_India.pdf
UNEP SBCI. (2010b). “Draft briefing on the sustainable building index.” United Nations Environment Programme, Sustainable Buildings and Climate Initiative, Paris. Available at: http://www.unep.org/sbci/pdfs/SYM2010-UNEP-SBCI_SB_Index_Briefing.pdf
UNEP SBCI and WRI. (2009). “Common carbon metric: Protocol for measuring energy use and reporting greenhouse gas emissions from building operations.” United Nations Environment Programme, Sustainable Buildings and Climate Initiative and the World Resources Institute, Paris. Available at: http://www.unep.org/sbci/pdfs/Common- Carbon-Metric-for_Pilot_Testing_220410.pdf.
UNESCO. (2001). Prices of water in various countries 2001. Go to http://www.unesco.org/water/ and follow the document links.
UNFCCC. (2007). “Investment and financial flows to address climate change.” United Nations Framework Convention on Climate Change, Germany. Available at: www.unfccc.int.
UN-HABITAT. (2010). State of the world’s cities 2010/2011: Bridging the urban divide. Earthscan, London and Washington DC. Available at: http://www.unhabitat.org/pmss/listItemDetails.aspx?publicationID=2917.
Ürge-Vorsatz, D., Arena, D., Herrero, S.T., and Butcher, A. (2010). “Employment impacts of a large-scale deep building energy retrofit programme in Hungary.” Central European University and the European Climate Foundation, Hungary. Available at: https://www.ceu. hu/node/6234.
Van Wyk, L., Kolev, M., Osburn, L., de Villiers, A., and Kimmie, Z. (2009). “Employment aspects of energy-related improvements in construction in South Africa.” Council for Scientific and Industrial Research for the ILO. Joint SECTOR-ENTERPRISE publication. Van Wyk (ed.) (2009). The green building handbook South Africa. Volume 1. Green Building Media, South Africa.
Vine, E. (2005). “An international survey of the energy service company (ESCO) industry.” Energy Policy, 33, 5, 691-704.
Waterwise. (2011a). “Toilet flushing (at home).” [online] (Updated 4 Feb 2011) Available at: http://www.waterwise.org.uk/reducing_water_wastage_in_the_uk/house_and_garden/toilet_flushing_at_home. html (Accessed 4 February 2011).
Waterwise. (2011b). “Choosing a dishwasher.” [online] (Updated 4 Feb 2011) Available at: http://www.waterwise.org.uk/reducing_water_wastage_in_the_uk/house_and_garden/choosing_a_dishwasher. html (Accessed 4 February 2011).
WBCSD. (2007a). “Energy efficiency in buildings: Business realities and opportunities. Summary report.” World Business Council for Sustainable Development, Geneva. Available at: http://www.wbcsd.org/DocRoot/1QaHhV1bw56la9U0Bgrt/EEB-Facts-and-trends.pdf.
WBCSD. (2007b). “The cement sustainability initiative.” World Business Council for Sustainable Development, Switzerland.
WBCSD. (2009). “Energy efficiency in buildings: Transforming . the market.” World Business Council for Sustainable Development, Geneva. Available at: http://www.wbcsd.org/Plugins/DocSearch/details.asp?DocTypeId=25&ObjectId=MzQyMDQ
WBCSD. (2011). “Energy efficiency in buildings. Business Realities and Opportunities.” World Business Council for Sustainable Development, Geneva. Available at: http://www.wbcsd.org/DocRoot/JNHhGVcWoRIIP4p2NaKl/WBCSD_EEB_final.pdf
Wei, M., Patadia, S., and Kammen, D.M. (2010). “Putting renewables and energy efficiency to work: How many jobs can the clean energy industry generate in the US?” Energy Policy, 38, 2, 919-931.
von Weizsäcker, E., Hargroves, K.C., Smith, M.H., Desha, C., and Stasinopoulos, P. (2009). Factor five: Transforming the global economy through 80per cent improvements in resource productivity. A report to the Club of Rome. Earthscan/James & James, UK; USA.
Westling, H. (2003). “Performance contracting. Summary report from the IEA DSM Task X within the IEA DSM implementing agreement.” International Energy Agency, Paris.
WHO. (2009). Global health risks: Mortality and burden of disease attributable to selected major risks. World Health Organization, Geneva.
World Bank and Padeco Co. LTD. (2010). “Cities and climate change mitigation: Case study on Tokyo’s emissions trading system.” World Bank Urban Development Unit. Available at: http://s i t e r e s o u r c e s . w o r l d b a n k . o r g / I N T U R B A N D E V E LO P M E N T /Resources/336387-1226422021646/Tokyo_ ETS_Padeco.pdf.
Wyon, D.P. (2004). “The effects of indoor air quality on performance and productivity.” Indoor Air, 14, 7, 92-101.
Zhou, N., McNeil, M.A., Fridley, D., Lin, J., Price, L., de la Rue du Can, S., Sathaye, J., and Levine, M. (2007). “Energy use in China: Sectoral trends and future outlook.” Lawrence Berkeley National Laboratory, Environmental Energy Technologies Division. Available at: http://china.lbl.gov/ publications/energy-use-china-sectoral-trends-and-future-outlook.
373