Embed Size (px)
Citation preview

Building Resilience in School Children
Risk and Promotive Factors amongst Maltese
Primary School Pupils
Carmel Cefai and Liberato Camilleri
A publication of the
European Centre for Educational Resilience and Socio-Emotional Health
University of Malta

Building Resilience in School Children
Risk and Promotive Factors amongst Maltese
Primary School Pupils
Published by the European Centre for Educational Resilience and Socio- Emotional Health University of Malta, Malta.
First published in 2011
© Carmel Cefai and Liberato Camilleri
All rights reserved. No part of this publication may be reproduced, stored in a retrieval system, or transmitted, in any form or by any means, electronic, mechanical, photocopying, recording or otherwise, without the prior written permission of the authors or the publisher.
ISBN: 978-99957-0-092-8
Design and layout: Liberato Camilleri and Carmel Cefai
Cover design: sayitmalta
Printed in Malta by Printing Unit, University of Malta

Building Resilience in School Children
iii
Contents Contents iii
List of Tables vi
List of Figures ix
List of Boxes xiii
Acknowledgements xiv
The Authors xv
Executive Summary xvii
Chapter 1 Introduction 3 1.1 Rationale 6 1.2 Objectives 7 1.3 Methodology 8
1.3.1 Sample 8 1.3.2 Instruments 9 1.3.3 Analysis 15
1.4 Report Structure 16 PART 1 SEBD and Prosocial Behaviour in Year 4 19 Chapter 2 Prevalence rate of SEBD in Year 4 21
2.1 Prevalence rate of SEBD in Year 4 21 2.2 Change in pupils’ behaviour from Year 1 to Year 4 25
Chapter 3 SEBD by individual, school, home factors 33
3.1 SEBD by individual variables 33 3.1.1 Individual characteristics variables 34 3.1.2 Individual classroom and school variables 35 3.1.3 Individual home and community variables 39 3.1.4 Regression analysis of individual variables 43

Building Resilience in School Children
iv
3.2 SEBD by whole classroom variables 45 3.3 SEBD by whole school variables 48 3.4 Conclusion 49
Chapter 4 Prosocial behaviour by individual, school, home factors 59 4.1 Prosocial behaviour by individual variables 59
4.1.1 Individual characteristics variables 59 4.1.2 Individual classroom and school variables 61 4.1.3 Individual home and community variables 63 4.1.4 Regression analysis of individual variables 66
4.2 Prosocial behaviour by whole classroom variables 67 4.3 Prosocial behaviour by whole school variables 69 4.4 Conclusion 70
PART 2 The Early to Junior Years Trajectory 79
Chapter 5 Trajectory of SEBD from Year 1 to Year 4 81 5.1 SEBD change by individual variables 82
5.1.1 Individual characteristics variables 82 5.1.2 Individual classroom and school variables 84 5.1.3 Individual home and community variables 88
5.2 Whole classroom variables 92 5.3 Whole school variables 94 5.4 Multivariate Logistic regression analysis 96 5.5 The cumulative effect of risk factors 101
Chapter 6 Trajectory of prosocial behaviour from Year 1 to Year 4 115 6.1 Prosocial behaviour change by individual variables 116
6.1.1 Individual characteristics variables 116 6.1.2 Individual classroom and school variables 118 6.1.3 Individual home and community variables 122
6.2 Whole classroom variables 127 6.3 Whole school variables 128 6.4 Multivariate Logistic regression analysis 130 6.5 The cumulative effect of promotive factors 134
Building Resilience in School Children
v
Chapter 7 Risk and promotive factors trajectory 147 7.1 Individual variables 148
7.1.1 Individual characteristics variables 148 7.1.2 Individual classroom and school variables 150 7.1.3 Individual home and community variables 154
7.2 Whole classroom variables 159 7.3 Whole school variables 161 7.4 Conclusion 163
CONCLUSION 179
Chapter 8 Conclusion and recommendations 181 8.1 Overall findings and conclusions 181
8.1.1 Year 4 pupils 181 8.1.2 Strongest risk and promotive predictors 183 8.1.3 Key role of proximal processes in classrooms
and families 187 8.1.4 The relationship between risk and protective
factors 188 8.1.5 Early intervention 189
8.2 Risk and promotive factors and implications for practice 192 8.2.1 Self-efficacy, self-esteem, and communication
skills 192 8.2.2 Gender 194 8.2.3 Disability, health and learning problems 195 8.2.4 Teacher-pupils relationship 196 8.2.5 Peer relationships 198 8.2.6 Teacher-parent relationship 199 8.2.7 Pupil engagement and achievement 200 8.2.8 Academic expectation 201 8.2.9 Family structure and poverty 202 8.2.10 Family relationships and parenting 205 8.2.11 Classroom engagement and sense of community 207 8.2.12 Bullying and misbehaviour at school 209
8.3 Conclusion 213
References 219

Building Resilience in School Children
vi
List of Tables Table 1.1: Individual child variables 13 Table 1.2: Whole classroom and whole school variables 14 Table 2.1: Prevalence rate of SEBD in Year 4 22 Table 2.2: Prevalence rate of SEBD in Year 4 by gender 23 Table 2.3: SEBD categorisation of Year 4 pupils 24 Table 2.4: Teachers’ evaluations of pupils in Year 4 25 Table 2.5: Parents’ evaluations of pupils in Year 4 26 Table 2.6: Teachers’ evaluations of pupils in Year 1 and Year 4 27 Table 2.7: Parents’ evaluations of pupils in Year 1 and Year 4 27 Table 2.8: Mean subscale scores by gender (teachers’ assessment) 28 Table 2.9: Mean subscale scores by gender (parents’ assessment) 29 Table 3.1: Mean total difficulty scores by individual characteristics 30 Table 3.2: Mean total difficulty scores by individual classroom
and school variables 32 Table 3.3: Mean total difficulty scores by individual home and
community variables 36 Table 3.4: Regression analysis of significant individual predictors 40 Table 3.5: Mean total difficulty scores by whole classroom variables 42 Table 3.6: Regression analysis of the whole classroom variables 43 Table 3.7: Mean total difficulty scores by whole school variables 44 Table 3.8: Regression analysis of whole school variables 45 Table 3.9: Significant predictors by teachers’ evaluation 46 Table 3.10: Significant predictors by parents’ evaluation 46 Table 4.1: Mean prosocial scores by individual characteristics 60 Table 4.2: Mean prosocial scores by individual classroom
and school variables 61 Table 4.3: Mean prosocial scores by individual community
and home variables 64 Table 4.4: Regression analysis of individual variables 67 Table 4.5: Mean prosocial scores by whole classroom variables 67 Table 4.6: Regression analysis by whole classroom variables 68 Table 4.7: Mean prosocial scores by whole school variables 69 Table 4.8: Regression analysis of whole-school variables 70

Building Resilience in School Children
vii
Table 4.9: Regression analysis of significant predictors by teachers’ evaluations 71
Table 4.10: Regression analysis of significant predictors by parents’ evaluations 71
Table 5.1: Percentage of pupils by type of SEBD change 82 Table 5.2: Change in SEBD by individual characteristics variables 86 Table 5.3: Odds ratio of significant individual characteristics
variables 84 Table 5.4: Change in SEBD by individual classroom and school
factors 85 Table 5.5: Odds ratio of individual classroom and school variables 87 Table 5.6: Change in SEBD by individual home and community
factors 88 Table 5.7: Odds ratio of significant individual community and
home variables 91 Table 5.8: Change in SEBD by whole classroom variables 93 Table 5.9: Odds ratio of significant whole classroom variables 94 Table 5.10: Change in SEBD by whole school variables 95 Table 5.11: Odds ratio of significant whole school variables 96 Table 5.12: Multivariate logistic regression of all variables by
teachers’ evaluations 97 Table 5.13: Multivariate logistic regression of all variables by
parents’ evaluations 98 Table 5.14: Likelihood of mental health difficulties by number
of risk factors 102 Table 6.1: Percentage of pupils by type of change in prosocial
behaviour scores 116 Table 6.2: Change in prosocial behaviour by individual
characteristics variables 117 Table 6.3: Odds ratio of significant individual characteristics 118 Table 6.4: Change in prosocial behaviour by individual class
and school variables 119 Table 6.5: Odds ratio of significant classroom and school
variables 121 Table 6.6: Change in prosocial behaviour by individual home
and community variables 123

Building Resilience in School Children
viii
Table 6.7: Odds ratio of significant individual community and home variables 125
Table 6.8: Change in prosocial behaviour by whole classroom variables 127
Table 6.9: Odds ratio of significant whole classroom variables 128 Table 6.10: Change in prosocial behaviour by whole school
variables 129 Table 6.11: Odds ratio of significant whole school variables 130 Table 6.12: Multivariate logistic regression of all variables by
teachers’ evaluations 131 Table 6.13: Multivariate logistic regression of all variables by
parents’ evaluations 132 Table 7.1: Percentage of pupils by type of group 148 Table 7.2: Risk and promotive groups by individual
characteristics variables 149 Table 7.3: Odds ratio of significant individual characteristics
variables 150 Table 7.4: Risk and promotive groups by individual classroom
and school variables 151 Table 7.5: Odds ratio of significant individual classroom and
school variables 153 Table 7.6: Risk and promotive groups by individual home and
community variables 155 Table 7.7: Odds ratio of significant individual community and
home variables 159 Table 7.8: Risk and promotive groups by whole classroom
variables 160 Table 7.9: Odds ratio of significant whole classroom variables 161 Table 7.10: Risk and promotive groups by whole school variables 161
Table 7.11: Odds ratio of significant whole school variables 162 Table 7.12: Multivariate logistic regression of all variables by
teachers’ evaluations 163 Table 7.13: Multivariate logistic regression of all variables by
parents’ evaluations 164
Building Resilience in School Children
ix
List of Figures Figure 2.1: Prevalence rate of SEBD in Year 4 23 Figure 2.2: Prevalence rate of SEBD by gender 24 Figure 2.3: Gender differences in emotional difficulties 30 Figure 2.4: Gender differences in conduct problems 30 Figure 2.5: Gender differences in hyperactivity problems 31 Figure 2.6: Gender differences in peer difficulties 31 Figure 2.7: Gender differences in prosocial behaviour 32 Figure 2.8: Gender differences in total difficulties 32 Figure 3.1: Sources of pupil support at school 38 Figure 3.2: What helps pupils in learning 38 Figure 3.3: Pupil’s suggestions on ways of improving behaviour 39 Figure 3.4: Source of pupil support at home 42 Figure 3.5: Pupils’ participation in local community activities 43 Figure 3.6: Classroom management 47 Figure 3.7: Best predictors of total difficulty scores of Year 4 pupils 51 Figure 3.8: Total difficulty scores by teacher-reported self-esteem 52 Figure 3.9: Total difficulty by parental academic expectations 52 Figure 3.10: Total difficulty scores by teacher-reported engagement 53 Figure 3.11: Total difficulty scores by teacher-reported pupil
relationship with peers 53 Figure 3.12: Total difficulty by pupil support from close friends 54 Figure 3.13: Total difficulty scores by father occupation 54 Figure 3.14: Total difficulty scores by family time 55 Figure 3.15: Total difficulty scores by pupil’s behaviour at home 55 Figure 3.16: Total difficulty by pupils’ relationship with siblings 56 Figure 3.17: Total difficulty scores by pupils’ behaviour during play 56 Figure 3.18: Total difficulty by sense of classroom community 57 Figure 3.19: Total difficulty score by repeating a year 57 Figure 4.1: Best predictors of prosocial scores for Year 4 pupils 72 Figure 4.2: Prosocial scores by gender 73 Figure 4.3: Prosocial scores by parent-reported self-efficacy 73 Figure 4.4: Prosocial scores by teacher-parents communication 74 Figure 4.5: Prosocial scores by pupil relationships with peers 74

Building Resilience in School Children
x
Figure 4.6: Prosocial scores by family structure 75 Figure 4.7: Prosocial scores by family time 75 Figure 4.8: Prosocial scores by child’s behaviour at home 76 Figure 4.9: Prosocial scores by family conflict 76 Figure 4.10: Prosocial scores by pupils’ participation in lessons 77 Figure 4.11: Prosocial scores by medication or therapy 77 Figure 5.1: Best predictors of SEBD change 99 Figure 5.2: Likelihood of mental health difficulties by risk factors 102 Figure 5.3: Change in SEBD by gender 103 Figure 5.4: Change in SEBD by pupil communication 103 Figure 5.5: Change in SEBD by teacher-reported self-esteem 104 Figure 5.6: Change in SEBD by teacher reported self efficacy 104 Figure 5.7: Change in SEBD by pupil-reported academic progress 105 Figure 5.8: Change in SEBD by parental academic expectations 105 Figure 5.9: Change in SEBD by teacher-reported engagement 106 Figure 5.10: Change in SEBD by teacher-parent communication 106 Figure 5.11: Change in SEBD by teacher-pupils relationship 107 Figure 5.12: Change in SEBD by pupils-teacher relationship 107 Figure 5.13: Change in SEBD by relationships with peers 108 Figure 5.14: Change in SEBD by support from close friends 108 Figure 5.15: Change in SEBD by family structure 109 Figure 5.16: Change in SEBD by child’s behaviour at home 109 Figure 5.17: Change in SEBD by child’s communication with parents 110 Figure 5.18: Change in SEBD by child’s participation in organizations 110 Figure 5.19: Change in SEBD by parenting stress 111 Figure 5.20: Change in SEBD by parenting supervision 111 Figure 5.21: Change in SEBD by pupils’ participation in lessons 112 Figure 5.22: Change in SEBD by pupils’ behaviour at school 112 Figure 5.23: Change in SEBD by bullying at school 113 Figure 5.24: Change in SEBD by pupil’s friends at school 113 Figure 6.1: Best predictors of prosocial behaviour change by
teachers’ and parents’ evaluations 133 Figure 6.2: Likelihood of mental health difficulties by number
of promotive factors 135 Figure 6.3: Change in prosocial behaviour by gender 136 Figure 6.4: Change in prosocial behaviour by communication 136

Building Resilience in School Children
xi
Figure 6.5: Change in prosocial behaviour by teacher-reported self-esteem 137
Figure 6.6: Change in prosocial behaviour by teacher-reported self-efficacy 137
Figure 6.7: Change in prosocial behaviour by parent-reported self-efficacy 138
Figure 6.8: Change in prosocial behaviour by parental academic expectation 138
Figure 6.9: Change in prosocial behaviour by teacher-reported pupil’s engagement 139
Figure 6.10: Change in prosocial behaviour by teacher-parent communication 139
Figure 6.11: Change in prosocial behaviour by teacher-pupils relationship 140
Figure 6.12: Change in prosocial behaviour by teacher-reported pupil’s relationship with peers 140
Figure 6.13: Change in prosocial behaviour by pupil’s support from close friends 141
Figure 6.14: Change in prosocial behaviour by family structure 141 Figure 6.15: Change in prosocial behaviour by family income 142 Figure 6.16: Change in prosocial behaviour by communication
between pupil and parents 142 Figure 6.17: Change in prosocial behaviour by pupil’s relationship
with relatives 143 Figure 6.18: Change in prosocial behaviour by parent-reported
pupil’s friends 143
Figure 6.19: Change in prosocial behaviour by family conflict 144 Figure 6.20: Change in prosocial behaviour by pupils’ classroom
participation in lessons 144 Figure 6.21: Change in prosocial behaviour by pupils’ sense of
classroom community 145 Figure 6.22: Change in prosocial behaviour by classroom resources 145 Figure 6.23: Change in prosocial behaviour by pupils’ engagement
in school activities 146 Figure 6.24: Change in prosocial behaviour by school bullying 146

Building Resilience in School Children
xii
Figure 7.1: Best risk and promotive predictors by teachers’ and parents’ evaluations 165
Figure 7.2: Risk and promotive groups by gender 167 Figure 7.3: Risk and promotive groups by pupil communication 167 Figure 7.4: Risk and promotive groups by teacher-reported
pupil self-esteem 168 Figure 7.5: Risk and promotive groups by teacher-reported
pupil self-efficacy 168 Figure 7.6: Risk and promotive groups by pupil-reported pupil
academic progress 169 Figure 7.7: Risk and promotive groups by parental academic
expectations 169
Figure 7.8: Risk and promotive groups by pupil learning difficulties 170 Figure 7.9: Risk and promotive groups by communication
between teacher and parent 170 Figure 7.10: Risk and promotive groups by relationship between
teacher and pupil 171 Figure 7.11: Risk and promotive groups by teacher-reported pupil
relationship with peers 171 Figure 7.12: Risk and promotive groups by pupil friends at school 172 Figure 7.13: Risk and promotive groups by family structure 172 Figure 7.14: Risk and promotive groups by family income 173 Figure 7.15: Risk and promotive groups by family time 173 Figure 7.16: Risk and promotive groups by pupil’s home behaviour 174 Figure 7.17: Risk and promotive groups by family cohesion 174 Figure 7.18: Risk and promotive groups by parenting stress 175 Figure 7.19: Risk and promotive groups by parental supervision 175 Figure 7.20: Risk and promotive groups by pupils’ sense of
classroom community 176 Figure 7.21: Risk and promotive groups by pupils’ school
behaviour 176 Figure 7.22: Risk and promotive groups by pupils’ engagement in
school activities 177 Figure 7.23: Risk and promotive groups by school bullying 177

Building Resilience in School Children
xiii
List of Boxes
Box 8.1 Window of Vulnerability 183 Box 8.2 Window of Opportunity 184 Box 8.3 Portrait of healthy students 185 Box 8.4 Moving beyond risk to resilience 190 Box 8.5 Emotional Literacy through Circle Time 196 Box 8.6 Pupils’ recommendations on learning and behaviour 202 Box 8.7 Supporting single parent families 203 Box 8.8 Protective Factors for Promoting Healthy Families 206 Box 8.9 Dealing with bullying and violence at school 210 Box 8.10 Promoting a positive school climate 212

Building Resilience in School Children
xiv
Acknowledgements
The authors would like to express their deep appreciation to the following for making this research project and publication possible: • The Research Fund Committee at the University of Malta for
partially funding this project. • All the schools which participated in the project, including the
College Principals and Heads of Schools, the schools’ clerical staff, and all the classroom teachers, pupils and parents who completed the questionnaires.
• The data collection team led by Rosette Dimech and other students on the M.Ed, SEBD and M.Ed Inclusion and IENs at the Faculty of Education.
• Marisa Farrugia for inputting the data. • Our colleague Professor Paul Cooper (University of Leicester,
UK) who was a key partner in the initial national study which preceded this study.

Building Resilience in School Children
xv
The Authors
CARMEL CEFAI is the Director of the European Centre for Educational Resilience and Socio-Emotional Health, and a senior lecturer in Psychology at the University of Malta. He is a visiting fellow at the School of Education, University of Leicester, UK. He studied education and psychology at the University of Malta and various Universities in the UK, completing his PhD at the University of London. He is the author of various papers in international and local journals; his books include Promoting Resilience in the Classroom; Engagement Time: A National Study of Students with Social, Emotional, and Behaviour Difficulties in Maltese schools (with P. Cooper and L. Camilleri), Promoting Emotional Education (with P. Cooper), Nurture Groups in Primary Schools (with P. Cooper), and Healthy Students Healthy Lives (with L. Camilleri). Carmel is founding joint editor of the International Journal of Emotional Education and founding Honorary Chair of the European Network for Social and Emotional Competence (ENSEC). He is the coordinator of an international research project on the promotion of mental health in children and young people. His research interests include social and emotional literacy in school, educational resilience, and socio-emotional health in childhood and adolescence. LIBERATO CAMILLERI is a senior lecturer in Statistics at the Faculty of Science, University of Malta. He studied Mathematics and Statistics at the University of Malta and received his PhD in Applied Statistics in 2005 from Lancaster University. His research specialization areas are related to statistical models, which include Generalized Linear models, Latent Class models, Multi-Level models, Random Coefficient models and Survival models. Liberato is the author of several papers that are published in statistical journals and conference proceedings. His most recent publications include SEBD in Maltese Schools - A Multilevel model; Bias of Standard Errors in Latent Class Model Applications using Newton-Raphson and EM Algorithms; Latent Class Mixture models for

Building Resilience in School Children
xvi
analyzing rating responses; Models for Market Segmentation; Assessing the Performance of Information Criteria to determine the optimal number of segments in a Latent class framework; Standard error estimation in EM applications related to Latent Class models; Latent Class Analysis for segmenting preferences of investment bonds (best paper award). Liberato has co-authored a number of publications with local and foreign researchers in several fields of application including neural networks, operations research, market research, education, SEBD, and atmospheric chemistry. He has also contributed to a research project to devise a standardized test that measures spelling and reading abilities of school children. Liberato is a member of the international scientific committee COSME.

Building Resilience in School Children
xvii
Executive Summary
This study was a follow up to the national study on social, emotional and behaviour difficulties which sought to establish the prevalence rate and the pattern of distribution of such difficulties in Maltese primary and secondary schools (Cefai, Cooper and Camilleri, 2008). It examined the trajectories and drivers of change, both positive and negative, from Year 1 to Year 4 in primary schools.
The sample consisted of all Year 1 primary pupils who had participated in the first study and who were now in Year 4. 486 pupils attending 65 state and non-state primary schools, as well as their classroom teachers and parents were selected to participate. 79.6% of teachers, 84.2% of pupils and 61.9% of parents returned the completed questionnaires.
The first part of this report provides a portrait of pupils’ behaviour in Year 4. 9.4% of Year 4 pupils have SEBD according to teachers, while the prevalence rate according to parents is 7.8%, although the difference is not significant. The most common difficulties are those related to hyperactivity, followed by conduct and emotional problems respectively. Boys appear to be more vulnerable than girls, exhibiting more difficulties and less prosocial behaviour. Both difficulties particularly conduct and peer problems, and prosocial behaviour, increased from Year 1 to Year 4.
Pupils’ relationships with peers, engagement in learning, support from close friends, parental expectations, family time, father occupation, sense of classroom community, and behaviour at home are some of the strongest predictors of SEBD in Year 4. None of the whole school variables emerged as significant variables when analyzed collectively with the other variables.

Building Resilience in School Children
xviii
Positive relationship with peers and gender emerged as the key predictors of prosocial behaviour in Year 4, but family and parents characteristics also appear to be particularly important predictors. Year 4 pupils most likely to exhibit prosocial behaviour are female pupils who have good relationships with peers, have high self-efficacy, and whose parents and teacher communicate well together; attend classrooms with high levels of pupils’ engagement; are well behaved at home and come from two-parent families which provide quality time and have low levels of conflict.
The second part of this report presents the findings of the
longitudinal study, examining how both SEBD and prosocial behaviour changed from Year 1 to Year 4, and how the changes were related to individual, school, home and community factors. The pupils most likely to develop SEBD from Year 1 to Year 4 appear to be those who attend schools with high levels of bullying, come from single parent families, have poor communication difficulties, poor relationship with teachers, peers, friends and parents, and have parents who are stressed and have low academic expectations for their children. The more risk factors they are exposed to, the more likelihood of difficulties in their social and emotional wellbeing and academic success. One out of every eleven children is at high risk (60% chance) for developing mental health problems, while 3% are at very high risk (75% chance of developing mental health difficulties when exposed to five or more risk factors). However, some risk factors may be more likely to lead to SEBD than others.
On the other hand, the pupils most likely to engage in prosocial behaviour over time in primary school, are those who have good relationships with their peers and the class teacher, attend schools where bullying is low, have good self-efficacy and self-esteem, are actively engaged in the learning process, and come from two parent families with good income. The more such factors are present in pupils’ lives, the more likely the latter are to enjoy psychological wellbeing and mental health. The chance of having mental health problems when at least five promotive factors are
Building Resilience in School Children
xix
present is 0%, compared to 60% when no promotive factors are present.
When all the factors were examined to identify which of these discriminated the risk (pupils who show an increase in SEBD and a decrease in prosocial behaviour) from the promotive group (pupils who manifest an increase in prosocial behaviour and a decrease in SEBD), a similar though not identical picture emerged. The factors most likely to lead towards a healthy social-emotional trajectory in the early primary school years, include pupils’ relationship with friends, teacher and peers, low bullying in school, pupils’ active engagement and good academic progress, high self-esteem and self-efficacy, two-parent families with good income, adequate supervision and quality time, low parenting stress and high parental expectations. The more pupils have of these positive factors, the more likely their social and emotional development, mental health and school success will improve.
About 10% of Maltese young children are experiencing significant difficulties in their social and emotional development and are at significant risk of experiencing mental health problems. We can protect the young child from SEBD, mental health problems and school failure, if we reduce the significant risk factors and increase the promotive ones within the various systems in which the child operates, with a particular focus on building healthy, supportive and responsive families and schools. The study has identified particular windows of vulnerability which need to be closed as early in children’s lives as possible, as well as windows of opportunity which might be developed to support the healthy development of young children. Our efforts need to be particularly directed towards reducing bullying at school, supporting single parents, developing children’s communication skills, self-esteem and self-efficacy, building closer relationships between the child and his/her teacher and peers, strengthening the school-family collaboration, and raising parental academic expectations for their children.

Building Resilience in School Children
xx

Introduction
1

Building Resilience in School Children
2
Introduction
3
Children’s social and emotional health, wellbeing and difficulties are becoming an issue of increasing concern and importance in schools today. The Health Behaviour School Checklist study carried out amongst secondary school students in about thirty countries, reported that Maltese children and young people were with the bottom group in the list in terms of perceived health, subjective well-being and relationships with parents (WHO, 2008). They felt amongst the most pressured students in the study, with the pressure increasing across the secondary school years. Although school-based bullying was reported to be lower than the European Union (EU) average, violence was well above the average, particularly amongst 13-15 year old students, with 13 per cent of female and 26 per cent of male 13-year olds engaging in frequent fighting. Alcohol consumption amongst 13-15 year olds was at the top of the league, with 21% of female and 28% of male 13-year old students drinking weekly, rising to 39% and 51% of 15-year olds respectively. The report Children 2010 (NSO, 2010) reported that the Maltese law courts referred 250 cases of children/young people to the Probation Services between 2002 and 2008: almost half of the reported incidences involved theft, 16 per cent violence and 13 per cent juvenile drug-related offences.
1
Building Resilience in School Children
4
Another study amongst 23 OECD countries, based upon reports from school staff, indicated that almost half of lower secondary students in Malta intimidated or verbally abused other students, which was significantly higher than the study average (OECD, 2009). Maltese teachers said that students intimidating and verbally abusing other students (almost 50% of the teachers) or staff themselves (20% of the teachers) interfered with the quality of their instruction.
It may come as no surprise, in view of such statistics, that school teachers often prefer teaching students with other types of difficulty, such as physical or intellectual disability, than pupils with social, emotional and behaviour difficulties (SEBD) (Avramadis and Norwich, 2002; Kalambouka et al., 2007; Tanti Rigos, 2009). Indeed students with SEBD are usually the least liked and understood students (Baker 2005; Kalambouka et al., 2007; Tanti Rigos, 2009), the least likely to receive effective and timely support (Kalambouka et. al., 2007; Ofsted, 2007) and the least likely to be included (McBeath et. al., 2006). They are the only group for whom punitive, exclusionary responses are still permitted by law (Cooper 2001), a fact which makes SEBD the only individual educational needs category which exposes the student to increased risk of exclusion as a function of its identification (Jull, 2008). The high incidence of SEBD among excluded students (Parsons et al., 2001; ORegan, 2010) indicates that in the case of SEBD, schools in general tend to be more willing to consider exclusion as a legitimate resolution, than is the case for other forms of individual educational needs. Maltese students with SEBD frequently complain of feeling unloved and unwanted by their teachers and school staff, victims of an unjust and rigid system, unsupported in their needs and excluded from the academic and social aspects of school life (Cefai and Cooper, 2010).
Young people with SEBD are also the most vulnerable students to school failure and premature school leaving, social exclusion and mental health problems (Cole, Daniel and Visser, 2005; Fergusson, Horwood and Ridder 2005; Colman et al. 2009). They are more at risk of engaging in such behaviours as substance abuse, violence and criminality, and to leave school without any
Introduction
5
certification or vocational skills, with consequent poor employability opportunities (Maes and Lievens 2003; Fergusson, Horwood and Ridder 2005; Colman et al., 2009). Seen in this way such young people may end up as an economic burden on the country’s resources, including health and social services.
It is thus to be expected that social, emotional and behaviour
difficulties in school continue to generate considerable debate amongst educationalists, parents and other stakeholders. The debate has been frequently characterized, however, by outdated and sterile arguments which seek to apportion blame or to pose simplistic and ill-informed explanations. Changing social and cultural values, commercial pressures and excessive consumerism, increasing children’s rights, increasing poverty and inequality, family discord and breakups, parental incompetence and absence, media violence, weakening of connectedness and social support in communities, increasing stress in families and children, negative peer pressure, learning difficulties and consequent lack of support at school, academic stress, unrelated and irrelevant curriculum, are some of the common factors frequently cited as being at the cause of SEBD. Depending on one’s position, understanding and beliefs, one or more of these factors are sometimes put forward to explain behaviour difficulties in school.
Informed research-based discourse in the international
literature has moved away from the erstwhile simplistic mono-causal explanations for SEBD, underlining the complexity and multi-factorial nature of the phenomenon (Cooper and Jacobs, 2011; Cooper, Bilton and Kakos, in press). SEBD are best seen as a dynamic, multi-layered phenomenon that results from a wide range of influence that coalesce to create an increasingly cumulative effect. Various biological, psychological, educational and social factors influence the nature and development of SEBD, and an adequate understanding, prevention and management of such difficulties require that we examine how various individual, home and school factors interact in the development of such difficulties (Cooper, Bilton and Kakos, in press).

Building Resilience in School Children
6
1.1 Rationale
This backdrop underlines the rationale of the study. We needed to know how many of our school children were facing social, emotional and behaviour difficulties, where these children were, what was causing these children to behave in this way, and what can be done to prevent and address these difficulties effectively. We needed to identify those factors which put school children more at risk for developing SEBD at school, as well as what helped to protect children from such difficulties and promoted their healthy social and emotional development. We also needed to identify these risk and protective factors in children’s school lives as early as possible. Although the prevalence of SEBD is higher in secondary schools, there is a concern about the increasing incidence of such difficulties in primary schools. While presently there are more difficulties in secondary schools (Cefai, Cooper and Camilleri, 2008), such difficulties are starting earlier in primary school with a greater rate of increase in the early and junior primary years (Farrell and Humphrey, 2009; Rose et al al., 2009; Cooper and Jacobs, 2011).
This pattern is a cause for increasing concern as the onset of
SEBD at an early age is a predictor of social and academic difficulties in adolescence (Fergusson, Horwood, and Ridder, 2005; Rose et al., 2009). Farrell and Polat (2003) argue that while children who are formally identified by local educational authorities as having SEBD tend to be nine years old or older, it is clear that many of these children have been identified as having such problems well before they were formally assessed, as early as the first year in primary school. This underlines the need for early identification and consequent early intervention before difficulties become more serious and entrenched in children’s behaviour patterns (National Institute for Health and Clinical Excellence, 2008; Farrell and Humphrey, 2009; DataPrev Project, 2011; Domitrovich, Cortes and Greenberg, 2007).

Introduction
7
Clearly, understanding and establishing the nature, distribution and causes of SEBD in school as early as possible in the pupils’ lives, is instrumental in developing and implementing effective policies and interventions to address the needs of such pupils. The absence of epidemiological data on the distribution, nature and of SEBD in Maltese schools constitutes a barrier to developing effective early responses to such difficulties.
In view of this situation, the authors undertook a national
study of social, emotional and behaviour difficulties in Maltese schools (Cefai, Cooper and Camilleri, 2008) It was a survey based on 10% of the entire school population in Malta with the aim of identifying the national patterns of distribution of children and young persons with social, emotional and behavioural difficulties in primary and secondary schools in Malta. The study sought to establish the prevalence of school children having SEBD, the pattern of their distribution within different schools, and the relationship between distribution and individual, school, family and socio-economic factors. The second part of the study was a longitudinal study seeking to identify the risk and promotive factors for SEBD in school. 1.2 Objectives
The present report presents the findings of the first longitudinal study carried out following the national study in 2008. The longitudinal study included those pupils who were in Year 1 in the initial study and who were now in Year 4. Using data from the SEBD national project together with other data collected three years later, the study examined the trajectories and drivers of change, both positive and negative, across two time periods, namely Year 1 to Year 4. More specifically the study sought to address the following questions:

Building Resilience in School Children
8
• What is the prevalence of SEBD amongst Year 4 pupils and how does it compare with the prevalence rate established in the national study three years earlier?
• What individual, school and home factors predict SEBD or prosocial behaviour amongst Year 4 pupils?
• What factors predict an increase in SEBD and in prosocial behaviour from Year 1 to Year 4?
• What factors predict an increase in SEBD/decrease in prosocial behaviour (risk factors) and decrease in SEBD/increase in prosocial behaviour (promotive factors) from Year 1 to Year 4?
• What is the cumulative effect of risk and promotive factors on the mental health of primary school children?
1.3 Methodology 1.3.1 Sample
The sample in this study included all Year 1 primary pupils who had participated in the first study and who were now in Year 4. These pupils were originally chosen at random from classrooms selected through cluster sampling from a number of schools which provided a proportional representation of the school population by school region. This geographical representation is essential to ensure correct inferences. The sample consisted of 232 male and 254 female Year 4 pupils attending 65 state and non-state primary schools in Malta. The parents and classroom teachers of the selected pupils were also asked to participate in the study by providing essential information about the pupils’ social, emotional and behaviour difficulties, prosocial behaviour, and various individual, school and home factors. From a total of 486 possible participants, 301 (61.9%) parents, 387 (79.6%) teachers and 409 (84.2%) pupils completed and returned their questionnaires.

Introduction
9
1.3.2 Instruments
The Maltese version of the Strengths and Difficulties Questionnaire (SDQ) (Goodman 1997) was used as a measure of the pupils’ social, emotional and behaviour difficulties and prosocial behaviour (Cefai, Cooper and Camilleri, 2008). The SDQ is a brief questionnaire which has been used by many researchers as a screening tool to measure social, emotional and behaviour difficulties, and identifies the prevalence of mental health difficulties among children and young people. It comprises four difficulty subscales, measuring emotional symptoms, hyperactivity, conduct problems and peer difficulties respectively. It also includes a fifth subscale measuring pro-social behaviour. In addition, the instrument contains an ‘impact supplement’ which enables the reportee to indicate the perceived level of ‘burden’ associated with the norm-referenced difficulties score.
The parent and teacher SDQs and SDQ impact scale were used in the study. The Maltese versions were developed through a process of forward and backward translations and then piloted with a number of teachers, parents and students. Construct validity of the Maltese version, gave correlation coefficients ranging from 0.72 to 0.89 (teachers) and from 0.71 to 0.83 (parents) on the five subscales, suggesting a satisfactory level of construct validity. The Cronbach’s Alphas from a test-retest measure ranged from 0.67 to 0.92 for individual items, and from 0.75 to 0.89 for the five subscales, suggesting satisfactory reliability at both individual and subscale levels.
The present study aimed to explore the relationship between SEBD/prosocial behaviour and a number of individual, classroom, school, home and community variables, how these relationships varied from Year 1 to Year 4, and which of these variables constituted a significant risk or promotive factor. Moreover, a set of supplementary questionnaires completed by teachers, parents and pupils were constructed to collect essential information about various factors that were found to be related to the development of

Building Resilience in School Children
10
SEBD and the promotion of positive behaviour. A review of the literature identified various factors related to SEBD and prosocial behaviour amongst school children, including individual factors such as age, gender, language, locality, ethnicity, personality factors such as self-esteem and self-efficacy, and the presence of other difficulties such as medical conditions. Classroom and school factors such as attainment, attendance, engagement, learning difficulties, and support with learning, relationship with teachers, peer relationships have also been found to be significant predictors, as were and home and community variables such as socio-economic status, family structure and size, family relationships, parenting and neighbourhood safety and support amongst others.
In the first study, a relatively large scale survey, we had to
restrict the focus to structural variables such as age, gender, region, school size, and SES, with less attention to such processes as classroom relationships, classroom management strategies, whole school approach to behaviour, family relationships and parenting style amongst others. In the follow-up study we excluded some of the variables which were not found to be significant in the local context such as religion and ethnicity, but included other relational and psychosocial factors which were identified in the literature as being strongly related to pupil behaviour. These included amongst others pupils’ relationships with teachers, peers and family members, classroom management, staff teamwork and collegiality, meaningful and influential engagement of both pupils and staff, sources of support at school and at home, parenting strategies, family relationships and dynamics, and community support.
The inclusion of variables in our study depended on various factors, namely a review of the international literature on the factors which were found to predict either SEBD or prosocial behaviour, the factors which emerged as significant factors in the first study, as well as the constraints imposed on the study such as issues of accessibility and confidentiality. Since the study was not anonymous, it was decided to avoid items which might have proved to be sensitive for the participants and thus jeopardise the response
Introduction
11
rate. Indeed, this was a particularly relevant issue as we had only a relatively small sample of parents, teachers and pupils. In this respect we avoided questions related to family abuse, family psychopathology and marital conflict amongst others, while not delving too deep into relationships with parents and teachers.
Our model of child behaviour is one that construes
behaviour as being influenced by multiple contexts in line with Bronfenbrenner’s systems theory (Bronfenbrenner, 1989). The classroom, the whole school, the family, the local community, as well as the child’s own personality all impact his or her behaviour. We therefore categorised the predictive variables into individual, class, school home and community factors. The individual student variables were grouped into 3 subgroups, namely individual characteristics such as gender, locality, language, illness/disability, medication/therapy, communication, self-esteem and self-efficacy (Gilligan, 2001; Linnenbrink and Pintrich 2003; Newman, 2004; Ford et al., 2007; Hysing et al., 2007; Guttman and Brown, 2008; Cooper and Jacobs, 2011); classroom and school variables, including support in learning, academic progress and expectations, engagement, learning difficulties, attendance, relationship with teachers, peers, and friends and home-school communication (Resnick et al., 1997; Hamre and Pianta, 2001; Desforges and Abouchaar, 2003; Fletcher-Cambell and Wilkin, 2003; Ford et al., 2007; Gutman and Feinstein, 2008; Cooper and Jacobs, 2011); and home variables, including socio-economic status, family structure and size, relationships with parents, siblings, relatives and friends, and family dynamics such as quality of parenting, family time and family cohesion (Darling, 1999; Amato, 2001, 2005; Davies-Kean, 2005; Bradley and Corwyn, 2007; Engle and Black, 2008; Gutman and Feinstein, 2008; McLanahan, 2009); and community safety and support (Hawkins, Catalano and Arthur, 2002; Siqueira and Diaz, 2004; Arthur et al, 2007). The whole classroom variables included classroom characteristics, such as pupils’ behaviour during play, engagement, collaboration, involvement in decisions and sense of community, as well as teacher’s classroom management and training (Resnick et al., 1997; Solomon et al., 2000; Gutman, Sameroff, and

Building Resilience in School Children
12
Eccles, 2002; Battistich, Schaps, and Wilson, 2004; Adi et al., 2007a; Rose et al., 2009; Cooper and Jacobs, 2011). The whole school variables included the pupils’ behaviour, support, collaboration, and engagement at school as well as bullying, and staff’s participation, teamwork and collegiality and administrative support (Fletcher-Cambell and Wilkin, 2003; Battistich, Schaps, and Wilson, 2004; McLaughlin, 2006; Adi et al., 2007a; Rose et al., 2009; Cooper and Jacobs, 2011). Table 1.1 presents the list of individual variables examined in this study categorised in the three subgroups described above; while Table 1.2 presents the list of whole classroom and school variables. Table 1.1: Individual child variables
Individual characteristics
Gender Mother language Locality Illness or disability Medication or therapy Communication Self-esteem (teacher and parent reported) Self-efficacy (teacher and parent reported)
Classroom and school variables
Academic progress (teacher and pupil reported) Teacher academic expectation Parent academic expectation Learning difficulties Learning support(teacher and pupil reported) Peer support with work Support with homework Source of support at school Repeating a year Engagement (teacher and pupil reported) What helps in learning Attendance Teacher-parent communication

Introduction
13
Parent-school communication Teacher-pupils relationship Pupils-teacher relationship Relationships with peers (teacher and pupil reported) Friends at school Close friends at school Support from close friends Plays with peers Ways of improving behaviour at school
Home and community variables
Family structure Family size Father and mother occupation Father and mother education Family income Family time Behaviour at home Communication with parents Relationship with siblings Relationship with relatives Parent reported friends Source of support at home Membership in organisations Participation in organisations Family cohesion Family conflict Parenting stress Parenting difficulty Parenting quality time Parenting supervision Parenting strategies Neighbourhood safety Neighbourhood support

Building Resilience in School Children
14
Table 1.2: Whole classroom and whole school variables
Whole classroom variables
Pupils’ participation in lessons Pupils’ involvement in decisions Pupils’ collaboration in learning Pupils’ behaviour during play Pupils’ sense of classroom community Classroom resources Classroom management Teacher training
Whole school variables
Pupils’ behaviour at school Pupils’ support and collaboration Pupils’ engagement in school activities Pupils’ participation in decisions Bullying Staff participation in school activities Staff participation in decisions Staff teamwork Staff support and collegiality Administrative support
Information about individual variables was extracted mainly from teachers’ and pupils’ questionnaires, that about home and community variables from the parents’ questionnaires, while the teachers’ questionnaire provided information on the class and school variables. Most of the variables were assessed on a 3-point ordinal scale assuming a continuum between the categories (frequently, occasionally, rare; very good, average, poor; always, sometimes, never). The teacher questionnaire was divided into three sections, namely a section on the individual pupil being assessed (individual characteristics related to learning, relationships and behaviour), a section on their classroom such as classroom management, pupils’ collaboration and relationships, and teacher training, and a section on the whole school such as pupils’ behaviour, support and bullying, staff teamwork and collegiality, and school-home relationship. The parent supplementary questionnaire also included three sections,

Introduction
15
namely one section on demographic variables (family size and structure, parental occupation and education, home language and region), another on the child being assessed (individual characteristics related to relationships with family members and parenting), and another section on the family and community, such as family cohesion and dynamics and community safety and support. The pupil questionnaire asked questions about the pupil’s learning and behaviour at school, relationships with teacher, peers and friends, sources of support at school and at home, relationships with parents, siblings and friends, and participation in local organisations.
The teacher, parent and pupil supplementary questionnaires
were all self-administered by the participants, but in the case of some pupils the questionnaire was read to them by a research assistant and the pupils ticked the appropriate boxes for each statement. The teachers and parents completed both the SDQ and the supplementary questionnaires.
1.3.3 Analysis
Hypothesis testing was carried out mainly via the One-way ANOVA and Chi-Square tests. The One-way ANOVA test was used to compare mean scores, elicited from teachers’ and parents’ SDQ evaluations, with the categories of each individual, classroom, school, home and community variable. The chi square test was used to examine the association between improvement/deterioration in SEBD/prosocial behaviour and the levels of each categorical predictor. For both tests, a 0.05 level of significance was employed.
Modelling was carried out mainly through ANOVA regression and Logistic regression analysis. ANOVA regression analysis was used to relate collectively the SDQ scores provided by respondents to individual, classroom, school, home and community predictors. Moreover, the models were used to identify the significant predictors of SEBD and Prosocial behaviour and rank them by their contribution in explaining variations in the responses.
Building Resilience in School Children
16
To identify the significant risk and promotive factors, pupils were clustered into two groups, namely whether they experienced an improvement or deterioration in SEBD/prosocial behaviour from Year 1 to Year 4. Logistic regression analysis was used to relate collectively these categorical responses to individual (individual characteristic, classroom, school and home/community) predictors and whole class and whole school predictors, and simultaneously identify and rank the strongest risk and promotive predictors. Only students whose SEBD/prosocial behaviour scores were available in both Year 1 and Year 4 were included in this analysis. Moreover, pupils exhibiting no change over the three year period were also excluded. The teachers’ SDQ scores suggested that the total difficulty score of 330 pupils changed between Years 1 and 4, while 275 had a change in prosocial score. The corresponding numbers of pupils who showed a change on the basis of parents’ SDQ were 175 and 125 respectively. 1.4 Report Structure
This report is divided in two main parts with three chapters each, and an overall conclusion. Part 1 (Chapters 2-4) presents the data related to Year 4 pupils. Chapter 2 presents the prevalence rate of SEBD and prosocial behaviour amongst Year 4 students in Maltese primary schools, and discusses how these compare with the previous rate established in the initial national study. In Chapters 3 and 4 we investigate through ANOVA regression analysis the relationships between SEBD/prosocial behaviour of Year 4 pupils and a number of individual, classroom, school, community and home variables. In both chapters, we identify the predictors that best explain the variation in the responses. Part 2 (Chapters 5-7) presents the data of the longitudinal study. In Chapters 5 and 6 we examine through Logistic regression analysis the change in SEBD and prosocial behaviour from Year 1 to Year 4, identifying the strongest predictors associated with these changes. In both chapters we also examine the cumulative effect of risk and promotive factors on
Introduction
17
children’s mental health. Chapter 7 seeks to build a profile of risk and promotive factors amongst primary school children by identifying the factors which either lead to an increase in SEBD and decrease in prosocial behaviour on one hand (risk factors), or to a decrease in SEBD and increase in prosocial behaviour on the other (promotive factors). The Conclusion (Chapter 8) summarises the findings of the whole study and discusses the implications of the findings for practice in Maltese primary schools.

Building Resilience in School Children
18

Prevalence rate of SEBD in Year 4
19

Building Resilience in School Children
20

Prevalence rate of SEBD in Year 4
21
In the national study on SEBD in Maltese schools, it was found that 9% of primary school pupils have SEBD (Cefai, Cooper and Camilleri, 2008). The prevalence rate was established on the basis of data collected from teachers across all the primary school years. In the current study, we sought to establish the prevalence rate of SEBD in Year 4 on the basis of both the teachers’ and parents’ versions of the SDQ. The following sections describe the prevalence rate in Year 4 by gender, followed by a description of the mean SDQ subscale scores by type of difficulty and gender. An examination of the changes in the subscale scores from Year 1 to Year 4 is also carried out by gender, making use of both the teachers’ and parents’ evaluations.
2.1 Prevalence rate of SEBD in Year 4
To determine the prevalence rate of SEBD amongst Year 4 primary pupils, the SDQ Impact Supplement was completed by both teachers and parents. The Impact Supplement includes five items that assess overall distress and social impairment measured on a 3-point scale. Pupils are classified as falling into the normal, borderline or abnormal band according to the scores generated and
2

Building Resilience in School Children
22
the cut off points established in the previous study (Cefai, Cooper and Camilleri, 2008). The prevalence rate of pupils with SEBD is based on the proportion of pupils falling within the abnormal category.
For the 486 Year 4 pupils that were randomly selected for this study, the teachers completed the Impact Supplement for 374 pupils (76.95%), whereas the parents returned 268 completed questionnaires (55.14%). 226 pupils were assessed by both teachers and parents, 148 by teachers only, 42 by parents only. Seventy pupils were neither assessed by teachers nor by parents. According to teachers, 81.0% of the Year 4 pupils were in the normal band, 9.6% in the borderline and the remaining 9.4% in the abnormal (Table 2.1 and Figure 2.1). The 9.4% cut off point for abnormal SEBD cases in Year 4 is comparable to the 9.05% cut off point established by Cefai, Cooper and Camilleri (2008) of pupils with SEBD in primary schools. The 95% confidence interval suggests that the actual (population) prevalence rate lies between 6.44% and 12.36% (Table 2.1). The confidence interval includes the 2008 SEBD prevalence rate (9.05%) established for primary schools, which implies that the present situation is comparable to the 2008 rate. Parents perceive a lower percentage (7.8%) of Year 4 pupils in the abnormal category and a higher percentage (83.6%) of pupils in the normal category; however, the differences between proportions are not significant at the 0.05 level of significance.
Table 2.1: Prevalence rate of SEBD in Year 4
SEBD Percentage 95% confidence interval
Normal 81.0% 77.02% 84.98% Borderline 9.6% 6.62% 12.58%
Teacher assessment
Abnormal 9.4% 6.44% 12.36% Normal 83.6% 79.17% 88.03% Borderline 8.6% 5.24% 11.96%
Parent assessment
Abnormal 7.8% 4.59% 11.01%

Prevalence rate of SEBD in Year 4
23
Figure 2.1: Prevalence rate of SEBD in Year 4
Both teachers’ and parents’ assessments indicate that there
are higher proportions of females in the normal SEBD category and higher proportions of males in the borderline and abnormal categories; again these differences are not significant at the 0.05 level of significance (Table 2.2 and Figure 2.2). Table 2.2: Prevalence rate of SEBD in Year 4 by gender
Teacher Evaluation Parent Evaluation SEBD Boys Girls Boys Girls
Normal 80.2 81.8 82.8 84.4 Borderline 10.0 9.2 8.8 8.4 Abnormal 9.8 9.0 8.4 7.2
Building Resilience in School Children
24
Figure 2.2: Prevalence rate of SEBD by gender
Finally, of the 226 students who were assessed by both teachers and parents, 87.6% of the parents’ evaluations matched the teachers’ evaluations, suggesting that parents and teachers tend to agree on the SEBD categorization of primary school pupils (Table 2.3). Table 2.3: SEBD categorisation of Year 4 pupils
Parent evaluation Normal Borderline Abnormal Total
Normal 183 11 2 196 Borderline 10 8 3 21
Teacher evaluation
Abnormal 1 1 7 9 Total 194 20 12 226

Prevalence rate of SEBD in Year 4
25
2.2 Changes in pupils’ behaviour from Year 1 to Year 4
Tables 2.4 and 2.5 show the mean subscale scores of Year 4 pupils categorised by gender for teachers’ and parents’ evaluations. The sample of 347 Year 4 pupils assessed by teachers consisted of 159 males and 188 females; whereas the 193 pupils assessed by parents consisted of 91 males and 102 females. In general, the parents’ means are higher than those of teachers for both difficulties and prosocial behaviour, a finding similar to the pattern found in the national study. Another similar finding to that of the previous study is that in both the teachers’ and parents’ assessments, hyperactivity featured as the most common problem amongst Year 4 pupils. Table 2.4: Teachers’ evaluations of pupils in Year 4
95% Confidence Interval for Mean
Subscale Mean Std. Dev.
Lower Bound
Upper Bound P-value
Male 1.78 2.171 1.46 2.10 Emotion Female 1.82 2.183 1.52 2.12
0.924
Male 2.06 2.250 1.43 2.09 Conduct Female 2.11 1.391 2.21 2.60
0.792
Male 3.91 3.236 3.43 4.38 Hyperactivity Female 2.53 2.567 2.18 2.89
0.000
Male 1.88 1.960 1.59 2.17 Peer Female 1.87 1.878 1.61 2.13
0.971
Male 7.50 2.356 7.16 7.85 Prosocial Female 8.32 2.151 8.02 8.62
0.000
Male 9.36 7.168 8.31 10.42 Total Difficulty Female 8.61 5.627 7.83 9.39
0.253
On the other hand, while parents suggest that emotional
problems are the most pressing problem following hyperactivity, teachers’ evaluations indicate conduct. Both teachers and parents agree that males are more hyperactive, less prosocial and have more difficulties than females; however, they have contrasting views regarding other types of difficulties. Teachers perceive that females

Building Resilience in School Children
26
have more emotional and conduct problems than males; whereas, parents’ assessments indicate that males have more emotional, peer and conduct difficulties than females. However, most mean scores do not differ significantly between genders.
Table 2.5: Parents’ evaluations of pupils in Year 4
95% Confidence Interval for Mean
Subscale Mean Std. Dev.
Lower Bound
Upper Bound P-value
Male 2.76 2.327 2.36 3.15 Emotion Female 2.47 2.306 2.10 2.84
0.294
Male 2.26 1.643 1.99 2.54 Conduct Female 1.73 1.514 1.48 1.97
0.004
Male 4.59 2.549 4.16 5.02 Hyperactivity Female 3.12 2.442 2.73 3.51
0.000
Male 2.43 2.096 2.07 2.78 Peer Female 2.01 1.734 1.73 2.28
0.064
Male 8.53 1.682 8.24 8.81 Prosocial Female 9.17 1.508 8.93 9.41
0.001
Male 12.04 6.448 10.94 13.13 Total Difficulty Female 9.33 5.747 8.41 10.24
0.000
Tables 2.6 and 2.7 present the teachers’ and parents’ evaluations of total difficulty and the five subscales’ scores for those pupils whose SDQ scores were available both in Year 1 and Year 4. There is an increase in the mean total difficulty and prosocial scores from Year 1 to Year 4 in both teachers’ and parents’ evaluations. The increase in difficulties is significant in teachers’ evaluation; whereas the improvement in prosocial behaviour is significant in the parents’ assessment. The increase in the total difficulty score, however, is not reflected evenly across the four difficulty subscales. Teachers’ evaluations suggest an increase in all behaviour problems except emotional difficulties, while parents’ evaluations indicate an increase in emotional, conduct and peer difficulties but a significant decrease in hyperactivity. Both teachers and parents agree that conduct and peer difficulties tend to increase from Year 1 to Year 4,

Prevalence rate of SEBD in Year 4
27
but they have contrasting views about emotional and hyperactivity problems. Table 2.6: Teachers’ evaluations of pupils in Year 1 and Year 4
95% Confidence Interval for Mean
Subscale Mean Std. Dev.
Lower Bound
Upper Bound P-value
Year 1 2.02 2.217 1.78 2.25 Emotion Year 4 1.80 2.153 1.57 2.03
0.142
Year 1 1.19 1.780 1.01 1.38 Conduct Year 4 2.12 1.871 1.93 2.32
0.000
Year 1 3.16 2.816 2.86 3.45 Hyperactivity Year 4 3.22 2.930 2.92 3.53
0.638
Year 1 1.53 1.685 7.49 7.98 Peer Year 4 1.90 1.963 7.67 8.15
0.003
Year 1 7.74 2.304 7.28 8.51 Prosocial Year 4 7.91 2.287 8.37 9.72
0.262
Year 1 7.89 5.810 1.78 2.25 Total Difficulty Year 4 9.05 6.359 1.57 2.03
0.001
Table 2.7: Parents’ evaluations of pupils in Year 1 and Year 4
95% Confidence Interval for Mean
Subscale Mean Std. Dev.
Lower Bound
Upper Bound P-value
Year 1 2.21 2.072 1.92 2.51 Emotion Year 4 2.58 2.270 2.26 2.90
0.021
Year 1 1.75 1.393 1.55 1.94 Conduct Year 4 1.93 1.575 1.71 2.16
0.137
Year 1 4.27 2.383 3.93 4.61 Hyperactivity Year 4 3.79 2.645 3.42 4.17
0.009
Year 1 1.76 1.706 1.52 2.00 Peer Year 4 2.17 1.875 1.90 2.43
0.007
Year 1 8.61 1.620 8.38 8.84 Prosocial Year 4 8.92 1.695 8.68 9.16
0.021
Year 1 9.99 4.986 9.28 10.70 Total Difficulty Year 4 10.47 6.183 9.59 11.35
0.239
Building Resilience in School Children
28
Tables 2.8 and 2.9 display the mean SDQ scores of total difficulty and the five subscales categorised by gender. The tables reveal an interesting portrait of similarities and contrasts. While teachers’ and parents’ evaluations suggest an increase in total difficulty for males, their evaluations diverge with relation to female pupils: teachers’ evaluations indicate a significant increase in total difficulties, while parents’ suggest a decrease in difficulty (though not significant). In contrast, prosocial behaviour appears to increase in both genders though most differences between mean scores are not significant.
Table 2.8: Mean subscale scores by gender (teachers’ assessment)
Subscale
Gender
Year Mean
Std. Deviation P-value
Year 1 2.05 2.383 Male Year 4 1.83 2.162
0.389
Year 1 1.99 2.071
Emotion
Female Year 4 1.77 2.151
0.317
Year 1 1.52 2.031 Male Year 4 1.83 2.287
0.196
Year 1 0.92 1.488
Conduct
Female Year 4 2.37 1.387
0.000
Year 1 3.86 2.955 Male Year 4 4.03 3.166
0.621
Year 1 2.56 2.554
Hyperactivity
Female Year 4 2.55 2.532
0.952
Year 1 1.49 1.831 Male Year 4 1.90 2.016
0.059
Year 1 1.56 1.555
Peer
Female Year 4 1.90 1.922
0.060
Year 1 7.30 2.451 Male Year 4 7.44 2.399
0.611
Year 1 8.11 2.109
Prosocial
Female Year 4 8.31 2.112
0.341
Year 1 8.91 6.256 Male Year 4 9.58 7.204
0.374
Year 1 7.03 5.270
Total Difficulty
Female Year 4 8.59 5.525
0.005
Prevalence rate of SEBD in Year 4
29
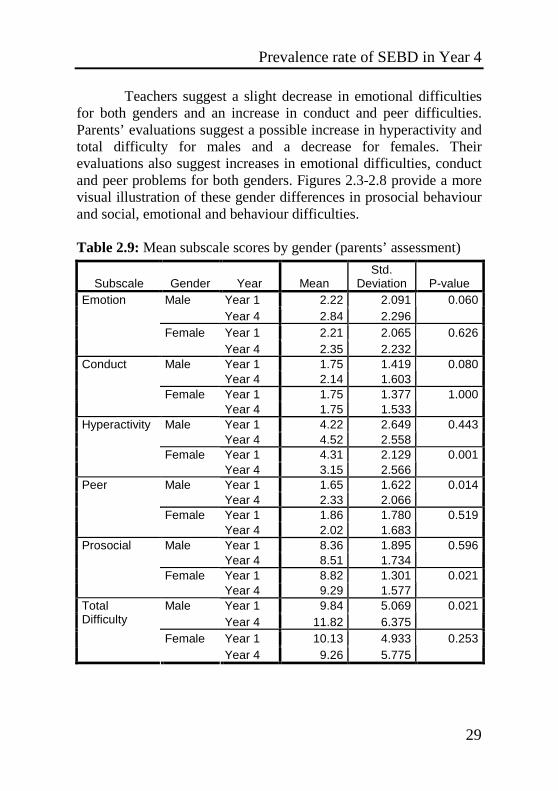
Teachers suggest a slight decrease in emotional difficulties for both genders and an increase in conduct and peer difficulties. Parents’ evaluations suggest a possible increase in hyperactivity and total difficulty for males and a decrease for females. Their evaluations also suggest increases in emotional difficulties, conduct and peer problems for both genders. Figures 2.3-2.8 provide a more visual illustration of these gender differences in prosocial behaviour and social, emotional and behaviour difficulties.
Table 2.9: Mean subscale scores by gender (parents’ assessment)
Subscale
Gender
Year Mean
Std. Deviation P-value
Year 1 2.22 2.091 Male Year 4 2.84 2.296
0.060
Year 1 2.21 2.065
Emotion
Female Year 4 2.35 2.232
0.626
Year 1 1.75 1.419 Male Year 4 2.14 1.603
0.080
Year 1 1.75 1.377
Conduct
Female Year 4 1.75 1.533
1.000
Year 1 4.22 2.649 Male Year 4 4.52 2.558
0.443
Year 1 4.31 2.129
Hyperactivity
Female Year 4 3.15 2.566
0.001
Year 1 1.65 1.622 Male Year 4 2.33 2.066
0.014
Year 1 1.86 1.780
Peer
Female Year 4 2.02 1.683
0.519
Year 1 8.36 1.895 Male Year 4 8.51 1.734
0.596
Year 1 8.82 1.301
Prosocial
Female Year 4 9.29 1.577
0.021
Year 1 9.84 5.069 Male Year 4 11.82 6.375
0.021
Year 1 10.13 4.933
Total Difficulty
Female Year 4 9.26 5.775
0.253

Building Resilience in School Children
30
Figure 2.3: Gender differences in emotional difficulties
Figure 2.4: Gender differences in conduct problems

Prevalence rate of SEBD in Year 4
31
Figure 2.5: Gender differences in hyperactivity problems
Figure 2.6: Gender differences in peer difficulties

Building Resilience in School Children
32
Figure 2.7: Gender differences in prosocial behaviour
Figure 2.8: Gender differences in total difficulties

SEBD by individual, school and home factors
33
This chapter explores the relationship between social, emotional and behaviour difficulties and a range of individual, school and home variables. The first section presents the teachers’ and parents’ SDQ mean total difficulty scores according to the various individual variables, clustered into three subgroups, namely individual characteristics, classroom/school and home variables. It also presents the results of the ANOVA regression analysis which identified the significant individual predictors. The chapter then examines the mean total difficulty scores by whole classroom and whole school variables and concludes with a final regression analysis of all the significant SEBD predictors taken together. 3.1 SEBD by individual variables
The individual level variables have been grouped into three sets of factors, namely individual characteristics, such as gender and self-esteem, classroom and school factors such as academic progress, engagement and relationships with teacher and peers, and home and community characteristics such as communication with parents and behaviour at home. These will be discussed separately in the following sections.
3

Building Resilience in School Children
34
3.1.1 Individual characteristics variables
Table 3.1 Mean total difficulty scores by individual characteristics
Total Difficulty Score (Year 4) Teacher Parent
Individual variables
(Characteristics) Mean St. Dev Mean St. Dev Male 9.58 7.204 11.82 6.375 Gender Female 8.59 5.525 9.26 5.775 Maltese 9.03 6.473 10.44 6.192 Language English/other 8.32 4.845 7.42 3.919 North harbour 7.48 6.425 11.29 6.048 South harbour 9.32 6.106 9.48 6.219 South Eastern 8.42 6.068 10.27 5.759 Western 7.00 5.685 10.67 6.426 Northern 8.20 5.979 10.38 6.105
Locality
Gozo 8.50 5.550 9.12 7.415 Yes 11.23 6.747 13.87 6.283 Illness or
disability No 7.67 5.562 10.02 6.023 Yes 9.89 4.954 13.95 5.979 Medication or
therapy No 7.84 5.809 10.05 6.070 Poor 18.75 8.552 14.67 9.048 Adequate 12.18 6.019 13.09 6.661
Communication
Very good 7.41 5.330 9.20 5.449 Low 17.45 6.677 13.80 7.014 Average 11.17 5.975 12.91 6.946
Teacher reported self-esteem High 6.98 5.422 8.73 5.065
Low 12.29 10.11 18.00 5.621 Average 9.30 6.156 12.96 6.197
Parent reported self-esteem
High 7.16 5.209 9.00 5.548 Low 16.46 6.592 12.00 6.986 Average 10.38 6.248 12.06 6.657
Teacher reported self-efficacy High 6.83 5.212 8.70 5.182
Low 8.88 5.111 18.00 6.205 Average 8.63 6.359 12.39 5.954
Parent reported self-efficacy
High 7.30 5.238 8.44 5.205
Table 3.1 provides descriptive statistics for total difficulty
scores categorised by individual characteristics variables using both teachers’ and parents’ evaluations. Mean total difficulty scores that differ significantly are marked bold.
SEBD by individual, school and home factors
35
Individual personality characteristics such as communication skills, self-esteem and self-efficacy appear to be some of the predictors most strongly related to SEBD according to both teacher and parent responses. Health conditions and disability are similarly significantly related to SEBD, while pupils undergoing intervention for their difficulties are more likely to have SEBD, however, the relationship is weaker. Male pupils appear to have more difficulties than females but language and locality do not seem to be related to SEBD.
3.1.2 Individual classroom and school variables
Table 3.2 presents descriptive statistics for total difficulty scores by individual classroom and school variables, using both teachers’ and parents’ evaluations. Significant differences between mean scores are marked bold.
Most of the classroom related individual characteristics are significantly related to SEBD according to both teachers’ and parents’ responses. The teacher-pupils relationship features as a strong predictor of SEBD according to both teachers and parents: SEBD tends to increase significantly when this relationship deteriorates. Parents’ evaluations suggest that peer relationships are not as important as the relationship with the teacher, but teachers’ evaluations indicate that pupils who have poor relationships with peers and who have no friends at school are more likely to experience SEBD. Both teachers’ and parents’ evaluations indicate that support from close friends and playing with peers are protective against SEBD. According to both teachers’ and parents’ evaluations, learning difficulties, academic progress, teacher, peer and parental support with learning, engagement, and teachers’ and parents’ academic expectations are all strongly related to SEBD. Attendance and home-school communication are also significant predictors of SEBD.

Building Resilience in School Children
36
Table 3.2: Mean total difficulty scores by individual classroom and school variables
Total Difficulty Score (Year 4) Teacher Parent
Individual variables (Learning) Mean St. Dev Mean St. Dev Poor 15.35 7.095 14.29 6.799 Average 10.90 5.497 12.55 6.645
Teacher reported academic progress Very good 6.23 4.642 8.62 5.167
Poor 14.50 7.186 13.86 4.598 Average 9.02 5.996 11.48 7.096
Pupil reported academic progress Very good 7.88 5.894 8.95 4.832
Poor 16.11 6.283 14.90 5.724 Moderate 11.31 6.266 13.24 7.052
Teacher academic expectation Good 6.52 4.810 8.54 4.984
Poor 11.40 6.022 19.33 7.501 Moderate 11.11 6.477 15.63 5.678
Parental academic expectation Good 6.78 5.044 8.09 4.602
Many 15.41 7.859 17.25 6.397 Some 9.03 5.764 11.04 6.190
Learning difficulties
None 7.65 6.023 8.99 5.745 Yes 13.77 6.564 14.06 7.166 Teacher reported
learning support No 8.28 6.030 9.75 5.812 Not much 9.68 7.041 11.18 5.982 Moderate 8.96 6.033 10.28 6.367
Pupil reported support
A lot 8.42 6.155 10.25 6.121 Not much 10.74 6.802 13.70 6.689 Moderate 9.37 6.084 10.13 6.236
Peer support with work
A lot 7.86 5.933 9.76 5.778 Not much 6.25 4.606 7.98 5.206 Moderate 7.93 5.756 10.32 5.742
Support with homework
A lot 10.28 6.348 13.27 6.536 Yes 12.80 7.815 17.00 6.245 Repeating a year No 8.83 6.292 10.08 6.045 Low 15.29 6.789 12.50 7.607 Average 9.86 5.844 11.83 6.212
Teacher reported engagement
High 6.11 4.723 8.48 5.200 Low 13.04 7.651 12.33 7.566 Average 8.66 5.615 11.80 6.432
Pupil reported engagement
High 8.21 6.287 9.15 5.600 Regular 8.81 6.302 10.15 6.061 Attendance Irregular 12.79 6.886 12.75 8.057

SEBD by individual, school and home factors
37
Poor 18.73 6.018 13.00 4.000 Moderate 13.36 7.606 12.62 6.265
Teachers-parent communication
Good 7.93 5.541 9.98 6.101 Moderate 8.95 5.721 12.48 6.334 Parent-school
communication Good 7.67 5.761 9.59 5.925 Moderate 16.19 7.773 12.88 6.752 Teacher-pupil
relationship Very good 7.82 5.267 9.93 5.979 Poor 13.24 7.273 13.98 4.274 Moderate 9.87 6.427 12.16 6.814
Pupil-teacher relationship
Very good 7.82 5.742 9.54 5.833 Poor 21.85 4.828 16.75 6.850 Moderate 14.33 6.853 11.22 7.100
Teacher reported relationship with peers Very good 7.21 4.785 9.84 5.792
Poor 12.35 7.469 14.00 5.538 Moderate 9.61 6.467 10.78 6.868
Pupil reported relationship with peers Very good 8.07 5.797 9.93 5.783
Yes 8.56 5.887 10.19 6.071 Pupil has friends at school No 17.29 10.07 10.75 8.770
Yes 8.76 6.215 10.26 6.115 Pupil has close friends No 10.21 6.658 13.17 7.333
Not at all 11.17 4.355 20.17 4.215 Moderate 8.82 6.401 11.12 6.135
Pupil has support from close friends A lot 6.48 3.917 8.36 4.947
Not much 17.43 9.863 20.50 3.536 Moderate 10.46 5.948 12.48 7.481
Pupil plays with peers
A lot 8.34 5.972 9.85 5.821
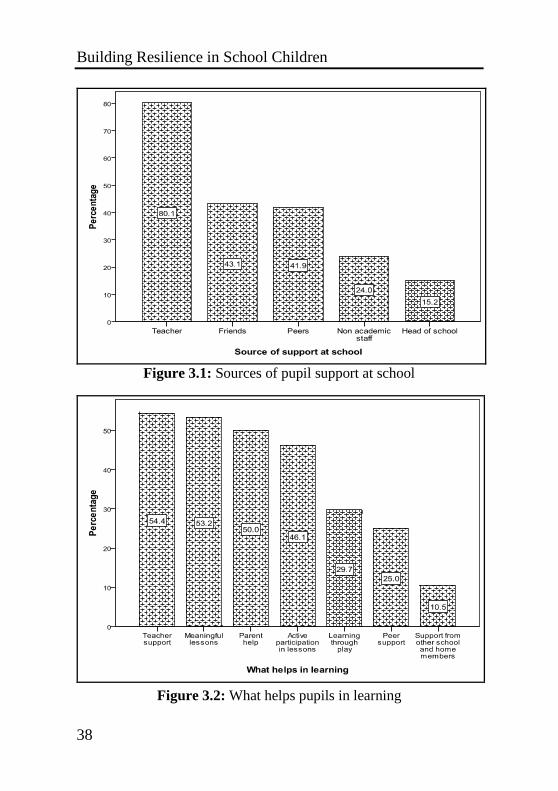
Figure 1 displays sources of pupils’ support at school. More
than 80% of Year 4 pupils mentioned teacher support helps them in their learning at school. This is followed by support from friends and peers (43.1% and 41.9% respectively), non-academic staff (24%) and the Head of school (15.2%). Figure 3.2 displays sources of pupils’ support in learning. Teacher support (54.4%), meaningful lessons (53.2%) and active participation in lessons (46.1%) as well as support from parents (50%) are the strongest sources, followed by learning through play (29.7%) and peer support (25%). Clearly a caring teacher relationship, an engaging and connective pedagogy, and parental support are the critical determinants of what help pupils to learn according to the pupils themselves.
Building Resilience in School Children
38
Figure 3.1: Sources of pupil support at school
Figure 3.2: What helps pupils in learning

SEBD by individual, school and home factors
39
Figure 3.3: Pupil’s suggestions on ways of improving behaviour
Figure 3.3 displays suggestions made by pupils of what help
them improve their behaviour at school. Around 63% of pupils suggested more interesting lessons, 60% more understanding teachers, 46% more helpful peers, 45% good behaviour management such as classroom rules, while 25% mentioned attractive classrooms.
3.1.3 Individual home and community variables
Table 3.3 presents descriptive statistics for total difficulty scores by individual, home and community variables on the basis of teachers’ and parents’ evaluations. Significant differences between mean scores are marked in bold.
Table 3.3 shows that structural home factors such as locality,
home language, family size, and parental education and occupation are not significantly related to SEBD. On the other hand, factors such as family dynamics and relationships are significant predictors: pupils’ behaviour at home, their relationship with parents, siblings,

Building Resilience in School Children
40
relatives and friends are all significantly related to SEBD according to both teachers and parents. Local community factors, such as neighbourhood safety and support, are weak predictors of SEBD.
Table 3.3: Mean total difficulty scores by individual home and community variables
Total Difficulty Score (Year 4) Teacher Parent
Home and community variables Mean St. Dev Mean St. Dev 2-parent family 7.83 5.658 10.21 6.141 Family
Structure 1-parent family 10.78 7.651 13.38 6.292 1 child 8.63 6.287 10.48 6.443 2 children 7.17 5.981 10.23 5.989 3 children 8.42 5.527 10.23 6.685
Family Size
4 or more children 10.24 5.190 12.47 5.580 Professional 7.63 5.707 9.53 5.676 Clerical/Technical 6.36 4.942 9.54 5.491 Skilled 8.09 5.190 10.77 6.678
Father Occupation
State income 13.64 8.947 11.78 6.140 Professional 7.34 5.090 8.89 5.034 Clerical/Technical 6.86 5.918 11.19 7.202 Skilled 8.73 5.922 11.00 6.300
Mother Occupation
House carer 8.22 6.329 10.70 6.332 Primary 9.86 5.210 10.88 8.560 Secondary 8.53 6.151 11.15 6.652 Post secondary 6.98 5.196 10.08 5.279
Father Education
Tertiary 6.80 4.978 8.11 4.981 Primary 8.00 3.916 9.83 9.326 Secondary 8.44 6.486 11.00 6.373 Post secondary 7.14 5.232 10.73 5.650
Mother Education
Tertiary 7.78 4.660 8.24 5.070 Less than €150 12.41 8.987 14.23 6.044 €150 – €300 8.05 5.354 10.85 6.414
Family Income
More than €300 6.74 5.620 9.05 5.652 Little 12.73 7.734 18.44 7.073 Average 7.96 5.396 10.42 6.070
Family Time
A lot 7.59 6.063 9.73 5.741 Poor 15.60 10.62 20.33 4.726 Moderate 9.56 5.643 14.20 6.039
Behaviour at home
Good 6.98 5.321 8.54 5.244

SEBD by individual, school and home factors
41
Poor 15.50 12.39 18.33 8.145 Moderate 10.97 5.911 15.75 5.512
Communication with parents
Good 7.25 5.188 9.21 5.594 Poor 11.20 9.257 18.83 9.020 Moderate 9.57 7.020 13.56 5.882
Relationship with siblings
Good 7.31 5.265 9.10 5.404 Moderate 10.82 7.435 16.31 7.040 Relationship
with relatives Good 7.75 5.488 9.89 5.805 Yes 7.77 5.539 10.13 5.884 Parent-reported
Friends No 16.20 9.935 22.80 4.919 Yes 7.87 5.653 10.40 6.310 Membership in
organization No 8.43 6.120 11.75 6.253 Poor 8.50 7.419 14.60 5.103 Moderate 8.57 5.907 13.24 5.864
Participation in organization
Regular 7.63 5.443 9.48 6.018 Little 9.67 7.638 15.00 8.718 Average 9.85 5.684 12.49 5.895
Family Cohesion
A lot 7.54 5.840 9.84 6.157 With shouting 9.68 6.840 14.38 7.275 Family
Conflict Calm discussion 7.66 5.552 9.33 5.472 Very stressed 9.76 6.372 13.98 6.528 Fairly stressed 7.73 5.633 10.13 5.861
Parenting Stress
Not stressed 6.78 5.813 6.46 3.920 Very difficult 8.32 6.128 11.29 6.713 Fairly difficult 7.29 5.002 9.52 5.158
Parenting Difficulty
Not difficult 9.56 8.033 8.50 4.721 Moderate 9.21 6.210 12.85 6.429 Parental
Quality time A lot 7.65 5.591 9.84 5.990 Moderate 9.46 6.897 11.43 6.760 Parenting
Supervision A lot 7.53 5.263 10.15 5.951 Discipline 8.12 5.535 11.02 6.182 Punishment 9.65 6.581 13.11 6.400 Rewards 6.77 5.077 10.02 5.515 Persuasion 7.22 5.065 8.93 5.884
Parenting Strategies
Discussion 6.66 5.694 8.94 5.437 Not safe 8.10 7.063 12.11 6.351 Moderately safe 7.96 5.713 11.02 6.450
Neighbourhood Safety
Very safe 8.12 5.897 8.89 5.379 Not helpful 8.48 5.407 11.69 6.622 Fairly helpful 7.57 6.018 10.39 6.035
Neighbourhood Support
Very helpful 8.49 6.075 9.29 5.972

Building Resilience in School Children
42
One parent families appear to have more children with SEBD according to both teachers’ and parents’ evaluations. Families with low incomes and whose father is on state income are more likely to have children with SEBD, while parental education appears also to be related to SEBD, though the relationship is not significant. Families with little time for their children, lack of cohesion and which use negative conflict resolution, are more likely to have children exhibiting SEBD. Parenting stress, lack of quality time with children, poor supervision and negative parenting are important predictors of SEBD. Punishment is more likely to be related with SEBD, while positive management strategies such as persuasion and discussion are associated with lower SDQ scores. Punishment is more likely to be used with boys than with girls.
Figure 3.4: Source of pupil support at home
Figure 3.4 displays the source of pupil support at home. The vast majority of pupils (93%) identified their parents as the main source, followed by siblings (31%) and relatives (17%).

SEBD by individual, school and home factors
43
Figure 3.5: Pupils’ participation in local community activities
On the other hand, Figure 3.5 shows that pupil membership and participation in organizations in the local community do not appear to be related to SEBD; indeed more than half of the pupils (51%) are not members of any organization. Participation in organizations is highest in sports activities (24%), followed by religious activities (14%), and cultural and social activities (11%). Boys are more likely to be members of sports organisations; whereas females are more likely to participate in social, cultural and religious organisations.
3.1.4 Regression analysis of individual variables
The major limitation of the One Way ANOVA test is that it only compares the mean difficulty scores across the levels of a sole predictor. On the other hand, multivariate regression takes into account several predictive variables simultaneously, thus modeling the difficulty scores with more accuracy. A backward procedure has
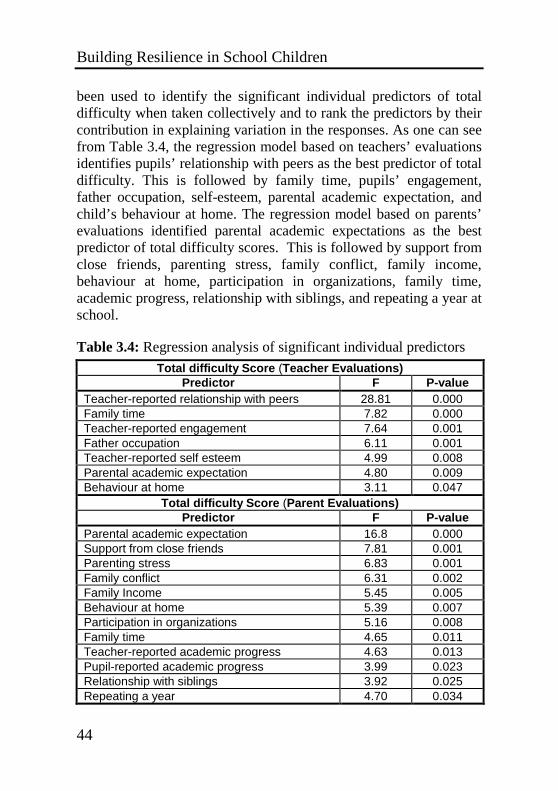
Building Resilience in School Children
44
been used to identify the significant individual predictors of total difficulty when taken collectively and to rank the predictors by their contribution in explaining variation in the responses. As one can see from Table 3.4, the regression model based on teachers’ evaluations identifies pupils’ relationship with peers as the best predictor of total difficulty. This is followed by family time, pupils’ engagement, father occupation, self-esteem, parental academic expectation, and child’s behaviour at home. The regression model based on parents’ evaluations identified parental academic expectations as the best predictor of total difficulty scores. This is followed by support from close friends, parenting stress, family conflict, family income, behaviour at home, participation in organizations, family time, academic progress, relationship with siblings, and repeating a year at school. Table 3.4: Regression analysis of significant individual predictors
Total difficulty Score (Teacher Evaluations) Predictor F P-value
Teacher-reported relationship with peers 28.81 0.000 Family time 7.82 0.000 Teacher-reported engagement 7.64 0.001 Father occupation 6.11 0.001 Teacher-reported self esteem 4.99 0.008 Parental academic expectation 4.80 0.009 Behaviour at home 3.11 0.047
Total difficulty Score (Parent Evaluations) Predictor F P-value
Parental academic expectation 16.8 0.000 Support from close friends 7.81 0.001 Parenting stress 6.83 0.001 Family conflict 6.31 0.002 Family Income 5.45 0.005 Behaviour at home 5.39 0.007 Participation in organizations 5.16 0.008 Family time 4.65 0.011 Teacher-reported academic progress 4.63 0.013 Pupil-reported academic progress 3.99 0.023 Relationship with siblings 3.92 0.025 Repeating a year 4.70 0.034

SEBD by individual, school and home factors
45
Both the teachers’ and parents’ evaluations underline the role of parental academic expectations, peer relationships and support, and pupils’ behaviour at home, as key predictors in SEBD. On the other hand, teachers and parents suggest different aspects of learning and relationships in predicting SEBD, with parents underlining more out-of-school factors. While teachers’ responses suggest that poor relationships with peers, poor engagement and poor self-esteem are the strongest predictors of SEBD, parents’ evaluations underline poor academic progress and repeating a year, as well as out-of-school factors such as lack of support from close friends, poor relationship with siblings, and lack of participation in organizations. The overall portrait underlines the key roles of school and home factors in putting young children at risk for SEBD. Year 4 pupils with poor self- esteem, poor relationships with peers, poor academic progress and learning difficulties, poor engagement and poor parental expectations are more at risk of manifesting SEBD. Pupils exhibiting behaviour problems at home and experiencing difficulties in relationships with siblings, and coming from poor families characterized by little quality time, high parenting stress and negative conflict management, are also at risk for developing SEBD. 3.2 SEBD by whole classroom variables
Table 3.5 shows the mean total difficulty scores by whole classroom variables according to both teachers’ and parents’ evaluations. With one exception (pupils’ play), parents’ evaluations do no suggest that classroom variables are important predictors of SEBD; teachers on the other hand, suggest that pupils’ participation and collaboration in learning and their sense of classroom community are very important factors in SEBD. It is interesting to note that neither parents nor teachers’ evaluations indicate pupils’ involvement in decision making as important for the development of SEBD; similarly with regards to classroom resources and teacher training. The latter may be partly explained to the fact that none of the teachers indicated inadequate training in dealing with SEBD.

Building Resilience in School Children
46
Table 3.5: Mean total difficulty scores by whole classroom variables
Total Difficulty Score (Year 4) Teacher Parent
Classroom variables Mean St. Dev Mean St. Dev Poor 20.0 7.00 16.0 1.41 Average 10.3 6.92 10.7 5.95
Pupils’ participation during lessons High 8.41 5.93 10.0 6.21
Poor 9.56 6.36 11.7 6.85 Average 9.39 6.76 10.4 6.26
Pupils’ involvement in decision taking High 8.69 5.87 9.92 5.94
Poor 13.5 9.19 14.0 4.24 Average 10.9 7.36 10.8 6.13
Pupils’ collaboration in learning High 8.05 5.69 8.86 6.08
Poor 10.6 10.5 14.0 14.1 Average 9.29 6.59 10.6 6.33
Pupils’ behaviour during play Good 8.52 5.98 9.77 5.81
Poor 16.5 16.3 11.0 9.90 Average 13.1 8.61 10.1 7.20
Pupils’ sense of classroom community High 8.60 6.03 10.0 6.03
Not adequate 11.4 7.96 10.9 6.17 Adequate 9.43 6.20 10.3 6.10
Classroom resources
Very adequate 9.04 5.18 8.84 6.55 Adequate 8.94 6.78 10.8 6.43 Teachers’
training Very good 8.95 5.90 9.56 5.79
Figure 3.6 shows that teachers tend to use positive behaviour
management in their classroom with classroom rules being the most popular strategy and punishment the least used. Other strategies, including reward, individual teaching assistance and dealing with student’s socio emotional wellbeing are also frequently used.
Regression analysis was used to identify the significant
predictors of total difficulty using backward procedure. The number of classroom related predictors that were found to be significantly related to SEBD was very small. Table 3.6 shows that according to teachers’ evaluations, pupils’ lack of classroom community was found to be the best whole classroom predictor, followed by pupils’ participation during lessons.
SEBD by individual, school and home factors
47
Figure 3.6: Classroom management
The regression model for parents’ evaluation, on the other
hand, suggests that pupils’ behaviour during play is the single significant classroom predictor. Other predictors were found to contribute marginally to the total variance in total difficulty scores.
Table 3.6: Regression analysis of the whole classroom variables
Total difficulty scores (Teacher Evaluations) Predictor F P-value
Pupils’ sense of classroom community 8.21 0.000 Pupils’ participation during lessons 6.47 0.002
Total difficulty scores (Parent Evaluations) Predictor F P-value
Pupils’ behaviour during play 3.80 0.024

Building Resilience in School Children
48
3.3 SEBD by whole school variables
Table 3.7 shows the mean total difficulty scores of the whole school variables. Mean total difficulty scores that differ significantly are marked in bold. In contrast to individual characteristics, very few whole school variables featured as strong indicators of SEBD.
Table 3.7: Mean total difficulty scores of whole school variables
Total Difficulty Score (Year 4) Teacher Parent
School variables Mean St. Dev Mean St. Dev Average 9.83 6.268 10.52 6.265 Pupils’ behaviour Good 8.36 6.425 9.86 6.020 Average 9.89 6.567 10.98 6.367 Pupils’ support and
collaboration Good 7.46 5.821 9.81 6.013 Average 9.77 7.210 10.82 5.508 Pupils’ engagement
in school activities Good 8.56 5.921 9.14 6.418 Poor 9.47 7.028 10.55 6.153 Average 8.74 5.957 9.99 6.309
Pupils’ participation in decisions
Good 6.72 4.012 9.80 5.181 A lot 9.52 6.947 10.25 6.524 Occasional 9.20 6.854 10.27 6.113
Bullying
Low 8.70 5.876 9.70 6.199 Low 9.18 6.195 11.50 0.707 Average 8.87 6.675 10.19 6.093
Staff participation in school activities
High 5.43 4.237 10.24 6.301 Low 8.74 6.638 10.47 6.366 Average 9.21 6.531 9.96 5.696
Staff participation in decisions
High 8.41 4.940 10.67 7.662 Low 9.19 6.477 10.78 6.613 Average 8.96 6.232 10.08 5.915
Staff teamwork
High 8.11 6.879 8.82 5.411 Low 9.32 7.083 10.38 5.965 Average 9.36 6.453 9.74 5.826
Staff support and collegiality
High 8.80 6.085 10.19 6.484 Low 9.05 6.422 10.40 5.210 Average 9.30 6.869 10.04 6.316
Administrative support
High 9.01 5.836 10.00 6.149

SEBD by individual, school and home factors
49
None of the school variables are significant according to the parents’ responses, while only two predictors were found significant according to teachers’ evaluations. Pupils’ behaviour at school and their support and collaboration are the only two significant factors at whole school level. The data also suggests that SEBD is more likely to be prevalent in schools where bullying is high and pupils’ participation in decisions is low, and where staff collaboration, support, collegiality, participation in school activities, and administrative support are low; however, these predictors are not significant.
Regression analysis was used to identify the significant predictors of total difficulty using backward procedure. The number of school related predictors that were found to be significantly related to SEBD was very small, indicating that school-related variables explain a very small portion of the variation in the total difficulty scores. As one can see from Table 3.8, the regression model identifies pupils’ support and collaboration as the sole significant whole school predictor (teachers’ evaluations).
Table 3.8: Regression analysis of whole school variables Total difficulty scores of Year 4 pupils (Teacher Evaluation)
Predictor F P-value Pupils’ support and collaboration 11.80 0.001
3.4 Conclusion
A final task was carried out by fitting regression models that relate total difficulty scores to all significant individual, classroom, school, home and community variables for both teachers’ and parents’ evaluations. A backward procedure was again used to identify the parsimonious models that include solely the dominant predictors of SEBD. The regression model that fits pupils’ difficulty scores identifies respectively eight and seven dominant predictors for teachers’ and parents’ evaluations.

Building Resilience in School Children
50
Table 3.9: Significant predictors by teachers’ evaluation Total difficulty scores of Year 4 pupils (Teacher Evaluation)
Predictor F P-value Teacher-reported relationship with peers 23.96 0.000
Teacher-reported engagement 8.404 0.000
Pupils’ sense of classroom community 7.862 0.006
Father occupation 3.661 0.014
Family time 4.267 0.016
Parental academic expectation 3.378 0.036
Teacher-reported self esteem 3.229 0.042
Behaviour at home 3.068 0.049
Table 3.9 shows that five of these predictors are individual variables mostly related to behaviour, relationships and learning; two are home related variables and the last predictor is a whole classroom factor. Pupil’s relationship with peers is the best predictor, followed by engagement, pupils’ sense of classroom community, father occupation, family time, parental academic expectation, self-esteem and behaviour at home. This eight-predictor parsimonious model explains 58.9% of the total variation in the difficulty scores.
Table 3.10: Significant predictors by parents’ evaluation Total difficulty scores of Year 4 pupils (Parent Evaluation)
Predictor F P-value Parental academic expectation 35.71 0.000
Family time 7.196 0.001
Repeating year 10.02 0.002
Support from close friends 6.150 0.003
Pupils’ behaviour during play 4.983 0.009
Behaviour at home 4.926 0.009
Relationship with siblings 4.236 0.017
Table 3.10 shows that five of these predictors are individual variables mostly related to behaviour, relationships and learning; one is a home variable and the last predictor a whole classroom variable. Parental academic expectation is the best predictor of total difficulty, followed by family time, repeating a year, support from close friends

SEBD by individual, school and home factors
51
behaviour during play and at home and relationship with siblings. This seven-predictor parsimonious model explains 65.5% of the total variation in the responses.
Figure 3.7: Best predictors of total difficulty scores of Year 4 pupils
Figure 3.7 shows that parental academic expectation, family
time and behaviour at home are significant predictors in both teachers’ and parents’ evaluations, while none of the whole school variables were found to contribute significantly in explaining variation in the total difficulty scores when included with other individual, classroom, home and community variables. Year 4 pupils most at risk for SEBD are those who are poorly engaged in classroom activities, are repeating a year, have poor relationships with peers and siblings, lack support from close friends and show behaviour difficulties at home. They attend classrooms where pupils exhibit poor play behaviour and low sense of community, and come from families with low parental academic expectations, little family time, and where the father is poorly skilled or unemployed. Figures 3.8-3.19 exhibit differences in the mean difficulty scores for the significant predictors.

Building Resilience in School Children
52
Figure 3.8: Total difficulty scores by teacher-reported self-esteem
Figure 3.9: Total difficulty by parental academic expectations
SEBD by individual, school and home factors
53
Figure 3.10: Total difficulty scores by teacher-reported engagement
Figure 3.11: Total difficulty scores by teacher-reported pupil
relationship with peers

Building Resilience in School Children
54
Figure 3.12: Total difficulty by pupil support from close friends
Figure 3.13: Total difficulty scores by father occupation

SEBD by individual, school and home factors
55
Figure 3.14: Total difficulty scores by family time
Figure 3.15: Total difficulty scores by pupil’s behaviour at home
Building Resilience in School Children
56
Figure 3.16: Total difficulty by pupils’ relationship with siblings
Figure 3.17: Total difficulty scores by pupils’ behaviour during play
SEBD by individual, school and home factors
57
Figure 3.18: Total difficulty by sense of classroom community
Figure 3.19: Total difficulty score by repeating a year

Building Resilience in School Children
58

Prosocial behaviour by individual, school and home factors
59
This chapter explores the relationship between prosocial behaviour and a range of individual, class, school and home variables. The first section presents the teachers’ and parents’ mean prosocial scores by individual variables, clustered into three groups, namely individual characteristic, classroom, school, community and home variables. The results of the ANOVA regression analysis at the end of the section identify the significant predictors within each cluster of individual variables. The chapter then similarly examines the whole classroom and whole school variables explored in the study, concluding with a final regression analysis analyzing all the significant predictors together. 4.1 Prosocial behaviour by individual variables 4.1.1 Individual characteristics variables
Table 4.1 provides descriptive statistics for the prosocial behaviour scores categorised by individual characteristics variables using both teachers’ and parents’ evaluations. Mean prosocial scores that differ significantly are marked bold.
4
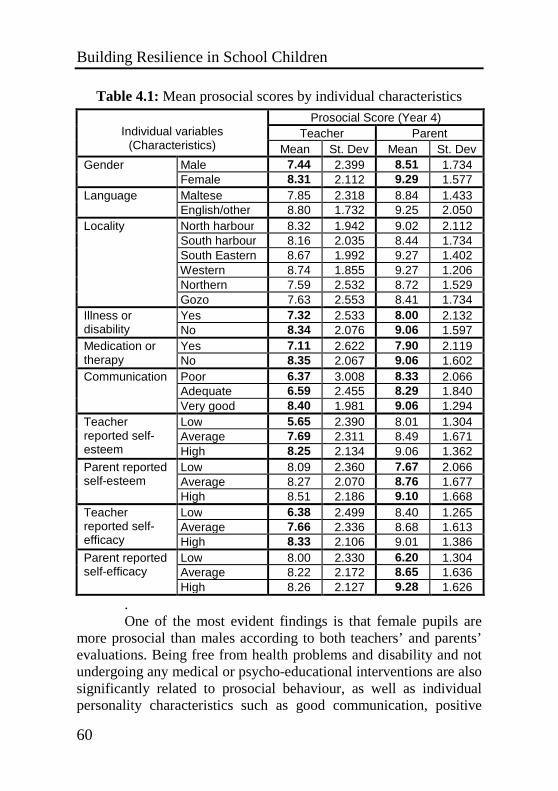
Building Resilience in School Children
60
Table 4.1: Mean prosocial scores by individual characteristics
Prosocial Score (Year 4) Teacher Parent
Individual variables
(Characteristics) Mean St. Dev Mean St. Dev Male 7.44 2.399 8.51 1.734 Gender Female 8.31 2.112 9.29 1.577 Maltese 7.85 2.318 8.84 1.433 Language English/other 8.80 1.732 9.25 2.050 North harbour 8.32 1.942 9.02 2.112 South harbour 8.16 2.035 8.44 1.734 South Eastern 8.67 1.992 9.27 1.402 Western 8.74 1.855 9.27 1.206 Northern 7.59 2.532 8.72 1.529
Locality
Gozo 7.63 2.553 8.41 1.734 Yes 7.32 2.533 8.00 2.132 Illness or
disability No 8.34 2.076 9.06 1.597 Yes 7.11 2.622 7.90 2.119 Medication or
therapy No 8.35 2.067 9.06 1.602 Poor 6.37 3.008 8.33 2.066 Adequate 6.59 2.455 8.29 1.840
Communication
Very good 8.40 1.981 9.06 1.294 Low 5.65 2.390 8.01 1.304 Average 7.69 2.311 8.49 1.671
Teacher reported self-esteem High 8.25 2.134 9.06 1.362
Low 8.09 2.360 7.67 2.066 Average 8.27 2.070 8.76 1.677
Parent reported self-esteem
High 8.51 2.186 9.10 1.668 Low 6.38 2.499 8.40 1.265 Average 7.66 2.336 8.68 1.613
Teacher reported self-efficacy High 8.33 2.106 9.01 1.386
Low 8.00 2.330 6.20 1.304 Average 8.22 2.172 8.65 1.636
Parent reported self-efficacy
High 8.26 2.127 9.28 1.626
. One of the most evident findings is that female pupils are
more prosocial than males according to both teachers’ and parents’ evaluations. Being free from health problems and disability and not undergoing any medical or psycho-educational interventions are also significantly related to prosocial behaviour, as well as individual personality characteristics such as good communication, positive

Prosocial behaviour by individual, school and home factors
61
self-esteem and high self-efficacy. On the other hand, locality and language do not appear to be related to prosocial behaviour amongst Year 4 pupils. 4.1.2 Individual classroom and school variables
Table 4.2 presents the mean prosocial behaviour scores of individual classroom and school variables by teachers’ and parents’ evaluations.
Table 4.2: Mean prosocial scores by individual classroom and school variables
Prosocial Score (Year 4) Teacher Parent
Individual variables (Learning) Mean St. Dev Mean St. Dev Poor 6.87 2.809 8.82 1.510 Average 7.61 2.153 8.88 1.468
Teacher reported academic progress Very good 8.36 2.077 8.87 1.500
Poor 6.95 2.417 8.71 4.348 Average 8.04 2.106 8.77 1.476
Pupil reported academic progress Very good 7.99 2.278 8.90 1.502
Poor 6.17 2.864 8.40 0.843 Moderate 7.85 2.199 8.76 1.540
Teacher academic expectation Good 8.26 2.079 8.86 1.505
Poor 7.30 2.669 7.33 1.751 Moderate 8.27 2.103 8.45 1.860
Parental academic expectation Good 8.26 2.118 9.17 1.580
Many 6.35 3.297 8.25 6.850 Some 8.01 2.084 8.83 1.443
Learning difficulties
None 8.09 2.147 8.96 1.469 Yes 7.37 2.760 8.28 1.934 Teacher reported
learning support No 7.99 2.207 8.95 1.408 Not much 7.73 2.546 8.56 2.773 Moderate 7.89 2.181 8.72 1.563
Pupil-reported support
A lot 8.06 2.162 8.97 1.385 Not much 8.42 1.708 8.95 3.086 Moderate 7.79 2.287 8.70 1.660
Peer support with work
A lot 8.00 2.248 9.08 1.234
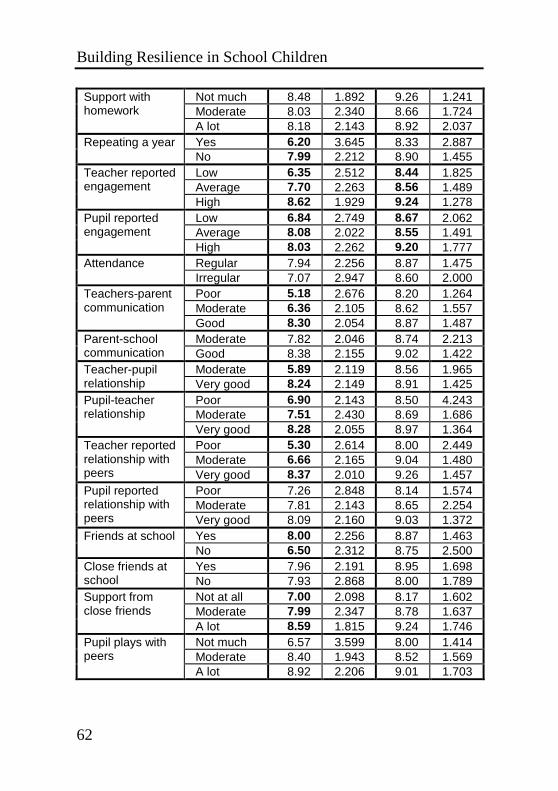
Building Resilience in School Children
62
Not much 8.48 1.892 9.26 1.241 Moderate 8.03 2.340 8.66 1.724
Support with homework
A lot 8.18 2.143 8.92 2.037 Yes 6.20 3.645 8.33 2.887 Repeating a year No 7.99 2.212 8.90 1.455 Low 6.35 2.512 8.44 1.825 Average 7.70 2.263 8.56 1.489
Teacher reported engagement
High 8.62 1.929 9.24 1.278 Low 6.84 2.749 8.67 2.062 Average 8.08 2.022 8.55 1.491
Pupil reported engagement
High 8.03 2.262 9.20 1.777 Regular 7.94 2.256 8.87 1.475 Attendance Irregular 7.07 2.947 8.60 2.000 Poor 5.18 2.676 8.20 1.264 Moderate 6.36 2.105 8.62 1.557
Teachers-parent communication
Good 8.30 2.054 8.87 1.487 Moderate 7.82 2.046 8.74 2.213 Parent-school
communication Good 8.38 2.155 9.02 1.422 Moderate 5.89 2.119 8.56 1.965 Teacher-pupil
relationship Very good 8.24 2.149 8.91 1.425 Poor 6.90 2.143 8.50 4.243 Moderate 7.51 2.430 8.69 1.686
Pupil-teacher relationship
Very good 8.28 2.055 8.97 1.364 Poor 5.30 2.614 8.00 2.449 Moderate 6.66 2.165 9.04 1.480
Teacher reported relationship with peers Very good 8.37 2.010 9.26 1.457
Poor 7.26 2.848 8.14 1.574 Moderate 7.81 2.143 8.65 2.254
Pupil reported relationship with peers Very good 8.09 2.160 9.03 1.372
Yes 8.00 2.256 8.87 1.463 Friends at school No 6.50 2.312 8.75 2.500 Yes 7.96 2.191 8.95 1.698 Close friends at
school No 7.93 2.868 8.00 1.789 Not at all 7.00 2.098 8.17 1.602 Moderate 7.99 2.347 8.78 1.637
Support from close friends
A lot 8.59 1.815 9.24 1.746 Not much 6.57 3.599 8.00 1.414 Moderate 8.40 1.943 8.52 1.569
Pupil plays with peers
A lot 8.92 2.206 9.01 1.703

Prosocial behaviour by individual, school and home factors
63
Good academic progress, high teacher and parent academic expectations, active pupil engagement in learning and lack of learning difficulties are all related to prosocial behaviour, again underlining the inextricable link between learning and behaviour displayed in Table 4.2. On the other hand, however, support with learning from the teacher, peers and parents, did not feature as important predictors of prosocial behaviour, suggesting that learning difficulties and needing support may be more indicative of SEBD as exhibited in Chapter 3. Good communication between teachers and parents is significantly related to prosocial behaviour on the basis of teachers’ evaluations.
Classroom relationships are significantly related to prosocial
behaviour according to the teachers’ evaluations, with a similar, though not significant trend, emerging from the parents’ evaluations. The teacher-pupils/pupils-teacher relationships stand as very strong predictors of prosocial behaviour; evaluations from parents suggest a similar trend, though the relationships are not significant at the 0.05 level of significance. Relationships with peers, having friends at school, and support by close friends also feature as important predictors of pupils’ prosocial behaviour. On the other hand, pupils’ play with peers was found to be a weak predictor of prosocial behaviour in both teachers’ and parents’ evaluations. 4.1.3 Individual home and community variables
Table 4.3 presents descriptive statistics for the prosocial scores by individual home and community variables according to teachers’ and parents’ evaluations. Relatively few home-related factors have been found to be significantly related to prosocial behaviour, while community variables such as involvement in community organizations and neighbourhood safety and support were not related. Table 4.3 demonstrates that good behaviour at home, and good relationships between child and parents and relatives, feature as strong predictors
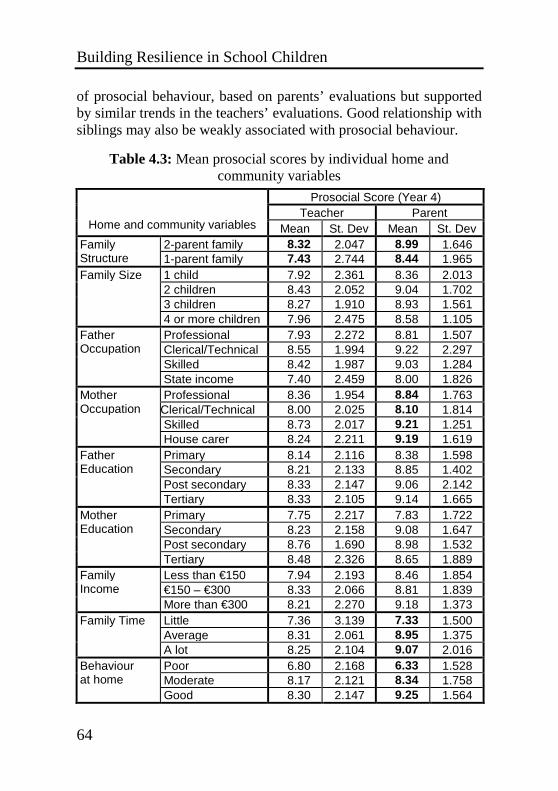
Building Resilience in School Children
64
of prosocial behaviour, based on parents’ evaluations but supported by similar trends in the teachers’ evaluations. Good relationship with siblings may also be weakly associated with prosocial behaviour.
Table 4.3: Mean prosocial scores by individual home and community variables
Prosocial Score (Year 4) Teacher Parent
Home and community variables Mean St. Dev Mean St. Dev 2-parent family 8.32 2.047 8.99 1.646 Family
Structure 1-parent family 7.43 2.744 8.44 1.965 1 child 7.92 2.361 8.36 2.013 2 children 8.43 2.052 9.04 1.702 3 children 8.27 1.910 8.93 1.561
Family Size
4 or more children 7.96 2.475 8.58 1.105 Professional 7.93 2.272 8.81 1.507 Clerical/Technical 8.55 1.994 9.22 2.297 Skilled 8.42 1.987 9.03 1.284
Father Occupation
State income 7.40 2.459 8.00 1.826 Professional 8.36 1.954 8.84 1.763 Clerical/Technical 8.00 2.025 8.10 1.814 Skilled 8.73 2.017 9.21 1.251
Mother Occupation
House carer 8.24 2.211 9.19 1.619 Primary 8.14 2.116 8.38 1.598 Secondary 8.21 2.133 8.85 1.402 Post secondary 8.33 2.147 9.06 2.142
Father Education
Tertiary 8.33 2.105 9.14 1.665 Primary 7.75 2.217 7.83 1.722 Secondary 8.23 2.158 9.08 1.647 Post secondary 8.76 1.690 8.98 1.532
Mother Education
Tertiary 8.48 2.326 8.65 1.889 Less than €150 7.94 2.193 8.46 1.854 €150 – €300 8.33 2.066 8.81 1.839
Family Income
More than €300 8.21 2.270 9.18 1.373 Little 7.36 3.139 7.33 1.500 Average 8.31 2.061 8.95 1.375
Family Time
A lot 8.25 2.104 9.07 2.016 Poor 6.80 2.168 6.33 1.528 Moderate 8.17 2.121 8.34 1.758
Behaviour at home
Good 8.30 2.147 9.25 1.564

Prosocial behaviour by individual, school and home factors
65
Poor 7.00 2.449 6.00 1.000 Moderate 8.03 2.236 8.00 1.685
Communication with parents
Good 8.31 2.104 9.19 1.611 Poor 8.00 1.732 8.33 1.862 Moderate 8.26 2.187 8.73 1.519
Relationship with siblings
Good 8.31 2.032 9.18 1.666 Moderate 7.94 2.076 7.69 2.152 Relationship
with relatives Good 8.27 2.139 9.05 1.627 Yes 8.25 2.144 8.98 1.676 Parent-reported
Friends No 7.40 2.074 7.60 2.302 Yes 8.17 2.090 8.90 1.503 Membership in
Organization No 8.26 2.323 8.81 2.693 Poor 8.07 2.200 8.10 1.853 Moderate 8.09 2.214 8.62 2.012
Participation in organization
Regular 8.24 2.109 9.01 1.311 Little 6.00 4.359 8.33 2.082 Average 8.06 2.250 8.68 1.695
Family Cohesion
A lot 8.34 2.061 8.98 1.704 With shouting 8.11 2.370 8.40 1.624 Family
Conflict Calm discussion 8.32 2.064 9.03 1.722 Very stressed 8.06 2.401 8.64 1.569 Fairly stressed 8.34 2.027 9.01 1.819
Parenting Stress
Not stressed 8.09 2.263 8.93 1.359 Very difficult 8.21 2.138 8.85 1.811 Fairly difficult 8.23 2.142 8.98 1.558
Parenting Difficulty
Not difficult 9.11 1.965 9.50 0.756 Moderate 8.00 2.331 8.63 1.593 Parental
Quality time A lot 8.31 2.085 9.04 1.683 Moderate 8.32 2.494 8.73 1.500 Parenting
Supervision A lot 8.22 2.017 9.00 1.752 Discipline 8.18 2.265 8.75 1.736 Punishment 8.09 2.293 8.44 1.816 Rewards 8.33 2.028 8.95 1.506 Persuasion 8.48 2.029 9.32 1.745
Parenting Strategies
Discussion 8.35 2.166 9.23 1.332 Not safe 8.50 2.039 9.22 3.300 Moderately safe 8.06 2.301 8.82 1.418
Neighbourhood Safety
Very safe 8.51 1.815 9.00 1.526 Not helpful 7.95 2.228 8.60 1.791 Fairly helpful 8.32 2.045 9.17 1.743
Neighbourhood Support
Very helpful 8.51 2.079 8.84 1.397

Building Resilience in School Children
66
The data suggests that children coming from two-parent families are more likely to exhibit prosocial behaviour, with support from both teachers’ and parents’ evaluations. Children in families which spend quality time together and solve conflicts constructively are also likely to engage in prosocial behaviour (parents’ evaluations). With the exception of mother occupation (parents’ evaluation), all the other indicators of socio-economic status (parental education, occupation and family income) and other family dynamics such as supervision, parenting strategies and parenting stress, did not feature as predictors of prosocial behaviour. 4.1.4 Regression analysis of individual variables
A backward regression procedure was used to identify the significant individual predictors of prosocial behaviour taken collectively and to rank them by their contribution in explaining variation in the responses. Table 4.4 shows that pupils’ relationship with peers is the best predictor of prosocial behaviour based on teachers’ evaluations. This is followed by good teacher-parent communication, child’s gender and family structure. On the other hand, the parents’ evaluations identify self-efficacy as the best predictor, followed by child’s communication with parents, self-esteem, family time, gender (females), lack of family conflict and good behaviour at home. Teachers’ and parents’ evaluations both indicate that gender is a clear predictor of prosocial behaviour, but while teachers’ evaluations underline more pupil relationships as other key predictors, parents’ evaluations indicate more personality and family factors such as high self-efficacy, positive self-esteem, good communication with parents, and good behaviour at home. Year 4 female pupils with high self-efficacy and self-esteem, coming from two parent families which spend good quality time together and solve conflicts constructively, who have good relationships with peers and with parents and behave well at home, and whose teachers and parents collaborate together are more likely to exhibit prosocial behaviour.

Prosocial behaviour by individual, school and home factors
67
Table 4.4: Regression analysis of individual variables
4.2 Prosocial behaviour by whole classroom variables
Table 4.5 displays the mean prosocial scores of classroom variables by teachers’ and parents’ evaluations. In contrast to individual characteristics, whole classroom factors did not feature as strong predictors of prosocial behaviour.
Table 4.5: Mean prosocial scores by whole classroom variables
Prosocial Score (Year 4) Teacher Parent
Classroom variables Mean St. Dev Mean St. Dev Poor 5.67 2.517 8.50 0.707 Average 7.39 2.238 8.85 1.433
Pupils’ participation during lessons High 8.05 2.285 8.85 1.520
Poor 7.48 7.48 7.48 2.502 Average 7.81 7.81 7.81 2.285
Pupils’ involvement in decision taking High 8.12 8.12 8.12 2.281
Poor 5.50 4.950 8.49 1.563 Average 7.59 2.383 8.68 1.423
Pupils’ collaboration in learning High 8.06 2.232 8.85 1.532
Prosocial scores of Year 4 students (Teacher Evaluations) Predictor F P-value Teacher-reported relationship with peers 18.640 0.000 Teacher-parent communication 14.508 0.000 Gender 14.958 0.000 Family structure 4.309 0.039
Parent Evaluations Parent reported self-efficacy 6.145 0.003 Communication with parents 4.167 0.017 Parent reported self-esteem 4.131 0.018 Family time 4.047 0.019 Gender 4.508 0.035 Family conflict 4.194 0.042 Behaviour at home 3.135 0.046

Building Resilience in School Children
68
Poor 7.66 2.268 8.23 1.526 Average 7.71 2.418 8.74 1.381
Pupils’ behaviour during play Good 8.09 2.192 8.81 1.582
Poor 6.50 2.121 8.36 1.118 Average 7.39 2.033 8.64 1.286
Pupils’ sense of classroom community High 7.96 2.315 8.87 1.519
Not adequate 7.35 2.149 8.79 1.357 Adequate 7.89 2.362 8.80 1.510
Classroom resources
Very adequate 8.51 2.032 9.22 1.536 Adequate 7.48 2.446 8.75 1.480 Teachers’
training Very good 8.22 2.141 9.00 1.523
Table 4.5 shows that none of the parents’ evaluations are
significant. According to teachers’ evaluations, collaboration in learning, pupils’ active participation during lessons and good teacher training are predictors of prosocial behaviour. Interestingly sense of classroom community, pupils’ involvement in decision making and good play behaviour, were not found to be predictive of prosocial behaviour, though there are indications that these three factors may be somewhat related to prosocial behaviour
Table 4.6: Regression analysis of whole classroom variables Prosocial scores of Year 4 students (Teacher Evaluation)
Predictor F P-value Pupils’ participation during lessons 9.669 0.002 Pupils’ collaboration in learning 3.612 0.028
Table 4.6 shows that the number of significant whole
classroom predictors identified by regression analysis is very small. The regression model of teachers’ evaluations indicates that pupils who participate actively during lessons and collaborate together in learning are more likely to behave prosocially. Parents’ evaluations suggest that no whole classroom predictor contributed significantly in explaining total variance in the prosocial scores at the 0.05 level of significance.

Prosocial behaviour by individual, school and home factors
69
4.3 Prosocial behaviour by whole-school variables
Table 4.7 shows the mean prosocial scores of whole school variables by teachers’ and parents’ evaluations. As in the case of whole classroom variables, they have been found to be very weak predictors of prosocial behaviour.
Table 4.7: Mean prosocial scores by whole school variables
Prosocial Score (Year 4) Teacher Parent
School variables Mean St. Dev Mean St. Dev Average 7.63 2.506 8.79 1.482 Pupils’ behaviour Good 8.10 2.132 8.91 1.510 Average 7.65 2.408 8.83 1.739 Pupils’ support and
collaboration Good 8.32 2.054 8.88 1.349 Average 7.72 2.183 8.74 1.383 Pupils’ engagement
in school activities Good 8.00 2.355 8.92 1.555 Poor 7.77 2.312 8.82 1.466 Average 7.99 2.319 8.86 1.583
Pupils’ participation in decisions
Good 8.22 2.045 9.10 0.994 A lot 7.54 2.047 8.67 1.775 Occasional 7.80 2.350 8.87 1.446
Bullying
Low 7.96 2.296 8.96 1.520 Low 7.43 1.134 8.50 0.707 Average 7.77 2.312 8.76 1.432
Staff participation in school activities
High 7.96 2.308 8.95 1.565 Low 8.13 2.311 8.81 1.707 Average 8.60 2.342 8.89 1.337
Staff participation in decisions
High 8.69 1.794 8.93 1.543 Low 7.70 1.927 8.83 1.000 Average 7.73 2.375 8.94 1.461
Staff teamwork
High 8.01 2.254 8.97 1.644 Low 7.89 2.444 8.75 1.390 Average 7.90 2.323 8.91 1.531
Staff support and collegiality
High 8.10 2.207 8.92 1.496 Low 8.09 2.112 8.52 1.126 Average 8.16 2.423 8.79 1.550
Administrative support
High 8.20 2.162 8.89 1.489

Building Resilience in School Children
70
Table 4.7 shows that none of the parents’ evaluations have significant p-values, while only pupils’ behaviour and pupils’ support and collaboration were significantly related to prosocial behaviour in teachers’ evaluations. There are also some suggestions that prosocial behaviour is more likely to be found in schools where bullying is low and where pupils’ participate in decisions. Staff behaviour such as participation in school activities and decisions, collaboration, support and collegiality, as well as administrative support, appears to be weak predictors of pupil prosocial behaviour. A regression analysis of whole school variables suggests that whole school variables explain a very small portion of the variation in the prosocial score. Table 4.8 identifies pupil support and collaboration as the sole significant school predictor of prosocial behaviour.
Table 4.8: Regression analysis of whole-school variables
Prosocial scores of Year 4 students (Teacher Evaluation) Predictor F P-value
Pupils’ support and collaboration 6.916 0.009
4.4 Conclusion
To identify the dominant, significant explanatory variables across clusters of individual, classroom, school, and home variables, regression analysis was again employed using the prosocial scores as the dependent variable for both teachers’ and parents’ evaluations. To identify the parsimonious models that include solely the dominant predictors of prosocial behaviour, a backward procedure was used.
Table 4.9 shows the results of the regression analysis that
fitted students’ prosocial scores provided by their teachers. This five-predictor parsimonious model explains 30.3% of the total variation in the prosocial scores. Three of the five significant predictors are individual variables mostly related to relationships and
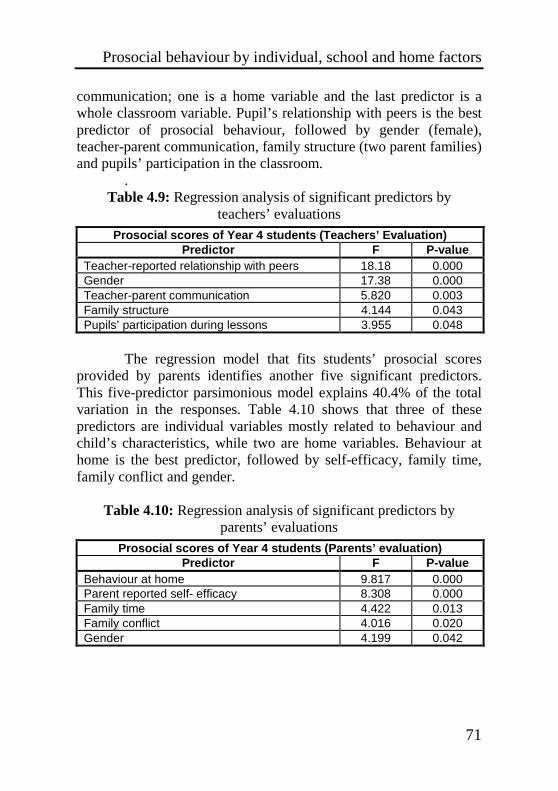
Prosocial behaviour by individual, school and home factors
71
communication; one is a home variable and the last predictor is a whole classroom variable. Pupil’s relationship with peers is the best predictor of prosocial behaviour, followed by gender (female), teacher-parent communication, family structure (two parent families) and pupils’ participation in the classroom.
. Table 4.9: Regression analysis of significant predictors by
teachers’ evaluations Prosocial scores of Year 4 students (Teachers’ Evaluation)
Predictor F P-value Teacher-reported relationship with peers 18.18 0.000 Gender 17.38 0.000 Teacher-parent communication 5.820 0.003 Family structure 4.144 0.043 Pupils’ participation during lessons 3.955 0.048
The regression model that fits students’ prosocial scores
provided by parents identifies another five significant predictors. This five-predictor parsimonious model explains 40.4% of the total variation in the responses. Table 4.10 shows that three of these predictors are individual variables mostly related to behaviour and child’s characteristics, while two are home variables. Behaviour at home is the best predictor, followed by self-efficacy, family time, family conflict and gender.
Table 4.10: Regression analysis of significant predictors by parents’ evaluations
Prosocial scores of Year 4 students (Parents’ evaluation) Predictor F P-value
Behaviour at home 9.817 0.000 Parent reported self- efficacy 8.308 0.000 Family time 4.422 0.013 Family conflict 4.016 0.020 Gender 4.199 0.042

Building Resilience in School Children
72
Figure 4.1: Best predictors of prosocial scores for Year 4 students
on the basis of teachers’ and parents’ evaluations Figure 4.1 shows that pupil’s gender is the sole significant
predictor common to both teachers’ and parents’ evaluations. None of the whole school related variables were found to contribute significantly in explaining variation in the prosocial scores when included with other individual, classroom, home and related variables. Year 4 pupils most likely to exhibit prosocial behaviour are female pupils who have good relationships with peers, high self-efficacy, have parents and teacher who communicate well together, and attend classrooms with high levels of pupils’ engagement. They are well behaved at home and come from two-parent families which provide good quality time and have low levels of conflict.
Figures 4.2-4.10 provide a more visual illustration of differences in prosocial scores categorized by individual, class, school and home variables.

Prosocial behaviour by individual, school and home factors
73
Figure 4.2: Prosocial scores by gender
Figure 4.3: Prosocial scores by parent-reported self-efficacy
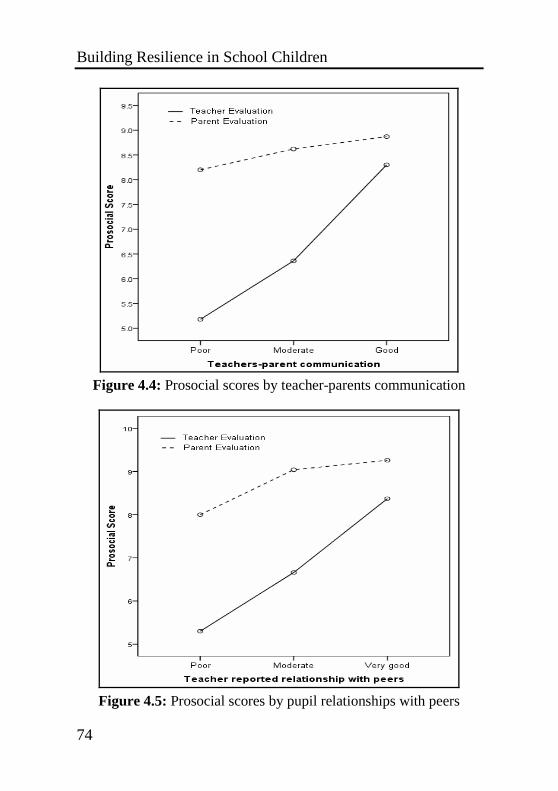
Building Resilience in School Children
74
Figure 4.4: Prosocial scores by teacher-parents communication
Figure 4.5: Prosocial scores by pupil relationships with peers

Prosocial behaviour by individual, school and home factors
75
Figure 4.6: Prosocial scores by family structure
Figure 4.7: Prosocial scores by family time

Building Resilience in School Children
76
Figure 4.8: Prosocial scores by child’s behaviour at home
Figure 4.9: Prosocial scores by family conflict
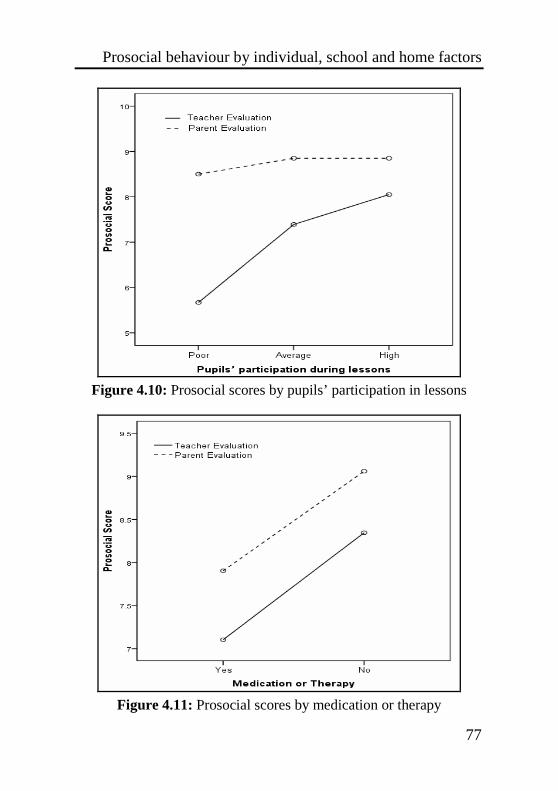
Prosocial behaviour by individual, school and home factors
77
Figure 4.10: Prosocial scores by pupils’ participation in lessons
Figure 4.11: Prosocial scores by medication or therapy

Building Resilience in School Children
78

Trajectory of SEBD from Year 1 to Year 4
79

Building Resilience in School Children
80
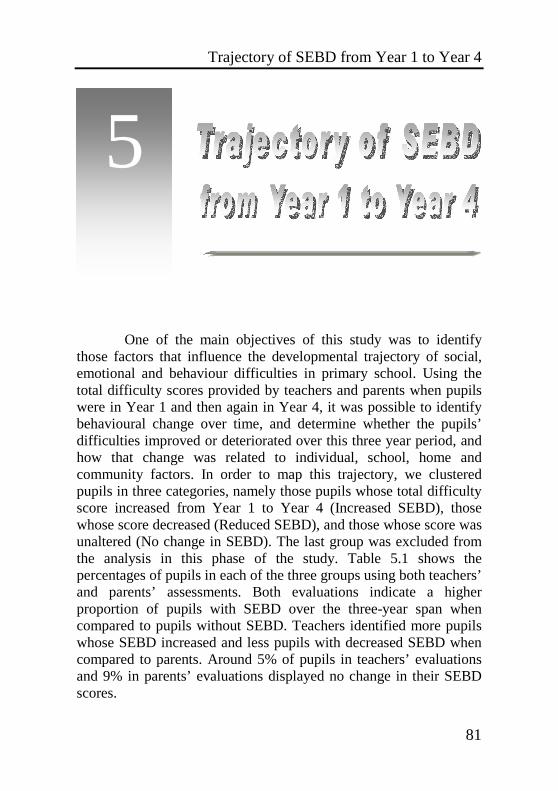
Trajectory of SEBD from Year 1 to Year 4
81
One of the main objectives of this study was to identify those factors that influence the developmental trajectory of social, emotional and behaviour difficulties in primary school. Using the total difficulty scores provided by teachers and parents when pupils were in Year 1 and then again in Year 4, it was possible to identify behavioural change over time, and determine whether the pupils’ difficulties improved or deteriorated over this three year period, and how that change was related to individual, school, home and community factors. In order to map this trajectory, we clustered pupils in three categories, namely those pupils whose total difficulty score increased from Year 1 to Year 4 (Increased SEBD), those whose score decreased (Reduced SEBD), and those whose score was unaltered (No change in SEBD). The last group was excluded from the analysis in this phase of the study. Table 5.1 shows the percentages of pupils in each of the three groups using both teachers’ and parents’ assessments. Both evaluations indicate a higher proportion of pupils with SEBD over the three-year span when compared to pupils without SEBD. Teachers identified more pupils whose SEBD increased and less pupils with decreased SEBD when compared to parents. Around 5% of pupils in teachers’ evaluations and 9% in parents’ evaluations displayed no change in their SEBD scores.
5

Building Resilience in School Children
82
Table 5.1: Percentage of pupils by type of SEBD change
Group
Teachers’ Evaluation
Parents’ Evaluation
Reduced SEBD 39.5% 43.0% Increased SEBD 55.6% 48.2% No change in SEBD 4.9% 8.8%
The following sections describe how the increase or
decrease in pupils’ SEBD are related to the various individual, classroom, school, home and community factors explored in this study. As in the previous chapters, the variables have been categorized into three main sets, namely individual, whole class and whole school variables. The analysis makes use of univariate logistic regression to examine the association between the likelihood of a pupil’s positive/negative change in SEBD and any individual, classroom, school, home and community variable. The advantage of using logistic regression analysis over the chi square, is that besides the p-value, which matches that of the chi square test using the likelihood-ratio method, it also provides estimates of the regression coefficients from which the odds ratios are computed. The odds ratio is a relative measure of hazard, indicating how much more likely a pupil will exhibit positive/negative behavioural change given the predictors. The odds ratios and their corresponding 95% confidence intervals are provided only for the significant predictors. 5.1 SEBD change by individual variables 5.1.1 Individual characteristics variables
Table 5.2 presents the percentage change in SEBD over the three year period by individual characteristics variables, making use of both teachers’ and parents’ evaluations. Significant percentage changes are marked bold. Table 5.3 presents the odds ratios and 95% confidence intervals computed for the significant predictors.

Trajectory of SEBD from Year 1 to Year 4
83
Table 5.2: Change in SEBD by individual characteristics variables
Teacher evaluation
Parent evaluation
Individual variables (Characteristics)
Less SEBD
More SEBD
Less SEBD
More SEBD
Male 53.3% 40.4% 37.3% 57.0% Gender Female 46.7% 59.6% 62.7% 43.0% Maltese 92.7% 92.0% 91.7% 93.7% Language English/other 7.3% 8.0% 8.3% 6.3% North harbour 20.4% 21.3% 30.3% 30.5% South harbour 12.9% 17.3% 14.6% 12.2% South Eastern 18.3% 18.1% 10.1% 15.9% Western 19.4% 15.0% 22.5% 11.0% Northern 17.2% 25.2% 12.4% 22.0%
Locality
Gozo 11.8% 3.1% 10.1% 8.5% Yes 9.4% 10.5% 12.3% 14.1% Illness or
Disability No 90.6% 89.5% 87.7% 85.9% Yes 7.0% 9.5% 11.1% 13.0% Medication or
therapy No 93.0% 90.5% 88.9% 87.0% Poor 1.5% 7.4% 4.2% 9.8% Adequate 20.4% 24.5% 19.4% 25.3%
Communication
Very good 78.1% 68.1% 76.4% 64.9% Low 2.9% 10.5% 1.3% 5.6% Average 32.1% 35.6% 41.8% 25.0%
Teacher reported self-esteem High 65.0% 53.9% 57.0% 69.4%
Low 1.1% 4.7% 1.3% 5.6% Average 28.3% 31.5% 31.3% 30.0%
Parent reported self-esteem
High 70.7% 63.8% 67.5% 64.4% Low 5.1% 10.1% 1.3% 6.9% Average 36.5% 42.6% 50.6% 31.9%
Teacher reported self-efficacy High 58.4% 47.3% 48.1% 61.1%
Low 2.4% 5.3% 1.2% 4.4% Average 44.4% 41.5% 38.3% 45.6%
Parent reported self-efficacy
High 53.2% 53.2% 60.5% 50.0%
Poor communication skills, low self-esteem and low self-
efficacy are the strongest predictors of increase in SEBD from the early to the junior primary school years. According to teachers’ evaluations, the estimated odds that a pupil having poor communication displays an increase in SEBD, is 3.850 times the

Building Resilience in School Children
84
estimated odds of pupils with good communication skills; according to parents’ evaluations, the estimated odds ratio is 2.813. The estimated odds that a pupil with low self-esteem show an increase in their SEBD is 1.553 times the estimated odds of a pupil with high self-esteem according to teacher’s evaluations, and 2.599 according to the parents’ evaluations. Teachers and parents exhibit contrasting views about behaviour change by gender. According to teachers, the estimated odds that a female pupil displays an increase in SEBD is 1.682 times the estimated odds of a male, while according to parents, the estimated odds ratio is 3.222 in the reverse direction. Pupils with disability/illness and undergoing treatment/intervention are more likely to manifest increased SEBD but the associations are not significant. Language and region do not seem to predict behaviour change, though there are some indications that while pupils from the northern region tend to experience a slight increase in SEBD, those in the western and Gozo show marginal decreases.
Table 5.3: Odds ratio of significant individual characteristics
variables Teachers’ Evaluation
Predictor
Chi Square
P-value
Odds ratio
95% Conf. Int.
Communication 8.390 0.015 3.850 (2.326 – 6.371) Gender 5.350 0.021 1.682 (1.081 – 2.616) Self-esteem 6.705 0.035 1.553 (1.015 –2.376)
Parents’ Evaluation Gender 6.831 0.009 3.222 (1.678 – 6.188) Self-efficacy 7.670 0.022 2.912 (1.624 – 5.223) Communication 6.540 0.038 2.813 (1.590 – 4.975) Self-esteem 6.344 0.042 2.599 (1.413 – 4.781)
5.1.2 Individual classroom and school variables
Table 5.4 presents the change in SEBD by individual classroom and school variables, making use of both teachers’ and parents’ evaluations. Significant percentage differences are marked bold.

Trajectory of SEBD from Year 1 to Year 4
85
Table 5.4: Change in SEBD by individual classroom and school factors
Teacher evaluation
Parent evaluation
Individual variables (Learning) Less
SEBD More SEBD
Less SEBD
More SEBD
Poor 13.9% 18.2% 11.1% 11.5% Average 22.6% 30.5% 19.4% 30.8%
Teacher reported academic progress Very good 63.5% 51.3% 69.4% 57.7%
Poor 1.7% 10.3% 4.0% 4.8% Average 47.5% 46.6% 41.3% 49.4%
Pupil reported academic progress Very good 50.8% 43.1% 54.7% 45.8%
Poor 8.8% 12.3% 5.6% 7.7% Moderate 26.3% 31.6% 19.4% 34.6%
Teacher academic expectation Good 65.0% 56.1% 75.0% 57.7%
Poor 3.2% 5.5% 1.2% 5.6% Moderate 21.3% 27.3% 13.6% 39.3%
Parent academic expectation
Good 75.5% 67.2% 85.2% 55.1% Many 2.5% 8.0% 2.4% 4.7% Some 48.3% 50.0% 50.8% 55.3%
Learning difficulties
None 49.2% 42.0% 46.8% 40.0% Yes 13.8% 12.4% 13.9% 10.1% Teacher reported
learning support No 86.2% 87.6% 86.1% 89.9% Not much 11.0% 15.6% 9.3% 12.2% Moderate 35.6% 37.6% 38.7% 36.6%
Pupil-reported support
A lot 53.4% 46.8% 52.0% 51.2% Not much 10.1% 9.9% 10.7% 14.5% Moderate 39.5% 43.0% 34.7% 35.4%
Peer support with work
A lot 50.4% 47.1% 54.7% 50.2% Not much 29.5% 39.4% 27.5% 37.3% Moderate 36.4% 38.3% 36.3% 35.5%
Support with homework
A lot 34.1% 22.3% 36.3% 27.2% Yes 2.7% 3.7% 1.3% 2.8% Repeating year No 97.3% 96.3% 98.7% 97.2% Low 12.5% 17.6% 11.1% 10.3% Average 33.1% 43.1% 26.4% 48.7%
Teacher reported engagement
High 54.4% 39.4% 62.5% 41.0% Low 5.1% 10.3% 2.7% 7.2% Average 50.8% 41.4% 33.3% 42.2%
Pupil reported engagement
High 44.1% 48.3% 64.0% 50.6% Regular 97.1% 94.7% 97.5% 94.2% Attendance Irregular 2.9% 5.3% 2.5% 5.8%
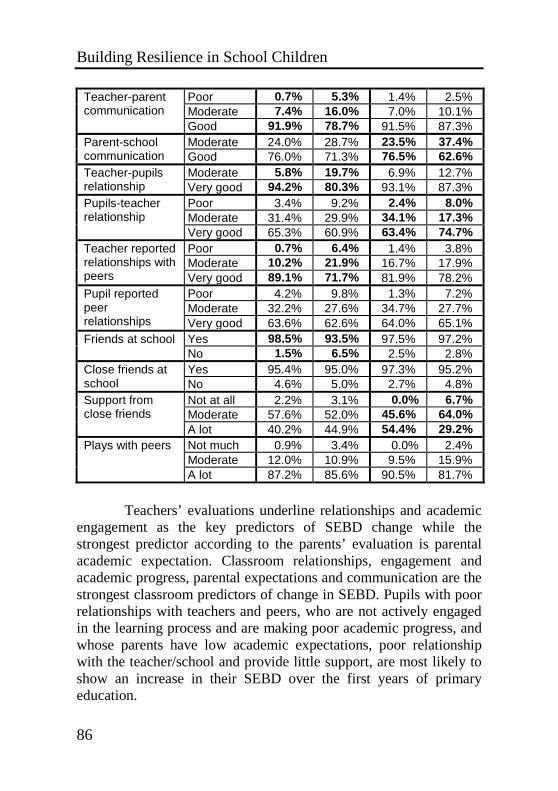
Building Resilience in School Children
86
Poor 0.7% 5.3% 1.4% 2.5% Moderate 7.4% 16.0% 7.0% 10.1%
Teacher-parent communication
Good 91.9% 78.7% 91.5% 87.3% Moderate 24.0% 28.7% 23.5% 37.4% Parent-school
communication Good 76.0% 71.3% 76.5% 62.6% Moderate 5.8% 19.7% 6.9% 12.7% Teacher-pupils
relationship Very good 94.2% 80.3% 93.1% 87.3% Poor 3.4% 9.2% 2.4% 8.0% Moderate 31.4% 29.9% 34.1% 17.3%
Pupils-teacher relationship
Very good 65.3% 60.9% 63.4% 74.7% Poor 0.7% 6.4% 1.4% 3.8% Moderate 10.2% 21.9% 16.7% 17.9%
Teacher reported relationships with peers Very good 89.1% 71.7% 81.9% 78.2%
Poor 4.2% 9.8% 1.3% 7.2% Moderate 32.2% 27.6% 34.7% 27.7%
Pupil reported peer relationships Very good 63.6% 62.6% 64.0% 65.1%
Yes 98.5% 93.5% 97.5% 97.2% Friends at school No 1.5% 6.5% 2.5% 2.8% Yes 95.4% 95.0% 97.3% 95.2% Close friends at
school No 4.6% 5.0% 2.7% 4.8% Not at all 2.2% 3.1% 0.0% 6.7% Moderate 57.6% 52.0% 45.6% 64.0%
Support from close friends
A lot 40.2% 44.9% 54.4% 29.2% Not much 0.9% 3.4% 0.0% 2.4% Moderate 12.0% 10.9% 9.5% 15.9%
Plays with peers
A lot 87.2% 85.6% 90.5% 81.7%
Teachers’ evaluations underline relationships and academic
engagement as the key predictors of SEBD change while the strongest predictor according to the parents’ evaluation is parental academic expectation. Classroom relationships, engagement and academic progress, parental expectations and communication are the strongest classroom predictors of change in SEBD. Pupils with poor relationships with teachers and peers, who are not actively engaged in the learning process and are making poor academic progress, and whose parents have low academic expectations, poor relationship with the teacher/school and provide little support, are most likely to show an increase in their SEBD over the first years of primary education.

Trajectory of SEBD from Year 1 to Year 4
87
Table 5.5: Odds ratio of individual classroom and school variables Teachers’ Evaluation
Predictor
Chi Square
P-value
Odds ratio
95% Conf. Int.
Teacher-pupils relationship 13.96 0.000 3.951 (1.776 – 8.789) Relationships with peers 17.63 0.000 2.666 (1.386 – 5.130) Teacher-parent communication 12.57 0.002 2.534 (1.192 – 5.387) Academic progress 10.17 0.006 1.962 (1.149 – 3.350) Friends at school 5.398 0.020 1.713 (1.027 – 2.856) Teacher reported engagement 7.260 0.027 1.637 (1.003 – 2.672)
Parents’ Evaluation Parent academic expectation 19.10 0.000 4.481 (2.074 – 9.678) Support from close friends 16.74 0.000 2.619 (1.379 – 4.972) Teacher reported engagement 8.421 0.015 2.145 (1.137 – 4.047) Pupils-teacher relationship 7.546 0.023 1.898 (1.020 – 3.534) Parent-school communication 3.932 0.047 1.761 (1.100 – 2.819)
Table 5.5 presents the odds ratio computed for significant
predictors by both teachers’ and parents’ evaluations.
• Pupils who have a poor relationship with their teacher are 3.951 times more likely to have SEBD than pupils who have good relationships; according to parents, the odds ratio is 1.898 times;
• Pupils who have poor relationships with their peers are 2.666 times more likely to have SEBD than peers who have hood relationships;
• Pupils whose teacher and parent do not enjoy a good relationship are 2.534 times more likely to have SEBD than peers whose teachers and parents work well together; according to parents the odds ratio is 1.761 times;
• Pupils with poor academic progress are 1.962 times more likely to have difficulties over time than pupils with good academic progress;
• Pupils who have no friends are 1.713 times more likely to have SEBD than peers who have friends;
• Pupils whose parents have low academic expectations for their children are 4.481 times more likely to develop SEBD than peers with parents who hold high expectations;
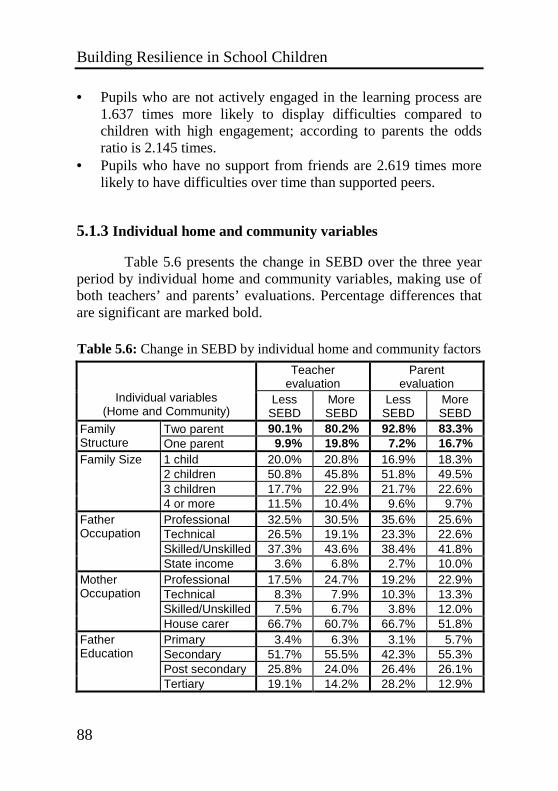
Building Resilience in School Children
88
• Pupils who are not actively engaged in the learning process are 1.637 times more likely to display difficulties compared to children with high engagement; according to parents the odds ratio is 2.145 times.
• Pupils who have no support from friends are 2.619 times more likely to have difficulties over time than supported peers.
5.1.3 Individual home and community variables
Table 5.6 presents the change in SEBD over the three year period by individual home and community variables, making use of both teachers’ and parents’ evaluations. Percentage differences that are significant are marked bold.
Table 5.6: Change in SEBD by individual home and community factors
Teacher evaluation
Parent evaluation
Individual variables (Home and Community)
Less SEBD
More SEBD
Less SEBD
More SEBD
Two parent 90.1% 80.2% 92.8% 83.3% Family Structure One parent 9.9% 19.8% 7.2% 16.7%
1 child 20.0% 20.8% 16.9% 18.3% 2 children 50.8% 45.8% 51.8% 49.5% 3 children 17.7% 22.9% 21.7% 22.6%
Family Size
4 or more 11.5% 10.4% 9.6% 9.7% Professional 32.5% 30.5% 35.6% 25.6% Technical 26.5% 19.1% 23.3% 22.6% Skilled/Unskilled 37.3% 43.6% 38.4% 41.8%
Father Occupation
State income 3.6% 6.8% 2.7% 10.0% Professional 17.5% 24.7% 19.2% 22.9% Technical 8.3% 7.9% 10.3% 13.3% Skilled/Unskilled 7.5% 6.7% 3.8% 12.0%
Mother Occupation
House carer 66.7% 60.7% 66.7% 51.8% Primary 3.4% 6.3% 3.1% 5.7% Secondary 51.7% 55.5% 42.3% 55.3% Post secondary 25.8% 24.0% 26.4% 26.1%
Father Education
Tertiary 19.1% 14.2% 28.2% 12.9%
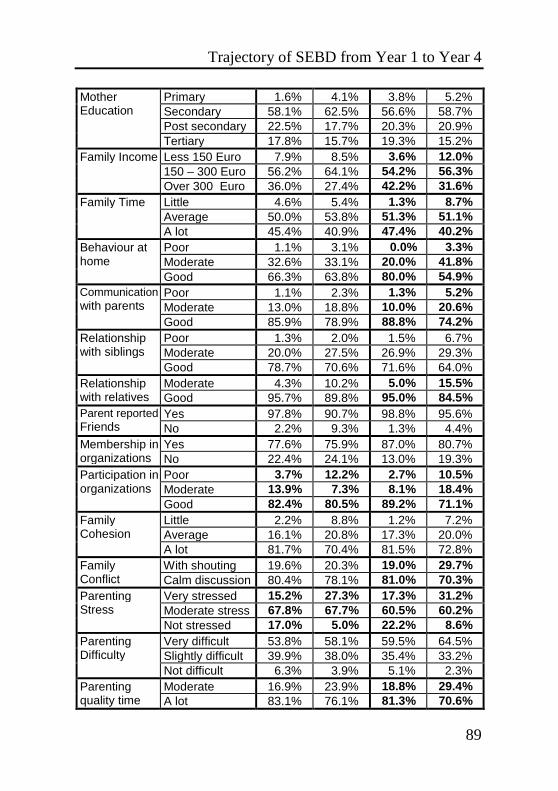
Trajectory of SEBD from Year 1 to Year 4
89
Primary 1.6% 4.1% 3.8% 5.2% Secondary 58.1% 62.5% 56.6% 58.7% Post secondary 22.5% 17.7% 20.3% 20.9%
Mother Education
Tertiary 17.8% 15.7% 19.3% 15.2% Less 150 Euro 7.9% 8.5% 3.6% 12.0% 150 – 300 Euro 56.2% 64.1% 54.2% 56.3%
Family Income
Over 300 Euro 36.0% 27.4% 42.2% 31.6% Little 4.6% 5.4% 1.3% 8.7% Average 50.0% 53.8% 51.3% 51.1%
Family Time
A lot 45.4% 40.9% 47.4% 40.2% Poor 1.1% 3.1% 0.0% 3.3% Moderate 32.6% 33.1% 20.0% 41.8%
Behaviour at home
Good 66.3% 63.8% 80.0% 54.9% Poor 1.1% 2.3% 1.3% 5.2% Moderate 13.0% 18.8% 10.0% 20.6%
Communication with parents
Good 85.9% 78.9% 88.8% 74.2% Poor 1.3% 2.0% 1.5% 6.7% Moderate 20.0% 27.5% 26.9% 29.3%
Relationship with siblings
Good 78.7% 70.6% 71.6% 64.0% Moderate 4.3% 10.2% 5.0% 15.5% Relationship
with relatives Good 95.7% 89.8% 95.0% 84.5% Yes 97.8% 90.7% 98.8% 95.6% Parent reported
Friends No 2.2% 9.3% 1.3% 4.4% Yes 77.6% 75.9% 87.0% 80.7% Membership in
organizations No 22.4% 24.1% 13.0% 19.3% Poor 3.7% 12.2% 2.7% 10.5% Moderate 13.9% 7.3% 8.1% 18.4%
Participation in organizations
Good 82.4% 80.5% 89.2% 71.1% Little 2.2% 8.8% 1.2% 7.2% Average 16.1% 20.8% 17.3% 20.0%
Family Cohesion
A lot 81.7% 70.4% 81.5% 72.8% With shouting 19.6% 20.3% 19.0% 29.7% Family
Conflict Calm discussion 80.4% 78.1% 81.0% 70.3% Very stressed 15.2% 27.3% 17.3% 31.2% Moderate stress 67.8% 67.7% 60.5% 60.2%
Parenting Stress
Not stressed 17.0% 5.0% 22.2% 8.6% Very difficult 53.8% 58.1% 59.5% 64.5% Slightly difficult 39.9% 38.0% 35.4% 33.2%
Parenting Difficulty
Not difficult 6.3% 3.9% 5.1% 2.3% Moderate 16.9% 23.9% 18.8% 29.4% Parenting
quality time A lot 83.1% 76.1% 81.3% 70.6%

Building Resilience in School Children
90
Moderate 22.3% 32.3% 20.5% 31.0% Parenting supervision A lot 77.7% 67.7% 79.5% 69.0%
Discipline 23.5% 28.2% 14.0% 25.8% Punishment 8.5% 14.0% 8.2% 13.2% Rewards 25.5% 24.2% 25.5% 20.9% Persuasion 22.9% 19.1% 25.5% 19.8%
Parenting Strategies
Discussion 19.6% 14.5% 26.8% 20.3% Not safe 8.5% 8.5% 6.2% 14.0% Moderately safe 56.2% 62.8% 59.3% 60.2%
Neighbourhood Safety
Very safe 35.4% 28.7% 34.6% 25.8% Not helpful 24.6% 25.7% 26.6% 28.3% Slightly helpful 49.2% 49.6% 45.0% 52.2%
Neighbourhood Support
Very helpful 26.2% 23.7% 28.4% 19.6%
Family structure appears to be the strongest predictor of the development of SEBD in primary school, followed by parenting stress and supervision, participation in local organisations and family dynamics. On the other hand, socio-economic status features as a relatively weaker predictor, even if family income is a significant predictor according to parents’ evaluations. According to teachers’ and parents’ evaluations, the odds that a child living in a single parent family will have more difficulties over time are more than three times the odds for a child living in a two-parent family. Both the parents’ and teachers’ evaluations indicate that parenting stress and lack of supervision at home, as well as non-participation of children in local organisations, are strong predictors of SEBD development. They also suggest that a child’s behaviour is set to deteriorate when parents use punishment as their main disciplinary measure; the proportion of children displaying improved behavioural change is larger when reward, discussion and gentle persuasion are used; these differences however, are not significant.
The parents’ evaluations underline parenting and family
dynamics as key predictors of SEBD. Children from single-parent, poor families with little family time, high family conflict and low family cohesion, with high parenting stress, poor supervision and lack of quality time, and with poor relationships with parents, relatives and siblings, are at the greatest risk of developing SEBD.
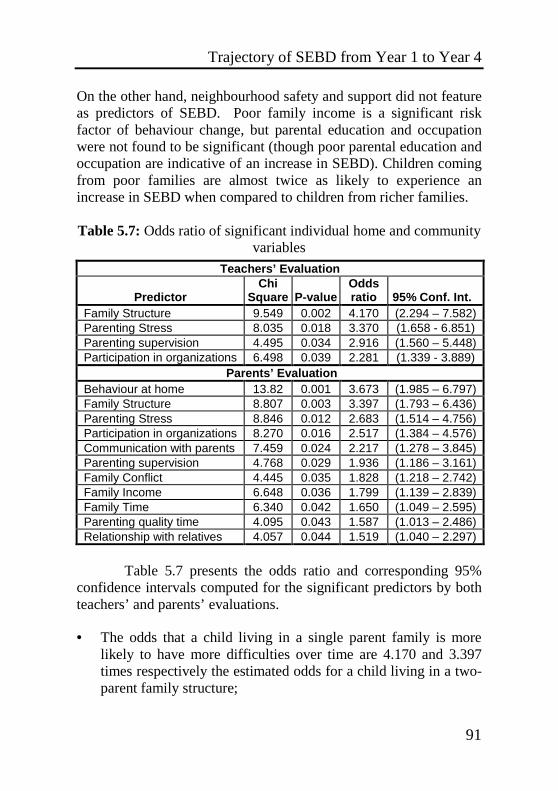
Trajectory of SEBD from Year 1 to Year 4
91
On the other hand, neighbourhood safety and support did not feature as predictors of SEBD. Poor family income is a significant risk factor of behaviour change, but parental education and occupation were not found to be significant (though poor parental education and occupation are indicative of an increase in SEBD). Children coming from poor families are almost twice as likely to experience an increase in SEBD when compared to children from richer families.
Table 5.7: Odds ratio of significant individual home and community
variables Teachers’ Evaluation
Predictor
Chi Square
P-value
Odds ratio
95% Conf. Int.
Family Structure 9.549 0.002 4.170 (2.294 – 7.582) Parenting Stress 8.035 0.018 3.370 (1.658 - 6.851) Parenting supervision 4.495 0.034 2.916 (1.560 – 5.448) Participation in organizations 6.498 0.039 2.281 (1.339 - 3.889)
Parents’ Evaluation Behaviour at home 13.82 0.001 3.673 (1.985 – 6.797) Family Structure 8.807 0.003 3.397 (1.793 – 6.436) Parenting Stress 8.846 0.012 2.683 (1.514 – 4.756) Participation in organizations 8.270 0.016 2.517 (1.384 – 4.576) Communication with parents 7.459 0.024 2.217 (1.278 – 3.845) Parenting supervision 4.768 0.029 1.936 (1.186 – 3.161) Family Conflict 4.445 0.035 1.828 (1.218 – 2.742) Family Income 6.648 0.036 1.799 (1.139 – 2.839) Family Time 6.340 0.042 1.650 (1.049 – 2.595) Parenting quality time 4.095 0.043 1.587 (1.013 – 2.486) Relationship with relatives 4.057 0.044 1.519 (1.040 – 2.297)
Table 5.7 presents the odds ratio and corresponding 95%
confidence intervals computed for the significant predictors by both teachers’ and parents’ evaluations.
• The odds that a child living in a single parent family is more
likely to have more difficulties over time are 4.170 and 3.397 times respectively the estimated odds for a child living in a two-parent family structure;

Building Resilience in School Children
92
• The odds that a child living in a family with high levels of parenting stress will have more difficulties over time are 3.370 and 2.683 times respectively the odds for a child experiencing low levels of parenting stress;
• A child with poor parenting supervision is 2.916 and 1.936 times respectively more likely to experience SEBD than well supervised children;
• A child not participating in local organisations is 2.281 and 2.517 times respectively more likely to develop SEBD than more active peers.
• The odds that a child who misbehaves at home displays an increase in difficulties are 3.673 times the estimated odds for a child who is well behaved;
• A child who has poor communication with parents is 2.217 times more likely to exhibit a deterioration in behaviour over time compared to peers having good communication with their parents;
• A child living in a family with violent conflicts is 1.828 more likely to develop SEBD than those in families employing more constructive conflict management;
• A child coming from a family with low income is 1.799 times more likely to experience an increase in SEBD when compared to children from more affluent families;
• A child coming from a family which provides little family time is 1.650 times more likely to develop SEBD than those living in families which provide quality time;
• A child who has a poor relationship with relatives is 1.519 more likely to experience SEBD than children enjoying good relationships.
5.2 Whole classroom variables
Table 5.8 presents the change in SEBD over the three year period by whole classroom variables. Percentage differences that are significant are marked in bold. Table 5.9 presents the odds ratio and

Trajectory of SEBD from Year 1 to Year 4
93
corresponding 95% confidence intervals computed for the significant predictors.
Table 5.8: Change in SEBD by whole classroom variables
Teacher evaluation
Parent evaluation
Classroom variables
Less SEBD
More SEBD
Less SEBD
More SEBD
Poor 0.0% 4.7% 0.0% 5.6% Moderate 13.4% 18.2% 17.4% 17.9%
Pupils’ participation in lessons Good 86.6% 77.1% 82.6% 76.5%
Poor 6.7% 8.8% 4.3% 6.4% Moderate 53.7% 53.8% 50.9% 50.7%
Pupils’ involvement in decisions Good 39.6% 37.4% 44.8% 42.9%
Poor 2.0% 1.5% 1.0% 0.0% Moderate 29.1% 31.9% 30.4% 33.8%
Pupils’ collaboration in learning Good 68.9% 66.6% 68.6% 66.2%
Poor 1.6% 3.0% 0.0% 1.4% Moderate 40.3% 39.6% 48.7% 53.6%
Pupils’ behaviour during play Good 58.1% 57.4% 51.3% 44.9%
Poor 0.0% 4.1% 0.0% 2.3% Moderate 3.0% 7.1% 6.5% 7.4%
Pupils’ sense of classroom community Good 97.0% 88.8% 93.5% 92.6%
Not adequate 10.5% 17.6% 10.3% 13.0% Adequate 76.7% 72.9% 67.9% 79.7%
Classroom resources
Very adequate 12.8% 9.5% 21.8% 7.2% Adequate 54.9% 58.2% 55.8% 58.0% Teachers’
training Very good 45.1% 41.8% 44.2% 42.0%
Table 5.9: Odds ratio of significant whole classroom variables
Teachers’ Evaluation
Predictor Chi
Square
P-value Odds ratio
95% Conf. Int.
Participation during lessons 6.822 0.033 2.948 (1.709 – 5.083) Sense of classroom community 6.540 0.038 2.504 (1.413 – 4.439) Classroom resources 6.115 0.047 1.685 (1.037 – 2.740)
Parents’ Evaluation Participation during lessons 6.884 0.032 2.123 (1.088 – 4.143) Classroom resources 6.438 0.040 1.842 (1.210 – 3.323)

Building Resilience in School Children
94
Pupils’ participation in classroom activities is the strongest whole classroom predictor of SEBD from the early to the junior years. According to teachers’ and parents’ evaluations, the odds that a pupil attending a classroom characterized by lack of pupils’ participation will have more SEBD are 2.948 and 2.123 times respectively the odds for a pupil attending a classroom with active pupils’ participation. This is followed by pupils’ sense of classroom community: the odds that a pupil attending a classroom where pupils have a weak sense of community will have more difficulties over time are 2.504 times the odds for a pupil attending a classroom with strong sense of community. Lack of classroom resources is another predictor of SEBD development. Teacher training, pupils’ involvement in decision making, pupils’ collaboration, and pupils’ behaviour during play did not feature as significant predictors. There are some indications, however, that classrooms marked by lack of pupils’ involvement in decision making, low levels of pupils’ collaboration and misbehavior during play tend to increase the possibility of pupils developing SEBD in the early years.
5.3 Whole school variables
Table 5.10 presents the change in SEBD over the three year period by whole school variables. Significant percentage differences are marked bold. Table 5.11 presents the odds ratios and corresponding 95% confidence intervals computed for the significant predictors by both teachers’ and parents’ evaluations.
The data suggests that the strongest whole school predictors
for the development of SEBD are related to pupils’ rather than to staff’s behaviour. Bullying at school is the strongest whole-school predictor: according to teachers’ and parents’ evaluations, the odds that a pupil attending a school characterized by bullying will have more SEBD are 3.068 and 3.673 times respectively the odds for a pupil attending a school with a low level of bullying. This is followed by pupils’ poor behaviour at the whole school level: the

Trajectory of SEBD from Year 1 to Year 4
95
odds that a pupil attending a school with high levels of pupil misbehaviour will have more difficulties over time are 2.552 and 2.319 times respectively the odds for a pupil attending a school with good pupil behaviour.
Table 5.10: Change in SEBD by whole school variables
Teacher evaluation
Parent evaluation
School variables
Less SEBD
More SEBD
Less SEBD
More SEBD
Average 35.4% 47.5% 37.7% 51.3% Pupils’ behaviour at school Good 64.6% 52.5% 62.3% 48.7%
Average 59.0% 70.1% 61.5% 72.5% Support and collaboration Good 41.0% 29.9% 38.5% 27.5%
Average 30.6% 39.5% 43.1% 52.3% Engagement in school activities Good 69.4% 60.5% 56.9% 47.7%
Poor 40.3% 47.0% 42.3% 49.3% Average 54.5% 47.5% 48.7% 46.4%
Pupils’ participation in decisions Good 5.2% 5.5% 9.0% 4.3%
A lot 3.8% 14.2% 8.7% 14.8% Occasional 43.6% 44.8% 36.2% 50.1%
Bullying
Rarely 52.6% 41.0% 55.1% 35.1% Low 1.1% 3.7% 1.3% 1.4% Average 44.3% 48.5% 42.3% 49.3%
Staff participation in school activities High 54.6% 47.8% 56.4% 49.3%
Low 28.4% 37.2% 37.2% 40.6% Average 59.0% 51.9% 51.3% 49.3%
Staff participation in decisions
High 12.7% 10.9% 11.5% 10.1% Low 11.5% 14.2% 6.4% 17.4% Average 46.4% 52.2% 44.9% 50.7%
Staff teamwork
High 42.1% 33.6% 48.7% 31.9% Low 10.9% 12.7% 7.7% 14.5% Average 43.7% 49.3% 43.6% 50.7%
Staff support and collegiality
High 45.4% 38.1% 48.7% 34.8% Low 6.0% 7.1% 2.6% 8.7% Average 44.0% 48.6% 43.6% 43.5%
Administrative support
High 50.0% 44.3% 53.8% 47.8%

Building Resilience in School Children
96
Table 5.11: Odds ratio of significant whole school variables Teachers’ Evaluation
Predictor
Chi Square
P-value
Odds ratio
95% Conf. Int.
Bullying 9.020 0.011 3.068 (1.783 – 5.280) Pupils’ behaviour at school 5.596 0.018 2.552 (1.415 – 4.604) Support and collaboration 4.891 0.027 2.036 (1.238 – 3.350)
Parents’ Evaluation Bullying 12.43 0.002 3.673 (2.111 – 6.402) Pupils’ behaviour at school 4.891 0.027 2.319 (1.231 – 4.367) Staff teamwork 6.763 0.034 1.948 (1.157 – 3.282)
Lack of pupils’ support and collaboration at the whole
school is another strong predictor according to teachers’ evaluations: pupils attending schools with low levels of pupil support and collaboration are 2.036 times more likely to have increased difficulties than pupils attending schools with high levels of pupil support and collaboration. Pupils’ poor engagement in school activities also appears to be associated with SEBD development. On the other hand, parents underline the lack of staff teamwork as another predictor of SEBD: the odds that a pupil attending a school with poor staff teamwork will have more difficulties over time are 1.948 times the estimated odds for a pupil attending a school with a collaborative staff. Other staff behaviours such as participation in school activities and decision making, and staff and administrative support did not feature as significant predictors of SEBD change.
5.4 Multivariate Logistic Regression Analysis
To identify the dominant factors that predict the likelihood
of a pupil displaying a change in social, emotional and behaviour difficulties over time, a multivariate logistic regression analysis was carried out for teachers’ and parents’ evaluations respectively, using solely the explanatory variables that were found to be significant in the univariate analysis.
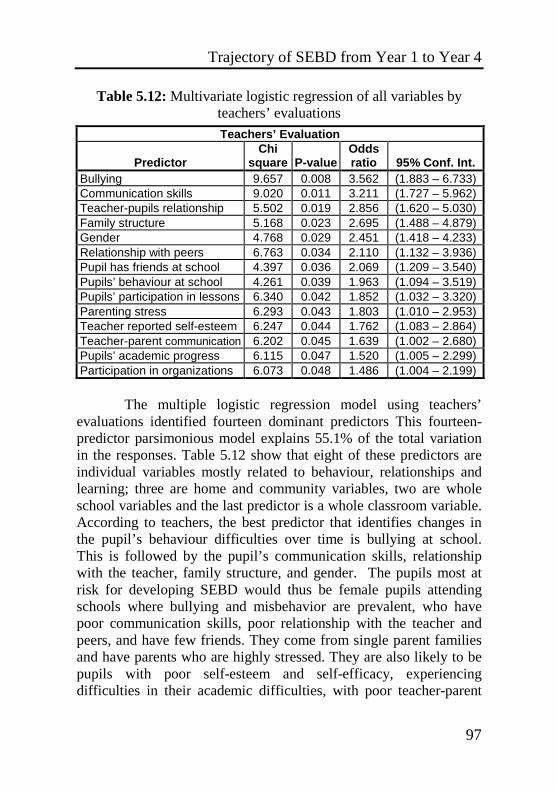
Trajectory of SEBD from Year 1 to Year 4
97
Table 5.12: Multivariate logistic regression of all variables by teachers’ evaluations Teachers’ Evaluation
Predictor
Chi square
P-value
Odds ratio
95% Conf. Int.
Bullying 9.657 0.008 3.562 (1.883 – 6.733) Communication skills 9.020 0.011 3.211 (1.727 – 5.962) Teacher-pupils relationship 5.502 0.019 2.856 (1.620 – 5.030) Family structure 5.168 0.023 2.695 (1.488 – 4.879) Gender 4.768 0.029 2.451 (1.418 – 4.233) Relationship with peers 6.763 0.034 2.110 (1.132 – 3.936) Pupil has friends at school 4.397 0.036 2.069 (1.209 – 3.540) Pupils’ behaviour at school 4.261 0.039 1.963 (1.094 – 3.519) Pupils’ participation in lessons 6.340 0.042 1.852 (1.032 – 3.320) Parenting stress 6.293 0.043 1.803 (1.010 – 2.953) Teacher reported self-esteem 6.247 0.044 1.762 (1.083 – 2.864) Teacher-parent communication 6.202 0.045 1.639 (1.002 – 2.680) Pupils’ academic progress 6.115 0.047 1.520 (1.005 – 2.299) Participation in organizations 6.073 0.048 1.486 (1.004 – 2.199)
The multiple logistic regression model using teachers’
evaluations identified fourteen dominant predictors This fourteen-predictor parsimonious model explains 55.1% of the total variation in the responses. Table 5.12 show that eight of these predictors are individual variables mostly related to behaviour, relationships and learning; three are home and community variables, two are whole school variables and the last predictor is a whole classroom variable. According to teachers, the best predictor that identifies changes in the pupil’s behaviour difficulties over time is bullying at school. This is followed by the pupil’s communication skills, relationship with the teacher, family structure, and gender. The pupils most at risk for developing SEBD would thus be female pupils attending schools where bullying and misbehavior are prevalent, who have poor communication skills, poor relationship with the teacher and peers, and have few friends. They come from single parent families and have parents who are highly stressed. They are also likely to be pupils with poor self-esteem and self-efficacy, experiencing difficulties in their academic difficulties, with poor teacher-parent

Building Resilience in School Children
98
communication and attending classrooms with poor pupils’ participation. They do not participate in local organisations.
Table 5.13: Multivariate logistic regression of all variables by
parents’ evaluations Parents’ Evaluation
Predictor
Chi square
P-value
Odds ratio
95% Conf. Int.
Gender 7.879 0.005 3.986 (2.039 – 7.794) Bullying 9.421 0.009 3.648 (1.833 – 7.257) Behaviour at home 8.857 0.012 3.351 (1.789 – 6.273) Parent academic expectation 8.270 0.016 3.029 (1.689 – 5.431) Support from close friends 7.927 0.019 2.945 (1.601 – 5.417) Family structure 5.168 0.023 2.846 (1.628 – 4.976) Parenting stress 7.459 0.024 2.761 (1.534 - 4.973) Pupils’ participation in lessons 7.224 0.027 2.598 (1.455 – 4.642) Teacher-reported self-efficacy 6.763 0.034 2.234 (1.205 – 4.143) Teacher-reported engagement 6.705 0.035 2.169 (1.245 – 3.776) Communication skills 6.540 0.038 1.963 (1.140 – 3.377) Pupil-teacher relationship 6.438 0.040 1.789 (1.022 – 3.135) Participation in organisations 6.340 0.042 1.726 (1.017 – 2.931) Communication with parents 6.202 0.045 1.684 (1.017 – 2.786) Parenting supervision 3.875 0.049 1.570 (1.000 – 2.464)
The multivariate logistic regression model using parents’
evaluations identifies fifteen dominant predictors. This fifteen-predictor parsimonious model explains 62.1% of the total variation in the responses. Table 5.13 shows that seven of these predictors are individual variables mostly related to behaviour, relationships and learning; six are home and community variables; one is a whole classroom variable and another a whole school variable. The best discriminant predictor is gender, followed by bullying, child’s behaviour at home, parental academic expectations, child support from close friends, family structure and parenting. The pupils most at risk for developing SEBD would thus be male pupils attending schools where bullying is prevalent, who manifest behaviour difficulties at home, with low parental academic expectations and little support from close friends. They are pupils coming from single-parent families with high levels of parental stress and low
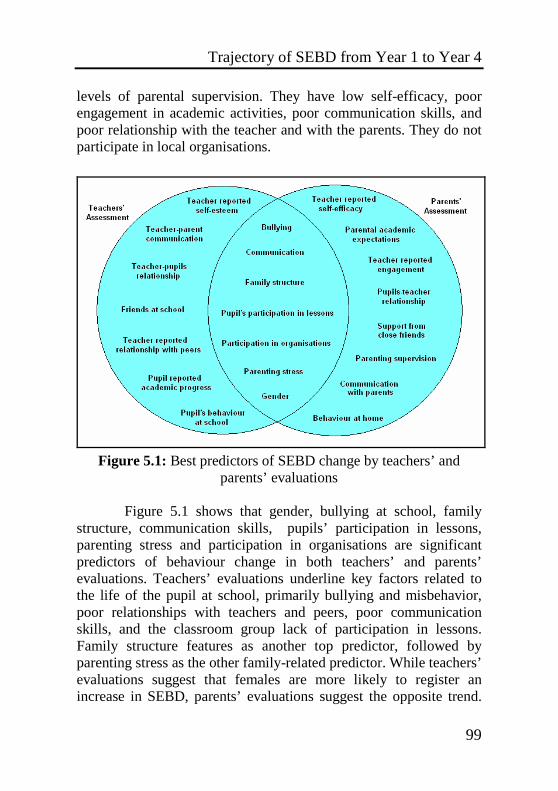
Trajectory of SEBD from Year 1 to Year 4
99
levels of parental supervision. They have low self-efficacy, poor engagement in academic activities, poor communication skills, and poor relationship with the teacher and with the parents. They do not participate in local organisations.
Figure 5.1: Best predictors of SEBD change by teachers’ and
parents’ evaluations
Figure 5.1 shows that gender, bullying at school, family structure, communication skills, pupils’ participation in lessons, parenting stress and participation in organisations are significant predictors of behaviour change in both teachers’ and parents’ evaluations. Teachers’ evaluations underline key factors related to the life of the pupil at school, primarily bullying and misbehavior, poor relationships with teachers and peers, poor communication skills, and the classroom group lack of participation in lessons. Family structure features as another top predictor, followed by parenting stress as the other family-related predictor. While teachers’ evaluations suggest that females are more likely to register an increase in SEBD, parents’ evaluations suggest the opposite trend.

Building Resilience in School Children
100
Indeed gender is the strongest predictor in the parents’ evaluations. Parents’ evaluations suggest a balance of individual, school and home factors in explaining the change in SEBD. School bullying features as another very strong predictor, followed by the child’s behaviour at home and parents’ own academic expectations for their offspring. Family structure and parenting stress are two other strong predictors, reflecting the findings in the teachers’ evaluations; these are followed by a number of individual characteristic, classroom and home predictors. Considering the ranking, odds ratio, and teachers’ and parents’ evaluations, it would seem that the strongest predictors for SEBD development in primary school are bullying at school, gender, pupil’s communication skills, family structure, parenting stress, behaviour at home, parental expectation, teacher-pupil relationship and peer relationships.
A longitudinal increase in SEBD is more likely to occur if a
pupil has poor communication, poor self-esteem and self-efficacy, poor relationships with teacher and peers, has few friends, is not engaged in classroom activities and is making poor academic progress. The home-school communication is poor and parental academic expectations are low. The pupil comes from a single parent family, with high levels of parenting stress, lack of supervision and family time, and high conflict. His or her behaviour at home is poor and s/he has poor communication with parents and relatives. The student does not participate in local organisations. S/he attends a classroom with lack of pupil participation, lack of resources and poor sense of community, and a school characterized by high level of pupil bullying and misbehaviour and poor staff collaboration and collegiality.
Figures 5.3 to 5.24 exhibit the associations between the likelihood of a pupil’s positive/negative change in social, emotional and behaviour difficulties and the significant individual, classroom, school, home and community variables that were identified by the Logistic regression models.

Trajectory of SEBD from Year 1 to Year 4
101
5.5 The cumulative effect of risk factors
The study also examined the cumulative effect of the various risk predictors identified above on the pupils’ well-being and mental health. For each pupil, the number of risk factors was counted from the list of significant predictors and pupils were then grouped into categories according to the numbers of risk factors they were exposed to. Gender was excluded since teachers’ and parents’ evaluations suggested opposite trends. For all the other risk factors, teachers and parents shared similar views about which categories of individual, classroom, school, home and community-related factors predicted an increase in SEBD. In 33.3% of the sample, no risk factor was present, one risk factor was present in 30.7% of the participants, two risk factors in 20.7%, three in 9.3%, four in 3.3% and five in 2.7%.
In order to predict the pupil’s likelihood of mental health
difficulties on the basis of the number of risk factors, the information provided by the teacher- and parent-reported SDQ total difficulties and impact scores was combined by means of an algorithm developed by Goodman and colleagues (Goodman et al. 2000). The algorithm generates three ordinal categories (unlikely, possible and probable) for the risk of mental health difficulties in children.
Table 5.14 and Figure 2 show the percentage of pupils
within each level of mental health problems, grouped by the number of risk factors present. It is evident that the percentage of possible and probable mental health problems rises steadily with every additional risk factor ( 2 25.05, 10, 0.005df pχ = = = ). The percentage of pupils showing at least signs of mental health problems (possible and probable outcome in the SDQ algorithm) is 12.0% in the group without any risk factors, increasing to 17.4% when one risk factor is present and 32.2% for two risk factors. The risk of mental health difficulty continues to increase significantly once pupils are exposed to more than two risk factors, ranging from 50% for pupils with 3 risk factors to 75% for those with 5 risk factors. This means that

Building Resilience in School Children
102
36% of young primary school pupils have at least 32% chance of experiencing mental health difficulties, while 15% of pupils have at least 50% chance. 6% and 3% of pupils are at very high risk with 60% and 75% chance of experiencing mental health problems respectively.
Table 5.14: Likelihood of mental health difficulties by number of risk factors
Mental Health Problem Unlikely Possible Probable
0 88.0% 10.0% 2.0% 1 82.6% 10.9% 6.5% 2 67.8% 16.1% 16.1% 3 50.0% 21.4% 28.6% 4 40.0% 20.0% 40.0%
Number of risk factors
5 25.0% 25.0% 50.0%
Figure 5.2: Likelihood of mental health difficulties by risk factors

Trajectory of SEBD from Year 1 to Year 4
103
Figure 5.3: Change in SEBD by gender
Figure 5.4: Change in SEBD by pupil communication

Building Resilience in School Children
104
Figure 5.5: Change in SEBD by teacher-reported self-esteem
Figure 5.6: Change in SEBD by teacher reported self efficacy

Trajectory of SEBD from Year 1 to Year 4
105
Figure 5.7: Change in SEBD by pupil-reported academic progress
Figure 5.8: Change in SEBD by parental academic expectations

Building Resilience in School Children
106
Figure 5.9: Change in SEBD by teacher-reported engagement
Figure 5.10: Change in SEBD by teacher-parent communication
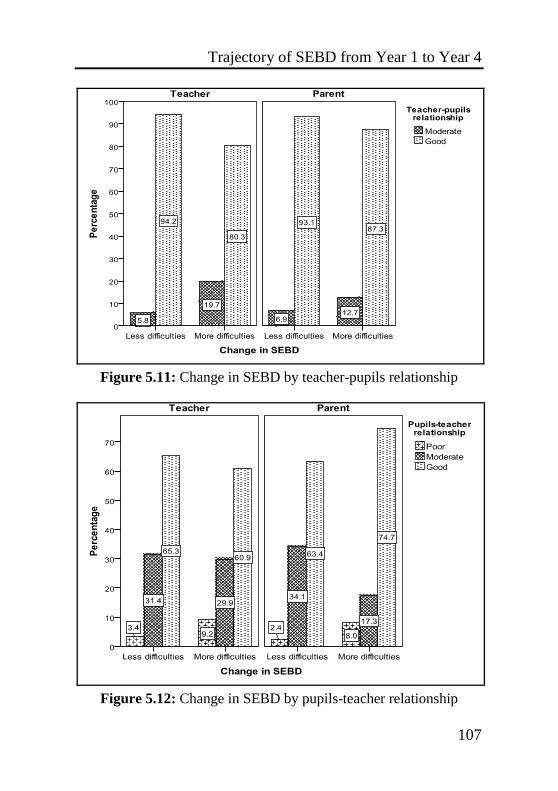
Trajectory of SEBD from Year 1 to Year 4
107
Figure 5.11: Change in SEBD by teacher-pupils relationship
Figure 5.12: Change in SEBD by pupils-teacher relationship

Building Resilience in School Children
108
Figure 5.13: Change in SEBD by relationships with peers
Figure 5.14: Change in SEBD by support from close friends
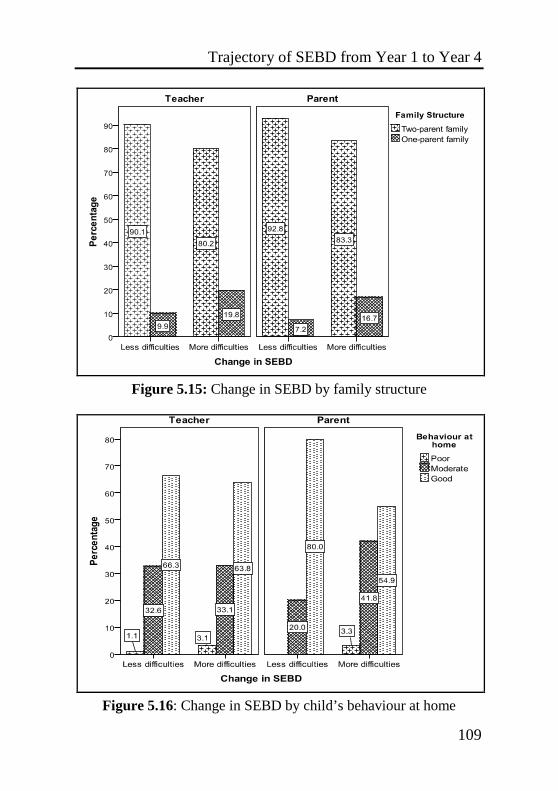
Trajectory of SEBD from Year 1 to Year 4
109
Figure 5.15: Change in SEBD by family structure
Figure 5.16: Change in SEBD by child’s behaviour at home

Building Resilience in School Children
110
Figure 5.17: Change in SEBD by child’s communication with parents
Figure 5.18: Change in SEBD by child’s participation in organizations
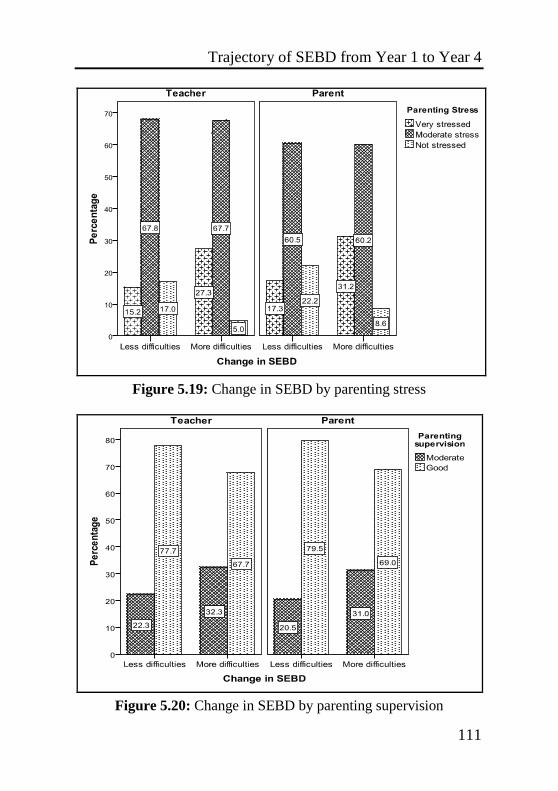
Trajectory of SEBD from Year 1 to Year 4
111
Figure 5.19: Change in SEBD by parenting stress
Figure 5.20: Change in SEBD by parenting supervision
Building Resilience in School Children
112
Figure 5.21: Change in SEBD by pupils’ participation in lessons
Figure 5.22: Change in SEBD by pupils’ behaviour at school

Trajectory of SEBD from Year 1 to Year 4
113
Figure 5.23: Change in SEBD by bullying at school
Figure 5.24: Change in SEBD by pupil’s friends at school

Building Resilience in School Children
114

Trajectory of Prosocial Behaviour from Year 1 to Year 4
115
One of the main objectives of this study was to identify those factors that influence the developmental trajectory of prosocial behaviour in primary school. Using the prosocial scores provided by teachers and parents when pupils were in Year 1 and then again in Year 4, it was possible to determine whether the pupils’ prosocial behaviour improved or deteriorated over this three year period, and how that change is related to individual, school, home and community factors. In order to map this trajectory, pupils were grouped in three categories, namely those pupils whose prosocial score increased from Year 1 to Year 4 (Improved prosocial behaviour), those whose score decreased (Decreased prosocial behaviour), and those whose prosocial score remained unaltered (No change in prosocial behaviour). The last group was excluded from the analysis in this phase of the study. Table 6.1 shows the percentages of pupils in each of the three groups using the teachers’ and parents’ assessments. Both evaluations indicate a higher proportion of pupils who displayed improved behaviour over the three-year span when compared to those manifesting a decrease in prosocial behaviour. Teachers’ evaluations identified a higher proportion of pupils whose prosocial behaviour decreased compared to parents. Around 20.7% of pupils in teachers’ evaluations and 35.2% in parents’ evaluations displayed no change.
6

Building Resilience in School Children
116
Table 6.1: Percentage of pupils by type of change in prosocial behaviour scores
Group
Teachers’ Evaluation
Parents’ Evaluation
Decreased prosocial behaviour 36.0% 24.9% Improved prosocial behaviour 43.3% 39.9% No change in prosocial behaviour 20.7% 35.2%
The following sections describe how the positive (increase)
or negative (decrease) changes in pupils’ prosocial behaviour are related to the various individual, classroom, school, home and community factors explored in this study. As in the previous chapters, the variables have been grouped in three main sets, namely individual pupil variables, whole class and whole school variables. The analysis makes use of univariate logistic regression to examine the association between the likelihood of a pupil’s positive/negative change in prosocial behaviour and any individual, classroom, school, home and community variables. The odds ratios and their corresponding 95% confidence intervals are provided only for the significant predictors. 6.1 Prosocial behavioural change by individual variables 6.1.1 Individual characteristics variables
Table 6.2 presents the change in prosocial behaviour over the three year period by individual characteristics variables, making use of both teachers’ and parents’ evaluations. Significant percentage changes are marked in bold. Table 6.3 presents the odds ratios and 95% confidence intervals computed for the significant predictors by both teachers’ and parents’ evaluations. These odds ratios are useful to examine how much more likely a pupil will exhibit prosocial behaviour change given the predictors.

Trajectory of Prosocial Behaviour from Year 1 to Year 4
117
Table 6.2: Change in prosocial behaviour by individual characteristics variables
Teacher evaluation
Parent evaluation
Individual variables (Characteristics)
More Prosocial
Less Prosocial
More Prosocial
Less Prosocial
Male 48.0% 48.8% 48.1% 62.4% Gender Female 52.0% 51.2% 51.9% 37.6% Maltese 92.3% 92.9% 92.5% 94.6% Language English/other 7.7% 7.1% 7.5% 5.4% North harbour 20.4% 25.7% 25.3% 30.2% South harbour 17.5% 10.8% 10.7% 12.8% South Eastern 19.4% 12.2% 18.7% 10.6% Western 17.5% 16.2% 24.0% 12.4% Northern 17.5% 25.7% 13.3% 21.3%
Locality
Gozo 7.8% 9.5% 8.0% 12.8% Yes 11.2% 9.6% 9.2% 14.9% Illness or
disability No 88.8% 90.4% 90.8% 85.1% Yes 9.3% 8.2% 6.6% 18.0% Medication or
therapy No 90.7% 91.8% 93.4% 82.0% Poor 4.0% 12.4% 3.0% 14.4% Moderate 17.4% 27.0% 17.9% 20.7%
Communication
Good 78.5% 60.6% 79.1% 64.9% Low 1.3% 9.8% 1.5% 11.1% Average 33.6% 35.2% 31.3% 45.9%
Teacher reported self- esteem High 65.1% 54.9% 67.2% 42.9%
Low 1.4% 4.8% 2.6% 9.1% Average 31.5% 28.8% 25.0% 27.3%
Parent reported self- esteem High 67.1% 66.3% 72.4% 63.6%
Low 4.7% 10.7% 3.0% 8.1% Average 36.9% 49.2% 46.3% 48.6%
Teacher reported self- efficacy High 58.4% 40.2% 50.7% 43.2%
Low 0.0% 6.7% 0.0% 11.1% Average 42.5% 40.0% 39.5% 42.2%
Parent reported self- efficacy High 57.5% 53.3% 60.5% 46.7%
Self-efficacy, self-esteem and communication skills are the
strongest individual characteristics predictors according to both teachers’ and parents’ evaluations. Teachers’ evaluations suggest that the estimated odds that pupils with high self-efficacy show an
Building Resilience in School Children
118
improvement in their prosocial behaviour is 3.546 times (teacher-reported) and 2.936 times (parent-reported) the estimated odds of pupils having low self-efficacy. According to parents, the estimated odds ratio is 3.699 (parent-reported) and in the same direction. Similarly according to teachers, the estimated odds that a pupil with high self-esteem exhibits an increase in prosocial behaviour is 3.814 times the estimated odds of a pupil with low self-esteem; according to parents, the estimated odds ratio is 2.879 in the same direction. Parents’ evaluations also show that female pupils as well as pupils not receiving any medication/intervention are more likely to show more prosocial behaviour as they move from one year to the other in primary school. There are also some indications, though the results are not significant, that pupils from particular regions such as South Eastern and Western may show an improvement in prosocial behaviour over time.
Table 6.3: Odds ratio of significant individual characteristics Teachers’ Evaluation
Predictor
Chi Square
P-value
Odds ratio
95% Conf. Int.
Teacher reported self-esteem 11.04 0.004 3.814 (1.906 – 7.636) Teacher reported self-efficacy 10.23 0.006 3.546 (1.905 – 6.602) Parent reported self-efficacy 7.633 0.022 2.936 (1.544 – 5.584) Communication 6.594 0.037 2.756 (1.522 – 4.992)
Parents’ Evaluation Parent reported self-efficacy 11.04 0.004 3.699 (1.823 – 7.505) Communication 7.224 0.027 3.026 (1.606 – 5.698) Teacher reported self-esteem 6.884 0.032 2.879 (1.513 – 5.473) Medication or therapy 4.445 0.035 2.644 (1.465 – 4.768) Gender 4.176 0.041 2.294 (1.239 – 4.244)
6.1.2 Individual classroom and school variables
Table 6.4 presents the change in prosocial behaviour by individual classroom and school variables. Significant changes in percentages are marked in bold. Table 6.5 presents the odds ratio computed for the significant predictors by both teachers’ and parents’ evaluations.

Trajectory of Prosocial Behaviour from Year 1 to Year 4
119
Table 6.4: Change in prosocial behaviour by individual classroom and school variables
Teacher evaluation
Parent evaluation
Individual variables (Learning)
More Prosocial
Less Prosocial
More Prosocial
Less Prosocial
Poor 14.8% 17.4% 3.0% 16.2% Average 27.5% 30.6% 33.3% 21.6%
Teacher reported academic progress Very good 57.7% 52.1% 63.6% 62.2%
Poor 4.6% 8.0% 0.0% 8.7% Average 47.9% 46.4% 45.3% 43.5%
Pupil reported academic progress Very good 47.6% 45.5% 54.7% 47.8%
Poor 10.1% 12.4% 1.5% 5.4% Moderate 30.2% 28.9% 30.3% 27.0%
Teacher academic expectation Good 59.7% 58.7% 68.2% 67.6%
Poor 2.7% 11.7% 1.4% 10.7% Moderate 14.9% 21.4% 25.7% 30.6%
Parent academic expectation
Good 82.4% 67.0% 73.0% 58.7% Many 3.8% 6.3% 1.4% 8.7% Some 50.8% 52.7% 25.7% 32.6%
Learning difficulties
None 45.4% 41.1% 73.0% 58.7% Yes 16.1% 9.8% 13.5% 10.4% Teacher reported
learning support No 83.9% 90.2% 86.5% 89.6% Not much 13.4% 13.8% 7.0% 11.6% Moderate 37.5% 40.0% 44.2% 40.6%
Pupil-reported support
A lot 49.1% 46.2% 48.8% 47.8% Not much 7.2% 12.2% 8.5% 9.1% Moderate 40.5% 41.2% 39.7% 45.5%
Peer support with work
A lot 52.3% 46.6% 51.8% 45.5% Not much 29.0% 37.8% 19.6% 34.2% Moderate 40.2% 36.5% 41.3% 36.8%
Support with homework
A lot 30.8% 25.7% 39.1% 28.9% Yes 4.0% 3.5% 4.5% 3.0% Repeating year No 96.0% 96.5% 95.5% 97.0% Low 11.5% 25.4% 9.1% 16.8% Average 43.2% 39.3% 37.9% 42.6%
Teacher reported engagement
High 45.3% 35.2% 53.0% 40.2% Low 6.8% 10.7% 2.9% 4.5% Average 44.0% 42.9% 43.5% 43.2%
Pupil reported engagement
High 49.2% 46.4% 53.6% 52.3%

Building Resilience in School Children
120
Regular 96.3% 95.1% 99.0% 97.3% Attendance Irregular 3.7% 4.9% 1.0% 2.7% Poor 2.0% 5.8% 0.0% 3.0% Moderate 5.4% 13.1% 8.1% 6.0%
Teacher-parent communication
Good 92.6% 81.1% 91.9% 91.0% Moderate 23.4% 29.7% 34.2% 39.1% Parent-school
communication Good 76.6% 70.3% 65.8% 60.9% Moderate 8.1% 23.0% 4.5% 10.8% Teacher-pupils
relationship Very good 91.9% 77.0% 95.5% 89.2% Poor 4.8% 8.0% 5.8% 6.8% Moderate 30.1% 29.5% 27.4% 27.3%
Pupils-teacher relationship
Very good 65.1% 62.5% 66.8% 65.9% Poor 1.3% 8.2% 3.5% 5.7% Moderate 12.8% 23.8% 14.9% 15.9%
Teacher reported relationships with peers Very good 85.9% 68.0% 81.6% 78.4%
Poor 6.3% 9.9% 4.5% 8.3% Moderate 27.1% 26.0% 31.8% 35.1%
Pupil reported peer relationships Very good 66.6% 64.1% 63.6% 56.5%
Yes 97.0% 95.0% 99.3% 97.5% Friends at school No 3.0% 5.0% 0.7% 2.5% Yes 97.3% 95.5% 95.7% 93.2% Close friends at
school No 2.7% 4.5% 4.3% 6.8%
Teachers underline relationships as the strongest predictor of
prosocial behaviour, with teacher-parent, peer and teacher-pupils relationships being the three strongest predictors. On the other hand, parents, highlight engagement and learning as the key promotive factors. According to teachers’ evaluations, the estimated odds that a pupil exhibits more prosocial behaviour with time when there is good teacher-parent communication are 5.689 times the estimated odds when that relationship is poor; the estimated odds for peer relationships and teacher-pupils relationships are 4.236 and 4.129 respectively. Such strong odds ratios underline the protective value of healthy classroom relationships amongst all members concerned, including parents.
Teachers’ and parents’ both underline engagement and support from close friends as other key predictors. Good academic progress, pupil engagement, parental academic expectations, support

Trajectory of Prosocial Behaviour from Year 1 to Year 4
121
from friends as well as play with peers are key promotive factors according to parents’ evaluations. Other learning-related factors such as receiving support with learning and homework, regular attendance and not repeating a year may also be positively related to prosocial behaviour, but the relationships are not significant.
Table 6.5: Odds ratio of significant classroom and school variables
Teachers’ Evaluation
Predictor Chi
Square
P-value Odds ratio
95% Conf. Int.
Teacher-parent communication 22.69 0.000 5.689 (3.070 – 10.55) Relationships with peers 14.90 0.001 4.236 (2.472 – 9.806) Teacher-pupils relationship 11.94 0.001 4.129 (2.380 – 7.162) Teacher reported engagement 9.210 0.010 3.756 (2.186 – 6.449) Support from close friends 7.726 0.021 2.568 (1.434 – 4.596)
Parents’ Evaluation Teacher reported engagement 6.593 0.037 2.711 (1.625 – 4.520) Academic progress by parent 6.340 0.042 2.569 (1.505 – 4.389) Learning difficulties 6.293 0.043 2.419 (1.394 – 4.194) Academic progress by teacher 6.274 0.044 2.264 (1.320 – 3.881) Parent academic expectation 6.158 0.046 2.019 (1.126 – 3.622) Support from close friends 6.073 0.048 1.873 (1.068 – 3.289) Plays with peers 6.032 0.049 1.694 (1.018 – 2.820)
According to teachers’ evaluations: • Pupils whose parents and teacher communicate well together are
5.689 times more likely to engage in prosocial behaviour over time, than when that relationship is poor;
• Pupils who have a good relationship with their peers are 4.236 times more likely to engage in prosocial behaviour over time than pupils who have poor peer relationships;
• Pupils who have a good relationship with their teacher are 4.129 times more likely to engage in prosocial behaviour over time than pupils who have a poor relationship;
• Pupils who are engaged in the learning process are 3.756 time more likely to engage in prosocial behaviour over time than less engaged peers; according to parents’ evaluations, the odds ratio is 2.711;

Building Resilience in School Children
122
• Pupils who have support from close friends are 2.568 times more likely to engage in prosocial behaviour over time than less supported peers; according to parents’ evaluations, the odds ratio is 1.873.
According to parents’ evaluations, • Pupils with satisfactory academic progress are 2.569 time more
likely to engage in prosocial behaviour over time than peers whose progress is poor;
• Pupil with no learning difficulties are 2.419 time more likely to engage in prosocial behaviour over time than peers experiencing learning difficulties;
• Pupils whose parents hold high academic expectations for them are 2.019 times more likely to engage in prosocial behavior over time than pupils of parents with lower expectations;
• Pupils who play frequently with their peers are 1.694 times more likely to engage in prosocial behaviour over time than peers who engage in less play.
6.1.3 Individual home and community variables
Table 6.6 presents the change in prosocial behaviour over the three year period by individual home and community variables, making use of both teachers’ and parents’ evaluations. Teachers’ evaluations underline family structure and family dynamics such as conflict, communication, cohesion and time as the key predictors of prosocial behaviour, while parents on the other hand, take a more multifactorial view including relationships, income and child’s behaviour at home besides the predictors already mentioned. Family structure emerges again as the key predictor from teachers’ evaluations: the estimated odds that a child living in a two-parent family will engage in more prosocial behaviour over time are 3.766 times the odds for a child living in a single-parent family; according to parents, the estimated odds ratio is 2.173 in the same direction.

Trajectory of Prosocial Behaviour from Year 1 to Year 4
123
Table 6.6: Change in prosocial behaviour by individual home and community variables
Teacher evaluation
Parent evaluation
Individual variables (Home and Community)
More Prosocial
Less Prosocial
More Prosocial
Less Prosocial
Two parent 95.1% 86.7% 95.6% 85.9% Family Structure One parent 4.9% 13.3% 4.4% 14.1%
1 child 21.5% 18.4% 14.6% 16.9% 2 children 44.9% 48.7% 60.4% 49.4% 3 children 22.4% 25.0% 18.8% 22.1%
Family Size
4 or more 11.2% 7.9% 6.3% 11.7% Professional 32.0% 34.7% 31.3% 37.2% Technical 23.7% 18.9% 22.4% 25.6% Semi Skilled 40.0% 39.1% 40.3% 30.2%
Father Occupation
State income 4.3% 7.2% 6.0% 7.0% Professional 19.4% 23.2% 20.0% 16.3% Technical 9.7% 10.5% 10.0% 18.6% Semi Skilled 5.6% 4.2% 10.0% 6.3%
Mother Occupation
House carer 65.3% 62.1% 60.0% 58.8% Primary 2.9% 2.9% 4.6% 4.4% Secondary 45.7% 54.9% 47.2% 48.9% Post secondary 30.0% 26.5% 24.6% 35.6%
Father Education
Tertiary 21.4% 15.7% 23.6% 11.1% Primary 1.9% 1.3% 6.3% 2.6% Secondary 61.3% 59.2% 52.1% 51.3% Post Secondary 21.7% 18.4% 22.9% 25.9%
Mother Education
Tertiary 15.1% 21.1% 18.8% 20.1% Less than €150 7.4% 8.2% 3.1% 12.7% €150 – €300 58.8% 64.4% 65.0% 63.4%
Family Income
Over €300 33.8% 27.4% 31.9% 23.9% Little 2.7% 8.7% 2.1% 10.6% Average 44.3% 48.9% 50.0% 57.4%
Family Time
A lot 53.0% 42.5% 47.9% 31.9% Poor 2.7% 4.8% 0.0% 6.4% Moderate 31.5% 33.5% 34.2% 36.2%
Behaviour at home
Good 65.8% 61.7% 65.8% 57.4% Poor 1.4% 8.8% 0.0% 6.5% Moderate 12.3% 15.0% 16.2% 23.9%
Communication with parents
Good 86.3% 76.2% 83.8% 69.6%
Building Resilience in School Children
124
Poor 2.4% 3.0% 1.6% 11.0% Moderate 20.2% 25.8% 27.0% 30.0%
Relationship with siblings
Good 77.4% 71.2% 71.4% 59.0% Moderate 8.3% 9.5% 1.4% 21.3% Relationship
with relatives Good 91.7% 90.5% 98.6% 78.7% Yes 98.1% 93.9% 99.5% 93.3% Parent
reported friends No 1.9% 6.1% 0.5% 6.7% Yes 76.9% 76.7% 80.0% 77.0% Membership in
organizations No 23.1% 23.3% 20.0% 23.0% Poor 5.6% 7.9% 7.3% 7.8% Moderate 10.0% 9.5% 12.2% 20.3%
Participation in organizations
Regular 84.4% 82.5% 80.5% 71.9% Little 0.0% 5.9% 1.7% 5.1% Average 14.9% 19.5% 11.3% 20.8%
Family Cohesion
A lot 85.1% 74.6% 87.0% 74.1% Violently 0.4% 4.0% 2.0% 3.0% With shouting 12.9% 18.9% 21.6% 26.7%
Family Conflict
Discussion 86.7% 77.1% 76.4% 70.3% Very stressed 16.2% 20.2% 18.7% 29.2% Slight stress 67.9% 73.0% 64.0% 60.4%
Parenting Stress
Not stressed 15.9% 6.8% 17.3% 10.4% Very difficult 53.8% 58.2% 56.0% 67.4% Slightly difficult 40.6% 37.7% 40.0% 30.4%
Parenting Difficulty
Not difficult 5.7% 4.1% 4.0% 2.2% Moderate 17.6% 19.6% 19.6% 21.3% Parenting
quality time A lot 82.4% 80.4% 80.4% 78.7% Moderate 16.4% 25.5% 21.9% 29.8% Parenting
supervision A lot 83.6% 74.5% 78.1% 70.2% Discipline 25.0% 28.1% 25.4% 31.7% Punishment 10.4% 11.6% 11.5% 17.1% Rewards 21.6% 19.9% 23.0% 18.3% Persuasion 22.5% 20.5% 23.0% 15.9%
Parenting strategies
Discussion 20.6% 19.9% 17.2% 17.1% Not safe 6.8% 7.5% 8.0% 10.4% Slightly safe 58.1% 61.7% 63.7% 62.5%
Neighbourhood Safety
Very safe 35.1% 30.8% 28.3% 27.1% Not helpful 20.6% 31.5% 22.7% 38.3% Slightly helpful 54.2% 46.6% 54.7% 40.4%
Neighbourhood Support
Very helpful 25.2% 21.9% 22.7% 21.3%
Trajectory of Prosocial Behaviour from Year 1 to Year 4
125
Communication with parents, family cohesion, family time and parenting stress are the other common predictors according to both teachers’ and parents’ evaluations. On the other hand, neighbourhood safety and support did not emerge as predictors of prosocial behaviour, while SES features as a relatively weak predictor. Supportive and protective homes are thus characterized by two-parents, cohesive families, constructive conflict resolution, time for family members, lack of parenting stress, and good relationships between the child and parents, siblings, relatives and friends. Good quality parenting time and supervision and a positive parenting style characterized by reward and persuasion rather than punishment also seem to be associated with increased prosocial behaviour over time.
Table 6.7 presents the odds ratio and corresponding 95%
confidence intervals computed for the significant predictors by both teachers’ and parents’ evaluations. Table 6.7: Odds ratio of significant individual home and community
variables
Teachers’ Evaluation
Predictor Chi
Square
P-value Odds ratio
95% Conf. Int.
Family Structure 6.465 0.011 3.766 (1.926 – 7.362) Family Conflict 8.035 0.018 3.318 (1.796 – 6.126) Communication with parents 6.822 0.033 2.198 (1.238 – 3.905) Family Cohesion 6.705 0.035 2.046 (1.112 – 3.764) Family Time 6.388 0.041 1.977 (1.105 – 3.540) Parenting Stress 6.340 0.042 1.846 (1.021 – 3.336)
Parents’ Evaluation Relationship with relatives 13.71 0.000 4.536 (2.302 – 8.937) Parent reported friends 5.596 0.018 3.549 (1.870 – 6.739) Family Income 7.633 0.022 3.264 (1.824 – 5.842) Communication with parents 7.378 0.025 2.981 (1.643 – 5.409) Relationship with siblings 7.151 0.028 2.573 (1.469 – 4.507) Family Cohesion 6.648 0.036 2.246 (1.270 – 3.973) Family Structure 4.261 0.039 2.173 (1.245 – 3.791) Family Time 6.438 0.040 1.943 (1.109 – 3.403) Behaviour at home 6.115 0.047 1.755 (1.056 – 2.916) Parenting Stress 6.073 0.048 1.611 (1.001 – 2.594)

Building Resilience in School Children
126
According to teachers’ and parents’ evaluations: • A child living in a two-parent family is 3.766 and 2.173 times
respectively more likely to engage in prosocial behaviour over time than children living with single parents;
• A child who has good communication with parents is 2.198 and 2.981 times respectively more likely to engage in prosocial behaviour over time than a child who has a poor relationship with parents;
• A child living in a cohesive family is respectively 2.046 and 2.246 times respectively more likely to engage in prosocial behaviour over time than a child coming from a less cohesive family;
• Families which provide adequate time for their members are 1.997 and 1.943 times respectively more likely to have children who engage in prosocial behaviour over time than families with little time for their members;
• A child living in a family with low levels of parenting stress is 1.846 and 1.611 times respectively more likely to engage in prosocial behaviour than a child whose parents are stressed.
According to parents’ evaluation • A child who has good relationships with relatives and siblings is
4.536 and 2.573 times respectively more likely to engage in prosocial behaviour than a child with poorer relationships;
• A child living in a family with a good income is 3.264 times more likely to engage in prosocial behaviour over time than a child living in poverty;
• A well-behaved child at home is 1.755 times more likely to engage in prosocial behaviour over time than a child with behaviour problems at home.
According to teachers’ evaluation a child coming from a family which resolves conflicts constructively is 3.318 times more likely to engage in prosocial behaviour than a child coming from more violent families.

Trajectory of Prosocial Behaviour from Year 1 to Year 4
127
6.2 Whole classroom variables
Table 6.8 presents the change in SEBD over the three year period by whole classroom variables, making use of both teachers’ and parents’ evaluations. Significant percentage changes are marked in bold. Table 6.9 presents the odds ratio computed for the significant predictors by both teachers’ and parents’ evaluations.
Table 6.8: Change in prosocial behaviour by whole classroom variables
Teacher evaluation
Parent Evaluation
Classroom variables More
Prosocial Less
Prosocial More
Prosocial Less
Prosocial Poor 0.0% 2.5% 0.0% 1.6% Average 14.1% 24.2% 18.9% 17.2%
Pupils’ participation in lessons High 85.9% 73.3% 81.1% 81.3%
Poor 5.6% 9.2% 2.7% 9.4% Average 51.7% 54.2% 62.2% 53.1%
Pupils’ involvement in decisions High 42.7% 36.7% 35.1% 37.5%
Poor 0.7% 0.8% 0.0% 2.0% Average 28.0% 34.2% 30.8% 32.4%
Pupils’ collaboration in learning High 71.3% 65.0% 69.2% 65.6%
Poor 2.1% 2.5% 0.0% 2.7% Average 43.4% 50.8% 53.1% 45.9%
Pupils’ behaviour during play Good 54.5% 46.7% 46.9% 51.4%
Poor 0.0% 5.7% 0.0% 3.0% Average 4.9% 8.4% 1.9% 10.1%
Pupils’ sense of classroom community High 95.1% 85.9% 98.1% 87.9%
Not adequate 9.2% 20.8% 9.3% 26.6% Adequate 71.1% 69.2% 76.6% 65.3%
Classroom resources
Very adequate 19.7% 10.0% 14.1% 8.1% Adequate 47.9% 61.7% 54.7% 64.9% Teachers’
training Very good 52.1% 38.3% 45.3% 35.1%
Classroom resources and pupils’ sense of community are
two common predictors according to both teachers’ and parents’ evaluations: pupils attending well-resourced classrooms are 3.893 and 2.010 times respectively more likely to engage in prosocial

Building Resilience in School Children
128
behaviour than pupils in less equipped classrooms; similarly pupils attending classrooms with a sense of community are 1.860 and 2.010 times respectively more likely to engage in prosocial behaviour than pupils without a sense of community. Pupils attending classrooms where pupils participate actively in lessons and teachers are well trained are also more likely to engage in prosocial behaviour according to teachers’ evaluations; it must be kept in mind, however, that the vast majority of teachers in the study are well trained.
Table 6.9: Odds ratio of significant whole classroom variables
Teachers’ Evaluation
Predictor Chi
Square
P-value Odds ratio
95% Conf. Int.
Classroom resources 10.23 0.006 3.893 (1.945 - 7.791) Participation during lessons 9.421 0.009 3.647 (1.979 - 6.722) Teachers’ training 5.024 0.025 2.496 (1.323 - 4.710) Sense of classroom community 6.340 0.042 1.860 (1.039 - 3.331)
Parents’ Evaluation Sense of classroom community 6.822 0.033 2.761 (1.552 - 4.913) Classroom resources 6.202 0.045 2.010 (1.168 - 3.459)
6.3 Whole school variables
Table 6.10 presents the change in prosocial behaviour over the three year period by whole school variables. Significant percentage changes are marked in bold. Table 6.11 presents the odds ratio computed for the significant predictors.
According to both teachers’ and parents’ evaluations the two
strongest whole school predictors are bullying and participation in school activities. Pupils attending schools where bullying is rare are 2.976 and 4.126 times respectively more likely to engage in prosocial behaviour over time than peers attending schools where bullying is high; the corresponding odds ratio for engagement in school activities are respectively 2.555 for teachers and 2.893 for

Trajectory of Prosocial Behaviour from Year 1 to Year 4
129
parents. Teachers’ evaluations also indicate that pupils attending schools with good behaviour are more likely to manifest prosocial behaviour themselves over time; parents’ evaluations on the other hand suggest that pupils’ support and collaboration is another whole school predictor of prosocial behaviour. As in the case of SEBD, staff relationships, collaboration and administrative support did not emerge as predictors of prosocial behaviour.
Table 6.10: Change in prosocial behaviour by whole school variables
Teacher evaluation
Parent evaluation
School variables More
Prosocial Less
Prosocial More
Prosocial Less
Prosocial Average 30.7% 42.7% 42.2% 48.6% Pupils’ behaviour
at school Good 69.3% 57.3% 57.8% 51.4% Average 60.8% 64.5% 57.9% 70.3% Pupils’ support
and collaboration Good 39.2% 35.5% 42.1% 29.7% Average 28.0% 42.1% 32.9% 45.9% Engagement in
school activities Good 72.0% 57.9% 67.1% 54.1% Poor 38.5% 51.2% 45.9% 46.3% Average 55.9% 44.6% 48.6% 50.6%
Pupils’ participation in decisions Good 5.6% 4.1% 5.4% 3.1%
A lot 4.1% 6.3% 2.8% 13.1% Occasional 40.8% 47.5% 42.2% 46.4%
Bullying
Low 55.1% 46.2% 55.0% 40.5% Low 1.7% 2.1% 0.0% 2.7% Average 42.8% 43.4% 46.9% 51.4%
Staff participation in school activities High 55.6% 54.5% 53.1% 45.9%
Low 22.2% 24.8% 23.8% 27.0% Average 60.3% 61.1% 58.4% 59.5%
Staff participation in decisions High 17.5% 14.1% 17.8% 13.5%
Low 3.3% 5.4% 6.2% 8.1% Average 57.0% 58.3% 50.3% 51.4%
Staff teamwork
High 39.7% 36.4% 43.5% 40.5% Low 4.0% 5.0% 6.3% 8.1% Average 49.0% 50.4% 45.3% 51.4%
Staff support and collegiality
High 47.1% 44.6% 48.4% 40.5% Low 2.7% 5.0% 2.7% 4.7% Average 45.7% 52.0% 43.2% 42.2%
Administrative support
High 49.6% 43.0% 54.1% 53.1%

Building Resilience in School Children
130
Table 6.11 Odds ratio of significant whole school variables Teachers’ Evaluation
Predictor
Chi Square
P-value
Odds ratio
95% Conf. Int.
Bullying 8.270 0.016 2.976 (1.496 - 5.921) Engagement in school activities 5.502 0.019 2.555 (1.367 - 4.775) Pupils’ behaviour at school 4.095 0.043 1.861 (1.062 - 3.260)
Parents’ Evaluation Bullying 11.62 0.003 4.126 (2.230 - 7.635) Engagement in school activities 4.956 0.026 2.893 (1.623 - 5.158) Pupils’ support and collaboration 4.261 0.039 1.871 (1.122 - 3.121)
6.4 Multivariate Logistic Regression Analysis
To identify the dominant factors that predict the likelihood of a pupil displaying a change in prosocial behaviour over time, a multivariate logistic regression analysis was carried out for teachers’ and parents’ evaluations respectively, using solely the explanatory variables that were found to be significant in the univariate analysis.
The multivariate Logistic regression model using teachers’ evaluation identified fourteen dominant predictors. This fourteen-predictor parsimonious model explains 63.8% of the total variation in the responses. Table 6.12 shows that eight of these predictors are individual variables mostly related to behaviour, relationships and learning; two are home and community variables, and two each are whole classroom and whole school variables respectively. According to teachers’ evaluations, the best predictor of a change in the pupil’s prosocial behaviour over time is pupil’s relationship with peers, followed by good relationship with the teacher, low level of bullying at school, high self-esteem and self-efficacy, and engagement in classroom activities. The pupils most likely to engage in prosocial behaviour from the early to the junior primary school years are thus pupils who enjoy good relationships with peers and with their teacher, attend schools where bullying is low, engage actively in the learning process, and have high self-esteem, self-efficacy and good

Trajectory of Prosocial Behaviour from Year 1 to Year 4
131
communication skills. They come from two-parent families with low levels of conflict, are supported by close friends, and their teachers and parents work well together. They attend classrooms and schools where pupils participate actively in activities at both classroom and school levels.
Table 6.12: Multivariate logistic regression of all variables by teachers’ evaluations Teachers’ Evaluation
Predictor
Chi square
P-value
Odds ratio
95% Conf. Int.
Relationship with peers 11.62 0.003 4.431 (2.339 - 8.395) Teacher-pupils relationship 7.033 0.008 4.016 (2.200 - 7.330) Bullying 9.421 0.009 3.894 (2.167 - 6.997) Teacher reported self-esteem 8.686 0.013 3.762 (2.077 - 6.813) Teacher reported engagement 8.399 0.015 3.594 (2.052 - 6.295) Teacher reported self efficacy 7.726 0.021 3.016 (1.705 - 5.335) Family structure 4.956 0.026 2.864 (1.658 - 4.948) Communication skills 7.013 0.030 2.456 (1.408 - 4.285) Family conflict 6.822 0.033 2.268 (1.320 - 3.896) Pupils’ participation in lessons 6.763 0.034 2.133 (1.230 - 3.700) Support from close friends 6.488 0.039 1.908 (1.096 - 3.323) Engagement in school activities 4.218 0.040 1.877 (1.086 - 3.243) Classroom resources 6.158 0.046 1.679 (1.029 - 2.741) Teacher-parent communication 6.115 0.047 1.621 (1.001 - 2.625)
The multivariate logistic regression model using parents’
evaluations identified another fourteen dominant predictors. This fourteen-predictor parsimonious model explains 60.7% of the total variation in the responses. Table 6.13 shows that five of these predictors are individual variables mostly related to behaviour, relationships and learning; six are home and community variables; and the other two a whole classroom and whole school variable respectively. According to parents’ evaluations, the best discriminant predictor is bullying, followed by the child’s positive relationship with relatives, two parent family, high self-efficacy and good family income. The pupils most likely to engage in prosocial behaviour from the early to the junior primary school years are thus female
Building Resilience in School Children
132
pupils who attend schools where bullying is rare, have good relationships with relatives and with parents, and come from two-parent, good income families with low levels of parenting stress. They have high self-efficacy and good communication skills, are actively engaged in learning at school, have friends and are supported by close friends, attend classrooms with a high sense of community and schools with high level of pupil participation in school activities.
Table 6.13: Multivariate logistic regression of all variables by
parents’ evaluations Parents’ Evaluation
Predictor
Chi Square
P-value
Odds ratio
95% Conf. Int.
Bullying 13.82 0.001 4.398 (2.232 - 8.665) Relationship with relatives 8.284 0.004 4.016 (2.107 - 7.653) Family structure 6.196 0.013 3.589 (1.932 - 6.667) Parent-reported self efficacy 8.399 0.015 3.521 (1.967 - 6.302) Family income 7.927 0.019 3.466 (1.952 - 6.155) Teacher-reported engagement 7.545 0.023 3.250 (1.784 - 5.920) Parent reported friends 4.828 0.028 3.101 (1.722 - 5.583) Parenting stress 7.081 0.029 3.049 (1.730 - 5.372) Gender 4.546 0.033 2.646 (1.473 - 4.754) Communication skills 6.763 0.034 2.455 (1.418 - 4.250) Support from close friends 6.540 0.038 2.144 (1.248 - 3.683) Communication with parents 6.340 0.042 1.943 (1.158 - 3.260) Sense of classroom community 6.247 0.044 1.817 (1.096 - 3.013) Engagement in school activities 3.875 0.049 1.648 (1.010 - 2.690)
Figure 6.1 shows that bullying at school, family structure,
pupil’s communication skills, pupils’ engagement in classroom and school activities, and support from close friends are significant predictors in both teachers’ and parents’ evaluations. As in the case of the SEBD predictors, teachers’ evaluations underlined key factors related to school, such as positive relationship with peers and teacher, low level of bullying, high self-esteem and high academic engagement. Parents’ evaluations on the other hand, are broader, with a combination of individual, school and home predictors. Apart

Trajectory of Prosocial Behaviour from Year 1 to Year 4
133
from bullying at school, the top predictors include good relationships with relatives, two parent family, high self-efficacy and good family income. Considering the ranking, odds ratio, and teachers’ and parents’ evaluations, it would seem that the strongest predictors of prosocial behaviour over the years in the primary school, are low bullying at school, pupil’s good relationships with the teacher, peers and family members, high self-efficacy and self-esteem, active engagement in lessons, and two parent families with good income.
Figure 6.1: Best predictors of prosocial behaviour change by
teachers’ and parents’ evaluations A longitudinal increase in prosocial behaviour is more likely
to occur if a pupil has good communication skills, high self-esteem and self-efficacy, is not on medication/therapy and is a female (parents). S/he has good relationships with teacher and peers, plays with and is supported by peers, is academically engaged, making good progress, and with good teacher-parent communication and high parental academic expectations. S/he is likely to come from a

Building Resilience in School Children
134
two-parent, cohesive family with high quality time and low levels of conflict and parental stress, has good relationship with parents and siblings, and is well behaved at home. S/he attends a classroom with adequate resources and well trained teachers, where pupils have a sense of community and participate actively in activities. The school s/he attends has a low level of bullying, good pupil behaviour, high pupil participation in school activities and pupil support and collaboration.
Figures 6.3-6.24 exhibit the associations between the
likelihood of a positive/negative change in prosocial behaviour and the significant individual, classroom, school, home and community variables that were identified by the logistic regression models.
6.5 The cumulative effect of promotive factors
The study examined the cumulative effect of the various promotive factors identified above on the pupils’ well-being and mental health. For each pupil, the number of promotive factors was counted from the list of significant predictors, and pupils were then grouped into categories according to the numbers of promotive factors they were exposed to. For all the significant promotive factors, teachers and parents shared similar views about which individual, classroom, school, home and community factors predict an improvement in prosocial behaviour. In 32.7% of the pupils, no promotive factor was present; one promotive factor was present in 30.0% of the participants, two promotive factors in 16.0%, three in 11.3%, four in 6.0% and five in 4.0%.
Figure 6.2 shows the percentage of pupils within each level of mental health problems, grouped by the number of promotive factors present. It is evident that the percentage of possible as well as probable mental health problems decreases steadily with every additional promotive factor (2 19.68, 10, 0.032df pχ = = = ). The percentage of pupils showing at least signs of mental health problems (possible and probable outcome in the SDQ algorithm) is

Trajectory of Prosocial Behaviour from Year 1 to Year 4
135
59.2% in the group without any promotive factors, decreasing to 42.2% when one promotive factor is present and 33.3% in the case of two promotive factors. The risk of mental health continues to decrease as the number of promotive factors increases, going down to 23.5% when three promotive factors are present and to 11.1% when there are four promotive factors. No pupil displayed mental health problems when there are five promotive factors. This means that one third of young primary school students (33%) have a 25% possibility of developing mental health problems and 35% the probability of mental health issues. On the other hand, having three or more promotive factors reduces significantly the probability of mental health problems: 11% (3 promotive factors) have only a 6% probability of developing mental health issues, while 10% (having 4 or more) appear to be protected from mental health problems.
Figure 6.2: Likelihood of mental health difficulties by number of
promotive factors

Building Resilience in School Children
136
Figure 6.3: Change in prosocial behaviour by gender
Figure 6.4: Change in prosocial behaviour by pupil’s communication
Trajectory of Prosocial Behaviour from Year 1 to Year 4
137
Figure 6.5: Change in prosocial behaviour by teacher-reported self-
esteem
Figure 6.6: Change in prosocial behaviour by teacher-reported self-
efficacy

Building Resilience in School Children
138
Figure 6.7: Change in prosocial behaviour by parent-reported self-
efficacy
Figure 6.8: Change in prosocial behaviour by parental academic
expectation

Trajectory of Prosocial Behaviour from Year 1 to Year 4
139
Figure 6.9: Change in prosocial behaviour by teacher-reported
pupil’s engagement
Figure 6.10: Change in prosocial behaviour by teacher-parent
communication

Building Resilience in School Children
140
Figure 6.11: Change in prosocial behaviour by teacher-pupils
relationship
Figure 6.12: Change in prosocial behaviour by teacher-reported
pupil’s relationship with peers

Trajectory of Prosocial Behaviour from Year 1 to Year 4
141
Figure 6.13: Change in prosocial behaviour by pupil’s support from
close friends
Figure 6.14: Change in prosocial behaviour by family structure

Building Resilience in School Children
142
Figure 6.15: Change in prosocial behaviour by family income
Figure 6.16: Change in prosocial behaviour by pupil’s
communication with parents

Trajectory of Prosocial Behaviour from Year 1 to Year 4
143
Figure 6.17: Change in prosocial behaviour by pupil’s relationship
with relatives
Figure 6.18: Change in prosocial behaviour by parent-reported
pupil’s friends

Building Resilience in School Children
144
Figure 6.19: Change in prosocial behaviour by family conflict
Figure 6.20: Change in prosocial behaviour by pupils’ classroom
participation in lessons
Trajectory of Prosocial Behaviour from Year 1 to Year 4
145
Figure 6.21: Change in prosocial behaviour by pupils’ sense of
classroom community
Figure 6.22: Change in prosocial behaviour by classroom resources

Building Resilience in School Children
146
Figure 6.23: Change in prosocial behaviour by pupils’ engagement
in school activities
Figure 6.24: Change in prosocial behaviour by school bullying
Risk and Promotive Factors Trajectory
147
This chapter maps the trajectory of pupils’ behaviour by grouping them into either a risk or promotive group and then examining which of the various variables predict either a positive trajectory or a negative one. Using both the total difficulty and prosocial scores provided by teachers and parents when pupils were in Year 1 and then again in Year 4, it was possible to identify a positive or negative behavioural change over time, and group the pupils accordingly. Pupils who scored higher in total difficulty but lower in prosocial behaviour from Year 1 and Year 4 were clustered into the risk group. Those who scored lower in total difficulty but higher in prosocial behaviour between Year 1 and Year 4 were put in the promotive group. Pupils who did not show a clear pathway, namely those who scored higher in both total difficulty and in prosocial behaviour or vice-versa, thus showing conflicting patterns, and those who displayed no change in behaviour, were excluded from this analysis. Table 7.1 illustrates the percentage of pupils who were excluded from the study or who were assigned to the promotive or risk groups using both the teachers’ and parents’ evaluations. Teachers’ evaluations indicate a higher proportion of pupils (38.3%) in the risk group; whereas parents assigned a higher proportion of pupils (37.8%) in the promotive group. Approximately 31% of the pupils in the sample were excluded from the study in both teachers’ and parents’ evaluations.
7

Building Resilience in School Children
148
Table 7.1: Percentage of pupils by type of group
Group Teachers’ Evaluation Parents’ Evaluation Promotive 30.3% 37.8% Risk 38.3% 30.6% Excluded from study 31.4% 31.6%
The following sections describe how the positive or negative
changes in pupils’ behaviour are related to the various individual, classroom, school, home and community factors explored in this study. As in the previous chapters, the variables have been grouped in three main sets, namely individual, whole class and whole school variables. The analysis makes use of univariate logistic regression to examine the association between the likelihood of a pupil’s positive/negative change in behaviour and individual, classroom, school, home and community variables. The odds ratios and their corresponding 95% confidence intervals are provided only for the significant predictors. 7.1 Individual variables 7.1.1 Individual characteristics variables
Table 7.2 presents the percentage of pupils in the risk and promotive groups over the three year period classified by individual characteristics variables, making use of both teachers’ and parents’ evaluations. Significant percentage differences representing strong associations between the groups and the predictors are marked bold. Table 7.3 presents the odds ratio and corresponding 95% confidence intervals which are computed for the significant predictors using Univariate Logistic Regression Analysis.
According to teachers’ and parents’ evaluations, pupils’ self-esteem, self-efficacy and communication skills are among the best predictors that discriminate between the two groups.

Risk and Promotive Factors Trajectory
149
Table 7.2: Risk and promotive groups by individual
characteristics variables
Teacher evaluation
Parent evaluation
Individual variables (Characteristics)
Promotive Group
Risk Group
Promotive Group
Risk Group
Male 48.6% 37.6% 31.5% 55.9% Gender Female 51.4% 62.4% 68.5% 44.1% Maltese 92.4% 96.1% 91.0% 92.2% Language English/other 7.6% 3.9% 9.0% 7.8% North harbour 19.2% 23.8% 25.0% 26.8% South harbour 15.1% 25.0% 12.5% 17.9% South Eastern 15.1% 16.7% 14.1% 12.9% Western 20.5% 16.7% 15.3% 16.1% Northern 19.2% 14.3% 20.8% 16.1%
Locality
Gozo 11.0% 3.6% 12.3% 10.3% Yes 7.2% 9.3% 9.9% 13.8% Illness or
disability No 92.8% 90.7% 90.1% 86.2% Yes 6.0% 9.3% 8.5% 15.5% Medication or
therapy No 94.0% 90.7% 91.5% 84.5% Poor 1.9% 7.8% 4.5% 14.9% Adequate 17.1% 25.6% 16.4% 18.5%
Communication
Very good 81.0% 66.7% 79.1% 66.6% Low 1.9% 10.9% 3.0% 2.0% Average 30.5% 33.3% 25.4% 43.1%
Teacher reported self- esteem High 67.6% 55.8% 71.6% 54.9%
Low 1.4% 2.4% 0.0% 8.4% Average 26.4% 32.5% 31.0% 37.5%
Parent reported self- esteem High 72.2% 65.1% 69.0% 54.1%
Low 4.8% 12.4% 4.5% 2.0% Average 33.3% 42.6% 35.8% 49.0%
Teacher reported self- efficacy High 61.9% 45.0% 59.7% 49.0%
Low 0.0% 6.8% 0.0% 7.1% Average 45.8% 37.8% 39.4% 50.0%
Parent reported self- efficacy High 54.2% 55.4% 60.6% 42.9%
Teachers’ evaluations suggest that the estimated odds ratio
that pupils with high self-esteem will be in the promotive group is 3.903 times than pupils with poor self-esteem; according to parents,
Building Resilience in School Children
150
the estimated odds ratio is 3.745 and in the same direction. Similarly according to teachers, the estimated odds that pupils with high self-efficacy will be in the promotive group is 3.586 times (teacher-reported) and 3.107 (parent-reported) the estimated odds of pupils with low self-efficacy; according to parents, the estimated odds ratio is 3.011 in the same direction. Parents’ evaluations also show that boys are more likely to be found in the risk group and girls in the promotive group. Teachers’ evaluations suggest an opposite trend but the finding is not significant. There are also some indications, though the results are not significant, that pupils from particular regions such as the Harbour area, pupils with disability or illness and who receive medication or therapy are more likely to be in the risk group.
Table 7.3: Odds ratio of significant individual characteristics
variables Teachers’ Evaluation
Predictor
Chi Square
P-value
Odds ratio
95% Conf. Int.
Teacher reported self-esteem 9.284 0.010 3.903 (2.73 – 5.57) Teacher reported self-efficacy 8.474 0.014 3.586 (2.72 – 4.73) Parent reported self-efficacy 8.122 0.017 3.107 (2.31 – 4.19) Communication 7.840 0.020 2.867 (2.09 – 3.93)
Parents’ Evaluation Gender 8.018 0.005 3.612 (2.56 – 5.09) Parent reported self-esteem 10.59 0.005 3.745 (2.81 – 4.99) Parent reported self-efficacy 9.232 0.010 3.011 (2.08 – 4.37) Communication 6.247 0.044 2.564 (1.75 – 3.76)
7.1.2 Individual classroom and school variables
Table 7.4 presents the percentage of pupils in the risk and promotive groups by individual classroom and school variables. Table 7.5 presents the odds ratio computed for the significant predictors by both teachers’ and parents’ evaluations. Significant percentage differences representing strong associations between the groups and the predictors are marked bold.
Risk and Promotive Factors Trajectory
151
Table 7.4: Risk and promotive groups by individual classroom and school variables
Teacher evaluation
Parent evaluation
Individual variables (Learning) Promotive
Group Risk
Group Promotive
Group Risk
Group Poor 16.2% 19.5% 9.0% 15.7% Average 23.8% 31.3% 22.4% 29.4%
Teacher reported academic progress Very good 60.0% 49.2% 68.7% 54.9%
Poor 2.2% 11.7% 4.5% 11.9% Average 46.7% 43.3% 43.3% 41.9%
Pupil reported academic progress Very good 51.1% 45.0% 52.2% 46.3%
Poor 10.5% 13.3% 6.0% 11.8% Moderate 28.6% 32.0% 22.4% 31.4%
Teacher academic expectation Good 61.0% 54.7% 71.6% 56.9%
Poor 4.1% 3.6% 1.4% 8.8% Moderate 23.0% 25.0% 12.7% 36.8%
Parental academic expectation Good 73.0% 71.4% 85.9% 54.4%
Many 3.3% 12.2% 3.0% 13.0% Some 46.0% 47.0% 53.7% 52.3%
Learning difficulties
None 48.7% 40.8% 43.3% 34.7% Yes 14.3% 10.9% 11.9% 9.8% Teacher reported
learning support No 85.7% 89.1% 88.1% 90.2% Not much 14.4% 15.8% 9.0% 9.4% Moderate 40.2% 39.2% 38.8% 37.7%
Pupil-reported learning support
A lot 45.3% 45.0% 52.2% 52.8% Not much 9.2% 13.2% 9.0% 9.3% Moderate 44.5% 41.8% 35.8% 51.9%
Peer support with work
A lot 46.2% 45.1% 55.2% 38.9% Not much 34.5% 39.2% 24.6% 38.0% Moderate 35.7% 39.2% 35.1% 35.2%
Support with homework
A lot 29.8% 21.6% 40.4% 26.8% Yes 1.6% 3.8% 0.0% 3.0% Repeating year No 98.4% 96.2% 100.0% 97.0% Low 12.5% 22.5% 5.0% 9.8% Average 34.6% 39.5% 30.8% 49.0%
Teacher reported engagement
High 52.9% 38.0% 64.2% 41.2% Low 2.6% 13.8% 3.0% 9.3% Average 45.0% 41.7% 43.3% 44.4%
Pupil reported engagement
High 52.4% 44.5% 53.7% 46.3%
Building Resilience in School Children
152
Regular 96.2% 94.5% 98.5% 96.1% Attendance Irregular 3.8% 5.5% 1.5% 3.9% Poor 1.0% 6.2% 1.5% 2.0% Moderate 6.7% 23.3% 6.1% 9.8%
Teacher-parent communication
Good 92.4% 70.5% 92.4% 88.2% Moderate 25.0% 25.7% 21.1% 35.1% Parent-school
communication Good 75.0% 74.3% 78.9% 64.9% Moderate 4.8% 24.0% 6.0% 17.6% Teacher-pupil
relationship Very good 95.2% 76.0% 94.0% 82.4% Poor 5.6% 10.0% 6.0% 9.8% Moderate 32.2% 28.3% 22.4% 23.5%
Pupil-teacher relationship
Very good 62.2% 61.7% 71.6% 66.7% Poor 0.0% 7.8% 1.5% 2.0% Moderate 11.4% 27.3% 11.9% 18.0%
Teacher reported relationship with peers Very good 88.6% 64.8% 86.6% 80.0%
Poor 5.6% 8.3% 1.5% 10.4% Moderate 27.8% 28.3% 23.3% 26.2%
Pupil reported relationship with peers Very good 66.7% 63.3% 75.2% 63.4%
Yes 98.1% 90.7% 98.0% 97.0% Friends at school No 1.9% 9.3% 2.0% 3.0% Yes 98.6% 95.8% 98.5% 96.3% Close friends at
school No 1.4% 4.2% 1.5% 3.7% Not at all 1.4% 3.6% 0.0% 7.3% Moderate 52.2% 53.0% 46.4% 67.3%
Support from close friends
A lot 46.5% 43.4% 53.6% 25.5% Not much 1.1% 4.2% 0.0% 3.7% Moderate 12.4% 10.8% 9.0% 11.1%
Pupil plays with peers
A lot 86.5% 85.0% 91.0% 85.2%
Teachers underline classroom relationships as the strongest
predictors distinguishing the risk from the promotive groups, with peer, teacher-parent and teacher-pupils relationships being the three strongest predictors. These are followed by four learning-related predictors (engagement, academic progress and learning problems). Parents’ evaluations on the other hand, provide a less uniform portrait with the first three predictors underlining parental expectations, support from friends and learning difficulties respectively. Taken together, however, these findings suggest that pupils are more likely to find themselves in the promotive group if

Risk and Promotive Factors Trajectory
153
they enjoy healthy relationships with their teacher and peers, are actively engaged and supported in their learning by their teacher, peers and parents, are making good academic progress, and have parents who expect them to do well and communicate well with their teachers. Other learning-related factors such as homework support, attendance and repeating a year, may also distinguish between the risk and promotive groups, but the relationships are not significant.
Table 7.5: Odds ratio of significant individual classroom and school
variables
Teachers’ Evaluation
Predictor Chi
Square
P-value Odds ratio
95% Conf. Int.
Relationship with peers 23.91 0.000 4.923 (3.45 – 7.03) Teacher-parent communication 19.32 0.000 4.423 (2.99 – 6.54) Teacher-pupil relationship 18.45 0.000 4.025 (2.99 – 5.42) Pupil reported engagement 7.726 0.021 3.256 (2.14 – 4.96) Pupils’ academic progress 7.545 0.023 3.104 (2.23 – 4.31) Teacher reported engagement 6.488 0.039 2.873 (1.91 – 4.31) Learning difficulties 6.115 0.047 2.543 (1.72 – 3.74) Pupil has friends at school 4.709 0.030 1.829 (1.33 – 2.51)
Parents’ Evaluation Parental academic expectation 16.28 0.000 4.217 (2.79 – 6.37) Support from close friends 15.08 0.001 3.863 (2.64 – 5.66) Learning difficulties 7.081 0.029 3.077 (2.19 – 4.33) Teacher reported engagement 6.763 0.034 2.744 (1.99 – 3.78) Relationship with peers 6.540 0.038 2.459 (1.61 – 3.75) Teacher-pupil relationship 4.026 0.045 1.526 (1.02 – 2.29) According to teachers’ evaluations: • Pupils with a good relationship with their peers are 4.923 times
more likely to be in the promotive group than pupils who have poor relationships; according to parents’ evaluations, the odds ratio is 2.459;
• Pupils whose teacher and parents communicate well together, are 4.423 times more likely to be in the promotive group than pupils with poor teacher-parent communication;

Building Resilience in School Children
154
• Pupils with good relationship with their teachers are 4.025 times more likely to be in the promotive group than pupils who have poor relationships; according to parents’ evaluations, the odds ratio is 1.526;
• Pupils who are engaged in the learning process are 3.265 times more likely to be in the promotive group over time than less engaged peers; according to parents’ evaluations, the odds ratio is 2.744;
• Pupils making good academic progress are 3.104 times more likely to be in the promotive group than peers who make poor progress;
• Pupils experiencing learning difficulties are 2.543 times more likely to be in the risk group over time than peers without such difficulties; according to parents’ evaluations, the odds ratio is 3.077;
• Pupils who have friends at school are 1.829 times more likely to be in the promotive group than pupils without friends.
According to parents’ evaluations: • Pupils whose parents hold high academic expectations for them
are 4.217 times more likely to be in the promotive group than pupils of parents with lower expectations;
• Pupils who have support from friends are 3.863 time more likely to be in the promotive group than less supported peers.
7.1.3 Individual home and community variables
Table 7.6 presents the percentage of pupils in the risk and promotive groups categorized by individual, home and community variables, while Table 7.7 presents the odds ratios and corresponding 95% confidence intervals computed for the significant regressors. Significant percentage differences representing strong associations between the groups and the predictors are marked bold.

Risk and Promotive Factors Trajectory
155
Table 7.6: Risk and promotive groups by individual home and community variables
Teacher evaluation
Parent evaluation
Individual variables (Home) Promotive
Group Risk
Group Promotive
Group Risk
Group Two parent 95.1% 84.5% 93.2% 83.1% Family
Structure One parent 4.9% 15.5% 6.8% 16.9% 1 child 18.4% 23.7% 16.4% 18.6% 2 children 52.9% 44.7% 54.8% 49.2% 3 children 18.4% 21.1% 20.5% 20.3%
Family Size
4 or more 10.3% 10.5% 8.2% 11.8% Professional 32.8% 30.0% 33.8% 26.9% Technical 25.0% 21.9% 28.6% 28.8% Semi Skilled 37.5% 39.0% 36.0% 36.5%
Father Occupation
State income 4.7% 9.1% 1.5% 7.7% Professional 18.1% 27.5% 19.4% 25.5% Technical 7.2% 8.7% 9.7% 18.2% Semi Skilled 10.8% 8.7% 5.6% 9.1%
Mother Occupation
House carer 63.9% 55.1% 65.3% 47.3% Primary 2.9% 2.5% 2.4% 5.7% Secondary 54.3% 51.9% 43.2% 54.4% Post secondary 21.4% 25.3% 22.0% 29.6%
Father Education
Tertiary 21.4% 20.3% 32.4% 9.3% Primary 2.3% 2.6% 0.8% 3.7% Secondary 59.8% 64.5% 56.2% 59.3% Post secondary 17.2% 14.5% 20.5% 18.4%
Mother Education
Tertiary 20.7% 18.4% 22.5% 18.6% Less 150 Euro 4.9% 14.3% 1.0% 12.3% 150 – 300 Euro 52.1% 55.1% 58.2% 62.9%
Family Income
Over 300 Euro 44.0% 30.6% 40.8% 34.8% Little 1.5% 10.4% 1.4% 10.2% Average 48.8% 54.1% 59.2% 57.2%
Family Time
A lot 49.7% 35.5% 39.4% 32.6% Poor 1.3% 10.4% 0.0% 5.3% Moderate 29.4% 30.5% 20.0% 35.1%
Behaviour at home
Good 69.3% 59.1% 80.0% 59.6% Poor 1.4% 7.2% 0.0% 3.5% Moderate 13.9% 19.5% 7.1% 22.8%
Communication with parents
Good 84.7% 73.3% 92.9% 73.7%

Building Resilience in School Children
156
Poor 1.8% 8.0% 1.7% 8.5% Moderate 19.3% 28.9% 25.9% 27.7%
Relationship with siblings
Good 78.9% 63.1% 72.4% 63.8% Moderate 4.1% 7.3% 2.9% 19.0% Relationship
with relatives Good 95.9% 92.7% 97.1% 81.0% Yes 98.6% 97.6% 98.6% 93.0% Parent reported
friends No 1.4% 2.4% 1.4% 7.0% Yes 72.7% 71.8% 85.0% 75.0% Membership in
organization No 27.3% 28.2% 15.0% 25.0% Poor 5.3% 9.9% 1.6% 8.3% Moderate 15.7% 12.2% 9.5% 14.6%
Participation in organization
Regular 79.0% 77.9% 88.9% 77.1% Little 2.7% 5.2% 0.2% 2.1% Average 12.2% 22.4% 18.1% 30.1%
Family Cohesion
A lot 85.1% 72.4% 81.7% 67.8% With shouting 12.9% 24.9% 17.4% 25.9% Family
Conflict Discussion 87.1% 75.1% 82.6% 74.1% Very stressed 11.3% 20.6% 15.5% 30.5% Slightly stressed 70.0% 72.1% 63.4% 62.7%
Parenting Stress
Not stressed 18.7% 7.3% 21.1% 6.8% Very difficult 51.4% 58.8% 59.2% 71.2% Slightly difficult 44.6% 38.8% 36.6% 25.4%
Parenting Difficulty
Not difficult 4.1% 2.4% 4.2% 3.4% Moderate 16.7% 30.7% 15.7% 30.6% Parental
quality time A lot 83.3% 70.3% 85.3% 69.4% Moderate 15.7% 27.7% 14.7% 33.3% Parenting
supervision A lot 84.3% 72.3% 85.3% 66.7% Discipline 23.5% 29.4% 12.0% 28.8% Punishment 5.5% 14.0% 8.2% 16.2% Rewards 25.5% 20.2% 27.7% 18.9% Persuasion 22.9% 19.0% 28.3% 18.9%
Parenting strategies
Discussion 22.6% 17.2% 23.8% 17.1% Not safe 8.1% 9.3% 7.0% 15.3% Moderately safe 58.1% 62.7% 59.2% 54.2%
Neighbourhood Safety
Very safe 33.7% 28.0% 33.8% 30.5% Not helpful 21.3% 26.7% 29.6% 37.9% Slightly helpful 49.3% 46.5% 42.3% 43.1%
Neighbourhood Support
Very helpful 29.3% 26.7% 28.2% 19.0%

Risk and Promotive Factors Trajectory
157
Teachers’ and parents’ evaluations underline similar key predictors differentiating between the risk and promotive groups, such as family structure, parenting stress, family and parental quality time and supervision, child’s relationships with parents, child’s behaviour at home and family income. The ranking of the variables however, differ considerably. Teachers’ evaluations again underline family structure as the top predictor differentiating the two groups. Parenting stress, family and parental quality time, and family conflict, as well as the child’s behaviour at home and relationships with siblings, are other important key predictors. On the other hand, father education features as the top predictor according to parents’ evaluations, indicating that the father’s tertiary education is a key promotive factor. Together with family income, parents’ evaluations indicate that SES is a key predictor in differentiating between the two groups. The child’s relationships with relatives and parents and parental supervision and parenting strategies are other top predictors according to the parents’ evaluations. The overall picture suggests that the most discriminating predictors are factors related to family structure, family time, parenting quality and stress, SES, the child’s behaviour at home and the type of relationships s/he has with the other family members. On the other hand, community factors such as participation in organisations and neighbourhood safety/support were not found to be good predictors of children’s behaviour. According to teachers’ and parents’ evaluations: • A child living in a two-parent family is 4.231 and 1.621 times
respectively more likely to be in the promotive group over time than a child living in a single-parent family;
• A child whose parents provide good quality time is 2.615 and 3.214 times respectively more likely to be in the promotive group than a child whose parents provide little time for their children;
• A child who has good communication with parents is 2.190 and 3.264 times respectively more likely to be in the promotive group over time than a child who has difficulty communicating with parents;

Building Resilience in School Children
158
• A child living in a family with low levels of parenting stress is 3.846 and 2.036 times respectively more likely to be in the promotive group than a child whose parents are highly stressed;
• A well-behaved child at home is respectively 2.936 and 2.873 times more likely to be in the promotive group than a child with home behaviour problems;
• A child living in a family with good income is 1.871 and 3.876 times respectively more likely to be in the promotive group over time than a child living in poverty;
• A child from a family that provides adequate time for its members is 3.244 and 2.542 times respectively more likely to be in the promotive group than a child from a family with little time for its members;
• A child who is well supervised by parents is 1.523 and 4.763 times more likely to be in the promotive group than poorly supervised children.
According to parents’ evaluation: • A child whose father has a tertiary level of education is 4.819
times more likely to be in the promotive group than a child whose father has a low level of education;
• A child whose parents make use of positive parenting strategies is 4.529 times more likely to be in the promotive group than a child brought up with a punitive parenting style;
• A child who has a good relationship with relatives is 3.456 times more likely to be in the promotive group over time than a child with poor relationships;
• A child coming from a cohesive family is 1.492 times more likely to be in the promotive group than peers coming from less cohesive families.
According to teachers’ evaluation, a child coming from a
family which resolves conflicts constructively is 2.003 times more likely to be in the promotive group than a child coming from more violent families.
Risk and Promotive Factors Trajectory
159
Table 7.7: Odds ratio of significant individual home and community variables
Teachers’ Evaluation Predictor Chi
Square P-value Odds
ratio
95% Conf. Int. Family structure 6.311 0.012 4.231 (2.38 – 7.51) Parenting stress 8.686 0.013 3.846 (2.07 – 7.16) Behaviour at home 8.149 0.017 2.936 (2.23 – 3.87) Family time 7.824 0.020 3.244 (2.02 – 5.20) Parental quality time 5.168 0.023 2.615 (1.54 – 4.45) Relationship with siblings 7.459 0.024 2.569 (1.82 – 3.62) Family conflict 4.653 0.031 2.003 (1.23 – 3.26) Family income 6.594 0.037 1.871 (1.13 – 3.09) Communication with parents 6.488 0.039 2.190 (1.64 – 2.92) Parental supervision 4.176 0.041 1.523 (1.02 – 2.27)
Parents’ Evaluation Father education 16.27 0.001 4.819 (3.23 – 7.19) Relationship with relatives 9.589 0.002 3.456 (2.38 – 5.01) Parental supervision 8.807 0.003 4.763 (3.11 – 7.31) Parenting strategies 14.45 0.006 4.529 (3.02 – 6.80) Communication with parents 10.11 0.006 3.264 (2.21 – 4.83) Family income 9.421 0.009 3.876 (2.38 – 6.31) Behaviour at home 9.323 0.009 2.873 (2.07 – 3.99) Parental quality time 6.465 0.011 3.214 (2.13 – 4.86) Family time 7.927 0.019 2.542 (1.64 – 3.95) Parenting stress 7.824 0.020 2.036 (1.34 – 3.10) Family Structure 4.709 0.030 1.621 (1.11 – 2.37) Family cohesion 6.293 0.043 1.492 (1.07 – 2.08)
7.2 Whole classroom variables
Table 7.8 presents the percentage of pupils in the risk and promotive groups by whole classroom variables, making use of both teachers’ and parents’ evaluations, while Table 7.9 presents the odds ratio computed for the significant predictors. Significant percentage differences representing strong associations between the groups and the predictors are marked bold.
Building Resilience in School Children
160
Table 7.8: Risk and promotive groups by whole classroom variables
Teacher evaluation
Parent evaluation
Classroom variables Promotive
Group Risk
Group Promotive
Group Risk
Group Poor 0.0% 9.3% 0.0% 12.0% Average 13.7% 11.5% 15.6% 17.6%
Pupils’ participation during lessons High 86.3% 77.2% 84.4% 70.4%
Poor 5.9% 9.4% 5.9% 6.3% Average 52.9% 54.3% 49.0% 59.4%
Pupils’ involvement in decision taking High 41.2% 36.2% 45.1% 34.4%
Poor 1.0% 9.1% 2.0% 8.0% Average 28.4% 26.3% 24.6% 27.5%
Pupils’ collaboration in learning High 70.6% 64.6% 73.4% 64.5%
Poor 3.9% 10.4% 1.3% 5.8% Average 39.2% 42.0% 45.8% 47.3%
Pupils’ behaviour during play Good 56.9% 45.7% 52.9% 46.9%
Poor 0.0% 4.6% 0.0% 10.2% Average 2.0% 7.3% 5.9% 11.3%
Pupils’ sense of classroom community High 98.0% 88.1% 94.1% 78.5%
Not adequate 10.8% 21.9% 9.8% 10.9% Adequate 74.5% 66.4% 72.5% 81.3%
Classroom resources
Very adequate 14.7% 11.7% 17.6% 7.8% Adequate 59.4% 53.9% 57.8% 60.0% Teachers’
training Very good 40.6% 46.1% 42.2% 40.0%
Pupils’ participation and collaboration in the classroom activities as well as their sense of classroom community are the key whole classroom predictors which distinguish the promotive from the risk group. According to teachers’ and parents’ evaluations, pupils attending classrooms where pupils are actively engaged in the learning process are 3.016 and 3.569 times respectively more likely to be in the promotive group than less engaged peers. Similarly pupils attending classrooms with a strong sense of community are 2.597 and 3.418 times respectively more likely to be in the promotive group than peers with a poor sense of community. Factors such as teacher training, play, and pupils’ involvement in decision making did not feature as significant whole classroom predictors.

Risk and Promotive Factors Trajectory
161
Table 7.9: Odds ratio of significant whole classroom variables Teachers’ Evaluation
Predictor Chi Square
P-value Odds ratio
95% Conf. Int.
Participation during lessons 9.657 0.008 3.016 (2.05 – 4.44) Sense of classroom community 8.270 0.016 2.597 (1.72 – 3.92) Pupils’ collaboration in learning 6.763 0.034 1.754 (1.25 – 2.47)
Parents’ Evaluation Participation during lessons 13.82 0.001 3.569 (2.59 – 4.92) Sense of classroom community 12.43 0.002 3.418 (2.39 – 4.88)
7.3 Whole school variables
Table 7.10 presents the percentage of pupils in the risk and promotive groups by whole school variables, while Table 7.11 presents the odds ratio computed for the significant predictors.
Table 7.10: Risk and promotive groups by whole school variables
Teacher evaluation
Parent evaluation
School variables Promotive
Group Risk
Group Promotive
Group Risk
Group Average 26.1% 41.4% 32.8% 53.1% Pupils’ behaviour at
school Good 73.9% 58.6% 67.2% 46.9% Average 48.8% 68.0% 62.7% 68.8% Pupils’ support and
collaboration Good 51.2% 32.0% 37.3% 31.3% Average 29.4% 41.4% 21.6% 42.2% Pupils’ engagement
in school activities Good 70.6% 58.6% 78.4% 57.8% Poor 39.2% 50.8% 35.3% 48.4% Average 54.9% 43.8% 54.9% 46.9%
Pupils’ participation in decisions
Good 5.9% 5.5% 9.8% 4.7% A lot 5.0% 12.8% 7.8% 8.0% Slight 44.6% 55.0% 35.9% 60.0%
Bullying
Low 50.5% 32.2% 56.3% 32.0% Low 0.8% 3.9% 2.0% 1.6% Average 46.9% 48.1% 41.2% 48.4%
Staff participation in school activities
High 52.3% 48.0% 56.9% 50.0%
Building Resilience in School Children
162
Low 32.4% 36.7% 42.2% 29.4% Average 55.0% 57.0% 48.4% 54.9%
Staff participation in decisions
High 12.6% 6.3% 9.4% 15.7% Low 9.4% 15.7% 7.8% 17.2% Average 46.1% 49.0% 37.3% 48.4%
Staff teamwork
High 44.5% 35.3% 54.9% 34.4% Low 10.2% 16.7% 7.8% 14.1% Average 46.1% 50.0% 43.1% 48.4%
Staff support and collegiality
High 43.8% 33.3% 49.0% 37.5% Low 6.9% 6.3% 2.0% 7.8% Average 41.2% 51.6% 45.1% 43.8%
Administrative support
High 52.0% 42.2% 52.9% 48.4%
Table 7.11: Odds ratio of significant whole school variables Teachers’ Evaluation
Predictor Chi Square
P-value Odds ratio
95% Conf. Int.
Pupils’ support and collaboration 7.550 0.006 3.555 (2.09 – 6.05) Bullying 8.846 0.012 3.346 (2.03 – 5.52) Pupils’ behaviour 5.024 0.025 1.894 (1.15 – 3.13)
Parents’ Evaluation Pupils’ behaviour 8.284 0.004 3.894 (2.41 – 6.31) Engagement in school activities 5.596 0.018 2.654 (1.16 – 6.09) Bullying 7.151 0.028 3.116 (2.02 – 4.80)
Both teachers’ and parents’ evaluations clearly indicate that pupils attending schools where bullying and misbehaviour are low are more likely to be found in the promotive group. According to teachers’ and parents’ evaluations, pupils attending schools where bullying is rare are 3.346 and 3.116 times respectively more likely to be in the promotive group over time than peers attending schools where bullying is more frequent; the corresponding odds ratio for pupils’ behaviour at school are 1.894 for teachers and 3.894 for parents. Teachers’ evaluations suggest that pupils’ support and collaboration is the strongest predictor differentiating the promotive from the risk group; parents’ evaluation on the other hand indicate pupils’ participation in school activities. Staff relationship, collaboration and administrative support did not emerge as significant predictors, although they are positively related to good pupils’ behaviour.
Risk and Promotive Factors Trajectory
163
7.4 Conclusion
To identify the dominant factors that predict the likelihood of a pupil being in the risk or protective group, a multivariate logistic regression analysis was carried out for teachers’ and parents’ evaluations respectively, using solely the explanatory variables that were found to be significant in the univariate analysis. Table 7.12 presents the findings from the teachers’ evaluations, while Table 7.13 presents those from the parents’ findings.
Table 7.12: Multivariate logistic regression of all variables by teachers’ evaluations Teachers’ Evaluation
Predictor
Chi Square
P-value
Odds ratio
95% Conf. Int.
Pupil has friends at school 14.847 0.000 3.312 (2.43 – 4.52) Teacher reported self-esteem 14.980 0.001 3.119 (2.36 – 4.13) Pupil’s academic progress 12.133 0.002 3.014 (2.32 – 3.91) Teacher reported self-efficacy 9.706 0.008 2.987 (2.47 – 3.61) Parental supervision 7.112 0.008 2.681 (1.93 – 3.73) Parenting stress 8.740 0.013 2.552 (2.07 – 3.15) Family income 8.256 0.016 2.469 (1.88 – 3.23) Relationship with peers 7.931 0.019 2.297 (1.62 – 3.26) Teacher-parent communication 7.363 0.025 1.958 (1.42 – 2.70) Communication skills 7.316 0.026 1.865 (1.53 – 2.28) Pupils’ behaviour at school 4.565 0.033 1.730 (1.44 – 2.11) Bullying 6.540 0.038 1.526 (1.18 – 1.80) Sense of classroom community 6.340 0.042 1.422 (1.02 – 1.99) Family structure 3.982 0.046 1.301 (1.01 – 1.67)
The multivariate logistic regression model using teachers’
evaluations identifies fourteen dominant predictors. This fourteen-predictor parsimonious model explains 59.4% of the total variations in the responses. Table 7.12 shows that seven of these predictors are individual variables mostly related to behaviour, relationships and learning; four are home variables, two are whole school variables and the last one a whole classroom variable. According to teachers’ evaluations, the best discriminant predictor is whether a pupil has

Building Resilience in School Children
164
friends at school, followed by self-esteem, self-efficacy and academic progress. The pupils most likely to be in the promotive group are those who have friends at school and have good relationships with peers, have good self -esteem, self-efficacy, and communication skills, and are making good academic progress. They come from two-parent families which provide adequate supervision, have adequate income, low levels of parenting stress and good parents-teachers communication. The pupils also attend classrooms where pupils have a strong sense of classroom community and schools with low levels of misbehaviour and bullying.
Table 7.13: Multivariate logistic regression of all variables by
parents’ evaluations Parents’ Evaluation
Predictor
Chi Square
P-value
Odds ratio
95% Conf. Int.
Gender 13.531 0.000 3.562 (2.77 – 4.57) Teacher-pupil relationship 12.195 0.000 3.338 (2.45 – 4.55) Family time 12.704 0.002 3.216 (2.48 – 4.17) Bullying 11.578 0.003 3.163 (2.64 – 3.79) Parental academic expectations 8.669 0.013 3.004 (2.46 – 3.67) Engagement in school activities 5.379 0.020 2.619 (1.90 – 3.61) Family income 7.545 0.023 2.543 (1.88 – 3.43) Learning difficulties 6.948 0.031 2.112 (1.61 – 2.77) Family structure 4.546 0.033 1.984 (1.59 – 2.47) Parenting stress 6.488 0.039 1.843 (1.38 – 2.46) Parental supervision 4.095 0.043 1.751 (1.45 – 2.12) Behaviour at home 6.247 0.044 1.436 (1.11 – 1.86) Communication skills 6.073 0.048 1.432 (1.08 – 1.89) Family cohesion 3.875 0.049 1.289 (1.00 – 1.66)
The multivariate logistic regression model using parents’ evaluations also identifies fourteen dominant predictors. Table 7.13 shows that this fourteen-predictor parsimonious model explains 67.8% of the total variations in the responses. Six of the predictors are individual variables mostly related to behaviour, relationships and learning; six are home variables and two are whole school

Risk and Promotive Factors Trajectory
165
variables. None of the classroom related variables were found to contribute significantly in explaining variation in the responses. According to parents, the best discriminant predictor is gender, followed by the teacher-pupil relationship, family time, bullying at school, parental academic expectations, and pupils’ engagement in school activities. Most of the remaining predictors are related to school factors. The pupils most likely to be in the promotive group are thus girls who have good relationships with their teachers, do not have learning difficulties, attend schools with low levels of bullying and a high level of pupil participation in school activities, and have parents who hold high academic expectations for them. They come from two-parent, cohesive families with good income, low levels of parenting stress, and good supervision. They have good communication skills and are well behaved at home.
Figure 7.1: Best risk and promotive predictors by teachers’ and
parents’ evaluations
Figure 7.1 shows that family structure, bullying at school, pupil’s communication skills, parental supervision, parenting stress

Building Resilience in School Children
166
and family income are significant predictors in both teachers’ and parents’ evaluations. Teachers’ top evaluations underline factors such as friends at school, self-esteem, self-efficacy, and academic progress. On the other hand, the top parents’ predictors are a combination of individual (gender), school (teacher-parent relationship, academic expectations), family (family time) and whole school (bullying, pupils’ participation in school activities) factors. Considering the ranking, odds ratio, and teachers’ and parents’ evaluations, it would seem that the strongest predictors which discriminate the promotive from the risk groups over the years in the primary school are relationships with teacher and friends, bullying, family income, structure and time, self-esteem, self-efficacy and communication skills, and academic progress.
Pupils are less likely to exhibit SEBD and more likely to
engage in prosocial behaviour if they have good self-esteem, self-efficacy and communication skills; good relationships with the teacher and classroom peers, have friends at school and are supported by them. They are engaged in classroom activities, make good academic progress, with parents who hold high expectations for them and who communicate well with their teacher. They have a good relationship with their parents, siblings and relatives and are well behaved at home. They come from two-parent, cohesive families with good income, low conflict, good quality family time and supervision, low parental stress and good parenting strategies. They attend classrooms where pupils are actively engaged and collaborate together in their learning and have a strong sense of classroom community, and schools where pupils are well behaved, participate in school activities, collaborate and support each other, and where bullying is low.
Figures 7.2-6.23 exhibit the associations between the likelihood of falling in the risk/promotive groups and the significant individual, classroom, school, home, community variables that were identified by the Logistic regression models.

Risk and Promotive Factors Trajectory
167
Figure 7.2: Risk and promotive groups by gender
Figure 7.3: Risk and promotive groups by pupil communication

Building Resilience in School Children
168
Figure 7.4: Risk and promotive groups by teacher-reported pupil
self-esteem
Figure 7.5: Risk and promotive groups by teacher-reported pupil
self-efficacy
Risk and Promotive Factors Trajectory
169
Figure 7.6: Risk and promotive groups by pupil-reported pupil
academic progress
Figure 7.7: Risk and promotive groups by parental academic
expectations

Building Resilience in School Children
170
Figure 7.8: Risk and promotive groups by pupil learning difficulties
Figure 7.9: Risk and promotive groups by teacher-parent
communication
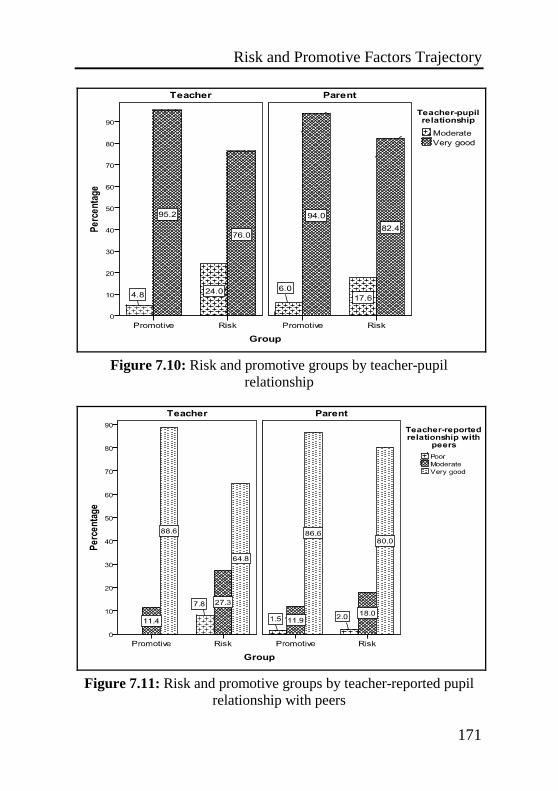
Risk and Promotive Factors Trajectory
171
Figure 7.10: Risk and promotive groups by teacher-pupil
relationship
Figure 7.11: Risk and promotive groups by teacher-reported pupil
relationship with peers

Building Resilience in School Children
172
Figure 7.12: Risk and promotive groups by pupil friends at school
Figure 7.13: Risk and promotive groups by family structure

Risk and Promotive Factors Trajectory
173
Figure 7.14: Risk and promotive groups by family income
Figure 7.15: Risk and promotive groups by family time

Building Resilience in School Children
174
Figure 7.16: Risk and promotive groups by pupil’s home behaviour
Figure 7.17: Risk and promotive groups by family cohesion
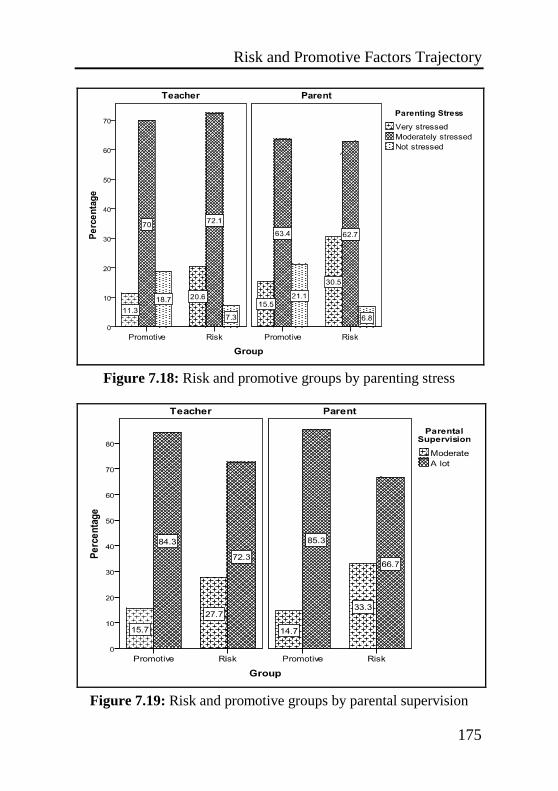
Risk and Promotive Factors Trajectory
175
Figure 7.18: Risk and promotive groups by parenting stress
Figure 7.19: Risk and promotive groups by parental supervision

Building Resilience in School Children
176
Figure 7.20: Risk and promotive groups by pupils’ sense of
classroom community
Figure 7.21: Risk and promotive groups by pupils’ school behaviour
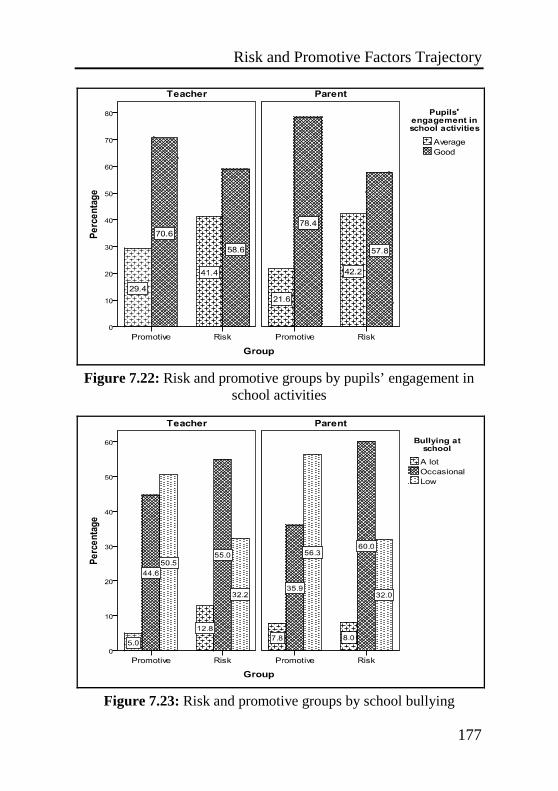
Risk and Promotive Factors Trajectory
177
Figure 7.22: Risk and promotive groups by pupils’ engagement in
school activities
Figure 7.23: Risk and promotive groups by school bullying

Building Resilience in School Children
178

Conclusion and Recommendations
179
Building Resilience in School Children
180
Conclusion and Recommendations
181
This chapter brings together all the results which emerged from the various analysis of the study, summarising the key findings and discussing their implications for practice and further research. The first section describes the major findings, identifying the strongest predictors which emerged from the study and the relationship between the risk and promotive factors. The following section then discusses the key predictors in more detail, with recommendations for practice in each section.
8.1 Overall findings and conclusions 8.1.1 Year 4 pupils
9.4% of Year 4 pupils have SEBD according to teachers, a rate similar to the 9.05 rate for primary school pupils established in the previous study and in the international literature (Meltzer et al., 2000; Cefai, Cooper and Camilleri, 2008). The prevalence rate according to parents is 7.8%, but although lower, the difference is not significant. Boys are more likely than girls to have SEBD, but again the difference is not significant. The most common difficulties in Year 4 are those related to restlessness, hyperactivity and lack of attention, followed by conduct (teachers) and emotional (parents)
8
Building Resilience in School Children
182
problems respectively. Both teachers’ and parents’ evaluations suggest that Year 4 boys may be more vulnerable than girls, having more difficulties and exhibiting lower prosocial behaviour. The data also suggests that both pupils’ difficulties (particularly conduct and peer problems) and prosocial behaviour increased from Year 1 to Year 4. The increase in difficulties appear to be more marked for boys in contrast to girls, but teachers’ and parents’ findings tend to diverge regarding gender differences.
The best overall predictors of SEBD in Year 4 are related to
pupils’ relationships with significant adults and peers, engagement in the learning process, and family dynamics. Pupils’ relationships with peers, engagement in learning, support from close friends, parental expectations, family time, father occupation, pupils’ sense of classroom community, and behaviour at home are some of the strongest predictors on the basis of teachers’ and parents’ evaluations. None of the whole school variables emerged as significant variables when analyzed collectively with the other variables using regression models. The overall picture suggests that Year 4 pupils most likely to have SEBD • are poorly engaged in classroom activities, are repeating a year,
have poor relationships with peers, and lack support from close friends;
• attend classrooms where pupils exhibit poor play behaviour and low sense of community;
• show behaviour difficulties at home, including problematic relationships with siblings, and come from families with low parental academic expectations, little family time, and where the father is either poorly skilled or unemployed.
Positive peer relationships and gender emerged as the
dominant predictors of prosocial behaviour in Year 4, but family and parent characteristics also appear to be somewhat related to prosocial behaviour, particularly good teacher-parent communication, two-parent families, good behaviour at home, family time and family conflict. Year 4 pupils most likely to exhibit prosocial behaviour are:

Conclusion and Recommendations
183
• female pupils who have good relationships with peers, high self-efficacy, and whose parents and teacher communicate well together;
• attend classrooms with high levels of pupils’ engagement; • are well behaved at home and come from two-parent families
which provide quality time and have low levels of conflict. 8.1.2 Strongest risk and promotive predictors
An examination of the study as a whole suggests that the pupils at high risk for developing SEBD are those who come from single parent families, attend schools with high levels of bullying, have poor communication skills, poor relationships with peers, teachers, friends and parents, and have parents who are stressed and have low academic expectations for their children (Box 8.1).
Box 8.1: Window of Vulnerability
A longitudinal increase in SEBD is more likely to occur if a pupil: • Has poor communication, self-esteem and self-efficacy. • Has poor relationships with teacher and peers, and has few friends. • Makes poor academic progress and is not engaged in classroom
activities, with poor home-school communication and low parental expectations.
• Comes from a single parent family, with high levels of parenting stress, lack of supervision and family time, and high level of conflict
• Exhibits poor behaviour at home and poor communication with parents and relatives, and does not participate in local organisations.
• Attends classrooms with lack of pupil participation, lack of resources and poor sense of classroom community.
• Attends schools where bullying is prevalent, pupils’ behaviour is poor, and pupils’ and staff’s collaboration is low.
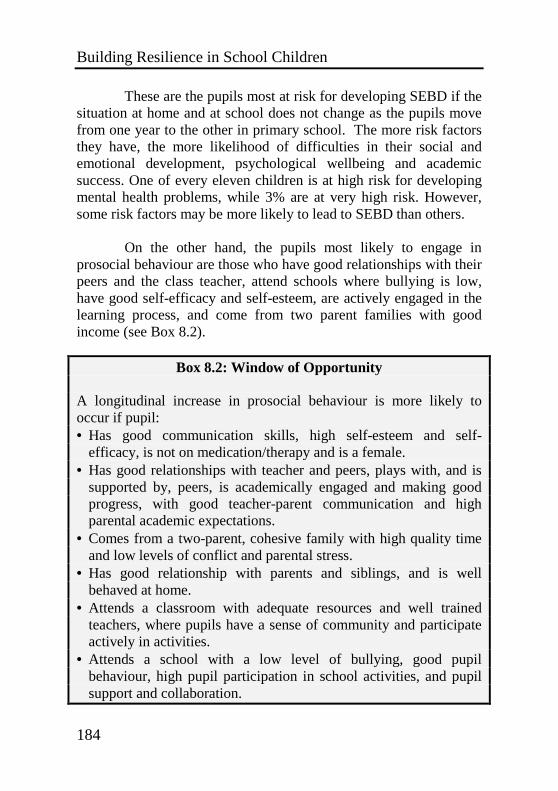
Building Resilience in School Children
184
These are the pupils most at risk for developing SEBD if the situation at home and at school does not change as the pupils move from one year to the other in primary school. The more risk factors they have, the more likelihood of difficulties in their social and emotional development, psychological wellbeing and academic success. One of every eleven children is at high risk for developing mental health problems, while 3% are at very high risk. However, some risk factors may be more likely to lead to SEBD than others.
On the other hand, the pupils most likely to engage in prosocial behaviour are those who have good relationships with their peers and the class teacher, attend schools where bullying is low, have good self-efficacy and self-esteem, are actively engaged in the learning process, and come from two parent families with good income (see Box 8.2).
Box 8.2: Window of Opportunity A longitudinal increase in prosocial behaviour is more likely to occur if pupil: • Has good communication skills, high self-esteem and self-
efficacy, is not on medication/therapy and is a female. • Has good relationships with teacher and peers, plays with, and is
supported by, peers, is academically engaged and making good progress, with good teacher-parent communication and high parental academic expectations.
• Comes from a two-parent, cohesive family with high quality time and low levels of conflict and parental stress.
• Has good relationship with parents and siblings, and is well behaved at home.
• Attends a classroom with adequate resources and well trained teachers, where pupils have a sense of community and participate actively in activities.
• Attends a school with a low level of bullying, good pupil behaviour, high pupil participation in school activities, and pupil support and collaboration.
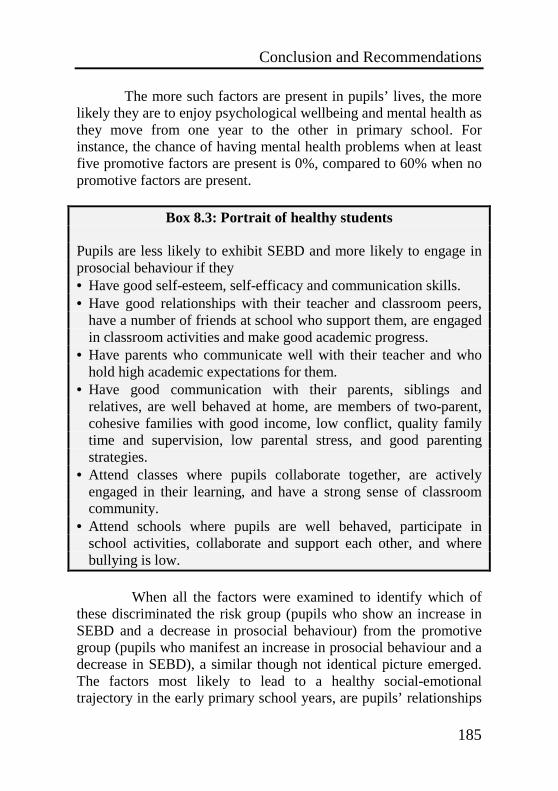
Conclusion and Recommendations
185
The more such factors are present in pupils’ lives, the more likely they are to enjoy psychological wellbeing and mental health as they move from one year to the other in primary school. For instance, the chance of having mental health problems when at least five promotive factors are present is 0%, compared to 60% when no promotive factors are present.
Box 8.3: Portrait of healthy students
Pupils are less likely to exhibit SEBD and more likely to engage in prosocial behaviour if they • Have good self-esteem, self-efficacy and communication skills. • Have good relationships with their teacher and classroom peers,
have a number of friends at school who support them, are engaged in classroom activities and make good academic progress.
• Have parents who communicate well with their teacher and who hold high academic expectations for them.
• Have good communication with their parents, siblings and relatives, are well behaved at home, are members of two-parent, cohesive families with good income, low conflict, quality family time and supervision, low parental stress, and good parenting strategies.
• Attend classes where pupils collaborate together, are actively engaged in their learning, and have a strong sense of classroom community.
• Attend schools where pupils are well behaved, participate in school activities, collaborate and support each other, and where bullying is low.
When all the factors were examined to identify which of
these discriminated the risk group (pupils who show an increase in SEBD and a decrease in prosocial behaviour) from the promotive group (pupils who manifest an increase in prosocial behaviour and a decrease in SEBD), a similar though not identical picture emerged. The factors most likely to lead to a healthy social-emotional trajectory in the early primary school years, are pupils’ relationships

Building Resilience in School Children
186
with friends, teacher and peers, low bullying in school, active engagement, good academic progress, high self-esteem and self-efficacy, two-parent families with good income, adequate supervision and quality family time, low parenting stress and high parental expectations. The more pupils have of these positive factors, the more likely their social and emotional development, mental health and school success will improve (Box 8.3).
Some predictors feature as both risk and promotive factors.
Bullying, family structure, communication skills, close friends, and peer and teacher-pupils relationships, are some of the strongest predictors overall, emerging not only as top predictors, but also as common risk and promotive factors. Self-esteem, teacher-parent communication, parental academic expectations also emerge as other common predictors from teachers’ and parents’ evaluations. The more the pupils are exposed to these factors at the negative end of the dimension (e.g. high level of bullying), the more at risk they are for developing SEBD and mental health problems. The more they have of these factors at the positive end of the dimension (e.g. close positive relationship with peers), the more likely pupils will steer away from SEBD and engage in prosocial behaviour.
Risk factors also tend to be cumulative, with one risk
leading to other risks (Newman, 2004). Single parent families for instance, are at risk of poverty, which is also linked to parental stress, less family time, lower parental academic expectations, and inadequate supervision amongst others. Pupils with five or more of these negative factors have 75% chance or more of developing SEBD in the early primary years. The poor are at risk of becoming poorer unless the poverty chain is broken. Research seems to suggest, however, that besides the number of risk factors, we need also to take into account the type or context of the risk/s present (Appleyard et al., 2005). The number of risks becomes more meaningful if we examine the nature or context of these factors and how they interact and ‘add’ together in impacting psychological wellbeing.

Conclusion and Recommendations
187
We can protect the young child from SEBD, mental health problems and school failure, if we reduce the significant risk factors and increase the promotive ones in his or her life. Our efforts thus need to be directed towards preventing bullying at school, providing multi-faceted support to single parents, developing children’s communication and friendship skills, self-esteem and self-efficacy, building closer relationships between the child and his/her teacher and peers, strengthening the school-family collaboration, raising parental and teacher academic expectations, reducing family poverty, and providing educational, psychological and economic support to parents and families. The more we reduce the risk factors and increase the promotive factors, the more chance vulnerable children have of taking a resilient pathway, maximizing their learning potential and enjoying healthy relationships with those around them. These positives thus become the building blocks of resilience in childhood. 8.1.3 Key role of proximal processes in classrooms and families
One of the evident issues emerging from the analysis of the data is that the strongest risk and promotive factors are related to the proximal classroom and home contexts in contrast to the more distal school and community contexts respectively. The literature has long drawn our attention that the strongest influences on children’s learning, behaviour and development are the home and the classroom where children develop their closest relationships and attachments and spend most of their time (Benard, 2004; Muis and Reynolds, 2005; Watkins, 2005; Cefai, 2008). Micro processes such as relationships with teachers, peers, parents and friends, academic engagement, positive beliefs and expectations, healthy family dynamics and effective parenting, have been shown to be significantly more influential in the development of SEBD and prosocial behaviour than whole school, neighbourhood and community factors, particularly the more structural variables. For instance, good parenting at home may counteract the negative impact of poverty, while supportive relationships and absence of

Building Resilience in School Children
188
parental discord with adults, may help the child to cope with the impact of parental separation (Agaibi and Wilson, 2005; Morrison Gutman, et al., 2010). This finding underlines the need for interventions which support the building of healthy, supportive and responsive classrooms and families, with attention to the key processes operating in these two systems, particularly relational ones. On the other hand, the more distal risk and promotive factors may help to strengthen and complement the healthy processes occurring in the classrooms and families. For instance, lack of bullying and good pupil behaviour at school, as well as staff teamwork and collaboration, also impact pupils’ behaviour in the classroom (McLaughlin and Talbert, 2006; Cefai, 2008). Healthy micro processes complemented and reinforced by positive macro processes, thus have a synergetic, value-added effect on pupils’ development and behaviour.
8.1.4 The relationship between risk and protective factors
The literature suggests that our efforts to build resilience in children need to be directed simultaneously at both risk reduction and the enhancement of protective factors (Pollard, Hawkins and Arthur, 1999). We are also more likely to be effective in resilience building if risk factors are countered within the same context as much as possible, such as neutralizing school bullying by providing supervision and adult and peer support at school, or reducing the impact of marital discord by enhancing the child’s relationships at home (Rutter, 1999). Our efforts need to be focused both on eliminating or reducing the risk factors children are exposed to, particularly chronic ones, while giving them adequate support and helping them to develop strengths and skills to offset the potential harm from the risk factors. Schools and families thus need to work hand in hand to support and reinforce each other’s efforts and initiatives. Within such a perspective, schools are not merely the victims of social forces beyond their control. They may promote prosocial behaviour and psychological wellbeing one hand, or may lead to disaffection, school failure and anti-social behaviour on the

Conclusion and Recommendations
189
other. Even in the case of children facing multiple risk factors or very unstable situations at home, the support and respite provided by schools and teachers can help to create an oasis of safety and stability and a platform for growth and success (Luthar, Cicchetti and Becker, 2000; Benard, 2004). O'Dougherty Wright and Masten (2005) for instance, found that interventions which sought to build attachment and connectedness to school amongst vulnerable pupils, impacted various outcomes, including academic achievement, substance use, and antisocial behaviour. 8.1.5 Early intervention
Pupils’ difficulties, particularly conduct and peer problems, tend to increase from Year 1 to Year 4, illustrating the need for timely and effective intervention as soon as children start attending school. The study has also identified the factors which are related to an increase in SEBD and in prosocial behaviour as pupils move from the early to the junior primary school years. The international literature has consistently shown that we are more likely to be effective in preventing SEBD and promoting psychological wellbeing and positive behaviour, if we start as early as possible when children are in preschool and the first years of primary school (Domitrovich, Cortes and Greenberg, 2007; National Institute for Health and Clinical Excellence, 2008; Farrell and Humphrey, 2009; Denham, Brown, and Domitrovich, 2010; DataPrev Project, 2011). Healthy social and emotional competence in the early years is linked to academic learning and emotional literacy, both in the short term and later on in the primary and secondary school years (Domitrovich, Cortes and Greenberg, 2007; Leerkes et al., 2008; Denham, Brown, and Domitrovich, 2010). The recently published National Curriculum Framework (MEYE 2011) underlines that it is in the early years that children build their wellbeing and self-esteem, recommending that they need to develop their social and emotional literacy skills during their first years at school. Maltese primary school teachers have also underlined the need for timely, adequate
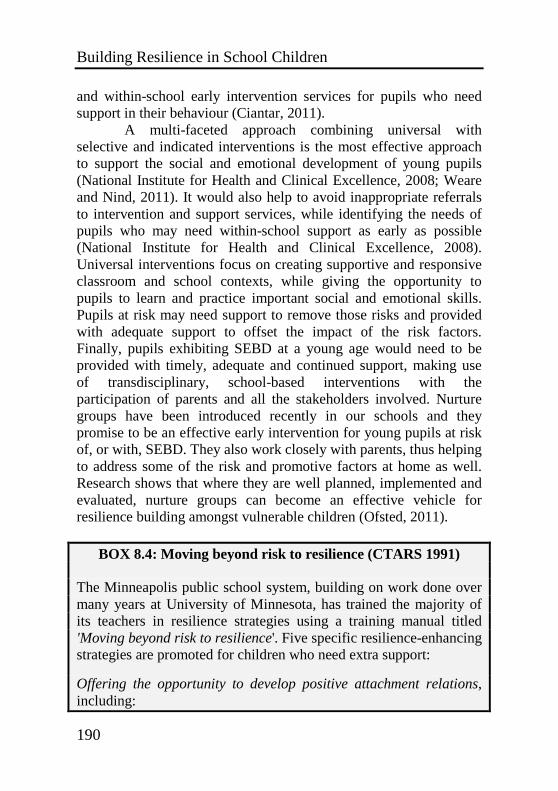
Building Resilience in School Children
190
and within-school early intervention services for pupils who need support in their behaviour (Ciantar, 2011).
A multi-faceted approach combining universal with selective and indicated interventions is the most effective approach to support the social and emotional development of young pupils (National Institute for Health and Clinical Excellence, 2008; Weare and Nind, 2011). It would also help to avoid inappropriate referrals to intervention and support services, while identifying the needs of pupils who may need within-school support as early as possible (National Institute for Health and Clinical Excellence, 2008). Universal interventions focus on creating supportive and responsive classroom and school contexts, while giving the opportunity to pupils to learn and practice important social and emotional skills. Pupils at risk may need support to remove those risks and provided with adequate support to offset the impact of the risk factors. Finally, pupils exhibiting SEBD at a young age would need to be provided with timely, adequate and continued support, making use of transdisciplinary, school-based interventions with the participation of parents and all the stakeholders involved. Nurture groups have been introduced recently in our schools and they promise to be an effective early intervention for young pupils at risk of, or with, SEBD. They also work closely with parents, thus helping to address some of the risk and promotive factors at home as well. Research shows that where they are well planned, implemented and evaluated, nurture groups can become an effective vehicle for resilience building amongst vulnerable children (Ofsted, 2011).
BOX 8.4: Moving beyond risk to resilience (CTARS 1991) The Minneapolis public school system, building on work done over many years at University of Minnesota, has trained the majority of its teachers in resilience strategies using a training manual titled 'Moving beyond risk to resilience'. Five specific resilience-enhancing strategies are promoted for children who need extra support:
Offering the opportunity to develop positive attachment relations, including:
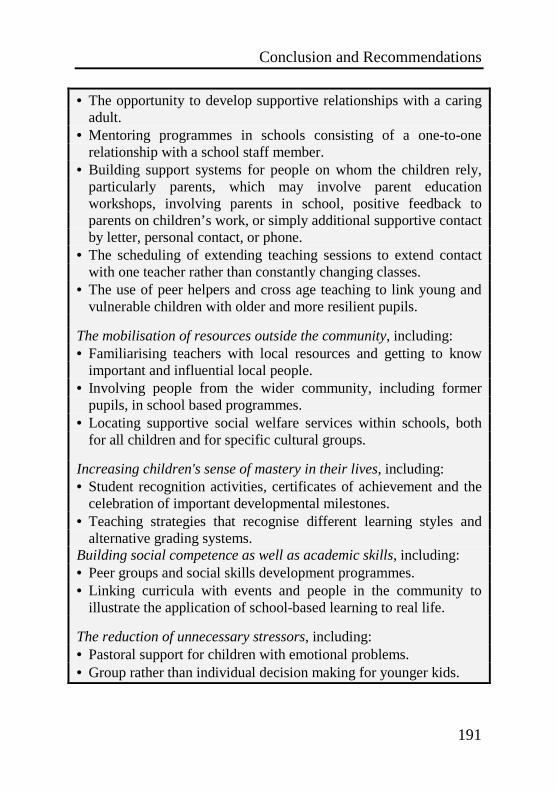
Conclusion and Recommendations
191
• The opportunity to develop supportive relationships with a caring adult.
• Mentoring programmes in schools consisting of a one-to-one relationship with a school staff member.
• Building support systems for people on whom the children rely, particularly parents, which may involve parent education workshops, involving parents in school, positive feedback to parents on children’s work, or simply additional supportive contact by letter, personal contact, or phone.
• The scheduling of extending teaching sessions to extend contact with one teacher rather than constantly changing classes.
• The use of peer helpers and cross age teaching to link young and vulnerable children with older and more resilient pupils.
The mobilisation of resources outside the community, including: • Familiarising teachers with local resources and getting to know
important and influential local people. • Involving people from the wider community, including former
pupils, in school based programmes. • Locating supportive social welfare services within schools, both
for all children and for specific cultural groups.
Increasing children's sense of mastery in their lives, including: • Student recognition activities, certificates of achievement and the
celebration of important developmental milestones. • Teaching strategies that recognise different learning styles and
alternative grading systems. Building social competence as well as academic skills, including: • Peer groups and social skills development programmes. • Linking curricula with events and people in the community to
illustrate the application of school-based learning to real life.
The reduction of unnecessary stressors, including: • Pastoral support for children with emotional problems. • Group rather than individual decision making for younger kids.

Building Resilience in School Children
192
8.2 Risk and promotive factors and implications for practice 8.2.1 Self-efficacy, self-esteem, and communication skills
Pupils’ self-esteem, self-efficacy and communication skills
are three of the strongest predictors of SEBD and prosocial behaviour, not only amongst the individual characteristics variables, but in the overall analysis of the study. Young children with positive self-esteem, high self-efficacy and good communication skills are less likely to experience SEBD and more likely to engage in positive behaviour at school. Having optimistic views of oneself and confidence in one’s ability and skills as a learner, have long been known to protect children from behaviour problems at school and to promote more positive behaviour in children. It enables young children to develop healthy relationships with peers, develop friendships, recruit support and avoid bullying, thus protecting them from other risk factors which might compromise their wellbeing and adaptive functioning (Linnenbrink and Pintrich 2003; Guttman and Brown, 2008; Morrison Gutman et al., 2010). It may also serve as a moderating factor for children at risk, such a protecting low income boys from potential SEBD, particularly peer problems (Guttman and Brown, 2008), young children from disadvantaged home backgrounds from school failure (OECD, 2011) and moderating the effects of traumatic experiences in childhood (Masten, Best and Garmezy, 1990). It also enables vulnerable young children to mobilize these resources in times of difficulty to exert control and overcome the challenges they may face at school or at home. Negative views of oneself and one’s abilities and in the ability to bring about change in one’s lives, are likely to persist throughout childhood if not nipped at the bud, with consequent negative effect on learning, behaviour and relationships (Seligman, 1998).
Parents, teachers and significant others in children’s lives
can promote young children’s self-esteem and self-efficacy by providing opportunities for success in valued tasks both at school and at home, promoting a sense of competence, expressing positive beliefs and optimism in children and in their abilities, providing
Conclusion and Recommendations
193
space for autonomy and self-directed activities, creating safe, caring and supportive contexts with secure and healthy attachments where children can grow, thrive and maximise their potential, and by teaching social and emotional skills from the early years. Resilience building where children learn to exert more control over their lives, believe in their ability to bring about change in their own lives, learn to solve problems effectively, and have an optimistic outlook on life, could be an essential part of the curriculum from a young age (ibid.)
One of the implications of this finding is that emotionally
literate children will be able to have more successful learning and social experiences at school (cf. MEEF, 2011). Consistent research evidence suggests, however, that one-off, bolt-on programmes in emotional literacy such as self-esteem, self-efficacy and communication skills, are not likely to work in the long term (Ofsted, 2007; Greenberg, 2010; Durlack et al., 2011; Weare and Nind, 2011). Such skills need also to be taught explicitly rather than simply captured from the context (Greenberg, 2010; Weare and Nind, 2011). Social and emotional education needs to be a core competence in primary education, facilitating not only children’s emotional literacy skills, but enhancing academic learning as well (National Institute for Health and Clinical Excellence, 2008; Greenberg, 2011; Weare, 2010; Cefai et al., in press). A dual focus on academic and social-emotional learning promotes academic achievement, engagement, positive behaviour and healthy relationships (Payton et al., 2008; Dix et al., 2011; Durlak et al., 2011). It also acts as an antidote against both internalised and externalised problems in children such as anxiety, depression, conduct problems, and violence (Waddell et al., 2007; Blank et al., 2009). It enables students to regulate their emotions, cope better with classroom demands and frustrations, and solve problems more effectively. Pupils will be able to relate better and work more collaboratively with others, avoid entering into unnecessary conflicting situations, and synergise their learning potential through collaborative learning. They would also enjoy better relationships with the classroom teacher, which widens their opportunities for learning. These are competencies which children can learn and use

Building Resilience in School Children
194
effectively given the right context and tools, particularly as they are still at a young age when their personality is still developing.
There is a need for a new structure in public school systems – An “Office of Social and Emotional Development”. This office is focused on curriculum and policy and is NOT located with psychologists, counselors, social workers, and special educators, but in the central mission of schools – Curriculum. It involves both teacher training in quality teaching processes as well as specific curriculum. (Greenberg, 2011) 8.2.2 Gender
The evidence on gender differences in the study is not always consistent, particularly when comparing the findings from parents’ and teachers’ evaluations. The general picture, however, seems to suggest that while girls are more likely to engage in prosocial behaviour than boys, boys are more likely to manifest SEBD than girls, particularly in conduct and hyperactivity problems. It is indicative that young boys are particularly prone to develop SEBD, with clear targets for early intervention. It must be borne in mind, however, that the gender difference observed in SEBD is not as wide as that usually portrayed in international research (see Cefai, Cooper and Camilleri, 2008). Moreover girls may be underrepresented because of their tendency to internalize rather than externalize difficulties (Cooper and Jacobs, 2011), while in the last half a century or so, the rise in externalizing difficulties has increased at a greater rate amongst girls than amongst boys (Rutter and Smith, 1995). Indeed there is a danger of construing SEBD as a male-dominated field, with girls receiving less attention and resources than boys (Osler and Vincent, 2003). Young girls need support not only with regards to emotional problems where they tend to experience more difficulties than boys, but with behaviour problems as well.
Conclusion and Recommendations
195
8.2.3 Disability, health and learning problems
Another group of pupils at risk for SEBD are those having a disability, health problem or learning difficulty, and undergoing medication and/or treatment. International research has shown that pupils with disability/learning difficulties face greater psychological difficulties and are at greater risk of bullying than their peers, with up to 80% of such pupils being liable to bullying at school (Mencap, 2007; Morrison Gutman et al., 2010). This is a particularly salient point in view of the study’s finding that school bullying is one of the major risk factors for SEBD in primary school. This group of pupils is also particularly vulnerable during developmental transitions, such as the transition from one school to another (McGee et al., 2004). More work thus needs to be done to ensure the effective inclusion of pupils with disability and other difficulties in the learning and social processes taking place in the classrooms and outside such as integrating the support such pupils receive within the mainstream school services to avoid stigmatization and labeling, providing adequate and effective support during developmental transitions, and promoting values such as diversity, solidarity and collaboration (Bartolo et al., 2007, Cefai, 2008; Morrison Gutman et al., 2010).
Mainstream staff collaboration, accessible and high quality within-school professional and educational support and provisions starting as early as possible in the pupils’ life, peer preparation programmes, collaborative learning, buddy systems, differentiated teaching, bullying prevention and home-school collaboration, are some of the tools which can be used to ensure that pupils with disability/learning difficulty do not develop SEBD as well. A balance between universal interventions in learning, behaviour and emotional literacy and targeted interventions for pupils experiencing risk or difficulty in any area of their development, is crucial for healthy cognitive, social and emotional development. Research shows that both universal and targeted approaches have their place in school, and that a dual focus is more effective than one focusing only on either universal or targeted interventions (Adi et al., 2007; Greenberg, 2010).
Building Resilience in School Children
196
Box 8.5: Emotional Literacy through Circle Time Quality circle time (Mosley, 1993) is a child-friendly approach that facilitates the practice of socio-emotional literacy skills in an inclusive, caring and democratic climate. It lends itself effectively to practising skills such as speaking, listening, turn-taking, problem-solving and appreciating each other’s company. Through structured sessions within a safe and supportive setting, pupils can participate in developmentally-appropriate tasks, games and discussions to help develop their self-esteem, self-confidence, and other emotional and social literacy. Circle time sessions follow a carefully structured five-step model, built around the skills of listening, speaking, looking, thinking and concentrating. Pupils take a more active role during these sessions than they usually do in more traditional lessons, and the teacher provides space, opportunity and encouragement for the group to discuss personal and social issues in a safe and supportive environment. Circle time operates according to a number of rules which ensure that a supportive atmosphere is maintained, including, that only positive comments are made during the session; listening when somebody is speaking; keeping hands and legs to oneself; having a right to pass (not speak) if one wishes to; and respecting confidentiality. Pupils are encouraged to come up with suggestions and solutions to the issues being discussed. Circle Time sessions are structured (part of the regular classroom timetable), solution focused and make us of a variety of teaching and learning strategies. The sessions consist of five sequential stages, namely meeting up – playing a game; warming up – breaking the silence; opening up – exploring issues; cheering up – celebrating the positive; and calming down – bridging to the next lesson.
8.2.4 Teacher-pupils relationship
Classroom relationships and pupils’ engagement in the learning process are the two major set of significant individual school-related variables. The teacher-pupils relationship is one of the strongest predictors in the prevention of SEBD and promotion of

Conclusion and Recommendations
197
prosocial behaviour, particularly on the basis of teachers’ evaluations. Research has long established this relationship as the platform on which learning and positive behaviour in the classroom are built (Hamre and Pianta, 2001; Battistisch, Schaps and Wilson, 2004; Cefai, 2008). It is particularly meaningful and protective for vulnerable pupils who lack such relationships in their homes (Hamre and Pianta, 2001, 2005). Secure and healthy relationships have also been found to increase pupils’ ability to cope with stressful experiences and develop self-reliance and autonomy (Masten et al., 1990; Bernard, 2004). Unhealthy relationships, on the other hand, are related to both academic and behaviour difficulties in young pupils, particularly boys (Hamre and Pianta, 2001, Hughes and Kwok, 2007).
A healthy and supportive teacher-pupil relationship in
primary school is associated with positive interactions with peers, emotional regulation, academic achievement and fewer behaviour problems (Battistisch, Schaps and Wilson, 2004; Klem and Connell, 2004; Cefai, 2008; Wu, Hughes and Kwok, 2010). Kindergarten pupils who enjoyed a non-conflictual relationship with their teacher were more likely to develop healthy relationships with their teachers as they moved on in their primary school years. (Pianta and Stuhlman, 2004; Berry and O’Connor, 2009).
Teachers who develop emotional connectedness with their
pupils from the very first year in the primary school thus help young children to embark on a positive developmental trajectory. This protective effect operates for all pupils in the classroom, but appears to be particularly significant for vulnerable children in both their academic and social growth (Benard, 2004; Hamre and Pianta 2005; Baker, 2006; Hughes and Kwok, 2007). It provides a scaffold of support and stability which encourages pupils to engage in positive social interactions with each other and with other adults without any undue stress, thus helping them to develop healthier relationships in their lives.
Building Resilience in School Children
198
8.2.5 Peer relationships
Positive peer relationships in the classroom are the top overall predictor of positive behaviour in primary schools according to teachers’ evaluations. They provide an important social context for children’s positive development and behaviour, particularly as children start to grow older (Wentzell, 1998; Blank et al., 2009). Pupils who feel accepted and respected by their classroom peers, feel valued members of their group; the consequent sense of classroom belonging is related to positive classroom behaviours like motivation, engagement and positive interactions with peers (Wentzell, 1998; Battistisch, Schaps and Wilson, 2004; Blank et al., 2009). A related strong predictor is having close friends with whom to work, share and play. In an interesting study, Bolger and Patterson (2003) found that having a supportive relationship with one or more close friends is a protective factor against peer rejection itself. It will also be difficult for bullying, one of the key risk factors for SEBD identified in this study, to thrive in contexts marked by close friendships and supportive peer interactions.
The classroom teacher may employ various strategies to
create a supportive and collaborative climate in the classroom with pupils sharing and helping each other in both academic and social goals. Social and emotional education through Circle Time will enable pupils to develop more the skills of effective communication, building and maintaining relationships, constructive conflict management, and collaborative working. Collaborative learning experiences makes it more possible for pupils to relate well with each other, become more interconnected and develop a sense of belonging and community (Johnson and Johnson, 2008; Friend and Cook, 2009). Peer mentoring, peer tutoring and buddy systems, as well as cross age tutoring connecting young vulnerable children with older more resilient pupils, are other mediums through which educators may promote positive and collaborative pupil interactions in the classroom (Browne et al., 2004; Adi et al., 2007, Garrard and Lipsey, 2007). Winfield (2001) reported that peer learning groups have been found to operate as protective factors for pupils at risk, as

Conclusion and Recommendations
199
they facilitate improved skills in relationships with both peers and adults.
The teamwork between the class teacher and other adults in
the classroom, such as Learning Support Assistants, the staff’s own collegiality and collaboration, and the teacher-parents collaboration are other sources that sustain a collaborative classroom community. Finally, the teacher’s own relationship with the pupils may serve as a model and incentive for more prosocial relationships amongst the pupils themselves, not only setting standards of social interactions in the group, but also facilitating the acceptance of rejected or difficult pupils (Hughes, Cavell and Wilson, 2001; Donahue et al., 2003; Lane, Little, et al., 2010). 8.2.6 Teacher-parent relationship
The teacher-parent communication featured as another significant predictor of pupils’ prosocial behaviour. Good communication between teachers and parents is related to both pupils’ academic achievement and social behaviour, and appears to be particularly significant for pupils at risk (Battistisch, Schaps and Wilson, 2004; Hughes and Kwok, 2007; Farrell and Humphrey, 2009). This is mainly true of the early primary school years when parents’ involvement in children education is usually at its highest (Green et al., 2007; Kikas, Peets, and Niilo, 2011). When schools seek to build effective partnerships with parents and the community by involving them in their academic and social activities, pupils show increases in attendance rates and positive attitudes towards learning, good behaviour, and emotional literacy (Ade et al., 2007; Slee et al., 2009; Weare and Nind, 2011). Schools may seek to provide more accessible and welcoming classrooms and schools for parents, with opportunities for meaningful and influential contributions to the academic and social life of the school. What happens at school has a positive impact on familes and communities (Durlak and Weissberg, 2007). They may also seek to encourage parents to become more involved and participate in the education of

Building Resilience in School Children
200
their children, to support their children in their learning, and instill in them high academic self efficacy. Parental education, especially for parents coming from impoverished environments, may also help to promote educational resilience amongst vulnerable children. For instance, nurture groups may operate as centres for parenting education, with parents supported to reinforce the cogntive, social and emotional skills pupils are learning at school (Cefai and Cooper, 2011).
8.2.7 Pupil engagement and achievement
Academic engagement and progress, learning difficulties and support with learning, and academic expectations emerged as some of the strongest predictors in the study. The findings underline the inextricable link between learning and behaviour and how learning difficulties may lead to social, emotional and behaviour difficulties over time (Lanrdrum, Tankersley and Kaufmann, 2003; Gresham et al., 2004; Ford et al., 2007; Cefai, Cooper and Camilleri, 2008). The study also highlights the value-added effect when teachers and parents work hand in hand to support children’s education. Pupils who are actively engaged and supported in their learning by teacher, peers and parents, and have teachers and parents who expect them to do well and communicate well together, are more likely to steer away from SEBD and engage in prosocial behaviour (cf. Ford et al., 2007; Reschly and Christenson, 2009; Morrison Gutman et al., 2010).
Identifying pupils’ needs and strengths and adapting learning activities accordingly, recruiting pupils’ motivation and engagement, providing adequate, timely and tailored support, involving parents, and ensuring academic progress from the first year of the primary school, have high promotive value for primary school pupils (cf. Bartolo et al., 2007; Farrell and Humphrey, 2009; Ciantar, 2011). The new National Curriculum Framework (MEEF, 2011) underlines the need for meaningful, engaging and participative learning experiences and the use of connective pedagogy in the
Conclusion and Recommendations
201
classroom. The current exercise in developing benchmarks for attainment in core competencies, while ensuring that all pupils move towards the achievement of the set academic targets within a developmental, inclusive perspective, providing adequate support as necessary, would ensure that primary school pupils would be able to learn and achieve according to their potential and readiness level (MECYS, 2009). Further research needs also to be carried out on developing SEBD-friendly pedagogy in our schools. Most of the research in the area has focused on behaviour management and support, while particular pedagogies for pupils with SEBD are underdeveloped and under-researched (Lewis and Norwich, 2004).
8.2.8 Academic expectations
High parental and teacher academic expectations are highly predictive of both SEBD and prosocial behaviour in primary school, acting as both risk and promotive factors. Such expectations are particularly significant for pupils considered at risk or experiencing difficulties in their cognitive, social or emotional development (Benard, 2004; Lane, Pierson, et al., 2010). The significant adults in the young child’s world thus need to focus more on his or her strengths and potential rather than weaknesses and deficits. They need to have high but reasonable expectations for the learning and achievement of the pupil, being 'optimistically tuned to their student's strengths and hidden possibilities’ (Benard, 2004). The communication of these positive expectations do not only impact their own behaviour towards the pupils, but enhances the pupil’s own belief and confidence in his or her own ability as a learner (Guttman and Brown, 2008; Morrison Gutman et al., 2010). Academic expectations may be relayed to pupils through the expression of positive beliefs and optimism, an accent on pupil’s strengths and skills and provision of opportunities for success in valued tasks, adequate and timely support, space for autonomy, and caring and supportive contexts.

Building Resilience in School Children
202
Box 8.6: Pupils’ recommendations on learning and behaviour
What helps pupils to learn? 54% teacher support 53% meaningful lessons 50% support from parents 46% active participation in lessons 30% play 25% peer support What helps pupils to engage in positive behaviour? 63% interesting lessons 60% understanding teachers 46% helpful peers 45% good behaviour management (e.g. classroom rules) 25% attractive classrooms
8.2.9 Family structure and poverty
Family structure, family dynamics and parenting emerged as key home predictors in contrast to weaker predictors such as SES, locality, home language, family size, local organisations, and neighbourhood safety and support. Family structure is one of the strongest predictors in the study both as a risk and promotive factor (Cefai, Cooper and Camilleri, 2008). Children in single parent families appear to be particularly vulnerable to SEBD. 14% of children and young people in Malta live with one parent (NSO 2010). Malta has also a relatively high rate of teenage pregnancies (5.8%) compared to the 3% EU average (Euro-Peristat, 2008). Research shows that a harmonious, intact two parent family is one of the strongest protective factors for young children (Buchanan and Ritchie, 2004; Fomby and Cherlin, 2007; Osborne and McLanahan, 2007). On the other hand, loss of parent through separation/divorce accompanied by discord and disharmony and economic difficulties,

Conclusion and Recommendations
203
is particularly risky for primary school children, particularly boys (Wallerstein, Corbin and Lewis, 1988; Morrison Gutman et al., 2010). However, if single parents are able to provide a positive and healthy home environment for the children, children’s social and emotional development is likely to follow a normative trajectory (Hetherington and Stanley-Hagan 1999; Morrison Gutman, et al. 2010).
Children from single parent families in Malta are more likely
to be living on the poverty line (NSO, 2011). Poor SES is strongly related to SEBD in this study, with children coming from poor families being twice as likely to experience an increase in SEBD. Poverty may be related to other risk factors as well, such as family and parenting stress, lack of quality time and poor supervision (Amato, 2005; Engle and Black, 2008; McLanahan, 2009). It is also linked to poor physical health, poor cognitive development, low academic achievement and mental health difficulties amongst children (Engle and Black, 2008; Morrison Gutman et al., 2010; Schoon et al., 2011). This is a particular cause for concern, as more than one in five children (22%) in Malta, are at the risk of poverty (Eurostat, 2010). It underlines the cumulative and interactive impact of risk factors on SEBD. As already indicated, being exposed to more than one risk factor increases considerably the risk of developing SEBD and mental health. Clearly children coming from single parents are key targets for multifaceted interventions related to education, employment (including minimum wage, pay equity, paid sick leave/dependent care leave, and flexible work schedules), child care, income supports, health care and housing amongst others (see Box 8.7).
Box 8.7: Supporting single parent families (adapted from Montgomery County Commission for Women, 2009)
An action plan to support the healthy development of single parent families includes targets related to education, employment, child care, income supports, health care and housing. Some of key policy recommendations may include:

Building Resilience in School Children
204
• Provide incentives and supports for low-income girls to earn post-secondary and tertiary education or vocational training, including careers in science, technology, mathematics and engineering.
• Organize training programs specifically for low-income women to help them escape occupational ghettos and access better jobs with better pay and benefits.
• Include parent education and training as part of the social benefits. • Train teachers to emphasize to their students that educational
achievement is the best way to avoid poverty. • Increase the minimum wage to a living wage and index the
minimum wage to reflect annual changes in the cost of living; • Encourage employers, both state and private, to allow flexible
work schedules for all workers, regardless of income level. • Modify child care subsidy programs so that an eligible family is
required to spend no more than 10% of its income for child care. • Reduce/remove income tax for many low- and moderate – income
families. • Expand the availability and enhance the quality of affordable
preschool programs for families of low income. • Provide tax credits or other incentives to encourage the business
community to provide child care benefits. • Provide sufficient funding for and improve enforcement of child
support orders. • Reform and update child support guidelines - including updating
the underlying economic estimates of child rearing costs, income guidelines, and necessary self-sufficiency reserves.
• Expand access to critical preventive health care for low-income women
• Provide comprehensive, affordable health care for all. • Expand support services for low-income housing. • Increase the total amount of affordable housing, including rental
housing. • Explore the feasibility of developing alternative initiatives such as
programs that might facilitate arrangements for single-mother families to share housing.
Conclusion and Recommendations
205
8.2.10 Family relationships and parenting
Healthy family relationships, family resources such as quality time, cohesion and good conflict management, and positive parenting emerged as the three groups of family related processes mostly linked to SEBD and prosocial behaviour. These three key processes provide a stable, healthy and protective environment which promotes the healthy development of young children, even in the face of stress and other risk factors that children may be facing (Darling, 1999; Morrison Gutman et al., 2010). The presence of positive and supportive parents is one of the most powerful protective factors for children aged 5-10 years over time (Osborne and McLanahan, 2007). Authoritative parenting, where parents provide expectations and structure within a caring and nurturing context, is a highly beneficial process in children’s healthy development, particularly for children in distress, while family cohesion protects children from stress by promoting their sense of control and coping strategies (Darling, 1999; Morrison Gutman et al., 2010). On the other hand, poor family relationships, impoverished family resources such as disharmony, discord and low quality time, and poor parenting such as inadequate supervision and coercive parenting, put children’s social and emotional development at risk (cf. Amato, 2005; Osborne and McLanahan, 2007; McLanahan, 2009). The data suggests that parenting stress appears to be a strong predictor of SEBD while parenting difficulty is a weaker predictor, suggesting that while parents may have no difficulty in being good parents as such, their stress in enacting their role may compromise their competence.
These findings underline the need to build support systems
for families and parents, particularly those having young children, in bringing up healthy children. This would also lessen the burden on schools and services on providing prevention and intervention programmes later on in children’s lives (Farrell and Humphrey, 2009; Sollars, 2010). Parental education and family learning, support to build resilience and competence in parents, provision of resources such as transportation, flexible childcare facilities, flexible parental

Building Resilience in School Children
206
leave and working hours, access to essential services for families, availability of social services and healthcare, and economic and financial packages, would facilitate the role of families in bringing up healthy children and young people (see Box 8.8). Particular support to families in difficulties, such as large families with limited resources, families living in poverty, families with unemployed parents, single parent families, and families experiencing psychological or relational problems such as family breakup, parental psychopathology, violence and discord, are particular targets for intervention. Such support, however, would need to be provided without increasing the stigma attached to some communities and families. Parenting education and support need to become the norm for all parents, as in the case of antenatal courses (Paterson, 2011).
Box 8.8: Protective Factors for Promoting Healthy Families (Department of Health and Human Services USA, 2007)
Nurturing and Attachment: A child’s early experience of being nurtured and developing a bond with a caring adult affects all aspects of behaviour and development. When parents and children have strong, warm feelings for one another, children develop trust that their parents will provide what they need to thrive, including love, acceptance, positive guidance, and protection. Knowledge of Parenting and of Child and Youth Development: Discipline is both more effective and more nurturing when parents know how to set and enforce limits and encourage appropriate behaviours based on the child’s age and level of development. Parents who understand how children grow and develop can provide an environment where children can live up to their potential. Child abuse and neglect are often associated with a lack of understanding of basic child development—or an inability to put that knowledge into action. Timely mentoring, coaching, advice, and practice may be more useful to parents than information alone.
Conclusion and Recommendations
207
Parental Resilience: Resilience is the ability to handle everyday stressors and recover from occasional crises. Parents who are emotionally resilient have a positive attitude, creatively problem solve, effectively address challenges, and are less likely to direct anger and frustration at their children. In addition, these parents are aware of their own challenges—for example, those arising from inappropriate parenting they received as children—and accept help and/or counseling when needed. Social Connections: Evidence links social isolation and perceived lack of support to child maltreatment. Trusted and caring family and friends provide emotional support to parents by offering encouragement and assistance in facing the daily challenges of raising a family. Supportive adults in the family and the community can model alternative parenting styles and can serve as resources for parents when they need help. Concrete Supports for Parents: Many factors beyond the parent-child relationship affect a family’s ability to care for their children. Parents need basic resources such as food, clothing, housing, transportation, and access to essential services that address family-specific needs (such as childcare, health and mental health care) to ensure the health and well-being of their children. It is critical to provide concrete supports, information, and access to community resources that families need. These combined efforts help families cope with stress and prevent situations where maltreatment could occur.
8.2.11 Classroom engagement and sense of community
Whole classroom and whole school variables appear to have less influence on the development of SEBD and prosocial behaviour than individual factors. The two main classroom processes which appear to prevent SEBD and promote prosocial behaviour are pupils’ participation in the classroom and a sense of classroom community.

Building Resilience in School Children
208
Active pupil participation in meaningful activities relevant to pupils’ lives and matched to their interests, developmental needs and learning styles, addresses pupils’ needs for competence and esteem. They are particularly crucial for pupils considered at risk and for pupils with SEBD (Benard, 2004; Groom and Rose 2004; Cooper and Jacobs, 2011). Experiential and constructivist learning activities, use of multi-sensory resources and interactive activities, and a pedagogy drawing on pupils’ own developmental stages, experiences, interests and strengths, are useful tools in facilitating students’ active engagement. Learning becomes an enjoyable enterprise, spilling over to the whole classroom group. Teachers have long been aware that pupils who are busily and happily engaged in ongoing classroom activities have little time for misbehaviour.
A sense of classroom community is linked to positive
academic and social outcomes among primary school pupils, including those considered at risk of school failure and psychosocial difficulties (Solomon et al., 2000; Battistich , Schaps, and Wilson 2004; Cefai, 2007). As Dweck (1999) argues, pupils’ beliefs about themselves, their abilities and learning, are strongly influenced by the classroom processes and relationships. Pupils who feel trusted and valued internalise the values and goals that the teachers and the group hold for them, and are more likely to be motivated, to work hard in the classroom, and to engage in those behaviours that are expected of them. Pupils with a strong sense of belonging to their classroom community are more likely to internalise the academic and social values and behaviours inherent in that community, such as mutual understanding, respect and support, sharing, collaboration, solidarity and other prosocial behaviours, as well as positive attitudes towards learning (Deci and Ryan, 2000). In a study of a number of Year 2, 3 and 4 classroom communities in Maltese primary schools, Cefai (2008) identified a number of processes which helped to build a sense of community amongst the pupils. The community building blocks included caring and supportive relationships between the teacher and pupils, an ethic of support and solidarity amongst the pupils, authentic, active and meaningful pupil

Conclusion and Recommendations
209
engagement, collaborative learning and teamwork amongst all classroom members, full inclusion of all pupils in the learning and social processes, positive beliefs and high expectations for all pupils on the part of the teacher, and pupil autonomy and participation in the classroom decisions. Taken together, these processes created a caring community that became more than just the sum of its parts, promoting positive academic and social values, attitudes and behaviours amongst all members. 8.2.12 Bullying and misbehaviour at school
Pupils’ behaviour at school, such as bullying, misbehaviour, and participation, appear to be the key determinants of SEBD and prosocial behaviour, in contrast to staff’s own behaviour such as participation and collaboration in school activities and decisions, collegiality and administrative support; the latter emerged a relatively weak predictors. Bullying is one of the strongest risk and promotive factors in the whole study, indicating that pupils attending schools where bullying is high are particularly vulnerable to SEBD.
Whilst it is encouraging to note that the latest HBSC study,
which is based on students’ self-reports, reported that bullying in Maltese schools is lower than the EU average (WHO, 2008), other data based on staff’s perceptions and reports of incidents, suggests a more problematic picture. A study amongst OECD countries, reported that almost half (48.8%) of lower secondary students in Malta intimidated or verbally abused other students, a figure significantly higher than the OECD average (OECD 2009). In 2010-2011, 218 reports of bullying in schools in Malta were received at the Safe School Programme at the Education Directorates (Malta Today, 2011). The HBSC study (WHO, 2008) also reported that 13% of female and 26% of male students aged 13 years, engage in frequent fighting. These percentages contrast considerably with 7% and 21% respective EU averages. Box 8.9 provides various suggestions on how schools may prevent and deal with bullying and violence.

Building Resilience in School Children
210
High levels of bullying and pupil misbehaviour and lack of pupil participation and support at the whole school level, pose a high risk for individual pupils’ positive behaviour and emotional wellbeing. This may not only operate directly with individual pupils being directly subjected to bullying for instance, but also through the promotion of a peer culture where bullying, misbehaviour, anti-social behaviour and disengagement become ingrained in the school’s ethos and everyday behaviour. On the other hand, a school with low levels of mishebaviour and bullying and high levels of pupil engagement and support has a positive impact on pupils’ prosocial behaviour.
Box 8.9: Dealing with bullying and violence at school (adapted
from Datasav, 2011)
Research evidence suggests that interventions to prevent bullying and violence in schools: • Are implemented fully, intensively and consistently, with clear
specific and clear aims and written guidelines, and a sound theoretical base.
• Avoid using peer work which brings difficult, violent or bullying pupils together, but use peer norming, pairing those with difficult behaviour with those who are more positive have adverse effects.
• Use a range of staff as appropriate to the stage of the intervention e.g. specialist staff to initiate and teachers to sustain and embed the work in the academic curriculum.
• Have an explicit goal of preventing violence and bullying but focus on the whole child, not just their difficult behaviour, using positive rather than problem or fear based approaches, and developing attitudes, values, skills and beliefs.
• Are embedded within a whole school approach, where several components of the school are mobilised to provide an effective environment both to prevent violent and bullying behaviour and promote mental health and wellbeing.

Conclusion and Recommendations
211
• Develop a whole school climate which emphasizes respect, tolerance and good relationships, and which also makes it clear that violent or bullying behaviour is not acceptable and which responds to it immediately and with clear and strong consequences for perpetrators.
• Develop skills and provide practical work to strengthen social, emotional, cognitive and behavioural competences, with opportunities to practice in a range of contexts, and integrated into the curriculum. Where there is a particular problem include more specific skills to address difficult behaviour, such as impulse control, empathy, conflict resolution, mediation and assertion.
• Ensure parental involvement and offer parenting education to all parents, within which special help offered to the parents of children with difficult behaviour can be less stigmatizing.
• Give leaders with training and ongoing consultancy and support. • Ensure community involvement, using adults as support, mentors
and role models, including providing well controlled, peaceful and tolerant models of strength and authority.
• Operate over several years and start early, providing education in generic social and emotional skills with the youngest students and continue with older ones, providing more specific skills to address difficult behaviour.
The WHO framework for health promotion in schools
recommends a whole school approach which includes the development of a supportive school ethos and environment as one of the key constituents (WHO, 2007). Current research is underlining the importance of a positive school climate with positive values, attitudes and behaviours as a key factor in the promotion of pupils’ wellbeing, behaviour and mental health (Adi et al., 2007; Slee et al., 2009; Greenberg, 2010). Such a climate promotes positive and healthy relationships amongst school members, as well as a sense of belonging and attachment to the school and its values (Browne et al., 2004; Adi et al., 2007; National Institute for Health and Clinical Excellence, 2008).

Building Resilience in School Children
212
Box 8.10: Promoting a positive school climate (adapted from the Ontario Ministry of Education, 2010)
Guiding principles: • Everyone has a role to play in building a welcoming, positive and
inclusive school climate. Success depends on active involvement of school leaders, staff members, students, parents/guardians and community members who are committed to a shared, well-developed vision of a safe, caring, supportive school community.
• Building a positive school climate requires a focus on developing healthy and respectful relationships throughout the school community – among students, among adults, and between adults and students.
• Building a positive school climate means embedding the principles of equity and inclusive education in all aspects of the learning environment to support the well-being and achievement of pupils.
• No single solution can guarantee the creation and maintenance of a positive school climate. Success requires an ongoing, collaborative and comprehensive effort on the part of everyone involved.
Characteristics: • Students, parents, and staff members feel safe, comfortable, and
accepted. • Healthy and respectful relationships are promoted among all
members of the school community. • Students are encouraged to be leaders and positive role models–
for example, by speaking up about issues such as bullying. • Parents and community members are actively engaged. • Positive behaviour is reinforced and students are given
opportunities to develop relationships that are free of racism, discrimination, and harassing behaviour.
• There is a culture of high expectations in which the improvement of learning outcomes for all students is emphasized.
• All cultures are respected and valued.

Conclusion and Recommendations
213
Bear, Blank and Smith (2009) provide a number of characteristics which were found to be effective in building and maintaining a positive school climate, namely positive relationship-building among pupils, school staff and families; a sense of belonging, with both pupils and staff actively engaged in the life of the school and experiencing school as meaningful and productive; positive behaviour supports in contrast to the use of coercive measures; high expectations in both academic and social goals amongst teachers, pupils, and parents; development of social and emotional skills among all pupils; involvement of parents and community who are viewed as valuable resources and are strongly encouraged to take an active role in the school; fairness and clarity of rules; and school safety (see Box 8.10).
8.3 Conclusion
About ten percent of Maltese young children are experiencing significant difficulties in their social and emotional development and are at significant risk of experiencing mental health problems. This has implications not only for the short and medium term, but for the long term as well, as poor adjustment in childhood has been consistently linked with negative psychosocial outcomes in adulthood. The foundations for mental health difficulties, delinquency, criminality, social exclusion, relationship problems and substance abuse in adulthood are largely laid in childhood. Children today are facing increasing pressures and stresses in their lives which render the concept of childhood as a time of innocence and bliss, an irrelevant one. On the other hand, we have also evidence that children and young people who possess good social, emotional and cognitive skills, are more likely to lead healthy and satisfying lives in adulthood. The resilience perspective has also shown that even those young children who are faced with multiple risks may be helped to overcome the odds and grow up as healthy and successful individuals. We are not suggesting that we need to shelter our children and eliminate the vestige of all childhood problems, which is not only impractical but unwarranted. The goal is that childhood is

Building Resilience in School Children
214
lived and experienced in contexts which provide the child with the opportunities and competencies required to accomplish adjustment, success and fulfillment in life.
This study has identified the key risk and promotive factors in the development of SEBD and prosocial behaviour in young primary school children in Malta. It has pinpointed particular windows of vulnerability which need to be closed as early in children’s lives as possible. It has also drawn our attention to particular windows of opportunity which might be developed to support the healthy development of young children. It has made a number of recommendations on how to reduce and address the risk factors and facilitate the promotive factors identified in the study, with a particular focus on building healthy, supportive and responsive classroom and family communities. The findings have also shown that pupils’ behaviour and development are complex, multi-faceted phenomena, and that simplistic, one sided approaches are set to fail to help children in the long term. An adequate model of promotion, prevention and intervention will need to address this complexity, taking into consideration the various individual, home, community, and school predictors identified in the study. Prevention and intervention need to take place within a systemic, multidisciplinary approach addressing systems such as home, school and community, and involving various agencies and services at universal, selective and indicated intervention levels. The major resources in the country need to be focused on health promotion and prevention as early in the child’s life as possible, seeking to prevent identified risks and facilitate promotive and protective factors at the various systems in which the child operates.
Finally, we would like to end with a note of caution. The findings in this report are based on a relatively small sample of primary school pupils from the ten colleges in Malta and Gozo. It is thus imperative that the generalisation of the findings are treated with caution, namely as indicators of trends and pathways, rather than conclusive and definite trajectories.

Conclusion and Recommendations
215
8.3.1 Final comment
In the face of difficult and challenging behaviour in children, adults may be at risk of becoming disillusioned and dispirited, believing that the problems cannot be overcome and that failure is inevitable. Such attitudes are likely to lead to a negative self fulfilling cycle. As Cooper (2006, p.84) very aptly put it, we must not give up on children and young people: “There is no point working in educational settings unless we have a commitment to the idea that we can make a positive difference in the educational lives of our children…maintaining a positive and optimistic attitude is very important”. We must never lose hope when working with children and young people in difficulty. The literature has repeatedly shown us that even in the midst of the most adverse circumstances and the most challenging behaviours, children are able to overcome the odds and go on to achieve successful and healthy lives.
We must accept finite disappointment, but never lose
infinite hope Martin Luther King

Building Resilience in School Children
216

References
217

Building Resilience in School Children
218

References
219
Adi, Y, Killoran, A., Janmohamed, K, and Stewart-Brown, S. (2007) Systematic Review of the effectiveness of interventions to promote mental wellbeing in primary schools: Universal approaches which do not focus on violence or bullying. London: National Institute for Clinical Excellence.
Agaibi, C.P, and Wilson, J.E. (2005) Trauma, PTSD and Resilience. A Review of the Literature Trauma, Violence & Abuse, 6, 3, 195-216.
Amato, P.R. (2001) Children of divorce in the 1990s: an update of the Amato and Keith (1991) meta-analysis. Journal of Family Psychology, 15, 355–370.
Amato, P.R. (2005). The impact of family formation change on the cognitive, social, and emotional well-being of next generation. Future Child, 15, 75-96.
Appleyard, K., Egeland, B., van Dulmen, M., and Srouge, L. (2005). When more is not better: The role of cumulative risk in child behavior outcome. Journal of Child Psychology and Psychiatry, 46 (3), 235-245.
Arthur, M. W., Briney, J. S., Hawkins, J. D., Abbott, R. D., Brooke-Weiss, B. L. and Catalano, R. F. (2007) Measuring risk and protection in communities using the Communities That Care Youth Survey. Evaluation and Program Planning 30 (2), 197–211.
Avramidis, E. and Norwich, B. (2002). Teachers’ attitudes towards integration/inclusion: a review of the literature. European Journal of Special Needs Education, 17 (2):129-149.
Baker, P. H. (2005) Managing student behaviour: how ready are teachers to meet the challenge? American Secondary Education, 33(3), 50–67.
Baker, J. A. (2006) Contributions of teacher-child relationships to positive school adjustment during elementary school. Journal of School Psychology, 44, 211- 229.
Bartolo, P., Janik, I., Janikova,V. et al. (2007) Responding to Student Diversity Teacher’s Handbook. Malta: University of Malta.
Battistich, V., Schaps, E., and Wilson, N. (2004). Effects of an elementary school intervention on students' "connectedness" to school and social adjustment during middle school. The Journal of Primary Prevention, 24 (3), 243-262.

Building Resilience in School Children
220
Bear, G.G., Blank, J. and Smith, D.C. (2009) Fact Sheet School Climate. Consortium to Prevent Violence. Last retrieved on 1st October 2011 from: www.preventschoolviolence.org
Benard, B. (2004) Resiliency: What we have Learned. San Francisco, CA: WestEd.
Berry, D., and O’Connor, E. (2009). Behavioral risk, teacher–child relationships, and social skill development across middle childhood: A child-by-environment analysis of change. Journal of Applied Developmental Psychology, 31(1), 1-14.
Blank , L. Baxter, S. Goyder, L., Guillaume,L., Wilkinson, A, Hummel, S. and Chilcott, J. (2009). Systematic review of the effectiveness of universal interventions which aim to promote emotional and social wellbeing in secondary schools. London: National Institute for Clinical Excellence.
Bolger, K.E. and Patterson, C.J. (2003) Sequelae of child maltreatment: vulnerability and resilience. In S.S. Luthar (ed.) Resilience and Vulnerability: Adaptation in the Context of Childhood. New York, NY: Cambridge University Press.
Bradley, R.H. and Corwyn, R.F. (2007). Externalizing problems in fifth grade: Relations with productive activity, maternal sensitivity, and harsh parenting from infancy through middle childhood. Developmental Psychology, 43, 1390-1401.
Bradley, R.H. and Corwyn, R.F. (2008). Infant temperament, parenting, and externalizing behavior in first grade: A test of the differential susceptibility hypothesis. The Journal of Child Psychology and Psychiatry, 49, 124-131.
Bronfenbrenner, U. (1989) Ecological systems theory. Annals of Child Development, 6, 187–249.
Browne, G, Gafni, A., Roberts, J. Byrne, C. and Majumdar, G. (2004) Effective/efficient mental health programs for school-age children: a synthesis of reviews. Social Science and Medicine 58 (7), 1367-1384.
Buchanan, A. and Ritchie, C. (2004) What works for Troubled Children (revised edition) London: Barnardo's/Russell Press.
Cefai, C. (2007) Resilience for all: a study of classrooms as protective contexts. Emotional and Behaviour Difficulties, 12 (2), 119-134.

References
221
Cefai, C. (2008). Promoting resilience in the classroom. A guide to developing emotional and cognitive skills. London: Jessica Kingsley Publishers.
Cefai, C. and Cooper, P. (2011) Nurture Groups in Maltese Schools: Promoting Inclusive Education.British Journal of Special Education, 38(2):65-72.
Cefai, C., Cooper, P., and Camilleri, L. (2008). Engagement Time: a national study of students with social, emotional and behaviour difficulties in Maltese schools. Malta: European Centre for Education Resilience and Socio-Emotional Health, University of Malta.
Cefai, C., Grech, T., Mallia Borg, F. Mizzi, B., Pizzuto, S. and Zammit, S. (in press). Education with Heart. Social and Emotional Education as a Core Competence in Maltese Primary Schools. Malta: University of Malta.
Ciantar, J. (2011) Early Intervention Support Services for Children with Social Emotional Difficulties. Unpublished B.Ed (Hons) dissertation, Faculty of Education, University of Malta.
Cole, T., Daniels, H. and Visser, J., (2005) The mental health needs of pupils with EBD. In R. Williams and M. Kerfoot (Eds) Child and Adolescent Mental Health Services. Oxford : Oxford University Press.
Colman, I., Murray, J., Abbott, R.A., Maughan, B., Kuh, D., Croudace, T.J. and Jones, P.B. (2009) Outcomes of conduct problems in adolescence: 40 year follow-up of national cohort. British Medical Journal, 338, 208-211.
Cooper, P. (2001). We can Work it out: What Works in Educating Pupils with Social, Emotional and Behavioural Difficulties: Inclusive Practice in Mainstream Schools. London: Routledge and Falmer.
Cooper, P. (2006) Promoting Positive Pupil Engagement. Educating Pupils with Social, Emotional and Behaviour Difficulties. Malta: Miller Publications.
Cooper, P., Bilton, C. and Kakos, M. (in press) The Importance of a Biopsychosocial Approach to Interventions for SEBD. In T. Cole, H. Daniels and J. Visser, J. (Eds) The Routledge International Companion to Emotional and Behavioural Difficulties. London: Routledge.

Building Resilience in School Children
222
Cooper, P. and Jacobs, B. (2011) From Inclusion to Engagement. Chichester: Wiley.
CTARS (Comprehensive Teaming to Assure Resiliency in Students) (1991) Moving beyond risk to resiliency: the school’s role in supporting resilience in children. Minnesota, Minneapolis Public Schools.
Daniels, H., Cole, T. and Reykebill, N. (1999) Emotional and Behaviour Difficulties in Mainstream Schools. London: DfEE.
Darling, N. (1999) Parenting style and its correlates. ERIC Digest EDO-PS-99-3, Clearinghouse on Elementary and Early Childhood Education. University of Illinois, Illinois.
DataPrev Project (2011) Mental health prevention in educational settings. http://www.dataprevproject.net/Educational_Settings
Davis-Kean, P.E. (2005) The influence of parent education and family income on child achievement: The indirect role of parental expectations and the home environment. Journal of Family Psychology, 19(2), 294-304.
Deci, E. L. and Ryan, R. M. (2000). The “what” and “why” of goal pursuits: Human needs and the self-determination of behavior. Psychological Inquiry, 4, 227–268.
Denham, S. A., Brown, C. and Domitrovich, C. E. (2010) "Plays nice with others": Social-emotional learning and academic success. Early Education and Development, 21, 652–680.
Department of Health and Human Services USA (2007) Promoting Healthy Families in Your Community. Retrieved on 1st October 2011 from: http://www.projectabc-la.org/dl/healthy_families.pdf
Desforges, C. and Abouchaar, A. (2003) The impact of parental involvement, parental support and family education on pupil achievement and adjustment: A literature review. London: Department for Education and Skills.
Dix, K. L., Slee, P.T., Lawson, M.J. (2011) Implementation Quality of Whole-School Mental Health Promotion and Students’ Academic Performance. Child and Adolescent Mental Health (in press).
Domitrovich, C. E., Cortes, R. and Greenberg, M. T. (2007) Improving young children’s social and emotional competence: A random trial of the Preschool PATHS Program. Journal of Primary Prevention, 28(2), 67–91.
References
223
Donohue, K. M., Perry, K. E. and Weinstein, R. S. (2003) Teachers' classroom practices and children's rejection by their peers. Applied Developmental Psychology, 24, 91-118.
Durlak, J. A. and Weissberg, R. P. (2007) The impact of after-school programs that promote personal and social skills. Chicago, IL: Collaborative for Academic, Social, and Emotional Learning.
Durlak, J. A., Weissberg, R. P., Dymnicki, A. B., Taylor, R. D., and Schellinger, K. (2011). The impact of enhancing students’ social and emotional learning: A meta-analysis of school-based universal interventions. Child Development, 82, 474-501.
Dweck, C. S. (1999). Self-Theories: The role in motivation, personality, and development. Philadelphia, PA: The Psychology Press.
Engle, P.L. and Black. M.M. (2008) The effect of poverty on child development and educational outcomes. Annual NY Academic Science, 1136:243-56.
Euro-Peristat (2008). European perinatal health report [Electronic]. Last retrieved on 1st October 2011 from
http://www.europeristat.com/bm.doc/european-perinatal-health-report.pdf. Eurostat (2010) Combating poverty and social exclusion. A
statistical portrait of the European Union 2010. Last retrieved on 1st October 2001from:
epp.eurostat.ec.europa.eu/cache/ITYOFFPUB/KS-EP-09-001/EN/KS Farrell, P. and Humphrey, N. (2009) Improving services for pupils
with social, emotional and behaviour difficulties: responding to the challenge. International Journal of Emotional Education, 1 (1), 64–82.
Farrell, P. and Polat, F. (2003). The long term impact of residential provision for pupils with emotional and behavioural difficulties. European Journal of Special Needs Education, 18 (3), 277-292.
Fergusson, D.M., Horwood, L.J. and Ridder, E.M. (2005) Show me the child at seven: the consequences of conduct problems in childhood for psychosocial functioning in adulthood. Journal of Child Psychology and Psychiatry, 46, 837-49.
Fomby, P. and Cherlin, A.J. (2007) Family instability and child well-being. American Sociological Review, 72, 181-204.
Fletcher-Campbell, F. and Wilkin, A. (2003) Review of the research literature on educational interventions for pupils with emotional

Building Resilience in School Children
224
and behavioural difficulties. Slough, UK: National Foundation for Educational Research.
Ford, T., Collishaw, S., Meltzer, H. and Goodman, R. (2007) A prospective study of childhood psychopathology: independent predictors of change over three years. Social Psychiatry and Psychiatric Epidemiology, 42(12), 953–61.
Friend, M. and Cook, L. (2009) Interactions: Collaboration Skills for School Professionals. 6th Edition. Prentice Hall.
Garrard, W. M. and Lipsey, M. W. (2007). Conflict resolution education and antisocial behaviour in U.S. schools: A meta-analysis. Conflict Resolution Quarterly, 25 (1), 9-38
Gilligan, R. (2001) Promoting positive outcomes for children in need: the assessment of protective factors. In J. Horwath (ed.) The Child's World: assessing children in need. London: Jessica Kingsley Publishers.
Goodman, R. (1997) The Strengths and Difficulties Questionnaire: A Research Note. Journal of Child Psychology and Psychiatry, 38, 581-586.
Goodman, R., Renfrew, D., and Mullick, M. (2000) Predicting type of psychiatric disorder from Strengths and Difficulties Questionnaire (SDQ) scores in child mental health clinics in London and Dhaka. European Child Adolescent Psychiatry, 9, 129–134.
Green, C. L., Walker, J. M. T., Hoover-Dempsey, K. V., and Sandler, H. (2007) Parents’ motivations for involvement in children’s education: An empirical test of a theoretical model of parental involvement. Journal of Educational Psychology, 99, 532-544.
Greenberg, M. T. (2010) School-based prevention: current status and future challenges. Effective Education, 2 (1), 27–52.
Greenberg, M. T. (2011) Promoting Well-Being in Schools: Current Status and Future Challenges. Keynote Presentation at the Third ENSEC Conference, University of Manchester, UK.
Greenberg, M.T., Weissberg, R.P., O’Brien, M.U., Zins, J.E., Resnik, H. Fredericks, L., and Elias, M.J. (2003) Enhancing school-based prevention and youth development through coordinated social, emotional academic learning. American Psychologist, 58, 466-474.
Gresham, F.M., Cook, C.R., Crews, S.D., and Kern, L. (2004). Social skills training for children and youth with emotional and behavioral

References
225
disorders: Validity considerations and future directions. Behavioral Disorders, 30 (1), 32-46.
Groom, B. and Rose, R. (2004) Involving students with emotional and behavioural difficulties in their own learning: a transnational perspective. In P. Garner et al. (Eds) The Handbook of Emotional and Behavioural Difficulties. London: Sage.
Gutman, L.M. and Brown, J. (2008) The importance of social worlds: an investigation of peer relationships. Centre for the Wider Benefits of Learning. London: Institute of Education.
Gutman L.M. and Feinstein, L. (2008) Parenting behaviours and children’s development from infancy to early childhood: Changes, continuities, and contributions. Centre for the Wider Benefits of Learning. London: Institute of Education.
Gutman, L. M., Sameroff, A. S., and Eccles, J. S. (2002). The academic achievement of African American students in early adolescence: An examination of risk, promotive, and protective factors. American Journal of Community Psychology, 30 (3), 376-399.
Hamre, B. K. and Pianta, R. C. (2001) Early teacher-child relations and the trajectory of children’s school outcomes through eighth grade. Child Development, 72 (2), 625-638.
Hamre, B. K. and Pianta, R. C. (2005) Can instructional and emotional support in the first-grade classroom make a difference for children at risk of school failure? Child Development, 76 (5), 949-967.
Hawkins, J. D., Catalano, R. F. and Arthur, M. W. (2002) Promoting science-based prevention in communities. Addictive Behaviors, 27 (6), 951–976.
Hetherington, E. and Stanley-Hagan, M. (1999) The adjustment of children with divorced parents: A risk and resiliency perspective. Journal of Child Psychology and Psychiatry, 40, 129-140.
Hughes, J. and Kwok, O. (2007) Influence of student-teacher and parent-teacher relationships on lower achieving readers’ engagement and achievement in the primary grades. Journal of Educational Psychology, 99 (1), 39-51.
Hughes, J. N., Cavell, T. A. and Wilson, V. (2001). Further support for the developmental significance of the quality of the teacher-student relationship. Journal of School Psychology, 39 (4), 289-301.

Building Resilience in School Children
226
Hysing, M., Elgen, I., Gillberg, C., Lie, S.A. and Lundervold, A.J. (2007) Chronic physical illness and mental health in children. Results from a large-scale population study. Journal of Child Psychology and Psychiatry, 48, 785–792.
Johnson, D.W. and Johnson, F.P. (2008) Joining Together. Group Theory and Group Skills. Tenth Edition. NY: Allyn & Bacon.
Jull, S.K. (2008) Emotional and behavioural difficulties (EBD): the special educational need justifying exclusion. Journal of Research in Special Educational Needs, 8 (1), 13-18.
Kalambouka, A., Farrell, P., Dyson, A. and Kaplan, I. (2007). The impact of placing pupils with special educational needs in main stream schools on the achievements of their peers. Educational Research, 39, 365–382.
Kiernan, K.E. and Mensah, F.K. (2009) Poverty, maternal depression, family status and children’s cognitive and behavioural development in early childhood: a longitudinal study. Journal of Social Policy, 38, 569-88.
Kikas, E., Peets, K. and Niilo, A. (2011). Assessing Estonian mothers’ involvement in their children’s education and trust in teachers. Early Child Development and Care (in press).
Klem, A. M. and Connell, J. P (2004). Relationships matter: Linking teacher support to student engagement and achievement. Journal of School Health, 74 (7) 262 – 273.
Landrum, T. J., Tankersley, M. and Kauffman, J. M. (2003). What is special about special education for students with emotional or behavioral disorders? Journal of Special Education, 37, 148–156.
Lane, K. L., Little, A. L., Menzies, H. M., Lambert, W. and Wehby, J. H. (2010) A comparison of students with behavioral challenges educated in suburban and rural settings: Academic, social and behavioral outcomes. Journal of Emotional and Behavioral Disorders, 18, 131-148.
Lane, K. L., Pierson, M., Stang, K. and Carter, E. W. (2010) Teacher expectations students’ classroom behaviour: Do expectations vary as a function of school risk? Remedial and Special Education, 31, 163-174.
Leerkes, E. M., Paradise, M., O’Brien, M., Calkins, S. D. and Lange, G. (2008) Emotion and Cognition Processes in Preschool Children. Merrill-Palmer Quarterly, 54, 102-124.

References
227
Lewis, A. and Norwich, B. (2004) Special Teaching for Special Children - Pedagogies for Inclusion. UK: Open University Press.
Linnenbrink, E.A. and Pintrich, P.R. (2003) The role of self-efficacy in student engagement and learning in the classroom. Reading and Writing Quarterly: Overcoming Learning Difficulties, 19, 2, 119-137.
Luthar, S., Cicchetti, D. and Becker, B. (2000). The construct of resilience: a critical evaluation and guidelines for future work. Child Development, 71, 3, 543-62.
MacBeath, J. (2006) Finding a voice, finding self. Educational Review, 58, 2, 195–207.
Maes, L., and Lievens, J. (2003) Can school make a difference? A multilevel analysis of adolescent risk and health behaviour. Social Science and Medicine, 56, 517–29.
Malta Today (2011) 218 bullying reports received in 2010 to 2011 scholastic year. Last retrieved on 1st October 2011 from http://www.maltatoday.com.mt/news/2011/0923/218-bullying-reports
Masten, A., Best, K. Garmezy, N. (1990) Resilience and development: Contributions from the study of children who overcome adversity. Development and Psychopathology, 2, 425–444.
McLanahan, S. (2009) Fragile families and the reproduction of poverty. Annual American Academy of Political and Social Sciences, 62, 111-31.
McLaughlin, M., and Talbert, J. (2006). Building school-based teacher learning communities. New York, NY: Teachers College Press.
MECYS (2009) National Policy and Strategy for the Attainment of Core Competences in Primary Education. Malta: Ministry of Education, Culture, Youth and Sports.
MEEF (2011) Towards a quality education for all. The national curriculum framework 2011. Ministry of Education, Employment and the Family. Malta:
Meltzer, H., Gatward, R., Goodman, R., et al. (2000) Mental Health of Children and Adolescents in Great Britain. London: Stationery Office.
Mencap (2007) Bullying wrecks lives.Report about the experiences of bullying of children and young people with a learning disability. Last retrieved on 1st October 2011 from http://www.mencap.org.uk/node/5843

Building Resilience in School Children
228
Montgomery County Commission for Women (2009) Single Mothers and Poverty. Agenda for Action. Last retrieved on 1st October 2011 from
http://www.montgomerycountymd.gov/content/CFW/Publications/ Morrison Gutman, L., Brown, J., Akerman, R. and Obolenskaya, P.
(2010) Change in wellbeing from childhood to adolescence: risk and resilience. London: Institute of Education, University of London.
Mosley, J. (1993) Turn Your School Round. Wisbech, Cambridge-shire: LDA.
Muijs, D. and Reynolds, D. (2005) Effective Teaching: Evidence and Practice. Second edition. London: Sage Publications.
National Institute for Health and Clinical Excellence (2008) Promoting children's social and emotional wellbeing in primary education. London: National Health Service. Newman, T. (2004) What Works in Building Resilience. Ilford: Barnardo.
NSO (2010) Children 2010. Malta: National Statistics Office. NSO (2011) International Day of Families. News Release, 13th May 2011. Malta: National Office of Statistics. O'Dougherty Wright, M. and Masten, A. S. (2005) Resilience process in
development. In S. Goldstein, and R.B. Brooks (eds.), Handbook of resilience in children. New York: Springer.
OECD (2009) Teaching and Learning International Survey (TALIS) [Electronic Version]. Last retrieved on 1st October 2011 from: www.oecd.org/edu/talis/firstresults
OECD (2011) Against the Odds: Disadvantaged students who succeed in School, OECD Publishing. Last retrieved on 1st October 2011 from: http://dx.doi.org/10.1787/9789264090873-en
Ofsted (2007) Developing social, emotional and behavioural skills in secondary schools. Last retrieved on 1st October 2011 from www.ofsted.gov.uk
Ofsted (2011) Report: Supporting Children with Challenging Behaviour Through a Nurture Group Approach. Last retrieved on 1st October 2011 from http://www.ofsted.gov.uk
Ontario Ministry of Education (2010) Promoting a positive school climate. A resource for schools. Last retrieved on 1st October 2011 from: http://www.edu.gov.on.ca/eng/parents/IntroDocEng.pdf

References
229
O’Regan, F (2011) Exclusion from School and ADHD. International Journal of Emotional Education, 2 (2), 3-18.
Osborne, C. and McLanahan, S. (2007) Partnership instability and child well-being. Journal of Marriage and Family, 69, 1065-83.
Osler, A. and Vincent, K. (2003) Girls and Exclusion: rethinking the agenda. London: Routledge Falmer.
Parsons, C., Hayden, C., Godfrey, R. Howlett, K. and Martin, T. (2001) Excluding Primary School Children - the Outcomes Six Years On. Pastoral Care in Education, 19 (4), 4-15.
Paterson, C. (2011) Parenting Matters: Early Years and Social Mobility. Centre Forum. Last retrieved on 1st October 2011 from: http://www.centreforum.org/assets/pubs/parenting-matters.pdf
Payton, J., Weissberg, R.P., Durlak, J.A., Dymnicki, A.B., Taylor, R.D., Schellinger, K.B. and Pachan, M. (2008) The Positive Impact of Social and Emotional Learning for Kindergarten to Eighth-Grade Students. Findings from Three Scientific Reviews. Chicago, IL: CASEL.
Pianta, R. C. and Stuhlman, M. W. (2004) Teacher-child relationships and children's success in the first years of school. School Psychology Review, 33(3), 444-458.
Pollard, J. A., Hawkins, J.D. and Arthur, M.W. (1999) Risk and protection: Are both necessary to understand diverse behavioral outcomes in adolescence? Social Work Research, 23 (8), 145-58.
Reschly, A. L. and Christenson, S. L. (2009). Parents as essential partners for fostering students’ learning outcomes. In R. Gilman, E. S. Huebner and M. Furlong (Eds.) A handbook of positive psychology in the schools: Promotion of wellness in children and youth. New York: Blackwell.
Resnick, M.D., Bearman, P.S., Blum, R.W., et al. (1997) Protecting adolescents from harm. Findings from the National Longitudinal Study on Adolescent Health. The Journal of the American Medical Association, 278, 10, 823-832.
Rose, W., Aldgate, A., McIntosh, M. and Hunter, H. (2009) High-risk children with challenging behaviour: changing directions for them and their families. Child and Family Social Work, 14,178–188.
Rutter, M. and Smith, D. (Eds) (1995) Psychosocial Disorders in Young People. Chichester: Wiley.
Building Resilience in School Children
230
Seligman, M. (1998) Learned Optimism. New York: Pocket Books. Schoon, I., Jones, E., Cheng,H. and Maughan, B. (2011) Family
hardship, family instability, and cognitive development. Journal of Epidemiological Community Health (in press).
Siqueira, L.M. and Diaz, A. (2004) Fostering resilience in adolescent females. Mount Sinai Journal of Medicine, 71(3), 148-53.
Slee, P. T., Lawson, M. J., Russell, A. et al. (2009). KidsMatter Primary Evaluation final report. Last retrieved on 1st October 2011 from:
www.kidsmatter.edu.au/uploads/2009/10/kidsmatter-fullreport-web.pdf. Sollars, V. (2010) Social and Emotional Competence: Are preventive
programmes necessary in early childhood education and care? International Journal of Emotional Education, 2 (1), 49-60.
Solomon, D., Battistisch, V., Watson, M., Schaps, E. and Lewis, C. (2000) A six district study of educational change: direct and mediated effects of the child development project. Social Psychology of Education, 4, 3-51.
Tanti Rigos, V. (2009) Maltese teachers; causal attributions, cognitive and emotional responses to students with emotional and behavioral difficulties. Unpublished M.Ed. dissertation. Faculty of Education, University of Malta.
Waddell, C, Peters, R.V., Hua, R.M. and McEwan, K. (2007) Preventing Mental Disorders in Children: A Systematic Review to Inform Policy-Making. Canadian Review of Public Health. 98 (3) 166-173.
Wallerstein, J.S., Corbin, S.B., and Lewis, J.M. (1988). Children of Divorce: A 10-Year Study. In E.M. Hetherington and J.D. Arasteh (Eds.), Impact of Divorce, Single Parenting and Step-parenting on Children. Hillsdale, NJ: Lawrence Erlbaum Associates.
Watkins, C. (2005) Classrooms as learning communities: a review of research. London Review of Education 3(1), 47-64.
Weare, K. (2010) Mental Health and social and emotional Learning: evidence, principles, tensions, balances. Advances in School Mental Health Promotion, 3 (1), 5- 17.
Weare, K. and Nind, M. (2011) Promoting mental health of children and adolescents through schools and school based intervention evidence outcomes school based interventions report of work package three of the dataprev project. UK: University of Southampton.

References
231
Wentzel, K. (1998) Social relationships and motivation in middle school: The role of parents, teachers, and peers. Journal of Educational Psychology, 90(2), 202-209.
World Health Organisation (2007) What is a health promoting school? http://www.who.int/school_youth_health/gshi/hps/en/index.html World Health Organisation (2008) Inequalities in Young People’s
Health. School-Aged Children International Report from the 2005/2006 Survey [Electronic]. Last etrieved on October 2011 from: http://www.euro.who.int/Document/E91416.pdf.
Wu, J. Y., Hughes, J. N., and Kwok, O. M. (2010) Teacher–student relationship quality type in elementary grades: Effects on trajectories for achievement and engagement. Journal of School Psychology, 48, 357–387.