Embed Size (px)
Citation preview
Optics Communications 286 (2013) 244–250
Contents lists available at SciVerse ScienceDirect
Optics Communications
0030-40
http://d
n Corr
Univers
E-m
journal homepage: www.elsevier.com/locate/optcom
Building region derivation from LiDAR data using a reversed iterativemathematic morphological algorithm
Liang Cheng a, Wei Zhao b, Peng Han c, Wen Zhang a, Jie Shan d,e, Yongxue Liu a, Manchun Li a,n
a Jiangsu Provincial Key Laboratory of Geographic Information Science and Technology, Nanjing University, 22 Hankou Road, Nanjing 210097, Chinab Institute of Remote Sensing Applications Chinese Academy of Sciences, 20 Datun Road, Beijing 100012, Chinac Beijing Normal University, No. 19, XinJieKouWai St., Beijing 100875, Chinad School of Remote Sensing and Information Engineering, Wuhan University, Chinae School of Civil Engineering, Purdue University, USA
a r t i c l e i n f o
Article history:
Received 4 May 2012
Received in revised form
6 August 2012
Accepted 10 August 2012Available online 7 September 2012
Keywords:
Building region
LiDAR
Mathematic morphological
Reversed iterative
18/$ - see front matter & 2012 Elsevier B.V. A
x.doi.org/10.1016/j.optcom.2012.08.028
espondence to: Department of Geographical
ity, Nanjing 210093, China. Tel./fax: þ86 25
ail address: [email protected] (M. Li).
a b s t r a c t
A new algorithm, called RIMM (Reversed Iterative Mathematic Morphological) algorithm, is proposed
for automatic derivation of building region information from LiDAR (Light Detection And Ranging) data.
The main contribution of the proposed algorithm is to provide a reliable way for building point
detection from airborne LiDAR data, in which the reversed iteration makes that the thresholds can be
determined in a simple way, thus guaranteeing the applicability of this algorithm for various
complicated real situations. An experimental region with 2.8 million LiDAR points, containing many
buildings with various roof structures, various sizes, various orientations, and various roof texture
conditions, are selected to validate the effect and applicability of this algorithm. The average values of
commission and omission error in building information derivation are 5.7% and 8.7%, respectively. The
experimental results indicate that this RIMM algorithm is able to derive building region information
effectively.
& 2012 Elsevier B.V. All rights reserved.
1. Introduction
The processing of optical images for automatic derivation ofbuilding region information has been a research issue for decades;many related studies have been reported [1–4]. A detailed reviewof techniques for the automatic extraction of buildings from aerialimages was made by Mayer [5]. However, a difficult problem stillexists in automated extraction of building information because itis almost impossible to automatically distinguish building regionsaccurately from other objects only based on aerial imagery.Airborne LiDAR (Light Detection And Ranging) technology is ableto provide directly measured three-dimensional points [6], fromwhich building regions can be derived. Studies on automaticdetection of building information from raw LiDAR data have beenraised in recent years. For building point detection, many meth-ods were presented, such as the iterative linear interpolationmethod [7], the adaptive line enhancement method [8], the slope-based filter [9], and the morphological method.
In this research, more attention is on the morphologicalmethods. Kilian et al. [10] proposed a morphological filter forremoving nonground points. In their method, a point with thelowest elevation within a given window size was first detected
ll rights reserved.
Information Science, Nanjing
83597359.
and the points in this window that fall within a band above thelowest elevation were selected as ground points. The selection ofa filtering window size is critical for the success of this method.By using gradually increased window sizes, a progressive mor-phological filter was presented by Zhang et al. [11]. For a point, ifits elevation difference between surfaces after morphologicalopening with gradually increased window sizes is less than athreshold, it was classified as a terrain point. The major limitationof this method is that it assumed the slope over an area isconstant, which is not always realistic, especially for complexscenes. Chen et al. [12] introduced a modified mathematicalmorphology algorithm for extracting building points, which useda large window and a small window to do the opening operationand marked the points as a building point while the elevationlargely changed during two opening operations. It is hard to dealwith a number of buildings with various size in a specific area bytwo filtering window with fixed sizes. Some typical approachesassociated with LiDAR data filtering were also presented [13,14].
These reported morphological approaches suffer from variousproblems, such as the limitation of applicability due to use of thefixed window sizes, the requirement of constant slope terrain forprogressive morphological filter, the difficulty to determineappropriate window sizes for various buildings in real situations.To address these problems, a new algorithm, called RIMM(Reversed Iterative Mathematic Morphological) algorithm, isproposed to identify building points from raw LiDAR data. Similar

L. Cheng et al. / Optics Communications 286 (2013) 244–250 245
to Zhang et al. [11] algorithm, briefly called Zhang algorithm, theRIMM algorithm uses progressively changes of window sizes onmorphological operations. However, in comparison to Zhangalgorithm, this RIMM algorithm does not require the assumptionof a constant slope for dynamical calculation of height differencethreshold. Benefited by the reversed iteration strategy, a fixed andpredefined height difference threshold can effectively accomplishbuilding point detection for varied buildings, which makes theprocess simple. Furthermore, it guarantees the applicability of theproposed algorithm for various complicated real situations.
2. RIMM algorithm
The technical flow chart of the RIMM algorithm is shown in Fig. 1.A morphological opening operation with an initial window of largestlength in this iteration process is firstly applied to the raw data. Bygradually decreasing the window size, opening operations are theniteratively applied to the raw data. Building points are detected bycomparing the results between the adjacent iteration operations.
Fig. 2(a) shows a top view of LiDAR data in a region. Transectedby a line in Fig. 2(a), a profile of this data is illustrated in Fig. 2(b),
LiDAR Data
Morphological opening F
Morphological opening F
Iteration End
Reduce window size
at a step length
Reducewindow
sizeat
a step length
Window size <minimum threshold?
Determinewindow size
No
Yes
Fig. 1. Flow chart of the pro
building
Fig. 2. LiDAR data. (a) Top view, (b) A profile
including four main types of feature points: ground points,building points, sparse tree points, and dense tree points.Fig. 3(a) illustrates the initial window of length L0 (the largestwindow size in the reversed iteration), which is used for mor-phological opening operation. By applied the morphological open-ing with window L0 on Fig. 3(a), as shown in Fig. 3(b), almost allfeature points are filtered due to the sizes of features are smallerthan this window size. The filter also tends to over-removeground points with this large window size. The filtered resultsare shown as blue points in Fig. 3(b). Then the window size isdecreased from L0 to L1 (Fig. 3(c)) and an opening operation isperformed again as above. Because the window size is reduced,some objects with relatively large sizes are preserved; the objectsthat are smaller than the window size are still filtered. Thefiltered results are shown as the red points in Fig. 3(d). Weoverlay blue points in Fig. 3(b) and red points in Fig. 3(d) tocompare their height change in each location. The points arelabeled as non-ground points in Fig. 3(e), if their height differenceis larger than a fixed height difference threshold. For these labelednon-ground points in Fig. 3(e), we can find their correspondingplaces in Fig. 2(b). From the Fig. 2(b), these non-ground points inFig. 3(e) could be identified as dense tree points. Because the
iltering results
iltering results Keep points
Post-processing
Building regions
ComparisonFind points (height
difference>threshold)
Building points and dense tree points
posed RIMM algorithm.
sparse tree dense tree ground
of LiDAR data from a transect line in (a).

Window size L0 Window size L0 Window size L0
Window size L1 Window size L1 Window size L1Window size L1
Window size L2 Window size L2 Window size L2
building building
dense tree
Fig. 3. The process of RIMM algorithm. (a) Raw data (Fig. 2(b)) and initial window with a length of L0, (b)The results (blue points) by morphological opening on (a) with
window L0, (c) Decrease the length of window from L0 to L1, (d) The results (red points) by morphological opening on (c) with window L1, (e) Overlay blue points in (b) and
red points in (d) to detect the points (labeled), if their height differences are bigger than the threshold, (f) Remove the labeled point in (e) and decrease the length of
window from L1 to L2, (g) The results (cyan points) by morphological opening on (f) with window L2, (h) Overlay red points in (d) and cyan points in (g) to detect the points
(labeled), if their height differences are bigger than the threshold, and (i) The filtered results (red points) by multiple iteration. (For interpretation of the references to color
in this figure legend, the reader is referred to the web version of this article.)
L. Cheng et al. / Optics Communications 286 (2013) 244–250246
objective of RIMM algorithm is only to find building points, thisfixed height difference threshold is determined as the heightvalue of the lowest building. The reason of using gradually changedwindows is, under two windows with a small size change from L0 toL1, the corresponding change of terrain elevation is small, but thechange of non-ground object elevation is large. It imply that thesmall change of window sizes can separate the ‘‘abrupt change’’ and‘‘gradual change’’, since non-terrain objects such as buildingsusually have abrupt changes of elevation while the change ofterrain elevation is gradual.
The window size is decreased to L2 in Fig. 3(f) and anotheropening operation with this new window is performed on thedata in Fig. 3(f) (the labeled points before are not involved). Thefiltered results are shown as cyan points in Fig. 3(g). By comparingred points in Fig. 3(d) and cyan points in Fig. 3(g), the points arelabeled as non-ground points (building points), if their elevationdifference is larger than the same fixed height difference thresh-old, shown in Fig. 3(h). Similarly, this filtering process is iteratedas before until the window size is reduced to the minimumthreshold. By performing multiple iteration of morphologicalopening operation with gradually decreased window size frommaximum to minimum, the ‘‘abrupt change’’ non-ground pointscan be identified from the ‘‘gradual change’’ ground points.Fig. 3(i) illustrates the final filtered results. Fig. 4 gives an exampleof extremely complex scene for building point detection, whichcovers many dense trees with larger size than buildings. Features
(such as dense trees) that have the sizes between the maximumand minimum window size may be remained during the iterationprocess. A post-processing is introduced later to eliminate theseremained non-building points.
How to determine the thresholds (maximum window size,minimum window size, height difference, and step length) shouldbe discussed. All of these four thresholds are fixed and pre-defined threshold values. To determine these thresholds, we openLiDAR data (Fig. 6(a)) by using a LiDAR data processing software(e.g., a commerce software—Terrasolid Software). In a LiDAR dataprocessing software, it is easy to find the building with themaximum size, the building with the minimum size, and thelowest building in a region. The maximum window size threshold(106 m in this study) and minimum window size threshold (6 min this study) are assigned according to the maximum andminimum of the building sizes, respectively. The height value ofthis lowest building is taken as the height difference threshold(6 m in this study). The reason is discussed above. These threenumbers (106 m, 6 m, and 6 m) are obtained by measuring thecorresponding buildings size in software. In general, the laser-scanned objects include buildings, vehicles, trees and ground; andfew vehicles and trees are bigger than buildings in size. Therefore,controlled by these maximum and minimum size thresholds andthe height difference threshold, most of the filtered non-groundpoints are building points. For step length threshold, in theory, itshould be set as small as possible, because only the small

L. Cheng et al. / Optics Communications 286 (2013) 244–250 247
threshold can eliminate the influences of high-relief terrain initeration processes. The small change of window sizes canseparate the ‘‘abrupt change’’ and ‘‘gradual change’’. In general,the step length value cannot be larger than the height differencethreshold. On the other hand, too intensive iterations wouldreduce the efficiency of the processes. To keeping the balance ofthe two aspects, the step length threshold is determined as 5 m inthis study.
Compared to Zhang algorithm, the advantage of this RIMMalgorithm is the way to determine threshold, which is benefitedby the reversed iteration strategy. In Zhang algorithm, the same
Fig. 4. The building point detection results in an example of extremely complex scen
(b) The detected building points and dense tree points (Dense trees that have the sizes b
eliminated later during the post-processing).
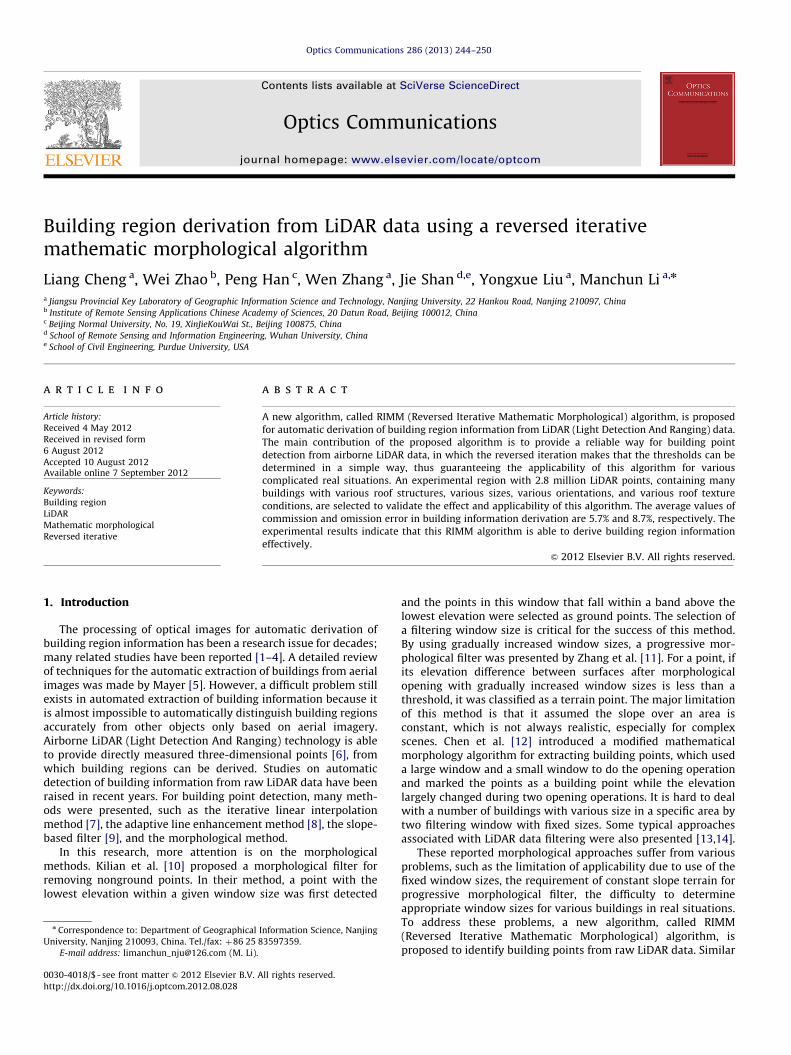
Fig. 5. Post-processing of RIMM. (a) The segmentation results based on roughness (Ligh
mathematical morphological filtering (building points shown as red, non-building poin
filtering, and (d) The final results of building point detection. Note that the aerial image i
of the references to color in this figure legend, the reader is referred to the web versio
thresholds (window size, elevation difference, etc) shouldbe determined. The window size threshold and elevation differ-ence threshold are dynamically calculated by a complicatedway in each iteration process. Furthermore the elevation differ-ence threshold should be determined based on the assumption ofa constant topography slope in the study area. Also the maximumelevation difference threshold should be set to a fixed heightin Zhang algorithm. In this proposed algorithm, we justneed to determine the fixed thresholds at beginning of iterationprocesses and also does not require the assumption of aconstant slope.
e covering many dense trees (without post-processing). (a) Raw LiDAR data, and
etween the maximum and minimum window size may be remained, which will be
t yellow indicates high value, dark yellow indicated low value), (b) The results by
ts shown as green, an aerial image overlain as background), (c) The results by area
s shown only for background and is not involved in this process. (For interpretation
n of this article.)
L. Cheng et al. / Optics Communications 286 (2013) 244–250248
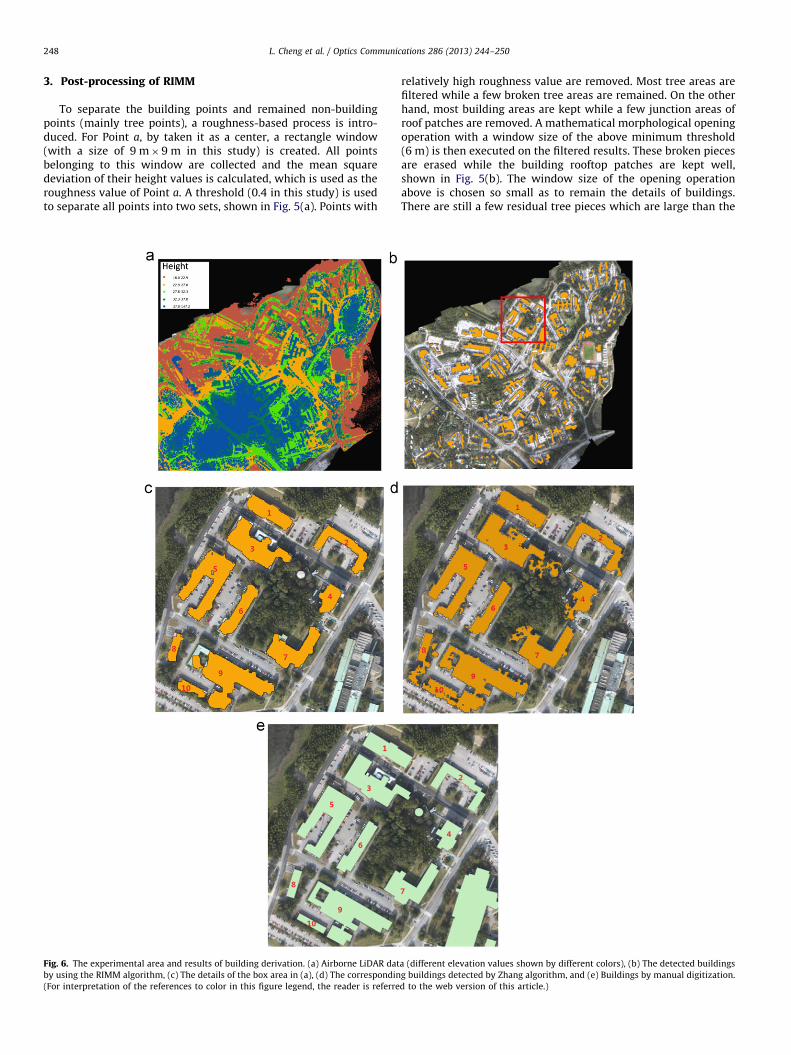
3. Post-processing of RIMM
To separate the building points and remained non-buildingpoints (mainly tree points), a roughness-based process is intro-duced. For Point a, by taken it as a center, a rectangle window(with a size of 9 m�9 m in this study) is created. All pointsbelonging to this window are collected and the mean squaredeviation of their height values is calculated, which is used as theroughness value of Point a. A threshold (0.4 in this study) is usedto separate all points into two sets, shown in Fig. 5(a). Points with
Fig. 6. The experimental area and results of building derivation. (a) Airborne LiDAR dat
by using the RIMM algorithm, (c) The details of the box area in (a), (d) The correspondin
(For interpretation of the references to color in this figure legend, the reader is referre
relatively high roughness value are removed. Most tree areas arefiltered while a few broken tree areas are remained. On the otherhand, most building areas are kept while a few junction areas ofroof patches are removed. A mathematical morphological openingoperation with a window size of the above minimum threshold(6 m) is then executed on the filtered results. These broken piecesare erased while the building rooftop patches are kept well,shown in Fig. 5(b). The window size of the opening operationabove is chosen so small as to remain the details of buildings.There are still a few residual tree pieces which are large than the
a (different elevation values shown by different colors), (b) The detected buildings
g buildings detected by Zhang algorithm, and (e) Buildings by manual digitization.
d to the web version of this article.)

Table 1The commission and omission of building information derivation.
Building
ID
Ground reference data
(m2)
Detected area (m2) Overlapped area (m2) Commission (%) Omission (%)
RIMM
algorithm
Zhang
algorithm
RIMM
algorithm
Zhang
algorithm
RIMM
algorithm
Zhang
algorithm
RIMM
algorithm
Zhang
algorithm
1 1911.96 1799.95 1890.46 1770.06 1802.98 1.7 4.6 7.4 5.7
2 1843.09 1808.81 1984.51 1688.2 1719.60 6.7 13.3 8.4 6.7
3 3394.22 3345.27 4256.66 3177.87 3231.30 5.0 24.1 6.4 4.8
4 1182.08 1073.49 1465.31 1033.35 1042.60 3.7 28.8 12.6 11.8
5 4159.17 3984.97 4162.44 3855.98 3834.76 3.2 7.9 7.3 7.8
6 1698.25 1678.06 1779.69 1586.31 1608.24 5.5 9.6 6.6 5.3
7 2691.43 2647.84 3091.08 2508.03 2594.54 5.3 16.1 6.8 3.6
8 622.32 592.19 1207.71 547.72 551.38 7.5 54.3 12.0 11.4
9 5145.34 4877.76 5461.82 4523.95 4857.20 7.2 11.1 12.1 5.6
10 533.03 619.99 1018.01 461.59 461.60 25.5 54.7 13.4 13.4
Total 23,180.88 22,428.33 26,317.69 21,153.06 21,704.19 – – – –
Average – – – – – 5.7 22.5 8.7 7.6
L. Cheng et al. / Optics Communications 286 (2013) 244–250 249
window size (6 m�6 m), which can be removed with an areathreshold, since their areas are much smaller than rooftop patches.
Before performing the area calculation, points must be clus-tered according to the common attribute value. A twice-scanningprocedure is introduced for this point clustering. Firstly, each rowof the data is scanned from up to down. If a point has threemarked neighboring points (up, left, and right), it is marked witha same label. Otherwise, it is marked with a new label. Secondly,each column of the data is scanned from left to right, the adjacentregion even with different labels are connected. Fig. 5(c) illus-trates the results by area filtering. Furthermore, the missedjunction parts of roof patches are recovered. For a non-buildingpoint, it will be marked as a building point, if it has two buildingpoint neighbors on more than two directions with a distance (twotimes average point spacing, 2 m in this study). The buildingrecovery is then performed by checking each non-building point.Fig. 5(d) illustrate the final results of building point detection.
4. Evaluation
An experimental region with an area of 2000 m�2000 m,containing many buildings with different roof structures, differ-ent sizes, different orientations, and different roof texture condi-tions, are selected to validate the effect and applicability of thisalgorithm. Fig. 6(a) shows airborne LiDAR data, which haveaverage point spacing of 1.0 m, with a horizontal accuracy of0.3 m and a vertical accuracy of 0.15 m. 2.8 million LiDAR pointsare in Fig. 6(a). In addition, true-orthophoto is available forchecking quality of the derived buildings.
We implement the RIMM algorithm by using Microsoft VisualStudio C# and GDAL library. A Lenovo desktop computer(2.66 GHz CPU, 4 G Memory) is used to process the 2.8 millionLiDAR points by the implemented algorithm, by which theprocess time is about 20 min. Fig. 6(b) illustrates the results ofbuilding point detection in the experimental area. By overlayingthe results and the true-orthophoto, most buildings are effectivelyextracted and the overall visual appearance is satisfactory.
A quantitative analysis is discussed in a local region (the boxarea in Fig. 6(a)) by comparing this RIMM algorithm and Zhangalgorithm. Fig. 6(c) and (d) illustrate the results derived by RIMMalgorithm and Zhang algorithm, respectively. The buildings at thisplace that manually digitized based on the true-orthophoto aretaken as reference data (Fig. 6(e)). The commission and omissionare used to evaluate the effect of building detection. For abuilding, the real area and detected area can be computed from
the manual digitization results and automatic detection results,respectively. Furthermore, the overlapped area can be computedby overlaying the manual digitization results and automaticdetection results. The commission and omission can be calculatedusing Eq. (1), respectively.
commission¼ 1�ðoverlapped area=detected truthÞ
omission¼ 1�ðoverlapped area=ground truthÞ ð1Þ
Table 1 list the detailed values, including ground reference data,detected area, overlapped area, commission, and omission. Theaverage values of commission and omission error by using RIMMalgorithm are 5.7% and 8.7%, respectively. The average values ofcommission and omission error by using Zhang algorithm are22.5% and 7.6%, respectively. From this comparison, two algo-rithms obtain the similar values in omission error. However,compared to RIMM algorithm, Zhang algorithm results in a muchhigher value in commission error.
5. Conclusion
To automatically derive accurate building region informationwith reliable structures and accurate geometric position, a newRIMM algorithm is proposed in this study. The main contributionof the proposed algorithm is to provide a simple and reliable waybuilding point detection from raw LiDAR data, in which thereversed iteration makes that the thresholds can be determinedin a simple way, thus guaranteeing the applicability of thisalgorithm for various complicated real situations. Further studiesmay be performed in integrating airborne LiDAR and opticalimagery for building information derivation.
Acknowledgments
This work is supported by the National 973 Project (Grant No.2012CB719904), the National Natural Science Foundation ofChina (Grant No. 41001238). Sincere thanks are given for thecomments and contributions of anonymous reviewers and mem-bers of the Editorial team.
References
[1] M. Herman, T. Kanade, Readings in Computer Vision (1987) 471.[2] J.C. McGlone, J.A. Shufelt, Projective and Object Space Geometry for Mono-
cular Building Extraction, in: Proceedings of the IEEE Computer SocietyConference on Computer Vision and Pattern Recognition, 1994, pp. 54–61.

L. Cheng et al. / Optics Communications 286 (2013) 244–250250
[3] F. Xu, X. Niu, R. Li, Automatic Recognition of Civil Infrastructure ObjectsUsing Hopfield Neural Networks, in: ASPRS Annual Conference, 2002,pp. 18–26.
[4] R. Mohan, R. Nevatia, IEEE Transactions on Pattern Analysis and MachineIntelligence 11 (11) (1989) 1121.
[5] H. Mayer, Computer Vision and Image Understanding 74 (2) (1999) 138.[6] F. Ackermann, ISPRS Journal of Photogrammetry and Remote Sensing
54 (2–3) (1999) 64.[7] K. Kraus, N. Pfeifer, ISPRS Journal of Photogrammetry and Remote Sensing
53 (4) (1998) 193.[8] H.S. Lee, N.H. Younan, IEEE Transactions on Geoscience and Remote Sensing
41 (9) (2003) 2063.
[9] G. Vosselman, International Archives of Photogrammetry and Remote Sen-sing 33 (B4) (2000) 958.
[10] J. Kilian, N. Haala, M. Englich, International Archives of Photogrammetry andRemote Sensing 31 (B3) (1996) 383.
[11] K. Zhang, S. Chen, D. Whitman, L. Shyu, J. Yan, C. Zhang, IEEE Transactions onGeoscience and Remote Sensing 41 (4) (2003) 872.
[12] Q. Chen, P. Gong, D. Baldocchi, G. Xie, Photogrammetric Engineering &Remote Sensing 73 (2) (2007) 175.
[13] H.G. Maas, G. Vosselman, ISPRS Journal of Photogrammetry and RemoteSensing 54 (2–3) (1999) 153.
[14] G. Sithole, G. Vosselman, ISPRS Journal of Photogrammetry and RemoteSensing 59 (1–2) (2004) 85.