Embed Size (px)
Citation preview

Building Large Storage Based On Flash Disks Ilia Petrov, Guillermo G. Almeida, Alejandro P. Buchmann
Databases and Distributed Systems Group Department of Computer Science Technische Universität Darmstadt
{petrov | ggomez | buchmann}@dvs.tu-darmstadt.de
Ulrich Gräf, Principal Sales Consultant
Oracle Germany
ABSTRACT Flash SSDs are a technology that has the potential of drastically changing the architecture of a DBMS. In this paper we examine the properties of a storage space built on SSDs with RAID and how these affect data intensive systems. While we observed the expected performance improvements of one to two orders of magnitude of SSD-only storage over HDD storage, RAID-SSD systems showed interesting effects and large performance degradation: (a) the SSD read-write asymmetry and the write behavior are amplified due to RAID; (b) scalability issues in a RAID-based storage system appear because of inadequate controllers; (c) fragmentation and distribution issues affect performance much more than expected.
1. INTRODUCTION Flash Solid-State Disks (SSDs) are a disruptive technology, that has the potential of changing the established principles of DBMS architecture. Both Flash SSDs (under SSD we mean an enterprise-class, Flash NAND SLC SSD) and Hard Disk Drives (HDD) support the same block device interface standards, which makes simple replacement deceitfully easy. In comparison (Table 1), SSDs exhibit low latency (especially for small block sizes) and very high random throughput (IOPS–Input/Output Operations Per Second). All of these are 10 to 100 times better than the respective HDD values. Furthermore, the sequential throughput of an enterprise SSD is also high.
These properties represent a very good match to what is needed by data-intensive systems such as databases [4]. Their IO requirements on the storage can be summarized as follows: (i) large and reliable; (ii) fast (high sequential bandwidth, high random throughput); (iii) able to handle parallelism (parallel requests from multiple processes); (iv) fault tolerant; (v) easy to administer. Data intensive systems will rarely work with single disks because of their small volume and low reliability. RAID technology (Redundant Array of Independent Disks) [1,2] is instrumental for creating large, reliable and fast storage, built out of many independent drives. While the properties of single Flash SSDs have been well studied [9,10,11], the research community has paid little attention to SSDs in RAID configurations. A simple performance comparison of a single SSD and a RAID 0 configuration over two SSDs is shown in Table 1. The general expectation is that the performance of RAID 0 will be twice as high as one SSD.
Dev
ice
Seq
. Rea
d #
[
MB
/s] (
128K
)
Seq
. Writ
e #
[MB
/s](1
28K
)
Ran
d. R
ead
[ms]
(4K
B) +
Ran
d. W
rite
[ms]
(4K
B) +
Rea
d IO
PS
(4
KB
) #
Writ
e IO
PS
(4
KB
) #
Pric
e [€
/GB
]
Pric
e/R
ead
IO R
IO/€
] P
rice/
Writ
e IO
[WIO
/€]
E. HDD 160 160 3.2 3.5 310 280 2.5 1.1 1
E. SSD 250 170/120* 0.075 0.085 35000 3300 10 56 5.3
RAID0, 2xE.SSD
422 631/83* 0.375 0.458 24371 2035 19 13 1.1
Table 1: Comparison of enterprise HDDs, SSDs (according to the specifications) and a RAID 0 with two SSDs, 64KB stripe
unit size. (*- write cache off; + - queue depth 1; #- queue depth 32; RIO –Read IOPS; WIO – Write IOPS)
However, the measured performance falls short of this expectation (even at the best performing RAID level). Clearly the RAID benefits come at a high cost in SSD performance. The random IO throughput (IOPS) is approx. 30% lower than that of a single SSD. The sequential read throughput (MB/s) is better than that of a single SSD. The sequential write throughput seems good at first glance, but that is entirely due to the RAID controller’s write cache.
In this paper we research the observed performance loss. We quantify the SSD RAID performance, identify bottlenecks and look for solution alternatives: • We compare different RAID configurations. • We study the properties of these configurations: access
time, sequential and random throughput, and analyze those for the typical access patterns (random read/write, sequential read/write).
• We investigate the performance penalties incurred through the RAID technology and observe that the RAID controller cannot handle more than a few SSDs and scale; therefore it is the IO bottleneck; the well known rules-of-thumb get distorted.
• We propose a set of solution alternatives based on a combination of hardware and software RAID: we demonstrate that the optimal solution is several RAID controllers each with a few SSDs and software RAID on top. Nonetheless, the ideal solution would be specialized RAID controllers built specifically for Flash SSDs.
2. RAID RAID is a key and well-studied component of contemporary storage systems [1,2,12]. Depending on the redundancy and distribution mechanism there are multiple RAID levels [2] (0 through 6, and combinations). RAID 0 – non-redundant

disk array employing striping; relevant for computing environments where the high performance and capacity are more important than reliability. RAID 1 employs mirroring as redundancy scheme; whereas RAID 10/01 divides discs into sub-arrays, employs striping across sub-arrays and mirroring within sub-arrays. Both RAID1 and RAID10/01 are relevant for IO intensive OLTP applications. RAID 5 – block-interleaved distributed parity - is used for read-mostly applications with large data volumes (e.g. Data Warehousing) or high data volume streaming applications (seq. write/read): random writes represent a significant bottleneck. Table 2 presents a simple analytical comparison in terms of IO patterns, according to the throughput/cost ratio and the number of individual requests. The cost is proportional to the number of disks. The throughput/cost ratio is a metric for the number of disks involved in the execution of a request from the respective request pattern. For example a small random write request on RAID10 yields a synchronized write on the two mirrored disks in the respective sub-array. Hence throughput/cost=1/2.
RAID 0 RAID 1 RAID 5 RAID10 T/C R T/C R T/C R T/C R
Small rand. read 1 1 1 1 1 1 1 1 Small rand. write 1 1 1/2 2 1/4 4 1/2 2 Large seq. read 1 D 1 D 1 D 1 D Large seq. write 1 D 1/2 2D (D-1)/D D+1 1/2 2D Storage efficacy 1 1/2 (D-1)/D 1/2 Table 2: Simplified throughput/cost comparison of different
RAID levels. (D-number of disks in RAID array; T/C- Throughput/Cost; R- number of internal requests)
Based on the present body of research and the above analytical model the following conclusions can be drawn:
1. From Table 2 and [2] follows that writes (especially small random writes) are not a strength of RAID systems. In combination with the SSD properties (Section 4) this opens room for improvement.
1. As pointed out in [2] RAID5 is supposed to be four times worse than RAID0 for small writes.
2. In RAID10/01 and RAID1 writes generate twice as many synchronized single disk write requests.
2. In [2] it is also assumed that the performance of throughput-oriented RAID systems scales linearly with the number of devices. For HDD based arrays this is perfectly valid because in practice the single disk performance is the bottleneck.
3. In some RAID configurations single disk requests need to be coordinated to execute a RAID request. Its latency is susceptible to the maximum device latencies and correlates to the number of disks participating in a request. This is especially true for small writes (cf. 1.2).
4. To ensure comparable results for different RAID configurations use arrays with comparable effective volumes under the same workload [2].
3. TEST SETUP, WORKLOADS AND EXPERIMENTAL SEARCH SPACE The tests performed throughout this paper have been done on two machines. Machine A has Intel Core 2 Duo E8400 3GHz CPU with 4 GB RAM. Machine B is a 16 core server (four quad-core 2.3 GHz processors) with 64GB RAM and three enterprise-level RAID controllers with 512MB cache, and eight 10K RPM SAS HDDs with 16MB cache. The RAID controllers are Adaptec Series 5 (5085) with the following characteristics: PCIe x8 interface, dual-core 1.2 GHz RAID-on-a-chip, 512MB controller cache; support for 8 directly connected SAS devices (up to 256 through SAS expander). For economic reasons we performed experiments only with one type of RAID controllers. An analysis of the currently available controllers would show that (except for caching) they are compatible. However to ensure broad applicability of our findings we are in the process of validating our findings with other enterprise RAID controllers. Both machines run Windows 2008 Server R2. In addition we use an array of Intel X25-E/64GB enterprise SSDs. The single disk experiments (Section 4) are performed on machine A, the RAID experiments (Section 5) on machine B. As benchmark we use IOMeter 2008.06.18 [6], because it can be instrumented to generate wide range of workloads. The latency, sequential and random throughput results (for workload (b) – see below) have been validated with Oracle Orion [7], to ensure database validity. All tests are done on raw devices/volumes (unless mentioned otherwise) to eliminate the influence of the file system.
Workloads. We instrumented IOMeter with three types of workloads: a. workload latency - single requests, one load generator
(worker), queue depth 1. It is used to measure the latency on a single drive and RAID configurations;
b. workload light - one worker, 32 queue depth. It is used to measure the performance of a single drive or a lightly loaded RAID system;
c. workload heavy - ten workers with queue depth of 16. It is used to measure the maximum performance of a heavily loaded RAID system. We always use stripe unit size of 64KB and enabled
read and write caches. The software RAID experiments have been performed using the built-in Windows software RAID.
Experimental search space. We aim to study the characteristics of SSD storage space built on RAID: sequential and random throughput as well as latency. Hence we cover the following experimental space using the workloads and the setup described above. (i) We study the single SSD throughput and latency characteristics with latency and light workloads. Based on these we can explain

the behavior of SSD RAID systems. (ii) In a latency experiment we perform a comparative study of the latencies of different RAID configurations with the latency and light workloads. (iii) In a set of throughput experiments we study the sequential and random throughput of different RAID configurations. One question is to determine the maximum performance of a heavily loaded system using workload heavy and investigate RAID controller saturation. We examine also a lightly loaded system with workload light. Another question is to examine the throughput of different RAID level configurations for the same effective volume (for comparability) or for the same number of drives. (iv) In a scalability experiment we study the scalability of RAID the controllers while varying number of attached SSDs (verify conclusion (2) Section 2). 4. ENTERPRISE FLASH SSDs The performance exhibited by Flash SSDs is significantly better than that of HDDs (Table 1): low latency (Table 3.); very high random throughput (Figure 1); acceptable sequential performance (Figure 2); low power consumption. Flash SSDs, however, are not merely a faster alternative to HDDs; just replacing them does not yield optimal performance. Their specifics are due to the intrinsic characteristics of the NAND memory and their internal organization [9]. Below we shortly summarize them.
Figure 1: Random throughput (IOPS) of a single SSD
Figure 2: Sequential throughput (MB/s) of a single SSD
(a) asymmetric read/write performance – the read performance is significantly better than the write performance – up to an order of magnitude (Figure 1, Figure 2). This is a result of the internal organization of the NAND memory, which comprises two types of structures: pages and blocks. A page (typically 4/2 KB) is a read and write
unit. Pages are grouped into blocks of 32/128 pages (128/512KB). NAND memories support three operations: read, write, erase. Reads and writes are performed on a page-level, while erases are performed on a block level. Before performing a write, the whole block containing the page must be erased, which is a time-consuming operation. The respective raw latencies are: read-55µs; write 500µs; erase 900µs. In addition, writes should be evenly spread across the whole volume (see longevity). Hence no write in-place as on HDDs (see FTL).
Write Cache (WC)-ON Write Cache-OFF Sequential Read (SR) 53 µs max 12.29 ms –
Sequential Write (SW) 59 µs max 94.82 ms 455 µs Random Read (RR) 167 µs max 12.41 ms –
Random Write (RW) 113 µs max 100.68 ms 435 µs Table 3: Avg/Max latency of an enterprise SSD, block size 4K
(b) excellent random read throughput (IOPS) – especially for small block sizes. Small random reads are up to hundred times faster than on an HDD (Table 1). The good small block performance (4KB, 8KB) affects the present assumptions of generally larger database page sizes.
(c) acceptable random write throughput – small random writes are five to ten times slower than reads (Figure 1). Nonetheless, the random write throughput is an order of magnitude better than that of an HDD (Table 1). Due to the internal organization (write/erase cycle), random writes are an issue not only in terms of performance but also in terms of long-term effects due to fragmentation.
(d) very good sequential read/write transfer. It is commonly assumed that HDDs are better for sequential operations. The newer generations of SSDs improve significantly (Table 1). Sequential operations are also asymmetric (Figure 2). However due to read ahead, write back and good caching the asymmetry is reduced (below 25%).
Mixed loads (read/write ratios and sequential/random ratios other than 100% or 0%, Figure 3) exhibit worse performance than pure ones due to: (i) the sequential pattern detection overhead for read ahead; and (ii) read/write asymmetry. These statements are best illustrated with a short example: consider the case of 33% read and 0% randomness (i.e. 33% of all requests are sequential reads, 67% of all requests are sequential writes); the throughput amounts to 6605 IOPS. An attempt to derive this value from the respective pure loads (100% read, 0% random=25274 and 0% read, 0% random=22559) would yield 0.33*25274 + 0.67*22559 = 23454 IOPS, which is far better than the measured 6605.
(e) longevity – a memory cell can be rewritten a fixed number of times (between 100K and 1M); hence special wear-leveling algorithms are employed to increase the Mean Time Between Failures (MTBF) [9,10] to – 2x10⁶ hours.
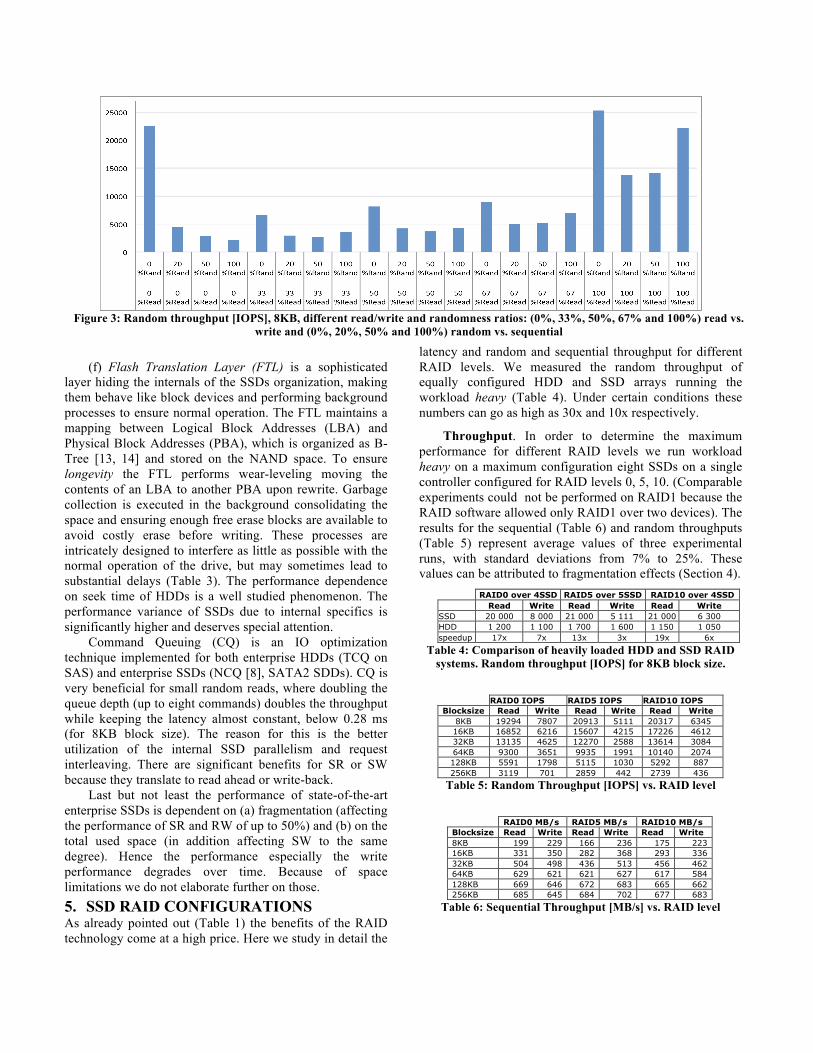
Figure 3: Random throughput [IOPS], 8KB, different read/write and randomness ratios: (0%, 33%, 50%, 67% and 100%) read vs.
write and (0%, 20%, 50% and 100%) random vs. sequential
(f) Flash Translation Layer (FTL) is a sophisticated
layer hiding the internals of the SSDs organization, making them behave like block devices and performing background processes to ensure normal operation. The FTL maintains a mapping between Logical Block Addresses (LBA) and Physical Block Addresses (PBA), which is organized as B-Tree [13, 14] and stored on the NAND space. To ensure longevity the FTL performs wear-leveling moving the contents of an LBA to another PBA upon rewrite. Garbage collection is executed in the background consolidating the space and ensuring enough free erase blocks are available to avoid costly erase before writing. These processes are intricately designed to interfere as little as possible with the normal operation of the drive, but may sometimes lead to substantial delays (Table 3). The performance dependence on seek time of HDDs is a well studied phenomenon. The performance variance of SSDs due to internal specifics is significantly higher and deserves special attention.
Command Queuing (CQ) is an IO optimization technique implemented for both enterprise HDDs (TCQ on SAS) and enterprise SSDs (NCQ [8], SATA2 SDDs). CQ is very beneficial for small random reads, where doubling the queue depth (up to eight commands) doubles the throughput while keeping the latency almost constant, below 0.28 ms (for 8KB block size). The reason for this is the better utilization of the internal SSD parallelism and request interleaving. There are significant benefits for SR or SW because they translate to read ahead or write-back.
Last but not least the performance of state-of-the-art enterprise SSDs is dependent on (a) fragmentation (affecting the performance of SR and RW of up to 50%) and (b) on the total used space (in addition affecting SW to the same degree). Hence the performance especially the write performance degrades over time. Because of space limitations we do not elaborate further on those. 5. SSD RAID CONFIGURATIONS As already pointed out (Table 1) the benefits of the RAID technology come at a high price. Here we study in detail the
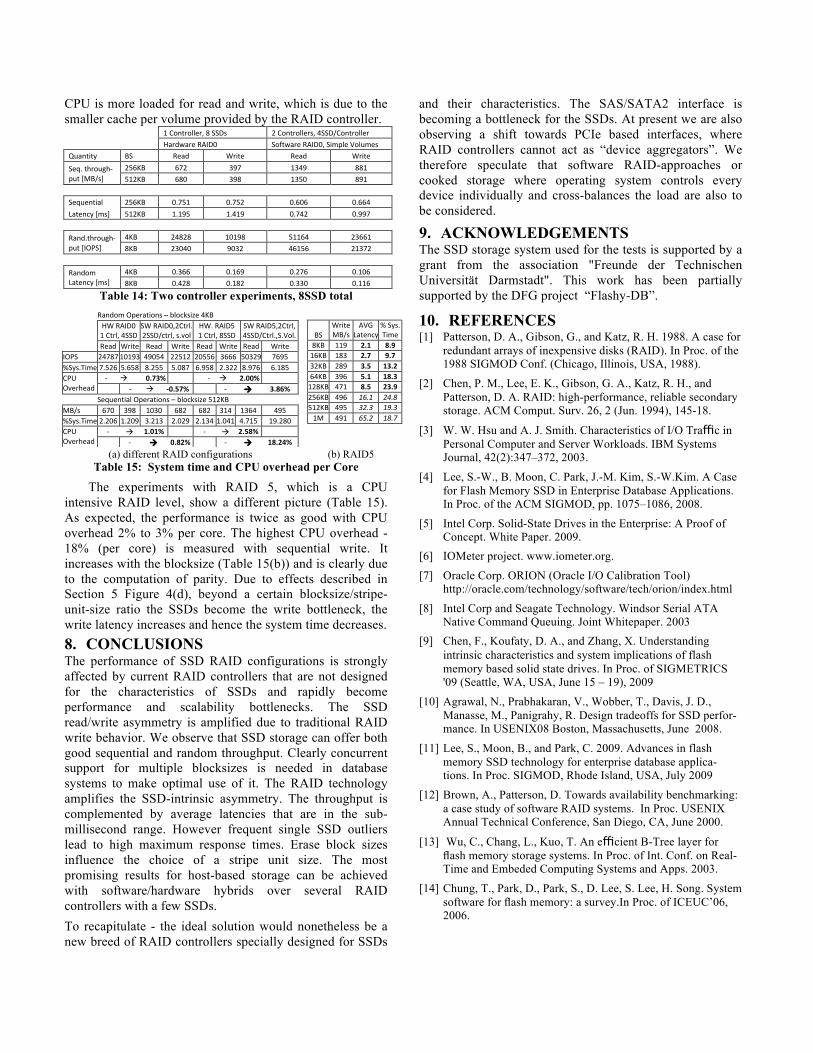
latency and random and sequential throughput for different RAID levels. We measured the random throughput of equally configured HDD and SSD arrays running the workload heavy (Table 4). Under certain conditions these numbers can go as high as 30x and 10x respectively.
Throughput. In order to determine the maximum performance for different RAID levels we run workload heavy on a maximum configuration eight SSDs on a single controller configured for RAID levels 0, 5, 10. (Comparable experiments could not be performed on RAID1 because the RAID software allowed only RAID1 over two devices). The results for the sequential (Table 6) and random throughputs (Table 5) represent average values of three experimental runs, with standard deviations from 7% to 25%. These values can be attributed to fragmentation effects (Section 4).
RAID0 over 4SSD RAID5 over 5SSD RAID10 over 4SSD Read Write Read Write Read Write SSD 20 000 8 000 21 000 5 111 21 000 6 300 HDD 1 200 1 100 1 700 1 600 1 150 1 050 speedup 17x 7x 13x 3x 19x 6x
Table 4: Comparison of heavily loaded HDD and SSD RAID systems. Random throughput [IOPS] for 8KB block size.
RAID0 IOPS RAID5 IOPS RAID10 IOPS Blocksize Read Write Read Write Read Write
8KB 19294 7807 20913 5111 20317 6345 16KB 16852 6216 15607 4215 17226 4612 32KB 13135 4625 12270 2588 13614 3084 64KB 9300 3651 9935 1991 10140 2074 128KB 5591 1798 5115 1030 5292 887 256KB 3119 701 2859 442 2739 436
Table 5: Random Throughput [IOPS] vs. RAID level
RAID0 MB/s RAID5 MB/s RAID10 MB/s Blocksize Read Write Read Write Read Write 8KB 199 229 166 236 175 223 16KB 331 350 282 368 293 336 32KB 504 498 436 513 456 462 64KB 629 621 621 627 617 584 128KB 669 646 672 683 665 662 256KB 685 645 684 702 677 683
Table 6: Sequential Throughput [MB/s] vs. RAID level

Clearly workload heavy saturates the controller. Under such conditions the random throughput of all RAID levels is similar (Table 5). It is also evident that random read/write asymmetry exists in SSD RAID configurations with read-to-write ratios similar to that of single SSDs. The random and sequential throughput is below the expected value (the sum of single SSD throughputs is higher) hence there is a bottleneck along the IO chain. This contradicts the assumption that the performance of throughput oriented systems scales linearly with the number of drives (assumption (2), Section 2). The sequential write performance is surprisingly a bit better, which is entirely due to RAID controller battery powered cache. We performed the very same experiment on arrays of fixed effective volume of approx. 240GB. This means 4SSD for RAID0, 5 for RAID5 and 8 for RAID10. We obtained very similar results, which indicates scalability problems. We investigate this claim in Section 6.
Random Throughput [IOPS] 1 SSD RAID0 4SSD RAID5 5SSD RAID10 8SSD BS Read Write Read Write Read Write Read Write 4KB 35511 5953 24787 10193 20639 5291 24396 7468 8KB 22738 4833 20987 6289 19255 3732 22273 4652 16KB 12743 3665 20054 4135 16718 2482 16320 4144 32KB 5646 1141 14376 3218 13423 1908 12868 3083 64KB 2804 292 9042 2250 7966 1243 8939 1775 128KB 1650 148 4850 1185 5018 591 5147 921 256KB 721 85 2484 556 2584 303 2619 475
Table 7: Random throughput workload light, volume=240GB
Sequential Throughput [MB/s] 1 SSD RAID0 4SSD RAID5 5SSD RAID10 8SSD BS Read Write Read Write Read Write Read Write 8KB 196 110 291 295 210 110 343 117 16KB 239 159 482 311 427 175 445 173 32KB 248 177 614 351 524 218 588 221 64KB 248 184 681 372 640 265 685 249 128KB 252 190 678 382 673 300 688 274 256KB 252 190 672 397 671 323 690 295 512KB 252 190 670 398 679 346 692 313 1024KB 252 190 665 398 683 348 690 311
Table 8: Sequential throughput, workload light, volume=240GB
For a fair RAID comparison we re-measured the throughput, on fixed effective volume configurations (vol.=240GB) with workload light (Table 7, Table 8). For comparison we also show the single SSD data. Workload light loads the system only moderately, in terms of outstanding IO operations (only 4 per SSD) and in terms of parallelism (single worker/load generator instead of ten). The results show that (a) the general RAID comparison conclusions apply (cp. Table 2) but the SSD-intrinsic asymmetry is also to be considered. For instance RAID5 offers the worst random write but a good random read performance; RAID 0 offers the best performance followed by RAID10. (b) severe scalability issues occur because single SSD outperforms a RAID5 configuration over 5 SSDs. The throughput exhibits clear asymmetry. Even with light load the read throughput of all configurations is comparable, which indicates saturation (Section 6).
Striping. Using the maximum performance workload heavy we went on to perform RAID0 experiments to determine a reasonable stripe unit size (Figure 4). The general principles of stripe size selection [1,2] hold: (a) lower stripe unit size yields higher transfer performance; (b) larger stripe size results in more requests executed in parallel.
Two conclusions can be drawn based on Figure 4: (1) Clearly there is less performance improvement from increasing the stripe size beyond a certain limit (the curves on all graphs flatten); (2) Sequential writes of block sizes larger than the erase block size (128KB and 256KB) deteriorate with larger stripe sizes. Our explanation for this is that the stripe unit size (which is the amount of data read and written to and from a single SSD for this type of sequential operations) hits the boundary of an erase block. Hence, a single stripe-unit write results into several sequential writes on the same SSD which lowers the performance significantly. With smaller stripe unit sizes the writes will be spread across multiple devices. The same effect occurs in the random case; due to the randomness the load is equally balanced on all SSDs hence there is no performance penalty. Thus empirically stripe-unit sizes such as 64KB (lower than an erase block size) seem optimal for SSD RAIDs.
Latency. Finally, we investigate the response times (Table 9 and Table 10) for random and sequential read and write operations using workload latency on fixed volume configurations to ensure the comparability of results. As a baseline we provide the single SSD latencies for the same workload (and Table 2 for the number of requests). Generally, in RAID configurations we observe sub-millisecond random latencies, which is a significant performance improvement over HDD configurations. 1 SSD RAID0 4SSD RAID5 5SSD RAID10 8SSD
BS Write Read Write Read Write Read Write Read 4KB 0.125 0.161 0.204 0.353 0.457 0.377 0.233 0.302 8KB 0.424 0.250 0.220 0.429 0.427 0.442 0.239 0.369 16KB 0.477 0.294 0.254 0.485 0.468 0.494 0.279 0.420 32KB 0.491 0.374 0.353 0.560 0.645 0.565 0.384 0.502 64KB 0.964 0.558 0.572 0.692 0.938 0.703 0.624 0.632 128KB 1.998 0.797 0.956 0.848 1.754 0.872 1.050 0.788 256KB 4.145 1.557 1.737 1.015 3.210 1.045 1.789 0.953
Table 9: Average latency of random operations in[ms].
Table 9 shows that small random writes are less expensive than small random reads (except for RAID5) due to the write-back functionality of the controller. This tendency is reverted for block sizes larger than a stripe-unit size (64KB) because of the coordinated operations on different drives. Since a read request is served by a single drive (block size less than a stripe-unit size), we can gauge the controller overhead by subtracting the read latency from that of a single drive. The read overhead is around 0.2 ms, which is substantial compared to single drive latencies. Due to the write-back functionality of both the controller and the drives it is difficult to draw precise conclusions about the write latency.

(a) Stripe size vs. Random Read (b) Stripe size vs. Random Write
(c) Stripe size vs Sequential Read (d) Stripe size vs Sequential Write
Figure 4: Sequential and random throughput vs. stripe unit size
While the average latencies are very low, the measured maximum latencies are surprisingly high and frequent. They range between 200ms and 450ms and are due to single SSD outliers (Table 3) and RAID request synchronization (Sec. 2, 4). Sequential latencies (Table 10) are naturally lower than the random latencies due to read-ahead and write-back.
1 SSD RAID0 4SSDs RAID5 5SSDs RAID10 8SSDs BS Write Read Write Read Write Read Write Read 8KB 0.072 0.064 0.153 0.237 0.154 0.275 0.107 0.178 16KB 0.107 0.093 0.178 0.271 0.181 0.345 0.130 0.213 32KB 0.173 0.152 0.229 0.336 0.240 0.472 0.180 0.284 64KB 0.329 0.282 0.327 0.467 0.335 0.663 0.282 0.412 128KB 0.653 0.529 0.474 0.535 0.497 0.742 0.431 0.485 256KB 1.308 1.062 0.743 0.743 0.808 0.910 0.783 0.694 512KB 2.632 2.115 1.382 1.168 1.587 1.443 1.567 1.169 1024KB 5.314 4.249 2.742 2.032 3.170 2.367 3.201 2.058
Table 10: Average latency of sequential operations in [ms]. The overhead varies depending on the RAID level. For RAID0 it is 0.18ms. Due to the write cache and write-back for block sizes smaller than the stripe-unit size the write latency is lower than the read latency. The maximum sequential latencies are between
100ms and 200ms again due to single SSD outliers and RAID request synchronization.
6. SCALABILITY The results discussed in Section 5 (and substantiated by others [5]) indicate that the RAID controller is (a) the performance bottleneck and that (b) it exhibits scalability issues. In this section we investigate these two claims.
Clearly there is a bottleneck along the IO chain, which may either be the RAID controller or the PCIe bus. An experiment was designed to investigate this. Machine B has 8-lane PCIe ports with theoretical throughput of 20Gb/s (PCIe is optimized for high data transfer rates). We determined the effective throughput on the PCIe bus using DTrace under OpenSolaris 2009, measuring the PCIe utilization for sequential (1MB) and random (0.5KB) reads with workload light over four SSDs (Table 11). The results show that: (a) the PCIe bus is utilized below 50% of its capacity; and (b) the SSDs can ideally provide more throughput. Thus the controller is the bottleneck.
0
5000
10000
15000
20000
25000
30000
16K 64KB 1024KB
Random
throughput[IOPS]
StripeSize8KB 16KB 32KB64KB 128KB 256KB
010002000300040005000600070008000900010000
16K 64KB 1024KB
Random
throughput[IOPS]
StripeSize
8KB 16KB 32KB64KB 128KB 256KB
100200300400500600700800
16K 64KB 1024KB
Sequentualthroughput[MB/s]
StripeSize
8KB 16KB 32KB64KB 128KB 256KB

BS MB/s IOPS PCIe x8 utilization
Theoretical throughput RAID0 (SingleSSD x 4)
1024 KB 694 694 33% 252 MB/s x 4 = 1008 MB/s 0.5 KB 33 67145 45% 59540 IOPS x 4= 238160
Table 11: PCIe x8 utilization
The next question is: with how many SSDs is the controller saturated? Using workload heavy we measure the
random and sequential read/ write throughput of a RAID0 configuration varying the number of SSDs. RAID0 is used because it offers the best performance and less restrictions on the number of SSDs.
(a) random read throughput (b) random write throughput
(c) sequential read throughput (d) sequential write throughput
(e)Avg. Random Latency, 8KB (f) sequential write throughput-WC Off
Figure 5: Sequential and random throughput vs. SSDs

Figure 5(a) and (b) clearly show the saturation for random operations. With small blocksizes (8KB) two SSDs are enough to saturate the controller. There is a dependence on the block size, but generally with four to five SSDs the controller can be completely saturated.
Figure 5 (c) and (d) show the sequential throughput versus the number of drives. Conclusions similar to the ones already drawn apply. The read throughput is dependent on the blocksize. Due to mechanisms such as read-ahead for small blocksizes two SSDs are enough. Four to five SSDs are enough to reach the maximum performance. It may seem that for sequential write operations the controller is saturated completely even with two SSDs, but that is entirely due to the write cache. To substantiate this claim we re-performed the experiment without write-cache (Figure 5(f)). The write performance increases linearly with the number of SSDs.
To get a complete picture of the scalability test it is important to investigate the latency of the different levels in the same manner (Figure 5(e)). While the read latency is only marginally dependent on the number of drives there is significant dependency on the write latency. From the throughput/cost perspective saturation is reached with 2 SSDs per controller. Once saturated the throughput does not improve with more drives, but the latency improves significantly up to 4 or 5 drives per controller.
7. SOLUTION ALTERNATIVES Given these conclusions, how can we efficiently attain the storage space needed by database systems? A very viable alternative to pure hardware RAIDs is a combination of hardware and software: (Option A) the devices are connected directly (no RAID controller) with software RAID on top; (Option B) eliminate the RAID functionality and use the controller as a simple device aggregator while running software RAID on top; (Option C) use simple RAID levels on multiple RAID controllers while running software RAID on top. The use of software RAID is coherent with the present hardware trends of multi-core architectures and faster interconnect: on most servers a processor core can be dedicated to run RAID software and do better than any RAID system-on-a-chip.
HardwareRAID0
HardwareRAID0withfilesys.(FS)
SoftwareRAID0withFS
SoftwareRAID0onJBODswithFS
SoftwareRAID0onS.VolumeswithFS
BS Read Write Read Write Read Write Read Write Read Write RandomThroughput
4KB 24678 7532 25272 10335 12308 6197 27069 5975 27793 103178KB 20489 3356 20435 4775 7895 2452 25276 2655 26208 346116KB 16954 2848 17007 4616 6298 2387 21210 2992 19134 3395
SequentialThroughput128KB 452.3 334.5 469.4 339.6 417.4 359.9 429.3 183.2 523.6 344.5256KB 451.0 339.4 468.9 340.3 438.8 365.1 454.1 188.5 523.5 343.4512KB 454.2 340.7 469.3 340.2 446.5 371.4 488.1 191.2 523.4 344.21024KB 456.0 341.4 467.2 339.8 449.7 377.3 505.3 191.1 523.7 344.7
Table 12:Sequential and random throughput RAID0
We investigate Option A by performing software RAID0 tests over two SSDs on machine A. We compare those with the Option B (Table 12), machine B. Since
IOmeter and Orion do not recognize the software RAID volume as raw devices, file system experiments were performed. Option B has two variants: (a) JBOD mode (Just a Bunch of Drives) – devices are exposed as they are; (b) Simple Volume – devices are exposed as they are (without RAID functionality) but with caching and CQ.
Clearly the best performer is software RAID0 on simple volumes. It combines the better command queue management and the cache of the controller with the software RAID on the faster CPU. This is because the CPU can handle better the concurrency required to coordinate the single volume operations, while the controllers handle caching and command queuing. Interestingly enough RAID0 on raw device is slower than RAID0 with file system (Table 12). The result can be explained with the file system cache and the better asynchronous IO support on file system level, which results in better command queuing.
1Controller 2Controllers
Hardware
RAID0,4SSDsSoftwareRAID0,4SSDs,S.Vol.
SoftwareRAID0,2SSDs/Ctlr,hwRAID0
SoftwareRAID02SSD/CtlrS.Vol.
Quantity BS Read Write Read Write Read Write Read Write256KB 672 397 671 462 1033 762 1031 684Seq.through‐
put[MB/s] 512KB 670 398 674 468 1039 760 1030 687
Sequential 256KB 0.743 0.743 0.688 0.711 0.772 0.512 0.531 0.461Latency[ms] 512KB 1.168 1.382 1.152 1.254 1.303 0.913 0.877 0.791
4KB 24787 10193 27675 11704 44537 19529 49054 22512Rand.through‐
put[IOPS] 8KB 20987 6289 25417 10575 41091 13657 44129 13765
Random 4KB 0.353 0.204 0.277 0.120 0.282 0.114 0.277 0.109Latency[ms] 8KB 0.429 0.220 0.365 0.196 0.334 0.161 0.332 0.138
Table 13: Two controller experiments
With the best performing alternative selected, we investigate the performance of solution Option B and C over two controllers with two SSDs (Table 13). Clearly the second controller and software RAID have a profound effect on performance. The sequential throughput increases by 40%. The random throughput doubles. The read and write latencies improve by 30% and 40% respectively. Please note that the sequential case loads the drives at their maximum. With 4 SSDs per controller the sequential and random throughputs double compared to the baseline case of 8 SSDs and a single controller (Table 14).
Since software RAID implementations utilize the main CPU and part of the lower layers of the OS we examine the system-time overhead (Table 15(a)). The data complements the results presented in Table 13. We report the average system-time per core and the CPU overhead of the software RAID on Machine B (16 cores). All in all, we see a low CPU overhead: at most 20% for random read and sequential read and write. Interestingly, random writes offload the CPU causing negative overhead (-0.57% per core). This is the superimposed effect of two factors, both of which affect the CPU utilization: IO wait time and software RAID CPU overhead. The software RAID on simple volumes yields lower response times, and lower IO wait times. Although the CPU is moderately loaded with software RAID it is offloaded with waiting time. For sequential operations the
CPU is more loaded for read and write, which is due to the smaller cache per volume provided by the RAID controller. 1Controller,8SSDs 2Controllers,4SSD/Controller
HardwareRAID0 SoftwareRAID0,SimpleVolumes
Quantity BS Read Write Read Write
256KB 672 397 1349 881Seq.through‐put[MB/s] 512KB 680 398 1350 891
Sequential 256KB 0.751 0.752 0.606 0.664
Latency[ms] 512KB 1.195 1.419 0.742 0.997
4KB 24828 10198 51164 23661Rand.through‐put[IOPS] 8KB 23040 9032 46156 21372
4KB 0.366 0.169 0.276 0.106RandomLatency[ms] 8KB 0.428 0.182 0.330 0.116
Table 14: Two controller experiments, 8SSD total RandomOperations–blocksize4KB
HWRAID01Ctrl,4SSD
SWRAID0,2Ctrl.2SSD/ctrl,s.vol
HW.RAID51Ctrl,8SSD
SWRAID5,2Ctrl,4SSD/Ctrl.,S.Vol.
Read Write Read Write Read Write Read WriteIOPS 2478710193 49054 22512 20556 3666 50329 7695%Sys.Time7.526 5.658 8.255 5.087 6.958 2.322 8.976 6.185
‐0.73% ‐2.00% CPUOverhead ‐‐0.57% ‐ 3.86% SequentialOperations–blocksize512KB MB/s 670 398 1030 682 682 314 1364 495%Sys.Time2.206 1.209 3.213 2.029 2.1341.041 4.715 19.280
‐ 1.01% ‐ 2.58% CPUOverhead ‐ 0.82% ‐ 18.24%
BSWriteMB/s
AVGLatency
%Sys.Time
8KB 119 2.1 8.916KB 183 2.7 9.732KB 289 3.5 13.264KB 396 5.1 18.3128KB 471 8.5 23.9256KB 496 16.1 24.8512KB 495 32.3 19.31M 491 65.2 18.7
(a) different RAID configurations (b) RAID5 Table 15: System time and CPU overhead per Core
The experiments with RAID 5, which is a CPU intensive RAID level, show a different picture (Table 15). As expected, the performance is twice as good with CPU overhead 2% to 3% per core. The highest CPU overhead - 18% (per core) is measured with sequential write. It increases with the blocksize (Table 15(b)) and is clearly due to the computation of parity. Due to effects described in Section 5 Figure 4(d), beyond a certain blocksize/stripe-unit-size ratio the SSDs become the write bottleneck, the write latency increases and hence the system time decreases. 8. CONCLUSIONS The performance of SSD RAID configurations is strongly affected by current RAID controllers that are not designed for the characteristics of SSDs and rapidly become performance and scalability bottlenecks. The SSD read/write asymmetry is amplified due to traditional RAID write behavior. We observe that SSD storage can offer both good sequential and random throughput. Clearly concurrent support for multiple blocksizes is needed in database systems to make optimal use of it. The RAID technology amplifies the SSD-intrinsic asymmetry. The throughput is complemented by average latencies that are in the sub-millisecond range. However frequent single SSD outliers lead to high maximum response times. Erase block sizes influence the choice of a stripe unit size. The most promising results for host-based storage can be achieved with software/hardware hybrids over several RAID controllers with a few SSDs. To recapitulate - the ideal solution would nonetheless be a new breed of RAID controllers specially designed for SSDs
and their characteristics. The SAS/SATA2 interface is becoming a bottleneck for the SSDs. At present we are also observing a shift towards PCIe based interfaces, where RAID controllers cannot act as “device aggregators”. We therefore speculate that software RAID-approaches or cooked storage where operating system controls every device individually and cross-balances the load are also to be considered.
9. ACKNOWLEDGEMENTS The SSD storage system used for the tests is supported by a grant from the association "Freunde der Technischen Universität Darmstadt". This work has been partially supported by the DFG project “Flashy-DB”.
10. REFERENCES [1] Patterson, D. A., Gibson, G., and Katz, R. H. 1988. A case for
redundant arrays of inexpensive disks (RAID). In Proc. of the 1988 SIGMOD Conf. (Chicago, Illinois, USA, 1988).
[2] Chen, P. M., Lee, E. K., Gibson, G. A., Katz, R. H., and Patterson, D. A. RAID: high-performance, reliable secondary storage. ACM Comput. Surv. 26, 2 (Jun. 1994), 145-18.
[3] W. W. Hsu and A. J. Smith. Characteristics of I/O Traffic in Personal Computer and Server Workloads. IBM Systems Journal, 42(2):347–372, 2003.
[4] Lee, S.-W., B. Moon, C. Park, J.-M. Kim, S.-W.Kim. A Case for Flash Memory SSD in Enterprise Database Applications. In Proc. of the ACM SIGMOD, pp. 1075–1086, 2008.
[5] Intel Corp. Solid-State Drives in the Enterprise: A Proof of Concept. White Paper. 2009.
[6] IOMeter project. www.iometer.org.
[7] Oracle Corp. ORION (Oracle I/O Calibration Tool) http://oracle.com/technology/software/tech/orion/index.html
[8] Intel Corp and Seagate Technology. Windsor Serial ATA Native Command Queuing. Joint Whitepaper. 2003
[9] Chen, F., Koufaty, D. A., and Zhang, X. Understanding intrinsic characteristics and system implications of flash memory based solid state drives. In Proc. of SIGMETRICS '09 (Seattle, WA, USA, June 15 – 19), 2009
[10] Agrawal, N., Prabhakaran, V., Wobber, T., Davis, J. D., Manasse, M., Panigrahy, R. Design tradeoffs for SSD perfor-mance. In USENIX08 Boston, Massachusetts, June 2008.
[11] Lee, S., Moon, B., and Park, C. 2009. Advances in flash memory SSD technology for enterprise database applica-tions. In Proc. SIGMOD, Rhode Island, USA, July 2009
[12] Brown, A., Patterson, D. Towards availability benchmarking: a case study of software RAID systems. In Proc. USENIX Annual Technical Conference, San Diego, CA, June 2000.
[13] Wu, C., Chang, L., Kuo, T. An efficient B-Tree layer for flash memory storage systems. In Proc. of Int. Conf. on Real-Time and Embeded Computing Systems and Apps. 2003.
[14] Chung, T., Park, D., Park, S., D. Lee, S. Lee, H. Song. System software for flash memory: a survey.In Proc. of ICEUC’06, 2006.