Embed Size (px)
Citation preview

Building footprint extraction from Digital Surface Modelsusing Neural Networks
Ksenia Davydova*, Shiyong Cui, and Peter Reinartz
German Aerospace Center (DLR), Remote Sensing Technology Institute (IMF),Oberpfaffenhofen, Germany
ABSTRACT
Two-dimensional building footprints are a basis for many applications: from cartography to three-dimensionalbuilding models generation. Although, many methodologies have been proposed for building footprint extraction,this topic remains an open research area. Neural networks are able to model the complex relationships betweenthe multivariate input vector and the target vector. Based on these abilities we propose a methodology usingneural networks and Markov Random Fields (MRF) for automatic building footprint extraction from normalizedDigital Surface Model (nDSM) and satellite images within urban areas. The proposed approach has mainly twosteps. In the first step, the unary terms are learned for the MRF energy function by a four-layer neural network.The neural network is learned on a large set of patches consisting of both nDSM and Normalized DifferenceVegetation Index (NDVI). Then prediction is performed to calculate the unary terms that are used in the MRF.In the second step, the energy function is minimized using a maxflow algorithm, which leads to a binary buildingmask. The building extraction results are compared with available ground truth. The comparison illustrates theefficiency of the proposed algorithm which can extract approximately 80% of buildings from nDSM with highaccuracy.
Keywords: Building footprint extraction, binary mask, Digital Surface Model, neural networks, Markov Ran-dom Fields, Normalized Difference Vegetation Index
1. INTRODUCTION
Two-dimensional (2D) building footprint extraction from imagery or/and DSM data has been a research issuefor decades and is of great interest since it plays a key role in three-dimensional (3D) building model generation,map updating, urban planning and reconstruction, infrastructure development, etc. The collection of buildingfootprints often needs a lot of manual work and is both time consuming and costly. Moreover, it is challenging toextract building information from remotely sensed data due to the sophisticated nature of urban environments.Therefore, automatic methods are required for an efficient collection of building footprints from large urban areascontaining thousands of buildings.
Many automatic methods have been developed in the last decades using various data sources. Some ap-proaches perform building detection on the basis of aerial1,2 and high-resolution satellite imagery3–7 using spec-tral reflectance values.8 However, these methods often face problems caused by imaging radiometry of opticalsensors when similar spectral reflectance of the ground occurs. The building roofs are built from different mate-rials depending on the regions and can have different colors. A comparable spectral reflectance of the buildingroofs with other objects on the ground can cause incorrect building extraction.
Several investigations have been made to detect building regions using height information. There are twomain sources for the height data. One source is LIDAR (LIght Detection And Ranging), which provides veryaccurate DSM. The majority of solutions propose at first to classify the LIDAR points as whether they belongto the ground, to buildings or to other object classes.9 Using ground filters the Digital Terrain Model (DTM)is determined and then subtracted from the DSM. Afterwards, applying height thresholds the remaining non-ground points are classified into vegetation and building candidate regions, which are further refined in following

steps applying different methods. In order to overcome the possible weakness of horizontal accuracy in LIDARdata some approaches use additionally multispectral data.10,11
The other source, which provides elevation information, is stereo imagery. The DSMs are calculated fromsatellite stereo data using image matching techniques. The quality of satellite images together with the globalcoverage dramatically increased in the last years, keeping the cost lower as compared to LIDAR data. As aresult, DSMs produced by stereo data have become more popular in the recent years.12,13 However, one of thedrawbacks of using DSMs from stereo satellite images is that they are not as accurate as the LIDAR basedDSMs. Generally, building footprint extraction with stereo DSM is quite similar to the methods using LIDARdata. In Ref. 12, 14 the building footprint candidates are generated as following: First, nDSM is generated bysubtraction of DTM from DSM. Second, using the NDVI, calculated from given multispectral data, the vegetationis discriminated from the buildings. Afterwords, shape modeling algorithms are used to precisely delineate thebuildings. Ref. 15 proposes to extract rectangular building footprints directly from the DSM using Marked PointProcesses (MPP). Simple building outlines in vectorial form are extracted from DSM in Ref. 16 using an energyminimization model with the assumption that buildings have rectangular shapes.
Although, many methods were developed in the field of building footprint extraction this problem is still notwell solved due to the complexity of buildings in urban areas. In this paper we present a methodology usingMRF and neural networks for automatic building footprint extraction from nDSM and satellite images with afocus on urban areas. A similar approach was used in Ref. 17, where Softmax was applied in the last layer ofthe neural network, which is actually a pixel-wise decision. The major difference in the presented methodologyis the use of MRF for generating the final binary mask, which is a global optimal inference, not a local one.
2. METHODOLOGY
2.1 Problem Formulation
Similar to Ref. 18 we define our problem as following: Let I be a nDSM image concatenated together with NDVIfrom given multispectral data and M be a corresponding given building mask. The pixels M(i, j) of the maskcould be defined as the following:
M(i, j) =
{1 if (i,j) is building0 if (i,j) is non-building
We aim to learn how to make the prediction p(M(i, j)|I) for each pixel and, applying the MRF energy mini-mization approach, to generate a binary building mask.
Since the satellite images are huge we tile the images into patches of size w×w pixels with overlap. It shouldbe mentioned that the size of the patch defined from image is equal to the size of the computed mask patch.Hence, we can rewrite the distribution as:
p(Patch(M)w×w)|Patch(I)w×w) (1)
where Patch(Image)w×w is an image’s patch of size w × w for both satellite image and true building mask. Asa result, the model learns to make predictions for each mask patch p(Patch(M)w×w) given a p(Patch(I)w×w)image patch.
2.2 Neural Networks and Learning algorithm to detect buildings/non-buildings
In the first step of the proposed approach for building footprint extraction from DSM and satellite images wemodel the distribution (1) applying neural networks, which have already been used for several applications inphotogrammetry and image analyses.17–19 In this work the neural network, functional form is denoted as f , isa four-layer perceptron where the first-layer is input, the fourth-layer is output and the rest are hidden-layers.The layers except the first one are non-linear layers with a logistic sigmoid activation function σ(x) defined bythe formula:
σ(x) =1
1 + e−x(2)

Regularly, the multilayer perceptron maps the input vector data xi to the output vector data yi through aset of non-linear functions (sigmoid activation function σ(x) in our case) with parameters W and b as a weightsand biases correspondingly. A single layer neural network can be represented as:
f(x) = σ
(∑i
Wixi + b
)(3)
Therefore, our network can be written as:
f(x) = σ (Wᵀ3σ (Wᵀ
2σ (Wᵀ1x + b1) + b2) + b3) (4)
where Wi are the weight matrices and bi are the bias vectors for each layer.
The reason of choosing a sigmoid function to model our problem is that we want to be sure the predictedvalues are between 0 and 1. It means the closer the value to 1 the higher the probability that the pixel belongsto the desired object. It is very useful for the later binary classification problem. Besides, the derivatives of thesigmoid function are easy to calculate, which leads to a faster training. Moreover, the use of a sigmoid functionhelps in a simple way to introduce non-linearity to the model. Thereby, when a non-linear function is used, moresophisticated models can be expressed.
In the training process of multilayer neural network weights and biases are at first randomly initialized.During every training iteration the inputs are sent to the network and the model outputs the predictions. Themodel then learns in a supervised manner comparing the resulted predictions with given true data by minimizingthe cross entropy and adjusting the weights and biases with backpropagation algorithm using stochastic gradientdescent in small batches. In order to prevent the tendency of neural network from overfitting the training data a”weight decay” (namely L2 regularization) is employed. It prevents the weights of growing too large. The crossentropy loss function together with weight decay formally can be written as:
E = − 1
n
∑x
[y log y + (1− y) log(1− y)] +λ
2n
∑w
w2 (5)
where n is the size of our training set, y is the corresponding desired output, y is a prediction and λ is the weightdecay coefficient.
To organize the training data the input images are divided into patches. It is also important to integrate asmuch additional context information as possible into the inputs. Therefore, because trees are usually mixed withbuildings, Normalized Difference Vegetation Index (NDVI) computed from the multispectral images is employed
32
32
DSM
32
32
NDVI
32
32
Ground truth
32×32
32×32
32×
32
Input layerSize: 2048
Hidden layerSize: 400
Hidden layerSize: 100
Output layerSize: 1024
Figure 1. Neural network organization

additionally to separate them from buildings. As a result, the neural network is learned on a large set of patchesconsisting of both DSM and NDVI as inputs and given mask as outputs (see Figure 1).
After training the defined neural network the model is ready to make the predictions on a new unseen dataset. Those new data are forwarded though the network and the predicted patches are obtained. After that, thepatches are stitched together in the same manner as image tiling in order to generate an image with the samesize as the original DSM.
2.3 MRF energy minimization
To generate a binary building mask the buildings should be separated from the background. This can be achievedby assigning to each pixel of the image a label. In our case it is a binary form where
L =
{0 background1 building
Additionally, we need to incorporate spatial correlations into a segmentation process in order to specify the localcharacteristics of an image.20,21 Therefore, the approach for the second step can be formulated as a discretelabeling problem, the solution to which is MRF energy minimization.
MRF is an undirected graphical models which can find a solution to energy minimization via graph cutalgorithm, where the minimum cut on a graph corresponds to the minimum of an energy function.22,23 It shouldbe mentioned that binary problems can be solved exactly using this approach. We compute minimum cut ona graph by using maximum flow algorithm due to its equivalency to the first as it is declared in the Ford andFulkerson theorem.23,24 This step of the approach is implemented in C++ using the graph cut minimizationsoftware prepared by Ref. 25 using the libraries provided by Ref. 26.
As described above, in the first step the predictions defined by Equation (1) are learned by the chosen neuralnetwork and a predicted mask is generated. Mainly, this prediction could be seen as unary terms φi(yi, x) forthe MRF energy function as shown in Equation (6).
E =
N∑i
φi(li, x) +∑i∼j
ψi(li, lj , x) (6)
where li is the label of node i, x is the given data. The unary terms penalize the solutions inconsistent with theobservations. The second potential term of Equation (6) is called pairwise term and it reflects the interactionsbetween labels assign within the neighborhood.
As a result, applying the described methodology we search for the best suitable label for each pixel takinginto account spatial correlations between them.
3. STUDY AREA AND DATASETS
We performed experiments on datasets consisting of DSM reconstructed from WorldView-2 stereo panchromaticimages and NDVI computed from WorldView-2 multi-spectral image. The DSM and panchromatic images havea resolution of 0.5 meters per pixel. By removing a topography information from DSM based on Ref. 27 weobtained a nDSM for the experiment, which contains information only about non-terrain objects (buildings, treesand etc.). For learning the parameters in the neural network a building mask from the municipal city of Munich,Germany is used as a ground truth.
For learning process the training dataset consisting of 39790 samples was generated. This dataset is organizedas pairwise dataset, where first element corresponds to the concatenated vector representation of nDSM andNDVI patches both of size 32×32 (input data for neural network in Figure 1) and the second element, whichcorresponds to the vector representation of ground truth patches of size 32×32 (output data for neural networkin Figure 1). The overlap between the patches is 24 pixels. To see how well the built neural network can perform,we use the generated on a new area two test datasets, which relate only to the vector representation of nDSMand NDVI patches as inputs to the neural network.
Region 1 Region 2
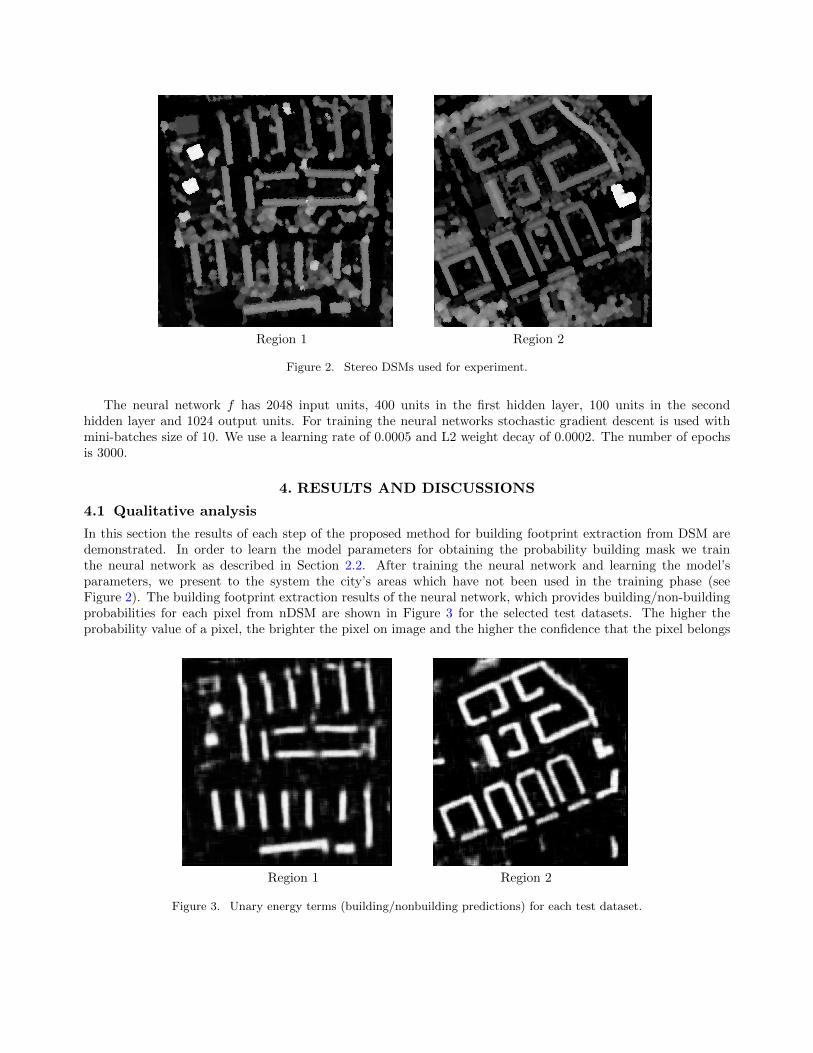
Figure 2. Stereo DSMs used for experiment.
The neural network f has 2048 input units, 400 units in the first hidden layer, 100 units in the secondhidden layer and 1024 output units. For training the neural networks stochastic gradient descent is used withmini-batches size of 10. We use a learning rate of 0.0005 and L2 weight decay of 0.0002. The number of epochsis 3000.
4. RESULTS AND DISCUSSIONS
4.1 Qualitative analysis
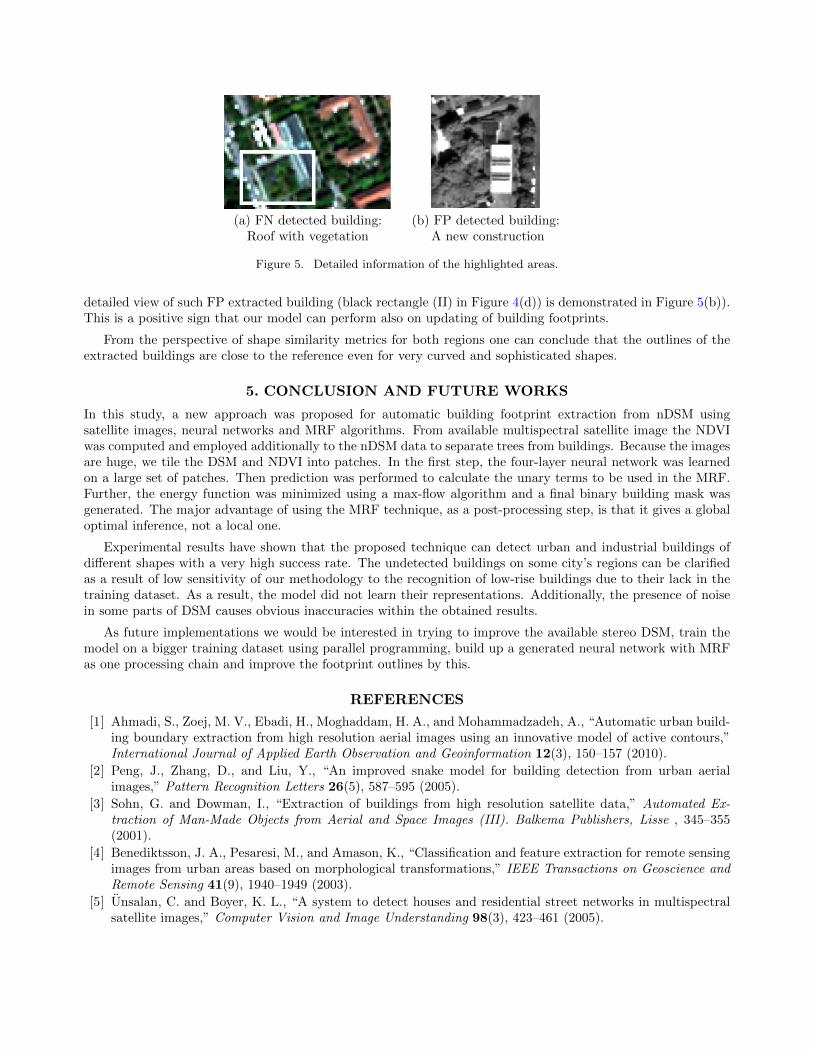
In this section the results of each step of the proposed method for building footprint extraction from DSM aredemonstrated. In order to learn the model parameters for obtaining the probability building mask we trainthe neural network as described in Section 2.2. After training the neural network and learning the model’sparameters, we present to the system the city’s areas which have not been used in the training phase (seeFigure 2). The building footprint extraction results of the neural network, which provides building/non-buildingprobabilities for each pixel from nDSM are shown in Figure 3 for the selected test datasets. The higher theprobability value of a pixel, the brighter the pixel on image and the higher the confidence that the pixel belongs
Region 1 Region 2
Figure 3. Unary energy terms (building/nonbuilding predictions) for each test dataset.

(a) Resulted mask: Region 1 (b) Resulted mask: Region 2
I
II
(c) Pixel-based evaluation: Region 1 (d) Pixel-based evaluation: Region 2
TP FN FP
Figure 4. Example of the extracted building footprints from nDSM.
to a building. It can be clearly seen that the model successfully extracts the shapes of building footprints,without any influence of trees.
The aimed binary building masks are obtained for two selected test regions by minimizing the MRF energyfunction as shown in Figures 4(a) and 4(b). It can be observed that using MRF the complex relationshipsspecifically the building footprint shapes are well modeled. For visualization and better interpretation theextracted building footprints are overlapped with the reference building footprints in Figures 4(c) and 4(d) forboth test datasets. As can be seen, the buildings are well separated from the background and they are in mostcases very close to the ground truth.
4.2 Quantitative analysis
In this paper the building footprint extraction results are evaluated against the reference based on traditionalpixel-based and object-based classification accuracy metrics. In the first step a many-to-many correspondencebetween reference building footprints and the extracted results is registered as the following: if the overlapbetween a building in reference and an extracted one is at least 50%, then the correspondence is detected. Thenthe extracted results are categorised as either true positive (TP), true negative (TN), false positive (FP) and falsenegative (FN). According to classification applications: TP represents the common area of extracted objects andreference objects; TN is an area, which belongs to neither the extracted result nor the reference; FP representsthe falsely extracted buildings; FN is the area that belongs to the reference object but not to the extracted

result. This allows us to introduce the following evaluation metrices for pixel-based evaluation:
Completeness =TP
TP + FN(7)
Correctness =TP
TP + FP(8)
Quality =TP
TP + FN + FP(9)
According to Ref. 28 the description to these metrices can be given as following: The completeness defines thefraction of the building polygon area being correctly detected with respect to the desired building footprintarea. The correctness defines the fraction of correctly detected parts of extracted building footprint to thewhole extracted building polygon area. The overall quality rate represents a combination of completeness andcorrectness.
Additionally, object-based shape similarity metrics are calculated as well, which describe how the extractedobject is resembling to the referenced one. From the large variety of measures regarding to shape similarities, thePerimeter ratio r(P ) and Area ratio r(A) between the extracted building footprint and reference are selected.These ratios are defined as:
r(P ) =abs(Pe − Pref )
Pref(10)
r(A) =abs(Ae −Aref )
Aref(11)
where Pe and Pref correspond to perimeter of extracted building and reference, and Ae and Aref are the areas ofextracted building and reference, respectively. The closer these ratios to 0, the more similar are both shapes. Itshould be noticed that for each presented shape metric, calculated between corresponding buildings, the obtainedvalues are averaged afterwards.
A quantitative analysis has been performed on both selected test datasets to assess the quality of the proposedmethodology. For every dataset the pixel-based and object-based metrics were calculated and the results arepresented in Table 1. We consider a minimum size of a building as 32 m2 in order to avoid obvious mistakes.From the obtained results we can see that, although the completeness/correctness/quality values are datasetdependent, their values are close to correspondent values among the regions.
Table 1. Pixel-based and object-based automatic building footprint extraction results for both test datasets.
Completeness Correctness Quality r(A) r(P )Region 1 72% 91% 67% 0.15 0.16Region 2 75% 89% 69% 0.13 0.078
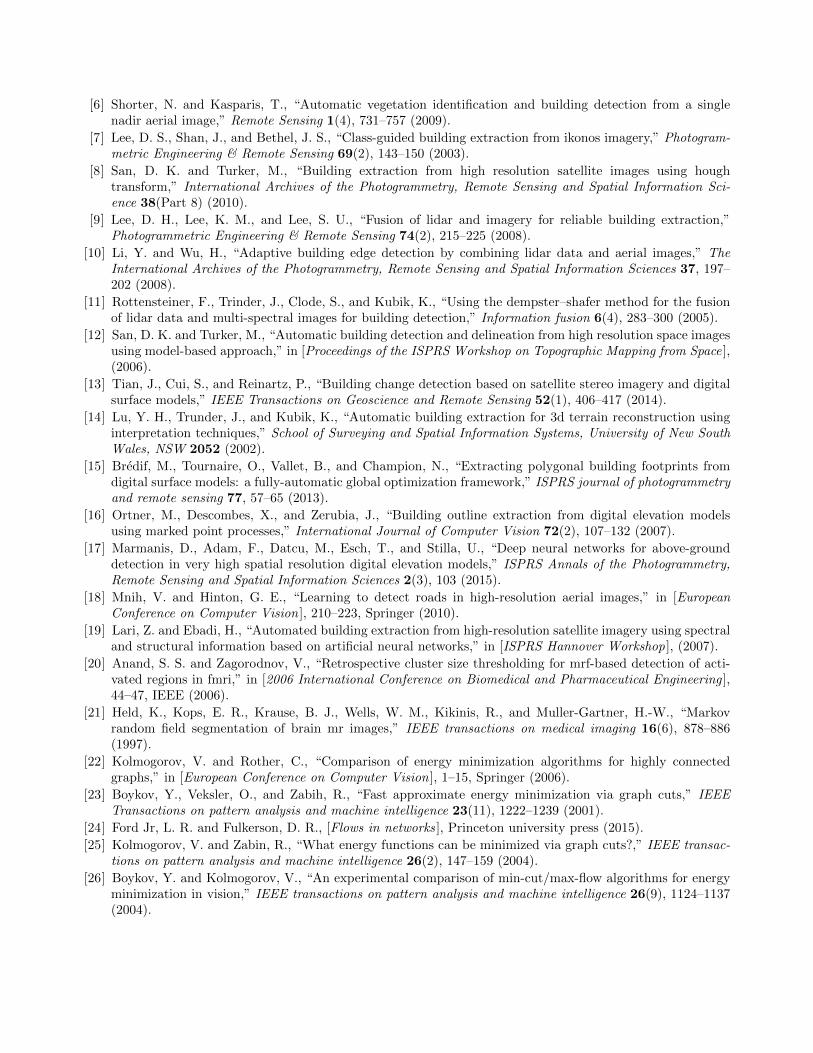
Most of FN errors (red regions in Figures 4(c) and 4(d)) are due to completely undetected buildings. Thiscan be explained as low sensitivity of our approach to the recognition of low-rise buildings, which are surroundedby higher buildings. Another reason can be the lack of low-rise building or their small amount in the trainingdataset. As a result, the model did not learn their representations and can not recognize them as buildings.Another reason of undetected buildings is their possible cover with vegetation, grown on the roof. The typicalexample of such roof is highlighted in black rectangle (I) in Figure 4(d). This region is demonstrated in themultispectral image in Figure 5(a). Some undetected building parts of the obtained results can be caused bynoisy DSM data.
Turning to FP errors (blue color in Figures 4(c) and 4(d)) we can conclude that some positively extractedfootprints define new built constructions in a city. Because the used ground truth is not up to date, they are notpresented on it. However those new constructions can be clearly seen on DSM and pancromatic images. The
(a) FN detected building: (b) FP detected building:Roof with vegetation A new construction
Figure 5. Detailed information of the highlighted areas.
detailed view of such FP extracted building (black rectangle (II) in Figure 4(d)) is demonstrated in Figure 5(b)).This is a positive sign that our model can perform also on updating of building footprints.
From the perspective of shape similarity metrics for both regions one can conclude that the outlines of theextracted buildings are close to the reference even for very curved and sophisticated shapes.
5. CONCLUSION AND FUTURE WORKS
In this study, a new approach was proposed for automatic building footprint extraction from nDSM usingsatellite images, neural networks and MRF algorithms. From available multispectral satellite image the NDVIwas computed and employed additionally to the nDSM data to separate trees from buildings. Because the imagesare huge, we tile the DSM and NDVI into patches. In the first step, the four-layer neural network was learnedon a large set of patches. Then prediction was performed to calculate the unary terms to be used in the MRF.Further, the energy function was minimized using a max-flow algorithm and a final binary building mask wasgenerated. The major advantage of using the MRF technique, as a post-processing step, is that it gives a globaloptimal inference, not a local one.
Experimental results have shown that the proposed technique can detect urban and industrial buildings ofdifferent shapes with a very high success rate. The undetected buildings on some city’s regions can be clarifiedas a result of low sensitivity of our methodology to the recognition of low-rise buildings due to their lack in thetraining dataset. As a result, the model did not learn their representations. Additionally, the presence of noisein some parts of DSM causes obvious inaccuracies within the obtained results.
As future implementations we would be interested in trying to improve the available stereo DSM, train themodel on a bigger training dataset using parallel programming, build up a generated neural network with MRFas one processing chain and improve the footprint outlines by this.
REFERENCES
[1] Ahmadi, S., Zoej, M. V., Ebadi, H., Moghaddam, H. A., and Mohammadzadeh, A., “Automatic urban build-ing boundary extraction from high resolution aerial images using an innovative model of active contours,”International Journal of Applied Earth Observation and Geoinformation 12(3), 150–157 (2010).
[2] Peng, J., Zhang, D., and Liu, Y., “An improved snake model for building detection from urban aerialimages,” Pattern Recognition Letters 26(5), 587–595 (2005).
[3] Sohn, G. and Dowman, I., “Extraction of buildings from high resolution satellite data,” Automated Ex-traction of Man-Made Objects from Aerial and Space Images (III). Balkema Publishers, Lisse , 345–355(2001).
[4] Benediktsson, J. A., Pesaresi, M., and Amason, K., “Classification and feature extraction for remote sensingimages from urban areas based on morphological transformations,” IEEE Transactions on Geoscience andRemote Sensing 41(9), 1940–1949 (2003).
[5] Unsalan, C. and Boyer, K. L., “A system to detect houses and residential street networks in multispectralsatellite images,” Computer Vision and Image Understanding 98(3), 423–461 (2005).
[6] Shorter, N. and Kasparis, T., “Automatic vegetation identification and building detection from a singlenadir aerial image,” Remote Sensing 1(4), 731–757 (2009).
[7] Lee, D. S., Shan, J., and Bethel, J. S., “Class-guided building extraction from ikonos imagery,” Photogram-metric Engineering & Remote Sensing 69(2), 143–150 (2003).
[8] San, D. K. and Turker, M., “Building extraction from high resolution satellite images using houghtransform,” International Archives of the Photogrammetry, Remote Sensing and Spatial Information Sci-ence 38(Part 8) (2010).
[9] Lee, D. H., Lee, K. M., and Lee, S. U., “Fusion of lidar and imagery for reliable building extraction,”Photogrammetric Engineering & Remote Sensing 74(2), 215–225 (2008).
[10] Li, Y. and Wu, H., “Adaptive building edge detection by combining lidar data and aerial images,” TheInternational Archives of the Photogrammetry, Remote Sensing and Spatial Information Sciences 37, 197–202 (2008).
[11] Rottensteiner, F., Trinder, J., Clode, S., and Kubik, K., “Using the dempster–shafer method for the fusionof lidar data and multi-spectral images for building detection,” Information fusion 6(4), 283–300 (2005).
[12] San, D. K. and Turker, M., “Automatic building detection and delineation from high resolution space imagesusing model-based approach,” in [Proceedings of the ISPRS Workshop on Topographic Mapping from Space ],(2006).
[13] Tian, J., Cui, S., and Reinartz, P., “Building change detection based on satellite stereo imagery and digitalsurface models,” IEEE Transactions on Geoscience and Remote Sensing 52(1), 406–417 (2014).
[14] Lu, Y. H., Trunder, J., and Kubik, K., “Automatic building extraction for 3d terrain reconstruction usinginterpretation techniques,” School of Surveying and Spatial Information Systems, University of New SouthWales, NSW 2052 (2002).
[15] Bredif, M., Tournaire, O., Vallet, B., and Champion, N., “Extracting polygonal building footprints fromdigital surface models: a fully-automatic global optimization framework,” ISPRS journal of photogrammetryand remote sensing 77, 57–65 (2013).
[16] Ortner, M., Descombes, X., and Zerubia, J., “Building outline extraction from digital elevation modelsusing marked point processes,” International Journal of Computer Vision 72(2), 107–132 (2007).
[17] Marmanis, D., Adam, F., Datcu, M., Esch, T., and Stilla, U., “Deep neural networks for above-grounddetection in very high spatial resolution digital elevation models,” ISPRS Annals of the Photogrammetry,Remote Sensing and Spatial Information Sciences 2(3), 103 (2015).
[18] Mnih, V. and Hinton, G. E., “Learning to detect roads in high-resolution aerial images,” in [EuropeanConference on Computer Vision ], 210–223, Springer (2010).
[19] Lari, Z. and Ebadi, H., “Automated building extraction from high-resolution satellite imagery using spectraland structural information based on artificial neural networks,” in [ISPRS Hannover Workshop ], (2007).
[20] Anand, S. S. and Zagorodnov, V., “Retrospective cluster size thresholding for mrf-based detection of acti-vated regions in fmri,” in [2006 International Conference on Biomedical and Pharmaceutical Engineering ],44–47, IEEE (2006).
[21] Held, K., Kops, E. R., Krause, B. J., Wells, W. M., Kikinis, R., and Muller-Gartner, H.-W., “Markovrandom field segmentation of brain mr images,” IEEE transactions on medical imaging 16(6), 878–886(1997).
[22] Kolmogorov, V. and Rother, C., “Comparison of energy minimization algorithms for highly connectedgraphs,” in [European Conference on Computer Vision ], 1–15, Springer (2006).
[23] Boykov, Y., Veksler, O., and Zabih, R., “Fast approximate energy minimization via graph cuts,” IEEETransactions on pattern analysis and machine intelligence 23(11), 1222–1239 (2001).
[24] Ford Jr, L. R. and Fulkerson, D. R., [Flows in networks ], Princeton university press (2015).
[25] Kolmogorov, V. and Zabin, R., “What energy functions can be minimized via graph cuts?,” IEEE transac-tions on pattern analysis and machine intelligence 26(2), 147–159 (2004).
[26] Boykov, Y. and Kolmogorov, V., “An experimental comparison of min-cut/max-flow algorithms for energyminimization in vision,” IEEE transactions on pattern analysis and machine intelligence 26(9), 1124–1137(2004).

[27] Qin, R., Tian, J., and Reinartz, P., “Spatiotemporal inferences for use in building detection using series ofvery-high-resolution space-borne stereo images,” International Journal of Remote Sensing , 1–22 (2015).
[28] Zeng, C., Wang, J., and Lehrbass, B., “An evaluation system for building footprint extraction from remotelysensed data,” IEEE Journal of Selected Topics in Applied Earth Observations and Remote Sensing 6(3),1640–1652 (2013).