Embed Size (px)
Citation preview
UNIVERSITÀ DEGLI STUDI DI UDINE _______________________________________________________________
Dottorato di Ricerca in Scienze e Biotecnologie Agrarie
Ciclo XXIV
Coordinatore: Prof. Mauro Spanghero
TESI DI DOTTORATO DI RICERCA
BUILDING CATALOGUES OF GENETIC VARIATION IN POPLAR
DOTTORANDA Sara Pinosio
RELATORE
Prof. Michele Morgante CORRELATORE Dott. Fabio Marroni
_______________________________________________________________
ANNO ACCADEMICO 2011-2012

Tesi di dottorato di Sara Pinosio discussa presso l’Università degli Studi di Udine
2
Tesi di dottorato di Sara Pinosio discussa presso l’Università degli Studi di Udine
3
Contents
Summary...................................................................................................................... 5 1 Introduction ............................................................................................................ 9
1.1 ENERGYPOPLAR project ................................................................................... 9 1.2 Detection of SNP markers in lignin biosynthesis genes............................... 11
1.2.1 CAD4 Sanger sequencing........................................................................... 13 1.2.2 Pooled multiplex sequencing of CAD4, HCT1, C3H3, CCR7 and 4CL3................................................................................................................................ 15 1.2.3 Next-generation sequencing technology................................................. 16
1.3 Phenotypic effect of structural variants.......................................................... 19 1.4 Methods for SV detection ................................................................................. 22
1.4.1 Paired-end mapping (PEM) signature..................................................... 23 1.4.2 Depth of coverage (DOC) signature......................................................... 25
2 Genetic Diversity in CAD4 ............................................................................... 27
2.1 Materials and Methods ..................................................................................... 27 2.1.1 Subjects and genotyping ............................................................................ 27 2.1.2 Statistical analyses ..................................................................................... 29
2.2 Results ................................................................................................................ 30 2.3 Discussion .......................................................................................................... 35 2.4 Supplementary Material .................................................................................. 38
3 Rare Variants in Lignin Genes....................................................................... 40
3.1 Materials and Methods ..................................................................................... 40 3.1.1 Plant Material .............................................................................................. 40 3.1.2 Amplification and pooling......................................................................... 41 3.1.3 Sequencing .................................................................................................. 43 3.1.4 Data Analysis............................................................................................... 44
3.2 Results ................................................................................................................ 47 3.2.1 Resequencing .............................................................................................. 47 3.2.2 Variant detection........................................................................................ 51 3.2.3 Removing sequencing and alignment errors ......................................... 56 3.2.4 Effect of using a high fidelity DNA polymerase on SNP detection ..... 56 3.2.5 Effect of decreasing Mean Individual Coverage (MIC) on SNP detection................................................................................................................ 58 3.2.6 Population genetics parameters .............................................................. 58
3.3 Discussion .......................................................................................................... 59 4 Structural Variation in Poplar....................................................................... 63
4.1 Materials and Methods ..................................................................................... 63 4.1.1 Plant material .............................................................................................. 63

Tesi di dottorato di Sara Pinosio discussa presso l’Università degli Studi di Udine
4
4.1.2 DNA extraction, library preparation, and next-generation sequencing................................................................................................................................ 64 4.1.3 Short read alignment and phylogeny reconstruction............................ 64 4.1.4 Detection of deletions ................................................................................ 65 4.1.5 Detection of insertions............................................................................... 65 4.1.6 Simulations ................................................................................................. 67 4.1.7 Gene content analysis ................................................................................ 69 4.1.8 PCR validation ............................................................................................ 70
4.2 Results ................................................................................................................ 71 4.2.1 Sequencing .................................................................................................. 71 4.2.2 Simulations ................................................................................................. 72 4.2.3 Structural variants detection and classification .................................... 77 4.2.4 Gene content analysis................................................................................ 80 4.2.5 Experimental validation............................................................................ 84
4.3 Discussion .......................................................................................................... 86 5 Copy Number Variation in Poplar................................................................ 93
5.1 Materials and Methods ..................................................................................... 93 5.1.1 Depth of coverage analysis ........................................................................ 93 5.1.2 Gene content analysis ................................................................................ 95
5.2 Results................................................................................................................. 95 5.2.1 Depth of coverage analysis ........................................................................ 95 5.2.2 Gene content analysis.............................................................................. 101
5.3 Discussion ........................................................................................................ 105 List of References ................................................................................................. 109 Acknowledgments ................................................................................................ 121
Tesi di dottorato di Sara Pinosio discussa presso l’Università degli Studi di Udine
5
Summary
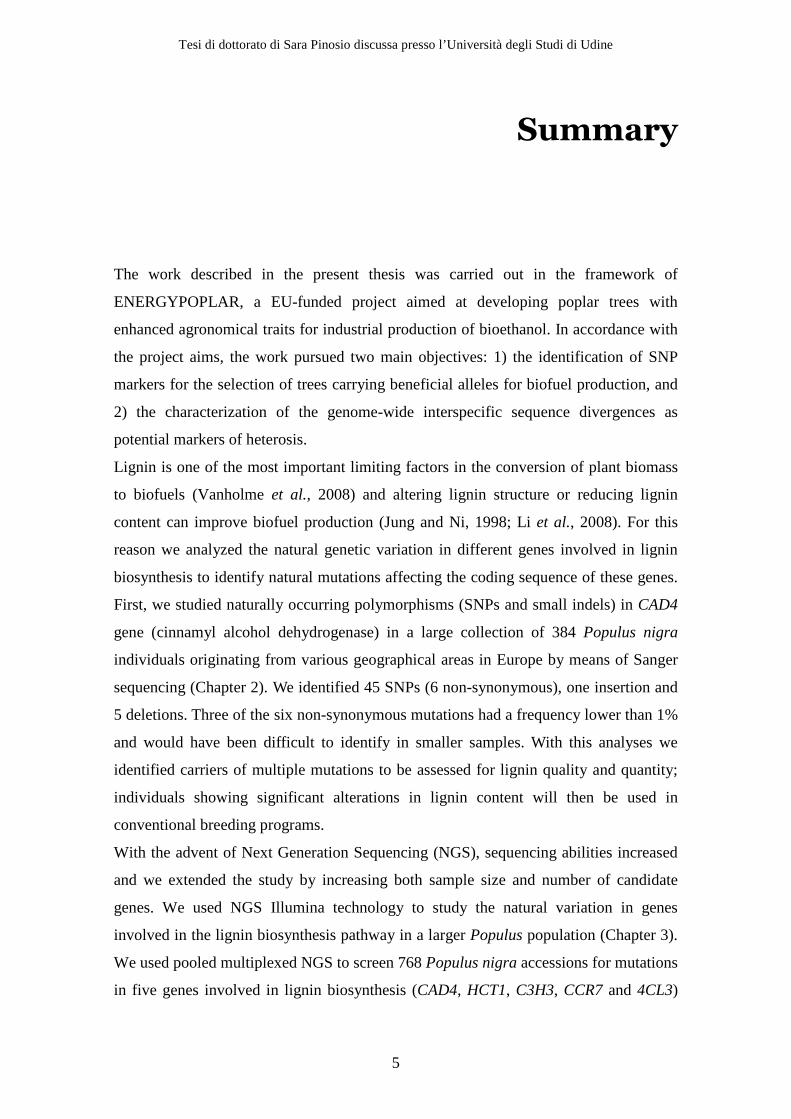
The work described in the present thesis was carried out in the framework of
ENERGYPOPLAR, a EU-funded project aimed at developing poplar trees with
enhanced agronomical traits for industrial production of bioethanol. In accordance with
the project aims, the work pursued two main objectives: 1) the identification of SNP
markers for the selection of trees carrying beneficial alleles for biofuel production, and
2) the characterization of the genome-wide interspecific sequence divergences as
potential markers of heterosis.
Lignin is one of the most important limiting factors in the conversion of plant biomass
to biofuels (Vanholme et al., 2008) and altering lignin structure or reducing lignin
content can improve biofuel production (Jung and Ni, 1998; Li et al., 2008). For this
reason we analyzed the natural genetic variation in different genes involved in lignin
biosynthesis to identify natural mutations affecting the coding sequence of these genes.
First, we studied naturally occurring polymorphisms (SNPs and small indels) in CAD4
gene (cinnamyl alcohol dehydrogenase) in a large collection of 384 Populus nigra
individuals originating from various geographical areas in Europe by means of Sanger
sequencing (Chapter 2). We identified 45 SNPs (6 non-synonymous), one insertion and
5 deletions. Three of the six non-synonymous mutations had a frequency lower than 1%
and would have been difficult to identify in smaller samples. With this analyses we
identified carriers of multiple mutations to be assessed for lignin quality and quantity;
individuals showing significant alterations in lignin content will then be used in
conventional breeding programs.
With the advent of Next Generation Sequencing (NGS), sequencing abilities increased
and we extended the study by increasing both sample size and number of candidate
genes. We used NGS Illumina technology to study the natural variation in genes
involved in the lignin biosynthesis pathway in a larger Populus population (Chapter 3).
We used pooled multiplexed NGS to screen 768 Populus nigra accessions for mutations
in five genes involved in lignin biosynthesis (CAD4, HCT1, C3H3, CCR7 and 4CL3)

Tesi di dottorato di Sara Pinosio discussa presso l’Università degli Studi di Udine
6
and developed a novel workflow for SNP detection. Applying our workflow to the
whole data set, we identified 37 non-synonymous SNPs in five genes involved in lignin
biosynthesis, one of which caused a premature stop codon (C243*) in HCT1 gene.
Carriers of the stop codon have been selected for extensive phenotypic evaluation, and
will be used in conventional breeding program to obtain offspring with improved lignin
composition. Sensitivity and specificity of the method were extremely high, allowing an
accurate estimation of allele frequencies and population genetic parameters. We
concluded that our workflow based on pooled multiplexed NGS is an efficient and
accurate method to screen a large number of individuals for mutations providing the
basis for a next generation Ecotilling method (Comai et al., 2004).
To characterize the genome-wide interspecific sequence divergence among poplar
parental species, we performed whole genome next-generation sequencing of 18 poplar
accessions: 4 Populus nigra accessions, 2 Populus deltoides and 12 P. nigra x P.
deltoides F1 hybrids. We studied the genetic variation present in the different poplar
species, focusing on the detection of two different classes of structural variants (SVs):
1) insertion/deletion polymorphisms related with the transposable elements activity
(Chapter 4) and 2) larger copy number variants (CNVs) (Chapter 5).
For the detection of insertions and deletions we exploited the paired-end mapping
information generated from next-generation sequencing data by comparing P. nigra and
P. deltoides sequences to the P. trichocarpa reference sequence. Overall, we identified
3380 deletions and 5887 insertions corresponding to 14.7 Mb and 23.3 Mb respectively
and accounting in total for the 10% of the whole poplar reference genome. According to
our results, the insertion of class I LTR retroelements is the major contributor to the
overall observed structural variation. We observed relatively few structural variants in
transcribed regions compared to intergenic regions.
CNVs were detected by comparing the depth of coverage obtained in P. nigra and P.
deltoides resequenced individuals. We identified 192 regions (~28.4 Mb) with a higher
copy number in P. nigra than in P. deltoides and 154 CNVs (~24.6 Mb) with the
opposite signature. In addition, 117 regions, corresponding to a total of 13.9 Mb,
exhibited an intraspecific pattern of copy number variation. Our analysis showed that
the regions of copy number variation were rich in repetitive sequences and had lower-
than-average gene content. However, some classes of genes, such as disease resistance
genes, resulted to be over-represented in CNVs with respect to the rest of the genome,

Tesi di dottorato di Sara Pinosio discussa presso l’Università degli Studi di Udine
7
suggesting a relationship between the evolution of these gene families and copy number
variants.
In summary, with the present thesis we built an elaborated catalogue of genetic
variation in poplar. With the aim of obtaining different sources of information for
selecting poplar with favorable agronomical traits, we 1) surveyed single nucleotide
polymorphisms in specific target regions of many individuals and 2) investigated the
genome-wide distribution of structural variation in a relatively small interspecific
poplar pedigree.

Tesi di dottorato di Sara Pinosio discussa presso l’Università degli Studi di Udine
8

Tesi di dottorato di Sara Pinosio discussa presso l’Università degli Studi di Udine
9
1
Introduction
1.1 ENERGYPOPLAR project
The present PhD thesis work is part of the EU-funded project ENERGYPOPLAR. The
project, started in May 2008, brings together an interdisciplinary group of ten public
and private partners from six European countries with the ultimate goal of developing
poplar trees with enhanced agronomical traits for industrial production of bioethanol.
With the growing increase in energy demand and rising petrol-based fuel costs, the
development of renewable liquid biofuels derived from cellulosic biomass is a strategic
priority for the European Union. Liquid biofuels offer an important alternative to reduce
Europe’s dependence on fossil fuels, to reduce greenhouse gas emissions and to assist
rural and agricultural development. Green plants are being used increasingly for
production of transportation fuels in Europe and their application is being promoted
through different European directives, which aim to achieve 20% of liquid fuel supply
by 2020 (EREC, 2008). The achievement of this target requires a step-change in the
understanding and manipulation of plant traits and a shift to second generation biofuel
crops. In fact, the most common concern related to the current first generation of
biofuel systems, such as corn and sugarcane, is that, as production capacities increase,
so does their competition with agriculture for arable land used for food production. On
the other hand, second-generation biofuels are produced sustainably by using biomass
comprised of the residual non-food parts of current crops, as well as other crops that are
not used for food purposes, such as poplar trees (Havlík et al., 2010). Trees are
attractive as a bioenergy system because they display a wide range of growth habits and
can be grown on marginal lands unsuited to other agricultural crops, with reduced input
costs and optimized land management.

Tesi di dottorato di Sara Pinosio discussa presso l’Università degli Studi di Udine
10
Among all forest trees, Populus was chosen as the ideal perennial plant to work with. In
fact, Populus is both model and commercial crop, and an extensive genomics toolbox
already exists for this plant. This genomic toolkit includes the annotated genomic
sequence of the north American Populus trichocarpa species (Tuskan et al., 2006),
genome-wide expression oligoarrays (Rinaldi et al., 2007), SNP (single nucleotide
polymorphisms) arrays (Douglas, 2011) and large global transcriptomics databases
where several hundred microarrays expression studies are available for data-mining and
in-silico discovery of candidate genes (Sjödin et al., 2006). In addition, from the fifth
framework project POPYOMICS, four extensive mapping populations with molecular
genetic markers and an electronic database of QTL for biomass quality and quantity are
available and electronically linked to the DNA physical sequence of Populus. A large
natural population of Populus is also available from the sixth framework network of
excellence EVOLTREE.
Central to energizing a new biofuel industry based on conversion of cellulosic biomass
to ethanol is to improve the quality and quantity of biomass feedstock. Current methods
to break down biomass into simple sugars and convert them into ethanol are inefficient
and constitute the core barrier to produce ethanol at quantities and costs competitive
with gasoline. This requires understanding the factors that are key determinants of plant
cell-wall chemical and physical structures. Improving feedstock quality will contribute
to improved bioethanol production. However trees selected for desired cell wall
properties for efficient fuel production must also be productive: yield should be
optimized for low input agricultural systems, ensuring sustainability targets such as
greenhouse gas mitigation, maintenance of ecosystem services and diversity. Thus, high
biomass production needs to be combined with desirable cell wall properties in trees to
be used as a source for generation of biofuels. The specific ENERGYPOPLAR
objectives that have been pursued in the present PhD thesis are:
1- the development of SNP markers usable for the selection of trees carrying beneficial
alleles for biofuel production.
2- the characterization of the genome-wide interspecific sequence divergence among
poplar parental species involved in the production of F1 hybrids. An extensive map of
the interspecific genetic variation will be of help for the selection of markers of
heterosis.
Tesi di dottorato di Sara Pinosio discussa presso l’Università degli Studi di Udine
11
1.2 Detection of SNP markers in lignin
biosynthesis genes
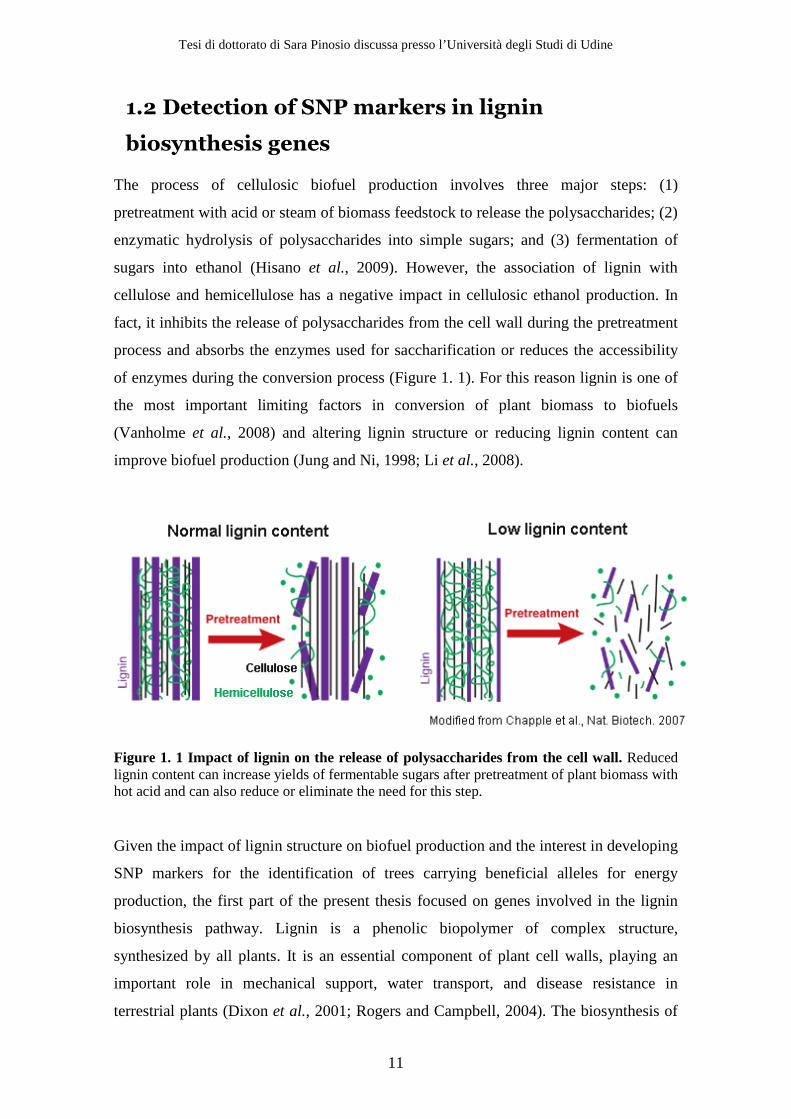
The process of cellulosic biofuel production involves three major steps: (1)
pretreatment with acid or steam of biomass feedstock to release the polysaccharides; (2)
enzymatic hydrolysis of polysaccharides into simple sugars; and (3) fermentation of
sugars into ethanol (Hisano et al., 2009). However, the association of lignin with
cellulose and hemicellulose has a negative impact in cellulosic ethanol production. In
fact, it inhibits the release of polysaccharides from the cell wall during the pretreatment
process and absorbs the enzymes used for saccharification or reduces the accessibility
of enzymes during the conversion process (Figure 1. 1). For this reason lignin is one of
the most important limiting factors in conversion of plant biomass to biofuels
(Vanholme et al., 2008) and altering lignin structure or reducing lignin content can
improve biofuel production (Jung and Ni, 1998; Li et al., 2008).
Figure 1. 1 Impact of lignin on the release of polysaccharides from the cell wall. Reduced lignin content can increase yields of fermentable sugars after pretreatment of plant biomass with hot acid and can also reduce or eliminate the need for this step.
Given the impact of lignin structure on biofuel production and the interest in developing
SNP markers for the identification of trees carrying beneficial alleles for energy
production, the first part of the present thesis focused on genes involved in the lignin
biosynthesis pathway. Lignin is a phenolic biopolymer of complex structure,
synthesized by all plants. It is an essential component of plant cell walls, playing an
important role in mechanical support, water transport, and disease resistance in
terrestrial plants (Dixon et al., 2001; Rogers and Campbell, 2004). The biosynthesis of
Tesi di dottorato di Sara Pinosio discussa presso l’Università degli Studi di Udine
12
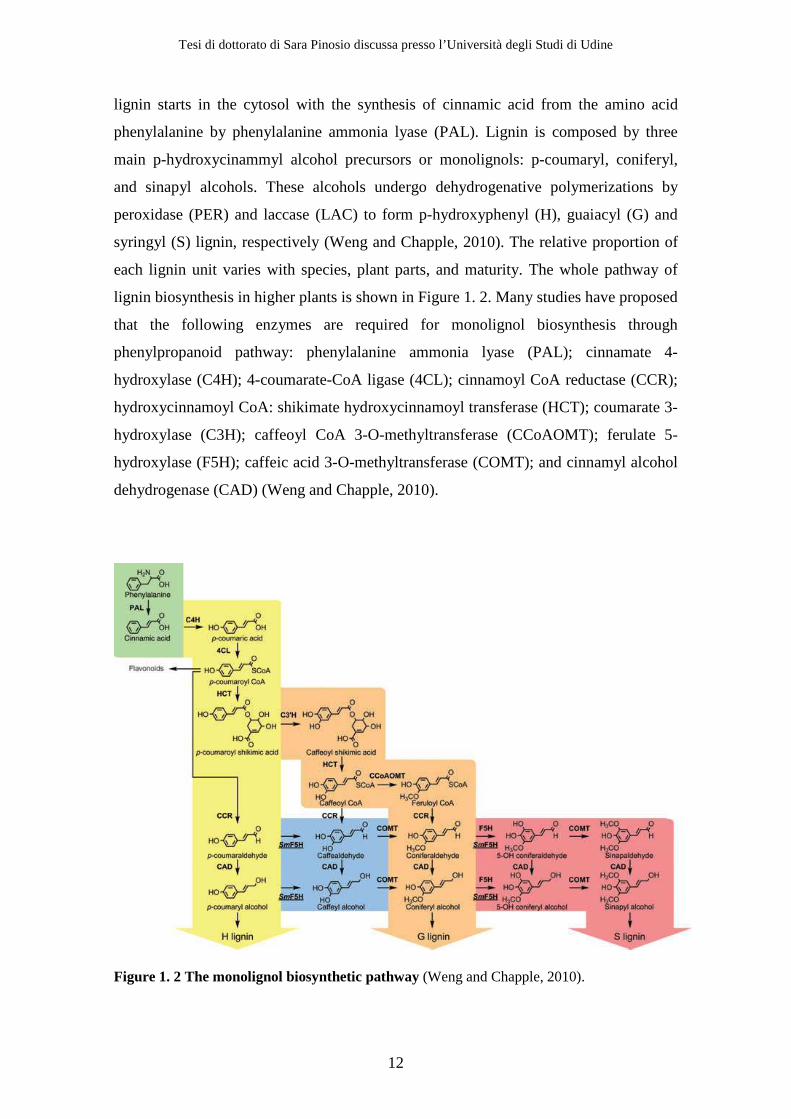
lignin starts in the cytosol with the synthesis of cinnamic acid from the amino acid
phenylalanine by phenylalanine ammonia lyase (PAL). Lignin is composed by three
main p-hydroxycinammyl alcohol precursors or monolignols: p-coumaryl, coniferyl,
and sinapyl alcohols. These alcohols undergo dehydrogenative polymerizations by
peroxidase (PER) and laccase (LAC) to form p-hydroxyphenyl (H), guaiacyl (G) and
syringyl (S) lignin, respectively (Weng and Chapple, 2010). The relative proportion of
each lignin unit varies with species, plant parts, and maturity. The whole pathway of
lignin biosynthesis in higher plants is shown in Figure 1. 2. Many studies have proposed
that the following enzymes are required for monolignol biosynthesis through
phenylpropanoid pathway: phenylalanine ammonia lyase (PAL); cinnamate 4-
hydroxylase (C4H); 4-coumarate-CoA ligase (4CL); cinnamoyl CoA reductase (CCR);
hydroxycinnamoyl CoA: shikimate hydroxycinnamoyl transferase (HCT); coumarate 3-
hydroxylase (C3H); caffeoyl CoA 3-O-methyltransferase (CCoAOMT); ferulate 5-
hydroxylase (F5H); caffeic acid 3-O-methyltransferase (COMT); and cinnamyl alcohol
dehydrogenase (CAD) (Weng and Chapple, 2010).
Figure 1. 2 The monolignol biosynthetic pathway (Weng and Chapple, 2010).
Tesi di dottorato di Sara Pinosio discussa presso l’Università degli Studi di Udine
13
The functions of many lignin genes have been well-studied in several plant species,
especially in dicot plants using either mutants or transgenic plants. Different studies
have reported the possibility to modify or reduce lignin content in biofuel crops by
overexpression, down-regulation, or suppression of genes involved in either lignin
synthesis, regulation, or polymerization (Li et al., 2003; Chen and Dixon, 2007). The
effect on lignin reduction or modification depends on the transgene. For example, the
down-regulation of the upstream genes like C3H, HCT, or 4CL leads to reduction in
lignin content, while the down-regulation of F5H and COMT resulted in changes of S/G
ratio (Weng et al., 2008). However, there are still concerns with the potential
environmental impacts of such genetically modified (GM) plants, including gene flow
from non-native to native plant relatives. As a result non-GM biotechnologies using
‘molecular breeding’ remain particularly attractive. An alternative approach to
transgenesis is the identification of natural mutations affecting the activity of these
genes and the evaluation of the phenotypic effects of such mutations. In fact, the huge
reservoir of genetic diversity present in the Populus germplasm has so far been poorly
exploited because of the inefficiency in identifying natural variants for candidate genes.
Functional variants are likely to be rare (Eyre-Walker, 2010) and the identification of
rare SNPs requires sample sizes larger than those commonly used in studies aimed at
surveying genetic variation. New methods are being developed that allow fast and
cheap resequencing of genes and genomes and even the standard Sanger sequencing
technology has now become so affordable that gene resequencing can be accomplished
on hundreds of individuals (Greenman et al., 2007). For this reason we decided to
screen a large population of Populus nigra to identify both common and rare functional
variants in candidate genes of lignin biosynthesis pathway.
1.2.1 CAD4 Sanger sequencing
We decided to start with the analysis of the natural genetic variation in one of the ten
genes involved in lignin biosynthesis: the cinnamyl alcohol dehydrogenase (CAD).
CAD is a family of genes involved in lignin biosynthesis in several plants (Walter et al.,
1988). In Populus, the CAD gene family includes at least 15 candidates (Barakat et al.,
2009) (Figure 1. 3). Natural loss-of function CAD mutants have been identified in
several plants (Halpin et al., 1998; Sattler et al., 2009); however, no natural loss-of
function CAD mutant has been identified in poplar so far. We therefore set out to search

Tesi di dottorato di Sara Pinosio discussa presso l’Università degli Studi di Udine
14
for natural polymorphisms occurring in CAD and obtain a map of genetic variation in
the gene.
CAD4 was the first of the CAD genes to be isolated and cloned (Van Doorsselaere et
al., 1995). Following the isolation of CAD4 cDNA, transgenic poplar trees expressing
antisense CAD4 construct were obtained (Baucher et al., 1996). Transgenic poplars
with reduced CAD4 activity showed structural alterations of lignin (Lapierre et al.,
1999), thus confirming the importance of CAD4 in determining lignin composition.
Among the members of CAD family, CAD4 is considered to be the most important
CAD gene in the poplar lignin biosynthetic pathway based on phylogenetic and
expression analyses (Hamberger et al., 2007). A recent study (Shi et al., 2010) showed
that CAD4 (referred to in the study as PtrCAD1) is the only gene of the CAD family
showing a substantial expression and a high specificity for differentiating xylem and is
therefore likely to be the only gene of the family actively involved in lignin formation
in differentiating xylem. Given this background information, CAD4 was chosen as the
most interesting member of the CAD gene family to be investigated in detail.
Figure 1. 3 Distribution of CAD genes on Populus chromosomes (Barakat et al., 2009). The names of the chromosomes and their sizes (Mb) are indicated below each chromosome. Segmental duplicated homeologous blocks are indicated with the same color. The position of genes is indicated with an arrowhead.

Tesi di dottorato di Sara Pinosio discussa presso l’Università degli Studi di Udine
15
Polymorphisms detected in the protein-coding region of the gene will fall in one of the
three functional categories: nonsense mutations (null alleles) which cause a stop codon,
and thus lead to a truncated protein; missense mutations which cause an amino acidic
change; and synonymous polymorphisms, which have no effect on the amino acidic
sequence of the protein. Nonsense mutations are likely to have the strongest effect on
lignin content. However, such alleles are likely to be negatively selected, and thus rare
(Eyre-Walker, 2010). Missense mutations, causing an amino acidic change, can have an
impact on the structure of the enzyme and thus on the efficiency with which lignin is
produced. Although synonymous polymorphisms do not affect amino acidic
composition of the protein, they can in some instances affect the correct splicing of the
gene or they can be in linkage disequilibrium (LD) with some undetected functional
variant. Genome-wide and candidate gene association mapping can thus be used to
identify the role of such variants (Risch and Merikangas, 1996). Noncoding
polymorphism can affect the expression of the gene when located in promoter or in
other regulatory regions.
Surveys of nucleotide polymorphisms are customarily performed on less than 50
individuals (Gilchrist et al., 2006; Ingvarsson, 2008; Olson et al., 2010), and are likely
to miss SNPs with frequencies equal or lower than 1%. However, functional
polymorphisms, if negatively selected, are likely to be rare (Eyre-Walker, 2010) and
require larger sample sizes. With this in mind, we set out to identify and study naturally
occurring polymorphisms in a large collection of 384 Populus nigra individuals
originating from various geographical areas in Europe. We screened each genotype for
nonsense, missense, and synonymous mutations in CAD4.
1.2.2 Pooled multiplex sequencing of CAD4, HCT1, C3H3,
CCR7 and 4CL3
With the advent of Next Generation Sequencing (NGS), our sequencing abilities
increased and we decided to deepen the study by increasing sample size and increasing
the number of candidate genes. To study the natural variation in genes involved in the
lignin biosynthesis pathway in a larger Populus population, we decided to exploit NGS
Illumina technology. We used pooled multiplexed NGS to screen 768 Populus nigra
accessions for mutations in five genes involved in lignin biosynthesis. We selected the
Tesi di dottorato di Sara Pinosio discussa presso l’Università degli Studi di Udine
16
candidates prioritizing genes for which (a) a known effect on lignin biosynthesis has
been documented either in poplar or in other species through the respective orthologs
(Vanholme et al., 2008), (b) functional redundancy is less pronounced (Shi et al.,
2010), and (c) expression is higher in differentiating xylem compared to other tissues
(Shi et al., 2010). The selected candidate genes were CAD4, HCT1, C3H3, CCR7 and
4CL3.
1.2.3 Next-generation sequencing technology
In the last few years, the high demand for low-cost sequencing has driven the
development of high-throughput sequencing technologies that parallelize the
sequencing process, producing thousands or millions of sequences at once. Next-
generation sequencing (NGS) allows researchers to obtain a large amount of genetic
data in the form of short sequences at an unprecedented rate. NGS platforms share a
common technological feature: massively parallel sequencing of clonally amplified or
single DNA molecules, spatially separated in a flow cell (Shendure and H., Ji, 2008).
This design is a paradigm shift from that of Sanger sequencing, which is based on the
electrophoretic separation of chain-termination products produced in individual
sequencing reactions. In NGS, sequencing is performed by repeated cycles of
polymerase-mediated nucleotide extensions. As a massively parallel process, NGS
generates hundreds of megabases to gigabases of nucleotide sequence output in a single
instrument run (Mardis, 2008).
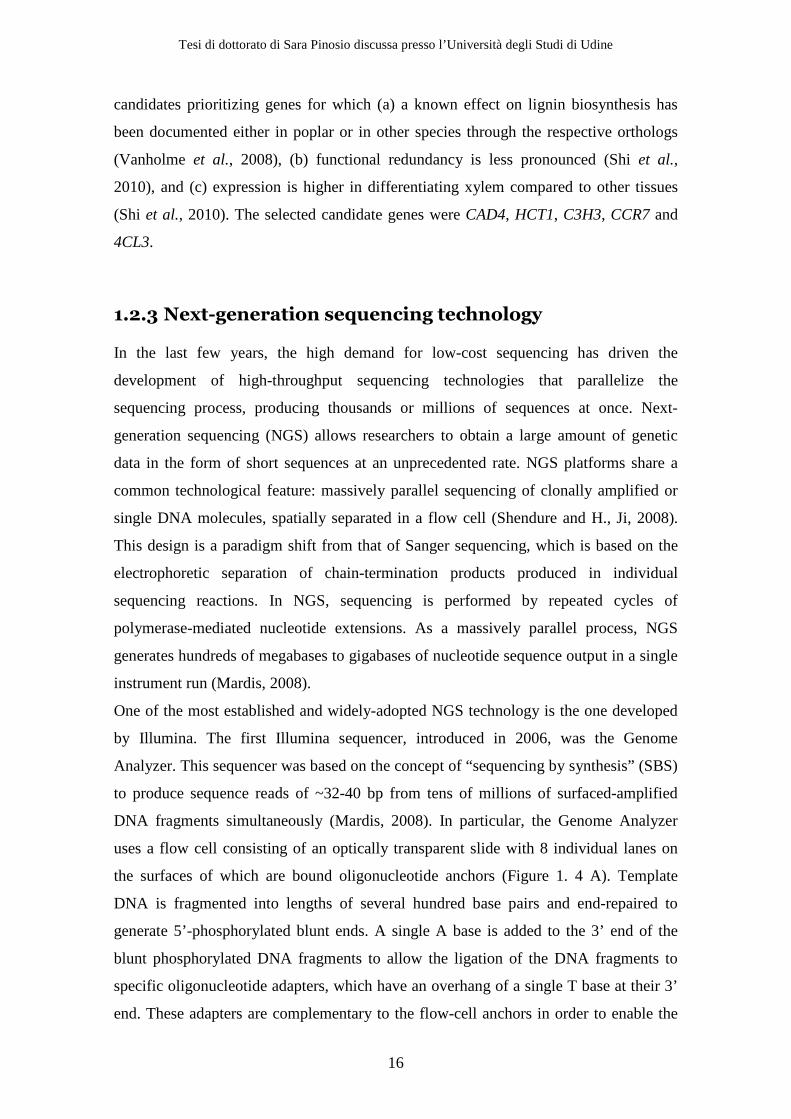
One of the most established and widely-adopted NGS technology is the one developed
by Illumina. The first Illumina sequencer, introduced in 2006, was the Genome
Analyzer. This sequencer was based on the concept of “sequencing by synthesis” (SBS)
to produce sequence reads of ~32-40 bp from tens of millions of surfaced-amplified
DNA fragments simultaneously (Mardis, 2008). In particular, the Genome Analyzer
uses a flow cell consisting of an optically transparent slide with 8 individual lanes on
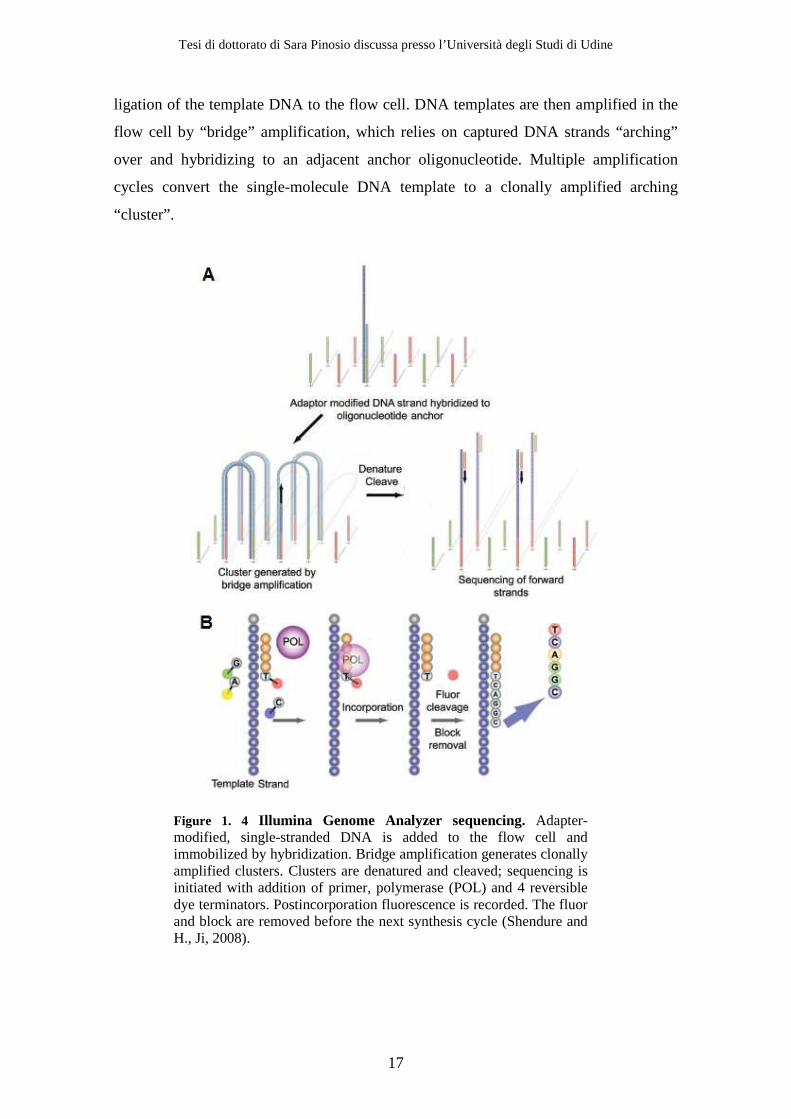
the surfaces of which are bound oligonucleotide anchors (Figure 1. 4 A). Template
DNA is fragmented into lengths of several hundred base pairs and end-repaired to
generate 5’-phosphorylated blunt ends. A single A base is added to the 3’ end of the
blunt phosphorylated DNA fragments to allow the ligation of the DNA fragments to
specific oligonucleotide adapters, which have an overhang of a single T base at their 3’
end. These adapters are complementary to the flow-cell anchors in order to enable the
Tesi di dottorato di Sara Pinosio discussa presso l’Università degli Studi di Udine
17
ligation of the template DNA to the flow cell. DNA templates are then amplified in the
flow cell by “bridge” amplification, which relies on captured DNA strands “arching”
over and hybridizing to an adjacent anchor oligonucleotide. Multiple amplification
cycles convert the single-molecule DNA template to a clonally amplified arching
“cluster”.
Figure 1. 4 Illumina Genome Analyzer sequencing. Adapter-modified, single-stranded DNA is added to the flow cell and immobilized by hybridization. Bridge amplification generates clonally amplified clusters. Clusters are denatured and cleaved; sequencing is initiated with addition of primer, polymerase (POL) and 4 reversible dye terminators. Postincorporation fluorescence is recorded. The fluor and block are removed before the next synthesis cycle (Shendure and H., Ji, 2008).

Tesi di dottorato di Sara Pinosio discussa presso l’Università degli Studi di Udine
18
Approximately 50 x 106 separate clusters could be generated per flow cell. For
sequencing, the clusters are denatured, and a subsequent chemical cleavage reaction and
wash leave only forward strands for single-end sequencing (Figure 1. 4 B). Sequencing
of the forward strands is initiated by hybridizing a primer complementary to the adapter
sequences, which is followed by addition of polymerase and a mixture of 4 differently
colored fluorescent reversible dye terminators. The terminators are incorporated
according to sequence complementarity in each strand in a clonal cluster. After
incorporation, excess reagents are washed away, the clusters are optically interrogated,
and the fluorescence is recorded. With successive chemical steps, the reversible dye
terminators are unblocked, the fluorescent labels are cleaved and washed away, and the
next sequencing cycle is performed. This iterative, sequencing-by-synthesis process
required approximately 2.5 days to generate read lengths of 36 bases. With 50 x 106
clusters per flow cell, the overall sequence output was >1 Gb per analytical run
(Bentley et al., 2008). Subsequent to the first Genome Analyzer, new platforms with an
improved throughput were launched by Illumina: the Genome Analyzer IIx, which can
generate up to 90 Gb per analytical run with read lengths of 150 bp and the latest
HiSeq2000 that can produce more than 600 Gb per run with read lengths of 100 bp.
Illumina, as other NGS technologies, offers also the possibility to sequence both ends of
template molecules (Figure 1. 5 A). Such “paired-end” sequencing provides positional
information that facilitates alignment and assembly (Korbel et al., 2007; Campbell et
al., 2008) and is emerging as a key technique for assessing genome rearrangements and
structural variation on a genome-wide scale. An interesting application of Illumina NGS
is the “multiplex sequencing”, i.e. the sequencing of different DNA samples in the same
lane. Considering the high throughput of the latest sequencing machine, multiplexing is
very useful when targeting specific genomic regions or working with small genomes. In
fact, pooling samples into a single lane of a flow cell exponentially increases the
number of samples analyzed in a single run without drastically increasing costs or time.
In the multiplexed sequencing method, DNA libraries are “tagged” with a unique DNA
sequence, or index, during sample preparation. Multiple samples are then pooled into a
single lane on a flow cell and sequenced together in a single run. An automated three-
read sequencing strategy (Figure 1. 5 B) identifies with high accuracy each uniquely
tagged sample for individual downstream analysis.
The high-throughput of NGS sequencing technologies enables resequencing of
individual genomes, or targeted re-sequencing of a number of selected regions in a large

Tesi di dottorato di Sara Pinosio discussa presso l’Università degli Studi di Udine
19
number of pooled individuals (Ingman and Gyllensten, 2009). NGS can be used to
screen large populations for rare functional variants in target genes, and as a follow-up
to genome-wide association studies, to extensively sequence regions surrounding
associated single nucleotide polymorphisms (Druley et al., 2009). Previous studies have
indicated that NGS can reliably detect variants in pooled samples (Druley et al., 2009;
Out et al., 2009).
Figure 1. 5 A. Paired-end sequencing: adapters (A1 and A2) are ligated onto DNA fragments. Template cluster are formed on the flow cell by bridge amplification and the two ends (R1 and R2) are sequentially sequenced. B. Multiplex sequencing. During library preparation, a 6 bp sequence is added to the DNA insert allowing the sequencing of different libraries in the same lane of a flow cell.
1.3 Phenotypic effect of structural variants
High yield is an important phenotypic trait for energy crops. Natural phenotypic
variation observed among different genotypes can be partly explained by the presence
of genetic variants. Understanding the genetic basis of phenotypic variation is important
for the identification of genetic markers usable for the prediction of specific phenotypic
traits. In poplar, high yield depends on the successful exploitation of the remarkable
Tesi di dottorato di Sara Pinosio discussa presso l’Università degli Studi di Udine
20
hybrid vigor that is achieved when crossing different species to produce interspecific F1
hybrids. The molecular bases of hybrid vigor remain elusive despite a long history of
exploitation of heterosis in breeding and of research on this topic. Recent studies
focused on the role of regulatory variation in determining heterosis that finds its basis in
DNA sequence variation (Springer and Stupar, 2007). A correlation between genetic
distance and heterosis has long been recognized even though it is not a perfect one
(Frascaroli et al., 2007). For example, analysis of the genomic variation in maize, a
species with pronounced intraspecies hybrid vigor, showed remarkable sequence
variation especially outside of transcribed regions (Brunner et al., 2005) that is
accompanied by high levels of cis-regulatory variation resulting in differential
expression of the two alleles present in the hybrid (Stupar and Springer, 2006).
Preliminary analysis of sequence variation among different Populus species showed
limited levels of variation in transcribed regions, while intergenic regions harbor much
more variation, even though still less than that observed in maize (G. Zaina and M.
Morgante, unpublished).
To explore the extent of sequence diversity present between different poplar species and
get a sense of its possible contribution to phenotypic variation, we set out to study the
P. nigra-P. deltoides sequence divergence at a genome-wide level by means of Illumina
next-generation sequencing. It was long assumed that most of the genome variation
arises from single nucleotide polymorphisms. In recent years, the role of another type of
genetic variation has been recognized, namely, structural variation (Manolio et al.,
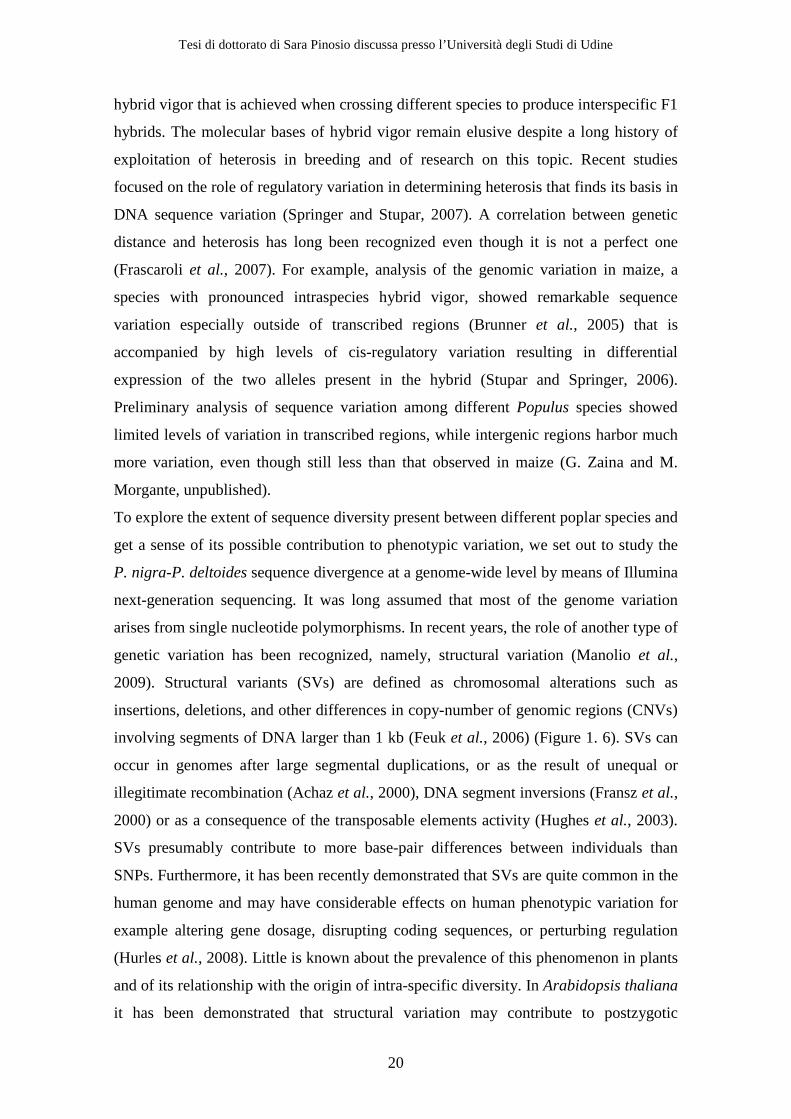
2009). Structural variants (SVs) are defined as chromosomal alterations such as
insertions, deletions, and other differences in copy-number of genomic regions (CNVs)
involving segments of DNA larger than 1 kb (Feuk et al., 2006) (Figure 1. 6). SVs can
occur in genomes after large segmental duplications, or as the result of unequal or
illegitimate recombination (Achaz et al., 2000), DNA segment inversions (Fransz et al.,
2000) or as a consequence of the transposable elements activity (Hughes et al., 2003).
SVs presumably contribute to more base-pair differences between individuals than
SNPs. Furthermore, it has been recently demonstrated that SVs are quite common in the
human genome and may have considerable effects on human phenotypic variation for
example altering gene dosage, disrupting coding sequences, or perturbing regulation
(Hurles et al., 2008). Little is known about the prevalence of this phenomenon in plants
and of its relationship with the origin of intra-specific diversity. In Arabidopsis thaliana
it has been demonstrated that structural variation may contribute to postzygotic
Tesi di dottorato di Sara Pinosio discussa presso l’Università degli Studi di Udine
21
isolation through the production of genetically deficient hybrids (Lynch and Conery,
2003). Currently, not much interest has been manifested for the detection and
consequences of structural polymorphisms in plants, but, although the global impact of
structural variation is unknown, it might have dramatic consequences on phenotypic
diversity (Weigel and Mott, 2009).
Figure 1. 6 Types of structural variants (Hurles et al., 2008).
SVs can be divided in two groups on the basis of their sequence length: 1) small SVs,
when they range from 1 to ~30 kb in size, and 2) large SVs, that can extend from ~30
Kb to few Mb. Many small insertion/deletions are probably due to the recent movement
of transposable elements (TEs), that are very active in many plants. In fact, TEs are a
tremendous source of genome instability and genetic variation; for example, they
impact gene expression via the introduction of alternative regulatory elements, exons,
and splice junctions (Ray and Batzer, 2011). In addition, TEs can mediate genome
rearrangements through nonhomologous recombination (Eichler and Sankoff, 2003).
The molecular basis of the larger SVs, referred also as copy number variations (CNVs),
are still not fully understood. However, several recent studies have reported their
presence in the human genome (Sebat et al., 2004; Tuzun et al., 2005). The presence of
large CNVs has also been reported in maize where a region of ~2.6 Mb present in the

Tesi di dottorato di Sara Pinosio discussa presso l’Università degli Studi di Udine
22
inbred line B73 but entirely absent from the Mo17 inbred line was identified (Springer
et al., 2009).
To study interspecific sequence divergence in poplar we performed whole genome
next-generation sequencing of 18 poplar accessions: 4 Populus nigra accessions, 2
Populus deltoides and 12 P. nigra x P. deltoides F1 hybrids, obtained by crossing two
of the four resequenced P. nigra and the two resequenced P. deltoides with a factorial
design. We then took advantage from two different analytical strategies for the
detection of the two different classes of structural variants:
1- small variants (deletions and insertions), probably resulting from the movement of
TEs, were detected by comparing P. nigra and P. deltoides sequences with respect to
the P. trichocarpa reference sequence.
2- larger variants, whose mechanism of origin is not fully understood, were detected by
comparing sequences from P. nigra with those from P. deltoides.
1.4 Methods for SV detection
The earliest methods for discovering structural variants are based on whole-genome
array comparative genomic hybridization (aCGH) (Medvedev et al., 2009). Array CGH
platforms are based on the principle of comparative hybridization of two labeled
samples (test and reference) to a set of hybridization targets to test the relative
frequencies of probe DNA segments between two samples (Pinkel et al., 1998) (Figure
1. 7). However the power of this technology in identifying structural variant is limited.
In fact, aCGH is limited to detecting only copy number differences of sequences that
are present in the reference assembly used to design the probes. Array CGH platforms
cannot identify balanced structural variants or, in the case of duplication, specify the
location of a duplicated sequence. In addition, the breakpoint resolution of any
prediction is correlated with the density of the probes on the array and is usually low
(~50 Kb). SNP microarrays have been used for SVs discovery and genotyping (Cooper
et al., 2008). These platforms are also based on hybridization and measure the intensity
of probe signals at known SNP loci. For this reason, SNP microarrays suffer of the
same limitations as aCGH. The advent of next-generation sequencing technologies
promises to revolutionize structural variation studies and replace microarrays as the

Tesi di dottorato di Sara Pinosio discussa presso l’Università degli Studi di Udine
23
platforms for discovery and genotyping. However, NGS approaches present substantial
computational and bioinformatics challenges. In general, the identification of SVs from
NGS data is performed by mapping sequence reads to a reference genome and
subsequently identifying signature or patterns that are diagnostic of different classes of
SV. In particular, there are two main signatures that can be exploited for the detection
of SVs from NGS data: paired-end mapping (PEM) and depth of coverage (DOC)
(Medvedev et al., 2009).
Figure 1. 7 Array CGH technology. DNA from two samples is differentially labelled, using different fluorophores, and hybridized to several thousand DNA probes. Differences in copy number between the two samples are detected as differences in the intensities of the two fluorophores.
1.4.1 Paired-end mapping (PEM) signature
The paired-end mapping signature results from the analysis of the mapping information
of paired-end reads aligned against a reference genome. Using this signature, structural
variants can be detected with the presence of ‘discordant’ paired reads, i.e. pairs in
which the mapping span and/or orientation of read pairs are inconsistent with the
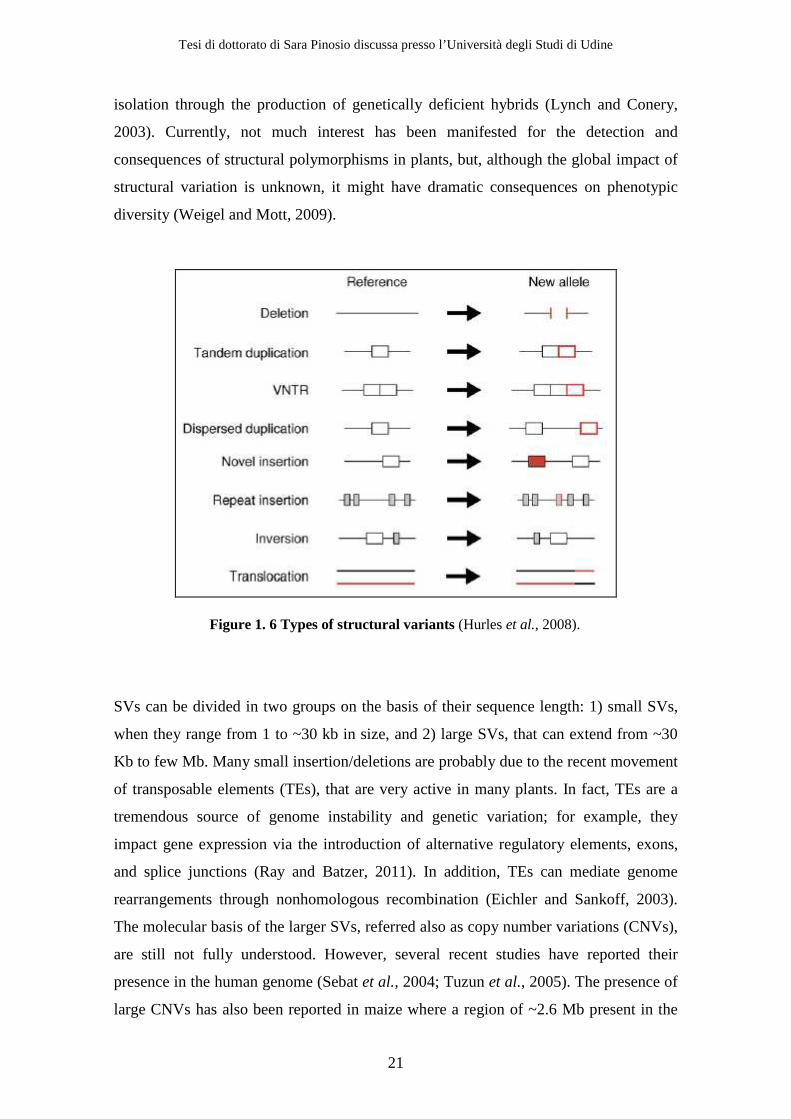
reference genome (Figure 1. 8). Most classes of variation can, in principle, be detected.
Deletions can be detected by the presence of read pairs that map to reference genome
Tesi di dottorato di Sara Pinosio discussa presso l’Università degli Studi di Udine
24
with a mapping distance greater than the insert size. Conversely, insertions can be
detected by the presence of read pairs with a mapping distance smaller than the
expected one. However, basic insertion signature suffer from two main limitations: 1)
no signature is detected when the size of the insertion is greater than the insert size of
the sequenced fragment and 2) the signature gives no information regarding
composition of the inserted sequence. Another variant that leaves a clear PEM signature
is an inversion: a paired-read that spans one of the breakpoints of an inversion will map
to the reference genome with the orientation of the read, lying within the inversion,
flipped (Korbel et al., 2007).
Figure 1. 8 PEM signature. Schematic representation of the paired-end mapping signature usable for the detection of deletions, insertions and inversions.
The read-pair method is the most widely applied approach for the detection of SVs, and
was first demonstrated using BAC end sequences (Volik et al., 2003) and subsequently
applied with fosmid paired-end sequences (Tuzun et al., 2005). Only later was applied
to next-generation sequencing (Korbel et al., 2007). Several computational tools based
on PEM signature have been developed for the detection of structural variants from
NGS data, including PEMer (Korbel et al., 2009), VariationHunter (Hormozdiari et al.,
2010), BreakDancer (Chen et al., 2009) and MoDIL (Lee et al., 2009).
We decided to take advantage from PEM signature for the detection of small deletions
and insertions occurring in P. nigra and P. deltoides sequenced individuals with respect
to the P. trichocapra reference genome. For the detection of deletions, we decided to
Tesi di dottorato di Sara Pinosio discussa presso l’Università degli Studi di Udine
25
use BreakDancerMax (Chen et al., 2009). On the other hand, for the detection of the
insertions, none of the available methods using PEM signature could be employed. In
fact, we are interested in the detection of insertions of sequences that are greater than
the standard Illumina insert size (~500 bp) and, as a consequence, simple PEM
signature cannot be applied. For this reason we decided to develop a custom pipeline
for the detection of insertions resulting from the movement of transposable elements.
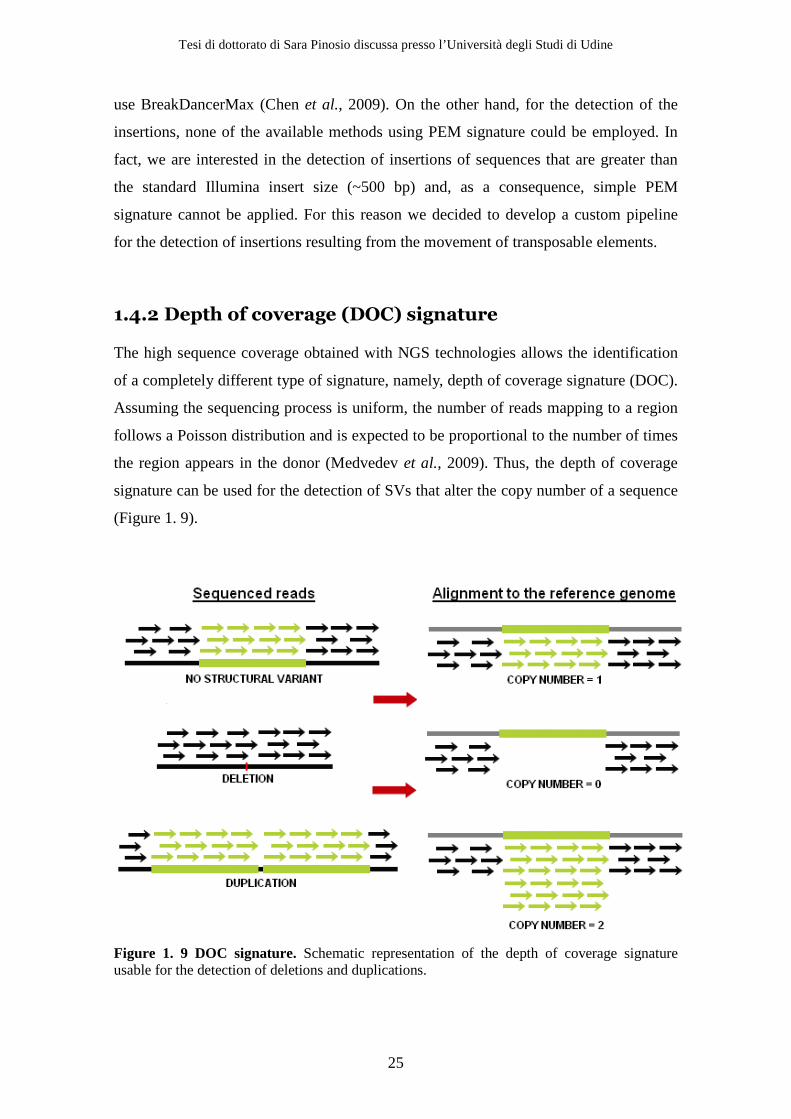
1.4.2 Depth of coverage (DOC) signature
The high sequence coverage obtained with NGS technologies allows the identification
of a completely different type of signature, namely, depth of coverage signature (DOC).
Assuming the sequencing process is uniform, the number of reads mapping to a region
follows a Poisson distribution and is expected to be proportional to the number of times
the region appears in the donor (Medvedev et al., 2009). Thus, the depth of coverage
signature can be used for the detection of SVs that alter the copy number of a sequence
(Figure 1. 9).
Figure 1. 9 DOC signature. Schematic representation of the depth of coverage signature usable for the detection of deletions and duplications.
Tesi di dottorato di Sara Pinosio discussa presso l’Università degli Studi di Udine
26
In fact, the depth of coverage analysis examines the increase and decrease in sequence
coverage to detect duplications and deletions, respectively, and to predict absolute copy
numbers of genomic intervals (Alkan et al., 2011; Yoon et al., 2009). Read-depth
approaches using NGS data were first applied to define rearrangements in cancer
(Campbell et al., 2008) and to build absolute copy number maps of the human genome
(Sudmant et al., 2010).
Unlike the PEM insertion signature, the gain DOC signature does not indicate were an
insertion occurred, but rather what duplicated sequence has been inserted. The strength
of a gain/loss signature is directly related to the coverage of the dataset and to the size
of the CNV. In contrast to most PEM signatures, DOC signatures can be used to detect
very large events; in fact, the larger the event, the stronger the signature. However, they
are not able to identify smaller events that PEM signatures are able to detect; they are
also much poorer at localizing breakpoints.
We thus decided to use the DOC signature to detect large regions of copy number
variation between the P. nigra and P. deltoides sequenced individuals in order to
determine the level of sequence homology among these two species and to check for the
presence of large CNVs as those reported in maize (Springer et al., 2009) and in
humans (Tuzun et al., 2005).
Tesi di dottorato di Sara Pinosio discussa presso l’Università degli Studi di Udine
27
2
Genetic Diversity in CAD4
The content of this chapter has been published:
Nucleotide diversity and linkage disequilibrium in Populus nigra cinnamyl alcohol dehydrogenase (CAD4) gene. F. Marroni, S. Pinosio, G. Zaina, F. Fogolari, N. Felice, F. Cattonaro and M. Morgante. Tree Genetics & Genomes, 2011.
2.1 Materials and Methods
2.1.1 Subjects and genotyping
Individuals included in the present study were originally collected in five different
European nations: France (n=169), Italy (n=103), Germany (n=50), The Netherlands
(n=48) and Spain (n=14). In Italy, Germany and Spain trees were collected from one to
three locations, while in France and The Netherlands they were collected at several
different sites. DNA extraction was performed on dehydrated leaves using the DNeasy
plant kit (Qiagen, Inc., Valencia, CA).
Although components of CAD gene family in poplar are now well characterized
(Barakat et al., 2009), until a few years ago, researchers focused their efforts on a single
gene coding for Cinnamyl Alcohol Dehydrogenase (CAD, EC 1.1.1.195), located on
Linkage Group (LG) IX of the P. trichocarpa genome (Lapierre et al., 1999). We
focused on the same gene, which is now named CAD4, and is one of the only two genes
of the CAD family which are preferentially expressed in the xylem (Barakat et al.,
Tesi di dottorato di Sara Pinosio discussa presso l’Università degli Studi di Udine
28
2009). Primer design was performed using Primer3plus (Untergasser et al., 2007).
Table 2. 1 lists the primers used in the experiment. DNA amplifications were performed
in a 20 µl volume. The reactions contained on average 15 ng of genomic DNA and the
following reagents: 0.3 µM of each primer, 250 µM of each dNTP, 1.5 mM MgCl2, 2%
DMSO, 1 unit Amplitaq Gold (Applied Biosystems, Foster City, CA) and 1X PCR
buffer II (Applied Biosystems, Foster City, CA). The reactions were performed in the
Geneamp 9700 PCR system (Applied Biosystems, Foster City, CA), under the
following conditions: 95 °C for 10 min., 35 cycles of 20 sec. at 94 °C, 30 sec. at 60 °C
and 1 min. 30 sec. at 72 °C, followed by a final extension of 10 min. at 72 °C. PCR
products were analysed on agarose gel and purified using Agencourt Ampure magnetic
beads (Beckmann Coulter, Fullerton, CA) using a Biomek FX robot (Beckmann
Coulter, Fullerton, CA).
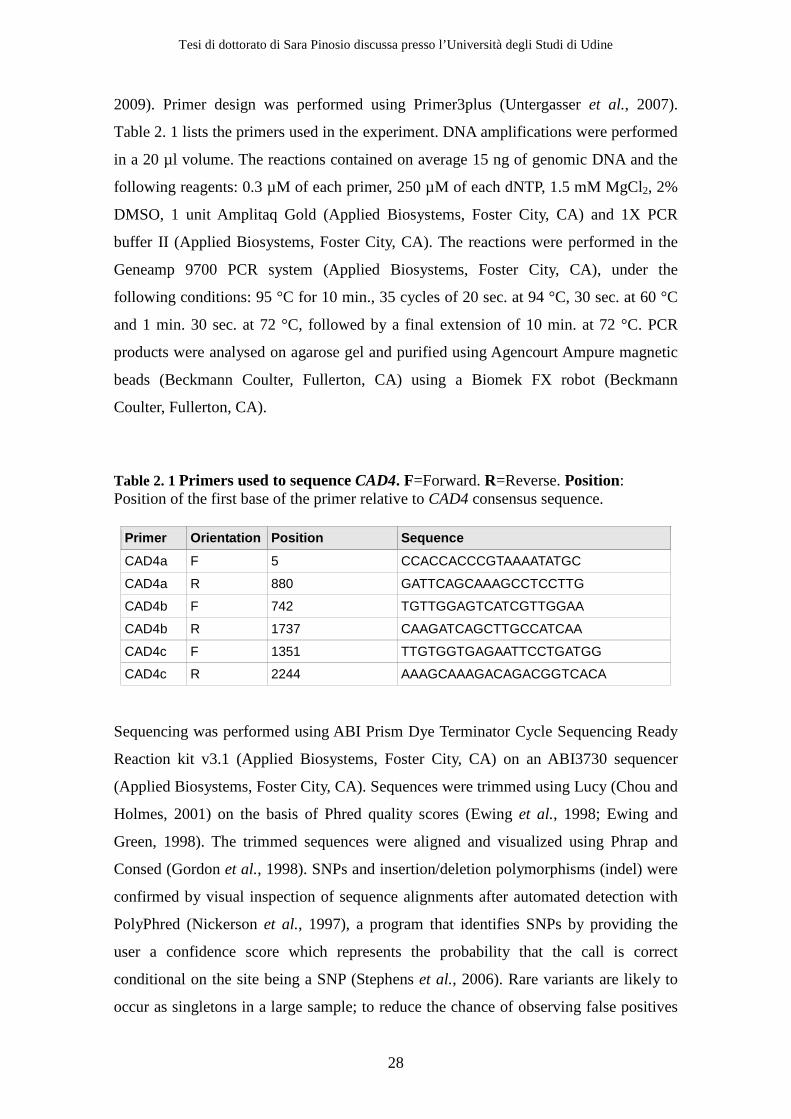
Table 2. 1 Primers used to sequence CAD4. F=Forward. R=Reverse. Position: Position of the first base of the primer relative to CAD4 consensus sequence.
Primer Orientation Position Sequence
CAD4a F 5 CCACCACCCGTAAAATATGC
CAD4a R 880 GATTCAGCAAAGCCTCCTTG
CAD4b F 742 TGTTGGAGTCATCGTTGGAA
CAD4b R 1737 CAAGATCAGCTTGCCATCAA
CAD4c F 1351 TTGTGGTGAGAATTCCTGATGG
CAD4c R 2244 AAAGCAAAGACAGACGGTCACA
Sequencing was performed using ABI Prism Dye Terminator Cycle Sequencing Ready
Reaction kit v3.1 (Applied Biosystems, Foster City, CA) on an ABI3730 sequencer
(Applied Biosystems, Foster City, CA). Sequences were trimmed using Lucy (Chou and
Holmes, 2001) on the basis of Phred quality scores (Ewing et al., 1998; Ewing and
Green, 1998). The trimmed sequences were aligned and visualized using Phrap and
Consed (Gordon et al., 1998). SNPs and insertion/deletion polymorphisms (indel) were
confirmed by visual inspection of sequence alignments after automated detection with
PolyPhred (Nickerson et al., 1997), a program that identifies SNPs by providing the
user a confidence score which represents the probability that the call is correct
conditional on the site being a SNP (Stephens et al., 2006). Rare variants are likely to
occur as singletons in a large sample; to reduce the chance of observing false positives
Tesi di dottorato di Sara Pinosio discussa presso l’Università degli Studi di Udine
29
due to amplification and sequencing errors, we introduced the following quality
controls: 1) we included in the present study only SNPs with a confidence score equal
to 99; 2) whenever SNP information was available on both strands or in mutliple
amplicons, we built a “SNP consensus” integrating information from different reads for
each individual; 3) at each SNP position, we considered only individual sequences for
which the genotype quality score was higher than 98%. Two multiallelic SNPs were
excluded from further analyses. Intron-exon boundaries were defined according to
poplar genome versions 1.1 (http://www.jgi.org) and 2 (http://www.phytozome.com),
and confirmed using the gene prediction program GeneMark (Lomsadze et al., 2005).
To predict the effect of the amino acid substitutions on protein structure and function
we built molecular models of mutants based on the Protein Data Bank structure
(http://www.rcsb.org/pdb) of the closely related cinnamyl alcohol dehydrogenase of
Arabidopsis thaliana (PDB id. 2CF5) which displays 78% identity in sequence. We
used the program Swiss-PDB-Viewer (Guex and Peitsch, 1997) for building consensus
and all mutant structures. No sidechain refinement was attempted at this stage as only
gross features of the models were used.
2.1.2 Statistical analyses
Two measures of LD between pairs of SNPs, r2 and D', were calculated using the R
(http://www.r-project.org) package genetics. Since singleton SNPs give no information
when calculating LD, we excluded them from LD analyses. The decay of r2 with
distance was fitted using Hill and Weir expectation of r2 between adjacent sites (Hill
and Weir, 1988). In accordance with previous work (Remington et al., 2001), we used
the equation:
where n is the sample size and C, the parameter to be estimated, represents the product
of the population recombination parameter (ρ=4Ner) and the distance in base pairs. The
decay of D' was fitted using the equation E(D')=(1-θ)t, where t, the parameter to be
estimated, represents the number of generations since D'=1 (Abecasis et al., 2001).
Non-linear least squares, implemented in the R package nls, were used to fit equations
to our data.

Tesi di dottorato di Sara Pinosio discussa presso l’Università degli Studi di Udine
30
Multilocus haplotype reconstruction was performed using PHASE 2.1.1 (Stephens et
al., 2001), which has been shown to provide accurate estimates of haplotype
frequencies from population data (Marroni et al., 2005). Haplotypes were reconstructed
in the whole dataset assuming a panmictic model and in each individual country of
origin. Tajima's D, Fay and Wu's H, and McDonald-Kreitman tests were performed with
DNAsp (Librado and Rozas, 2009). The effect of sample size on population genetics
parameter estimates was investigated by sampling subsets of six different sizes (5, 10,
25, 50, 125 and 250 individuals) and calculating nucleotide diversity and neutrality
statistics. For each sample size we produced by resampling five subsets.
Some of the analyses required an outgroup; we therefore included two P. trichocarpa
sequences for CAD4, retrieved from Joint Genome Institute (http://www.jgi.org) and
National Center for Biotechnology Information (http://www.ncbi.nlm.nih.gov/) web
sites.
2.2 Results
We obtained sequences of CAD4 from 360 trees (GenBank accessions: HM440565 to
HM440924). Consensus sequence was 2240 bp long; coding sequence was 1074 bp
long, and was formed by five exons (Figure 2. 1). The consensus of P. nigra CAD4 was
aligned using BLAST against the whole P. trichocarpa genome. The best hit was P.
trichocarpa CAD4 sequence (locus estExt_Genewise1_v1.C_LG_IX2359 in poplar
genome v1.1, locus POPTR_0009s09870 in poplar genome v2), showing 97% identities
to the whole length of the query, an expected value of 0 and a score of 3736. The
second best hit was on scaffold one, showing 89% identities to a fragment of 886 bases
of the query, an expected value of 0 and a score of 1126. These results confirm that
produced sequences belonged to the CAD4 locus.
Figure 2. 1 Positions of SNPs (vertical bars) and deletions (asterisks) relative to noncoding sequences (represented as horizontal lines) and exons (boxes).

Tesi di dottorato di Sara Pinosio discussa presso l’Università degli Studi di Udine
31
We identified 45 SNPs, corresponding to one SNP every 50 base pairs. The complete
list of the SNPs, together with the corresponding minor allele frequency is presented in
supplementary Table S- 1. Thirteen of the 45 SNPs are in CAD4 coding sequence, and
six of them cause amino acid substitutions (Table 2. 2); position of SNPs and indels
relative to the coding sequence of CAD4 are depicted in Figure 2. 1. In addition, we
identified 5 deletions and one insertion, all in non-coding regions (
Table 2. 3).
Table 2. 2 Predicted aminoacidic substitutions caused by non-synonymous SNPs. Consensus (bp): position of the SNP relative to the consensus sequence. SNP: Common allele/rare allele. Coding (bp): Position of the SNP relative to the consensus coding sequence. a.a. change: amino acid substitution caused by the variant.
Consensus (bp) SNP Coding (bp) a.a. change
409 G/C 109 V37L
484 C/T 184 H62Y
777 C/A 310 N104H
1361 A/G 443 K148R
1515 A/G 597 I199M
1753 G/A 835 A279T
Table 2. 3 Insertions and deletions identified in CAD4. Position (bp): Position of the insertion or deletion relative to the consensus sequence. Length: Length of the indel. Bases: inserted or deleted nucleotides.
Type Position (bp) Length Bases
Insertion 324 6 TGTGTA
Deletion 515 1 A
Deletion 1049 1 A
Deletion 1125 1 C
Deletion 1261 2 AA
Deletion 1905 1 T
Tesi di dottorato di Sara Pinosio discussa presso l’Università degli Studi di Udine
32
According to molecular models we built, all amino acid substitutions are far apart from
the zinc ion binding catalytic site and thus it is not straightforward to predict any
structural or dynamical consequences relevant to enzymatic function. The most
interesting mutations are N104H and I199M. N104H is in close proximity to one of the
zinc ion binding sites and could thus perturb this structural motif which appears
conserved in cinnamyl alcohol dehydrogenases of several plant species (Youn et al.,
2006). Moreover the mutation introduces a titratable group that could be in the range of
pH of optimal enzyme activity (Sarni et al., 1984). Although it is difficult to predict
dramatic effects as a consequence of I199M mutation, unless the protein cannot
accommodate the increase in side chain volume, it is worth noting that the residue is
contacting the helix entailing C163 which is participating in the catalytic site and could
thus perturb the structure and/or the dynamics at the catalytic site. Finally, we identified
several subjects carrying more than a single non-synonymous SNP. They were
homozygous carriers of N104H, I199M and A279T or composite heterozygous for
various combinations of N104H, I199M, A279T and V37L. One subject was
homozygous for N104H and carried one I199M allele.
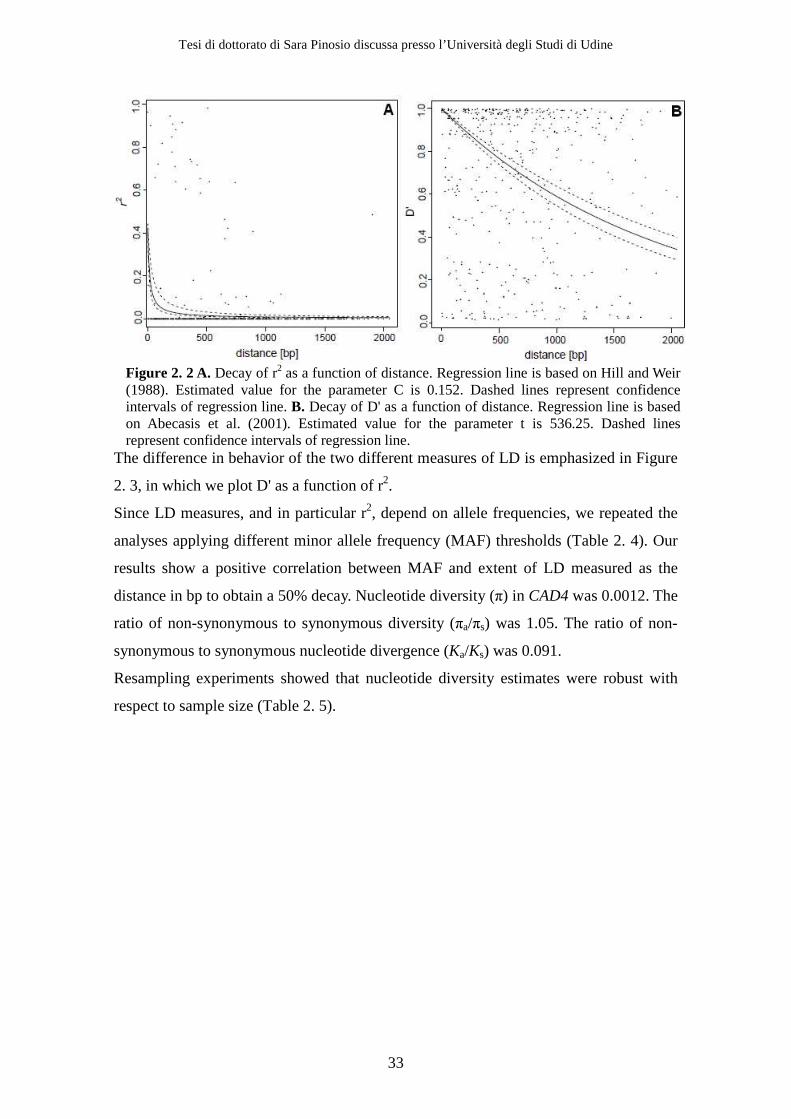
The decay of r2 with distance was rather fast (Figure 2. 2 A); according to our nonlinear
regression, the value of r2 was decreased by 50% after only 16bp, and decreased to
values close to zero (i.e. < 0.05) after 50bp. The pattern for D' was strikingly different,
although it still showed a rapid decay (Figure 2. 2 B). D' values were on average higher
than r2 values and the decay of D' with distance was slower than the decay of r2. Our
nonlinear regression showed that the distance at which D' was reduced by 50% was
1294bp.
Tesi di dottorato di Sara Pinosio discussa presso l’Università degli Studi di Udine
33
Figure 2. 2 A. Decay of r2 as a function of distance. Regression line is based on Hill and Weir (1988). Estimated value for the parameter C is 0.152. Dashed lines represent confidence intervals of regression line. B. Decay of D' as a function of distance. Regression line is based on Abecasis et al. (2001). Estimated value for the parameter t is 536.25. Dashed lines represent confidence intervals of regression line.
The difference in behavior of the two different measures of LD is emphasized in Figure
2. 3, in which we plot D' as a function of r2.
Since LD measures, and in particular r2, depend on allele frequencies, we repeated the
analyses applying different minor allele frequency (MAF) thresholds (Table 2. 4). Our
results show a positive correlation between MAF and extent of LD measured as the
distance in bp to obtain a 50% decay. Nucleotide diversity (π) in CAD4 was 0.0012. The
ratio of non-synonymous to synonymous diversity (πa/πs) was 1.05. The ratio of non-
synonymous to synonymous nucleotide divergence (Ka/Ks) was 0.091.
Resampling experiments showed that nucleotide diversity estimates were robust with
respect to sample size (Table 2. 5).

Tesi di dottorato di Sara Pinosio discussa presso l’Università degli Studi di Udine
34
Figure 2. 3 D' as a function of r2. Each data point shows values of the two LD measures obtained for all pairs of alleles.
Table 2. 4 Variation of LD patterns depending on SNPs minor allele frequencies. Threshold: Minor allele frequency (MAF) required to include SNPs in the analyses. Non-unique: No frequency threshold applied (MAF>0). Decay50: Distance (in bp) at which LD is reduced of 50%.
Threshold Decay 50 (r2) Decay 50 (D')
Non-unique 16 1294
0.01 64 2236
0.02 69 1655
0.025 59 2845
0.05 93 6750
0.1 491 8695

Tesi di dottorato di Sara Pinosio discussa presso l’Università degli Studi di Udine
35
Table 2. 5. Variations in estimated population genetics parameters as a function of sample size. For each parameter mean of the values obtained in five replicates are shown for each subsample. π: nucleotide diversity. πa: aminoacidic nucleotide diversity. πs: nucleotide diversity in synonymous positions. πsnc: nucleotide diversity in synonymous or non-coding positions. K a: non-synonymous nucleotide divergence compared to the outgroup. K s: synonymous nucleotide divergence compared to the outgroup. D: Tajima's D. D p-val: Tajima's D p-value. H: Fay and Wu's H. H p-val: Fay and Wu's H p-value. NI : McDonald-Kreitman Neutrality Index. NI p-val : McDonald-Kreitman Neutrality Index p-value. S: Number of segregating sites. Ha: Number of reconstructed haplotypes.
Sample Size
5 10 25 50 125 250 360
π 0.0011 0.0012 0.0012 0.0012 0.0012 0.0012 0.0012
πa/πs Inf 0.92 2.02 1.13 1.00 1.04 1.05
πa 0.0007 0.0006 0.0008 0.0007 0.0007 0.0007 0.0008
πs 0 0.0008 0.0004 0.0006 0.0007 0.0007 0.0007
πsnc 0.0013 0.0026 0.0015 0.0015 0.0015 0.0015 0.0015
Ka/Ks 0.095 0.091 0.095 0.093 0.093 0.093 0.091
Ka 0.0029 0.0028 0.0029 0.0028 0.0028 0.0028 0.0029
Ks 0.0307 0.0308 0.0307 0.0309 0.0309 0.0309 0.0309
D -0.63 -1.14 -1.13 -1.44 -1.47 -1.38 -1.49
D p-val 0.317 0.141 0.133 0.056 0.04 0.054 0.029
H 1.63 0.24 -2.30 -3.11 -8.12 -6.52 -11.30
H p-val 0.919 0.632 0.248 0.287 0.024 0.043 0.006
NI 2.36 2.01 2.16 2.41 3.48 2.68 4.08
NI p-val 0.660 0.688 0.590 0.518 0.391 0.489 0.240
S 8.2 14.4 19.8 27.2 35.4 39 45
Ha 5.4 8.8 13 19 29 38.2 44
Average π ranged from 0.0011 to 0.0012 across all sample sizes. Only extremely small
sample sizes led to occasional major departures from the observed value of 0.0012. The
same behavior was observed for the Ka/Ks ratio. Neutrality tests are more sensitive to
sample size. Mean values obtained with less than 50 subjects are lower than the
estimate obtained with the whole sample, and significant departures from neutrality
failed to be detected even with as many as 250 subjects. Fay and Wu's H seemed to be
more affected by sample size than Tajima's D.
2.3 Discussion
CAD4 is an essential gene for lignin biosynthesis; natural CAD mutants showing
Tesi di dottorato di Sara Pinosio discussa presso l’Università degli Studi di Udine
36
aberrant phenotype have been identified in maize (Halpin et al., 1998) and in sorghum,
(Sattler et al., 2009) while a mutation associated with reduced expression of CAD was
mapped in the same region as the cad locus in pine (MacKay et al., 1997). Transgenic
poplar trees with silenced CAD gene have been obtained, but no natural CAD loss-of-
function mutant has been identified. We set out to screen CAD4 in a large sample in
search of functional variants. Functional variants are likely to be rare (Eyre-Walker,
2010), and the identification of rare SNPs require sample sizes larger than those
commonly used in studies aimed at surveying genetic variation.
One objective of the present work was to screen a large sample of P. nigra individuals
to identify non-synonymous SNPs in the CAD4 gene. In total, we identified 45 SNPs
(13 in coding region, 6 of which non-synonymous), one insertion in non-coding region
and 5 deletions, also in non-coding region. Three of the six non-synonymous mutations
have a frequency lower than 1% and would have been difficult to identifiy using
smaller sample size. The mutations likely to have the strongest impact on CAD
enzymatic activity are I199M and, to a lesser extent, N104H, but the two substitutions
have been identified in P. tremuloides (Youn et al., 2006). Individuals carrying multiple
occurrences of non-synonymous SNPs are more likely to show altered CAD activity.
Only experimental validation, which is however out of the scope of the present
investigation, could confirm or rule out this hypothesis. Individuals carrying mutations
shown to affect lignin composition might be used in experimental crosses to obtain an
offspring with the desired properties.
We investigated decay of r2 and D' with distance in CAD4 using the appropriate decay
function for each LD statistic. Previous studies observed that LD in different poplar
species extends only for few hundred base pairs (Gilchrist et al., 2006; Ingvarsson,
2008). We confirmed the findings, and obtained an even faster decay of LD in CAD4.
According to our estimates, the distance over which LD (measured as r2, for
comparison with previous studies) is reduced by 50% is about 16 bp while in previous
works it was reported to vary between 50 and 500 base pairs. The difference might be
due to the different number of loci investigated or to the different sample size. The
present study is focusing on a single gene, and LD decay can be different from the
decay measured by pooling data from several genes. On the other hand, LD estimates
depends on allele frequencies and sample size (Jiang et al., 2009; Terwilliger and
Hiekkalinna, 2006; VanLiere and Rosenberg, 2008). Previous studies were investigating
sample sizes of less than 50 individuals (Gilchrist et al., 2006; Ingvarsson, 2008). For
Tesi di dottorato di Sara Pinosio discussa presso l’Università degli Studi di Udine
37
such studies, all non-unique SNPs would have a MAF greater than 0.01. LD measures,
and in particular r2, depend on allele frequencies, in that rare alleles tend to lower LD
levels and studies which miss rare SNPs will tend to give slightly inflated LD estimates
(Hedrick and Kumar, 2001). This is confirmed by the LD analyses that we performed
using different MAF thresholds. Increasing the cut-off frequency, we obtained higher
average LD values and slower LD decay. Applying a threshold of 1% for MAF we
obtained an estimate of 64 bp as the distance at which LD decays of 50%. Increasing
the threshold to 5% brought the distance to 93bp. D' decay was slower than r2 decay, but
it showed a similar dependence on allele frequency. The different behavior of D' and r2
is well-known, and was confirmed by plotting D' as a function of r2 (see Figure 2. 3). D'
suffers from a “ceiling effect”, because it reaches its maximum value of 1 whenever one
of the 4 possible haplotypes is not observed in the sample (Mueller, 2004). The
probability of this happening is fairly high if one (or both) the investigated SNPs has a
low MAF. R-square, on the contrary, tends to be low, especially when rare alleles are
present (Hedrick and Kumar, 2001), and suffers therefore from what could be named
the “floor effect”. The combination of floor effect and ceiling effect is evident in Figure
2. 3. The floor effect is witnessed by the presence of several pairwise comparisons with
r2=0, irrespective of D' value. The ceiling effect, on the contrary, results in an
abundance of pairwise comparisons with D'=1, irrespective of r2 value.
As a further objective of our work, we estimated diversity indexes, and evaluated their
robustness with respect to variations in sample size. We observed negative Tajima's D
and Fay and Wu's H values for CAD4. Negative values of Tajima's D indicate negative
selection, population growth and/or genetic hitchhiking (Tajima, 1989), and negative
values of H suggest genetic hitchhiking (Fay and Wu, 2000). However, the coexistence
of negative values for both D and H has been related to the demographic history of the
population, and might be explained by a bottleneck event (Heuertz et al., 2006); since
we investigated only one locus, we cannot determine if negative values of Tajima's D
and Fay and Wu's H are due to selection or to demographic history. In their original
work McDonald and Kreitman (McDonald and Kreitman, 1991) found that replacement
to synonymous ratio between Drosophila species exceeded that measured within a
Drosophila species and interpreted this as evidence for adaptive fixation of amino acid
changes. On the other hand, more recent studies (Nachman et al., 1994; Rand and
Kann, 1996) observed instances in which the replacement to synonymous ratio within
species was higher than that between species, thus leading to a Neutrality Index (NI)
Tesi di dottorato di Sara Pinosio discussa presso l’Università degli Studi di Udine
38
greater than 1, like in the present study. This can be explained by the nearly neutral
theory of evolution, assuming that moderately deleterious polymorphisms are present
within species, but in the long range are eliminated by selection and do not contribute to
divergence between species. Nucleotide diversity (π) was 0.0012, in agreement with the
average nucleotide diversity of 0.0018 observed in nine genes in P. trichocarpa,
(Gilchrist et al., 2006) but lower than the values of 0.0042 and 0.0110 observed in two
previous studies in P. tremula (Ingvarsson, 2008). Non-synonymous substitutions are
relatively frequent in CAD4 (πa/πs=1.05), but they do not survive enough to become
fixed across species (low Ka/Ks), thus suggesting the existence of negative selection on
CAD4.
Previous studies showed the effect of ascertainment bias on θ and Tajima’s D (Ramírez-
Soriano and Nielsen, 2009); given the availability of a large sample, we investigated the
effect of sample size on population genetics parameters and neutrality tests. Resampling
experiments showed that accurate measures of nucleotide diversity can be obtained
when the sample size is 25 individuals (corresponding to 50 chromosomes) or more,
while neutrality tests are quite sensitive to variations in sample size, and deviations
from neutrality might fail to be detected even with sample sizes of 250 individuals
(Table 2. 5); this is because small sample sizes lead to a relatively large variance of π
and hence D (Lohse and Kelleher, 2009).
In conclusion 1) we screened 360 P. nigra individuals in search of functional variants of
CAD4. The use of a large set of individuals enabled us to sample most of the genetic
variation in CAD4 and to identify six functional variants. In addition, we identified
carriers of multiple mutations to be assessed for lignin quality and quantity; individuals
showing significant alterations in lignin content will then be used in conventional
breeding programs. Then, 2) we investigated LD structure in CAD4; we showed that LD
estimates in small samples might be biased, and 3) we studied the robustness of
population genetics parameters estimates with respect to sample size. We showed that
the use of small data sets might lead to wrong interpretation of neutrality tests.

Tesi di dottorato di Sara Pinosio discussa presso l’Università degli Studi di Udine
39
2.4 Supplementary Material
Table S- 1 Summary statistics of identified SNPs. Position: base pair position relative to the consensus sequence. SNP (1/2): Alleles of the SNP (in alphabetic order). MA : Minor Allele. MAF : Minor Allele Frequency. O(1/1): Observed individuals with genotype 1/1. O(1/2): Observed individuals with genotype 1/2. O(2/2): Observed individuals with genotype 2/2. HWE : p-value of Fisher's exact test for deviations from Hardy-Weinberg Equilibrium. Non-synonymous SNPs are shown in bold.
Position SNP (1/2) MA MAF O(1/1) O(1/2) O(2/2) HWE
93 C/G G 0.018 297 11 0 1.00
114 A/T A 0.002 0 1 311 1.00
143 C/G G 0.005 315 3 0 1.00
273 A/G A 0.021 0 14 315 1.00
306 A/T A 0.015 0 10 320 1.00
408 C/T C 0.008 0 5 325 1.00
409 C/G C 0.008 0 5 326 1.00
462 A/C A 0.002 0 1 331 1.00
484 C/T T 0.001 334 1 0 1.00
511 A/T A 0.006 0 4 328 1.00
518 A/T T 0.003 334 2 0 1.00
574 G/T G 0.166 10 89 229 0.97
583 A/T T 0.111 266 42 15 0.00
609 C/T C 0.002 0 1 330 1.00
777 A/C A 0.157 8 79 216 1.00
948 A/T A 0.079 7 38 285 0.13
969 C/G G 0.066 294 34 5 0.19
995 C/T T 0.001 340 1 0 1.00
1012 C/T T 0.021 326 12 1 0.84
1015 A/T T 0.001 340 1 0 1.00
1042 A/T A 0.009 0 6 333 1.00
1075 A/G A 0.025 2 13 322 0.38
1098 C/T T 0.176 221 82 15 0.45
1100 C/T C 0.024 2 12 318 0.37
1159 A/G G 0.066 280 32 5 0.19
1163 A/G A 0.002 0 1 313 1.00
1165 G/T G 0.010 0 6 307 1.00
1168 A/T A 0.002 0 1 316 1.00
1219 G/T T 0.002 313 1 0 1.00

Tesi di dottorato di Sara Pinosio discussa presso l’Università degli Studi di Udine
40
Position SNP (1/2) MA MAF O(1/1) O(1/2) O(2/2) HWE
1294 G/T T 0.002 308 1 0 1.00
1305 A/G G 0.021 292 9 2 0.32
1361 A/G G 0.002 309 1 0 1.00
1402 C/T C 0.009 0 6 322 1.00
1437 A/G G 0.029 322 18 1 1.00
1515 A/G G 0.178 241 67 26 0.00
1518 A/G A 0.021 2 10 328 0.34
1753 A/G A 0.017 1 8 292 0.81
1758 A/G G 0.007 293 4 0 1.00
1801 C/T C 0.002 0 1 299 1.00
1827 C/T C 0.052 3 25 271 0.58
1853 A/T A 0.002 0 1 297 1.00
1886 A/T T 0.168 215 39 28 1.97E-006
1900 C/T C 0.002 0 1 298 1.00
2047 A/C A 0.007 0 4 300 1.00
2140 A/G G 0.007 275 4 0 1.00
Tesi di dottorato di Sara Pinosio discussa presso l’Università degli Studi di Udine
41
3
Rare Variants in Lignin Genes
The content of this chapter has been published:
Large scale detection of rare variants via pooled multiplexed next generation sequencing: towards next generation Ecotilling. F. Marroni*, S. Pinosio*, E. Di Centa, I. Jurman, W. Boerjan, N. Felice, F. Cattonaro and M. Morgante. The Plant Journal, 2011. *First shared authorship
3.1 Materials and Methods
3.1.1 Plant Material
The experimental sample consisted of 768 Populus nigra accessions originally collected
in different European areas (Smulders et al., 2008; Rohde et al., 2010). A large
proportion of trees originated from France (n=631). The remaining trees originated
from Italy (n=118), Germany (n=9), Spain (n=9) and The Netherlands (n=1). Latitude
ranged from 40.24° N to 51.48° N (median latitude=46.24°N) and longitude from
16.39° E to 0.56° W (median longitude=3.19° E). Altitude above sea level ranged from
35 m to 1699m (median altitude 160m). Approximately 1 gram of leaf material was
collected for DNA extraction from each tree.
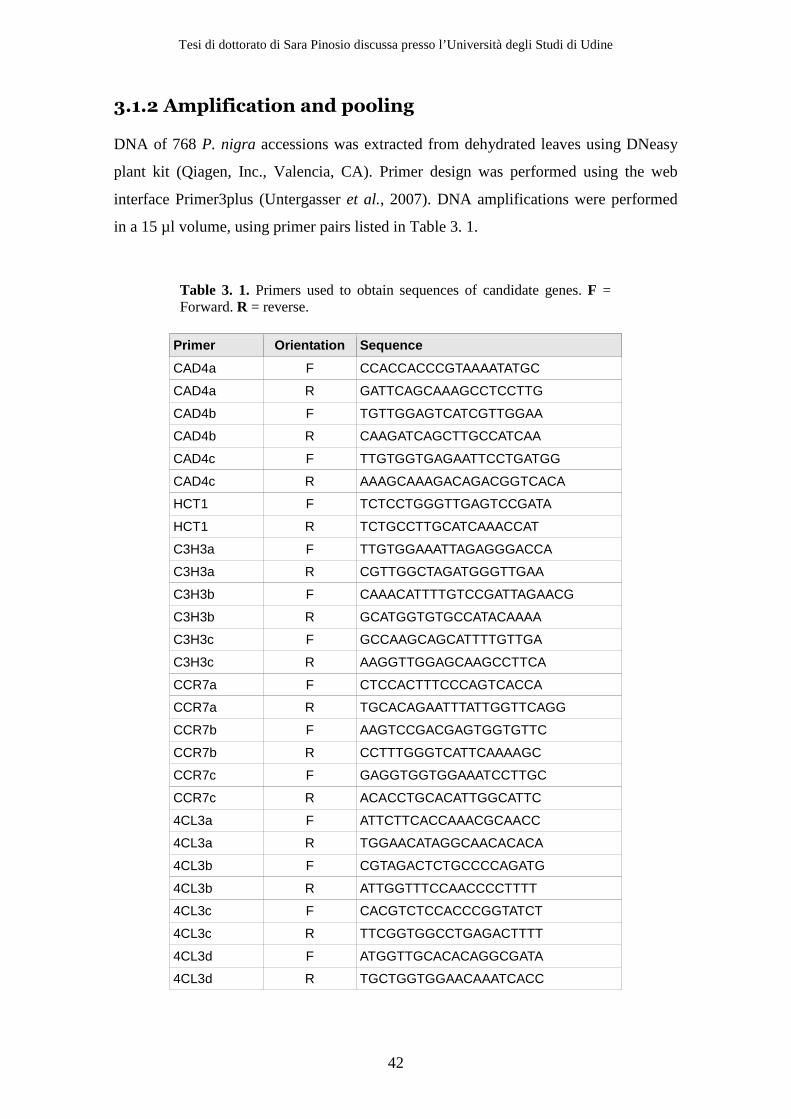
Tesi di dottorato di Sara Pinosio discussa presso l’Università degli Studi di Udine
42
3.1.2 Amplification and pooling
DNA of 768 P. nigra accessions was extracted from dehydrated leaves using DNeasy
plant kit (Qiagen, Inc., Valencia, CA). Primer design was performed using the web
interface Primer3plus (Untergasser et al., 2007). DNA amplifications were performed
in a 15 µl volume, using primer pairs listed in Table 3. 1.
Table 3. 1. Primers used to obtain sequences of candidate genes. F = Forward. R = reverse.
Primer Orientation Sequence
CAD4a F CCACCACCCGTAAAATATGC
CAD4a R GATTCAGCAAAGCCTCCTTG
CAD4b F TGTTGGAGTCATCGTTGGAA
CAD4b R CAAGATCAGCTTGCCATCAA
CAD4c F TTGTGGTGAGAATTCCTGATGG
CAD4c R AAAGCAAAGACAGACGGTCACA
HCT1 F TCTCCTGGGTTGAGTCCGATA
HCT1 R TCTGCCTTGCATCAAACCAT
C3H3a F TTGTGGAAATTAGAGGGACCA
C3H3a R CGTTGGCTAGATGGGTTGAA
C3H3b F CAAACATTTTGTCCGATTAGAACG
C3H3b R GCATGGTGTGCCATACAAAA
C3H3c F GCCAAGCAGCATTTTGTTGA
C3H3c R AAGGTTGGAGCAAGCCTTCA
CCR7a F CTCCACTTTCCCAGTCACCA
CCR7a R TGCACAGAATTTATTGGTTCAGG
CCR7b F AAGTCCGACGAGTGGTGTTC
CCR7b R CCTTTGGGTCATTCAAAAGC
CCR7c F GAGGTGGTGGAAATCCTTGC
CCR7c R ACACCTGCACATTGGCATTC
4CL3a F ATTCTTCACCAAACGCAACC
4CL3a R TGGAACATAGGCAACACACA
4CL3b F CGTAGACTCTGCCCCAGATG
4CL3b R ATTGGTTTCCAACCCCTTTT
4CL3c F CACGTCTCCACCCGGTATCT
4CL3c R TTCGGTGGCCTGAGACTTTT
4CL3d F ATGGTTGCACACAGGCGATA
4CL3d R TGCTGGTGGAACAAATCACC
Tesi di dottorato di Sara Pinosio discussa presso l’Università degli Studi di Udine
43
The reactions contained on average 25 ng of genomic DNA and the following reagents:
0.3 µM of each primer, 250 µM of each dNTP, 1.5 mM MgCl2, 2% DMSO, 1 unit
Amplitaq Gold (Applied Biosystems, Foster City, CA) and 1X PCR buffer II (Applied
Biosystems, Foster City, CA). The reactions were performed in the Geneamp 9700 PCR
system (Applied Biosystems, Foster City, CA), under the following conditions: 95 °C
for 10 minutes, 40 cycles of 20 seconds at 94 °C, 30 seconds at 60 °C and 1 minute and
30 seconds at 72 °C, followed by a final extension of 10 minutes at 72 °C.
Amplification of HCT1 was performed substituting 1 unit Amplitaq Gold with 0.3 units
of Phusion High Fidelity DNA polymerase (Finnzymes, Espoo, Finland). PCR products
were then pooled according to the following schemes:
Phase 1: We amplified CAD4 in three amplicons, using PCR primers already tested in
a different sample (Marroni et al., 2011); for each amplicon, the quantities of the PCR
products of 16 random accessions were estimated on agarose gel; the average
concentration was taken as an estimate of each amplicon's concentration, and the three
amplicons of each individual were combined in equimolar amounts. Experimental
samples were pooled in 12 separate groups, each composed by 64 accessions (totaling
to 768). A schematic representation of the pooling scheme is depicted in Figure 3. 1.
Three amplicons obtained from three control accessions for which Sanger sequencing
was already available (Marroni et al., 2011) were added to each pool.
Phase 2: In phase 2, we amplified the CDS of the selected genes using one primer
pair for HCT1, four for 4CL3 and three for each of C3H3 and CCR7. For each
amplicon, the quantities of the PCR products of 16 random accessions were estimated
on agarose gel; the average concentration was taken as an estimate of each amplicon's
concentration and the eleven amplicons of each individual were combined in equimolar
amounts. Experimental samples were pooled in 12 separate groups, each composed by
64 accessions.

Tesi di dottorato di Sara Pinosio discussa presso l’Università degli Studi di Udine
44
Figure 3. 1 Pooled multiplexed next generation sequencing screening of large populations. Identification of mutation carriers in a pool requires sequencing of the accessions of the corresponding pool.
3.1.3 Sequencing
To prepare NGS libraries, 5 µg of pooled PCR products were randomly fragmented by
nebulizing at 60 psi (pound per square inch) for 4 minutes. Libraries were prepared
using Illumina reagents, according to manufacturer's specifications (Illumina, San
Diego, CA). End repair of fragmented DNA was performed using T4 DNA polymerase
and Klenow polymerase with T4 polynucleotide kinase. An “A” base was added at the
3' end using a 3'–5' exonuclease-deficient Klenow fragment, and Illumina indexed
adapter oligonucleotides were ligated to the sticky ends thus created. We
electrophoresed the ligation mixture on an agarose gel and size-selected fragments at
200 bp.
DNA was enriched for fragments with Illumina adapters on either end by a 16-cycle
PCR reaction performed by using the Illumina Multiplexing Sample Preparation
Oliogonucleotide Kit according to manufacturer’s instructions. A Genome Analyzer

Tesi di dottorato di Sara Pinosio discussa presso l’Università degli Studi di Udine
45
flowcell was prepared on the supplied cluster station according to manufacturer’s
protocol. In both phase 1 and phase 2 of the experiment, two lanes of the flowcell were
used to sequence the 768 accessions. Clusters of PCR colonies were then sequenced on
an Illumina Genome Analyzer II platform using a single read run of 44bp coupled with
7bp Illumina indexes sequencing with the Illumina Multiplex Sequencing primer.
Images from the instrument were processed using the manufacturer’s pipeline software
to generate FASTQ sequence files. Sanger sequencing was performed using BigDye ®
Terminator v3.1 Cycle Sequencing Kit (Applied Biosystems, Foster City, CA) on an
ABI3730 sequencer (Applied Biosystems, Foster City, CA) following manufacturer's
instructions.
3.1.4 Data Analysis
In a previous study (Marroni et al., 2011) we obtained a CAD4 consensus sequence
from 360 accessions (GenBank accessions HM440565 to HM440924). This reference
was 2240bp long and comprised the complete CAD4 CDS (1074bp). The P. nigra
reference sequences for the coding portions of HCT1 (accession JF693234), C3H3
(accession JF693232), CCR7 (accession JF693233) and 4CL3 (accession JF693234)
were obtained from Sanger sequencing of eight accessions, using phred (Ewing and
Green, 1998), phrap and consed (Gordon et al., 1998).
Illumina sequences were aligned against the P. nigra reference with the short reads
aligner Novoalign (Novocraft Technologies Sdn Bhd, Kuala Lumpur, Malaysia), which
uses full Needleman-Wunsch algorithm with gap penalties. Alignment was performed
setting the alignment scoring options t (the highest alignment score acceptable for the
best alignment) and g (the gap opening penalty) in a different way for SNP and small
indel detection. For SNP detection the chosen pair of scoring options was t=60 and
g=15, while for indel detection t=110 and g=20. Default settings for the remaining
alignment scoring, quality control and read filtering options were retained. Coverage
statistics were calculated based on alignment performed for SNP detection. Mean
Individual per Base Coverage (MIBC) was calculated for each base as R/N, where R is
the number of reads covering the position and N is the number of accessions (N=768 for
analysis on the whole data set and N=64 for analysis at pool level). Thus, MIBC
represents for each base the mean number of reads covering the base in each accession.
Mean Individual Coverage (MIC) is calculated as the average of MIBC over the
Tesi di dottorato di Sara Pinosio discussa presso l’Università degli Studi di Udine
46
reference sequence. To evaluate experiment-wide MIC we used the reference sequences
of all the studied genes.
SNP and indel detection was performed with Varscan (Koboldt et al., 2009). SNP
detection was performed separately on forward and reverse reads of each pool; a SNP
was called if the alternative allele was present both in forward and reverse sequences in
at least 10 reads per strand. This allowed discarding false positive SNPs due to
sequence specific sequencing errors. SNPs called by Varscan with an average variant
quality lower than 25 and SNPs identified in regions with a MIBC lower than 50x
(corresponding to a total coverage of 3350x) were not considered.
Error distribution in Illumina reads is not uniform; the proportion of errors usually
shows an increasing trend from the beginning to the end of the read, with the possibility
of observing high error rates in the very first bases (Kircher et al., 2009). In addition,
preliminary results of the present study indicated that false positive SNPs can be
identified at the 3' and 5' ends of a read when a small deletion/insertion is present near
(<10bp) the read ends. To control for this, a specific a posteriori quality control was
applied. Each read was partitioned in three segments of equal length, and the condition
was imposed that each SNP had to be independently identified (using the thresholds
shown above) when considering each of the segments of the read separately.
To assess the performance of NGS multiplexed pooled genotyping to identify SNPs, in
phase 1 two amplicons (CAD4b and CAD4c) of two of the twelve pools (pool 5 and
pool 9) were sequenced with the Sanger method and SNPs were detected on the
obtained individual sequences. Identification of SNPs in Sanger sequences of the
training set was performed using polyphred (Nickerson et al., 1997). Sensitivity and
specificity of pooled multiplexed NGS were measured using receiver operating
characteristic (ROC) curve analysis, considering individual Sanger sequencing as a gold
standard. Comparison was performed only on positions in which Sanger coverage was
at least 50x.
In ROC curves, the true positive rate (sensitivity) is calculated in function of the false
positive rate (1 - specificity) for different cut-off points; each point on the ROC
represents a sensitivity/specificity pair corresponding to a particular decision threshold.
Area under the ROC curve (AUC) is an overall measure of test performance, with 0.5
indicating random performance and 1.0 denoting perfect performance. The proportion
of true Illumina SNPs as a function of the proportion of false SNPs was calculated,
using the variant frequency threshold as the test outcome and Sanger genotyping as the

Tesi di dottorato di Sara Pinosio discussa presso l’Università degli Studi di Udine
47
outcome. Best variant frequency threshold was chosen as the one at which the average
of sensitivity and specificity was highest, in order to maximize true positives, while
minimizing false positives.
The correlation between minor allele frequencies of SNPs identified by pooled next
generation sequencing and of those SNPs identified by individual Sanger sequencing
was calculated by the Pearson product-moment correlation coefficient. In each pool,
minor allele frequency (MAF) for Sanger sequencing was calculated as the number of
occurrences of the alternative allele divided by the total number of sequences. MAF for
pooled multiplexed NGS was calculated as the number of reads carrying the alternative
allele divided by the total number of reads.
Small indel detection was performed separately on forward and reverse reads of each
pool, requiring an indel to be called in both forward and reverse strands in at least 2
reads per strand. Indels with an average individual coverage lower than 25x per strand
were not considered.
To investigate the effect of sequence coverage on SNP calling and to identify the
optimal coverage for variant detection, a total of 1000 simulations, sampling subsets
from 1% to 99% of reads generated in phase 1 were run, and the identified SNPs
(positives) were compared with those identified using the whole sequence data. The
intersection of the two sets represents a conservative estimate of true positives. Positive
Predictive Value (PPV) was calculated as the ratio between true positives and positives.
Comparison between SNPs identified by multiplexed pooled NGS and individual
Sanger sequencing was repeated in phase 2. The selected test set was composed as
follows: all the twelve pools for primer HCT, pool 2 for primers CCR7b and CCR7c,
and pool 12 for primer 4CL3b. The algorithm applied for SNP detection in Sanger
sequences was the same as applied in phase 1, while when identifying SNPs in short
reads in HCT1, C3H3, CCR7 and 4CL3 (showing on average half of the coverage of
CAD4), the number of reads required on each strand and the lower acceptable
individual coverage of a region to be used for SNP calling were linearly scaled, and set
to five and 25x, respectively.
To investigate the effect of frequency threshold on SNP calling, additional analyses
were conducted by varying the MAF threshold frequency from 0 to 1%, removing
coverage thresholds and requiring that only one occurrence of the SNP was found on
the forward and reverse strand. When the MAF threshold was zero, the number of
polymorphic positions corresponded to the number of bases in which an error was
Tesi di dottorato di Sara Pinosio discussa presso l’Università degli Studi di Udine
48
introduced on both strands during the whole sequencing process. The proportion of
polymorphic positions was plotted as a function of the variant frequency used to define
a polymorphism in each gene.
Nucleotide diversity is the average number of per site differences between two
randomly chosen DNA sequences (Nei and Li, 1979); here, it was estimated as the sum
of unbiased heterozygosity of segregating sites (Tajima, 1989), averaged over all
nucleotides. Heterozygosity and its 95% confidence limits were calculated by
resampling with replacement all pairs of polymorphic loci with probability
corresponding to the frequency of the two alleles, and multiplying by n/(n-1), where n is
the sample size of the pool, to obtain an unbiased estimate of nucleotide diversity
(Futschik and Schlötterer, 2010); for each polymorphic position 200 resampling
experiments were performed, each of size 10000. Neutrality hypothesis was tested
calculating Tajima’s D (Tajima, 1989); we chose confidence limits for Tajima’s D
based on the beta distribution for n=1000 DNA sequences, as calculated by Tajima
(Tajima, 1989). Statistical analyses were performed in R (www.r-project.org).
3.2 Results
3.2.1 Resequencing
We performed a multiplexed pooling NGS experiment in 768 P. nigra accessions
divided in 12 pools of 64 accessions each. The experiment consisted of two phases; we
list objectives and results of each experimental phase below.
Phase 1 (CAD4)
Aim of phase 1 was to set-up a multiplexed pooled sequencing procedure for SNP
detection in CAD4 in 768 accessions. In addition, two pools (n=128) underwent
individual Sanger sequencing to perform a sensitivity analysis and to identify the
optimal SNP calling method; we will refer to this subset as the “training set”.
In phase 1 of the experiment, about 0.9 Gb of sequence data were generated. Dividing
this amount by the number of accessions (n=768) and by the length of the CAD4
consensus (2240bp), we obtained an experiment-wide Mean Individual Coverage (MIC)

Tesi di dottorato di Sara Pinosio discussa presso l’Università degli Studi di Udine
49
of 486x. The complete consensus sequence of P. nigra CAD4 was obtained in our
laboratory in a previous study (Marroni et al., 2011). The consensus was used as a
reference against which short reads were aligned. After removing a) reads which could
not be aligned to the reference (8%), b) reads which could not be assigned to an index
(4%), and c) over represented reads at amplicon ends (16%), an experiment-wide MIC
of 350x was obtained (Figure 3. 2). MIC was variable across pools, ranging from 120x
to 640x (Figure 3. 3). However, coverage at each single position along the gene,
measured as Mean Individual per Base Coverage (MIBC, see Materials and Methods
for details), is strongly conserved between pools, suggesting its sequence specificity.
Figure 3. 2 MIBC along CAD4 sequence. SNPs (vertical bars) and indels (asterisks) positions are indicated relative to the coding sequence (CDS, grey boxes) and introns (horizontal black lines).
Figure 3. 3 MIBC along CAD4 sequence in each pool. P1: MIBC of pool 1; P2: MIBC of pool 2; … ; P12: MIBC of pool 12.
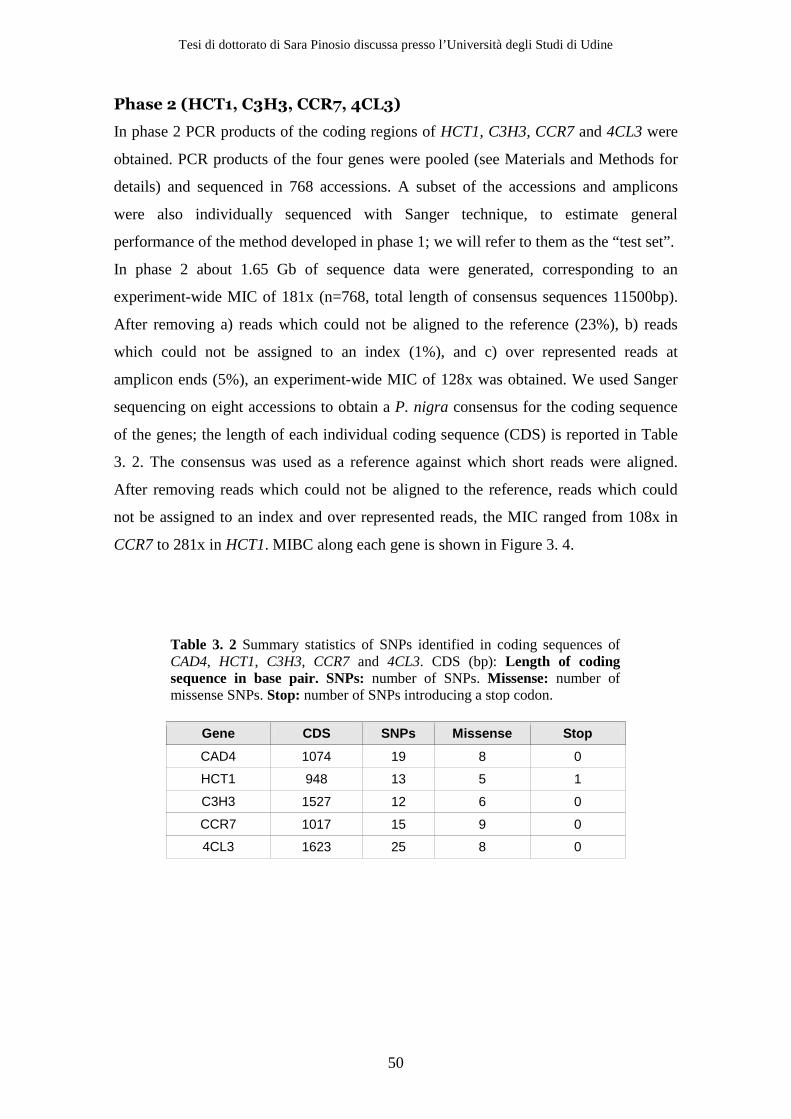
Tesi di dottorato di Sara Pinosio discussa presso l’Università degli Studi di Udine
50
Phase 2 (HCT1, C3H3, CCR7, 4CL3)
In phase 2 PCR products of the coding regions of HCT1, C3H3, CCR7 and 4CL3 were
obtained. PCR products of the four genes were pooled (see Materials and Methods for
details) and sequenced in 768 accessions. A subset of the accessions and amplicons
were also individually sequenced with Sanger technique, to estimate general
performance of the method developed in phase 1; we will refer to them as the “test set”.
In phase 2 about 1.65 Gb of sequence data were generated, corresponding to an
experiment-wide MIC of 181x (n=768, total length of consensus sequences 11500bp).
After removing a) reads which could not be aligned to the reference (23%), b) reads
which could not be assigned to an index (1%), and c) over represented reads at
amplicon ends (5%), an experiment-wide MIC of 128x was obtained. We used Sanger
sequencing on eight accessions to obtain a P. nigra consensus for the coding sequence
of the genes; the length of each individual coding sequence (CDS) is reported in Table
3. 2. The consensus was used as a reference against which short reads were aligned.
After removing reads which could not be aligned to the reference, reads which could
not be assigned to an index and over represented reads, the MIC ranged from 108x in
CCR7 to 281x in HCT1. MIBC along each gene is shown in Figure 3. 4.
Table 3. 2 Summary statistics of SNPs identified in coding sequences of CAD4, HCT1, C3H3, CCR7 and 4CL3. CDS (bp): Length of coding sequence in base pair. SNPs: number of SNPs. Missense: number of missense SNPs. Stop: number of SNPs introducing a stop codon.
Gene CDS SNPs Missense Stop
CAD4 1074 19 8 0
HCT1 948 13 5 1
C3H3 1527 12 6 0
CCR7 1017 15 9 0
4CL3 1623 25 8 0
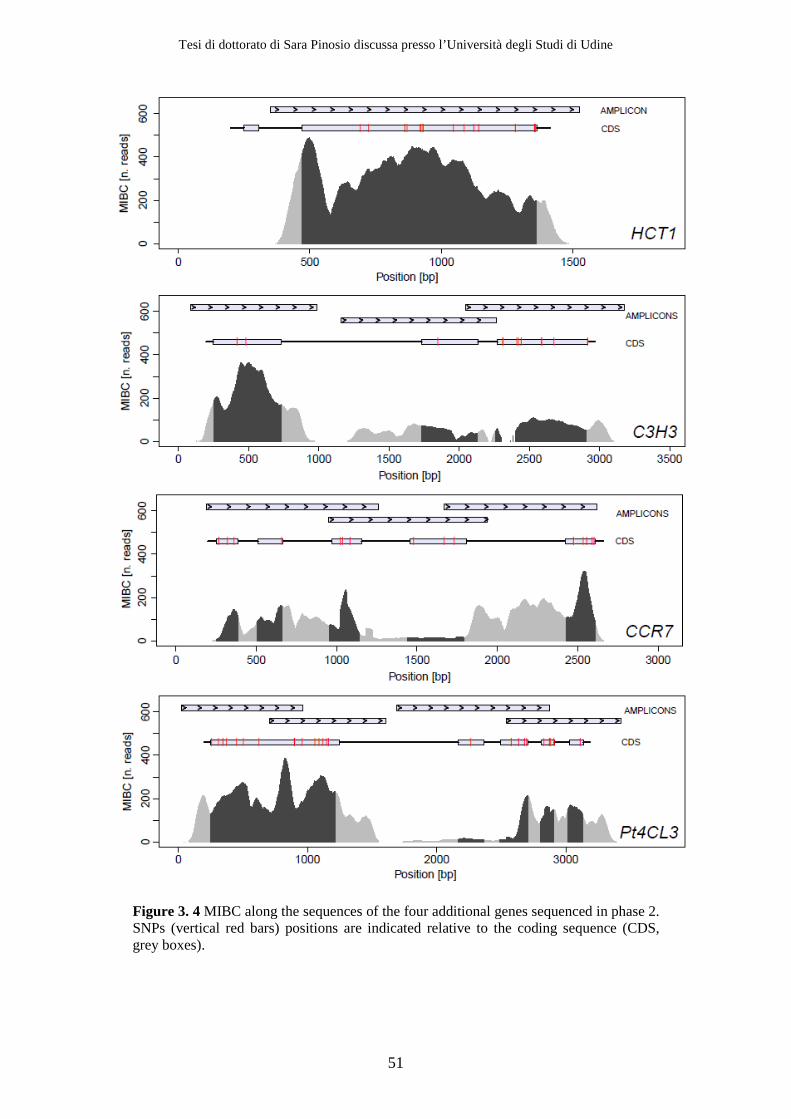
Tesi di dottorato di Sara Pinosio discussa presso l’Università degli Studi di Udine
51
Figure 3. 4 MIBC along the sequences of the four additional genes sequenced in phase 2. SNPs (vertical red bars) positions are indicated relative to the coding sequence (CDS, grey boxes).

Tesi di dottorato di Sara Pinosio discussa presso l’Università degli Studi di Udine
52
3.2.2 Variant detection
Phase 1 (CAD4)
To identify the more appropriate minor allele frequency (MAF) for SNP calling, we
selected two pools (pool 5 and pool 9) as a training set. The training set was analyzed
using both individual Sanger sequencing and pooled multiplexed NGS. Using
individual Sanger sequencing, we identified a total of 42 SNPs, 19 in pool 5 and 23 in
pool 9 (Table 3. 3, column Individual Sanger). Using multiplexed pooled NGS, we
identified a total of 43 SNPs, 19 in pool 5 and 24 in pool 9 (Table 3. 3, column Pooled
NGS); considering individual Sanger genotyping as the gold standard, 42 of the 43
SNPs identified by multiplexed pooled NGS were true positives and 1 was a false
positive. No false negatives were identified. ROC analysis gave the best results
(sensitivity 100%, specificity 99.9%) when we defined a SNP as any position in which
more than 0.41% of the reads showed a base different from the consensus. Overall,
pooled NGS was in agreement with individual Sanger sequencing and area under the
ROC curve was 99.9%. The small difference obtained between the two techniques may
be due to the joint effect of pooling and of the use of different sequencing technologies.
Correlation of allele frequencies determined by Sanger individual sequencing and next
generation pooled sequencing was high (Table 3. 3 and Figure 3. 5, Pearson's
correlation coefficient r=0.96). Thus, the number of reads in a pooled sample is strongly
correlated to allelic frequency in the origin population. As additional measure for
assessing the ability of Illumina multiplexed pooled analysis to identify SNPs and
indels, we mixed in each pool three controls for which the complete CAD4 sequence
was known from a previous study (Marroni et al., 2011). In total, these 36 controls
contributed 109 SNPs and 17 indels to the twelve pools. We were able to identify 105
of these SNPs and 15 indels, corresponding to sensitivity of 96% for SNP calling and of
88% to identify both SNPs and indels. Although rare, polymorphisms present in the
control accessions might be present in additional accessions of each pool, thus the
estimated sensitivity should be considered as an upper bound.
Using the identified MAF threshold, we performed SNP detection on the whole sample
and identified 48 SNPs (1 every 47 bp), 19 of which in CDS (1 every 56 bp); 8 of them
were non-synonymous (Table 3. 4). We identified 5 deletions and one insertion, all in
non-coding regions (Table 3. 5 and Figure 3. 2). All the indels had already been

Tesi di dottorato di Sara Pinosio discussa presso l’Università degli Studi di Udine
53
identified in a previous study (Marroni et al., 2011). No indels were detected in the
coding sequence of CAD4.
Table 3. 3 Minor allele frequency (MAF) of CAD4 SNPs identified, in Pool 5 and Pool 9, by multiplexed pooled NGS and individual Sanger sequencing, respectively. 1Position of the SNP on the reference sequence. 2Minor allele frequency (MAF) using pooled multiplexed NGS. 3Minor allele frequency (MAF) using individual Sanger sequencing. ND: No SNP detected.
Pool 5 Pool 9
Position 1 SNP Pooled NGS 2 Individual Sanger 3
Pooled NGS 2 Individual Sanger 3
948 T/A 0.0487 0.0735 0.0855 0.0758
969 C/G 0.1584 0.1471 0.1764 0.1667
1012 C/T 0.0090 0.0147 0.0167 0.0379
1016 T/G ND ND 0.0079 0.0076
1075 G/A 0.0122 0.0221 0.0478 0.0530
1098 C/T 0.2052 0.2206 0.1856 0.1970
1100 T/C 0.0082 0.0147 0.0098 0.0379
1159 A/G 0.1687 0.1439 0.1809 0.1719
1165 T/G 0.0100 0.0152 0.0054 0.0156
1168 T/A 0.0049 0.0076 ND ND
1219 G/T 0.0048 0.0077 0.0370 0.0156
1260 A/G ND ND 0.0132 ND
1305 A/G 0.0108 0.0076 0.0193 0.0259
1329 A/G ND ND 0.0094 0.0172
1402 T/C 0.0111 0.0149 0.0066 0.0161
1437 A/G 0.0183 0.0147 0.0065 0.0077
1515 A/G 0.2141 0.2279 0.1457 0.1567
1518 G/A 0.0090 0.0075 0.0227 0.0373
1753 G/A 0.0046 0.0074 0.0359 0.0373
1758 A/G 0.0055 0.0074 0.0049 0.0075
1827 T/C 0.0338 0.0368 0.0183 0.0154
1886 T/A 0.2742 0.2426 0.1894 0.1875
2013 C/T ND ND 0.0154 0.0159
2101 C/T ND ND 0.0079 0.0079
2140 A/G ND ND 0.0105 0.0079

Tesi di dottorato di Sara Pinosio discussa presso l’Università degli Studi di Udine
54
Figure 3. 5 Minor allele frequency of SNPs identified in the training set by pooled multiplexed NGS and individual Sanger sequencing. Error bars are calculated for pooled multiplexed NGS assuming a binomial distribution, with successes corresponding to the number of reads carrying the minor allele and attempts corresponding to the total number of reads.
Phase 2 (HCT1, C3H3, CCR7, 4CL3)
Using the SNP detection pipeline used in phase 1 we analyzed the four additional genes
included in phase 2, to identify variants affecting amino acid composition of the
corresponding gene products. We identified a total of 65 SNPs, 28 of which were non-
synonymous (Table 3. 4). Five missense SNPs were identified in HCT1, nine in CCR7,
five in C3H3, and eight in 4CL3. In addition a SNP causing a premature stop codon was
identified in HCT1. No indel was detected in the coding sequence of any of the four
genes. To estimate general performance of the method developed in phase 1, a subset of
accessions and amplicons included in phase 2 (the “test set”) was selected for individual
Sanger sequencing. The test set included all twelve pools for amplicon HCT1, pool 2
for amplicons CCR7a and CCR7c, and pool 12 for amplicon 4CL3b. In total, 94 SNPs
were called, 83 of which were identified by both approaches, six only by NGS and five
by Sanger sequencing alone, with a sensitivity of 93%. Correlation of MAF between
pooled multiplexed NGS and individual Sanger sequencing was 0.98, and correlation
between the logarithms of the allele frequencies (sensitive to differences in small MAF)
was 0.96. Figure 3. 6 shows logarithm of MAF of SNPs identified by individual Sanger
sequencing as a function of logarithm of MAF of SNPs identified by NGS multiplexed
pooled sequencing. Of the 83 SNPs identified by both approaches, 34 had a frequency
lower than 5% and 10 a frequency lower than 1%. Each rare SNP is carried by one or a
few accessions, and globally they appear in a small proportion of accessions.
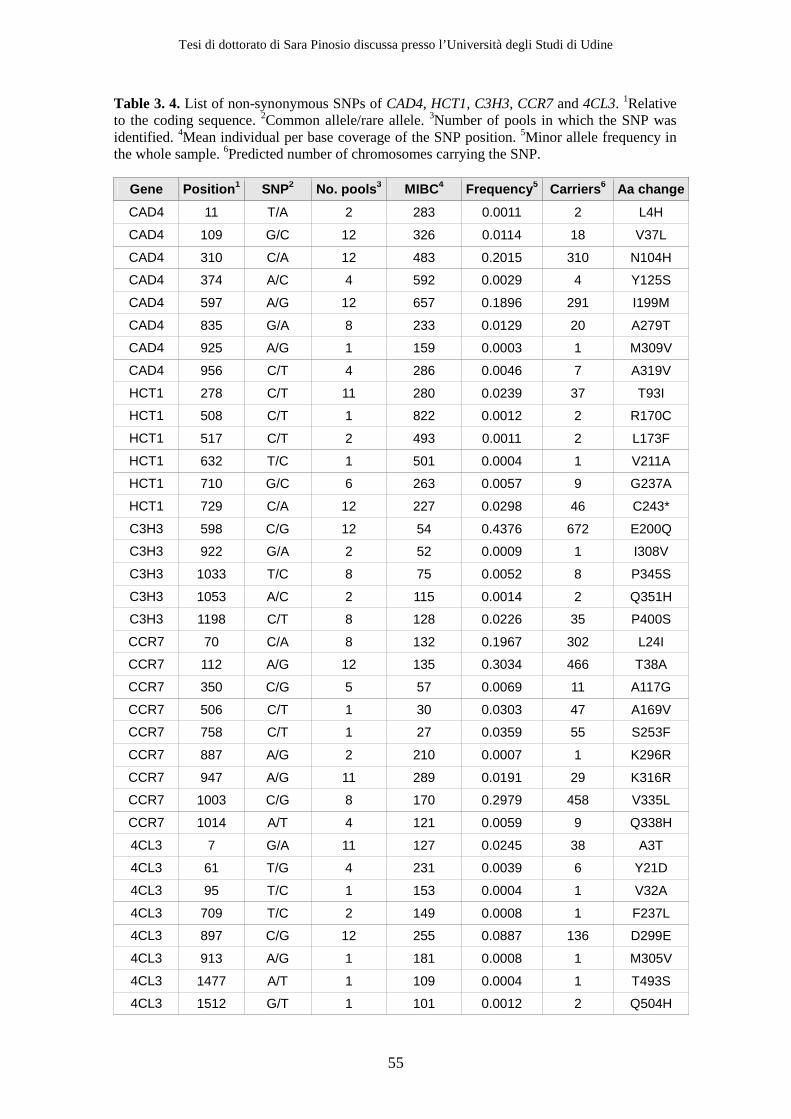
Tesi di dottorato di Sara Pinosio discussa presso l’Università degli Studi di Udine
55
Table 3. 4. List of non-synonymous SNPs of CAD4, HCT1, C3H3, CCR7 and 4CL3. 1Relative to the coding sequence. 2Common allele/rare allele. 3Number of pools in which the SNP was identified. 4Mean individual per base coverage of the SNP position. 5Minor allele frequency in the whole sample. 6Predicted number of chromosomes carrying the SNP.
Gene Position 1 SNP2 No. pools 3 MIBC4 Frequency 5 Carriers 6 Aa change
CAD4 11 T/A 2 283 0.0011 2 L4H
CAD4 109 G/C 12 326 0.0114 18 V37L
CAD4 310 C/A 12 483 0.2015 310 N104H
CAD4 374 A/C 4 592 0.0029 4 Y125S
CAD4 597 A/G 12 657 0.1896 291 I199M
CAD4 835 G/A 8 233 0.0129 20 A279T
CAD4 925 A/G 1 159 0.0003 1 M309V
CAD4 956 C/T 4 286 0.0046 7 A319V
HCT1 278 C/T 11 280 0.0239 37 T93I
HCT1 508 C/T 1 822 0.0012 2 R170C
HCT1 517 C/T 2 493 0.0011 2 L173F
HCT1 632 T/C 1 501 0.0004 1 V211A
HCT1 710 G/C 6 263 0.0057 9 G237A
HCT1 729 C/A 12 227 0.0298 46 C243*
C3H3 598 C/G 12 54 0.4376 672 E200Q
C3H3 922 G/A 2 52 0.0009 1 I308V
C3H3 1033 T/C 8 75 0.0052 8 P345S
C3H3 1053 A/C 2 115 0.0014 2 Q351H
C3H3 1198 C/T 8 128 0.0226 35 P400S
CCR7 70 C/A 8 132 0.1967 302 L24I
CCR7 112 A/G 12 135 0.3034 466 T38A
CCR7 350 C/G 5 57 0.0069 11 A117G
CCR7 506 C/T 1 30 0.0303 47 A169V
CCR7 758 C/T 1 27 0.0359 55 S253F
CCR7 887 A/G 2 210 0.0007 1 K296R
CCR7 947 A/G 11 289 0.0191 29 K316R
CCR7 1003 C/G 8 170 0.2979 458 V335L
CCR7 1014 A/T 4 121 0.0059 9 Q338H
4CL3 7 G/A 11 127 0.0245 38 A3T
4CL3 61 T/G 4 231 0.0039 6 Y21D
4CL3 95 T/C 1 153 0.0004 1 V32A
4CL3 709 T/C 2 149 0.0008 1 F237L
4CL3 897 C/G 12 255 0.0887 136 D299E
4CL3 913 A/G 1 181 0.0008 1 M305V
4CL3 1477 A/T 1 109 0.0004 1 T493S
4CL3 1512 G/T 1 101 0.0012 2 Q504H

Tesi di dottorato di Sara Pinosio discussa presso l’Università degli Studi di Udine
56
Table 3. 5 Insertions and deletions detected in CAD4. Position: Position in base pair relative to the length of P. nigra coding sequence. Type: Type of polymorphism (Ins = Insertion, Del = Deletion). No. pools: number of pools in which the polymorphism was identified. MIBC : Mean individual per base coverage of the considered position in the pools in which the polymorphism was identified. Frequency pools: Minor allele frequency in the pools carrying the polymorphism. Frequency total: Minor allele frequency in the whole sample.
Position Type Sequence No. pools MIBC Frequency
pools Frequency
total
325 Ins TGTGTA 8 264.67 0.0082 0.0055
374 Del CTT 9 257.27 0.0048 0.0036
522 Del A 12 342.98 0.0365 0.0365
1126 Del C 9 402.33 0.0205 0.0154
1259 Del AA 12 444.43 0.2964 0.2964
1909 Del T 11 191.13 0.0089 0.0082
Figure 3. 6 Minor allele frequency of SNPs identified in the test set by pooled multiplexed NGS and individual Sanger sequencing.
Among the large proportion of variants with a frequency lower than 5%, we identified
in HCT1 a variant causing a premature stop codon (C243*, Table 3. 4); the resulting
gene product is substantially shorter than the expected 315 amino acids. We confirmed
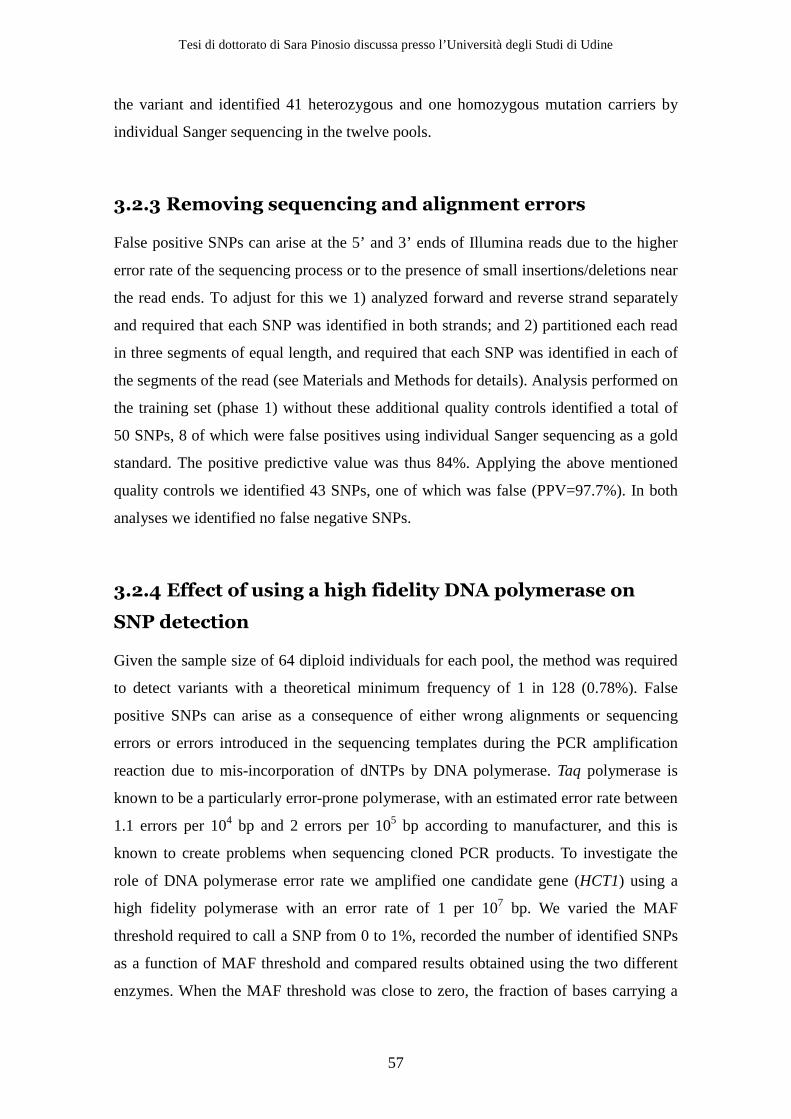
Tesi di dottorato di Sara Pinosio discussa presso l’Università degli Studi di Udine
57
the variant and identified 41 heterozygous and one homozygous mutation carriers by
individual Sanger sequencing in the twelve pools.
3.2.3 Removing sequencing and alignment errors
False positive SNPs can arise at the 5’ and 3’ ends of Illumina reads due to the higher
error rate of the sequencing process or to the presence of small insertions/deletions near
the read ends. To adjust for this we 1) analyzed forward and reverse strand separately
and required that each SNP was identified in both strands; and 2) partitioned each read
in three segments of equal length, and required that each SNP was identified in each of
the segments of the read (see Materials and Methods for details). Analysis performed on
the training set (phase 1) without these additional quality controls identified a total of
50 SNPs, 8 of which were false positives using individual Sanger sequencing as a gold
standard. The positive predictive value was thus 84%. Applying the above mentioned
quality controls we identified 43 SNPs, one of which was false (PPV=97.7%). In both
analyses we identified no false negative SNPs.
3.2.4 Effect of using a high fidelity DNA polymerase on
SNP detection
Given the sample size of 64 diploid individuals for each pool, the method was required
to detect variants with a theoretical minimum frequency of 1 in 128 (0.78%). False
positive SNPs can arise as a consequence of either wrong alignments or sequencing
errors or errors introduced in the sequencing templates during the PCR amplification
reaction due to mis-incorporation of dNTPs by DNA polymerase. Taq polymerase is
known to be a particularly error-prone polymerase, with an estimated error rate between
1.1 errors per 104 bp and 2 errors per 105 bp according to manufacturer, and this is
known to create problems when sequencing cloned PCR products. To investigate the
role of DNA polymerase error rate we amplified one candidate gene (HCT1) using a
high fidelity polymerase with an error rate of 1 per 107 bp. We varied the MAF
threshold required to call a SNP from 0 to 1%, recorded the number of identified SNPs
as a function of MAF threshold and compared results obtained using the two different
enzymes. When the MAF threshold was close to zero, the fraction of bases carrying a
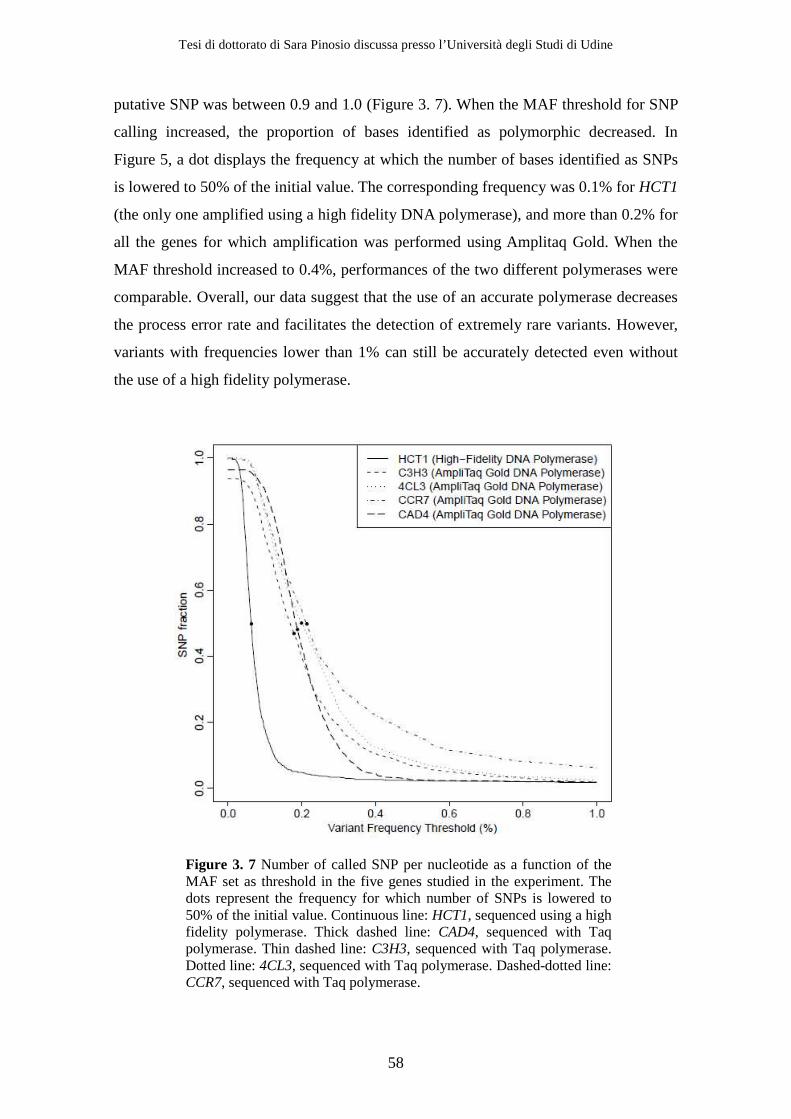
Tesi di dottorato di Sara Pinosio discussa presso l’Università degli Studi di Udine
58
putative SNP was between 0.9 and 1.0 (Figure 3. 7). When the MAF threshold for SNP
calling increased, the proportion of bases identified as polymorphic decreased. In
Figure 5, a dot displays the frequency at which the number of bases identified as SNPs
is lowered to 50% of the initial value. The corresponding frequency was 0.1% for HCT1
(the only one amplified using a high fidelity DNA polymerase), and more than 0.2% for
all the genes for which amplification was performed using Amplitaq Gold. When the
MAF threshold increased to 0.4%, performances of the two different polymerases were
comparable. Overall, our data suggest that the use of an accurate polymerase decreases
the process error rate and facilitates the detection of extremely rare variants. However,
variants with frequencies lower than 1% can still be accurately detected even without
the use of a high fidelity polymerase.
Figure 3. 7 Number of called SNP per nucleotide as a function of the MAF set as threshold in the five genes studied in the experiment. The dots represent the frequency for which number of SNPs is lowered to 50% of the initial value. Continuous line: HCT1, sequenced using a high fidelity polymerase. Thick dashed line: CAD4, sequenced with Taq polymerase. Thin dashed line: C3H3, sequenced with Taq polymerase. Dotted line: 4CL3, sequenced with Taq polymerase. Dashed-dotted line: CCR7, sequenced with Taq polymerase.

Tesi di dottorato di Sara Pinosio discussa presso l’Università degli Studi di Udine
59
3.2.5 Effect of decreasing Mean Individual Coverage (MIC)
on SNP detection
To investigate the effect of decreasing MIC on SNP detection and to identify the
optimal coverage for variant detection, we performed simulations on subsets of the data
generated in phase 1. Figure 3. 8 shows the number of SNPs as a function of MIC
(continuous line). The graph also shows the corresponding number of SNPs in common
with those identified in the analysis on the whole dataset (dashed line), which can be
considered a conservative estimate of true positive SNPs. When MIC is above 150x, the
results are not distinguishable from those obtained with the whole data set. Performance
is worse for MIC lower than 100x, where almost 50% of the identified SNPs were not
identified in the whole data set (i.e. likely to be false positives).
Figure 3. 8 Number of SNPs identified as a function of MIC. Results are plotted as the average of results from ten independent simulations (continuous line). The average number of SNPs included in the intersection between SNPs identified in the simulation and in the whole set of reads (dashed lines) are used as an estimate of true positives.
3.2.6 Population genetics parameters
Accuracy of nucleotide diversity estimation by pooled multiplexed NGS was evaluated
by comparing nucleotide diversity in training and test set. Estimates of nucleotide
diversity based on multiplexed pooled NGS and individual Sanger sequencing were
highly correlated (r=0.99, Figure 3. 9). Nucleotide diversity and statistical tests for
neutrality (Tajima’s D test) were computed in the whole sample. Results are shown in
Table 4. No Tajima’s D test showed significant deviation from neutrality. However,

Tesi di dottorato di Sara Pinosio discussa presso l’Università degli Studi di Udine
60
most of Tajima’s D tests showed negative values. Overall nucleotide diversity ranged
from 0.65*10-3 to 1.86*10-3. Non-synonymous to synonymous nucleotide diversity ratio
ranged from 0.03 in HCT1 and 4CL3 to 0.47 in CCR7.
Figure 3. 9 Nucleotide diversity calculated using allele frequency estimated by pooled multiplexed NGS (light bars) and by individual Sanger sequencing (dark bars).
3.3 Discussion
Next generation sequencing of selected genomic regions represents a powerful
approach to identify the complete spectrum of DNA sequence variants. Accurate
detection and genotyping of SNPs is crucial for using population sequencing to detect
rare, as well as common, functional variants affecting any given trait. For this reason, a
cheap and fast method for the identification of polymorphisms is likely to be of great
importance for determining the spectrum of variation and for identifying carriers of
Tesi di dottorato di Sara Pinosio discussa presso l’Università degli Studi di Udine
61
functional variants. We report on the use of multiplexed pooled next generation
sequencing of PCR products to identify SNPs in five candidate genes involved in lignin
biosynthesis.
Our aim was to detect rare, as well as common, polymorphisms in a sample of 768
poplar accessions arranged in 12 pools consisting of 64 accessions each. For this
reason, we developed a custom analysis workflow with strong discrimination ability
between real SNPs and sequencing or alignment errors. Given the small number of
genes that we sequenced, PCR was the method of choice. However, errors due to DNA
polymerase might affect the detection of rare variants. We performed a subset of
amplifications using a high fidelity polymerase, and showed that the use of an accurate
DNA polymerase increase the ability to discriminate between sequencing errors and
true polymorphisms (Figure 3. 7).
Each of the 12 pools was composed by a relatively high number of poplar accessions
(n=64), and the number of individuals sequenced in a single reaction was very high
(n=768). Therefore, a high Mean Individual Coverage was required to avoid that SNPs
in under-represented accessions were missed. In phase 1 we obtained a MIC of 350x.
Simulations showed that lower MIC (around 150x) still allowed to obtain reliable
results (Figure 3. 8).
False positive SNPs can arise at the 5’ and 3’ ends of Illumina reads due to the higher
error rate of the sequencing process or to the presence of small insertions/deletions near
the read ends. The workflow that we developed was effective in removing SNPs in
proximity of small insertions/deletions, and substantially reduced false positive
findings.
Applying our workflow to the whole data set, we identified 37 non-synonymous SNPs
in five genes involved in lignin biosynthesis (Table 3. 4), one of which (C729A) caused
a premature stop codon (C243*) in HCT1. We performed individual Sanger sequencing
to identify carriers of the C243* mutation. Carriers of the stop codon have been selected
for extensive phenotypic evaluation, and will be used in conventional breeding program
to obtain offspring with improved lignin composition. Among SNPs confirmed by
individual Sanger sequencing, we were able to identify a SNP occurring only once in
1536 chromosomes (expected frequency 0.065%). This gives an idea of the potential
that pooled multiplexed NGS has to identify rare variants. The ability to confidently
identify rare variants is crucial. Mutations affecting the phenotype are likely to be
Tesi di dottorato di Sara Pinosio discussa presso l’Università degli Studi di Udine
62
negatively selected. Their frequency f will depend on the mutation rate µ and on the
strength of the negative selections. At the equilibrium, the predicted frequency of a
dominant mutation iss
fµ= , and that of a recessive mutation is
sf
µ= . Assuming a
gene mutation rate in the range 10-8 to 10-5 and a decrease in fitness of 1%, the expected
frequency of a dominant allele in the population will be lower than 0.1% and that of a
recessive allele lower than 5%. Not surprisingly, more than 40% of the SNPs identified
in the present study had a frequency lower than 5%, and eight SNPs are predicted to
appear in only one chromosome (Table 3. 4). Knockout mutations, such as those that
can be obtained by gene silencing through transformation, are likely to be fully
recessive and have a selection coefficient equal to 1. This would translate into an
equilibrium frequency range of 0.0001-0.0032 for the same range of mutation rate. This
would require screening a number of 475 to 15000 individuals to have a 95% chance of
identifying the desired mutation. These numbers, though large, are clearly approachable
using the method here described that can therefore be adopted to look for rare mutations
that could be utilized in breeding programs in place of transgenic events.
We detected one such mutations that causes a premature stop codon (C243*) in HCT1
and that was found at a rather high frequency (3%), including in a homozygous
individual. The reason for such a high frequency and for the vitality of the homozygote
could either be that the mutation is not causing a gene knockout due to its location
towards the COOH-terminus of the protein that would therefore retain at least a partial
activity, or that the gene is partially or completely functionally redundant due to the
presence of additional family members (Shi et al., 2010).
Our method accurately identified rare variants, with low false-positive and low false-
negative rates, and allowed to correctly estimate minor allele frequency (Figure 3. 5).
As a consequence, all population genetics parameters that can be obtained from allele
frequency, such as nucleotide diversity, are also accurately estimated. Additional
population genetic parameters such as Tajima’s D can also be calculated. The workflow
that we developed can be used to identify common and rare SNPs in any organism.
Given its ability to discriminate true positive SNPs from bias, it is particularly suited for
the screening of large populations in search of rare variants that could be immediately
used in breeding programs. In addition, studies aimed at the genetic characterization of
different populations of a given organism may take advantage of our workflow.

Tesi di dottorato di Sara Pinosio discussa presso l’Università degli Studi di Udine
63
Individuals belonging to each population will be pooled together, and population
genetics parameters can be accurately estimated for each population. Finally,
researchers investigating qualitative phenotypes may compose pools based on the
phenotypic category, accurately estimate allele frequency of SNPs in the two
phenotypic classes, and perform pooled association studies following statistical
approaches that have already been developed (Sham et al., 2002).
In conclusion, we showed that our workflow based on pooled multiplexed NGS is an
efficient and accurate method to screen a large number of individuals for mutations
providing the basis for a next generation Ecotilling method (Comai et al., 2004).
Sensitivity and specificity of the method are extremely high, and the identification of
polymorphisms is highly quantitative, allowing accurate estimation of allele frequencies
and population genetic parameters in large samples.
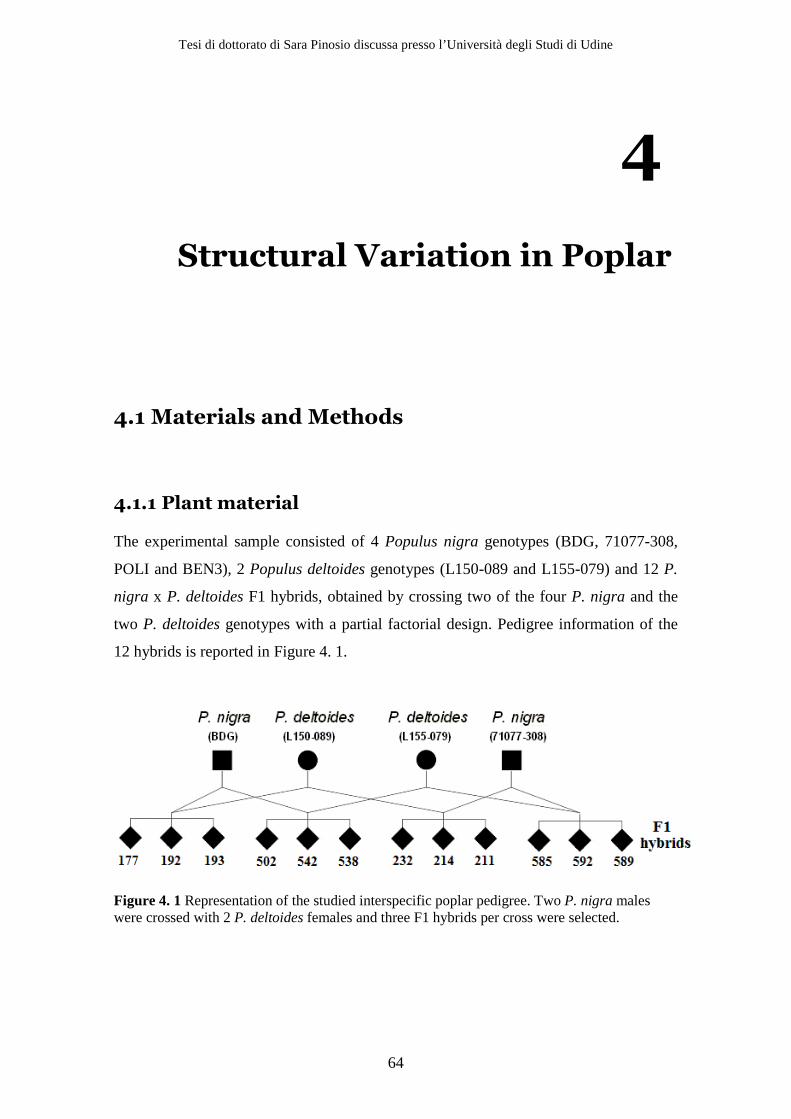
Tesi di dottorato di Sara Pinosio discussa presso l’Università degli Studi di Udine
64
4
Structural Variation in Poplar
4.1 Materials and Methods
4.1.1 Plant material
The experimental sample consisted of 4 Populus nigra genotypes (BDG, 71077-308,
POLI and BEN3), 2 Populus deltoides genotypes (L150-089 and L155-079) and 12 P.
nigra x P. deltoides F1 hybrids, obtained by crossing two of the four P. nigra and the
two P. deltoides genotypes with a partial factorial design. Pedigree information of the
12 hybrids is reported in Figure 4. 1.
Figure 4. 1 Representation of the studied interspecific poplar pedigree. Two P. nigra males were crossed with 2 P. deltoides females and three F1 hybrids per cross were selected.
Tesi di dottorato di Sara Pinosio discussa presso l’Università degli Studi di Udine
65
4.1.2 DNA extraction, library preparation, and next-
generation sequencing
Leaf tissues from greenhouse-grown plants were ground in liquid nitrogen and high-
molecular-weight genomic DNA was extracted from nuclei using a modification of
Zhang protocol (Zhang et al., 1995). To prepare NGS libraries, 5 µg of nuclear DNA
was randomly fragmented by Fragmentase treatment (NEBNext™ dsDNA
Fragmentase™, New England Biolabs) at 37°C for 1 hour. Libraries were prepared
using Illumina reagents, according to manufacturer's specifications (Illumina, San
Diego, CA). End repair of fragmented DNA was performed using T4 DNA polymerase
and Klenow polymerase with T4 polynucleotide kinase. Subsequently, an “A” base was
added at the 3' end using a 3'–5' exonuclease-deficient Klenow fragment. The paired
end adaptor (Illumina) with a single T base overhang at the 3′ end was ligated to the
above products. The PE adaptor ligated products were separated on a 2% agarose and
excised at approximately 600 bp. Fragments were enriched by 16-cycle PCR reaction
using PE primers 1.1 and 2.1 (Illumina). A Genome Analyzer flowcell was prepared on
the supplied cluster station and libraries were sequenced on the Illumina GA2x platform
according to the manufacturer's instructions. The library of sample POLI was sequenced
on the newer Illumina HiSeq platform. Images from the instrument were processed
using the manufacturer’s pipeline software to generate FASTQ sequence files.
4.1.3 Short read alignment and phylogeny reconstruction
CLC Genomics Workbench (CLC bio, Cambridge, MA) was used to remove low
quality 3' ends of each read. After trimming, only pairs where both reads were longer
than 50 bp were retained. Reads were aligned to the P. trichocarpa reference sequence
using the short read alignment program BWA (Li and Durbin, 2009) with default
parameters. Mean individual coverage for each sample was calculated by summing the
coverage at each position of the reference genome and dividing the result by the number
of positions of the genome covered by at least one read. Mean physical coverage was
calculated with the same criteria but taking into account also positions comprised
between the two sequenced reads. To reconstruct phylogeny we compared the reference
P. trichocarpa sequence with the consensus sequence of the four parental accessions.
The genome-wide number of nucleotide differences was calculated for all pairs of
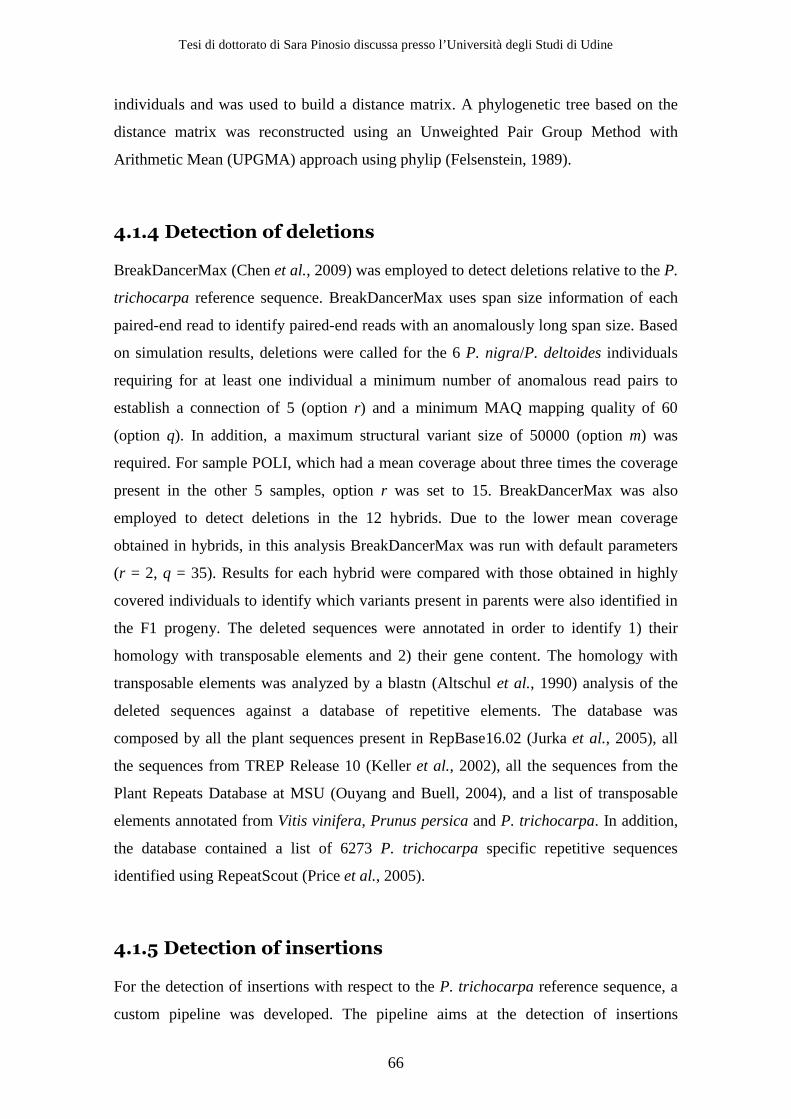
Tesi di dottorato di Sara Pinosio discussa presso l’Università degli Studi di Udine
66
individuals and was used to build a distance matrix. A phylogenetic tree based on the
distance matrix was reconstructed using an Unweighted Pair Group Method with
Arithmetic Mean (UPGMA) approach using phylip (Felsenstein, 1989).
4.1.4 Detection of deletions
BreakDancerMax (Chen et al., 2009) was employed to detect deletions relative to the P.
trichocarpa reference sequence. BreakDancerMax uses span size information of each
paired-end read to identify paired-end reads with an anomalously long span size. Based
on simulation results, deletions were called for the 6 P. nigra/P. deltoides individuals
requiring for at least one individual a minimum number of anomalous read pairs to
establish a connection of 5 (option r) and a minimum MAQ mapping quality of 60
(option q). In addition, a maximum structural variant size of 50000 (option m) was
required. For sample POLI, which had a mean coverage about three times the coverage
present in the other 5 samples, option r was set to 15. BreakDancerMax was also
employed to detect deletions in the 12 hybrids. Due to the lower mean coverage
obtained in hybrids, in this analysis BreakDancerMax was run with default parameters
(r = 2, q = 35). Results for each hybrid were compared with those obtained in highly
covered individuals to identify which variants present in parents were also identified in
the F1 progeny. The deleted sequences were annotated in order to identify 1) their
homology with transposable elements and 2) their gene content. The homology with
transposable elements was analyzed by a blastn (Altschul et al., 1990) analysis of the
deleted sequences against a database of repetitive elements. The database was
composed by all the plant sequences present in RepBase16.02 (Jurka et al., 2005), all
the sequences from TREP Release 10 (Keller et al., 2002), all the sequences from the
Plant Repeats Database at MSU (Ouyang and Buell, 2004), and a list of transposable
elements annotated from Vitis vinifera, Prunus persica and P. trichocarpa. In addition,
the database contained a list of 6273 P. trichocarpa specific repetitive sequences
identified using RepeatScout (Price et al., 2005).
4.1.5 Detection of insertions
For the detection of insertions with respect to the P. trichocarpa reference sequence, a
custom pipeline was developed. The pipeline aims at the detection of insertions
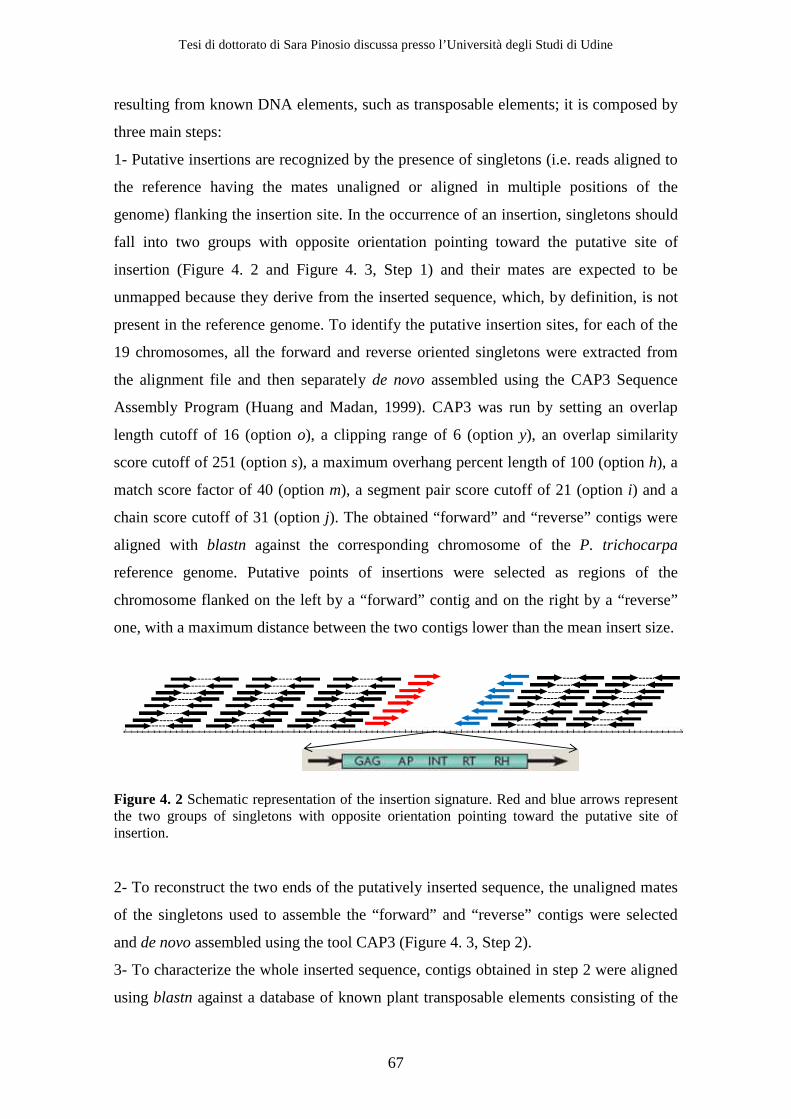
Tesi di dottorato di Sara Pinosio discussa presso l’Università degli Studi di Udine
67
resulting from known DNA elements, such as transposable elements; it is composed by
three main steps:
1- Putative insertions are recognized by the presence of singletons (i.e. reads aligned to
the reference having the mates unaligned or aligned in multiple positions of the
genome) flanking the insertion site. In the occurrence of an insertion, singletons should
fall into two groups with opposite orientation pointing toward the putative site of
insertion (Figure 4. 2 and Figure 4. 3, Step 1) and their mates are expected to be
unmapped because they derive from the inserted sequence, which, by definition, is not
present in the reference genome. To identify the putative insertion sites, for each of the
19 chromosomes, all the forward and reverse oriented singletons were extracted from
the alignment file and then separately de novo assembled using the CAP3 Sequence
Assembly Program (Huang and Madan, 1999). CAP3 was run by setting an overlap
length cutoff of 16 (option o), a clipping range of 6 (option y), an overlap similarity
score cutoff of 251 (option s), a maximum overhang percent length of 100 (option h), a
match score factor of 40 (option m), a segment pair score cutoff of 21 (option i) and a
chain score cutoff of 31 (option j). The obtained “forward” and “reverse” contigs were
aligned with blastn against the corresponding chromosome of the P. trichocarpa
reference genome. Putative points of insertions were selected as regions of the
chromosome flanked on the left by a “forward” contig and on the right by a “reverse”
one, with a maximum distance between the two contigs lower than the mean insert size.
Figure 4. 2 Schematic representation of the insertion signature. Red and blue arrows represent the two groups of singletons with opposite orientation pointing toward the putative site of insertion.
2- To reconstruct the two ends of the putatively inserted sequence, the unaligned mates
of the singletons used to assemble the “forward” and “reverse” contigs were selected
and de novo assembled using the tool CAP3 (Figure 4. 3, Step 2).
3- To characterize the whole inserted sequence, contigs obtained in step 2 were aligned
using blastn against a database of known plant transposable elements consisting of the
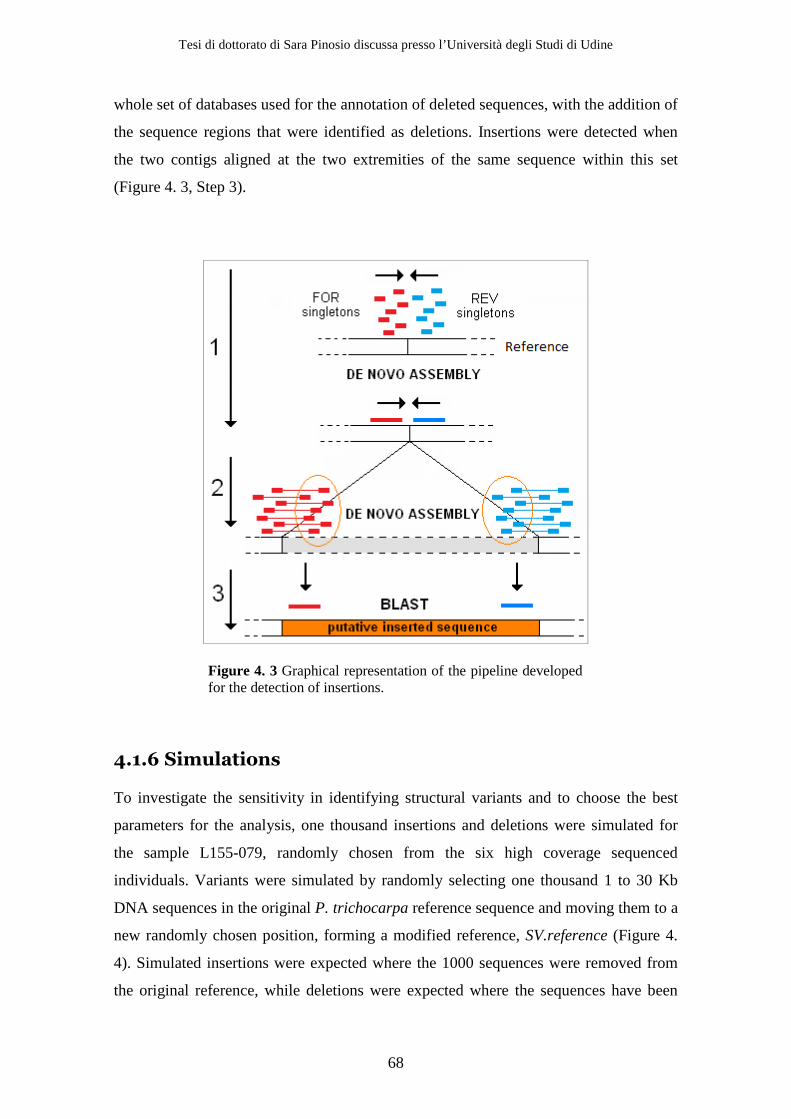
Tesi di dottorato di Sara Pinosio discussa presso l’Università degli Studi di Udine
68
whole set of databases used for the annotation of deleted sequences, with the addition of
the sequence regions that were identified as deletions. Insertions were detected when
the two contigs aligned at the two extremities of the same sequence within this set
(Figure 4. 3, Step 3).
Figure 4. 3 Graphical representation of the pipeline developed for the detection of insertions.
4.1.6 Simulations
To investigate the sensitivity in identifying structural variants and to choose the best
parameters for the analysis, one thousand insertions and deletions were simulated for
the sample L155-079, randomly chosen from the six high coverage sequenced
individuals. Variants were simulated by randomly selecting one thousand 1 to 30 Kb
DNA sequences in the original P. trichocarpa reference sequence and moving them to a
new randomly chosen position, forming a modified reference, SV.reference (Figure 4.
4). Simulated insertions were expected where the 1000 sequences were removed from
the original reference, while deletions were expected where the sequences have been
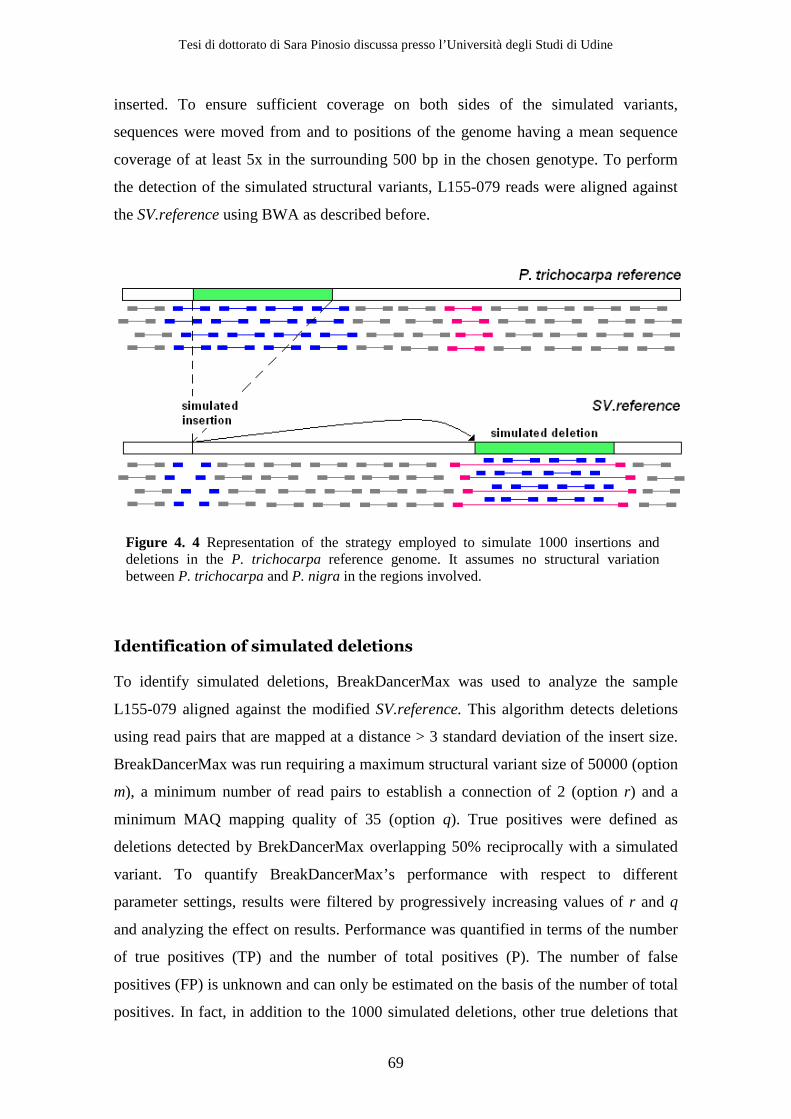
Tesi di dottorato di Sara Pinosio discussa presso l’Università degli Studi di Udine
69
inserted. To ensure sufficient coverage on both sides of the simulated variants,
sequences were moved from and to positions of the genome having a mean sequence
coverage of at least 5x in the surrounding 500 bp in the chosen genotype. To perform
the detection of the simulated structural variants, L155-079 reads were aligned against
the SV.reference using BWA as described before.
Figure 4. 4 Representation of the strategy employed to simulate 1000 insertions and deletions in the P. trichocarpa reference genome. It assumes no structural variation between P. trichocarpa and P. nigra in the regions involved.
Identification of simulated deletions
To identify simulated deletions, BreakDancerMax was used to analyze the sample
L155-079 aligned against the modified SV.reference. This algorithm detects deletions
using read pairs that are mapped at a distance > 3 standard deviation of the insert size.
BreakDancerMax was run requiring a maximum structural variant size of 50000 (option
m), a minimum number of read pairs to establish a connection of 2 (option r) and a
minimum MAQ mapping quality of 35 (option q). True positives were defined as
deletions detected by BrekDancerMax overlapping 50% reciprocally with a simulated
variant. To quantify BreakDancerMax’s performance with respect to different
parameter settings, results were filtered by progressively increasing values of r and q
and analyzing the effect on results. Performance was quantified in terms of the number
of true positives (TP) and the number of total positives (P). The number of false
positives (FP) is unknown and can only be estimated on the basis of the number of total
positives. In fact, in addition to the 1000 simulated deletions, other true deletions that

Tesi di dottorato di Sara Pinosio discussa presso l’Università degli Studi di Udine
70
were originally present in sample L155-079 with respect to P. trichocarpa can be
identified. To identify the optimal confidence score threshold and the optimal minimum
number of anomalously mapped pair reads required to call a deletion, we analyzed the
percentage of TP and P as a function of the applied thresholds. This analysis aimed at
the selection of those parameters at which the number of P considerably decreased
compared to TP, in order to maximize true positives, while minimizing false positives.
In addition, to analyze the possible factors affecting sensitivity, a comparison of the
sequence coverage in the 500 bp surrounding the simulated variants between true
positives and false negatives was performed. Boxplots and coverage statistics in the two
datasets were computed excluding from the analysis the 2.5% extreme values of the
coverage.
Identification of simulated insertions
To evaluate the power to detect insertions, the alignment of sample L155-079 against
the modified SV.reference was analyzed with a custom pipeline (see section 4.1.5). True
positives were defined as insertions detected by our pipeline less than 500bp apart from
the simulated insertion site. To evaluate the effect of sequence coverage on sensitivity,
a comparison of the sequence coverage between true positives and false negatives in the
500 bp surrounding the simulated insertions was performed.
4.1.7 Gene content analysis
The P. trichocarpa v2.2 gene annotation (Tuskan et al., 2006) was used to study the
gene content of the identified deletions and the gene fraction interrupted by the
identified insertions. Sequences of these two subsets of genes were used as query for a
blastx analysis against the Viridiplantae (taxid: 33090) non redundant protein (nr)
database. Blastx results were imported into the Blast2GO tool (Conesa et al., 2005) for
the functional annotation. Blast2GO extracts the GO terms associated to each of the
obtained blastx hit and returns an evaluated GO annotation for the query sequences.
Blast2GO functional annotation was performed taking into account only those
functional terms which were covered by at least 10% of the dataset. Over- or under-
representation of GO terms in the two subsets, as compared with the rest of the genome,
was tested using a Fisher’s Exact Test implemented in the Gossip (Blüthgen et al.,

Tesi di dottorato di Sara Pinosio discussa presso l’Università degli Studi di Udine
71
2005) package integrated in Blast2GO. To reduce the number of false positives, a false
discovery rate correction for multiple testing (Benjamini and Hochberg, 2007) was
applied and only differences with a corrected p-value <0.05 were selected.
4.1.8 PCR validation
To experimentally validate a set of identified insertions and deletions we used a PCR-
based assay. We performed PCR amplifications of the ends of 36 deletions and 36
insertions in order to obtain differential amplifications in the presence or absence of the
putatively detected variants. We aimed at obtaining at least 20 informative
amplifications for each kind of variant. We designed 4 primers for each variant (Figure
4. 5) that were combined in 3 primer pairs: one pair (1-2) amplifying the 5' junction
between the deleted/inserted sequence and the reference sequence, one pair (3-4)
amplifying 3' junction, and a third pair (1-4) connecting the two genomic regions
flanking the variant. Deletions are confirmed by the amplification of the two external
primers (1-4), while insertions are confirmed by the amplification of the two junctions
(1-2 and 3-4). Primer design was performed using BatchPrimer3 (You et al., 2008).
DNA amplifications were performed in 15 µl PCR reactions, using KAPA2G Fast Hot
Start Ready Mix (Kapa Biosystems). The reactions were performed in the Geneamp
9700 PCR system (Applied Biosystems, Foster City, CA), under the following
conditions: 95 °C for 2 minutes, 35 cycles of 15 seconds at 95 °C, 15 seconds at 56 °C
and 15 seconds at 72 °C, followed by a final extension of 1 minute at 72 °C.
Amplification results were run on a 1% agarose gel.
Figure 4. 5 Representation of the PCR assay performed to validate detected insertions and deletions with the expected amplification patterns for the two kinds of structural variation.

Tesi di dottorato di Sara Pinosio discussa presso l’Università degli Studi di Udine
72
4.2 Results
4.2.1 Sequencing
We performed whole-genome next-generation sequencing of 18 poplar accessions: 4
Populus nigra accessions, 2 Populus deltoides accessions and 12 P. nigra x P. deltoides
F1 hybrids, obtained by crossing two out the four re-sequenced P. nigra and the two re-
sequenced P. deltoides with a partial factorial design. Short reads were trimmed on the
basis of the FASTQ quality scores. After trimming, the mean read length ranged from
82.6 to 105.3 (Table 4. 1).
Table 4. 1 List of all the P. nigra (N), P. deltoides (D) and P. nigra x P. deltoides (N x D) resequenced accession with the corresponding library and coverage statistics obtained after the alignment to the P. trichocarpa reference genome.
Sample Species Mean read length
Mean insert size
Sequence coverage
Physical coverage
% reference covered
BDG N 96.3 554.4 16.9 48.6 61.7
71077-308 N 82.8 441.9 17.4 46.4 74.0
L150-089 D 104.7 227.9 20.7 22.6 64.2
L155-079 D 92.5 439.3 19.1 45.3 70.5
POLI N 96.7 390.2 69.7 140.7 76.6
BEN3 N 82.6 194.1 17.4 20.5 71.1
661200177 N x D 105.3 413.6 10.5 20.6 69.8
661200192 N x D 104.2 345.0 8.8 14.5 63.4
661200193 N x D 101.7 410.7 6.0 12.0 62.0
661200232 N x D 91.2 412.7 6.8 15.4 62.9
661200214 N x D 96.3 358.8 10.2 19.1 67.6
661200211 N x D 97.9 415.2 9.1 19.3 65.8
661200502 N x D 96.8 317.8 8.3 13.6 62.1
661200542 N x D 96.94 593.27 10.6 32.3 62.3
661200538 N x D 97.48 369.87 10.2 19.3 64.3
661200585 N x D 92.07 555.96 13.1 39.5 61.3
661200592 N x D 93.86 513.85 6.9 18.8 67.8
661200589 N x D 91.01 396.09 11.5 24.9 69.2
Populus trichocarpa v2 (Tuskan et al., 2006) was used as a reference against which
short reads were aligned. After removing reads aligned to the reference in multiple

Tesi di dottorato di Sara Pinosio discussa presso l’Università degli Studi di Udine
73
positions, we obtained a mean individual coverage ranging from 6x to ~70x (Table 4.
1). The original study design aimed at sequencing 2 P. nigra and 2 P. deltoides
accessions at 20x and the F1 hybrids at 10x. The two additional P. nigra accessions
(BEN3 and POLI) were sequenced in the framework of a collaborative effort, with a
coverage of 17x and 70x respectively. The percentage of the P. trichocarpa reference
sequence covered by at least one read was at least 60% in all the resequenced
individuals. The mean insert size was ~400 bp or more in all individuals, generating a
mean physical coverage of at least twice the sequence coverage. This was not true for
L155-079 and BEN3 in which insert size was ~200 bp and physical coverage was only
slightly greater than sequence coverage.
4.2.2 Simulations
To quantify the performance of structural variants detection as a function of parameters
settings, we simulated in the P. trichocarpa reference sequence one thousand deletions
and insertions ranging from 1 kb to 30 kb in size. We aligned reads obtained from
sample L155-079 against the simulated reference sequence and we analyzed the
performance in the identification of the simulated variants. To identify deletions we
used BreakDancerMax (Chen et al., 2009), an algorithm for high-resolution mapping of
genomic structural variation from next generation paired-end sequencing reads.
BreakDancerMax detects different kinds of structural variants, using read pairs that are
mapped with unexpected separation distances or orientation. We considered a deletion
as true positive if at least 50% of the detected variant overlapped with at least 50% of a
simulated variant. BreakDancerMax associates with each prediction a confidence score
that can be used to discriminate between true positives (TP) and false positives (FP). In
this experiment FP can only be estimated using the total number of positives (P) as a
proxy because the modified reference, in addition to the 1000 simulated deletions,
includes deletions originally present in sample L155-079. To identify the optimal
confidence score threshold for the detection of deletions, we analyzed the number of TP
(blue line) and P (red line) as a function of the applied score threshold (Figure 4. 6). If
all the identified deletions were true (simulated or not) the two curves would have the
same trend. However, increasing the confidence score threshold the number of positives
decreased faster than the number of true positives, suggesting the presence of a large
proportion of false positives when using low confidence score thresholds. At higher

Tesi di dottorato di Sara Pinosio discussa presso l’Università degli Studi di Udine
74
thresholds, the two curves decayed at a similar pace. This suggests that applying higher
thresholds the majority of the detected deletions are true. In order to maximize true
positives, while minimizing false positives we decided to select 60 as confidence score
threshold. Applying this threshold we excluded ~10% of the true positives and ~30% of
the total positives.
Figure 4. 6 Number of true positives (blue) and total positives (red) deletions as a function of the BreakDancerMax score threshold. A dashed line highlights the score threshold chosen for the analysis.
We performed a similar analysis to identify the optimal threshold for the number of
anomalously mapped pair reads required to call a deletion. We plotted the number of TP
(blue line) and the number of P (red line) as a function of the required number of
supporting pair reads (Figure 4. 7).
Figure 4. 7 Number of true positives (blue) and total positives (red) deletions as a function of the number of supporting paired reads required to call a variant. A dashed line highlights the number of supporting reads required for the analysis.
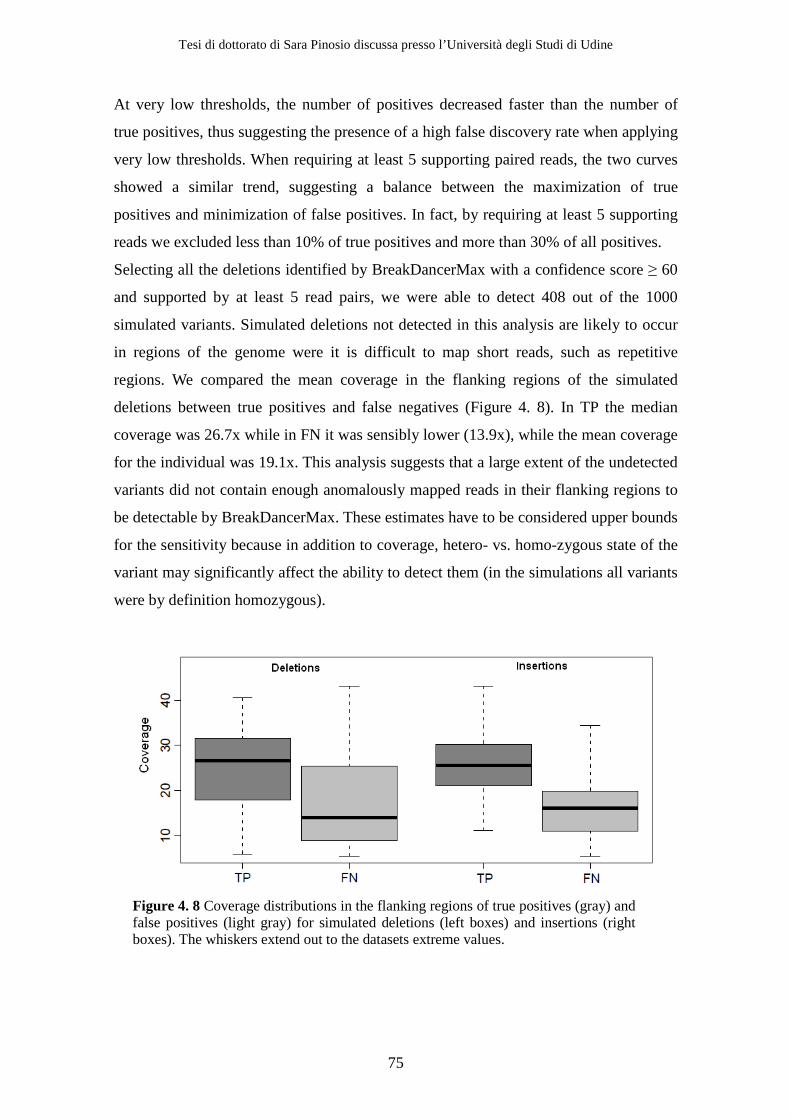
Tesi di dottorato di Sara Pinosio discussa presso l’Università degli Studi di Udine
75
At very low thresholds, the number of positives decreased faster than the number of
true positives, thus suggesting the presence of a high false discovery rate when applying
very low thresholds. When requiring at least 5 supporting paired reads, the two curves
showed a similar trend, suggesting a balance between the maximization of true
positives and minimization of false positives. In fact, by requiring at least 5 supporting
reads we excluded less than 10% of true positives and more than 30% of all positives.
Selecting all the deletions identified by BreakDancerMax with a confidence score ≥ 60
and supported by at least 5 read pairs, we were able to detect 408 out of the 1000
simulated variants. Simulated deletions not detected in this analysis are likely to occur
in regions of the genome were it is difficult to map short reads, such as repetitive
regions. We compared the mean coverage in the flanking regions of the simulated
deletions between true positives and false negatives (Figure 4. 8). In TP the median
coverage was 26.7x while in FN it was sensibly lower (13.9x), while the mean coverage
for the individual was 19.1x. This analysis suggests that a large extent of the undetected
variants did not contain enough anomalously mapped reads in their flanking regions to
be detectable by BreakDancerMax. These estimates have to be considered upper bounds
for the sensitivity because in addition to coverage, hetero- vs. homo-zygous state of the
variant may significantly affect the ability to detect them (in the simulations all variants
were by definition homozygous).
Figure 4. 8 Coverage distributions in the flanking regions of true positives (gray) and false positives (light gray) for simulated deletions (left boxes) and insertions (right boxes). The whiskers extend out to the datasets extreme values.
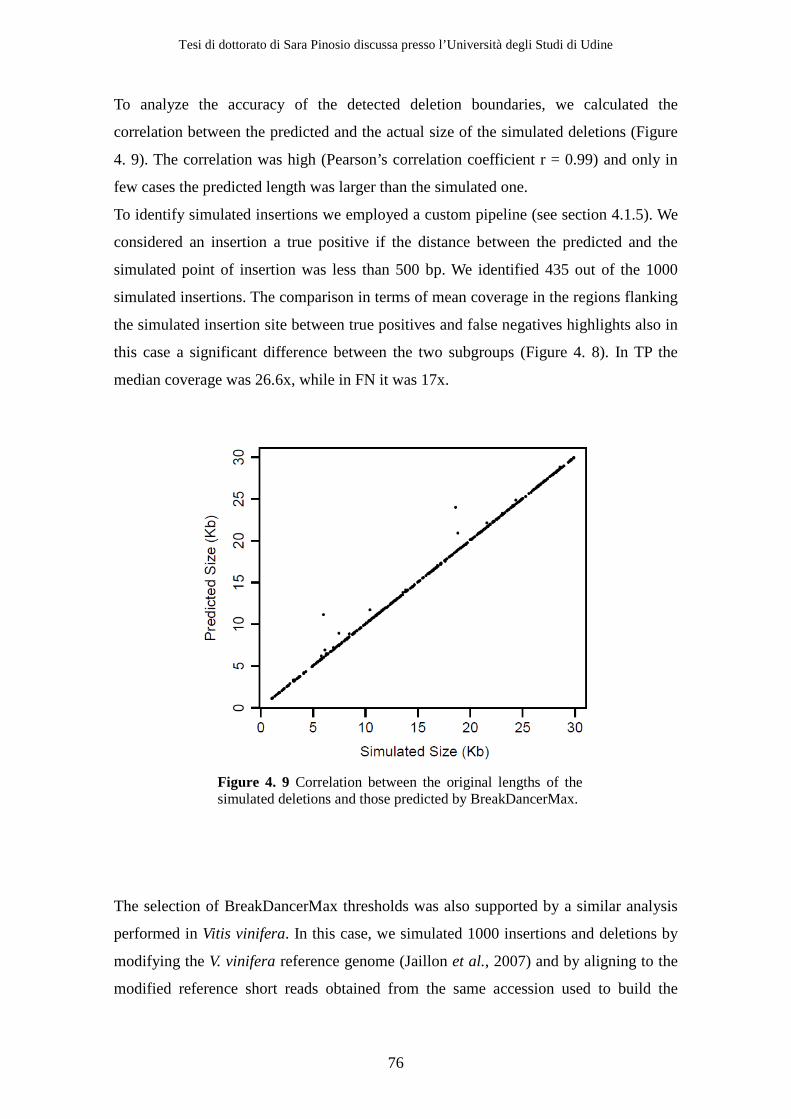
Tesi di dottorato di Sara Pinosio discussa presso l’Università degli Studi di Udine
76
To analyze the accuracy of the detected deletion boundaries, we calculated the
correlation between the predicted and the actual size of the simulated deletions (Figure
4. 9). The correlation was high (Pearson’s correlation coefficient r = 0.99) and only in
few cases the predicted length was larger than the simulated one.
To identify simulated insertions we employed a custom pipeline (see section 4.1.5). We
considered an insertion a true positive if the distance between the predicted and the
simulated point of insertion was less than 500 bp. We identified 435 out of the 1000
simulated insertions. The comparison in terms of mean coverage in the regions flanking
the simulated insertion site between true positives and false negatives highlights also in
this case a significant difference between the two subgroups (Figure 4. 8). In TP the
median coverage was 26.6x, while in FN it was 17x.
Figure 4. 9 Correlation between the original lengths of the simulated deletions and those predicted by BreakDancerMax.
The selection of BreakDancerMax thresholds was also supported by a similar analysis
performed in Vitis vinifera. In this case, we simulated 1000 insertions and deletions by
modifying the V. vinifera reference genome (Jaillon et al., 2007) and by aligning to the
modified reference short reads obtained from the same accession used to build the
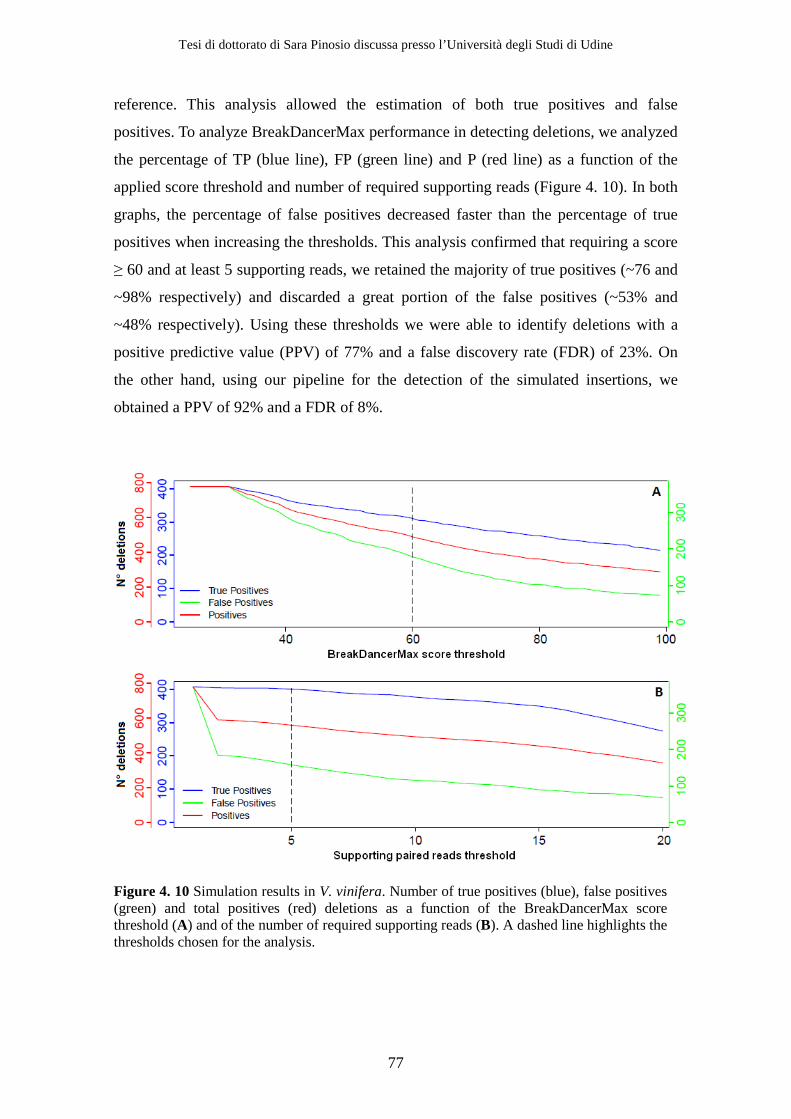
Tesi di dottorato di Sara Pinosio discussa presso l’Università degli Studi di Udine
77
reference. This analysis allowed the estimation of both true positives and false
positives. To analyze BreakDancerMax performance in detecting deletions, we analyzed
the percentage of TP (blue line), FP (green line) and P (red line) as a function of the
applied score threshold and number of required supporting reads (Figure 4. 10). In both
graphs, the percentage of false positives decreased faster than the percentage of true
positives when increasing the thresholds. This analysis confirmed that requiring a score
≥ 60 and at least 5 supporting reads, we retained the majority of true positives (~76 and
~98% respectively) and discarded a great portion of the false positives (~53% and
~48% respectively). Using these thresholds we were able to identify deletions with a
positive predictive value (PPV) of 77% and a false discovery rate (FDR) of 23%. On
the other hand, using our pipeline for the detection of the simulated insertions, we
obtained a PPV of 92% and a FDR of 8%.
Figure 4. 10 Simulation results in V. vinifera. Number of true positives (blue), false positives (green) and total positives (red) deletions as a function of the BreakDancerMax score threshold (A) and of the number of required supporting reads (B). A dashed line highlights the thresholds chosen for the analysis.
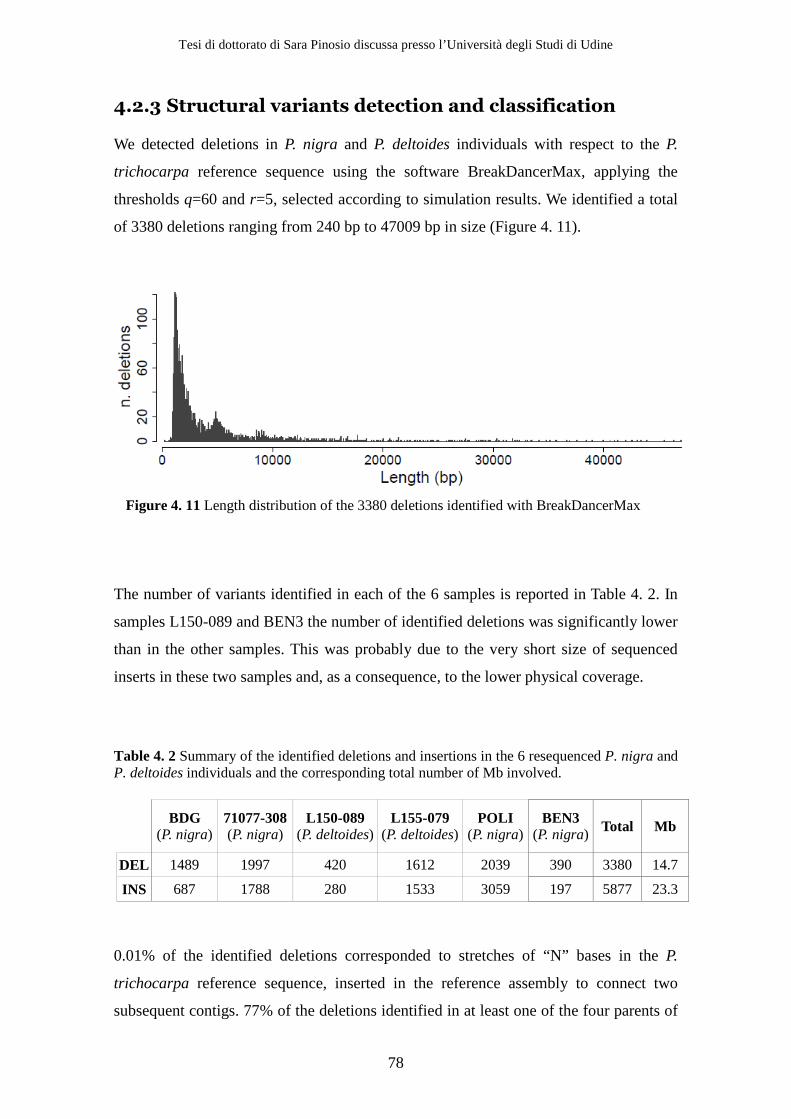
Tesi di dottorato di Sara Pinosio discussa presso l’Università degli Studi di Udine
78
4.2.3 Structural variants detection and classification
We detected deletions in P. nigra and P. deltoides individuals with respect to the P.
trichocarpa reference sequence using the software BreakDancerMax, applying the
thresholds q=60 and r=5, selected according to simulation results. We identified a total
of 3380 deletions ranging from 240 bp to 47009 bp in size (Figure 4. 11).
Figure 4. 11 Length distribution of the 3380 deletions identified with BreakDancerMax
The number of variants identified in each of the 6 samples is reported in Table 4. 2. In
samples L150-089 and BEN3 the number of identified deletions was significantly lower
than in the other samples. This was probably due to the very short size of sequenced
inserts in these two samples and, as a consequence, to the lower physical coverage.
Table 4. 2 Summary of the identified deletions and insertions in the 6 resequenced P. nigra and P. deltoides individuals and the corresponding total number of Mb involved.
BDG (P. nigra)
71077-308 (P. nigra)
L150-089 (P. deltoides)
L155-079 (P. deltoides)
POLI (P. nigra)
BEN3 (P. nigra) Total Mb
DEL 1489 1997 420 1612 2039 390 3380 14.7
INS 687 1788 280 1533 3059 197 5877 23.3
0.01% of the identified deletions corresponded to stretches of “N” bases in the P.
trichocarpa reference sequence, inserted in the reference assembly to connect two
subsequent contigs. 77% of the deletions identified in at least one of the four parents of
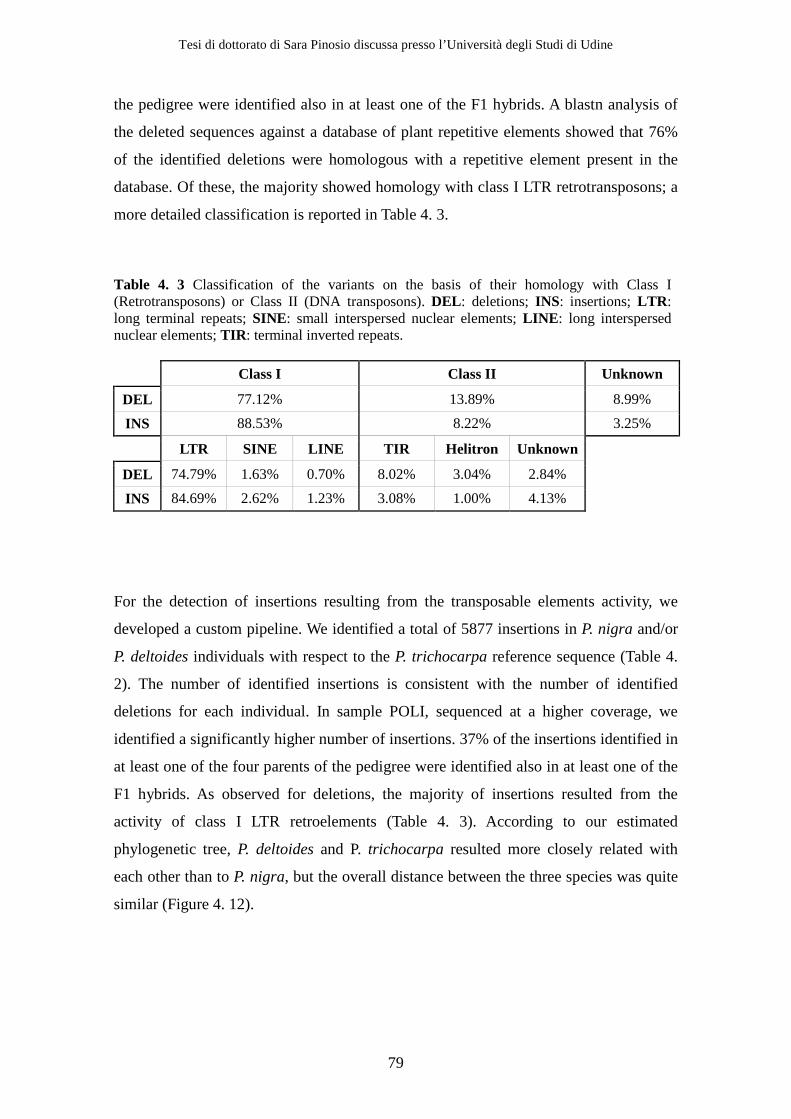
Tesi di dottorato di Sara Pinosio discussa presso l’Università degli Studi di Udine
79
the pedigree were identified also in at least one of the F1 hybrids. A blastn analysis of
the deleted sequences against a database of plant repetitive elements showed that 76%
of the identified deletions were homologous with a repetitive element present in the
database. Of these, the majority showed homology with class I LTR retrotransposons; a
more detailed classification is reported in Table 4. 3.
Table 4. 3 Classification of the variants on the basis of their homology with Class I (Retrotransposons) or Class II (DNA transposons). DEL : deletions; INS: insertions; LTR : long terminal repeats; SINE: small interspersed nuclear elements; LINE : long interspersed nuclear elements; TIR : terminal inverted repeats.
Class I Class II Unknown
DEL 77.12% 13.89% 8.99%
INS 88.53% 8.22% 3.25%
LTR SINE LINE TIR Helitron Unknown
DEL 74.79% 1.63% 0.70% 8.02% 3.04% 2.84%
INS 84.69% 2.62% 1.23% 3.08% 1.00% 4.13%
For the detection of insertions resulting from the transposable elements activity, we
developed a custom pipeline. We identified a total of 5877 insertions in P. nigra and/or
P. deltoides individuals with respect to the P. trichocarpa reference sequence (Table 4.
2). The number of identified insertions is consistent with the number of identified
deletions for each individual. In sample POLI, sequenced at a higher coverage, we
identified a significantly higher number of insertions. 37% of the insertions identified in
at least one of the four parents of the pedigree were identified also in at least one of the
F1 hybrids. As observed for deletions, the majority of insertions resulted from the
activity of class I LTR retroelements (Table 4. 3). According to our estimated
phylogenetic tree, P. deltoides and P. trichocarpa resulted more closely related with
each other than to P. nigra, but the overall distance between the three species was quite
similar (Figure 4. 12).
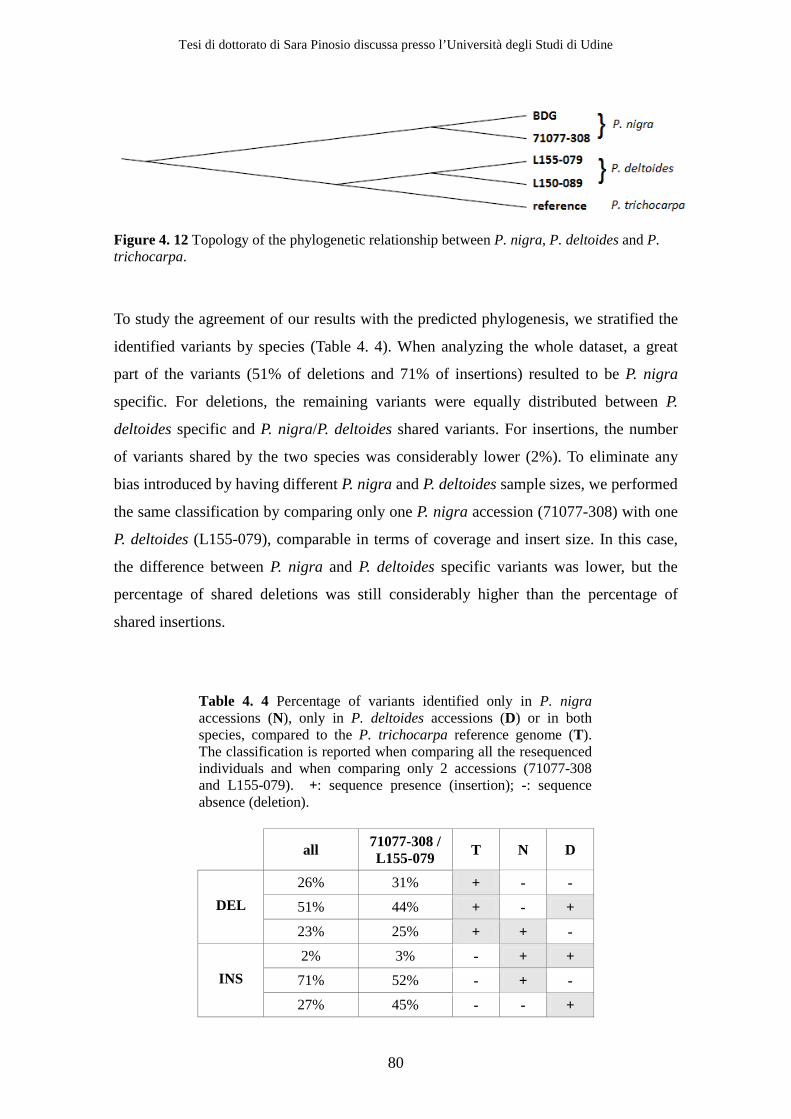
Tesi di dottorato di Sara Pinosio discussa presso l’Università degli Studi di Udine
80
Figure 4. 12 Topology of the phylogenetic relationship between P. nigra, P. deltoides and P. trichocarpa.
To study the agreement of our results with the predicted phylogenesis, we stratified the
identified variants by species (Table 4. 4). When analyzing the whole dataset, a great
part of the variants (51% of deletions and 71% of insertions) resulted to be P. nigra
specific. For deletions, the remaining variants were equally distributed between P.
deltoides specific and P. nigra/P. deltoides shared variants. For insertions, the number
of variants shared by the two species was considerably lower (2%). To eliminate any
bias introduced by having different P. nigra and P. deltoides sample sizes, we performed
the same classification by comparing only one P. nigra accession (71077-308) with one
P. deltoides (L155-079), comparable in terms of coverage and insert size. In this case,
the difference between P. nigra and P. deltoides specific variants was lower, but the
percentage of shared deletions was still considerably higher than the percentage of
shared insertions.
Table 4. 4 Percentage of variants identified only in P. nigra accessions (N), only in P. deltoides accessions (D) or in both species, compared to the P. trichocarpa reference genome (T). The classification is reported when comparing all the resequenced individuals and when comparing only 2 accessions (71077-308 and L155-079). +: sequence presence (insertion); -: sequence absence (deletion).
all 71077-308 /
L155-079 T N D
26% 31% + - -
51% 44% + - + DEL
23% 25% + + -
2% 3% - + +
71% 52% - + - INS
27% 45% - - +
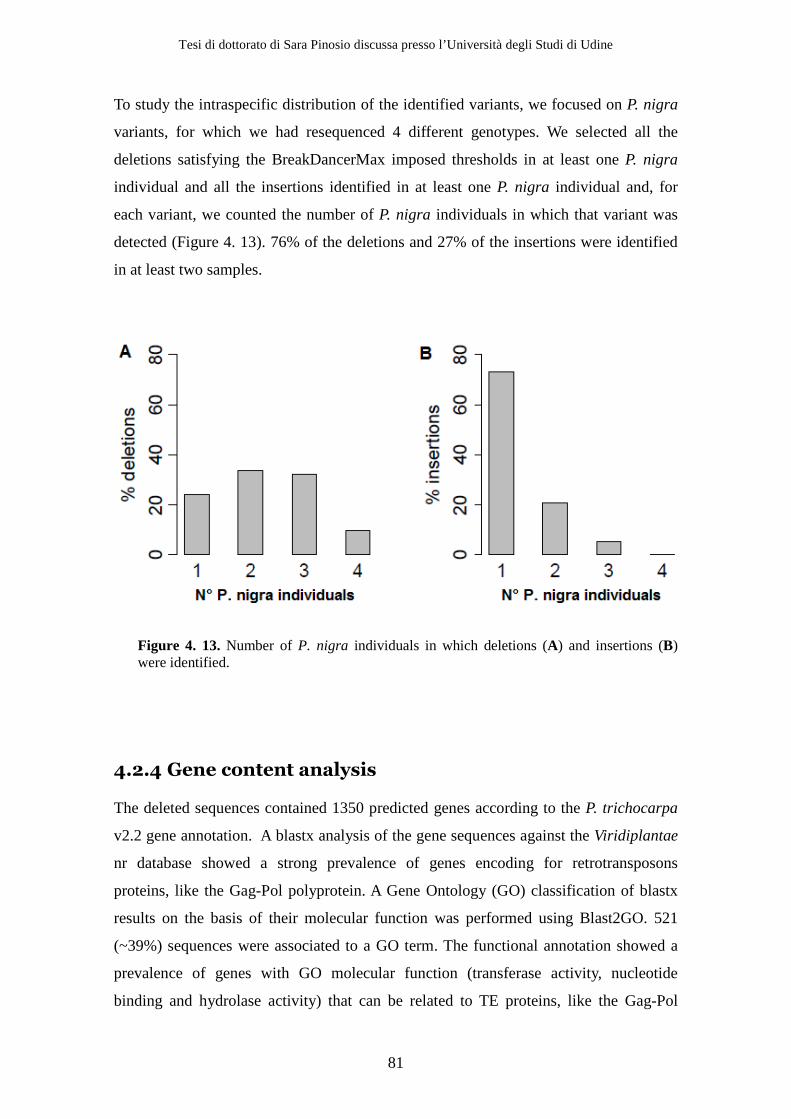
Tesi di dottorato di Sara Pinosio discussa presso l’Università degli Studi di Udine
81
To study the intraspecific distribution of the identified variants, we focused on P. nigra
variants, for which we had resequenced 4 different genotypes. We selected all the
deletions satisfying the BreakDancerMax imposed thresholds in at least one P. nigra
individual and all the insertions identified in at least one P. nigra individual and, for
each variant, we counted the number of P. nigra individuals in which that variant was
detected (Figure 4. 13). 76% of the deletions and 27% of the insertions were identified
in at least two samples.
Figure 4. 13. Number of P. nigra individuals in which deletions (A) and insertions (B) were identified.
4.2.4 Gene content analysis
The deleted sequences contained 1350 predicted genes according to the P. trichocarpa
v2.2 gene annotation. A blastx analysis of the gene sequences against the Viridiplantae
nr database showed a strong prevalence of genes encoding for retrotransposons
proteins, like the Gag-Pol polyprotein. A Gene Ontology (GO) classification of blastx
results on the basis of their molecular function was performed using Blast2GO. 521
(~39%) sequences were associated to a GO term. The functional annotation showed a
prevalence of genes with GO molecular function (transferase activity, nucleotide
binding and hydrolase activity) that can be related to TE proteins, like the Gag-Pol

Tesi di dottorato di Sara Pinosio discussa presso l’Università degli Studi di Udine
82
polyprotein (Figure 4. 14). Among these genes, we looked for enrichment in GO terms
involved in biological processes, cellular components, and molecular function. None of
the GO terms resulted over- or under-represented in the deleted genes, compared to the
remaining P. trichocarpa genes.
Figure 4. 14 Molecular function annotation graph. The combined annotation of the genes identified in the deleted sequences is visualized together. Only functional terms covered by at least the 10% of the dataset are displayed.
According to the P. trichocarpa v2.2 gene annotation, we found 1315 genes interrupted
by one of the identified insertions. The sequences of these genes were used as query for
a blastx analysis against the Viridiplantae nr database and blastx results were used for
the functional classification with blast2GO. 571 (~43%) sequences were associated to a
GO term. The resulting functional annotation was similar to the one obtained for
deletions, showing also in this case a prevalence of genes with GO molecular function
that can be related to TE proteins (Figure 4. 15). We detected over-representation of
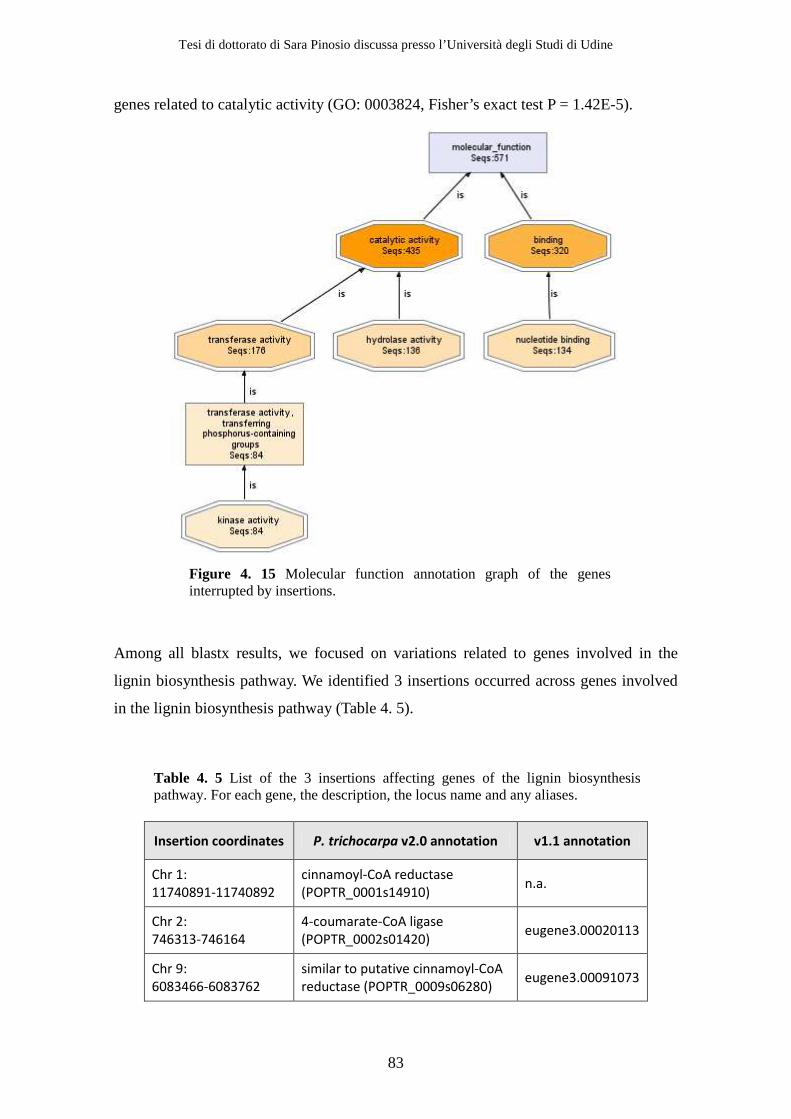
Tesi di dottorato di Sara Pinosio discussa presso l’Università degli Studi di Udine
83
genes related to catalytic activity (GO: 0003824, Fisher’s exact test P = 1.42E-5).
Figure 4. 15 Molecular function annotation graph of the genes interrupted by insertions.
Among all blastx results, we focused on variations related to genes involved in the
lignin biosynthesis pathway. We identified 3 insertions occurred across genes involved
in the lignin biosynthesis pathway (Table 4. 5).
Table 4. 5 List of the 3 insertions affecting genes of the lignin biosynthesis pathway. For each gene, the description, the locus name and any aliases.
Insertion coordinates P. trichocarpa v2.0 annotation v1.1 annotation
Chr 1:
11740891-11740892
cinnamoyl-CoA reductase
(POPTR_0001s14910) n.a.
Chr 2:
746313-746164
4-coumarate-CoA ligase
(POPTR_0002s01420) eugene3.00020113
Chr 9:
6083466-6083762
similar to putative cinnamoyl-CoA
reductase (POPTR_0009s06280) eugene3.00091073

Tesi di dottorato di Sara Pinosio discussa presso l’Università degli Studi di Udine
84
To obtain a genome-wide view of the distribution of deletions and insertions in the
poplar genome, we plotted the number of identified variants every 250 kb for each of
the 19 chromosomes (Figure 4. 16). Deletions and insertions were evenly distributed
across the whole genome. Peaks of variation were located in repetitive regions of the
genome in which the gene density is low.
Figure 4. 16. SV distribution across the 19 poplar chromosomes. Dark green bars: deletions. Light green bars: insertions. Red bars: gene density distribution calculated as the number of genes every 100 kb. Blue bars: repetitiveness of the genome calculated with a k-mer analysis using the tool Tallymer (Kurtz et al., 2008).
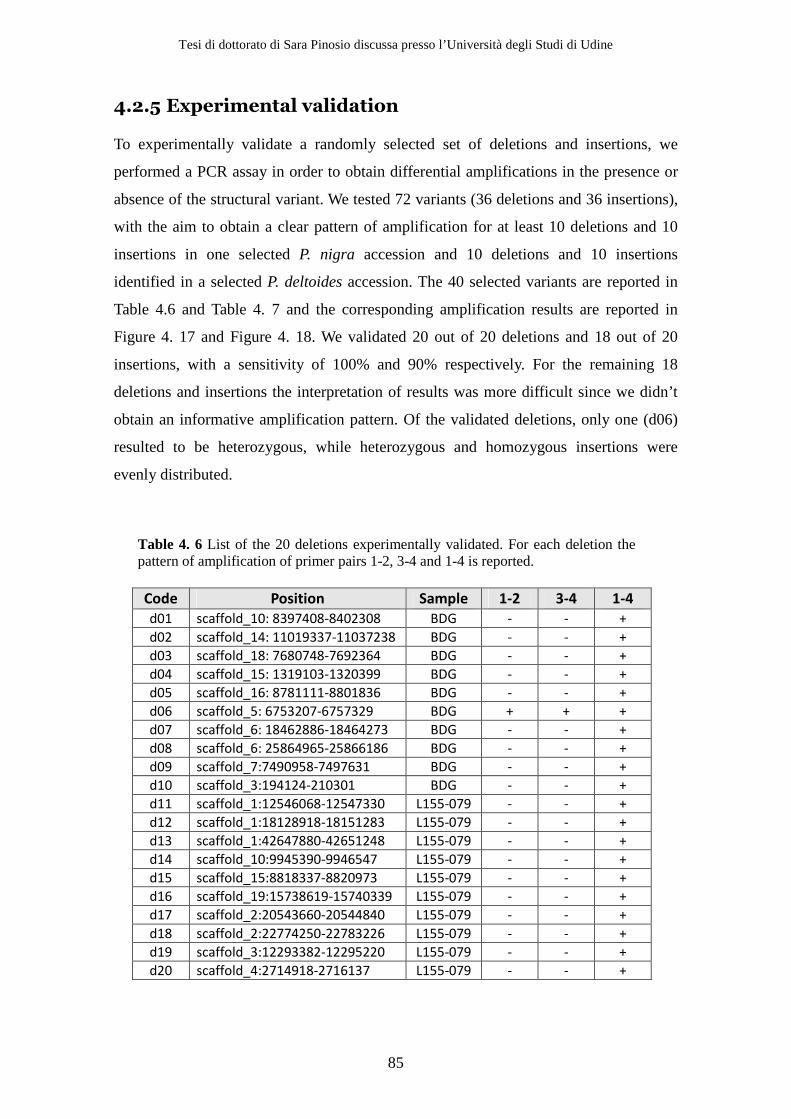
Tesi di dottorato di Sara Pinosio discussa presso l’Università degli Studi di Udine
85
4.2.5 Experimental validation
To experimentally validate a randomly selected set of deletions and insertions, we
performed a PCR assay in order to obtain differential amplifications in the presence or
absence of the structural variant. We tested 72 variants (36 deletions and 36 insertions),
with the aim to obtain a clear pattern of amplification for at least 10 deletions and 10
insertions in one selected P. nigra accession and 10 deletions and 10 insertions
identified in a selected P. deltoides accession. The 40 selected variants are reported in
Table 4.6 and Table 4. 7 and the corresponding amplification results are reported in
Figure 4. 17 and Figure 4. 18. We validated 20 out of 20 deletions and 18 out of 20
insertions, with a sensitivity of 100% and 90% respectively. For the remaining 18
deletions and insertions the interpretation of results was more difficult since we didn’t
obtain an informative amplification pattern. Of the validated deletions, only one (d06)
resulted to be heterozygous, while heterozygous and homozygous insertions were
evenly distributed.
Table 4. 6 List of the 20 deletions experimentally validated. For each deletion the pattern of amplification of primer pairs 1-2, 3-4 and 1-4 is reported.
Code Position Sample 1-2 3-4 1-4
d01 scaffold_10: 8397408-8402308 BDG - - +
d02 scaffold_14: 11019337-11037238 BDG - - +
d03 scaffold_18: 7680748-7692364 BDG - - +
d04 scaffold_15: 1319103-1320399 BDG - - +
d05 scaffold_16: 8781111-8801836 BDG - - +
d06 scaffold_5: 6753207-6757329 BDG + + +
d07 scaffold_6: 18462886-18464273 BDG - - +
d08 scaffold_6: 25864965-25866186 BDG - - +
d09 scaffold_7:7490958-7497631 BDG - - +
d10 scaffold_3:194124-210301 BDG - - +
d11 scaffold_1:12546068-12547330 L155-079 - - +
d12 scaffold_1:18128918-18151283 L155-079 - - +
d13 scaffold_1:42647880-42651248 L155-079 - - +
d14 scaffold_10:9945390-9946547 L155-079 - - +
d15 scaffold_15:8818337-8820973 L155-079 - - +
d16 scaffold_19:15738619-15740339 L155-079 - - +
d17 scaffold_2:20543660-20544840 L155-079 - - +
d18 scaffold_2:22774250-22783226 L155-079 - - +
d19 scaffold_3:12293382-12295220 L155-079 - - +
d20 scaffold_4:2714918-2716137 L155-079 - - +
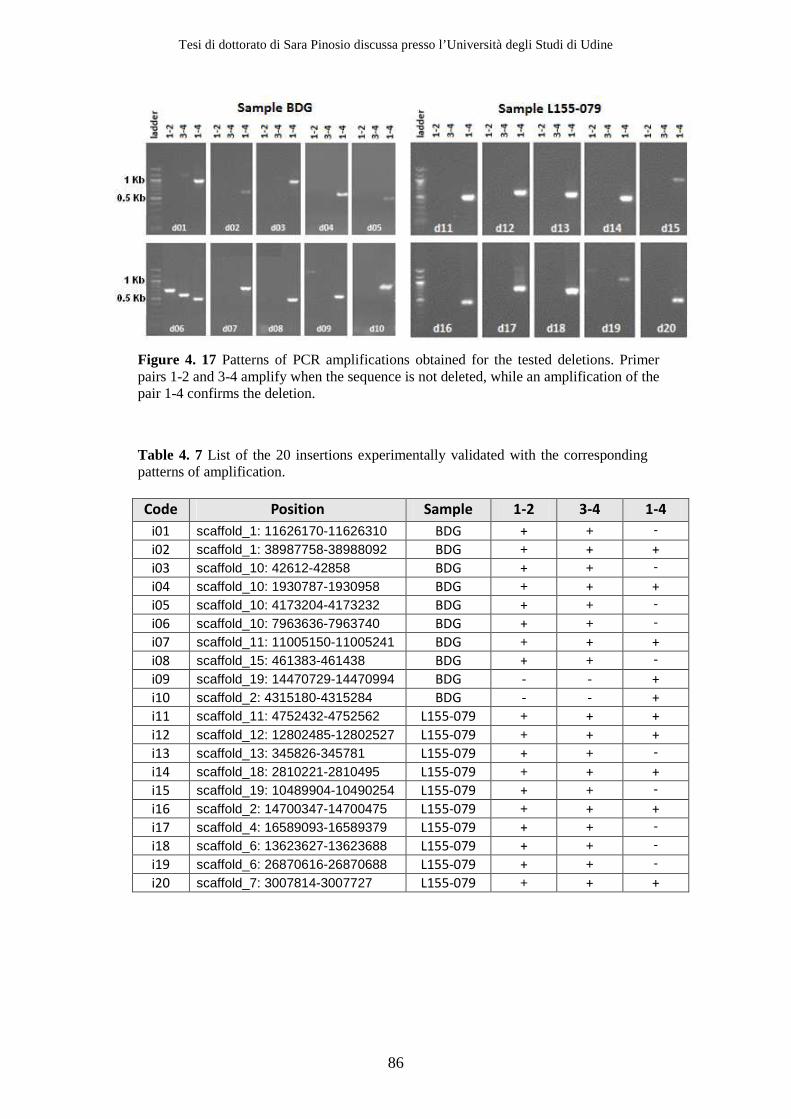
Tesi di dottorato di Sara Pinosio discussa presso l’Università degli Studi di Udine
86
Figure 4. 17 Patterns of PCR amplifications obtained for the tested deletions. Primer pairs 1-2 and 3-4 amplify when the sequence is not deleted, while an amplification of the pair 1-4 confirms the deletion.
Table 4. 7 List of the 20 insertions experimentally validated with the corresponding patterns of amplification.
Code Position Sample 1-2 3-4 1-4
i01 scaffold_1: 11626170-11626310 BDG + + -
i02 scaffold_1: 38987758-38988092 BDG + + + i03 scaffold_10: 42612-42858 BDG + + -
i04 scaffold_10: 1930787-1930958 BDG + + + i05 scaffold_10: 4173204-4173232 BDG + + -
i06 scaffold_10: 7963636-7963740 BDG + + -
i07 scaffold_11: 11005150-11005241 BDG + + + i08 scaffold_15: 461383-461438 BDG + + -
i09 scaffold_19: 14470729-14470994 BDG - - + i10 scaffold_2: 4315180-4315284 BDG - - + i11 scaffold_11: 4752432-4752562 L155-079 + + + i12 scaffold_12: 12802485-12802527 L155-079 + + + i13 scaffold_13: 345826-345781 L155-079 + + -
i14 scaffold_18: 2810221-2810495 L155-079 + + + i15 scaffold_19: 10489904-10490254 L155-079 + + -
i16 scaffold_2: 14700347-14700475 L155-079 + + + i17 scaffold_4: 16589093-16589379 L155-079 + + -
i18 scaffold_6: 13623627-13623688 L155-079 + + -
i19 scaffold_6: 26870616-26870688 L155-079 + + -
i20 scaffold_7: 3007814-3007727 L155-079 + + +

Tesi di dottorato di Sara Pinosio discussa presso l’Università degli Studi di Udine
87
Figure 4. 18 Patterns of PCR amplifications obtained for the tested insertions. Amplification of primer pairs 1-2 and 3-4 confirms the insertions while the pair 1-4 amplifies when there is no insertion.
4.3 Discussion
In the present study we performed a genome-wide analysis of structural variation (SV)
between Populus nigra and Populus deltoides. Although the global impact of structural
variation is unknown, it might have dramatic consequences on phenotypic diversity
(Weigel and Mott, 2009). In humans, it has been recently demonstrated that SVs are
quite common and may have considerable effects on human phenotypic variation by
altering gene dosage, disrupting coding sequences, or perturbing regulation (Hurles et
al., 2008). A recent work in maize (Springer et al., 2009) reported the presence of
several thousands of DNA segments, including genic sequences, that are present in one
inbred line but absent from another. Little is known about the prevalence of structural
variation in poplar and its relationship with the origin of intra-specific diversity. We
focused on the detection of deletions and insertions of 1-50 Kb by means of Illumina
paired-end sequencing of 4 P. nigra accessions, 2 P. deltoides accessions and 12 P.
nigra x P. deltoides F1 hybrids. Most of these variants are probably due to the recent
movement of transposable elements (TEs), that are very active in many plants.
The analysis was performed using as reference the genome of a different Populus
species (P. trichocarpa). On average we were able to cover ~70% of the P. trichocarpa
reference genome with reads obtained from both P. nigra and P. deltoides accessions.

Tesi di dottorato di Sara Pinosio discussa presso l’Università degli Studi di Udine
88
Thus, the alignment to the P. trichocarpa reference genome constitutes a powerful
resource for detecting a large portion of structural changes in these two species.
For the detection of structural variants we exploited the paired-end mapping
information generated from next-generation sequencing data. Using this signature,
deletions can be easily detected and there are different available tools that can be
employed for this aim (Medvedev et al., 2009). On the other hand, the detection of
novel insertions is more complicated and available tools can only detect very short
insertions that are enclosed by two sequenced reads of the same insert. For this reason
we performed the detection of structural variants employing two different approaches
for the two different types of variation: we used the software BreakDancerMax (Chen et
al., 2009) for the detection of deletions and we developed a custom pipeline,
specifically aimed at the detection of insertions resulting from the movement of
transposable elements. To quantify the performance in the detection of these variants
with the two approaches, we simulated one thousand deletions and insertions and we
measured our ability to identify them. We detected 40.8% of the simulated deletions and
43.5% of the simulated insertions. The two approaches gave very similar results in
terms of true positive rate, suggesting the presence of a common factor that affects the
performance of both methods. One possible factor is the presence in the SVs flanking
regions of sequences that are difficult to map, such as repetitive sequences. This
problem was already reported by BreakDancer developers. They found that, at 100 fold
physical coverage, out of the 844 structural variants identified on chromosome 17 of J.
Craig Venter’s genome (Levy et al., 2007), only about 365 (43.2%) contained two or
more anomalously mapped reads in their flanking regions and were detectable by
BreakDancerMax. Thus, working on different species does not have significant effects
on the performance of the tool. Moreover, Chen and colleagues showed that
BreakDancer’s performance is strongly dependent on the physical coverage of the
dataset. This evidence was confirmed by our results in which, for both simulated
deletions and insertions, the median coverage in the flanking regions of true positives
was higher than the median coverage of false positives. In addition, simulation results
confirmed the high accuracy of BreakDancerMax in the prediction of deletion sizes. In
our simulation, false positive rate (FPR) could not be estimated because, in addition to
the 1000 simulated deletions, the modified reference also contained true deletions. For
this reason, we performed a PCR-based validation of a random set of identified
variants. The experimental validation is the gold standard method to verify the

Tesi di dottorato di Sara Pinosio discussa presso l’Università degli Studi di Udine
89
reliability of our results. Even if we tested only a limited number of variants, results
were valuable to predict the false discovery rate. In fact, we obtained a FDR of 5% for
the two methods combined. In addition, simulation results obtained in V. vinifera
confirmed that the imposed thresholds for the detection of deletions ensured the
exclusion of a substantial proportion of false positives. In V. vinifera we estimated PPV
and FDR of the two approaches for the detection of structural variants. Deletions were
detected with PPV=77% and FDR=23% and insertions with a PPV=92% and FDR=8%.
These results suggest that BreakDancerMax performance in detecting deletions is still
amenable to improvements.
The most significant source of false positives from BreakDancer arises from alignment
artifacts in short-read data (Koboldt et al., 2010). Thus, a large fraction of false
positives is probably located in regions that are difficult to map, such as repetitive
regions. The false discovery rate may also be affected by the insert size of the
sequenced library. In this study, we used relatively small insert sizes (200-500 bp);
using larger insert sizes has the advantage of greater genomic coverage per sequenced
fragment but increases the difficulty of breakpoint annotation. It is likely that complete
characterization of all variants will require paired-end sequencing of several libraries of
different insert sizes, allowing reads to fall outside any repetitive sequence present near
the breakpoints.
Overall, we identified 3380 deletions and 5887 insertions in the studied accessions with
respect to the P. trichocarpa reference genome, corresponding to 14.7 Mb and 23.3 Mb
respectively. The number of identified variants per sample was quite variable. This was
mostly due to the variability of the sequenced libraries insert size. In fact, in the two
samples (L150-089 and BEN3) having a mean insert size considerably lower than the
other ones, also the number of identified variants was considerably lower. On the other
hand, in sample POLI, having a mean coverage almost 4 times the coverage of the other
samples, we identified a greater number of both deletions and insertions. These
considerations highlight the importance of insert size and physical coverage in the
detection of structural variants using the paired-end mapping signature.
In plants, transposable elements are a major source of genetic variation (Kidwell and
Lisch, 1997). As expected, the majority of the identified variants were related with the
activity of transposable elements, with a clear predominance of class I LTR
retrotransposons. These elements vary in size from several hundred bases to over 10 kb
(J L Bennetzen, 2000). Plotting the size distribution of the identified deletions, we
Tesi di dottorato di Sara Pinosio discussa presso l’Università degli Studi di Udine
90
observed two signature peaks at ~5Kb and at 1 Kb that could be respectively related to
entire retrotransposons and to retroelements undergone to subsequent rearrangements.
LTR retrotransposons transpose with the so called copy-and-paste mechanisms, thus
leaving a copy of themselves in the original site. For this reason, we expected that the
majority of the identified SVs, both insertions and deletions, originated from the
insertion of a new TE copy in a different position. Only ~10% of the variants showed
homology with class II DNA transposons. These elements transpose with the cut-and-
paste mechanisms, thus creating both a deletion (in the original site) and an insertion (in
the new site). Therefore, only a small proportion of the variants are expected to
originate from the excision of a TE from its original site.
When stratifying the identified deletions and insertions by species, we observed that a
great part of the variants was P. nigra specific. This result was probably due to the
different size of the two compared sets. In addition, a great part of the P. nigra variants
was composed by events detected in only one sample (POLI), for which we had a 4-fold
coverage with respect to all the other accessions. In fact, when comparing variants
identified in only one individual per species, the number of P. nigra and P. deltoides
variants was more comparable. Focusing on deletions, 31% of the identified variants
were shared between the two species. These events are likely insertions of LTR
retrotransposons occurred in P. trichocarpa rather than deletions occurred in both P.
nigra and P. deltoides individuals. 44% of the deletions were identified only in the P.
nigra individual. These variants may be due to a) P. trichocarpa exclusive insertions
(false negative deletions in P. deltoides), b) real P. nigra deletions generated by the
excision of a DNA transposon, or c) insertions occurred in the P. trichocarpa/P.
deltoides ancestor. Deletions due to DNA trasposons (case b) are expected to be a small
proportion. Simulations showed that the algorithm for the detection of deletions resulted
in a high number of false negatives. So, a substantial proportion of the deletions that we
classify as P. nigra specific might be present also in P. deltoides but were not detected
(case a). 25% of the deletions were detected only in the P. deltoides sample. In this
case, variants can be explained as a) P. trichocarpa exclusive insertions (implying a
missed detection in P. nigra) or b) real P. deltoides deletions. The difference between
the proportion of species-specific deletions observed in P. nigra (44%) and in P.
deltoides (25%) might be due to insertions that occurred in the P. trichocarpa/P.
deltoides ancestor (case c).

Tesi di dottorato di Sara Pinosio discussa presso l’Università degli Studi di Udine
91
Only ~3% of the insertions were shared between P. nigra and P. deltoides. These
variants are likely deletions occurred in P. trichocarpa, resulting from the activity of
class II transposable elements. Therefore, the percentage of shared deletions between
the two species was considerably higher than the percentage of shared insertions and
this is consistent with the observation that most of the SVs are originated by
retrotransposon activity. 52% and 45% of insertions were identified only in the P. nigra
or in the P. deltoides individual, respectively. The higher rate of P. nigra specific
insertions is in agreement with the estimated phylogeny.
Focusing on the intraspecific distribution of the identified variants, we found a higher
proportion of deletions (76%) detected in at least two P. nigra individuals with respect
to insertions (27%). Therefore, many insertions are intraspecific polymorphisms, while
most of deletions are interspecific polymorphisms. This was confirmed by PCR
validation experiments in which we obtained that the majority of the deletions are
homozygous, while heterozygous and homozygous insertions were evenly distributed.
All these evidences are consistent with the hypothesis that a large part of the variants
detected as deletions in P. nigra and/or P. deltoides are actually retrotransposons
insertions in P. trichocarpa.
The gene content analysis of the deleted sequenced confirmed that a great part of the
deletions resulted from the activity of transposable elements and suggested that
insertions have preferentially occurred in regions rich in transposable elements.
According to Fisher test, we didn’t notice any particular enrichment in GO terms for the
selected genes. This suggests that genes encoding for TE proteins are largely distributed
across the whole genome.
Focusing only on variants detected in the four parentals of the pedigree, we observed
that 77% of the deletions and 37% of the insertions identified in at least one of the four
parents, were identified also in at least one of the F1 hybrids. One reason explaining the
missed variations in hybrids may be the lower physical coverage obtained with respect
to the parental accessions. In addition, a substantial proportion of these variants is
expected to be heterozygous in hybrids, and for this reason the paired-end mapping
signature is expected to be found only in half of the sequenced reads. The difference
between the proportion of deletions and insertions identified in hybrids may have two
main causes: 1) Compared to 20-30% of deletions, only 2-3% of insertions are shared
between the two species, and inherited (most likely in homozygous state) by F1
hybrids. 2) The majority of the parental deletions are homozygous, while heterozygous
Tesi di dottorato di Sara Pinosio discussa presso l’Università degli Studi di Udine
92
and homozygous insertions were evenly distributed. As a consequence a greater
proportion of deletions are inherited by F1 compared to insertions.
Focusing on genes involved in the lignin biosynthesis pathway, we identified 3
insertions that are occurred in one of these genes, with a possible effect on their
transcription. In particular, two of them encoded for a cinnamoyl-CoA reductase and
one encoded for a 4-coumarate-CoA ligase. However, there is no experimentally proof
of active involvement of these genes in the biosynthesis of lignin. In a recent study
aimed at quantifying the expression and the regulation of all the genes involved in the
monolignol biosynthesis (Shi et al., 2010), two of them (POPTR_0001s14910 and
POPTR_0009s06280) were not even considered, while for the other
(POPTR_0002s01420) no proof of transcription in differentiating xylem was reported.
In summary, we performed a genome-wide comparative analysis of two closely related
Populus species and we provided a detailed catalogue of structural variants across the
whole genome. We confirmed that structural variants contribute to a substantial amount
of the overall genetic variation in poplar. The detected deletions and insertions cover
the 10% of the whole poplar reference genome. We found that a great proportion of this
variability was driven by the activity of class I LTR retroelements. Our results are in
agreement with a previous analysis of sequence variation among the three species in
Sanger sequences of three BAC clones (G. Zaina and M. Morgante, unpublished). Both
analyses showed limited levels of variation in transcribed regions, while intergenic
regions harbor much more variation. In addition, in both cases most of the structural
variation was explained by TEs not shared by the species. Future functional studies of
the detected variants could be of help in understanding the mechanisms of speciation in
poplar as well as the role of artificial and natural selection in these genomes.
Understanding the role of inter- and intraspecific structural variants in poplar may have
important implications for yield improvement and plant breeding.

Tesi di dottorato di Sara Pinosio discussa presso l’Università degli Studi di Udine
93
Tesi di dottorato di Sara Pinosio discussa presso l’Università degli Studi di Udine
94
5
Copy Number Variation in Poplar
5.1 Materials and Methods
The experimental samples are the same used in Chapter 3 (section 4.1.1). DNA
extraction, library preparation, and next-generation sequencing procedures are
described in section 4.1.2 while short read alignment is described in section 4.1.3.
5.1.1 Depth of coverage analysis
Depth of coverage analysis was performed using only paired reads that mapped
uniquely in the genome with correct orientation and spacing of the two ends. For each
sample, duplicated sequences were removed with the samtools rmdup utility (Li et al.,
2009) to eliminate local peaks of coverage that could alter the analysis. Ideally, the
depth of coverage analysis would involve a comparison in terms of coverage across the
whole genome between a resequenced and a reference individual in order to identify
regions that are more or less represented in the resequenced individual compared to the
reference. Such a design provides the greatest power to describe deletions and
duplications in any individual in comparison to the reference individual that was used to
construct the reference sequence. Different resequenced individuals can then be a
posteriori compared to one another once their structure in relation to the reference has
been established. In the present work, the lack of a P. trichocarpa resequenced
individual obliged us to perform the comparison between all the possible pairs of the P.
nigra and P. deltoides resequenced individuals. To identify regions of copy number
variation between the resequenced individuals it was necessary to compare the coverage
present in these individuals across the whole genome. The comparison was performed
Tesi di dottorato di Sara Pinosio discussa presso l’Università degli Studi di Udine
95
after dividing the whole genome into non-overlapping windows of unequal length,
containing a constant number of mapped reads in one of the two resequenced
individuals. The partition into windows is affected by the sample used to count the
number of mapped reads. Preliminary analysis showed that regions deleted (or showing
low coverage) in one individual are better detected if the partition is performed
counting the number of mapped reads of the other individual. For this reason, for each
pair of samples (e.g. sample a and sample b), the coverage comparison was performed
twice, once defining windows using mapped reads of sample a and once using those of
sample b. With the aim of identifying regions of variation at least 50 Kb long, windows
with a mean size of ~5 Kb were obtained by requiring a specific number of mapped
reads for each accession that varied depending on the read coverage obtained in each
individual. For each window, the ratio in log2-scale between the number of mapped
reads in sample a and the number of mapped reads in sample b was calculated. Log2
ratios were normalized on the basis of the total number of paired reads mapped in each
sequenced sample. Log2 ratios formed the raw input to the binary circular segmentation
algorithm implemented in R as the DNAcopy library of the Bioconductor project. This
algorithm identifies change-points in copy number between the two samples under
consideration by an iterative binary segmentation (Olshen et al., 2004). Regions of the
genome larger than 50 kb having a log2ratio between sample a and sample b higher
than a threshold t were selected as candidate CNVs.
To determine the optimal log2ratio threshold t, uniquely mapped paired reads from
sample BEN were randomly divided in two equal-size subsets. Both subsets were used
to divide the genome into windows having a mean size of 5 kb, by requiring 350
mapped reads per window. For each window of both partitions, coverage log2 ratios
between the two subsamples were calculated. To minimize the false discovery rate, the
log2 ratio threshold t was selected so that t was substantially higher than the log2 ratio
obtained between the two subsamples in ~99% of the windows.
The threshold t was used to select from DNAcopy segmentation results all the regions
larger than 50 Kb having a log2ratio >t between the two individuals under evaluation.
For each comparison a/b and b/a, where the subject at the numerator was used to define
windows, only positive values were used and the combination of positive results from
the two reciprocal comparisons provided the whole set of CNVs among that pair of
genotypes.

Tesi di dottorato di Sara Pinosio discussa presso l’Università degli Studi di Udine
96
5.1.2 Gene content analysis
The P. trichocarpa v2.2 gene annotation (Tuskan et al., 2006) was used to analyze the
gene content of the identified CNVs and to select disease resistance genes. For a more
detailed annotation, the sequences of the genes included in these regions were used as a
query for a blastx analysis against the Viridiplantae nr database. Blastx results were
imported into the Blast2GO tool for the functional annotation. Over- or under-
representation of GO terms of the selected regions, as compared with the rest of the
genome, were searched using a Fisher’s Exact Test implemented in the Gossip
(Blüthgen et al., 2005) package integrated in Blast2GO. To reduce the number of false
positives, a false discovery rate correction for multiple testing (Benjamini and
Hochberg, 2007) was applied and only differences with a corrected p-value <0.05 were
selected.
5.2 Results
5.2.1 Depth of coverage analysis
We assessed whether copy number changes between the P. nigra and P. deltoides
individuals could be identified from the depth of coverage signature resulting from
next-generation sequencing data. The number of paired reads retained after removal of
duplicated reads for each sample is reported in Table 5.1, together with the number of
mapped pairs of reads required to obtain windows of approximately 5000bp.
Coverage log2 ratios were used as the input for a circular binary segmentation
algorithm, developed for SNP array data, to generate statistical predictions of copy
number changes between the two individuals under comparison. To study the intrinsic
variability of this analysis and to choose the log2 ratio threshold for the selection of
copy number changes, we calculated the log2 ratios between two subsamples of the
same individual. The distribution of log2 ratios in each window between the two
subsamples had a mean of 0.015 and a standard deviation of 0.29 (Figure 5. 1). To
minimize the false discovery rate we selected a log2 ratio threshold t of 0.9. Only
0.16% of the individual windows obtained in the two subsamples had a log2 ratio > t.
Since a minimum of 2 windows are requested by DNAcopy to define a CNV, this has to
be considered as an upper threshold for the false discovery rate in our process. The

Tesi di dottorato di Sara Pinosio discussa presso l’Università degli Studi di Udine
97
requirement we set of for at least 50 kb (i.e. on average 10 windows) large segments to
be above the threshold makes this even more true.
Figure 5. 1 Coverage log2 ratio distribution of each window obtained by comparing two subsamples of the accession BEN3.
Table 5. 1 Summary of the genome fragmentation in windows obtained for each of the six P. nigra (N) or P. deltoides (D) individuals and number of the identified CNVs per individual with the corresponding total number of Megabases.
Sample Species N° paired reads Reads per
window
N°
windows
Mean window
length (bp)
POLI N 201246501 2500 82002 4915
BEN3 N 51374873 700 74829 5386
BDG N 15835588 200 80298 5019
71077-308 N 52288417 700 76217 5288
L150-089 D 51816841 700 75551 5334
L155-079 D 57674034 700 83954 4800
We defined a CNV as a genomic region in which the log2 ratio between two individuals
was ≥ t. The number of CNVs and the corresponding total number of Megabases
identified in each comparison is reported in Table 5. 2. We stratified CNVs by species
(Figure 5. 2 A). 232 CNVs, corresponding to ~34 Mb, had a coverage log2 ratio
significantly higher in at least one P. nigra individual with respect to at least one P.
deltoides individual (red) and 177 CNVs (~28 Mb) had the opposite signal (blue); 3
CNVs showed a contrasting evidence and occurred in both directions. 176 CNVs (~22
Mb) were detected by comparing individuals of the same species (yellow); as expected,
the majority of these CNVs were observed in P. nigra comparisons, for which we had
more individuals to compare. The coverage log2 ratio distribution obtained for the
CNVs detected comparing individuals of different species in the two directions (P.

Tesi di dottorato di Sara Pinosio discussa presso l’Università degli Studi di Udine
98
nigra/P. deltoides and P. deltoides/P. nigra) was very similar, ranging from 1 to 6 and
with a mean of ~2. In CNVs detected comparing individuals of the same species, the
distribution of log2 ratios was quite different: the mean was 1.4 and the majority of log2
ratio values were lower than 2 (Figure 5. 2 B).
Table 5. 2 Number and Megabases of CNVs identified in all comparisons.
Total number of Mb
POLI
(P. nigra)
BEN3 (P. nigra)
BDG (P. nigra)
71077-308 (P. nigra)
L150-089 (P. deltoides)
L155-079 (P. deltoides)
POLI (P. nigra)
5.88 3.70 2.09 10.67 10.09
BEN3 (P. nigra)
49
4.65 5.61 13.46 15.04
BDG (P. nigra)
29 35
3.22 15.35 14.32
71077-308 (P. nigra)
20 38 29
11.05 11.03
L150-089 (P. deltoides)
71 87 93 69
3.14 N°
ide
nti
fie
d C
NV
s
L155-079 (P. deltoides)
77 94 94 77 29
Figure 5. 2 Summary statistics of the identified copy number variants stratified by species. Red: CNV detected by comparing the coverage of P. nigra individuals over the coverage of P. deltoides ones. Blue: CNV detected by comparing the coverage of P. deltoides individuals over the coverage of P. nigra ones. Yellow: CNV detected by comparing the coverage of individuals of the same species. (A) Venn diagram summarizing the number of CNVs with the total number of Megabases involved. (B) Boxplot representing the distribution of the coverage log2 ratios.
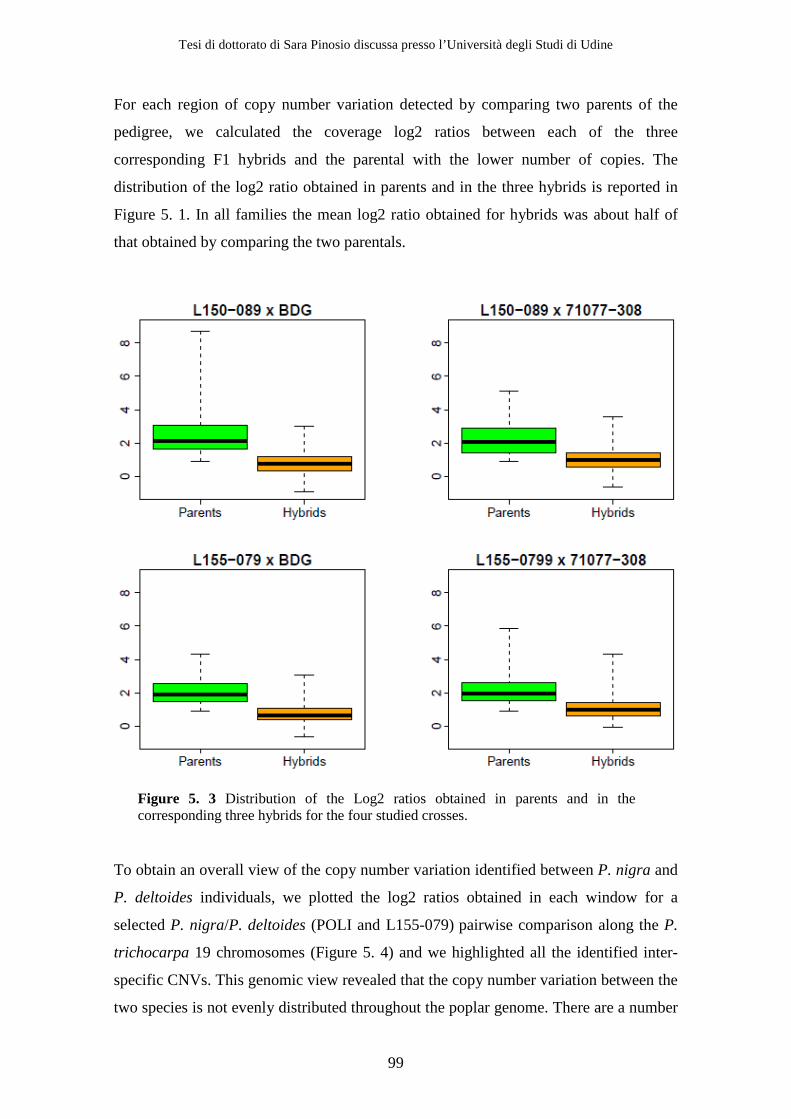
Tesi di dottorato di Sara Pinosio discussa presso l’Università degli Studi di Udine
99
For each region of copy number variation detected by comparing two parents of the
pedigree, we calculated the coverage log2 ratios between each of the three
corresponding F1 hybrids and the parental with the lower number of copies. The
distribution of the log2 ratio obtained in parents and in the three hybrids is reported in
Figure 5. 1. In all families the mean log2 ratio obtained for hybrids was about half of
that obtained by comparing the two parentals.
Figure 5. 3 Distribution of the Log2 ratios obtained in parents and in the corresponding three hybrids for the four studied crosses.
To obtain an overall view of the copy number variation identified between P. nigra and
P. deltoides individuals, we plotted the log2 ratios obtained in each window for a
selected P. nigra/P. deltoides (POLI and L155-079) pairwise comparison along the P.
trichocarpa 19 chromosomes (Figure 5. 4) and we highlighted all the identified inter-
specific CNVs. This genomic view revealed that the copy number variation between the
two species is not evenly distributed throughout the poplar genome. There are a number

Tesi di dottorato di Sara Pinosio discussa presso l’Università degli Studi di Udine
100
of highly conserved genomic regions showing very little or no copy number variation
between P. nigra and P. deltoides individuals.
Figure 5. 4 Genomic distribution of log2 POLI/L155-079 signals (red) and -log2 L155-079/POLI signals (blue) for each chromosome. Black lines highlight all the identified inter-specific CNVs.

Tesi di dottorato di Sara Pinosio discussa presso l’Università degli Studi di Udine
101
In the whole chromosome 2 we identified only few small regions of copy number
variation. In chromosome 9, with the exception of the first 1.5 Mbs, there was no
evidence of copy number variation between the two species. In addition, the proximal
half of chromosome 8 and the distal half of chromosome 10 resulted conserved in
terms of copy number between the P. nigra and P. deltoides individuals.
We identified a ~0.8 Mb CNV on chromosome 14 (positions 14585845-15349532). In
this region there is a strong positive signal of the coverage log2 ratio between all the P.
nigra over the two P. deltoides individuals. A closer inspection of this genomic region
with a Genome Browser (Figure 5. 5) confirmed a strong difference in terms of
sequence coverage between P. nigra and P. deltoides individuals, more marked in the
central 0.5 Mb region. This region contains 34 annotated genes, 18 of them coding for a
O-Glycosyl hydrolases family 17 protein.
Figure 5. 5 Genome browser visualization of a 800 kb region on chromosome 14 that is present with more copies in P. nigra with respect to P. deltoides. The sequence coverage of a P. nigra (red) and a P. deltoides individual (blue) and the gene distribution along this region are reported.
Another interesting region with an opposite signal was identified on chromosome 3
(positions 1789806-2391690). In this case P. deltoides individuals had a significantly

Tesi di dottorato di Sara Pinosio discussa presso l’Università degli Studi di Udine
102
higher coverage with respect to P. nigra individuals (Figure 5. 6). Also in this region
there are many genes and a large part of them encodes for a Leucine-Rich Repeat
(LLR) protein belonging to the NBS-LRR disease resistance protein family.
Figure 5. 6 Genome browser visualization of a 600 kb region on chromosome 3 that is present with more copies in P. deltoides with respect to P. nigra individuals.
5.2.2 Gene content analysis
The regions of copy number variation contained a total of 2661 predicted genes, with a
density of about one gene every 20 kb. Considering that the gene density estimated for
the whole P. trichocarpa reference genome is of about one gene every 10 kb, genomic
regions involved in CNVs are depleted of genes compared to the rest of genome. This
was visually confirmed by comparing the CNV and gene density distribution in the
whole genome (Figure 5. 7). Regions with low gene density are rich in CNVs, while in
regions with high gene density the number of identified CNV is limited. For example,
in chromosome 8, 9 10 and 14 there are extended regions with a high gene density and a
low rate of repetitiveness in which only very few or no CNVs were detected. On the
other hand, CNVs seemed to be preferentially located in repetitive regions of the
genome in which the gene density is low (Figure 5. 7).
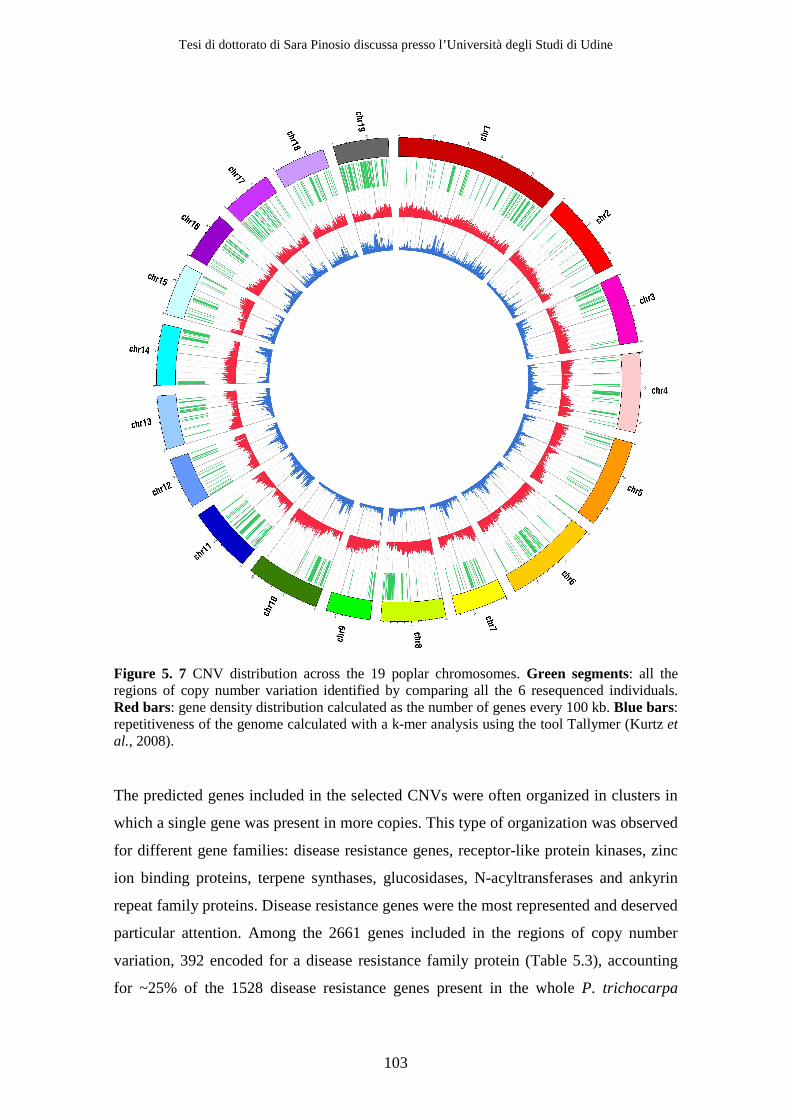
Tesi di dottorato di Sara Pinosio discussa presso l’Università degli Studi di Udine
103
Figure 5. 7 CNV distribution across the 19 poplar chromosomes. Green segments: all the regions of copy number variation identified by comparing all the 6 resequenced individuals. Red bars: gene density distribution calculated as the number of genes every 100 kb. Blue bars: repetitiveness of the genome calculated with a k-mer analysis using the tool Tallymer (Kurtz et al., 2008).
The predicted genes included in the selected CNVs were often organized in clusters in
which a single gene was present in more copies. This type of organization was observed
for different gene families: disease resistance genes, receptor-like protein kinases, zinc
ion binding proteins, terpene synthases, glucosidases, N-acyltransferases and ankyrin
repeat family proteins. Disease resistance genes were the most represented and deserved
particular attention. Among the 2661 genes included in the regions of copy number
variation, 392 encoded for a disease resistance family protein (Table 5.3), accounting
for ~25% of the 1528 disease resistance genes present in the whole P. trichocarpa
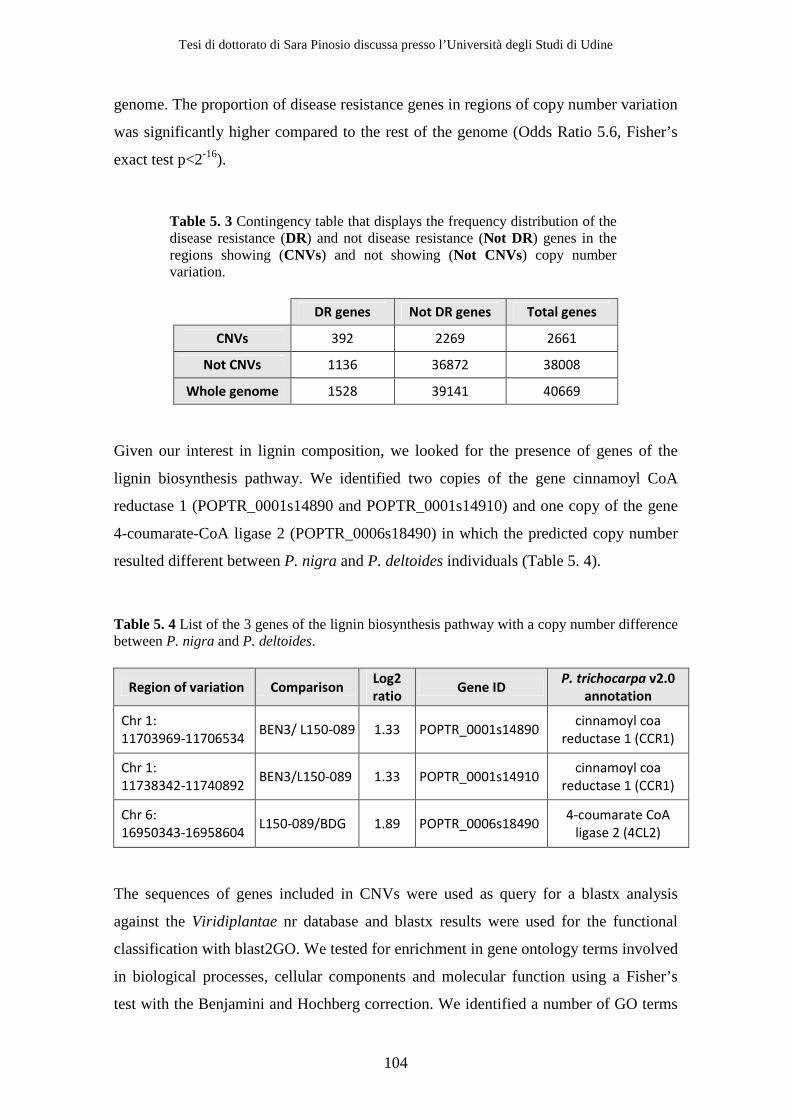
Tesi di dottorato di Sara Pinosio discussa presso l’Università degli Studi di Udine
104
genome. The proportion of disease resistance genes in regions of copy number variation
was significantly higher compared to the rest of the genome (Odds Ratio 5.6, Fisher’s
exact test p<2-16).
Table 5. 3 Contingency table that displays the frequency distribution of the disease resistance (DR) and not disease resistance (Not DR) genes in the regions showing (CNVs) and not showing (Not CNVs) copy number variation.
DR genes Not DR genes Total genes
CNVs 392 2269 2661
Not CNVs 1136 36872 38008
Whole genome 1528 39141 40669
Given our interest in lignin composition, we looked for the presence of genes of the
lignin biosynthesis pathway. We identified two copies of the gene cinnamoyl CoA
reductase 1 (POPTR_0001s14890 and POPTR_0001s14910) and one copy of the gene
4-coumarate-CoA ligase 2 (POPTR_0006s18490) in which the predicted copy number
resulted different between P. nigra and P. deltoides individuals (Table 5. 4).
Table 5. 4 List of the 3 genes of the lignin biosynthesis pathway with a copy number difference between P. nigra and P. deltoides.
Region of variation Comparison Log2
ratio Gene ID
P. trichocarpa v2.0
annotation
Chr 1:
11703969-11706534 BEN3/ L150-089 1.33 POPTR_0001s14890
cinnamoyl coa
reductase 1 (CCR1)
Chr 1:
11738342-11740892 BEN3/L150-089 1.33 POPTR_0001s14910
cinnamoyl coa
reductase 1 (CCR1)
Chr 6:
16950343-16958604 L150-089/BDG 1.89 POPTR_0006s18490
4-coumarate CoA
ligase 2 (4CL2)
The sequences of genes included in CNVs were used as query for a blastx analysis
against the Viridiplantae nr database and blastx results were used for the functional
classification with blast2GO. We tested for enrichment in gene ontology terms involved
in biological processes, cellular components and molecular function using a Fisher’s
test with the Benjamini and Hochberg correction. We identified a number of GO terms

Tesi di dottorato di Sara Pinosio discussa presso l’Università degli Studi di Udine
105
that were over-represented (P<0.05) in the regions of copy number variation, as
compared with the complete genome (Table 5. 5).
Table 5. 5 Over-represented gene ontology (GO) categories for genes in the regions of copy number variation compared with the complete P. trichocarpa genome. GO terms belonging to the same process (P) or function (F) are marked with the same color.
GO-ID GO term GO
Category P-Value #Test #Ref
GO:0006952 defense response P 3.25E-016 46 122
GO:0012501 programmed cell death P 5.75E-012 28 55
GO:0045087 innate immune response P 5.75E-012 23 32
GO:0002376 immune system process P 5.75E-012 23 33
GO:0006955 immune response P 5.75E-012 23 33
GO:0004872 receptor activity F 5.75E-012 74 419
GO:0006915 apoptosis P 6.64E-012 27 53
GO:0008219 cell death P 6.64E-012 28 59
GO:0016265 death P 6.64E-012 28 59
GO:0004888 transmembrane receptor
activity F 8.24E-011 32 92
GO:0003824 catalytic activity F 4.17E-009 674 9518
GO:0016301 kinase activity F 1.50E-008 186 1893
GO:0004672 protein kinase activity F 3.73E-008 153 1480
GO:0042973 glucan endo-1,3-beta-D-
glucosidase activity F 3.73E-008 21 49
GO:0016772 transferase activity, transferring
phosphorus-containing groups F 1.25E-007 194 2062
GO:0060089 molecular transducer activity F 1.41E-007 85 668
GO:0004871 signal transducer activity F 1.41E-007 85 668
GO:0016773 phosphotransferase activity,
alcohol group as acceptor F 1.90E-007 160 1616
GO:0008422 beta-glucosidase activity F 4.11E-006 21 69
GO:0006950 response to stress P 4.59E-006 61 450
GO:0000989 transcription factor binding
transcription factor activity F 1.09E-005 11 15
GO:0003712 transcription cofactor activity F 1.09E-005 11 15
GO:0015926 glucosidase activity F 1.80E-005 22 85
GO:0000988 protein binding transcription
factor activity F 1.73E-004 11 22
GO:0004097 catechol oxidase activity F 1.67 E-003 5 2
GO:0016740 transferase activity F 2.48 E-003 289 3849
GO:0009986 cell surface C 3.10 E-003 6 6
Over-represented genes under the biological processes category were mostly related to
response to stimulus and were primarily involved in stress and defense (GO:0006952,
GO:0045087, GO:0002376). GO terms related to cell death were also largely over-
represented in the regions of copy number variation (GO:0012501, GO:0006915,
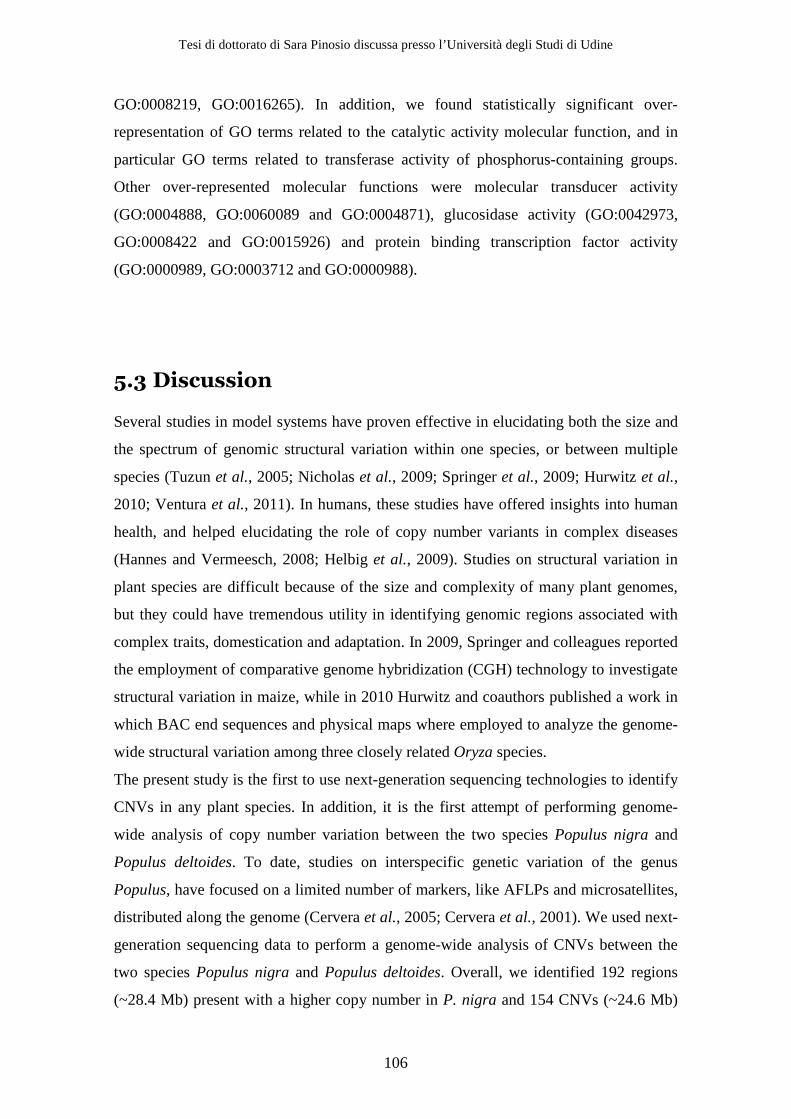
Tesi di dottorato di Sara Pinosio discussa presso l’Università degli Studi di Udine
106
GO:0008219, GO:0016265). In addition, we found statistically significant over-
representation of GO terms related to the catalytic activity molecular function, and in
particular GO terms related to transferase activity of phosphorus-containing groups.
Other over-represented molecular functions were molecular transducer activity
(GO:0004888, GO:0060089 and GO:0004871), glucosidase activity (GO:0042973,
GO:0008422 and GO:0015926) and protein binding transcription factor activity
(GO:0000989, GO:0003712 and GO:0000988).
5.3 Discussion
Several studies in model systems have proven effective in elucidating both the size and
the spectrum of genomic structural variation within one species, or between multiple
species (Tuzun et al., 2005; Nicholas et al., 2009; Springer et al., 2009; Hurwitz et al.,
2010; Ventura et al., 2011). In humans, these studies have offered insights into human
health, and helped elucidating the role of copy number variants in complex diseases
(Hannes and Vermeesch, 2008; Helbig et al., 2009). Studies on structural variation in
plant species are difficult because of the size and complexity of many plant genomes,
but they could have tremendous utility in identifying genomic regions associated with
complex traits, domestication and adaptation. In 2009, Springer and colleagues reported
the employment of comparative genome hybridization (CGH) technology to investigate
structural variation in maize, while in 2010 Hurwitz and coauthors published a work in
which BAC end sequences and physical maps where employed to analyze the genome-
wide structural variation among three closely related Oryza species.
The present study is the first to use next-generation sequencing technologies to identify
CNVs in any plant species. In addition, it is the first attempt of performing genome-
wide analysis of copy number variation between the two species Populus nigra and
Populus deltoides. To date, studies on interspecific genetic variation of the genus
Populus, have focused on a limited number of markers, like AFLPs and microsatellites,
distributed along the genome (Cervera et al., 2005; Cervera et al., 2001). We used next-
generation sequencing data to perform a genome-wide analysis of CNVs between the
two species Populus nigra and Populus deltoides. Overall, we identified 192 regions
(~28.4 Mb) present with a higher copy number in P. nigra and 154 CNVs (~24.6 Mb)

Tesi di dottorato di Sara Pinosio discussa presso l’Università degli Studi di Udine
107
with the opposite signature. In addition, 117 regions, corresponding to a total of 13.9
Mb, exhibit an intraspecific pattern of copy number variation. On average, we identified
~80 regions of copy number variation, corresponding to ~13 Mb when comparing two
individuals of a different species and ~30 CNV (4 Mb) when comparing individuals of
the same species (Table 5. 2). As expected, CNVs were more frequent between the two
species than within species. In addition, intraspecific CNVs showed a mean log2 ratio
of ~2 (Figure 5. 2), that was sensibly higher than that observed comparing individuals
of the same species. This may suggest that CNVs identified between different species
are more likely to be homozygous than those detected comparing individuals of the
same species. We also identified many extended regions of the genome that showed
little or no variation between the two species. In general, these conserved regions are
rich in genes and poor in repetitive sequences. On the other hand, in CNVs we found a
high level of repetitiveness and diminished gene content, as compared with the rest of
the genome. Transposable elements make up a high proportion of repetitive DNA,
indicating a possible contribution of these elements to the gain and loss of sequence in
the poplar genome. In poplar, the LTR retrotransposons represent the most active class
or transposable elements (see Chapter 4). LTR retroelements have been previously
shown to be major contributors to genome size evolution in rice (Ma and Bennetzen,
2004). Transposable elements may also be important in new gene formation and
genome evolution. For example Helitron-related transposable elements have been
shown to carry pseudogenes in maize and to contribute to the expansion and evolution
of the maize genome (Yang and Bennetzen, 2009).
Our analysis showed that the regions of copy number variation had a lower-than-
average gene content. However, some categories of GO terms, such as those related to
defense against stresses, cell death, transferase activity of phosphorus-containing
groups, molecular transducer activity, glucosidase activity and protein binding
transcription factor activity, were overrepresented compared to the rest of the genome.
Overall, in the regions of copy number variation we identified 2661 predicted genes.
Three of them are genes involved in the lignin biosynthesis pathway: two encoded for a
Cinnamoyl CoA Reductase 1 (CCR1) and the other encoded for a 4-Coumarate CoA
Ligase 2 (4CL2). To date, there is no proof of transcription in differentiating xylem for
these genes (Shi et al., 2010); however an analysis of differential expression between
individuals carrying a different number of copies of these genes will be of help to
investigate a possible effect on lignin biosynthesis.

Tesi di dottorato di Sara Pinosio discussa presso l’Università degli Studi di Udine
108
A large fraction of the genes included in CNVs encodes for disease resistance proteins,
such as the Nucleotide Binding Site-Leucine Rich Repeat (NBS_LRR) gene family.
Fisher’s exact test showed that the regions of copy number variation are significantly
enriched in disease resistance genes with respect to the rest of the genome. In maize,
evidences that disease resistance genes exhibit copy number variation for different
haplotypes have already been reported (Smith et al., 2004). In addition, the over-
representation of disease resistance genes in regions of structural variation between
different species has already been reported for rice (Hurwitz et al., 2010). Evidences of
the high variability of disease resistance genes have been also reported for Arabidopsis
thaliana (Clark et al., 2007). In A. thaliana, tandem duplications and losses have been
found to play the dominant role in affecting copy number of disease resistance genes
(Cannon et al., 2004). We observed that in the regions of copy number variation genes
were often organized in clusters. Tandem duplication processes are considered to be a
major cause for the generation of cluster of duplicated genes and for the expansion of
some genes families. For example, the extant distribution and diversity in Arabidopsis
genome of the NBS-LRR sequences has been generated by extensive duplication and
ectopic rearrangements that involved segmental duplications (Meyers et al., 2003).
Unequal recombination occurring when interspersed repetitive elements promote non-
homologue crossing-over is thought to be the primary mechanism driving the expansion
of gene clusters (Leister, 2004). After the duplication, each paralogue gene may retain
the same function as the ancestral copy or may lose the original function and/or obtain a
new function. Genes that confer a selective advantage are thus maintained by natural
selection. Therefore, the genes that we have found to be over-represented in the CNVs
may reflect recent gene acquisition events occurred in one of the two poplar species and
are candidate markers of interspecific divergence. In plants, interspecific CNVs may
contribute to heterosis (Springer et al., 2009). In this study we identified hundreds
genomic regions showing a different copy number between P. nigra and P. deltoides
accessions. In hybrids these regions will be inherited with a large number of different
combinations, providing the opportunity for novel gene complements and trans-
interactions with respect to the parents.
In summary, with this study we obtained a catalogue of CNVs across the poplar
genome. These regions may be useful tools to explore the mechanisms of speciation in
poplar and understand the molecular basis of heterosis in poplar hybrids.

Tesi di dottorato di Sara Pinosio discussa presso l’Università degli Studi di Udine
109
Tesi di dottorato di Sara Pinosio discussa presso l’Università degli Studi di Udine
110
List of References
Abecasis, G.R., Noguchi, E., Heinzmann, A., et al., (2001) Extent and distribution of linkage disequilibrium in three genomic regions. American journal of human genetics, 68(1), 191-197.
Achaz, G., Coissac, E., Viari, A. and Netter, P., (2000) Analysis of intrachromosomal duplications in yeast Saccharomyces cerevisiae: a possible model for their origin. Molecular biology and evolution, 17(8), 1268-75.
Alkan, C., Coe, B.P. and Eichler, E.E., (2011) Genome structural variation discovery and genotyping. Nature reviews. Genetics.
Altschul, S.F., Gish, W., Miller, W., Myers, E.W. and Lipman, D.J., (1990) Basic local alignment search tool. Journal of molecular biology, 215(3), 403-10.
Barakat, A., Bagniewska-Zadworna, A., Choi, A., Plakkat, U., DiLoreto, D.S., Yellanki, P. and Carlson, J.E., (2009) The cinnamyl alcohol dehydrogenase gene family in Populus: phylogeny, organization, and expression. BMC plant biology, 9, 26.
Baucher, M., Chabbert, B., Pilate, G., et al., (1996) Red Xylem and Higher Lignin Extractability by Down-Regulating a Cinnamyl Alcohol Dehydrogenase in Poplar. Plant physiology, 112(4), 1479-1490.
Benjamini, Y. and Hochberg, Y., (2007) Controlling the False Discovery Rate: A Practical and Powerful Approach to Multiple Testing.
Bennetzen, J L, (2000) Transposable element contributions to plant gene and genome evolution. Plant molecular biology, 42(1), 251-69.
Bentley, D.R., Balasubramanian, S., Swerdlow, H.P., et al., (2008) Accurate whole human genome sequencing using reversible terminator chemistry. Nature, 456(7218), 53-9.
Blüthgen, N., Brand, K., Cajavec, B., Swat, M., Herzel, H. and Beule, D., (2005) Biological profiling of gene groups utilizing Gene Ontology. Genome informatics. International Conference on Genome Informatics, 16(1), 106-15.
Brunner, S., Fengler, K., Morgante, M., Tingey, S. and Rafalski, A., (2005) Evolution of DNA sequence nonhomologies among maize inbreds. The Plant cell, 17(2), 343-60.

Tesi di dottorato di Sara Pinosio discussa presso l’Università degli Studi di Udine
111
Campbell, P.J., Stephens, P.J., Pleasance, E.D., et al., (2008) Identification of somatically acquired rearrangements in cancer using genome-wide massively parallel paired-end sequencing. Nature genetics, 40(6), 722-9.
Cannon, S.B., Mitra, A., Baumgarten, A., Young, N.D. and May, G., (2004) The roles of segmental and tandem gene duplication in the evolution of large gene families in Arabidopsis thaliana. BMC plant biology, 4, 10.
Cervera, M.T., Storme, V, Soto, A., Ivens, B, Montagu, M Van, Rajora, O.P. and Boerjan, W, (2005) Intraspecific and interspecific genetic and phylogenetic relationships in the genus Populus based on AFLP markers. TAG. Theoretical and applied genetics. Theoretische und angewandte Genetik, 111(7), 1440-56.
Cervera, M.T., Storme, Veronique, Ivens, Bart, Gusmao, J., Liu, B.H., Hostyn, V., Slycken, J. Van, Montagu, Marc Van and Boerjan, Wout, (2001) Dense Genetic Linkage Maps of Three Populus Species (Populus deltoides, P. nigra and P. trichocarpa) Based on AFLP and Microsatellite Markers. Genetics, 158(2), 787-809.
Chen, F. and Dixon, R.A., (2007) Lignin modification improves fermentable sugar yields for biofuel production. Nature biotechnology, 25(7), 759-61.
Chen, K., Wallis, J.W., McLellan, M.D., et al., (2009) BreakDancer: an algorithm for high-resolution mapping of genomic structural variation. Nature methods, 6(9), 677-81.
Chou, H.H. and Holmes, M.H., (2001) DNA sequence quality trimming and vector removal. Bioinformatics (Oxford, England), 17(12), 1093-104.
Clark, R.M., Schweikert, G., Toomajian, C., et al., (2007) Common sequence polymorphisms shaping genetic diversity in Arabidopsis thaliana. Science (New York, N.Y.), 317(5836), 338-42.
Comai, L., Young, K., Till, B.J., et al., (2004) Efficient discovery of DNA polymorphisms in natural populations by Ecotilling. Plant J, 37(5), 778-786.
Conesa, A., Götz, S., García-Gómez, J.M., Terol, J., Talón, M. and Robles, M., (2005) Blast2GO: a universal tool for annotation, visualization and analysis in functional genomics research. Bioinformatics (Oxford, England), 21(18), 3674-6.
Cooper, G.M., Zerr, T., Kidd, J.M., Eichler, E.E. and Nickerson, D.A., (2008) Systematic assessment of copy number variant detection via genome-wide SNP genotyping. Nature genetics, 40(10), 1199-203.
Dixon, R.A., Chen, F., Guo, D. and Parvathi, K., (2001) The biosynthesis of monolignols: a “metabolic grid”, or independent pathways to guaiacyl and syringyl units? Phytochemistry, 57(7), 1069-1084.
Doorsselaere, J. Van, Baucher, M., Feuillet, C., Boudet, A. M., Montagu, M. Van and Inze, D., (1995) Isolation of cinnamyl alcohol dehydrogenase cDNAs from
Tesi di dottorato di Sara Pinosio discussa presso l’Università degli Studi di Udine
112
two important economic species: alfalfa and poplar. Demonstration of a high homology of the gene within angiosperms. Plant physiology and biochemistry, 33(1), 105-109.
Douglas, C., (2011) Genomics of adaptation and wood properties in Populus trichocarpa. BMC Proceedings, 5(Suppl 7), O2.
Druley, T.E., Vallania, F.L.M., Wegner, D.J., et al., (2009) Quantification of rare allelic variants from pooled genomic DNA. Nature Methods, 6(April 2009), 263-265.
EREC, (2008) Renewable Energy Technology Roadmap 20% by 2020. European Renewable Energy Council.
Eichler, E.E. and Sankoff, D., (2003) Structural dynamics of eukaryotic chromosome evolution. Science (New York, N.Y.), 301(5634), 793-7.
Ewing, B. and Green, P., (1998) Base-calling of automated sequencer traces using phred. II. Error probabilities. Genome research, 8(3), 186-194.
Ewing, B., Hillier, L., Wendl, M C and Green, P., (1998) Base-calling of automated sequencer traces using phred. I. Accuracy assessment. Genome research, 8(3), 175-185.
Eyre-Walker, A., (2010) Evolution in health and medicine Sackler colloquium: Genetic architecture of a complex trait and its implications for fitness and genome-wide association studies. Proceedings of the National Academy of Sciences of the United States of America, 107 Suppl (suppl_1), 1752-6.
Fay, J.C. and Wu, C.I., (2000) Hitchhiking under positive Darwinian selection. Genetics, 155(3), 1405-13.
Felsenstein, J., (1989) PHYLIP -- Phylogeny Inference Package (Version 3.2). Cladistics, 0(5), 164-166.
Feuk, L., Carson, A.R. and Scherer, S.W., (2006) Structural variation in the human genome. Nature reviews. Genetics, 7(2), 85-97.
Fransz, P.F., Armstrong, S., Jong, J.H. de, Parnell, L.D., Drunen, C. van, Dean, C., Zabel, P., Bisseling, T and Jones, G.H., (2000) Integrated cytogenetic map of chromosome arm 4S of A. thaliana: structural organization of heterochromatic knob and centromere region. Cell, 100(3), 367-76.
Frascaroli, E., Canè, M.A., Landi, P., Pea, G., Gianfranceschi, L., Villa, M., Morgante, M. and Pè, M.E., (2007) Classical genetic and quantitative trait loci analyses of heterosis in a maize hybrid between two elite inbred lines. Genetics, 176(1), 625-44.

Tesi di dottorato di Sara Pinosio discussa presso l’Università degli Studi di Udine
113
Futschik, A. and Schlötterer, C., (2010) Massively Parallel Sequencing of Pooled DNA Samples--The Next Generation of Molecular Markers. Genetics, 186(1), 207-218.
Gilchrist, E.J., Haughn, G.W., Ying, C.C., et al., (2006) Use of Ecotilling as an efficient SNP discovery tool to survey genetic variation in wild populations of Populus trichocarpa. Molecular ecology, 15(5), 1367-78.
Gordon, D., Abajian, C. and Green, P., (1998) Consed: a graphical tool for sequence finishing. Genome research, 8(3), 195-202.
Greenman, C., Stephens, P., Smith, R., et al., (2007) Patterns of somatic mutation in human cancer genomes. Nature, 446(7132), 153-8.
Guex, N. and Peitsch, M.C., (1997) SWISS-MODEL and the Swiss-PdbViewer: an environment for comparative protein modeling. Electrophoresis, 18(15), 2714-23.
Halpin, C., Holt, K., Chojecki, J., Oliver, D., Chabbert, B., Monties, B., Edwards, K., Barakate, A. and Foxon, G.A., (1998) Brown-midrib maize (bm1)--a mutation affecting the cinnamyl alcohol dehydrogenase gene. The Plant journal : for cell and molecular biology, 14(5), 545-53.
Hamberger, B., Ellis, M., Friedmann, M., Azevedo Souza, C. de, Barbazuk, B. and Douglas, C.J., (2007) Genome-wide analyses of phenylpropanoid-related genes in Populus trichocarpa, Arabidopsis thaliana, and Oryza sativa: the Populus lignin toolbox and conservation and diversification of angiosperm gene families. Can J Bot, 85(12), 1182-1201.
Hannes, F. and Vermeesch, J.R., (2008) Benign and pathogenic copy number variation on the short arm of chromosome 4. Cytogenetic and genome research, 123(1-4), 88-93.
Havlík, P., Schneider, U.A., Schmid, E., et al., (2010) Global land-use implications of first and second generation biofuel targets. Energy Policy, In press.
Hedrick, P. and Kumar, S., (2001) Mutation and linkage disequilibrium in human mtDNA. European journal of human genetics : EJHG, 9(12), 969-72.
Helbig, I., Mefford, H.C., Sharp, A.J., et al., (2009) 15q13.3 microdeletions increase risk of idiopathic generalized epilepsy. Nature genetics, 41(2), 160-2.
Heuertz, M., Paoli, E. De, Källman, T., Larsson, H., Jurman, I., Morgante, M., Lascoux, M. and Gyllenstrand, N., (2006) Multilocus patterns of nucleotide diversity, linkage disequilibrium and demographic history of Norway spruce [Picea abies (L.) Karst]. Genetics, 174(4), 2095-105.
Hill, W. and Weir, B.S., (1988) Variances and covariances of squared linkage disequilibria in finite populations. Theoretical population biology, 33(1), 54-78.

Tesi di dottorato di Sara Pinosio discussa presso l’Università degli Studi di Udine
114
Hisano, H., Nandakumar, R. and Wang, Z.-Y., (2009) Genetic modification of lignin biosynthesis for improved biofuel production. In Vitro Cellular & Developmental Biology - Plant, 45(3), 306-313.
Hormozdiari, F., Hajirasouliha, I., Dao, P., Hach, F., Yorukoglu, D., Alkan, C., Eichler, E.E. and Sahinalp, S.C., (2010) Next-generation VariationHunter: combinatorial algorithms for transposon insertion discovery. Bioinformatics (Oxford, England), 26(12), i350-7.
Huang, X. and Madan, A., (1999) CAP3: A DNA sequence assembly program. Genome research, 9(9), 868-77.
Hughes, A.L., Friedman, R., Ekollu, V. and Rose, J.R., (2003) Non-random association of transposable elements with duplicated genomic blocks in Arabidopsis thaliana. Molecular phylogenetics and evolution, 29(3), 410-6.
Hurles, M.E., Dermitzakis, E.T. and Tyler-Smith, C., (2008) The functional impact of structural variation in humans. Trends in genetics : TIG, 24(5), 238-45.
Hurwitz, B.L., Kudrna, D., Yu, Y., Sebastian, A., Zuccolo, A., Jackson, S.A., Ware, D., Wing, R.A. and Stein, L., (2010) Rice structural variation: a comparative analysis of structural variation between rice and three of its closest relatives in the genus Oryza. The Plant journal : for cell and molecular biology, 63(6), 990-1003.
Ingman, M. and Gyllensten, U., (2009) SNP frequency estimation using massively parallel sequencing of pooled DNA. Eur J Hum Genet, 17(3), 383-386.
Ingvarsson, P.K., (2008) Multilocus patterns of nucleotide polymorphism and the demographic history of Populus tremula. Genetics, 180(1), 329-40.
Jaillon, O., Aury, J.-M., Noel, B., et al., (2007) The grapevine genome sequence suggests ancestral hexaploidization in major angiosperm phyla. Nature, 449(7161), 463-7.
Jiang, R., Tavaré, S. and Marjoram, P., (2009) Population genetic inference from resequencing data. Genetics, 181(1), 187-97.
Jung, H.J. and Ni, W., (1998) Lignification of plant cell walls: impact of genetic manipulation. Proceedings of the National Academy of Sciences of the United States of America, 95(22), 12742-12743.
Jurka, J., Kapitonov, V.V., Pavlicek, A., Klonowski, P., Kohany, O. and Walichiewicz, J., (2005) Repbase Update, a database of eukaryotic repetitive elements. Cytogenetic and genome research, 110(1-4), 462-7.
Keller, B., Wicker, T. and Matthews, D.E., (2002) TREP: a database for Triticeae repetitive elements. Trends in plant science, 7(12), 561-562.
Tesi di dottorato di Sara Pinosio discussa presso l’Università degli Studi di Udine
115
Kidwell, M.G. and Lisch, D., (1997) Transposable elements as sources of variation in animals and plants. Proceedings of the National Academy of Sciences of the United States of America, 94(15), 7704-11.
Kircher, M., Stenzel, U. and Kelso, J., (2009) Improved base calling for the Illumina Genome Analyzer using machine learning strategies. Genome biology, 10(8), R83.
Koboldt, D.C., Chen, K., Wylie, T., Larson, D.E., McLellan, M.D., Mardis, E.R., Weinstock, G.M., Wilson, R.K. and Ding, L., (2009) VarScan: variant detection in massively parallel sequencing of individual and pooled samples. Bioinformatics (Oxford, England), 25(17), 2283-2285.
Koboldt, D.C., Ding, L., Mardis, E.R. and Wilson, R.K., (2010) Challenges of sequencing human genomes. Briefings in bioinformatics, 11(5), 484-98.
Korbel, J.O., Abyzov, A., Mu, X.J., Carriero, N., Cayting, P., Zhang, Z., Snyder, M. and Gerstein, M.B., (2009) PEMer: a computational framework with simulation-based error models for inferring genomic structural variants from massive paired-end sequencing data. Genome biology, 10(2), R23.
Korbel, J.O., Urban, A.E., Affourtit, J.P., et al., (2007) Paired-end mapping reveals extensive structural variation in the human genome. Science (New York, N.Y.), 318(5849), 420-6.
Kurtz, S., Narechania, A., Stein, J.C. and Ware, D., (2008) A new method to compute K-mer frequencies and its application to annotate large repetitive plant genomes. BMC genomics, 9, 517.
Lapierre, C., Pollet, B., Petit-Conil, M., et al., (1999) Structural alterations of lignins in transgenic poplars with depressed cinnamyl alcohol dehydrogenase or caffeic acid O-methyltransferase activity have an opposite impact on the efficiency of industrial kraft pulping. Plant physiology, 119(1), 153-64.
Lee, S., Hormozdiari, F., Alkan, C. and Brudno, M., (2009) MoDIL: detecting small indels from clone-end sequencing with mixtures of distributions. Nature methods, 6(7), 473-4.
Leister, D., (2004) Tandem and segmental gene duplication and recombination in the evolution of plant disease resistance gene. Trends in genetics : TIG, 20(3), 116-22.
Levy, S., Sutton, G., Ng, P.C., et al., (2007) The diploid genome sequence of an individual human. PLoS biology, 5(10), e254.
Li, H. and Durbin, R. , (2009) Fast and accurate short read alignment with Burrows-Wheeler transform. Bioinformatics (Oxford, England), 25(14), 1754-60.
Li, H., Handsaker, B., Wysoker, A., Fennell, T., Ruan, J., Homer, N., Marth, G., Abecasis, G. and Durbin, R., (2009) The Sequence Alignment/Map format and SAMtools. Bioinformatics (Oxford, England), 25(16), 2078-9.

Tesi di dottorato di Sara Pinosio discussa presso l’Università degli Studi di Udine
116
Li, L., Zhou, Y., Cheng, X., Sun, J., Marita, J.M., Ralph, J. and Chiang, V.L., (2003) Combinatorial modification of multiple lignin traits in trees through multigene cotransformation. Proceedings of the National Academy of Sciences of the United States of America, 100(8), 4939-44.
Li, X., Weng, J.-K. and Chapple, C., (2008) Improvement of biomass through lignin modification. Plant J, 54(4), 569-581.
Librado, P. and Rozas, J., (2009) DnaSP v5: a software for comprehensive analysis of DNA polymorphism data. Bioinformatics (Oxford, England), 25(11), 1451-2.
Lohse, K. and Kelleher, J., (2009) Measuring the degree of starshape in genealogies--summary statistics and demographic inference. Genetics research, 91(4), 281-92.
Lomsadze, A., Ter-Hovhannisyan, V., Chernoff, Y.O. and Borodovsky, M., (2005) Gene identification in novel eukaryotic genomes by self-training algorithm. Nucleic acids research, 33(20), 6494-506.
Lynch, M. and Conery, J.S., (2003) The evolutionary demography of duplicate genes. Journal of structural and functional genomics, 3(1-4), 35-44.
Ma, J. and Bennetzen, Jeffrey L, (2004) Rapid recent growth and divergence of rice nuclear genomes. Proceedings of the National Academy of Sciences of the United States of America, 101(34), 12404-10.
MacKay, J.J., O’Malley, D.M., Presnell, T., Booker, F.L., Campbell, M M, Whetten, R.W. and Sederoff, R.R., (1997) Inheritance, gene expression, and lignin characterization in a mutant pine deficient in cinnamyl alcohol dehydrogenase. Proceedings of the National Academy of Sciences of the United States of America, 94(15), 8255-60.
Manolio, T.A., Collins, F.S., Cox, N.J., et al., (2009) Finding the missing heritability of complex diseases. Nature, 461(7265), 747-53.
Mardis, E.R., (2008) Next-generation DNA sequencing methods. Annual review of genomics and human genetics, 9, 387-402.
Marroni, F., Pinosio, S., Zaina, G., Fogolari, F., Felice, N., Cattonaro, F. and Morgante, M., (2011) Nucleotide diversity and linkage disequilibrium in Populus nigra cinnamyl alcohol dehydrogenase (CAD4) gene. Tree Genetics & Genomes, 7(5), 1011-1023.
Marroni, F., Toni, C., Pennato, B., Tsai, Y.-Y., Duggal, P., Bailey-Wilson, J.E. and Presciuttini, S., (2005) Haplotypic structure of the X chromosome in the COGA population sample and the quality of its reconstruction by extant software packages. BMC genetics, 6 Suppl 1, S77.
McDonald, J.H. and Kreitman, M., (1991) Adaptive protein evolution at the Adh locus in Drosophila. Nature, 351(6328), 652-4.
Tesi di dottorato di Sara Pinosio discussa presso l’Università degli Studi di Udine
117
Medvedev, P., Stanciu, M. and Brudno, M., (2009) Computational methods for discovering structural variation with next-generation sequencing. Nature methods, 6(11 Suppl), S13-20.
Meyers, B.C., Kozik, A., Griego, A., Kuang, H. and Michelmore, R.W., (2003) Genome-wide analysis of NBS-LRR-encoding genes in Arabidopsis. The Plant cell, 15(4), 809-34.
Mueller, J.C., (2004) Linkage disequilibrium for different scales and applications. Briefings in bioinformatics, 5(4), 355-64.
Nachman, M.W., Boyer, S.N. and Aquadro, C.F., (1994) Nonneutral evolution at the mitochondrial NADH dehydrogenase subunit 3 gene in mice. Proceedings of the National Academy of Sciences of the United States of America, 91(14), 6364-8.
Nei, M. and Li, W.H., (1979) Mathematical model for studying genetic variation in terms of restriction endonucleases. Proceedings of the National Academy of Sciences of the United States of America, 76(10), 5269-5273.
Nicholas, T.J., Cheng, Z., Ventura, M., Mealey, K., Eichler, E.E. and Akey, J.M., (2009) The genomic architecture of segmental duplications and associated copy number variants in dogs. Genome research, 19(3), 491-9.
Nickerson, D.A., Tobe, V.O. and Taylor, S.L., (1997) PolyPhred: automating the detection and genotyping of single nucleotide substitutions using fluorescence-based resequencing. Nucleic acids research, 25(14), 2745-2751.
Olshen, A.B., Venkatraman, E.S., Lucito, R. and Wigler, M., (2004) Circular binary segmentation for the analysis of array-based DNA copy number data. Biostatistics (Oxford, England), 5(4), 557-72.
Olson, M.S., Robertson, A.L., Takebayashi, N., Silim, S., Schroeder, W.R. and Tiffin, P. , (2010) Nucleotide diversity and linkage disequilibrium in balsam poplar (Populus balsamifera). The New phytologist, 186(2), 526-36.
Out, A.A., Minderhout, I.J.H.M. van, Goeman, J.J., et al., (2009) Deep sequencing to reveal new variants in pooled DNA samples. Human mutation, 30(12), 1703-1712.
Ouyang, S. and Buell, C.R., (2004) The TIGR Plant Repeat Databases: a collective resource for the identification of repetitive sequences in plants. Nucleic acids research, 32(Database issue), D360-3.
Pinkel, D., Segraves, R., Sudar, D., et al., (1998) High resolution analysis of DNA copy number variation using comparative genomic hybridization to microarrays. Nature genetics, 20(2), 207-11.
Price, A.L., Jones, N.C. and Pevzner, P.A., (2005) De novo identification of repeat families in large genomes. Bioinformatics (Oxford, England), 21 Suppl 1, i351-8.

Tesi di dottorato di Sara Pinosio discussa presso l’Università degli Studi di Udine
118
Ramírez-Soriano, A. and Nielsen, R., (2009) Correcting estimators of theta and Tajima’s D for ascertainment biases caused by the single-nucleotide polymorphism discovery process. Genetics, 181(2), 701-10.
Rand, D.M. and Kann, L.M., (1996) Excess amino acid polymorphism in mitochondrial DNA: contrasts among genes from Drosophila, mice, and humans. Molecular biology and evolution, 13(6), 735-48.
Ray, D.A. and Batzer, M.A., (2011) Reading TE leaves: New approaches to the identification of transposable element insertions. Genome research, 21(6), 813-20.
Remington, D.L., Thornsberry, J.M., Matsuoka, Y., Wilson, L.M., Whitt, S.R., Doebley, J., Kresovich, S., Goodman, M.M. and Buckler, E.S., (2001) Structure of linkage disequilibrium and phenotypic associations in the maize genome. Proceedings of the National Academy of Sciences of the United States of America, 98(20), 11479-84.
Rinaldi, C., Kohler, A., Frey, P., et al., (2007) Transcript profiling of poplar leaves upon infection with compatible and incompatible strains of the foliar rust Melampsora larici-populina. Plant physiology, 144(1), 347-66.
Risch, N. and Merikangas, K., (1996) The future of genetic studies of complex human diseases. Science (New York, N.Y.), 273(5281), 1516-7.
Rogers, L.A. and Campbell, Malcolm M., (2004) The genetic control of lignin deposition during plant growth and development. New Phytologist, 164(1), 17-30.
Rohde, A., Storme, Véronique, Jorge, V., et al., (2010) Bud set in poplar - genetic dissection of a complex trait in natural and hybrid populations. New Phytologist, 189(1), 106-121.
Sarni, F., Grand, C. and Boudet, A M, (1984) Purification and properties of cinnamoyl-CoA reductase and cinnamyl alcohol dehydrogenase from poplar stems (Populus X euramericana). European journal of biochemistry / FEBS, 139(2), 259-65.
Sattler, S.E., Saathoff, A.J., Haas, E.J., Palmer, N.A., Funnell-Harris, D.L., Sarath, G. and Pedersen, J.F., (2009) A nonsense mutation in a cinnamyl alcohol dehydrogenase gene is responsible for the Sorghum brown midrib6 phenotype. Plant physiology, 150(2), 584-95.
Sebat, J., Lakshmi, B., Troge, J., et al., (2004) Large-scale copy number polymorphism in the human genome. Science (New York, N.Y.), 305(5683), 525-8.
Sham, P., Bader, J.S., Craig, I., O Donovan, M. and Owen, M., (2002) DNA Pooling: a tool for large-scale association studies. Nature reviews. Genetics, 3(11), 862-871.
Shendure, J. and Ji, H., (2008) Next-generation DNA sequencing. Nature biotechnology, 26(10), 1135-45.

Tesi di dottorato di Sara Pinosio discussa presso l’Università degli Studi di Udine
119
Shi, R., Sun, Y.-H., Li, Q., Heber, S., Sederoff, R. and Chiang, V.L., (2010) Towards a systems approach for lignin biosynthesis in Populus trichocarpa: transcript abundance and specificity of the monolignol biosynthetic genes. Plant & cell physiology, 51(1), 144-163.
Sjödin, A., Bylesjö, M., Skogström, O., Eriksson, D., Nilsson, P., Rydén, P., Jansson, Stefan and Karlsson, J., (2006) UPSC-BASE--Populus transcriptomics online. The Plant journal : for cell and molecular biology, 48(5), 806-17.
Smith, S.M., Pryor, A.J. and Hulbert, S.H., (2004) Allelic and haplotypic diversity at the rp1 rust resistance locus of maize. Genetics, 167(4), 1939-47.
Smulders, M.J.M., Cottrell, J.E., Lefèvre, F., et al., (2008) Structure of the genetic diversity in black poplar (Populus nigra L.) populations across European river systems: Consequences for conservation and restoration. Forest Ecology and Management, 255(5-6), 1388-1399.
Springer, N.M. and Stupar, R.M., (2007) Allelic variation and heterosis in maize: how do two halves make more than a whole? Genome research, 17(3), 264-75.
Springer, N.M., Ying, K., Fu, Y., et al., (2009) Maize inbreds exhibit high levels of copy number variation (CNV) and presence/absence variation (PAV) in genome content. PLoS genetics, 5(11), e1000734.
Stephens, M., Sloan, J.S., Robertson, P.D., Scheet, P. and Nickerson, D.A., (2006) Automating sequence-based detection and genotyping of SNPs from diploid samples. Nature genetics, 38(3), 375-81.
Stephens, M., Smith, N.J. and Donnelly, P., (2001) A new statistical method for haplotype reconstruction from population data. American journal of human genetics, 68(4), 978-89.
Stupar, R.M. and Springer, N.M., (2006) Cis-transcriptional variation in maize inbred lines B73 and Mo17 leads to additive expression patterns in the F1 hybrid. Genetics, 173(4), 2199-210.
Sudmant, P.H., Kitzman, J.O., Antonacci, F., et al., (2010) Diversity of human copy number variation and multicopy genes. Science (New York, N.Y.), 330(6004), 641-6.
Tajima, F., (1989) Statistical method for testing the neutral mutation hypothesis by DNA polymorphism. Genetics, 123(3), 585-595.
Terwilliger, J.D. and Hiekkalinna, T., (2006) An utter refutation of the “fundamental theorem of the HapMap”. European journal of human genetics : EJHG, 14(4), 426-37.
Tuskan, G.A., Difazio, S., Jansson, S, et al., (2006) The genome of black cottonwood, Populus trichocarpa (Torr. & Gray). Science (New York, N.Y.), 313(5793), 1596-604.
Tesi di dottorato di Sara Pinosio discussa presso l’Università degli Studi di Udine
120
Tuzun, E., Sharp, A.J., Bailey, J.A., et al., (2005) Fine-scale structural variation of the human genome. Nature genetics, 37(7), 727-32.
Untergasser, A., Nijveen, H., Rao, X., Bisseling, Ton, Geurts, R. and Leunissen, J.A.M., (2007) Primer3Plus, an enhanced web interface to Primer3. Nucleic acids research, 35(Web Server issue), W71-74.
VanLiere, J.M. and Rosenberg, N.A., (2008) Mathematical properties of the r2 measure of linkage disequilibrium. Theoretical population biology, 74(1), 130-7.
Vanholme, R., Morreel, K., Ralph, J. and Boerjan, Wout, (2008) Lignin engineering. Current opinion in plant biology, 11(3), 278-285.
Ventura, M., Catacchio, C.R., Alkan, C., et al., (2011) Gorilla genome structural variation reveals evolutionary parallelisms with chimpanzee. Genome research, 21(10), 1640-9.
Volik, S., Zhao, S., Chin, K., et al., (2003) End-sequence profiling: sequence-based analysis of aberrant genomes. Proceedings of the National Academy of Sciences of the United States of America, 100(13), 7696-701.
Walter, M.H., Grima-Pettenati, J., Grand, C., Boudet, A M and Lamb, C.J., (1988) Cinnamyl-alcohol dehydrogenase, a molecular marker specific for lignin synthesis: cDNA cloning and mRNA induction by fungal elicitor. Proceedings of the National Academy of Sciences of the United States of America, 85(15), 5546-50.
Weigel, D. and Mott, R., (2009) The 1001 genomes project for Arabidopsis thaliana. Genome biology, 10(5), 107.
Weng, J.-K. and Chapple, C., (2010) The origin and evolution of lignin biosynthesis. The New phytologist, 187(2), 273-85.
Weng, J.-K., Li, X., Bonawitz, N.D. and Chapple, C., (2008) Emerging strategies of lignin engineering and degradation for cellulosic biofuel production. Current opinion in biotechnology, 19(2), 166-72.
Yang, L. and Bennetzen, Jeffrey L, (2009) Distribution, diversity, evolution, and survival of Helitrons in the maize genome. Proceedings of the National Academy of Sciences of the United States of America, 106(47), 19922-7.
Yoon, S., Xuan, Z., Makarov, V., Ye, K. and Sebat, J., (2009) Sensitive and accurate detection of copy number variants using read depth of coverage. Genome research, 19(9), 1586-92.
You, F.M., Huo, N., Gu, Y.Q., Luo, M.-C., Ma, Y., Hane, D., Lazo, G.R., Dvorak, J. and Anderson, O.D., (2008) BatchPrimer3: a high throughput web application for PCR and sequencing primer design. BMC bioinformatics, 9, 253.
Youn, B., Camacho, R., Moinuddin, S.G.A., Lee, Choonseok, Davin, L.B., Lewis, N.G. and Kang, C., (2006) Crystal structures and catalytic mechanism of the

Tesi di dottorato di Sara Pinosio discussa presso l’Università degli Studi di Udine
121
Arabidopsis cinnamyl alcohol dehydrogenases AtCAD5 and AtCAD4. Organic & biomolecular chemistry, 4(9), 1687-97.
Zhang, H.B., Zhao, X., Ding, X., Paterson, A.H. and Wing, R.A., (1995) Preparation of megabase-size DNA from plant nuclei. The Plant Journal, 7(1), 175-184.

Tesi di dottorato di Sara Pinosio discussa presso l’Università degli Studi di Udine
122
Acknowledgments
I would like to express my gratitude to my supervisor Prof. Michele Morgante for
providing me with the opportunity to complete my PhD thesis at the Institute of Applied
Genomics and for his expert guidance during these last three years.
A very special thanks goes out to my co-supervisor Dr. Fabio Marroni for his
invaluable teaching, for his helpfulness and friendship, and for sharing with me his
“ginial” ideas.
I would also like to thank all my colleagues of the Institute of Applied Genomics for
their great support and for the friendly atmosphere.
Last but not least, I wish to thank my family and Michele for giving me always their
support.
The work described in the present thesis has been supported by the European
Commission within the Seventh Framework Programme for Research, Project
Energypoplar (FP7-211917).


![Original Article Association of COL1A1 polymorphisms with ...calculation [26]. We used the Z test to evaluate the statistical significance of the pooled OR and MD. We assessed between-studies](https://img.dokumen.tips/doc/110x75/5e74380531eb0a79030528c4/original-article-association-of-col1a1-polymorphisms-with-calculation-26.jpg)