Embed Size (px)
Citation preview

Building Audit Report .
PREPARED FOR Large Office BuildingCEO
Johnny Appleseed . .
ASSESSMENT SITE1234 Sample WayChicago, IL 60601
. .
ASSESSMENT PERFORMED BYOptiMiser LLC.
. .
ASSESSMENT DATE8/8/2015
. .
REPORT DATE12/4/2015
Large Office Building
DisclaimerThis energy audit report intents to identify energy savings opportunities associated with recommended upgrades to the equipment and systems of thefacility at this site. Approximate saving ranges are included in this report to make decisions about reducing energy use at the facility. However, thisreport is not intended to serve as a detailed engineering design document. It should be noted that detailed design efforts are required in order toimplement some or all of the evaluated improvements.
As a result, OptiMiser is not liable if estimated savings ranges or economics are not actually achieved. All savings and cost estimates in the report arefor informational purposes, and are not to be construed as a design document or as guarantees. In no event will OptiMiser be liable for the failure ofthe customer to achieve a specified amount of energy savings, the operation of customer’s facilities, or any incidental or consequential damages ofany kind in connection with this report or the installation of the recommended measures.
Large Office Building 2

Contents
Executive Summary. . . . . . . . . . . . . . . . . . . . . . . . . . . . . . . . . . . . . . . . . . . . . . . . . . . . . . . . . . . . . . . . . . . . . . . . . . . . . . . . . . . . . . . . . . . . . . . . . . . 3
Audit and Facility Information. . . . . . . . . . . . . . . . . . . . . . . . . . . . . . . . . . . . . . . . . . . . . . . . . . . . . . . . . . . . . . . . . . . . . . . . . . . . . . . . . . . . . . . . . . . 5
Site Energy Use and Costs. . . . . . . . . . . . . . . . . . . . . . . . . . . . . . . . . . . . . . . . . . . . . . . . . . . . . . . . . . . . . . . . . . . . . . . . . . . . . . . . . . . . . . . . . . . . . . 8
Recommended Energy Efficiency Opportunities. . . . . . . . . . . . . . . . . . . . . . . . . . . . . . . . . . . . . . . . . . . . . . . . . . . . . . . . . . . . . . . . . . . . . . . . . . . . . 12
Potential Energy Efficiency Opportunities. . . . . . . . . . . . . . . . . . . . . . . . . . . . . . . . . . . . . . . . . . . . . . . . . . . . . . . . . . . . . . . . . . . . . . . . . . . . . . . . . . 13
Large Office Building

Executive Summary
Section 1 Executive SummaryThe goal of this audit is to identify and prioritize potential energy and demand savings opportunities at Large Office Building in Chicago, IL. Thefollowing measures were identified:
Step System Measure Electric EnergySavings (kWh)
Peak Electric DemandSavings (kW)
Heating EnergySavings (Therm) Incentive ($) Net Cost ($)
1 AHU Install VFD on Supply Fan 54,072 -0.3 1,147 $10,000 $35,0862 AHU High Efficiency Cooling Unit 215,469 230.0 - - $2,074,5573 Lighting Improve Light Fixtures 31,037 12.2 -11 - $28,225
These measures, if implemented, could result in annual energy savings of 299,634 kWh and 1,147 therms, with 242 kW of peak demand savings.These are equivalent to annual energy cost savings of $31,174 and will pay for themselves in about 69 years. The energy savings fromrecommended measures are approximately 16% of the electric consumption and 1% of the gas consumption for the facility’s most recent 12months of usage, based on billing data for this facility.
These measures will reduce the energy use intensity of the building from 146 kBtu/sf to 49 kBtu/sf, as shown in the Figure 1-1 below:
0 30 60 90 120 150
EUI - kBtu/sqft
Improved EUI=49 Base EUI=146
Figure 1-1: Building Energy Use Intensity
Large Office Building 3

The remainder of this report is organized as follows:
• Section 2 documents existing systems and conditions for the site
• Section 3 shows and discusses the site’s energy use and costs
• Section 4 provides brief descriptions of each energy measure
• Section 5 lists energy measures that are analyzed but not included in the report
Large Office Building 4

Section 2 Audit and Facility Information
2.1 Introduction
Large Office Building 5

2.2 General Site Information
Large Office Building was built in 2004. Large Office Building has 1 building whose functions, areas, occupancy periods and other information arelisted in the table below.
Table 2-1: Building Information SummaryBuilding Main Function(s) Quantity Area (sf.) No. of Floors Weekly Occupancy Saturday Occupancy Sunday Occupancy
LargeOffice Office 1 100,000 12 1 8:00 AM to 5:00 PM 9:00 AM to 12:00PM
2.3 Energy-Using SystemsTable 2-2 and Table 2-3 (on the following page) present lists of equipment installed in Large Office Building .Lighting
Table 2-2: Major Lighting Equipment SummaryEquipment Quantity Watt Operation Schedule Occupancy Sensor Location
32 500 153.1 48 Hrs/Wk No LargeOffice
Large Office Building 6
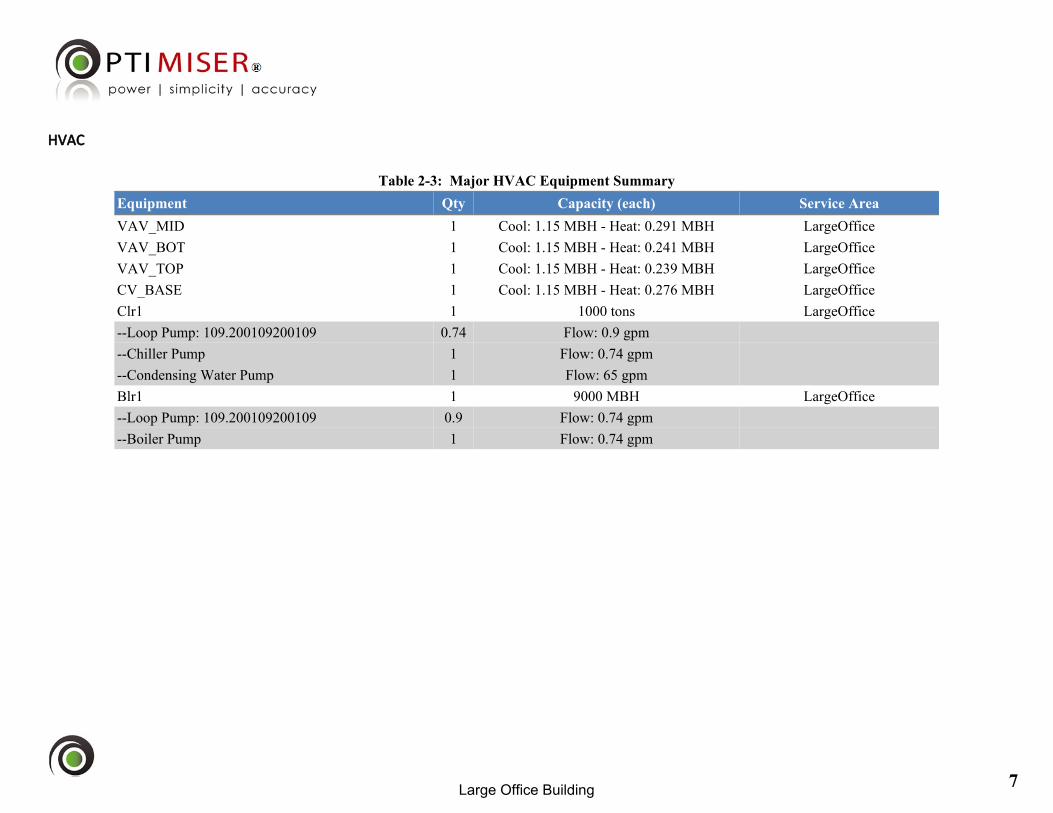
HVAC
Table 2-3: Major HVAC Equipment SummaryEquipment Qty Capacity (each) Service AreaVAV_MID 1 Cool: 1.15 MBH - Heat: 0.291 MBH LargeOfficeVAV_BOT 1 Cool: 1.15 MBH - Heat: 0.241 MBH LargeOfficeVAV_TOP 1 Cool: 1.15 MBH - Heat: 0.239 MBH LargeOfficeCV_BASE 1 Cool: 1.15 MBH - Heat: 0.276 MBH LargeOfficeClr1 1 1000 tons LargeOffice--Loop Pump: 109.200109200109 0.74 Flow: 0.9 gpm--Chiller Pump 1 Flow: 0.74 gpm--Condensing Water Pump 1 Flow: 65 gpmBlr1 1 9000 MBH LargeOffice--Loop Pump: 109.200109200109 0.9 Flow: 0.74 gpm--Boiler Pump 1 Flow: 0.74 gpm
Large Office Building 7

Section 3 Site Energy Use and Costs
3.1 Electricity and Fuel Consumption and CostsSample Fuel Company provides the fuel and Sample Electric Company supplies electricity to this building. The consumptions are shown in Figure 3-1and 3-2.
Monthly Electricity Consumption
kWh
0
100000
200000
300000
400000
500000
600000
700000
Feb Mar Apr May Jun Jul Aug Sep Oct Nov Dec Jan
Figure 3-1: Monthly Electricity Consumption and Demand
Large Office Building 8

Monthly Fuel Consumption
Ther
ms
0
5000
10000
15000
20000
25000
Feb Mar Apr May Jun Jul Aug Sep Oct Nov Dec Jan
Figure 3-2: Monthly Fuel Consumption
Figure 3-3 shows the monthly utility costs of Large Office Building . The electric and gas cost used to estimate the annual cost savings of this auditare $0.1/kWh and $0.68/therm.
Monthly Energy Costs ($)
0
100000
200000
300000
400000
500000
600000
700000
Feb Mar Apr May Jun Jul Aug Sep Oct Nov Dec Jan
Electricity FuelFigure 3-3: Total Monthly Energy Costs
Large Office Building 9

3.2 Energy Breakdown
Figure 3-4 shows a breakdown of different energy end users at Large Office Building .
11 %
31 %
17 %
27 %
15 %
Lighting Plug Loads
HVAC Cooling HVAC Fan
HVAC Pump
Figure 3-4: Breakdown of Energy Usage
Large Office Building 10

3.3 Benchmarking
Energy use intensity (EUI) is a measure of how much energy a building consumes, normalized by the square footage of the building. This parameteris used to gauge a building’s performance relative to similar buildings in the same climate zone.
Based on 12-month period electric and gas billing data and by using Energy Star Portfolio Manager as a benchmarking tool, the calculated site EUI is90 kBtu/ft2 and source EUI is 153 kBtu/ft2, which is greater than a median property of Portfolio Manager EUI. The Portfolio Manager medianProperty site EUI is 82 kBtu/ft2 and source EUI is 141 kBtu/ft2. The benchmarking results summary is shown in Table 3-1.
Table 3-1: Portfolio Manager Benchmarking Results SummaryMetric Median Property Property in Use
Source EUI (kBtu/ft2 ) 141 153
Site EUI (kBtu/ft2 ) 82 90
Source Energy Use (kBtu) 2,120,458 2,304,889
Site Energy Use (kBtu) 1,241,725 1,349,726
Total GHG Emission (Metric Tons) 144 157
Energy Star Score 45
The benchmarking results show Large Office Building 's energy consumption is higher than the median property in Portfolio Manager, so there is stillroom for improvement to lower energy consumption at this property. This property currently has an Energy Star Score of 45.
Large Office Building 11

Section 4 Recommended Energy Efficiency OpportunitiesThe following sections briefly describe recommended measures, categorized by measure cost and type.AHU
Est. Install Cost..................................Total Annual Savings.........................Simple Payback Period......................CO2 Equivalent Reduction................Annual kWh Savings.........................Annual therm Savings........................
AHU
Est. Install Cost..................................Total Annual Savings.........................Simple Payback Period......................CO2 Equivalent Reduction................Annual kWh Savings.........................Annual therm Savings........................
Lighting
Est. Install Cost..................................Total Annual Savings.........................Simple Payback Period......................CO2 Equivalent Reduction................Annual kWh Savings.........................Annual therm Savings........................
Install VFD on Supply Fan
$45,086$6,2697.2 Yrs43 t54,072 kWh1,147 therms
Existing supply fans are constant speed. VFD fan control is recommended to save supply fanenergy at partial load conditions. A duct static pressure signal is used to control the VFD andthe supply fan speed. Zone level terminal boxes may need to be retrofitted to variable airvolume type in order to achieve maximum supply fan savings.
High Efficiency Cooling Unit
$2,074,557$21,853>50 Yrs149 t215,469 kWh- therms
The package units serving the facility have relatively low cooling efficiency, resulting in highcooling energy consumption. More efficient packaged units can be installed to replace theexisting equipment so less cooling energy is used to maintain the same cooling output.
Improve Light Fixtures
$28,225$3,0529.2 Yrs21 t30,093 kWh- therms
Interior lighting of the facility consists of old linear fluorescent fixtures. Replacing thesefixtures with more efficient linear fluorescent lamps/fixtures or LEDs can reduce interiorlighting energy use while by using less electric lighting power to maintain the same lightinglevel. Indirect benefits include reduced HVAC energy consumption due to reduced buildingcooling load from lower internal loads.
Large Office Building 12

Section 5 Potential Energy Efficiency OpportunitiesThe following section lists energy efficiency measures that were considered and analyzed, but not included in this report. These opportunities werenot included for a variety of reasons including lack of data, design analysis time constraints or preliminary unfavorable economics.
System Measure Electric EnergySavings (kWh)
Peak ElectricDemand
Savings (kW)
Heating EnergySavings(Therm)
Savings ($) Incentive ($) Net Cost ($)
AHU Duct Static Pressure Reset 55,523 0.0 -12 $5,623 $200 $600AHU Supply Air Temp Control and Reset -85,801 0.0 16,266 $2,429 $450 $550AHU Demand Control Ventilation 4,180 23.8 44 $454 $2,000 $6,400AHU Improve AHU Scheduling 37,203 0.0 23,615 $19,933 $400 $800
Infiltration Improve Building Infiltration -973 0.0 768 $427 $550 $13,450Walls Improve Wall Characteristics -304 0.0 241 $134 - -Roof Improve Roof Characteristics -20 0.0 16 $9 $500 $9,500
Appliances Improve Appliances 7,402 0.8 0 $751 $2,000 $37,580Computers Computer Power Management 9,541 0.0 0 $968 - -
Large Office Building 13