Embed Size (px)
Citation preview

Building and Supporting Teacher Quality in Early Childhood Education

Today, There are Two
Achievement Gaps
The gap between white and more affluent
students in the U.S. and students of color and
those in poverty
The gap between U.S. students and those in
other high-achieving nations that have made
greater – and more equitable - investments in
education over the last thirty years.

PISA 2009 Results
Reading
Korea
Finland
Singapore
Canada
New Zealand
Japan
Australia
US is #14
Mathematics
Singapore
Korea
Finland
Lichtenstein
Switzerland
Japan
Canada
US is #31
Science
Finland
Singapore
Japan
Korea
New Zealand
Canada
Estonia
US is #27

0
10
20
30
40
50
60
70
80
90
100
Unite
d S
tate
s
Czech
Repub
lic
Est
onia
Germ
any
Switzerland
Denm
ark
Cana
da
Nor
way
Sweden
Rus
sian
Federa
tion
4
Aus
tria3
Slove
nia
Isr
ael
Slova
k Repu
blic
New Z
ealand
Hun
gary
Finland
Unite
d K
ingd
om3
Neth
erland
s
Lux
embou
rg
EU19 ave
rage
OECD a
vera
ge
Fra
nce
Aus
tralia
Ice
land
Belgium
Poland
Ire
land
Kor
ea
Chile2
Gre
ece
Ita
ly
Spa
in
Tur
key
Port
ugal
Mexico
Bra
zil2
1990s 1980s 1970s 1960s
%
1. Excluding ISCED 3C short programmes 2. Year of reference 20043. Including some ISCED 3C short programmes 3. Year of reference 2003.
The U.S. is Falling Behind in
Educational AttainmentApproximated by percentage of persons with ISCED3 qualfications in age groups 55-64, 45-55, 45-44 und 25-34 years
13
1
1
27

College Participation is
Also Falling Behind
Each year of additional education in the population
nets a gain of 3.7% in long-term economic growth
(OECD, 2005).
However, the U.S. has dropped from 1st to 17th in
college participation over the last decade.
About 38% of US students earn a c degree (only
17% of blacks and 11% of Latinos age 25-29),
compared to 50% in European countries and over
60% in Korea and Singapore.
U.S. high-tech jobs are increasingly filled by foreign
nationals.

Inequality Influences
Low US Rankings
Figure 1
U.S. PISA Results, by Subgroup, Compared to OECD Average
400
420
440
460
480
500
520
540
OECD avg. White Asian Black Hispanic
Reading Science Math Problem Solving

U.S. Leads in % of Children in Poverty,
2007 (OECD Nations)
Mexico
0.0%
5.0%
10.0%
15.0%
20.0%
25.0%
30.0%
Den
mar
k
Fin
alnd
Nor
way
Sw
eden
Cze
ch R
epub
lic
Sw
itzer
land
Fra
nce
Bel
guim
Hun
gary
Luxe
mbo
urg
Net
herla
nds
Aus
tria
Ger
man
y
Gre
ece
Pol
and
Japa
n
Spa
in
UK
Por
tuga
l
Irel
and
New
Zea
land
Italy
Uni
ted
Sta
tes
Mex
ico
22%

Educational Inequality
Exacerbates the Effects of Poverty
In most states, schools serving minority
and low-income students have
Lower funding levels
Larger class sizes and school sizes
Less well-qualified teachers
Less engaging and challenging
curriculum
Fewer computers, books, supplies
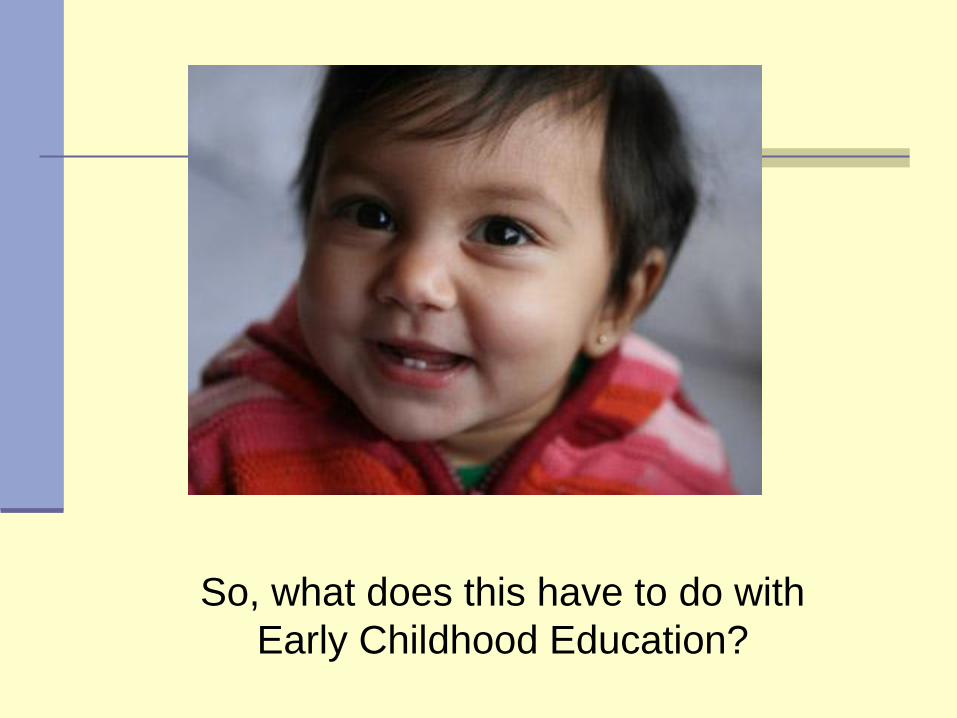
So, what does this have to do with
Early Childhood Education?

What are High-Achieving and
Steeply-Improving Nations Doing?
Universal preschool and health care
Equitable funding with investments in high-need schools and students
Large investments in educator preparation and ongoing support
A thoughtful, whole child curriculum
Performance assessments focused on higher order skills
Focus on multilingual, multicultural education

Quality ECE closes
much of the
achievement gap
and has long-term
benefits for:
Promotion
Graduation
College-going
Employment

ECE Pays Off
Social benefits of high-quality ECE* are
estimated at $4-$10 for every $1 invested.
Reduced costs for:
-- Grade retention and school failure
-- Special education placements
-- Dropping out (>$30 billion annually in CA)
-- Unemployment
-- Incarceration
*ABC, Perry Preschool, Oklahoma, New Jersey

The Most Successful Programs
Have Relied On…
Highly qualified teachers with a bachelor’s or
master’s degree in early childhood education
Small class sizes
Rich hands-on learning materials
Language- and print-rich environments
Creative play and engaging, collaborative
learning activities
Parent outreach and education.

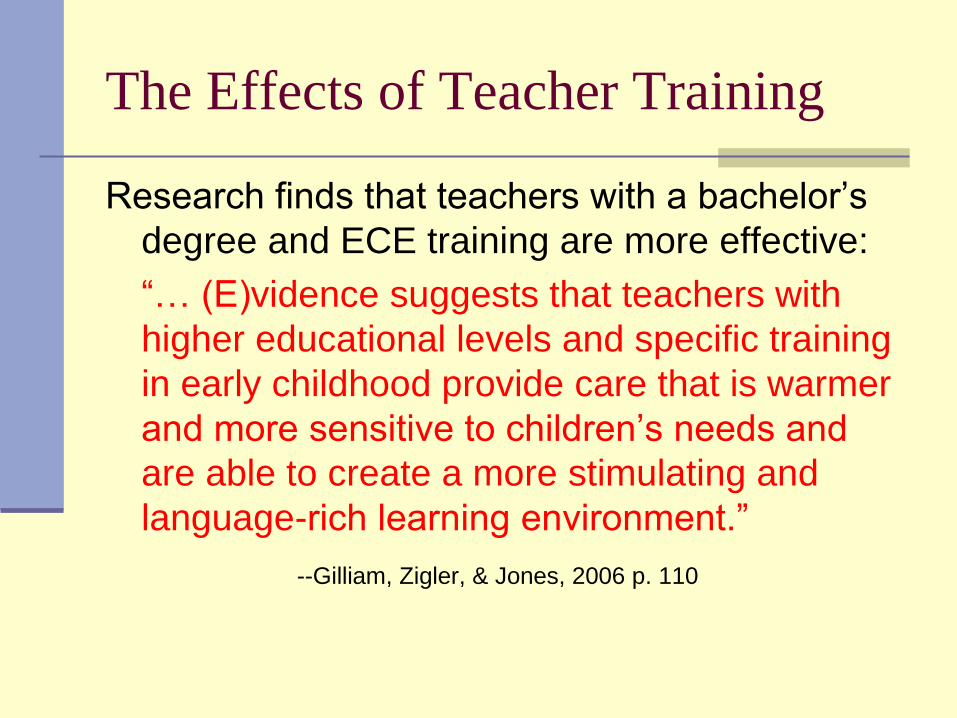
The Effects of Teacher Training
Research finds that teachers with a bachelor’s
degree and ECE training are more effective:
“… (E)vidence suggests that teachers with
higher educational levels and specific training
in early childhood provide care that is warmer
and more sensitive to children’s needs and
are able to create a more stimulating and
language-rich learning environment.”
--Gilliam, Zigler, & Jones, 2006 p. 110

Outcomes of
Well-Qualified Teachers
More educated teachers with ECE training
produce more positive outcomes:
Teacher - Student interactions
-- warm, language-rich, educative
Classroom Quality
-- wider range of guided activities, more
creative and complex play and learning
Cognitive outcomes
-- language, math, and reasoning skills
Social emotional outcomes


California’s ECE Workforce
130,000 providers serving 750,000 children
-- 55,000 in day care homes
--75,000 in ECE centers

Challenges in Recruiting and
Retaining ECE Teachers Working in ECE often
pays less than
gardening, waiting
tables, or pumping gas.
¼ of early childhood
workers are part of
working poor.

ECE Wages in California
Average salary of the highest-paid ECE
teacher with a BA = $34,382, nearly $16,000
less than that of the average California public
school kindergarten teacher.
Average wage for centers’ highest-paid
assistant teachers = $9.28 to $11.21per hour.
Annual ECE teacher turnover (22%) is twice
that of California public school K-12 teachers.
-- Whitehead et al. (2006). California Early Care and
Education Workforce Study

ECE Workforce
Qualifications in California
Bachelors degrees are held by:
25% of ECE center teachers
(2/3 of these degrees focus on ECE)
55% of center directors
14% of family day care providers
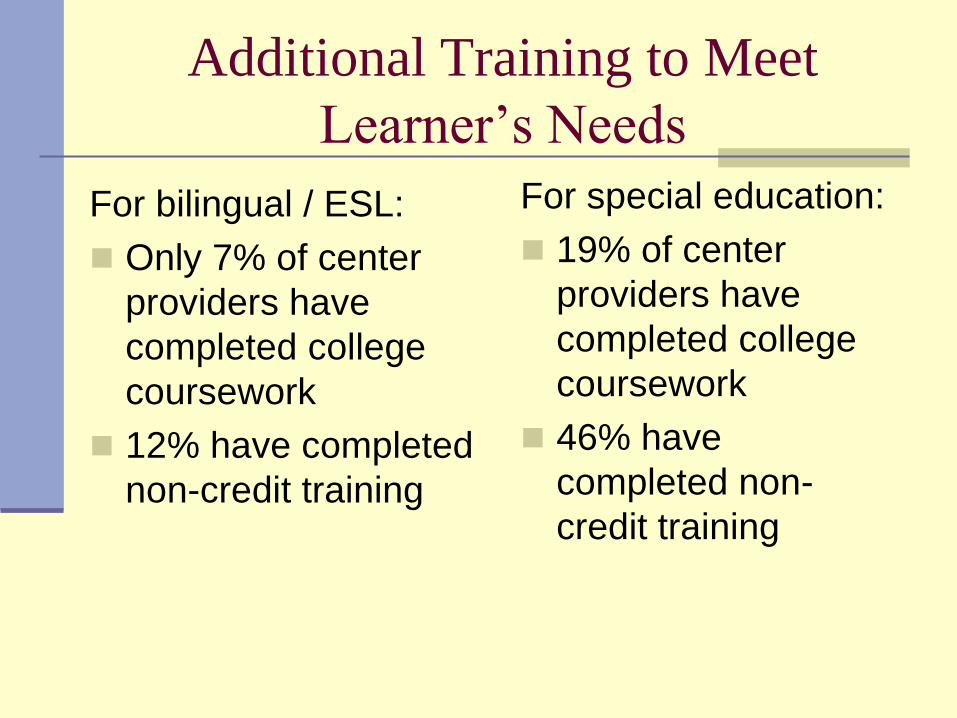
Additional Training to Meet
Learner’s Needs
For bilingual / ESL:
Only 7% of center
providers have
completed college
coursework
12% have completed
non-credit training
For special education:
19% of center
providers have
completed college
coursework
46% have
completed non-
credit training

What Can We Do to Move Forward?

Getting Ready for the Turnaround
Study effective state
programs and
preparation models
Develop PK program
standards
Develop standards &
investment plans for
preparation, PD, and
credentialing
Link PK and K-12
systems
The CA Way

What Happens When States Make Smart and
Equitable Investments?New Jersey Math Achievement Trends
4th Grade NAEP
White, 248
Hispanic, 206
Hispanic, 224
Black, 204
Black, 217
Black, 232
National Ave., 222
National Ave., 226
National Ave., 239White, 236 White, 239
White, 255
Hispanic, 234
Hispanic, 204
Black, 198
National Ave., 219
190
200
210
220
230
240
250
260
1992 1996 2003 2007
Source: National Assessment of Educational Progress, NAEP Data Trends
NA
EP
Scale
Sco
re CA, 230

What Did New Jersey Do?
Parity funding for high-minority, low-wealth districts
Investment in high-quality preschool
Subsidies for teacher learning and credentialing
Standards for preschool providers
Comparable PK teacher salaries
Whole school reform based on the Comer model
supporting child development, mental health and
teaching teams, and parent involvement
Teacher education & PD focused on urban and
bilingual teaching in literacy and mathematics,
PK-12

What Can All of Us Do?

We should say to each of them: “Do you know what you are?
You are a marvel. You are unique. In all the world there is
no other child exactly like you. In the millions of years that
have passed, there has never been a child like you... and
when you grow up, can you then harm another who is, like
you, a marvel? You must cherish one another.” You must
work -- we must all work -- to make this world worthy of its
children. -- Pablo Casals


![SSECT [Supporting Successful Early Childhood Transitions] SSECT [Supporting Successful Early Childhood Transitions] POMS TA Consultant POMS TA Consultant](https://img.dokumen.tips/doc/110x75/551c5145550346a5458b4d30/ssect-supporting-successful-early-childhood-transitions-ssect-supporting-successful-early-childhood-transitions-poms-ta-consultant-poms-ta-consultant.jpg)