Embed Size (px)
Citation preview

Peter Kukielski, GMB Member, Mining Investor Day 2011 - 23 September 2011
Building a world classmining business
1
DisclaimerForward-Looking Statements
This document may contain forward-looking information and statements about ArcelorMittal and its subsidiaries. These statements include financial projections and estimates and their underlying assumptions, statements regarding plans, objectives and expectations with respect to future operations, products and services, and statements regarding future performance. Forward-looking statements may be identified by the words “believe,” “expect,” “anticipate,”“target” or similar expressions. Although ArcelorMittal’s management believes that the expectations reflected in such forward-looking statements are reasonable, investors and holders of ArcelorMittal’s securities are cautioned that forward-looking information and statements are subject to numerous risks and uncertainties, many of which are difficult to predict and generally beyond the control of ArcelorMittal, that could cause actual results and developments to differ materially and adversely from those expressed in, or implied or projected by, the forward-looking information and statements. These risks and uncertainties include those discussed or identified in the filings with the Luxembourg Stock Market Authority for the Financial Markets (Commission de Surveillance du Secteur Financier) and the United States Securities and Exchange Commission (the “SEC”) made or to be made by ArcelorMittal, including ArcelorMittal’s Annual Report on Form 20-F for the year ended December 31, 2010 filed with the SEC. ArcelorMittal undertakes no obligation to publicly update its forward-looking statements, whether as a result of new information, future events, or otherwise.

2
Today’s agenda
• Outlook and strategy– Core strength, sustainable growth– Implementing savings, executing growth
• Mining– Building a World-Class Mining business
– Mining: a commercial approach
• Value-added leadership– ArcelorMittal Research and Development– Leadership in the Automotive steel market
0.0
1.0
2.0
3.0
4.0
5.0
6.0
7.0
2006 2007 2008 2009 2010 2011 2012 2013 2014 2015 2016
Fre
quen
cy R
ate
ArcelorMittal Anglo Xstrata Rio Tinto Vale Barrick Newmont
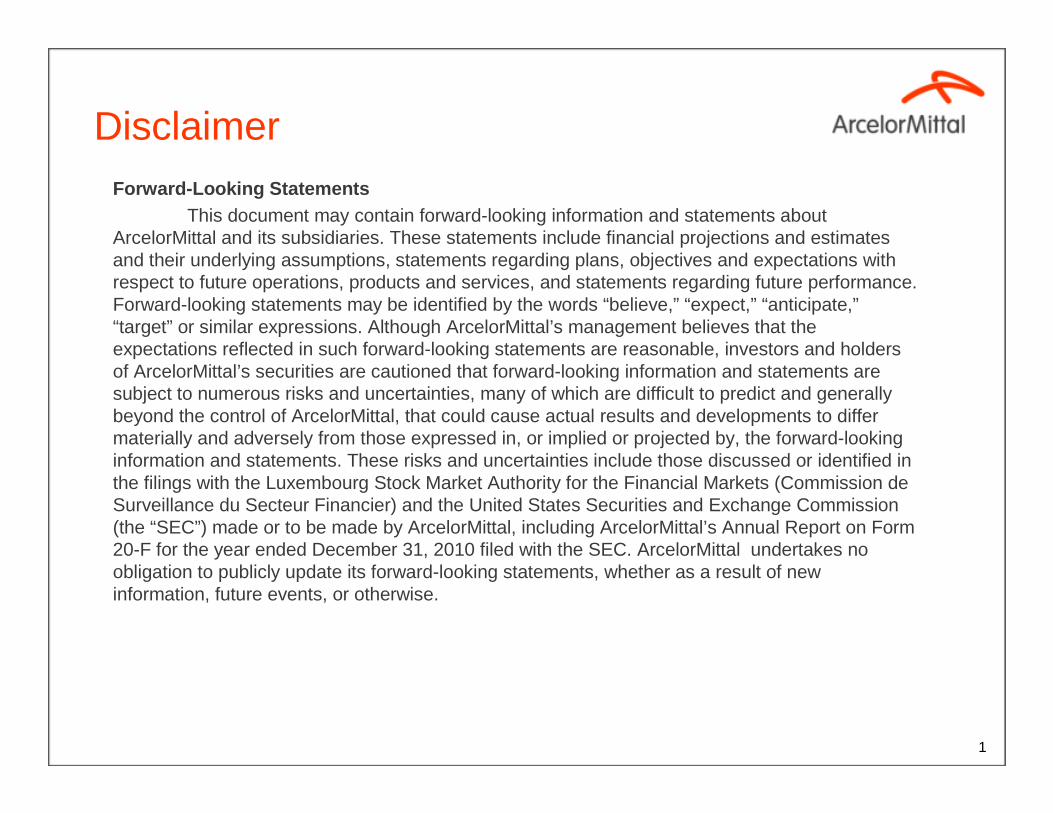
Target to be best in Safety…
Improving safety performance, trending towards worl d class standards
• Lost Time injury frequency rate refers to World Steel Association standard: Fr = Lost Time Injuries per 1.000.000 worked hours; based on own personnel and contractors• Source ArcelorMittal estimates and public reports of peer companies
Mining segment injury frequency rate*
Long term safety targets trending towards world
class
3
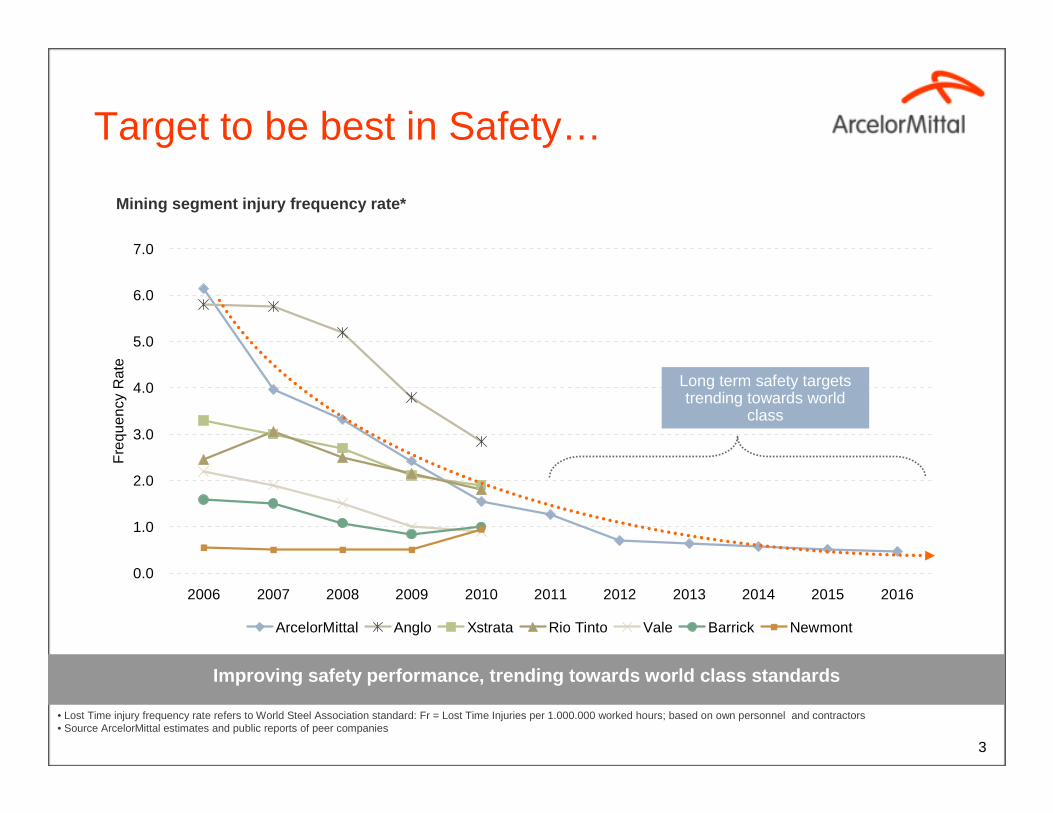
Peter KukielskiGMB
Head of mining
Phil du ToitEVP Projects& Exploration
Kleber SilvaVP Iron Ore
Johann Van ZylVP Non-Ferrous
Ajit Mathew VP Human Resources
Ram SarafVP Finance
Simon Wandke VPCommercial
Strong leadership team…
…with a track record of project execution
GMB Group Management Board; EVP Executive Vice President; VP Vice President; CTO Chief Technical Officer; GM General Manager;
4

Geographically diversified mining assets
South Africa Iron Ore**
* Includes share of production** Includes purchases made under July 2010 interim agreement with Kumba (South Africa)
Mining business portfolio
Key assets and projects
USA Iron Ore Minorca 100%Hibbing 62%*
Mexico Iron OreLas Truchas & Volcan 100%;
Pena 50%*Liberia
Iron Ore 70%
AlgeriaIron Ore
70%
Brazil Iron Ore100%
New projects / exploration
Existing mines
MauritaniaIron Ore
exploration license
Canada AMMC 100%
Bosnia Iron Ore
51%
USA Coal100%
South Africa Manganese
50%
Indian Iron Ore & Coal exploration
license
Ukraine Iron Ore
95%
Kazakhstan Coal
8 mines 100%
Kazakhstan Iron Ore
4 mines 100%
Russian Coal98.3%
Iron ore mine
Non ferrous mine
Coal mine
McArthur coal16.02% interest
Coal of Africa15.98%
CanadaBaffinland 70%
5
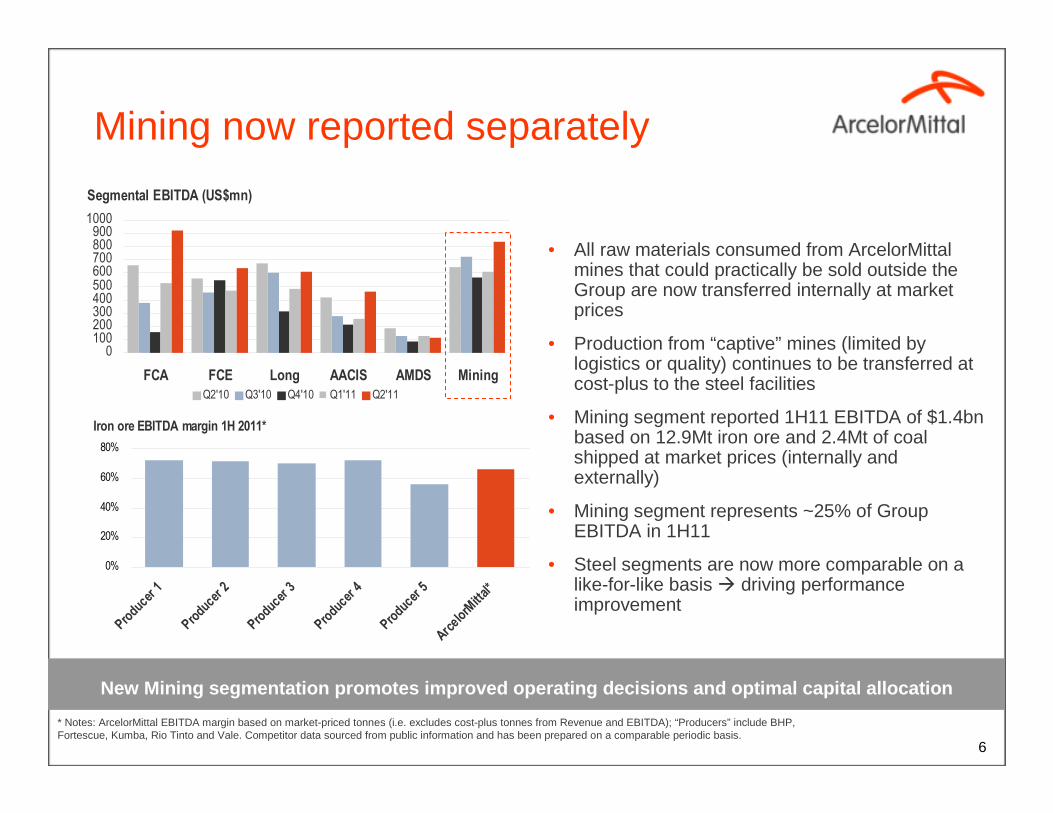
Segmental EBITDA (US$mn)
0100200300400500600700800900
1000
FCA FCE Long AACIS AMDS MiningQ2'10 Q3'10 Q4'10 Q1'11 Q2'11
Mining now reported separately
• All raw materials consumed from ArcelorMittal mines that could practically be sold outside the Group are now transferred internally at market prices
• Production from “captive” mines (limited by logistics or quality) continues to be transferred at cost-plus to the steel facilities
• Mining segment reported 1H11 EBITDA of $1.4bn based on 12.9Mt iron ore and 2.4Mt of coal shipped at market prices (internally and externally)
• Mining segment represents ~25% of Group EBITDA in 1H11
• Steel segments are now more comparable on a like-for-like basis � driving performance improvement
* Notes: ArcelorMittal EBITDA margin based on market-priced tonnes (i.e. excludes cost-plus tonnes from Revenue and EBITDA); “Producers” include BHP, Fortescue, Kumba, Rio Tinto and Vale. Competitor data sourced from public information and has been prepared on a comparable periodic basis.
New Mining segmentation promotes improved operating decisions and optimal capital allocation
6
Iron ore EBITDA margin 1H 2011*
0%
20%
40%
60%
80%
Prod
ucer 1
Prod
ucer 2
Prod
ucer 3
Prod
ucer 4
Prod
ucer 5
Arce
lorM
ittal*
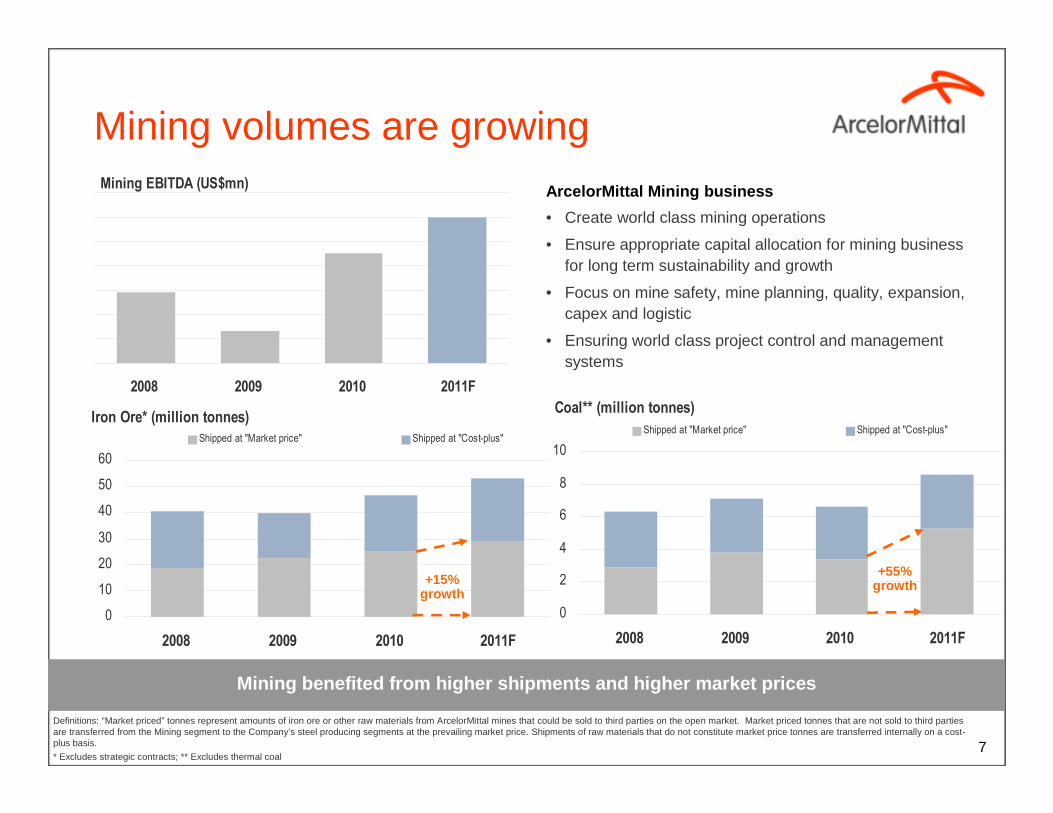
Mining EBITDA (US$mn)
2008 2009 2010 2011F
7
Mining volumes are growingArcelorMittal Mining business
• Create world class mining operations
• Ensure appropriate capital allocation for mining business for long term sustainability and growth
• Focus on mine safety, mine planning, quality, expansion, capex and logistic
• Ensuring world class project control and management systems
Mining benefited from higher shipments and higher m arket prices
Definitions: “Market priced” tonnes represent amounts of iron ore or other raw materials from ArcelorMittal mines that could be sold to third parties on the open market. Market priced tonnes that are not sold to third parties are transferred from the Mining segment to the Company’s steel producing segments at the prevailing market price. Shipments of raw materials that do not constitute market price tonnes are transferred internally on a cost-plus basis.
* Excludes strategic contracts; ** Excludes thermal coal
Coal** (million tonnes)
0
2
4
6
8
10
2008 2009 2010 2011F
Shipped at "Market price" Shipped at "Cost-plus"Iron Ore* (million tonnes)
0
10
20
30
40
50
60
2008 2009 2010 2011F
Shipped at "Market price" Shipped at "Cost-plus"
+15% growth
+55% growth

Reserve and resource update
Upgraded railway line linking mine with port at LiberiaAMMC: Mont-Wright Mining ComplexBaffinlandMont Wright, Canada
Jorc eq.
GKZ
SEC
N143-101
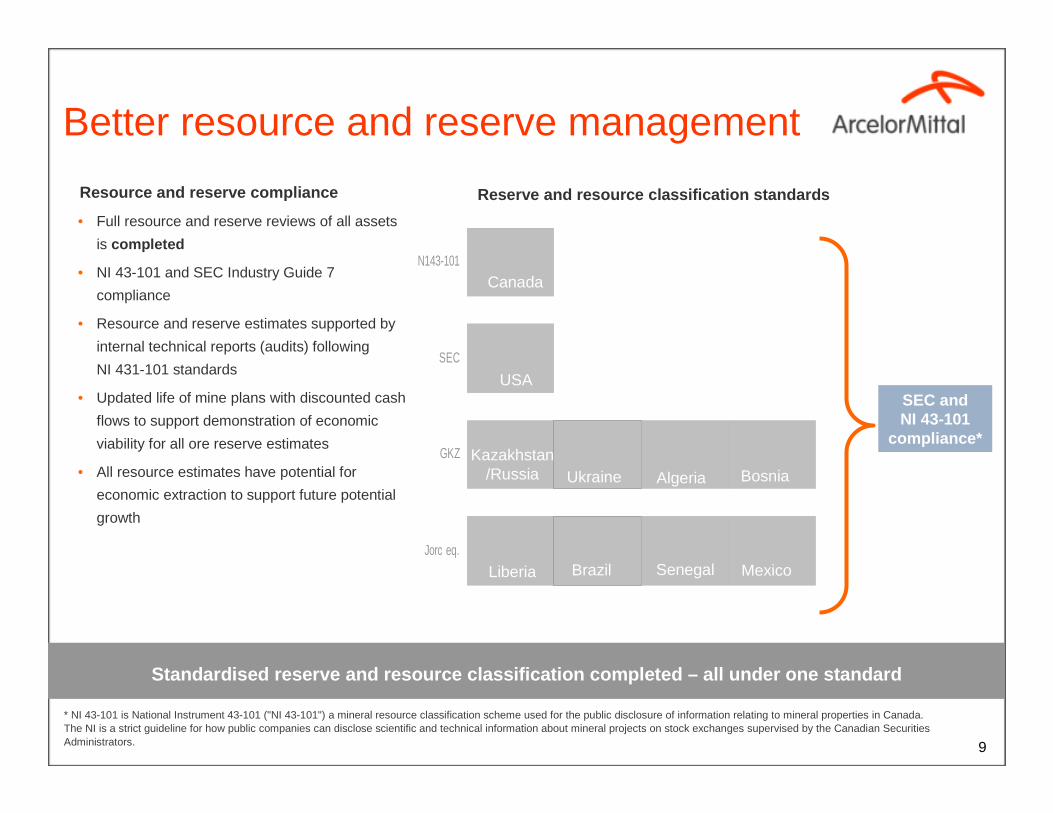
• Full resource and reserve reviews of all assets
is completed
• NI 43-101 and SEC Industry Guide 7
compliance
• Resource and reserve estimates supported by
internal technical reports (audits) following
NI 431-101 standards
• Updated life of mine plans with discounted cash
flows to support demonstration of economic
viability for all ore reserve estimates
• All resource estimates have potential for
economic extraction to support future potential
growth
Canada
USA
Kazakhstan/Russia Ukraine Algeria Bosnia
Liberia Brazil Senegal Mexico
SEC and NI 43-101
compliance*
Better resource and reserve management
Reserve and resource classification standardsResource and reserve compliance
* NI 43-101 is National Instrument 43-101 ("NI 43-101") a mineral resource classification scheme used for the public disclosure of information relating to mineral properties in Canada. The NI is a strict guideline for how public companies can disclose scientific and technical information about mineral projects on stock exchanges supervised by the Canadian Securities Administrators. 9
Standardised reserve and resource classification co mpleted – all under one standard

Type of product
281,025303,442292,350Canada (AMMC)
RegionProven & probable
reservesMeasured & indicated
resourcesInferred
resources
Mtonnes %Fe Mtonnes %Fe Mtonnes %Fe
Canada (Baffinland)
375 65 41 66 444 65
USA 581 20 41 23 90 23
Central America 308 29 117 29 88 28
South America 134 58 321 38 130 37
West Africa 22 61 1,539 44 1,522 41
Eastern Europe 366 37 866 38 - -
Central Asia 120 41 1,629 40 30 51
TOTAL 4,255 33 7,997 36 3,329 39
Iron ore reserves and resources2010 year-end estimates
The life of mine plans of operations and planned ex pansion projects are 90% based on ore reserve estimates
LumpsFines
Pellet feedConc
• Tonnage and grade estimates are reported as ‘Run of Mine’. Tonnage is reported on a wet metric basis. Where we own less than 100% of the operation, the estimates have not been adjusted to reflect our ownership interest.
• Mineral resource estimates are reported in addition to ore reserve estimates.
• The ore reserve and mineral resource estimates have been prepared under the supervision of ArcelorMittal qualified personnel . Detailed independent audits are conducted on a regular basis.
The terms "mineral resource", "measured mineral resource", "indicated mineral resource" and "inferred mineral resource" are defined in, and have been calculated in accordance with the guidelines set forth in, Canadian National Instrument 43-101 (“NI 43-101”). NI 43-101 is a codified set of rules and guidelines for reporting and displaying information related to mineral properties owned by, or explored by, companies which report results on stock exchanges within Canada, and is recognized by several other international stock exchanges and regulatory bodies. However, these terms are not defined terms under SEC Industry Guide 7 and (absent an applicable exception) are not permitted to be used in reports and registration statements filed with the SEC. Investors are cautioned not to assume that any part or all of mineral deposits in these categories will ever be converted into reserves. "Inferred mineral resources" have a great amount of uncertainty as to their existence, and great uncertainty as to their economic and legal feasibility. It cannot be assumed that all or any part of an inferred mineral resource will ever be upgraded to a higher category. 10

Better resource and reserve management -Example: ArcelorMittal Mines Canada
Ore reserve estimatesSupport a mine life of 29 years (including planned expansion to 24 Mtpa by 2013)
Measured and indicated resource estimatesPre-feasibility studies for additional growth
Inferred resource estimatesOn-going exploration program and preliminary economic evaluations to support long-term sustainability
Considerable Mineral Resource inventory to support significant future growth
11

Metallurgical coal reserves and resources2010 year-end estimates
The coal life of mine plans of operations and plann ed expansion projects are 100% based on coal reserve estimates
Inferred Resources
Proven+Probable Reserves
Measured+Indicated Resources
• Tonnage and grade estimates are reported as ‘Run of Mine’. Tonnage is reported on a wet metric basis. Where we own less than 100% of the operation, the estimates have not been adjusted to reflect our ownership interest.
• Mineral resource estimates are reported in addition to coal reserve estimates.
• The ore reserve and mineral resource estimates have been prepared under the supervision of ArcelorMittal qualified personnel. Detailed independent audits are conducted on a regular basis.
Group coal resources and reserves 2010 plant wise resource and reserve
Coal
Proven & probable reserves
Measured & indicated resources
Inferred resources
Mtonnes %Yield Mtonnes %Yield Mtonnes %Yield
Kazakhstan 193 46 588 47 8 62
Kuzbass 32 65 226 63 32 62
Princeton 123 59 86 54 4 53
TOTAL 347 52 901 52 43 61
12
The terms "mineral resource", "measured mineral resource", "indicated mineral resource" and "inferred mineral resource" are defined in, and have been calculated in accordance with the guidelines set forth in, Canadian National Instrument 43-101 (“NI 43-101”). NI 43-101 is a codified set of rules and guidelines for reporting and displaying information related to mineral properties owned by, or explored by, companies which report results on stock exchanges within Canada, and is recognized by several other international stock exchanges and regulatory bodies. However, these terms are not defined terms under SEC Industry Guide 7 and (absent an applicable exception) are not permitted to be used in reports and registration statements filed with the SEC. Investors are cautioned not to assume that any part or all of mineral deposits in these categories will ever be converted into reserves. "Inferred mineral resources" have a great amount of uncertainty as to their existence, and great uncertainty as to their economic and legal feasibility. It cannot be assumed that all or any part of an inferred mineral resource will ever be upgraded to a higher category.

Growth plan update
Upgraded railway line linking mine with port at LiberiaMont Wright, Canada,
0
10000
20000
30000
40000
50000
60000
70000
80000
90000
2010 2011F 2012 2013 2014 2015
Cost plus tonnage Marketable tonnage
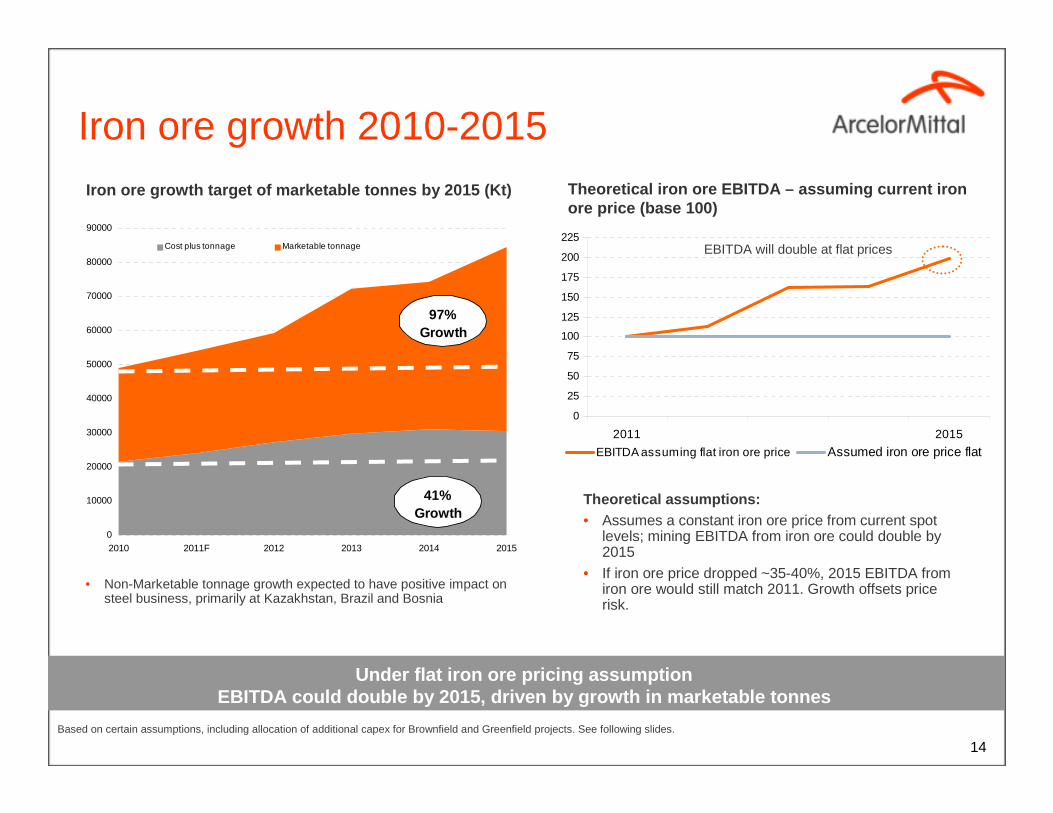
97% Growth
41% Growth
Iron ore growth 2010-2015Theoretical iron ore EBITDA – assuming current iron ore price (base 100)
Iron ore growth target of marketable tonnes by 2015 (Kt)
The life of mine plans of operations and planned ex pansion projects are 100% based on coal reserve estimates
Under flat iron ore pricing assumption EBITDA could double by 2015, driven by growth in ma rketable tonnes
• Non-Marketable tonnage growth expected to have positive impact on steel business, primarily at Kazakhstan, Brazil and Bosnia
14
Theoretical assumptions:• Assumes a constant iron ore price from current spot
levels; mining EBITDA from iron ore could double by 2015
• If iron ore price dropped ~35-40%, 2015 EBITDA from iron ore would still match 2011. Growth offsets price risk.
Based on certain assumptions, including allocation of additional capex for Brownfield and Greenfield projects. See following slides.
0
25
50
75
100
125
150
175
200
225
2011 2015
EBITDA assuming flat iron ore price Assumed iron ore price flat
EBITDA will double at flat prices

Iron ore growth 2010-2015, target 100MT including strategic contracts
2015 iron ore target growth plan on track
Canada Brazil
LiberiaPhase 1 & 2
Liberia Phase 1
Own iron ore growth target (million metric tonnes) (Excluding strategic contracts)
15
Canada
• One track for 10% growth in iron ore in 2011.
• Strategic contracts forecast of 16Mt by 2015*
• Target iron ore at ~100MT by 2015 (including strategic contracts)
* Strategic contracts include Kumba currently under dispute and Cleveland Cliffs contracts
** Includes the US$0.9 billon investment in expanding the pellet plant at AMMC which has not yet been committed to
49
3 1 1
54
5
11
14
84
0
20
40
60
80
100
2010 Operationaleff iciency
Brow nfield Greenfield 2011F Operationaleff iciency
Brow nfield Greenfield 2015 plan

ArcelorMittal Mines Canada (AMMC): expansion underway
• Expansion of our Mont Wright mine at AMMC and concentrate capacity to 24Mt pa due 2013 (from 16Mtpa post operational improvements) approved
• Expansion capitalising on existing infrastructure, product quality and experienced workforce
• Capex C$1.2bn for mine and concentrator plant expansion*
• Cash cost is circa $35/tonne
• Advantageously located with easy access to European and US markets
Mining expansion plan (concentrate) Million mt
Canadian industrial location ArcelorMittal Mines Canada overview
* Total scheme investment of US$2.1 billion includes investment in expanding the pellet plant which has not yet been committed to
Bloom LakeBloom Lake
Strategic advantage from exclusive use of own rail and port facilities
16
14 15
1
9
5
10
15
20
25
2011F 2013
Brownfield expansion
Canada base
`
* AMMC 2013 brownfieldexpansion includes 1mt increase for spirals
14
15
0
4
8
12
16
2011F 2012 2015
`
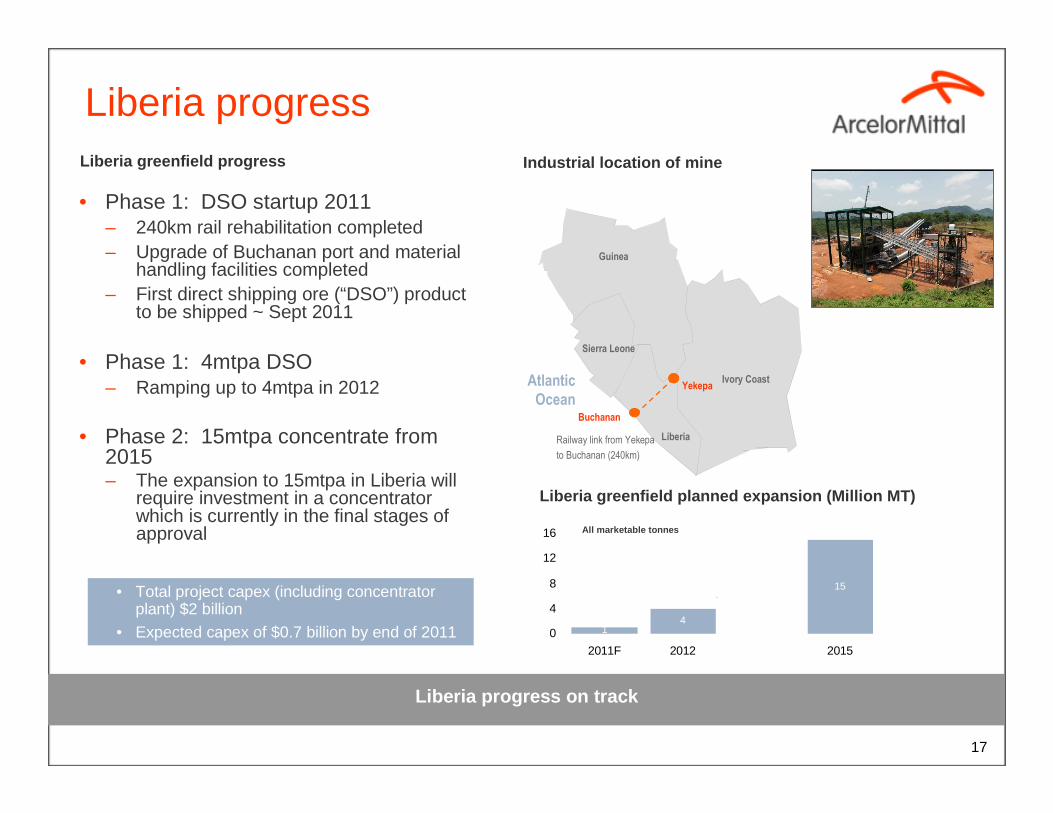
• Phase 1: DSO startup 2011– 240km rail rehabilitation completed– Upgrade of Buchanan port and material
handling facilities completed– First direct shipping ore (“DSO”) product
to be shipped ~ Sept 2011
• Phase 1: 4mtpa DSO– Ramping up to 4mtpa in 2012
• Phase 2: 15mtpa concentrate from 2015– The expansion to 15mtpa in Liberia will
require investment in a concentrator which is currently in the final stages of approval
Liberia progress
17
Liberia greenfield planned expansion (Million MT)
Industrial location of mine
All marketable tonnes
Guinea
Atlantic Ocean
Liberia
Ivory CoastYekepa
Buchanan
Sierra Leone
Railway link from Yekepa
to Buchanan (240km)
Liberia progress on track
Liberia greenfield progress
• Total project capex (including concentrator plant) $2 billion
• Expected capex of $0.7 billion by end of 2011

2015 and beyond
Upgraded railway line linking mine with port at LiberiaLiberia Crushing/Screening PlantUpgraded railway line linking mine with port at LiberiaBaffinlandBaffinland
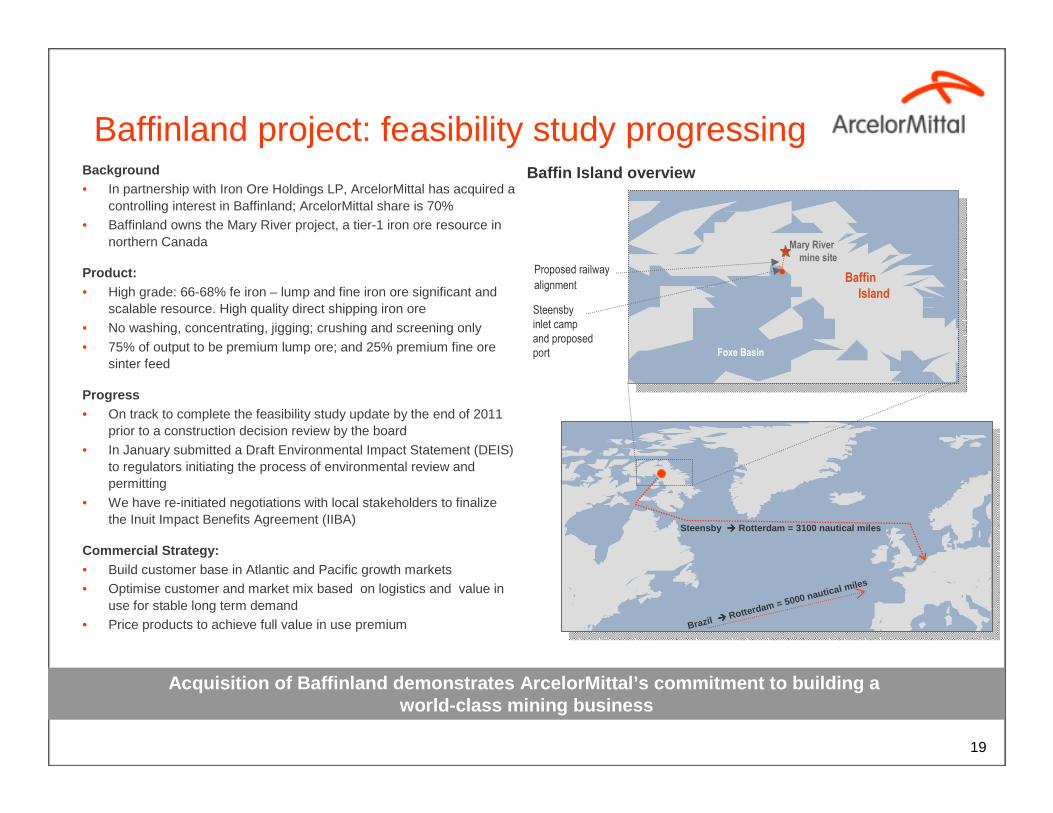
Baffinland project: feasibility study progressingBackground• In partnership with Iron Ore Holdings LP, ArcelorMittal has acquired a
controlling interest in Baffinland; ArcelorMittal share is 70%• Baffinland owns the Mary River project, a tier-1 iron ore resource in
northern Canada
Product:• High grade: 66-68% fe iron – lump and fine iron ore significant and
scalable resource. High quality direct shipping iron ore
• No washing, concentrating, jigging; crushing and screening only
• 75% of output to be premium lump ore; and 25% premium fine ore sinter feed
Progress• On track to complete the feasibility study update by the end of 2011
prior to a construction decision review by the board
• In January submitted a Draft Environmental Impact Statement (DEIS) to regulators initiating the process of environmental review andpermitting
• We have re-initiated negotiations with local stakeholders to finalize the Inuit Impact Benefits Agreement (IIBA)
Commercial Strategy:• Build customer base in Atlantic and Pacific growth markets• Optimise customer and market mix based on logistics and value in
use for stable long term demand• Price products to achieve full value in use premium
Acquisition of Baffinland demonstrates ArcelorMittal ’s commitment to building a world-class mining business
Baffin Island overview
Baffin Bay
Foxe Basin
Baffin Island
Mary River mine site
Proposed railway
alignment
Steensby
inlet camp
and proposed
port
Steensby ���� Rotterdam = 3100 nautical miles
Brazil ���� Rotterdam = 5000 nautical miles
19

-
20
40
60
80
100
120
140
160
180
2010 2011 2012 2013 2014 2015 2016 2017 2018 2019 2020
Base Planned efficiciency gains Planned Brownfield Planned Greenfield
Potential efficiency gains Potential Brownfield Potential Greenfield
Iron ore - Potential growth
Potential internal growth supported by pipeline of brownfield and greenfield projects
Planned and potential iron ore growth targets (mill ion metric tonnes) (Excluding strategic contracts)
Potential brownfield and greenfieldprojects under study
2015 iron ore target of 84MT (excluding “potential”projects and strategic contracts)
20

0
2
4
6
8
10
12
14
2010 2011 2012 2013 2014 2015 2016 2017 2018 2019 2020
Base Planned eff iciciency gains Planned Brow nfield Potential Brow nfield
Coal - Potential growth excluding off-takeTarget 11 Mtpa by 2015
Potential internal growth supported by pipeline of brownfield and greenfield projects
Planned and potential coal growth targets ( metric tonnes) (Excluding strategic contracts)
21
11 MT target by 2015
Capex and opex intensity
Liberia railway

70
80
90
100
110
120
130
140
150
160
2011F 2012 2013 2014 2015
70
80
90
100
110
120
130
140
150
160
Iron ore production Operating unit cost
Iron ore and coal production and opex
As production increases for iron ore and coal, oper ating costs are expected to fall
Iron ore production and operating unit cost (Index base 100=2011)
Coal production and operating unit cost(Index base 100=2011)
• Investments in AMMC and Liberia reduce the cost position of iron ore (excluding Baffinland)
• 2015 iron ore cash costs expected to be ~15% lower than 2011 (constant $ basis)
23
70
80
90
100
110
120
130
2011F 2012 2013 2014 2015
70
80
90
100
110
120
130
Coal production Operating unit cost
Index Index
Note: Operating unit costs shown are on a FOB basis

0
20
40
60
80
100
120
140
160
180
200
ArcelorMittalPlanned growth
Tier 1 Brazil Tier 1 West Africa Tier 1 Australia Tier 1 Australia
ArcelorMittal’s cost of adding iron ore production c apacity is comparable to other major producers
Iron ore capex intensity
Sources: Arcelormittal estimates and Citi Group estimates based on public information for competitors* Excluding planned greenfield projects (such as Baffinland) and investment in expanding the pellet plant at AMMC which has not yet been committed to
Estimated capital costs of key planned growth proje cts* in the iron ore industry
Capexintensity
US$m/mtpacapacity
24
Recap
• We have the management bench strength in place to build a world-class mining business
• Our growth is targeted towards global markets, including ArcelorMittal
• Our reserves and resources are now fully defined and provide outstanding support for our growth plan
• We have delivered our Liberia mine on plan and within budget
• Other growth initiatives are on track
Building a world class mining business
25

Appendix
Upgraded railway line linking mine with port at LiberiaAMMC: Mont-Wright Mining Complex

Reserve and resource definitionsNotes on mineral resource and ore reserve estimates
The ore reserve estimates have been prepared in compliance with both the SEC and NI43-101 requirements. Ore reserve estimates were prepared by competent professional engineers and geologists based on feasibility studies for greenfield projects and on pre-feasibility study level of engineering for existing operations to demonstrate that they can be economically extracted and sold at commercial rate. A commodity price not higher than the last historical three-year average realized price has been used in any reserve or cash flow analysis used to designate reserves. There is no evidence that the company could not obtain all the required governmental permits and environmental authorizations to conduct the mining operations as currently planned.
The terms "mineral resource", "measured mineral resource", "indicated mineral resource" and "inferred mineral resource" are defined in, and have been calculated in accordance with the guidelines set forth in, Canadian National Instrument 43-101 (“NI 43-101”). NI 43-101 is a codified set of rules and guidelines for reporting and displaying information related to mineral properties owned by, or explored by, companies which report results on stock exchanges within Canada, and is recognized by several other international stock exchanges and regulatory bodies. However, these terms are not defined terms under SEC Industry Guide 7 and (absent an applicable exception) are not permitted to be used in reports and registration statements filed with the SEC. Investors are cautioned not to assume that any part or all of mineral deposits in these categories will ever be converted into reserves. "Inferred mineral resources" have a great amount of uncertainty as to their existence, and great uncertainty as to their economic and legal feasibility. It cannot be assumed that all or any part of an inferred mineral resource will ever be upgraded to a higher category.
27