Embed Size (px)
Citation preview

TSX:TGZ / OTCQX:TGCDF
Building a
Low-Cost Mid-Tier
West African Gold Producer
Investor Presentation
March 2020

2
Forward-Looking StatementsAll information included in this presentation, including any information as to the future financial or operating performance and other statements of Teranga Gold Corporation (“Teranga”) that express
management’s expectations or estimates of future performance, other than statements of historical fact, constitute forward-looking information or forward-looking statements within the meaning of
applicable securities laws and are based on expectations, estimates and projections as of the date hereof. Forward-looking statements are included for the purpose of providing information about
management’s current expectations and plans relating to the future. Wherever possible, words such as “plans”, “expects”, “scheduled”, “trends”, “indications”, “potential”, “estimates”, “predicts”,
“anticipate”, “to establish”, “believe”, “intend”, “ability to”, or statements that certain actions, events or results “may”, “could”, “would”, “might”, “will”, or are "likely" to be taken, occur or be achieved, or the
negative of these words or other variations thereof, have been used to identify such forward-looking information. Specific forward-looking statements include, without limitation, all disclosure regarding
future results of operations, economic conditions and anticipated courses of action. Although the forward-looking statements contained herein reflect management's current beliefs and reasonable
assumptions based upon information available to management as of the date hereof, Teranga cannot be certain that actual results will be consistent with such forward-looking information. Such
assumptions include, among others, the ability to obtain any requisite governmental approvals, the accuracy of mineral reserve and mineral resource estimates, gold price, exchange rates, fuel and
energy costs, future economic conditions, anticipated future estimates of free cash flow, courses of action, the anticipated impact of combining the two assets, including anticipated synergies, and the
potential for the combined Sabodala-Massawa complex to become a top tier gold asset. Teranga cautions you not to place undue reliance upon any such forward-looking statements.
The economic analysis presented in the Massawa Technical Report was prepared by Barrick in respect of its feasibility study for a standalone development plan and proposed mining operation at
Massawa. Readers are advised that the economic outcomes disclosed by Barrick are presented in order to provide the reader with context regarding the Massawa project as proposed to be developed
by Barrick. However, readers are cautioned that as Teranga proposes to process the Massawa deposits at its existing Sabodala Project, the economic analysis presented in the Massawa Technical
Report should not be considered as representing the economic outcome stemming from an integrated Sabodala-Massawa mining complex.
The risks and uncertainties that may affect forward-looking statements include, among others, the inherent risks involved in exploration and development of mineral properties, including government
approvals and permitting, changes in economic conditions, changes in the worldwide price of gold and other key inputs, changes in mine plans and other factors, such as project execution delays, many
of which are beyond the control of Teranga. For a more comprehensive discussion of the risks faced by Teranga, and which may cause the actual financial results, performance or achievements of
Teranga to be materially different from estimated future results, performance or achievements expressed or implied by forward-looking information or forward-looking statements, please refer to
Teranga’s latest Annual Information Form filed with Canadian securities regulatory authorities at www.sedar.com or on Teranga’s website at www.terangagold.com. The risks described in the Annual
Information Form (filed and viewable on www.sedar.com and on Teranga’s website at www.terangagold.com) are hereby incorporated by reference herein. Teranga disclaims any intention or obligation
to update or revise any forward-looking statements whether as a result of new information, future events or otherwise, except as required by applicable law. Nothing herein should be construed as either
an offer to sell or a solicitation to buy or sell Teranga securities.
This presentation is dated as of February 27, 2020. All references to Teranga include its subsidiaries unless the context requires otherwise. This presentation contains references to Teranga using the
words “we”, “us”, “our” and similar words and the reader is referred to using the words “you”, “your” and similar words.
ALL DOLLAR AMOUNTS ARE DENOMINATED IN U.S. DOLLARS UNLESS SPECIFIED OTHERWISE

3
Massawa was discovered by Randgold Resources Limited, which merged with Barrick effective January 1, 2019. On July 23, 2019, Barrick voluntarily filed a technical report under National
Instrument 43-101 – Standards of Disclosure for Mineral Projects (“NI 43-101”) on the Feasibility Study of the Massawa Gold Project, Senegal (the “Massawa Feasibility Study”). The Massawa
Feasibility Study disclosed mineral resource statements as well as mineral reserve estimates as of December 31, 2018, which remain current for Barrick as of the date hereof. As the mineral
resource and mineral reserve estimates pre-date Teranga’s agreement to acquire Massawa, Teranga is treating them as “historical estimates” under NI 43-101, but they remain relevant as the most
recent mineral resource and reserves estimates for Massawa. Further drilling and resource modelling would be required to upgrade or verify these historical estimates as current mineral resources
or reserves for the combined Sabodala-Massawa Complex and accordingly, they should be relied upon only as a historical resource and reserve estimate of Barrick, which pre-dates Teranga’s
agreement to acquire Massawa. A Teranga “Qualified Person” under 43-101 has not done sufficient work to classify the historical estimate as current mineral resources or mineral reserves for the
combined Sabodala-Massawa Complex and Teranga is not treating the historical estimate as current mineral resources or mineral reserves.
Third Party Information
This presentation includes market and industry data which was obtained from various publicly available sources and other sources believed by Teranga to be true. Although Teranga believes this
information to be reliable, Teranga has not independently verified any of the data from third-party sources referred to in this presentation, or analyzed or verified the underlying reports relied upon or
referred to by such sources, or ascertained the underlying assumptions relied upon by such sources. Teranga does not make any representation as to the accuracy of such information.
Other Notes & Disclaimers
ALL DOLLAR AMOUNTS ARE DENOMINATED IN U.S. DOLLARS UNLESS SPECIFIED OTHERWISE.
Historical Resource Estimate – Massawa Gold Project

4
Creating a Low-Cost Mid-Tier Gold Producer in Mining-Friendly West Africa
Wahgnion Gold Mine
Stage
Achieved commercial
production November 1, 2019
2019 Production†
47,492 oz Au(7)
2019 AISC/oz*(10)
$938/oz Au
2P Reserves
1.6Moz @ 1.59 g/t Au(8)
Golden Hill Project
Stage
Exploration/PFS
Indicated Resource
415koz @ 2.02 g/t Au(9)
Inferred Resource
644koz @ 1.68 g/t Au(9)
Miminvest & Afema
Stage
Early Exploration
Standalone
Sabodala Gold Mine(1)
Stage
Production
2019 Production
241,276 oz Au(2)
2019 AISC/oz*
$807/oz Au
2P Reserves
2.2Moz @ 1.33 g/t Au(3)
Senegal
Côte d’Ivoire
Burkina FasoMali
Guinea
Sierra Leone
Liberia
Ghana
Benin
Niger
Togo
West African Birimian Greenstone Belt
Standalone
Massawa Project(4)
Stage
Development
Years 1-10 Average Production
203koz Au/year
Historical 2P Reserves
2.6Moz @ 3.94 g/t Au(5)
*Refer to Non-IFRS Performance Measures in the Appendix.
†Life of mine initial 5-year average of 132koz Au per year.
Refer to Endnotes (1), (2), (3), (4), (5), (7), (8), (9) and (10) in the Appendix.
5
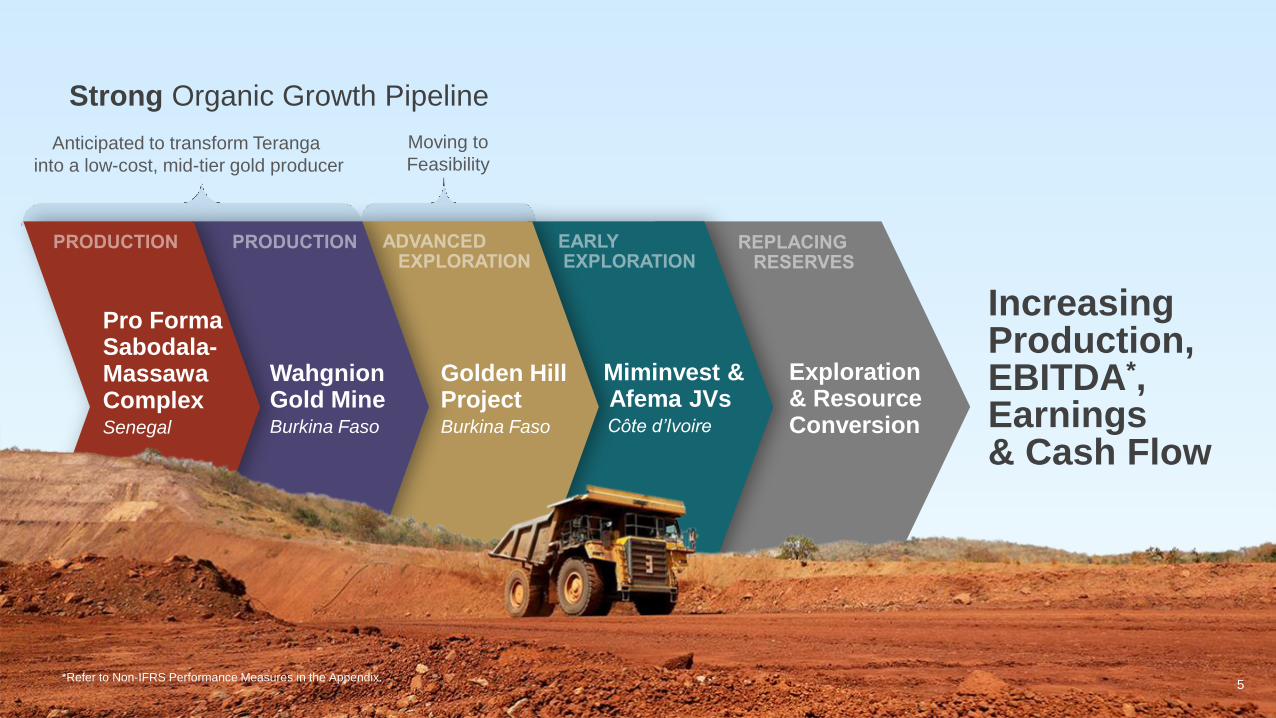
Pro FormaSabodala-MassawaComplexSenegal
WahgnionGold MineBurkina Faso
Golden HillProjectBurkina Faso
Miminvest &Afema JVsCôte d’Ivoire
Exploration & Resource Conversion
Increasing Production, EBITDA*, Earnings & Cash Flow
5
Anticipated to transform Teranga
into a low-cost, mid-tier gold producer
Moving to
Feasibility
Strong Organic Growth Pipeline
*Refer to Non-IFRS Performance Measures in the Appendix.

Teranga’s
Four
CSR Pillars
66

Top 20 Institutional Shareholders% of o/s
Shares
1 Tablo Corporation (David Mimran) 22.1
2 Ruffer LLP 5.9
3 Van Eck Associates 5.6
4 Dimensional Fund Advisors, L.P. 4.4
5 Konwave AG 1.7
6 Franklin Advisers, Inc. 1.7
7 Invesco Advisers 1.6
8 Heartland Advisors, Inc. 1.4
9 SSI Wealth Management 1.1
10 Stabilitas GmbH 0.9
11 IPConcept 0.9
12 Mackenzie Financial 0.9
13 AgaNola AG 0.8
14 British Columbia Investment Management 0.8
15 Earth Resource Investment Group 0.8
16 DWS Investment Management America 0.8
17 azValor Asset Management 0.7
18 AMG Fondsverwaltung AG 0.6
19 LSV Asset Management 0.5
20 Ethenea Independent Investors S.A. 0.5
Total shares held by top 20 shareholders 53%
7
Current Share Ownership and Price Performance
Source: Nasdaq IR Insight as at February 21, 2020
Analyst Coverage Rating Target Price (C$)
Canaccord Genuity Buy $12.00
Cormark Securities Top Pick $13.00
Eight Capital Buy $11.50
RBC Capital Markets Outperform $8.50
Average $11.25
The research firms listed above provide research on Teranga and its securities. The information, estimates, and recommendations of these analysts regarding Teranga’s performance are
theirs alone and do not represent that of Teranga and its management. Teranga does not by its reference above imply endorsement of or agree with such information.
Following the closing of the Massawa
acquisition expected in Q1 2020,
Barrick Gold is expected to become
Teranga’s second largest investor with a
pro forma ownership of 11.5%.
74%
41%
18%
Dec '18 Dec '19
TSX:TGZ GDXJ Index Gold Price
2019 Share Price Performance

Sabodala Gold OperationSenegal, West Africa
8

9
Masato
Mamasato
Kouroundi
Kerekounda
Kourouloulou
Golouma South
Koulouqwinde
Koutoniokollo
Kinemba East
Kobokoto
Goumbati
West
Maki
Medina Golouma
West
Golouma
North
Soukhoto Niakafiri
EastNiakafiri
West
Diadiako Gora
Sabodala Gold Mine (Open Pit)
Senegal, West AfricaPermitted mining license: 291 km2
*Refer to Non-IFRS Performance Measures in the Appendix
Refer to Endnotes (1),(2),(3),(10),(11) and (12) in the Appendix
2.2Moz2P Reserves
at 1.33 g/t Au(3)
3.7MozM&I Resources
at 1.52 g/t Au(3)Mine Life(1)
Sabodala: Largest Gold Producer in Senegal
Sabodala
13-Year
Life of Mine Summary(11) 5 Years2018-2022
Annual production(12) 213koz
All-in sustaining costs* $885/oz
Total free cash flow*(13) $230M
Strong 5-Year Profile with Potential to Increase Mine Life
Another Strong Year
2019 Guidance Actual
Production 215-230koz(2) 241koz(2)
All-in sustaining costs* $825-$900 $807/oz
Refer to Endnotes (1), (2), (3), (11), (12), and (13) in the Appendix.

Exceeded the Higher End of 2019 Production Guidance for
Fourth Consecutive Year(Koz Au)
10
17
131
214 207 212182
217233 245 241
2010 2011 2012 2013 2014 2015 2016 2017 2018 2019
Per Ounce Costs Beat Guidance
*Refer to Non-IFRS Performance Measures in the Appendix
+2.0Moz of Gold Produced at Sabodala Since IPO in December 2010
$/oz Au sold
2019
Actual Guidance
Cost of sales $1,015 $1,050 - $1,125
Total cash costs* (Sabodala only) $690 $725 - $775
All-in sustaining costs* $857 $900 - $975
Cash/(non-cash) inventory movements
and amortized advanced royalty costs ($50) ($75)
All-in sustaining costs (excluding
cash/(non-cash) inventory movements and
amortized advanced royalty costs)*
$807 $825 - $900

Sabodala + Massawa Gold ProjectSenegal, West Africa
11
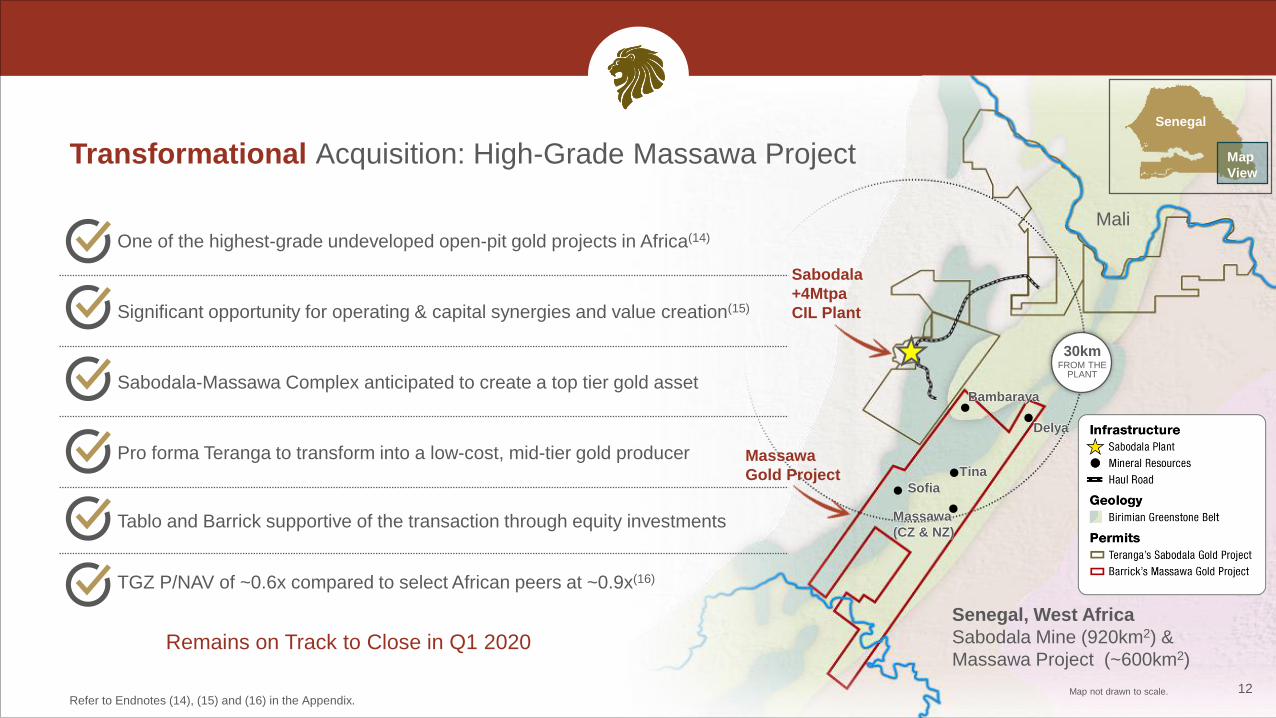
Transformational Acquisition: High-Grade Massawa Project
One of the highest-grade undeveloped open-pit gold projects in Africa(14)
Significant opportunity for operating & capital synergies and value creation(15)
Sabodala-Massawa Complex anticipated to create a top tier gold asset
Pro forma Teranga to transform into a low-cost, mid-tier gold producer
Tablo and Barrick supportive of the transaction through equity investments
TGZ P/NAV of ~0.6x compared to select African peers at ~0.9x(16)
Refer to Endnotes (14), (15) and (16) in the Appendix. 12
Massawa
Gold ProjectSofia
Tina
Delya
Sabodala
+4Mtpa
CIL Plant
Massawa
(CZ & NZ)
Senegal
Map
View
Mali
Bambaraya
30kmFROM THE
PLANT
Map not drawn to scale.
Senegal, West Africa
Sabodala Mine (920km2) &
Massawa Project (~600km2) Remains on Track to Close in Q1 2020

Compelling Acquisition Rationale
13
High-Grade
Massawa Project
Synergies &
Value Creation
Teranga Re-Rate
Opportunity
Building the Newest
Low-Cost, Mid-Tier
Gold Producer
▪ Proximity of Massawa project to Sabodala‘s mill and infrastructure (within 30 km) provides opportunity for capex/opex synergies(15)
– Reduces phase 1 and phase 2 capex for standalone mill and infrastructure
– Minimal infrastructure development anticipated to initiate mining at Massawa project and process free-milling ore at Sabodala
▪ Targeting near-term higher production and lower costs at pro forma Sabodala-Massawa complex with an optimized mine schedule
to be defined in technical studies
▪ Priority mining of higher-grade ore from Massawa project with first gold production targeted for H2 2020
▪ Pro forma Teranga anticipated to transition to a low-cost, mid-tier gold producer – as a result, cash margins and free cash
flows* are expected to increase commensurate with the increased production
▪ Teranga will continue to progress its attractive organic pipeline, including Golden Hill – an advanced exploration project
▪ Massawa project hosts one of Africa’s highest-grade undeveloped open-pit gold projects(14)
▪ Total historical mineral reserves of 2.6Moz @ 3.94 g/t Au(5)
▪ Robust economics on a standalone basis as per Barrick’s July 2019 Massawa Feasibility Study
▪ After-tax NPV5% of $677 million and IRR of 41% (at $1,400/oz gold price; $1,200/oz pit shell)(4)
▪ Exploration opportunity on large prospective land package
▪ Accelerates Teranga’s repositioning as a low-cost mid-tier West African gold producer
▪ The Massawa project’s historical mineral reserves base of 2.6Moz from 20.9Mt at 3.94 g/t(5) is expected to augment Sabodala’s
current mineral reserves base of 2.4Moz from 55.7Mt at 1.35 g/t(3)
▪ Current TGZ P/NAV of ~0.6x compared to select African peers at ~0.9x(16)*Refer to Non-IFRS Performance Measures in the Appendix.
Refer to Endnotes (3), (4), (5), (14), (15) and (16) in the Appendix.

14
Transaction Summary
Transaction
Consideration
Conditions
Timeline
Other Terms
▪ Teranga has entered into a definitive agreement pursuant to which it will acquire a 90% interest in the Massawa Gold
Project from a wholly-owned subsidiary of Barrick Gold Corporation (“Barrick”) and Compagnie Sénégalaise de
Transports Transatlantiques Afrique de l’Ouest SA (“CSTTAO”) (collectively, the “ Vendors”)
▪ Upfront consideration of $380 million in the form of $300 million in cash and $80 million in common shares
‒ $225 million will be funded by existing lender Taurus Funds Management, including $25 million to be provided by Barrick
‒ Balance to be funded through a private placement to the Vendors and a public offering
▪ Additional gold price-linked contingent payments of either nil, $25 million, $35 million, or $50 million due the later of the three years
following completion of Transaction or January 31, 2023(17)
▪ Tablo, controlled by Teranga director David Mimran, expected to invest $45 million to retain 21.2% ownership on
a pro forma basis
▪ Barrick expected to hold a 11.45% ownership in Teranga (pro forma basis) and is entitled to nominate one member to
the Company’s board of directors so long as it retains 10% equity ownership
▪ Closing is subject to receipt of the Massawa exploitation license, residual exploration license, and other consents from the Government
of Senegal including Teranga’s integration plans for the Sabodala-Massawa Complex
▪ Transaction is also conditional upon the closing of Teranga’s concurrent debt financing, prospectus financing and private placement
financing, each of which are also inter-conditional
▪ No shareholder vote required
▪ Transaction announced on December 10, 2019
▪ Bought deal equity offering closed on December 18, 2019
▪ Transaction expected to close in Q1 2020
Refer to Endnote (17) in the Appendix.

221 227
201
245 237
206
245
115
162175
250
50
100
150
200
250
300
Year 1 Year 2 Year 3 Year 4 Year 5 Year 6 Year 7 Year 8 Year 9 Year 10 Year 11
Robust Standalone Massawa Project Economics(4)
15
Standalone Life of Mine Production(100% basis)(4)
$1,200/oz Pit Shell Gold Price
Pit Shell Gold
Price
$1,200/oz
Economics(4)After-Tax NPV5% $M 421
After-Tax IRR % 28
Operational
Summary(4)
Total Ore Mined Mt 21
Average Grade g/t Au 3.94*
Contained Gold Moz 2.6
Total Tonnes Mined Mt 166
Average Strip Ratio w:o 6.9
Average Production Koz 201
Total Production Moz 2.1
Mine Life Years 10+
Cost
Summary(4)
Mining Cost $/t mined 3.55
Haulage Cost $/t milled 1.25
Plant Cost $/t milled 18.02
G&A Cost $/t milled 8.60
Capex
Summary(4)
Construction incl. of BIOX $M 413
BIOX Capital $M 80
Sustaining $M 16
Rehabilitation Cost $M 23
$421
$550
$677
$805
$1,200/oz $1,300/oz $1,400/oz $1,500/oz
Standalone Net Present Value (5%) Gold Price Sensitivity (100% basis)(4)
$1,200/oz Pit Shell Gold Price ($M)
*Ore reserve grade
Refer to Endnote (4) in the Appendix.

Anticipated Operating & Capital Synergies Support Teranga as Natural Acquirer of Massawa
16
Standalone
Massawa Operation(4)
(July 2019 Massawa Feasibility Study)
Standalone
Sabodala Operation(Year-to-date as at September 30, 2019*)
Infrastructure
Capex$333 million for all
phase 1 and phase 2 infrastructure
+4Mtpa mill & TSF
within ~30 km from Massawa
Mining$3.55/t mined (contractor; LOM)
+ $1.25/t ore haul to standalone mill$2.86/t mined*
Processing$18.02/t milled (LOM), including
BIOX$11.39/t milled*
G&A $8.60/t milled or ~$17 million/year $4.71/t milled*
Timing 2-year build; 10+ year mine life 13-year mine life
Anticipated
Synergies & Opportunities(15)
(relative to July 2019 Massawa Feasibility Study)
Reduces phase 1 and phase 2
capex for standalone mill and
infrastructure
Lower mine opex
Lower processing opex
Lower G&A opex
Accelerated production with higher
grade and longer mine life
*Year-to-date as at September 30, 2019.
Refer to Endnotes (4) and (15) in the Appendix.

Optimizing Mill Feed for Grade, Recovery & Cash Flow
17
Indicative Sabodala-Massawa Processed Ore Profile* (Mtpa)
2020E 2021E 2022E 2023E 2024E 2025E
Sabodala Ore 2P Reserves Contained Metal (Moz Au)
Annual Production (koz Au)
+4Mtpa Sabodala Current Mill Capacity
*Refer to Endnotes (2), (3), (4) and (5) in the Appendix. Subject to integrated technical studies. **Refer to Non-IFRS Performance Measures in the Appendix.
2P Reserve Grade (g/t Au)
1.35(3)
3.94(5)
0
0.5
1
1.5
2
2.5
3
3.5
4
4.5
Sabodala Massawa
Massawa Project Ore
Prioritize high-grade ore
for maximum
free cash flow**
2.4(3)
2.6(5)
2.3
2.35
2.4
2.45
2.5
2.55
2.6
2.65
Sabodala Massawa
241(2)
203(4)
Sabodala 2019 Massawa LOMAverage
(First 10 Years)
Intend to complete a pre-feasibility study to develop an optimized,
integrated mine plan within six months of transaction closing followed
by a definitive feasibility study

Majority of Reserves are Free-Milling;
BIOX a Proven Method for Refractory Ore
18
Massawa Feasibility Study July 2019: ~80% of Massawa Project
Ore Processed Through Whole Ore Leach Plant and ~20% Through
BIOX(5)
▪ Central Zone, North Zone and Delya contain refractory ore
▪ Massawa Feasibility Study envisioned BIOX addition to CIL plant
later in the mine life with $80 million capital cost(4)
▪ Teranga will evaluate opportunities to combine CIL/BIOX and
optimize blend and recovery
Well-Established Method for Processing Refractory Ore
▪ BIOX (biological oxidation) uses bacteria to oxidize sulphides in large
agitated tanks before treatment in a conventional plant
▪ Applied at 18 mine-sites worldwide since 1986 – Fosterville Mine has
one of the world's leading BIOX systems and has achieved record
recoveries (~98% recovery as at YTD Q3 2019)
▪ Testing, studies, and experts support BIOX at the Massawa project(4)
SOURCE: OUTOTEC.COM Refer to Endnote (4) in the Appendix
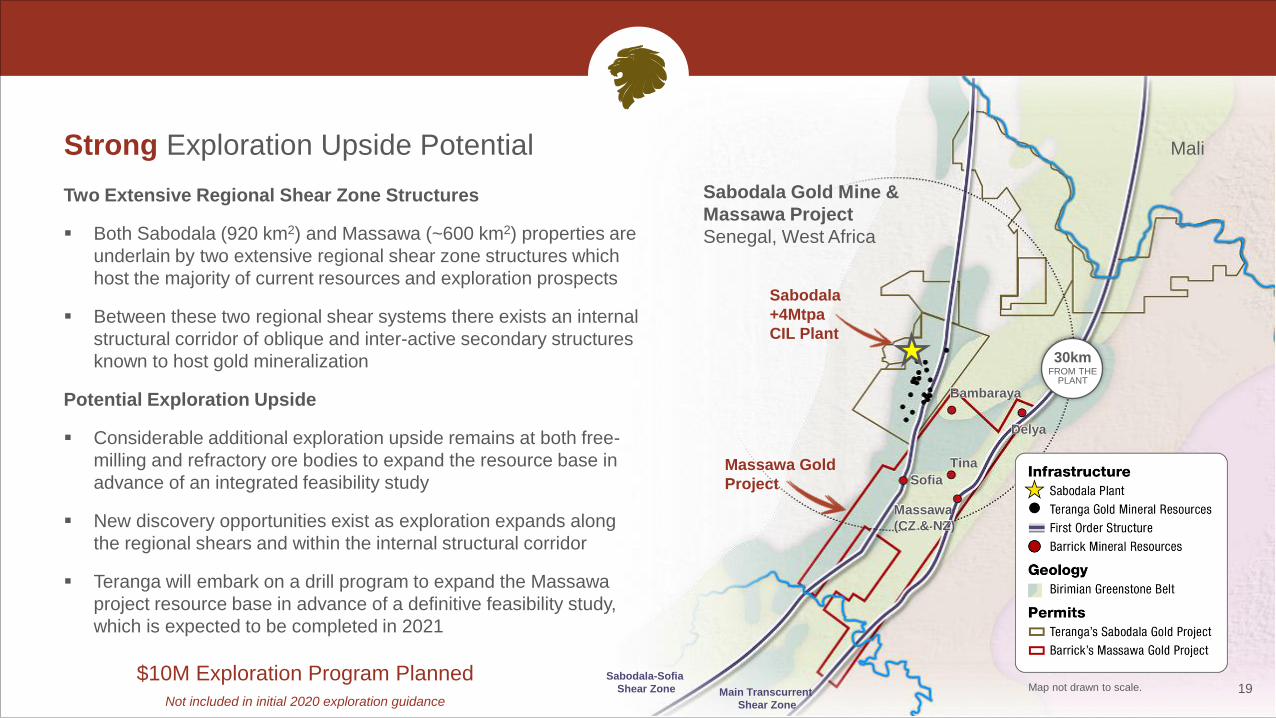
Strong Exploration Upside Potential
Two Extensive Regional Shear Zone Structures
▪ Both Sabodala (920 km2) and Massawa (~600 km2) properties are
underlain by two extensive regional shear zone structures which
host the majority of current resources and exploration prospects
▪ Between these two regional shear systems there exists an internal
structural corridor of oblique and inter-active secondary structures
known to host gold mineralization
Potential Exploration Upside
▪ Considerable additional exploration upside remains at both free-
milling and refractory ore bodies to expand the resource base in
advance of an integrated feasibility study
▪ New discovery opportunities exist as exploration expands along
the regional shears and within the internal structural corridor
▪ Teranga will embark on a drill program to expand the Massawa
project resource base in advance of a definitive feasibility study,
which is expected to be completed in 2021
19
Massawa Gold
Project
Tina
Bambaraya
Delya
Sabodala
+4Mtpa
CIL Plant
Mali
Sofia
Sabodala-Sofia
Shear Zone Main Transcurrent
Shear Zone
Massawa
(CZ & NZ)
30kmFROM THE
PLANT
Sabodala Gold Mine &
Massawa Project
Senegal, West Africa
Map not drawn to scale. $10M Exploration Program Planned
Not included in initial 2020 exploration guidance

Fully Funded Acquisition
20
Use of Funds ($M)
Massawa Transaction $380
Teranga Corporate $76
Total Use of Funds $456
Taurus
Debt
▪ $225 million acquisition facility amortizing over 3-year period ending Dec 31, 2022,
including $25 million to be provided by Barrick as a part of the lending syndicate
▪ 2.75% upfront fee and 7.85% annual interest paid quarterly in arrears
▪ Other terms: (i) 100% offtake rights on Massawa project production (subject to buyback
right); (ii) 4 million Teranga call rights*
Tablo
Equity
▪ Through the equity financing, $45 million invested by Tablo (Teranga's largest shareholder)
▪ Tablo will retain 21.2% ownership on a pro forma basis
Vendors Equity
& Contingent
Consideration
▪ Vendors to receive $80 million in Teranga common shares through the equity financing
▪ On a pro forma basis, Barrick will hold 11.45% of Teranga and CSTTAO will own 0.9%
▪ Barrick to nominate one Board member so long as it retains a 10% equity ownership
▪ Gold price-linked contingent payments due the later of the three years following completion
of Transaction and January 31, 2023(17)
Source of Funds ($M)
Taurus 3-Year Acquisition Facility $225
New Equity
Tablo Equity $45
Barrick Equity $80
Public Equity $106
Total Sources of Funds $456
Equity
Financing
▪ A total of $231 million in new equity (broker and private placement)
– $75 million in cash to be paid as part of the Massawa acquisition
– $80 million in Teranga common shares to the Vendors
– $76 million to be retained for deal costs, reserve development, exploration of Teranga’s
existing portfolio and working capital purposes
Completion of the acquisition facility, equity offering, and private
placement are all inter-conditional upon completion of the transaction.
*Strike price equal to 120% of the 5-day volume weighted average price of Teranga on the date of the announcement of the Transaction.
Refer to Endnote (17) in the Appendix

21
Relative Positioning Offers Opportunity for Potential Teranga Multiple Re-Rating
Price/Consensus Net Asset Value* (as of December 6, 2019) Price/Consensus 2020E CFPS* (as of December 6, 2019)
Source: Company materials, Capital IQ, equity research.
*Based on consensus equity research estimates. As at December 6, 2019
1.26x1.19x
1.00x0.96x
0.83x
0.72x0.69x 0.66x
0.60x
0.49x
B2Gold Centamin Perseus Endeavour GoldenStar
Resolute Roxgold Semafo Teranga Asanko
6.2x 6.1x5.8x
4.6x4.4x
3.6x 3.6x
3.0x2.8x 2.7x
Centamin Perseus B2Gold Endeavour GoldenStar
Resolute Asanko Roxgold Semafo Teranga
Status quo with multiples anticipated to be lower after factoring
in acquisition and further re-rate with synergies & value creating opportunities

$981$949 $943*
$916$871
$821 $800 $789 $779
$702
Perseus Asanko Teranga Resolute Centamin Golden Star Semafo Endeavour B2Gold Roxgold
8.24
3.94(5)
3.362.86
1.70 1.57 1.50 1.47 1.44 1.32 1.16
Roxgold Massawa SEMAFO Golden Star Endeavour Asanko Resolute Perseus Teranga B2Gold Centamin
Targeting Increased Reserves, Grade, Production & Cash Margin
22
2020E AISC ($/oz Au) Based on consensus equity research estimates.
Reserve Grade (g/t Au)
*Not to be interpreted as Teranga’s production and cost guidance for 2020.
**Net of 50% JV with Gold Fields.
Refer to Endnotes (4) and (5) in the Appendix.
Source: Company materials, Capital IQ, equity research.
Reserves - Contained Metal (Moz Au, 100% Basis)
2020E Production (koz Au) Based on consensus equity research estimates, except for Massawa.
1,020
751
511 492424
334* 315228 203(4)
134 119
0
200
400
600
800
1,000
1,200
1,400
1,600
B2Gold Endeavour Centamin Resolute Semafo Teranga Perseus Golden Star MassawaLife of Mine
AverageYears 1-10
Roxgold Asanko
8.7
7.36.7 6.4
4.03.3 2.9 2.6(5) 2.6
1.80.7
Endeavour Centamin Resolute B2Gold Teranga Perseus SEMAFO Massawa Asanko Golden Star Roxgold
**
Project
Project
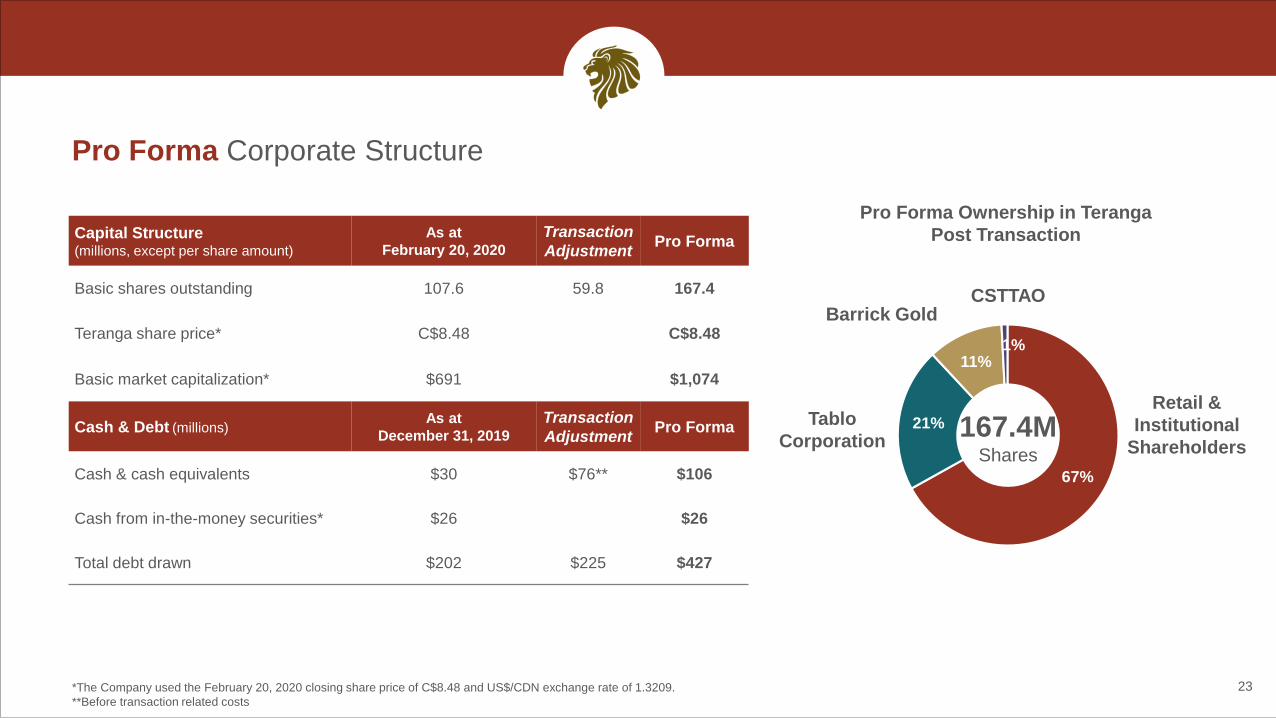
67%
21%
11%1%
Pro Forma Corporate Structure
23
Tablo
Corporation
CSTTAO
Pro Forma Ownership in Teranga
Post Transaction
Retail &
Institutional
Shareholders
Barrick Gold
167.4MShares
*The Company used the February 20, 2020 closing share price of C$8.48 and US$/CDN exchange rate of 1.3209.
**Before transaction related costs
Capital Structure (millions, except per share amount)
As at
February 20, 2020
Transaction
AdjustmentPro Forma
Basic shares outstanding 107.6 59.8 167.4
Teranga share price* C$8.48 C$8.48
Basic market capitalization* $691 $1,074
Cash & Debt (millions)As at
December 31, 2019
Transaction
AdjustmentPro Forma
Cash & cash equivalents $30 $76** $106
Cash from in-the-money securities* $26 $26
Total debt drawn $202 $225 $427

1. Tracking to Close Massawa Transaction in Q1 2020
Preliminary Integration Work Underway
• Sabodala’s technical and operating teams are working
on an optimized integration plan
• Pre-feasibility study for the combined mine plan in
progress and expected H2 2020
• Confirmatory metallurgical test-work to optimize the
blending of oxide ore at the plant has begun
• Initial detailed drilling program scheduled to begin
March 2020
Near-Term Targets
• Initiate mining at Sofia H2 2020
• Be in a position to process oxide ore from the Massawa
pit by mid-2021
24
Key Conditions To Closing
• Received formal consent to Teranga’s plans to
integrate Massawa into existing Sabodala mine as well
as a formal waiver by the Government of Senegal of its
equity participation
• Expect to satisfy the remaining conditions in the
coming weeks, which include the granting by the
Government of Senegal of an exploitation license and a
residual exploration license
WahgnionBurkina Faso, West Africa
25

Wahgnion: Teranga's Newest Gold Mine Off to a Great Start
26
*Refer to Non-IFRS Performance Measures in the Appendix.
**Pre-production capital costs of $240 million excludes $16 million in construction readiness
activities spent prior to major construction
Refer to Endnotes (6), (7), (8), (10), (11) and (18) in the Appendix
Mine Life(6)
1.6Moz2P Reserves
at 1.61 g/t Au(8)
2.4MozM&I Resources
at 1.59 g/t Au(8)
13-Year
Raul
Life of Mine Summary(11) Initial 5 Years2020-2024
Annual production(18) 132koz
All-in sustaining costs* $761/oz
Total free cash flow* $311M
Strong 5-Year Profile with Potential to Increase Mine Life
2019 Guidance Actual
Production 30-40koz 47koz(7)
All-in sustaining costs* $750-$825/oz $938/oz(10)
Commercial Production Achieved November 1, 2019
✓ 500 days worked without a lost time injury
✓ Completed two months ahead of the original schedule
✓ Completed approximately $15M below budget
✓ First gold pour achieved in August 2019
✓ Mill operating above nameplate capacity with no significant issues
✓ Continued focus on social responsibility activities, such as housing
and livelihood restoration programs

Multi-Year Drilling Program to Commence in 2020-2021
• ~12 regional drill-ready targets with the potential to become
resources and within trucking distance of mill
• Konatvogo: 2,000-metre NW-trending anomaly between
Fourkoura and Nogbele deposits. Up to 21.6 g/t Au from
altered shear-hosted quartz vein outcrops
• Bassongoro: 1,500-metre NNE-trending soil and auger
anomaly (up to 15g/t Au). Intersection of regional Nianka and
Fourkoura structures undrilled
Exploration Upside Potential
27
Raul
Samavogo
Nogbele
FourkouraStinger
Plant
Reserve Deposits
Exploration Targets
Wahgnion Gold Mine (Open-pit)
Burkina Faso, West AfricaPermitted mining license: 89 km2
Mali
Côte d’Ivoire
Kafina West
Hillside
Bagu Sud
Korindougou
Ouahiri
Sud
Raul
Kondandougoug
Konatvogo
Bazogo
Bassongoro
Samavogo North
MuddhiPetit Colline

Golden HillBurkina Faso, West Africa
28

Sources
¹ Press Release, SEMAFO (March 5, 2019)
² Press Release, Roxgold (July 11, 2019)
³ Annual Information Form, Endeavour Mining (March 26, 2019)
⁴ Press Release, Sarama Resources (September 4, 2019)
⁵ MD&A, Sarama Resources (August 27, 2019)6 MD&A, Sarama Resources (August 27, 2019)
M&I Resources are inclusive of P&P Reserves
Mana & Siou
M&I: 4.2Moz ¹
Houndé
M&I: 3.1 Moz ³
Yaramoko
M&I: 1.3Moz ²
Acacia JVs
South Houndé JV
Inferred: 2.1Moz ⁴
Interpreted Geology
Andesite
Basalt
Basin
Batholith
Chert
Granitoid
Tarkwaian
Houndé Belt Burkina Faso, West Africa
Teranga’s
Golden Hill ProjectMineral Resource: (9)
Indicated: 415koz @ 2.02 g/t Au
Inferred: 644koz @ 1.68 g/t Au
ACC
Holdings
Permits
ThreeBee
Project
M&I: 0.3Moz 6
Karankasso JV
M&I: 0.7Moz ⁵
Early-Stage Initial Resource Provides Solid
Base From Which to Grow Golden Hill
29
415,000 oz
at 2.02 g/t(9)
Indicated
644,000 oz
at 1.68 g/t(9)
Inferred
Highlights of Initial Resource
• Excellent along trend and to-depth continuity of gold
mineralization at all prospects drilled
• Reaffirms interpretations that each prospect offers
substantial upside for size expansion
For full details on Golden Hill, please visit www.terangagold.com
Refer to Endnote (9) in the Appendix
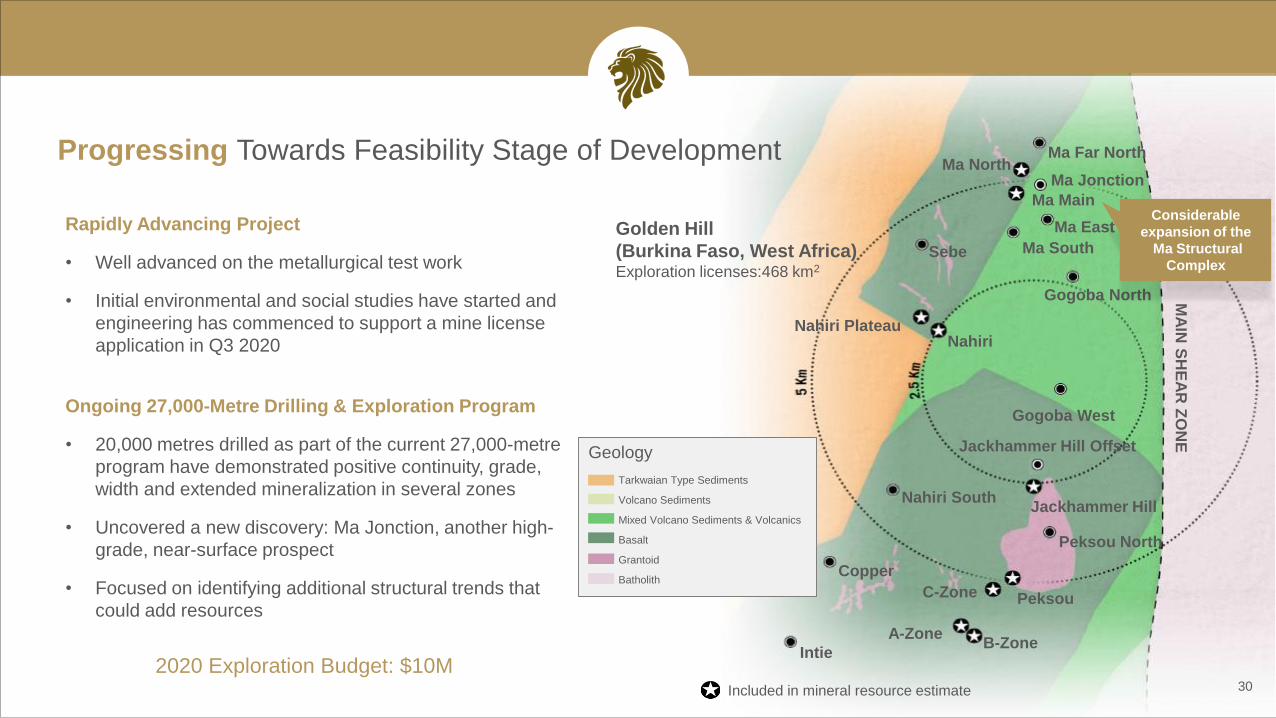
Progressing Towards Feasibility Stage of Development
30
Geology
Tarkwaian Type Sediments
Volcano Sediments
Mixed Volcano Sediments & Volcanics
Basalt
Grantoid
Batholith
Ma North
Golden Hill
(Burkina Faso, West Africa)Exploration licenses:468 km2
Ma Main
Ma East
Nahiri
Gogoba West
Nahiri Plateau
Jackhammer Hill
Peksou North
PeksouC-Zone
B-ZoneA-Zone
Ma Far North
Ma South
Gogoba North
Sebe
Nahiri South
Intie
Copper
MA
IN S
HE
AR
ZO
NE
Rapidly Advancing Project
• Well advanced on the metallurgical test work
• Initial environmental and social studies have started and
engineering has commenced to support a mine license
application in Q3 2020
Ongoing 27,000-Metre Drilling & Exploration Program
• 20,000 metres drilled as part of the current 27,000-metre
program have demonstrated positive continuity, grade,
width and extended mineralization in several zones
• Uncovered a new discovery: Ma Jonction, another high-
grade, near-surface prospect
• Focused on identifying additional structural trends that
could add resources
Included in mineral resource estimate
Ma Jonction
Jackhammer Hill Offset
2020 Exploration Budget: $10M
Considerable
expansion of the
Ma Structural
Complex

Miminvest & Afema Exploration OpportunitiesCôte d’Ivoire, West Africa
31

Côte d’Ivoire: Future Value Resides with Miminvest and Afema Early-Stage Opportunities
32
Agbaou
Ity
Yaouré
Tongon
Côte d’Ivoire
Guitry Sangaredougou
Bonikro
Dianra
AfemaCôte d’Ivoire represents more
than one-third of the West African
Birimian Greenstone Belt
Operating Gold Mine/ Development Project
Miminvest Exploration Properties
(100% earning, 3% NSR; JV formed June 2016)
• Guitry complex (includes Sangaredougou):
Highly prospective and potential district
• Dianra: Initial phase of exploration outlines
favourable follow-up targets
Afema Mine Joint Venture (51%, earning 70%; JV formed December 2017)
• Two well mineralized greenstone belts underlie
mine license and regional land package
• Five major shear structures crossing the
regional land package with a combined strike
length exceeding 140 km
3
Miminvest Permits
4
Afema Permits
Côte d'Ivoire
35%
Burkina Faso21%
Ghana19%
Guinea11%
Mali10%
Other4%
Sissingué
2020 Exploration Budget for Côte d’Ivoire: $6 to $8 million

High Priority Guitry District (including Sangaredougou)
• First-ever drilling program at Guitry consisted of a 68-hole,
3,320 metre air-core drilling program
• This program included a series of shallow, widely spaced,
multi-hole drill profiles designed to evaluate the central
1,000-metre strike extent within an extensive gold-in-soil
geochemical anomaly covering a 3 x 7 km area
• The most favourable results were:
– 24 metres grading 2.02 g/t Au (GUAC008)
– 20 metres grading 6.37 g/t Au (GUAC018)
– 4 metres grading 5.80 g/t Au (GUAC015)
– an additional +10 holes intersected 1.0-1.5 g/t over
lengths up to 10 metres
Tongon
Côte d’Ivoire
Sangaredougou
Operating Gold Mine/Development Project
Encouraging Early-Stage Results on Miminvest Permits
Guitry
Dianra
Afema
Sissingué
Agbaou
Ity
Yaouré
Bonikro
33

Numerous Structures Identified by Airborne Geophysical Survey of Afema
• Completed high-definition
airborne magnetic and
radiometric survey of both the
mine license and regional permits
• High quality survey data outlines
numerous fault zones, cross-
structures, lithologic contacts and
areas of folded stratigraphy on
mince license
• Compelling imagery worthy of
extensive follow-up
• Situated on two shear zones
extending down from Ghana
Afema Geophysical Survey: Reduced-to-Pole Magnetic Intensity
34
Ahafo
17 Moz
Newmont
3 Afema
Exploration
Permits
Afema
Mining Permit
Bibiani
7 Moz
Resolute
Chirano
5 Moz
Kinross
Edikan
6.6 Moz
Perseus
Bogoso/Prestea
18 Moz
Golden Star
Konogo
1.4 Moz
Signature Metals
Akyem
Newmont
Esaase
5.19 Moz
Obotan
5.5 Moz
Asanko
Obuasi 41 Moz
Anglo Gold Ashanti
Kubi 0.9 Moz
Asaute Gold Corporation
Damang 7.1 Moz
Goldfields
Tarkwa 24 Moz
Iduapriem
8.2 Moz
AngloGold Ashanti
Kumasi
Cape Coast
Sefwi-Bibiani
Gold Belt Asankrangwa
Gold BeltAshanti
Gold Belt
Winneba-Kibi
Gold Belt
Côte d’Ivoire Ghana
Senegal
Côte d’Ivoire
Burkina FasoMali
Guinea
Sierra Leone
Liberia
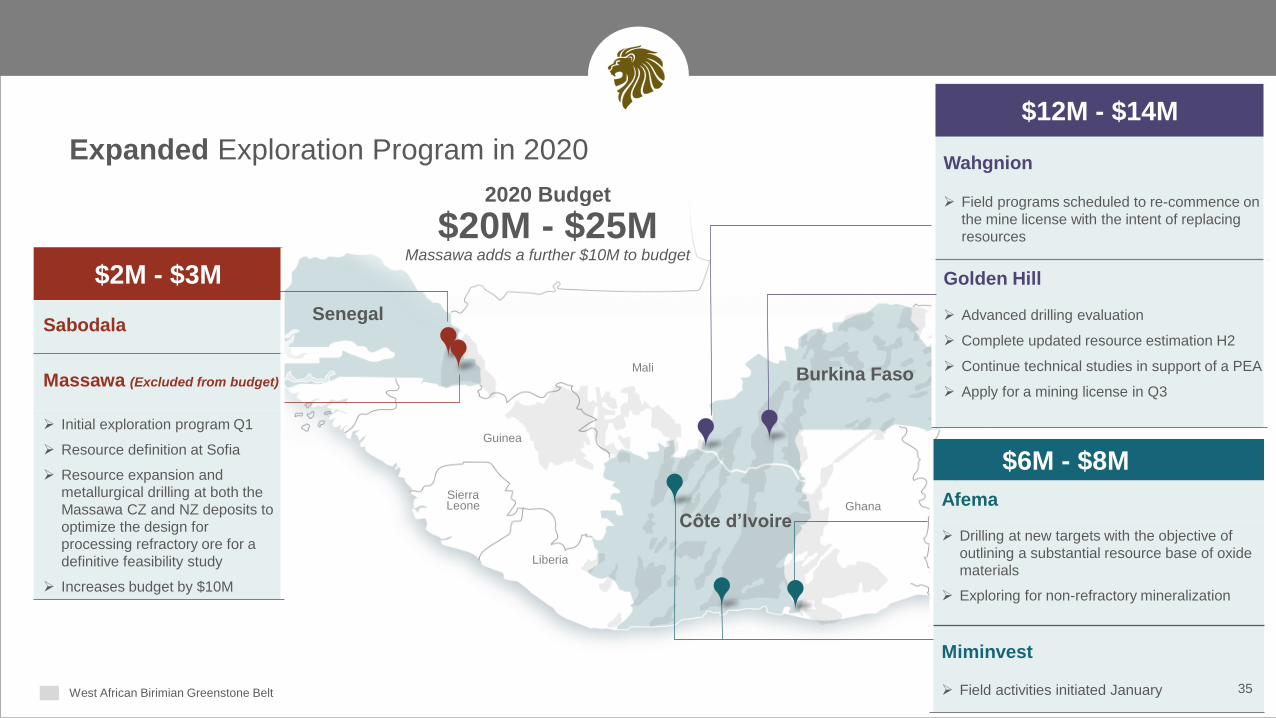
$2M - $3M
Sabodala
Massawa (Excluded from budget)
➢ Initial exploration program Q1
➢ Resource definition at Sofia
➢ Resource expansion and
metallurgical drilling at both the
Massawa CZ and NZ deposits to
optimize the design for
processing refractory ore for a
definitive feasibility study
➢ Increases budget by $10M
Ghana
Benin
Niger
West African Birimian Greenstone Belt
2020 Budget
$20M - $25MMassawa adds a further $10M to budget
Expanded Exploration Program in 2020
$6M - $8M
Afema
➢ Drilling at new targets with the objective of
outlining a substantial resource base of oxide
materials
➢ Exploring for non-refractory mineralization
Miminvest
➢ Field activities initiated January
$12M - $14M
Wahgnion
➢ Field programs scheduled to re-commence on
the mine license with the intent of replacing
resources
Golden Hill
➢ Advanced drilling evaluation
➢ Complete updated resource estimation H2
➢ Continue technical studies in support of a PEA
➢ Apply for a mining license in Q3
35

• Expect to produce
215,000 ounces of gold(12)
before addition of ore from
Massawa’s Sofia deposit
• Close the Massawa
acquisition, expected
Q1 2020
• Prepare for mining at
Massawa’s high-grade
Sofia deposit
• Release combined pre-
feasibility study within six
months of the transaction
close
• Commence exploring for
additional refractory and
oxide deposits
36
• $10M exploration
program to expand the
resource base
• Complete engineering,
environmental, and social
work to support the
preliminary economic
assessment required for
a mine license application
Q3 2020
• Increase the exploration
budget to $6M-$8M for the
Afema and Miminvest
exploration properties
Refer to Endnotes (12) and (15) in the Appendix
2020 Goals & Milestones: Repositioning Teranga
• Expect to produce
130,000-140,000 ounces
of gold(18) in first full year
of production
• Relaunch resource drilling
program on mine license
Appendix 1

2020 Guidance(24) (Twelve months ending December 31, 2020)
38Refer to Endnotes (19), (20), (21), (22), and (23) in the Appendix
Sabodala Wahgnion Consolidated
Operating
Results
Total mined (‘000t) 35,000 18,000-20,000 -
Ore Mined (‘000t) 5,000-6,000 2,500-3,000 -
Grade mined (g/t) 1.40-1.60 1.70-1.80 -
Strip ratio waste/ore 5.0-6.0 6.0-7.0 -
Ore milled (‘000t) 4,000-4,200 2,500-2,700 -
Head grade (g/t) 1.75-1.85 1.80-2.00 -
Recovery rate % 88-90 91-93 -
Gold produced(19) (oz) 215,000 130,000 – 140,000 345,000-355,000
Cost of sales per ounce sold $/oz sold 1,050-1,150 1,025-1,175 1,075-1,200
Total cash costs per ounce sold* $/oz sold 750-800 775-850 -
All-in sustaining costs(20)* $/oz sold 875-950 900-1,000 975–1,100
Non-cash inventory movements and amortized
advanced royalty costs(20)$/oz sold 25 (50) (25)
All-in sustaining costs (excluding non-cash
inventory movements and amortized
advanced royalty costs)(20)
$/oz sold 900-975 850-950 950–1,075
Mine Production Costs $ millions 160-170 90-100 -
Capital ExpendituresSustaining Capital (21) $ millions 15-20 15-20 -
Resettlement Capital $ millions 10-15 10-15 -
Corporate and Other
Corporate Administration Expense $ millions - - 16-17
Share-Based Compensation Expense(22) $ millions - - ~8
Regional Administration Costs $ millions - - ~6
Community Social Responsibility $ millions - - 9-10
Exploration and Evaluation (23) $ millions - - 20-25
*Refer to Non-IFRS Performance Measures in the Appendix

39
Executive Team
Richard Young, CPA
President & CEO
25+ years’ experience in gold
mining including 13 years at Barrick
Gold including finance and
corporate development
Paul Chawrun, P.Eng, MBA
Chief Operating Officer
25+ years’ experience in mining
including operations and
development projects for Fording
Coal, Suncor, and Detour Gold
Navin Dyal, CPA
SVP & Chief Financial Officer
13 years’ experience in mining including
7 years at Barrick Gold as Head of
Finance in copper business unit
David Savarie, LL.B
SVP, General Counsel,
Corporate Affairs & People
11 years’ corporate counsel experience
in mining including Deputy General
Counsel and Corporate Secretary of
Gabriel Resources
Aziz Sy, P.Eng, M.Sc., MBA
Regional Manager, West Africa
17+ years’ experience in managing
gold exploration projects, including
his work as Vice President Senegal
Operations for the Oromin Joint
Venture Group until its acquisition in
2014 by Teranga Gold
David Mallo, B.Sc. Geology
VP, Exploration
35+ years’ mineral exploration in project
evaluation and program management,
playing an integral role in acquisition,
discovery, and exploration of world-class
deposits including Eskay Creek and
Cobre Panama
Leily Omoumi, MBA
VP, Corporate Development
15+ years’ experience in the mining
and financial services industries,
including buy-side and sell-side
analyst at two major Canadian banks
and at Hatch in a technical capacity
Nancy Lee, MA
VP, Human Resources
20 years’ experience in human
resources with a focus on talent
development across industries in
Canada, US and Asia, including
Director, Global Talent
Management at Manulife Financial
Chantal Da Silva, J.D., LL.L., BA
VP, Legal Affairs
15 years’ experience as a solicitor and
corporate counsel advising on global
finance transactions, M&A and
commercial matters in natural
resources and financial services
Gwennael Guillen
VP, Corporate Social Responsibility
25 years’ experience in health,
safety, environment and community
relations, including 12 years on
mining projects in South America and
West Africa
Trish Moran, BBM , PPA
VP, Investor Relations &
Corporate Communications
25+ years’ experience in investor
relations and communications, including
the mining and financial services
industries

40
Teranga Board of Directors
Alan Hill, M.Eng
Chairman
35+ years experience in
mining including 20 years at
Barrick Gold in project
evaluation and development
Christopher Lattanzi, B.Eng
Director
30 years experience in mining
property valuation, scoping, feasibility
studies and project monitoring on a
global basis. Founder of Micon
International
Richard Young, CPA
President & CEO
25+ years experience in gold
mining including 13 years at
Barrick Gold in finance and
corporate development
Jendayi Frazer, Ph.D.
Director
17 years experience in key roles
supporting initiatives and policies
to build Africa’s equity and commodity
markets. First woman U.S. Ambassador
to South Africa
William Biggar, MA, CPA
Director
25+ years experience in senior
executive positions in investment,
mining and real estate including
Barrick Gold and Merrill Lynch
Edward Goldenberg, MA, BCl
Director
Distinguished career in policy including
10 years as Senior Policy Advisor to the
Prime Minister of Canada and the Prime
Minister's Chief of Staff in 2003. Honourary
Doctorate of Laws from McGill University
David Mimran
Director & Teranga’s Largest Shareholder
CEO of Grands Moulins d’Abidjan and
Grands Moulins de Dakar, among the
largest producers of agri-food in West
Africa. Special Advisor to the Government
of the Republic of Côte d'Ivoire
Alan Thomas, CPA
Director
30+ years mining and energy
industry experience in senior
financial and director roles including
6 years as VP and CFO of ShawCor
and 11 years as CFO of Noranda
Frank Wheatley, LL.B
Director
30+ years mining industry experience as
director, senior officer and legal counsel.
Extensive experience in public financing,
project debt financing, permitting of large-
scale mining projects and strategic M&A
Pending close of
Massawa transaction
and Barrick’s retained
ownership

41
Non-IFRS Performance Measures
The Company provides some non-IFRS financial measures as supplementary information that
management believes may be useful to investors to explain the Company’s financial results.
Beginning in the second quarter of 2013, we adopted an “all-in sustaining costs” measure
consistent with the guidance issued by the World Gold Council (“WGC”) on June 27, 2013, of
which Teranga became a member on November 27, 2018. The Company believes that the use
of all-in sustaining costs is helpful to analysts, investors and other stakeholders of the Company
in assessing its operating performance, its ability to generate free cash flow from current
operations and its overall value. This measure is helpful to governments and local communities
in understanding the economics of gold mining. The “all-in sustaining costs” is an extension of
existing “cash cost” metrics and incorporate costs related to sustaining production.
“Total cash cost per ounce sold” is a common financial performance measure in the gold
mining industry but has no standard meaning under IFRS. The Company reports total cash
costs on a sales basis. We believe that, in addition to conventional measures prepared in
accordance with IFRS, certain investors use this information to evaluate the Company’s
performance and ability to generate cash flow. Accordingly, it is intended to provide additional
information and should not be considered in isolation or as a substitute for measures of
performance prepared in accordance with IFRS. The measure, along with sales, is considered
to be a key indicator of a Company’s ability to generate operating profits and cash flow from its
mining operations.
Total cash costs figures are calculated in accordance with a standard developed by The Gold
Institute, which was a worldwide association of suppliers of gold and gold products and
included leading North American gold producers. The Gold Institute ceased operations in
2002, but the standard is considered the accepted standard of reporting cash cost of production
in North America. Adoption of the standard is voluntary and the cost measures presented may
not be comparable to other similarly titled measure of other companies.
The WGC definition of all-in sustaining costs seeks to extend the definition of total cash costs
by adding corporate general and administrative costs, reclamation and remediation costs
(including accretion and amortization), exploration and study costs (capital and expensed),
capitalized stripping costs and sustaining capital expenditures and represents the total costs of
producing gold from current operations. All-in sustaining costs exclude income tax payments,
interest costs, costs related to business acquisitions and items needed to normalize profits.
Consequently, this measure is not representative of all of the Company’s cash expenditures. In
addition, the calculation of all-in sustaining costs and all-in costs does not include depreciation
expense as it does not reflect the impact of expenditures incurred in prior periods. Therefore, it
is not indicative of the Company’s overall profitability.
The Company also expands upon the WGC definition of all-in sustaining costs by presenting an
additional measure of “All-in sustaining costs (excluding cash/(non-cash) inventory movements
and amortized advanced royalty costs)”. This measure excludes cash and non-cash inventory
movements and amortized advanced royalty costs which management does not believe to be
true cash costs and are not fully indicative of performance for the period.
“Total cash costs per ounce”, “all-in sustaining costs per ounce” and “all-in sustaining costs
(excluding cash/(non-cash) inventory movements and amortized advanced royalty costs) per
ounce” are intended to provide additional information only and do not have any standardized
definition under IFRS and should not be considered in isolation or as a substitute for measures
of performance prepared in accordance with IFRS. The measures are not necessarily indicative
of operating profit or cash flow from operations as determined under IFRS. Other companies
may calculate these measures differently. The following tables reconcile the most directly
comparable IFRS measure to these non-IFRS measures.
“Average realized price” is a financial measure with no standard meaning under IFRS.
Management uses this measure to better understand the price realized in each reporting period
for gold and silver sales. Average realized price is calculated on revenue and ounces sold to all
customers, except Franco-Nevada, as gold ounces sold to Franco-Nevada is recognized in
revenue at 20 percent of the prevailing gold spot price on the date of delivery and 80 percent at
$1,250 per ounce. The average realized price is intended to provide additional information only
and does not have any standardized definition under IFRS; it should not be considered in
isolation or as a substitute for measures of performance prepared in accordance with IFRS.
Other companies may calculate this measure differently.
EBITDA is a non-IFRS financial measure, which excludes income tax and related expenses,
finance costs (including accretion expense), interest income and depreciation and amortization
from net (loss)/profit for the year. In 2019, Teranga amended the definition of EBITDA to
exclude accretion expense to improve comparability of this non-IFRS financial measure with its
peers. The comparative 2018 EBITDA has been restated to conform to the new presentation.
EBITDA is intended to provide additional information to investors and analysts and do not have
any standardized definition under IFRS and should not be considered in isolation or as a
substitute for measures of performance prepared in accordance with IFRS. Management
believes that EBITDA is a valuable indicator of our ability to generate liquidity by producing
operating cash flow to: fund working capital needs, service debt obligations and fund capital
expenditures.
Beginning second quarter 2019, the Company adopted adjusted EBITDA as a new non-IFRS
financial measure. Management believes that adjusted EBITDA is a valuable indicator of our
ability to generate liquidity by producing operating cash flow to: fund working capital needs,
service debt obligations and fund capital expenditures, after adjusting for factors not reflective of
the underlying performance of the Company. Adjusted EBITDA is intended to provide additional
information to investors and analysts and does not have any standardized definition under IFRS
and should not be considered in isolation or as a substitute for measures of performance
prepared in accordance with IFRS. The Company calculates adjusted EBITDA as EBITDA
adjusted to exclude unrealized and realized foreign exchange gains and losses, gains and
losses on derivative instruments, non-cash fair value changes, impairment provisions and
reversals thereof, and other unusual or non-recurring items.
“Free cash flow” is a non-IFRS financial measure. The Company calculates free cash flow as net cash
flow provided by operating activities less sustaining capital expenditures. The Company believes this to be a
useful indicator of our ability to generate cash for growth initiatives. Other companies may calculate this
measure differently.
"Adjusted net (loss)/profit attributable to shareholders” and “adjusted basic (loss)/earnings per
share” are financial measures with no standard meaning under IFRS. These non-IFRS financial measures
are used by management and investors to measure the underlying operating performance of the Company.
Presenting these measures from period to period is expected to help management and investors evaluate
earnings trends more readily in comparison with results from prior periods.
The Company calculates “adjusted net (loss)/profit attributable to shareholders” as net (loss)/profit for the
year attributable to shareholders adjusted to exclude specific items that are significant, but not reflective of
the underlying operations of the Company, including: the impact of unrealized and realized foreign exchange
gains and losses, gains and losses on derivative instruments, accretion expense on long-term obligations,
the impact of foreign exchange movements on deferred taxes, non-cash fair value changes, impairment
provisions and reversals thereof, and other unusual or non-recurring items.
“Adjusted basic (loss)/earnings per share” is calculated using the weighted average number of shares
outstanding under the basic method of earnings per share as determined under IFRS.
For more information and the reconciliation of these measures, please refer to the Company’s latest
management’s discussion and analysis accessible on the Company’s website at
www.terangagold.com.
Qualified Persons Statement (Teranga)
42
The technical information contained in this document
relating to the Sabodala and Wahgnion open pit mineral
reserve estimates is based on, and fairly represents,
information compiled by Mr. Stephen Ling, P. Eng who is a
member of the Professional Engineers Ontario. Mr. Ling is
a full time employee of Teranga and is not "independent"
within the meaning of NI 43-101. Mr. Ling has sufficient
experience which is relevant to the style of mineralisation
and type of deposit under consideration and to the activity
which he is undertaking to qualify as a "Qualified Person"
under NI 43-101 Standards of Disclosure for Mineral
Projects. Mr. Ling has consented to the inclusion in this
document of the matters based on his compiled information
in the form and context in which it appears in this document.
The technical information contained in this document
relating to Sabodala, Wahgnion, and Golden Hill’s mineral
resource estimates is based on, and fairly represents,
information compiled by Ms. Patti Nakai-Lajoie. Ms. Nakai-
Lajoie, P. Geo., is a Member of the Association of
Professional Geoscientists of Ontario. Ms. Nakai-Lajoie is a
full time employee of Teranga and is not "independent"
within the meaning of NI 43-101. Ms. Nakai-Lajoie has
sufficient experience which is relevant to the style of
mineralisation and type of deposit under consideration and
to the activity which she is undertaking to qualify as a
"Qualified Person" under NI 43-101 Standards of Disclosure
for Mineral Projects. Ms. Nakai-Lajoie has consented to the
inclusion in this document of the matters based on her
compiled information in the form and context in which it
appears in this document.
The technical information contained in this document
relating to the Sabodala underground ore reserves
estimates is based on, and fairly represents, information
compiled by Jeff Sepp, P. Eng., of Roscoe Postle
Associates Inc. (“RPA”), who is a member of the
Professional Engineers Ontario. Mr. Sepp is “independent”
within the meaning of NI 43-101. Mr. Sepp has sufficient
experience which is relevant to the style of mineralisation
and type of deposit under consideration and to the activity
he is undertaking to qualify as a “Qualified Person” under NI
43-101 Standards of Disclosure for Mineral Projects. Mr.
Sepp has consented to the inclusion in this document of the
matters based on his compiled information in the form and
context in which it appears in this document.
Teranga's disclosure of mineral reserve and mineral
resource information is governed by NI 43-101 under the
guidelines set out in the Canadian Institute of Mining,
Metallurgy and Petroleum (the "CIM") Standards on Mineral
Resources and Mineral Reserves, adopted by the CIM
Council, as may be amended from time to time by the CIM
("CIM Standards"). There can be no assurance that those
portions of mineral resources that are not mineral reserves
will ultimately be converted into mineral reserves.
Teranga confirms that it is not aware of any new information
or data that materially affects the information included in the
technical reports for the Sabodala Project (August 30, 2017)
and the Wahgnion Project (October 31, 2018) pursuant
to National Instrument 43-101 - Standards of Disclosure for
Mineral Projects (the “Technical Reports”), or third quarter
2019 results, market announcements and, in the case of
estimates of Mineral Resources, that all material
assumptions and technical parameters underpinning the
estimates in the relevant market announcements
concerning the Technical Reports continue to apply and
have not materially changed.

Appendix 2
Standalone Massawa Project
44
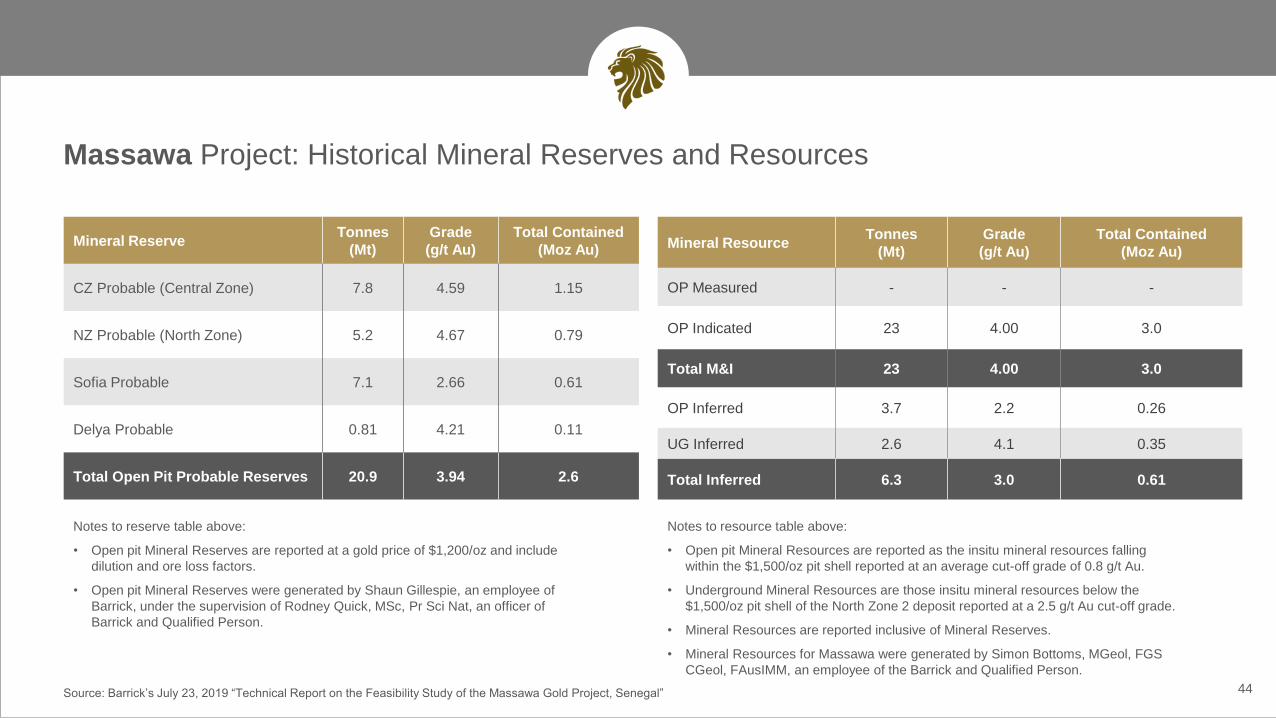
Massawa Project: Historical Mineral Reserves and Resources
Mineral ResourceTonnes
(Mt)
Grade
(g/t Au)
Total Contained
(Moz Au)
OP Measured - - -
OP Indicated 23 4.00 3.0
Total M&I 23 4.00 3.0
OP Inferred 3.7 2.2 0.26
UG Inferred 2.6 4.1 0.35
Total Inferred 6.3 3.0 0.61
Mineral ReserveTonnes
(Mt)
Grade
(g/t Au)
Total Contained
(Moz Au)
CZ Probable (Central Zone) 7.8 4.59 1.15
NZ Probable (North Zone) 5.2 4.67 0.79
Sofia Probable 7.1 2.66 0.61
Delya Probable 0.81 4.21 0.11
Total Open Pit Probable Reserves 20.9 3.94 2.6
Notes to resource table above:
• Open pit Mineral Resources are reported as the insitu mineral resources falling
within the $1,500/oz pit shell reported at an average cut-off grade of 0.8 g/t Au.
• Underground Mineral Resources are those insitu mineral resources below the
$1,500/oz pit shell of the North Zone 2 deposit reported at a 2.5 g/t Au cut-off grade.
• Mineral Resources are reported inclusive of Mineral Reserves.
• Mineral Resources for Massawa were generated by Simon Bottoms, MGeol, FGS
CGeol, FAusIMM, an employee of the Barrick and Qualified Person.
Source: Barrick’s July 23, 2019 “Technical Report on the Feasibility Study of the Massawa Gold Project, Senegal”
Notes to reserve table above:
• Open pit Mineral Reserves are reported at a gold price of $1,200/oz and include
dilution and ore loss factors.
• Open pit Mineral Reserves were generated by Shaun Gillespie, an employee of
Barrick, under the supervision of Rodney Quick, MSc, Pr Sci Nat, an officer of
Barrick and Qualified Person.

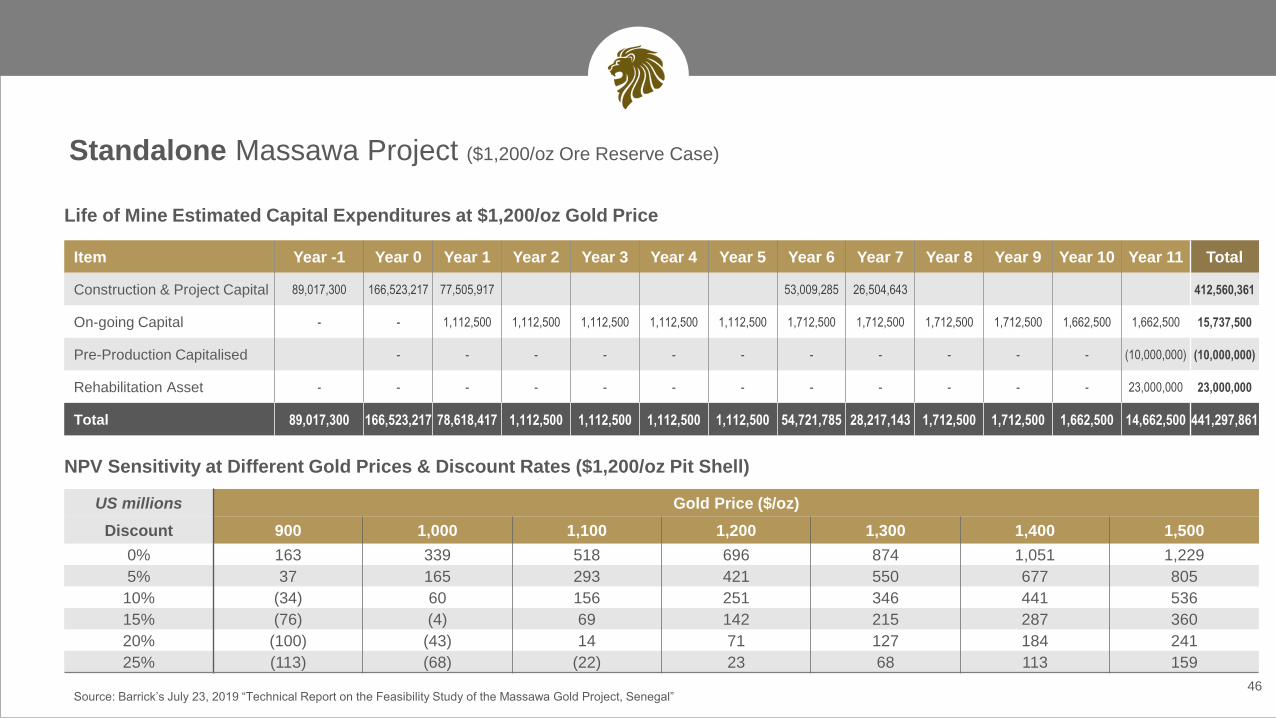
Standalone Massawa Project ($1,200/oz Ore Reserve Case)
45
Source: Barrick’s July 23, 2019 “Technical Report on the Feasibility Study of the Massawa Gold Project, Senegal”
Year Yr-2 Yr-1 Yr 0 Yr 1 Yr 2 Yr 3 Yr 4 Yr 5 Yr 6 Yr 7 Yr 8 Yr 9 Yr 10 Total
Production (koz) - - 221 227 201 245 237 206 245 115 162 175 25 2,060
CENTRAL ZONE NORTH ZONE SOFIA MAIN SOFIA NORTH DELYA
Rock Type WOLBIOX-
100% CZ
BIOX –
25%CZ
75%NZ
WOL
100% NZ
BIOX
100% NZWOL WOL
WOL
100% Delya
BIOX
100% Delya
BIOX 20%
Delya
80%NZ
Oxide ($/t milled) 11.29 N/A N/A 11.60 N/A 11.17 12.13 12.01 N/A N/A
Oxide Trans ($/t milled) 14.35 N/A N/A 13.41 N/A 12.95 12.84 13.76 N/A N/A
Reduced Trans ($/t milled) 15.73 43.09 26.88 14.57 25.79 14.31 13.56 13.93 48.69 29.70
Fresh ($/t milled) 17.40 43.09 26.88 15.74 25.79 15.68 14.30 15.62 48.69 29.70
Capital Cost Estimate per PhaseDescription PHASE 1 PHASE 2 PHASE 3 TOTAL
Direct Field Cost 91,278,343 10,933,099 47,559,136 149,770,578
Indirect Field Costs 21,023,557 4,253,992 12,309,577 187,357,703
Home Office Costs 12,488,244 1,456,895 5,538,306 19,483,445
Total Plant Cost 124,790,144 16,643,986 65,407,019 206,841,148
Other Costs 147,803,128 181,009 7,541,511 155,525,648
Mining Costs 37,102,894 6,525,273 6,565,398 50,193,565
Total Construction Capital 309,696,166 23,350,267 79,513,928 412,560,361
Production Forecast
Process Operating Cost Estimate Summary
Standalone Massawa Project ($1,200/oz Ore Reserve Case)
46Source: Barrick’s July 23, 2019 “Technical Report on the Feasibility Study of the Massawa Gold Project, Senegal”
Life of Mine Estimated Capital Expenditures at $1,200/oz Gold Price
Item Year -1 Year 0 Year 1 Year 2 Year 3 Year 4 Year 5 Year 6 Year 7 Year 8 Year 9 Year 10 Year 11 Total
Construction & Project Capital 89,017,300 166,523,217 77,505,917 53,009,285 26,504,643 412,560,361
On-going Capital - - 1,112,500 1,112,500 1,112,500 1,112,500 1,112,500 1,712,500 1,712,500 1,712,500 1,712,500 1,662,500 1,662,500 15,737,500
Pre-Production Capitalised - - - - - - - - - - - (10,000,000) (10,000,000)
Rehabilitation Asset - - - - - - - - - - - - 23,000,000 23,000,000
Total 89,017,300 166,523,217 78,618,417 1,112,500 1,112,500 1,112,500 1,112,500 54,721,785 28,217,143 1,712,500 1,712,500 1,662,500 14,662,500 441,297,861
NPV Sensitivity at Different Gold Prices & Discount Rates ($1,200/oz Pit Shell)
US millions Gold Price ($/oz)
Discount 900 1,000 1,100 1,200 1,300 1,400 1,500
0% 163 339 518 696 874 1,051 1,229
5% 37 165 293 421 550 677 805
10% (34) 60 156 251 346 441 536
15% (76) (4) 69 142 215 287 360
20% (100) (43) 14 71 127 184 241
25% (113) (68) (22) 23 68 113 159

Qualified Persons Statement (Barrick)
47
A technical report to support the feasibility study for
the Massawa gold project has been prepared in
accordance with National Instrument 43-101. The
report is dated as of 23 July 2019 and is filed on
SEDAR and available at www.barrick.com. Refer to
the Massawa Feasibility Study for further information
with respect to the key assumptions, parameters and
risks associated with the results of the feasibility
study, the mineral reserve estimates included therein
and other technical information. The Massawa
Feasibility Study was filed by Barrick on a voluntary
basis, and not as a result of a requirement of National
Instrument 43-101.
The following QPs, as that term is defined in National
Instrument 43-101 – Standards of Disclosure for
Mineral Projects, have prepared or supervised the
preparation of their relevant portions of the technical
information described above and the related Massawa
Feasibility Study on file, and have consented to the
inclusion of such information in this document:
• Rodney Quick, MSc, Pr Sci Nat; Mineral
Resource Management and Evaluation Executive
of Barrick;
• Simon Bottoms, MGeol, FGS CGeol, FAusIMM;
Senior Vice President, Africa & Middle East
Mineral Resource Manager of Barrick;
• Richard Quarmby, BSc (Chemical Engineering),
Pr Eng, CEng, MSAIChE, MIMMM; Africa &
Middle East Capital Projects Metallurgist of
Barrick; and
• Graham E. Trusler, MSc, Pr Eng, MIChE,
MSAIChE; CEO Digby Wells Environmental
(Jersey) Limited.

Endnotes
48
1. Based on the NI 43-101 Technical Report on the Sabodala Gold Project dated August 30, 2017 available on the Company’s website at www.terangagold.com and SEDAR at www.sedar.com.
2. At Sabodala, the Company produced a total of 241,276 ounces of gold in 2019, exceeding its 2019 production guidance of 215,000-230,000 ounces.
3. Sabodala’s Mineral Reserve estimate as at December 31, 2019. For more information regarding Sabodala’s mineral reserves and resources and related notes, please refer to management’s discussion and analysis for the year
ended December 31, 2019 to be filed February 2020 and to be available on the Company’s website at www.terangagold.com and SEDAR at www.sedar.com.
4. Based on Barrick Gold’s NI 43-101 Technical Report on the Feasibility Study of the Massawa Gold Project dated July 23, 2019 (the “Massawa Feasibility Study”) available at www.barrick.com and on SEDAR at www.sedar.com.
5. The Massawa project’s standalone historical mineral reserve estimate as at December 31, 2018 at a $1,200 gold price pit shell mineral reserves. For more information regarding the Massawa project’s ore reserve and mineral
resource estimates and related notes, please refer to the Massawa Feasibility Study available at www.barrick.com and on SEDAR at www.sedar.com.
6. Based on Teranga’s amended NI 43-101 Technical Report on the Wahgnion Gold Operations dated July 31, 2019 (the “Wahgnion Technical Report”) available on the Company’s website at www.terangagold.com and SEDAR at
www.sedar.com.
7. At Wahgnion, the Company produced a total of 47,492 ounces of gold in 2019, exceeding its production guidance of 30,000-40,000 ounces.
8. Wahgnion’s Mineral Reserve and Mineral Resource estimates as at December 31, 2019. Mineral Reserves are estimated using a gold price of $1,250 per ounce. Mineral Resources are estimated using a long-term gold price of
$1,500 per ounce, adjusted to match existing industry standards. For more information regarding Wahgnion’s Mineral Reserves and Resources and related notes, please refer management’s discussion and analysis for the year
ended December 31, 2019 filed February 2020 and to be available on the Company’s website at www.terangagold.com and SEDAR at www.sedar.com.
9. Golden Hill’s Mineral Resource estimate as at November 30, 2018. For more information regarding Golden Hill’s Mineral Resource and related notes, please refer to the press release dated February 21, 2019 available on the
Company’s website at www.terangagold.com and SEDAR at www.sedar.com.
10. Cost information only include results from the period after achieving commercial production at Wahgnion (November 1, 2019 to December 31, 2019).
11. Life of mine assumptions include: Gold Price $1,250 per ounce; Heavy Fuel Oil (HFO): Wahgnion - $0.59 per litre; Sabodala - $0.46 per litre; Light Fuel Oil (LFO): Wahgnion - $1.04 per litre ($0.88 per litre during construction
period); Sabodala - $0.81 per litre; Euro to USD Exchange Rate: $1.10.
12. This production target is based on proven and probable reserves only from Teranga’s Sabodala Project as at December 31, 2019. For more information regarding Sabodala’s Mineral Reserves and Resources and related notes,
please refer to management’s discussion and analysis for the year ended December 31, 2019 filed to be February 2020 and to be available on the Company’s website at www.terangagold.com and SEDAR at www.sedar.com.
49
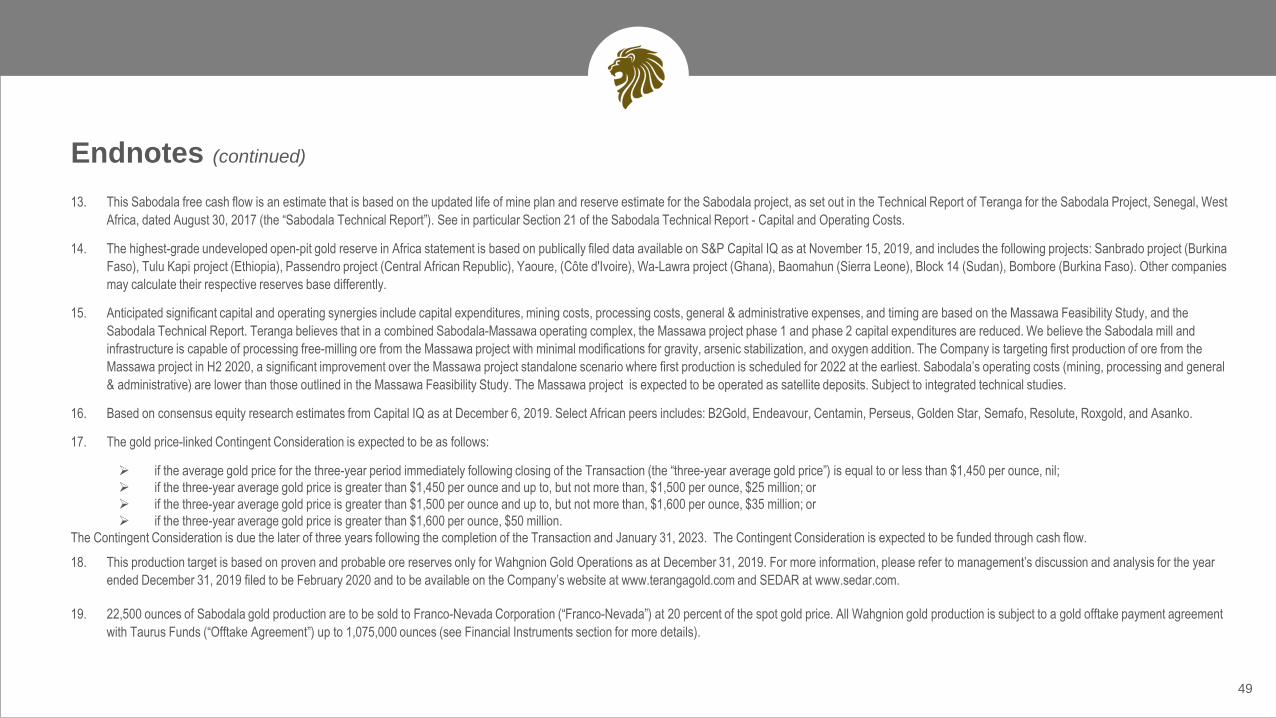
13. This Sabodala free cash flow is an estimate that is based on the updated life of mine plan and reserve estimate for the Sabodala project, as set out in the Technical Report of Teranga for the Sabodala Project, Senegal, West
Africa, dated August 30, 2017 (the “Sabodala Technical Report”). See in particular Section 21 of the Sabodala Technical Report - Capital and Operating Costs.
14. The highest-grade undeveloped open-pit gold reserve in Africa statement is based on publically filed data available on S&P Capital IQ as at November 15, 2019, and includes the following projects: Sanbrado project (Burkina
Faso), Tulu Kapi project (Ethiopia), Passendro project (Central African Republic), Yaoure, (Côte d'Ivoire), Wa-Lawra project (Ghana), Baomahun (Sierra Leone), Block 14 (Sudan), Bombore (Burkina Faso). Other companies
may calculate their respective reserves base differently.
15. Anticipated significant capital and operating synergies include capital expenditures, mining costs, processing costs, general & administrative expenses, and timing are based on the Massawa Feasibility Study, and the
Sabodala Technical Report. Teranga believes that in a combined Sabodala-Massawa operating complex, the Massawa project phase 1 and phase 2 capital expenditures are reduced. We believe the Sabodala mill and
infrastructure is capable of processing free-milling ore from the Massawa project with minimal modifications for gravity, arsenic stabilization, and oxygen addition. The Company is targeting first production of ore from the
Massawa project in H2 2020, a significant improvement over the Massawa project standalone scenario where first production is scheduled for 2022 at the earliest. Sabodala’s operating costs (mining, processing and general
& administrative) are lower than those outlined in the Massawa Feasibility Study. The Massawa project is expected to be operated as satellite deposits. Subject to integrated technical studies.
16. Based on consensus equity research estimates from Capital IQ as at December 6, 2019. Select African peers includes: B2Gold, Endeavour, Centamin, Perseus, Golden Star, Semafo, Resolute, Roxgold, and Asanko.
17. The gold price-linked Contingent Consideration is expected to be as follows:
➢ if the average gold price for the three-year period immediately following closing of the Transaction (the “three-year average gold price”) is equal to or less than $1,450 per ounce, nil;
➢ if the three-year average gold price is greater than $1,450 per ounce and up to, but not more than, $1,500 per ounce, $25 million; or
➢ if the three-year average gold price is greater than $1,500 per ounce and up to, but not more than, $1,600 per ounce, $35 million; or
➢ if the three-year average gold price is greater than $1,600 per ounce, $50 million.
The Contingent Consideration is due the later of three years following the completion of the Transaction and January 31, 2023. The Contingent Consideration is expected to be funded through cash flow.
18. This production target is based on proven and probable ore reserves only for Wahgnion Gold Operations as at December 31, 2019. For more information, please refer to management’s discussion and analysis for the year
ended December 31, 2019 filed to be February 2020 and to be available on the Company’s website at www.terangagold.com and SEDAR at www.sedar.com.
19. 22,500 ounces of Sabodala gold production are to be sold to Franco-Nevada Corporation (“Franco-Nevada”) at 20 percent of the spot gold price. All Wahgnion gold production is subject to a gold offtake payment agreement
with Taurus Funds (“Offtake Agreement”) up to 1,075,000 ounces (see Financial Instruments section for more details).
Endnotes (continued)

Endnotes (continued)
50
20. All-in sustaining costs per ounce is a non-IFRS financial measure and does not have a standard meaning under IFRS. All-in sustaining costs per ounce sold calculated at the mine site level includes only total cash costs per
ounce and sustaining capital expenditures. All-in sustaining costs for Sabodala includes sustaining capital expenditures but excludes growth capital related to the Sabodala village resettlement. Corporate administration and
share-based compensation expense are presented separately in this table and are not allocated to the mine site level costs. All-in sustaining costs presented on a consolidated basis includes corporate administration and
share-based compensation expense. All-in sustaining costs also includes non-cash inventory movements and non-cash amortization of advanced royalties. Excludes capitalized deferred stripping costs, included in mine
production costs.
21. Excludes capitalized deferred stripping costs, included in mine production costs.
22. Share-based compensation expense assumes a constant share price of C$4.00 per Teranga share.
23. Exploration and evaluation costs includes both expensed exploration, primarily attributable to exploration work on exploration permits, and capitalized reserve development, which is work performed on mine licenses. In the
second quarter, we have increased the lower end of the range from $5 million to $10 million to reflect actual and expected spend. The higher end of the range has not changed.
24. This outlook financial information is based on the following material assumptions for 2020: gold price: $1,450 per ounce; Brent Crude Oil: $60 per barrel; and Euro:USD exchange rate of 1:1.10.The Company assumes a
corporate income tax rate of 25 percent in Senegal and 17.5 percent in Burkina Faso. Other important assumptions: any political events are not expected to impact operations, including movement of people, supplies and
gold shipments; grades and recoveries is expected to remain consistent with the life-of-mine plan to achieve the forecast gold production; and no unplanned delays in or interruption of scheduled production.

51
Notes

TSX:TGZ / OTCQX:TGCDF
Trish Moran
Vice President, Investor Relations &
Corporate Communications
77 King Street West, Suite 2110
Toronto, ON M5K 1A2
T: +1.416.607.4507
W: terangagold.com


![Mineral Oil Manual - [Mineral Oil Manual]](https://img.dokumen.tips/doc/110x75/62101977efe0c144cb43a59a/mineral-oil-manual-mineral-oil-manual.jpg)