Embed Size (px)
Citation preview

A report byCivic EnterprisesEveryone Graduates Centerat Johns Hopkins UniversityAmerica’s Promise AllianceAlliance for Excellent Education
Lead SponsorAT&T
Supporting SponsorPearson Foundation
Written byRobert BalfanzJohn M. BridgelandMary BruceJoanna Hornig Fox
Building a Grad NationProgress and Challengein Ending the High School Dropout Epidemic
Annual Update
2012

TABLE OF CONTENTS
Letter from General Colin and Mrs. Alma Powell . . . . . . . . . . . . . . . . . . . . . 2
Executive Summary . . . . . . . . . . . . . . . . . . . . . . . . . . . . . . . . . . . . . . . 4
Introduction: Education and the Economy . . . . . . . . . . . . . . . . . . . . . . . . 15
Part 1: The Civic Marshall Plan to Build A Grad Nation . . . . . . . . . . . . . . . . . 19
Part 2: Update on the Civic Marshall Plan – What the Latest Data Tell Us . . . . . 22 The State of Graduation Rate Data . . . . . . . . . . . . . . . . . . . . . . . . . . . . 23 Progress and Challenge in Improving High School Graduation Rates . . . . . . . 23 Key Takeaways . . . . . . . . . . . . . . . . . . . . . . . . . . . . . . . . . . . . . . . . 33
Part 3: Progress and Challenge in Meeting the Benchmarks of the Civic Marshall Plan . . . . . . . . . . . . . . . . . . . . . . . . . . . . . . . . . . . . . . . . 38Elementary and Middle School Years (2012-2016) . . . . . . . . . . . . . . . . . . . . . . 39 Grade Level Reading . . . . . . . . . . . . . . . . . . . . . . . . . . . . . . . . . . . . . 40 Chronic Absenteeism . . . . . . . . . . . . . . . . . . . . . . . . . . . . . . . . . . . . 41 Early Warning Systems . . . . . . . . . . . . . . . . . . . . . . . . . . . . . . . . . . . 42 The Middle Grades . . . . . . . . . . . . . . . . . . . . . . . . . . . . . . . . . . . . . . 44 Adult and Peer Supports . . . . . . . . . . . . . . . . . . . . . . . . . . . . . . . . . . 47High School Years (2017-2020) . . . . . . . . . . . . . . . . . . . . . . . . . . . . . . . . . 52 Transition Supports . . . . . . . . . . . . . . . . . . . . . . . . . . . . . . . . . . . . . 52 Dropout Factories . . . . . . . . . . . . . . . . . . . . . . . . . . . . . . . . . . . . . . 53 Compulsory School Age . . . . . . . . . . . . . . . . . . . . . . . . . . . . . . . . . . . 61 Pathways to College and Career . . . . . . . . . . . . . . . . . . . . . . . . . . . . . . 64 Dropout Recovery . . . . . . . . . . . . . . . . . . . . . . . . . . . . . . . . . . . . . . 65
Part 4: Paths Forward . . . . . . . . . . . . . . . . . . . . . . . . . . . . . . . . . . . . . . 69 Federal Policy Recommendations . . . . . . . . . . . . . . . . . . . . . . . . . . . . 70 State Strategies . . . . . . . . . . . . . . . . . . . . . . . . . . . . . . . . . . . . . . . . 73
Final Word: A Letter from Young Leaders . . . . . . . . . . . . . . . . . . . . . . . . . 75
Conclusion . . . . . . . . . . . . . . . . . . . . . . . . . . . . . . . . . . . . . . . . . . . . . 77
Acknowledgments . . . . . . . . . . . . . . . . . . . . . . . . . . . . . . . . . . . . . . . . 77
Appendices . . . . . . . . . . . . . . . . . . . . . . . . . . . . . . . . . . . . . . . . . . . . . 78 A: Civic Marshall Plan Leading Principles and Action Items . . . . . . . . . . . . . 78 B: Civic Marshall Plan Cohort Approach . . . . . . . . . . . . . . . . . . . . . . . . . 79 C: Civic Marshall Plan: Measuring Our Progress . . . . . . . . . . . . . . . . . . . . 80 D: Civic Marshall Plan: Research Recommendations . . . . . . . . . . . . . . . . . 81 E: Graduation Rate Definitions, History, and Related Terms . . . . . . . . . . . . 82 F: Civic Marshall Plan State Index – Sample . . . . . . . . . . . . . . . . . . . . . . . 84 G: Graduation Rates, by State . . . . . . . . . . . . . . . . . . . . . . . . . . . . . . . 86 H: Graduation Rates, by Race . . . . . . . . . . . . . . . . . . . . . . . . . . . . . . . 87 I: How to Get Involved – What You Can Do to Help Build A Grad Nation . . . . . 88 J: Key Grad Nation Initiatives . . . . . . . . . . . . . . . . . . . . . . . . . . . . . . . . 90 K: Civic Marshall Plan Leadership . . . . . . . . . . . . . . . . . . . . . . . . . . . . . 91
Endnotes . . . . . . . . . . . . . . . . . . . . . . . . . . . . . . . . . . . . . . . . . . . . . . 92

Building a Grad Nation March 2012 1 1|
Case Studies and Snapshots Features on Proven and Promising Practices
Snapshot: Cleveland, Ohio . . . . . . . . . . . . . . . . . . . . . . . . . . . . . . . . . . . . 18
Case Study: Washington County Public Schools, Maryland . . . . . . . . . . . . . . . . 25
Case Study: Georgia . . . . . . . . . . . . . . . . . . . . . . . . . . . . . . . . . . . . . . . . 35
Snapshot: The Campaign for Grade-Level Reading . . . . . . . . . . . . . . . . . . . . . 40
Snapshot: Teacher Evaluation . . . . . . . . . . . . . . . . . . . . . . . . . . . . . . . . . . 42
Snapshot: National Service . . . . . . . . . . . . . . . . . . . . . . . . . . . . . . . . . . . 43
Snapshot: Las Vegas PBS, American Graduate . . . . . . . . . . . . . . . . . . . . . . . 45
Snapshot: United Way and Big Brothers Big Sisters . . . . . . . . . . . . . . . . . . . . 48
Case Study: Houston, Texas . . . . . . . . . . . . . . . . . . . . . . . . . . . . . . . . . . . 49
Snapshot: Junior Achievement . . . . . . . . . . . . . . . . . . . . . . . . . . . . . . . . . 53
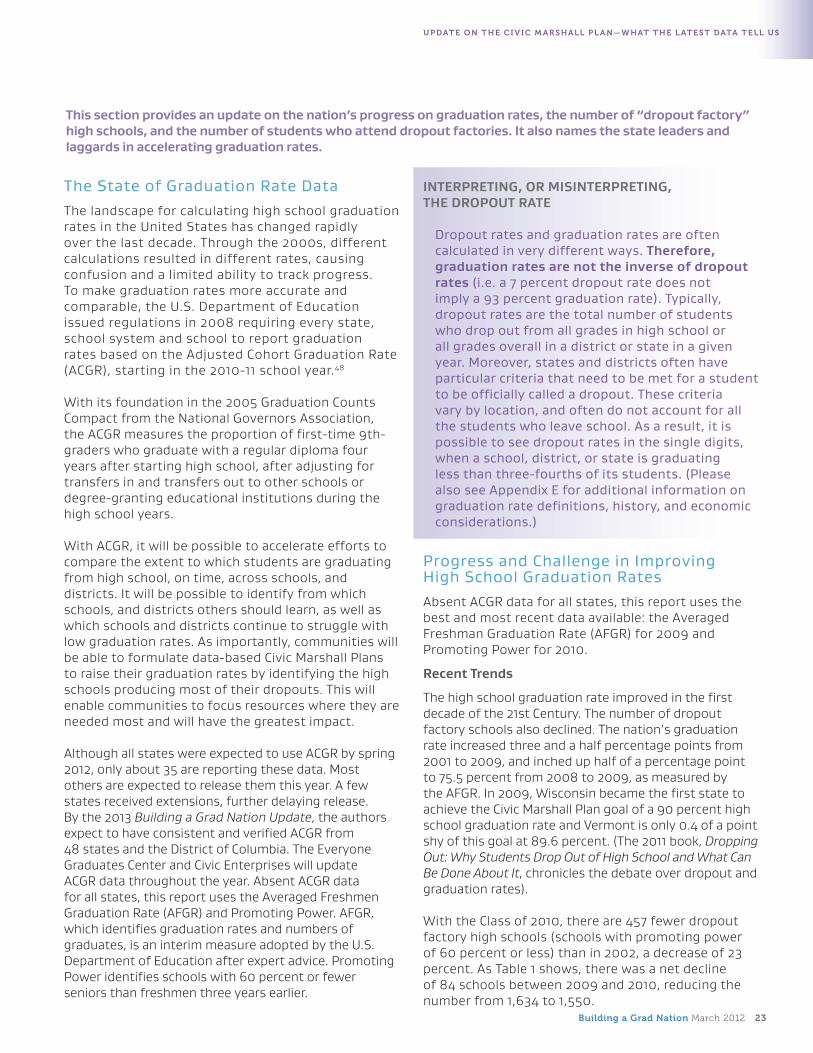
Case Study: Henry Grady High School, Atlanta Public Schools . . . . . . . . . . . . . . 54
Snapshot: Common Core State Standards . . . . . . . . . . . . . . . . . . . . . . . . . . 57
Case Study: Dothan, Alabama . . . . . . . . . . . . . . . . . . . . . . . . . . . . . . . . . . 58
Snapshot: School Counselors . . . . . . . . . . . . . . . . . . . . . . . . . . . . . . . . . . 61
Snapshot: The Business Case for Education . . . . . . . . . . . . . . . . . . . . . . . . . 66

2 Building a Grad Nation March 2012
Letter from General and Mrs. Powell
Our economic vitality depends on America’s ability to remain competitive in an ever-demanding global economy that requires a well-educated workforce.
The path to prosperity was clear to us as children. We knew we could take full advantage of the opportunities of our education—and succeed. Growing up in our families, communities, faith-based institutions, and schools, we knew graduating from high school and college was a prerequisite for a strong future and a launching pad for career success.
Today, there are many successes in America’s schools. Even in the toughest communities, facing the most significant challenges, we see examples of educators and families preparing our nation’s youngsters for success in school and life. But, in far too many communities across America, we continue to face educational challenges that jeopardize the futures of our young people, and in turn our country. Right now, 25 percent of all of our youngsters and 40 percent of our minority youngsters are not finishing high school with their peers. This lack of high-quality education has dramatic consequences for individuals, society, the economy, and even our national security.
Increasingly, we have the data available and the research in place to support student success. In other words, we know which children need supports and what interventions work. So, we are left with the challenge of getting these youngsters what they need, when they need it.
We cannot afford excuses. The United States is recovering from the greatest economic downturn since the Great Depression. Our economic vitality depends on America’s ability to remain competitive in an ever-demanding global economy that requires a well-educated workforce. In 2010, we shared a Civic Marshall Plan to create a Grad Nation. Through that first report and subsequent update, we saw hopeful signs of progress in boosting high school graduation rates in communities across the country. As this 2012 annual update shows, we have continued to make good progress, but we also have much work ahead to achieve our goal of a 90 percent high school graduation rate.
We hope this report illustrates both the important progress made by schools, communities and states across the country and the significant challenges that remain. The Grad Nation campaign continues to inspire each of us to work together to ensure all of our children graduate high school and college ready to compete in our global economy.
Failure is not an option. Opportunity must be the way.
General Colin Powell Alma J. Powell Founding Chair, America’s Promise Alliance Chair, America’s Promise Alliance

Building a Grad Nation March 2012 3

4 Building a Grad Nation March 2012
E x E c u t i v E s um m Ary
4 Building a Grad Nation March 2012
Executive Summary

Building a Grad Nation March 2012 5
E x E c u t i v E s um m Ary
the high school dropout crisis in the united states claims more than one million students each year, costing individuals the loss of potential earnings and the nation hundreds of billions of dollars in lost revenue.
This report shows that high school graduation rates continue to improve nationally and across many states and school districts, with 12 states accounting for the majority of new graduates over the last decade. Tennessee and New York continue to lead the nation with double-digit gains in high school graduation rates over the same period. The number of “dropout factory” high schools—and the number of students attending them—has also declined significantly over the last decade, particularly within suburbs and towns and in the South, and at a more accelerated rate within cities in recent years.
Other progress on the “Civic Marshall Plan” to build a Grad Nation, including progress in meeting the goal of a 90 percent high school graduation rate for the Class of 2020, gives us hope that these positive trends can continue. One state has now met the national high school graduation rate goal and another state has nearly done so; improvements are being made against the early benchmarks of the plan; and a significant number of institutions with reach into schools and communities are aligning their efforts with the Civic Marshall Plan’s benchmarks.
Although some states and school districts show that the dropout crisis can be solved, other states and districts are lagging, with 10 states having lower high school graduation rates recently compared to earlier in the decade. The pace across the country must be accelerated more than three-fold to meet the national goal of a 90 percent high school graduation rate by the Class of 2020. The strong relationship between education and the economy frames this year’s report to reinforce what is at stake in strengthening our nation and preserving access to the American Dream for generations to come.
EDUCATION AND THE ECONOMYThe high school dropout crisis in the United States claims more than one million students each year, costing individuals the loss of potential earnings and the nation hundreds of billions of dollars in lost revenue, lower economic activity and increased social services.1 With a national graduation rate of more than 75 percent in 2009—up from 72 percent in 2001—nearly one in four Americans, and four in 10 minorities, do not complete high school with their class.2 Better educational outcomes would lead to greater economic returns.
Improving high school and college graduation rates helps individuals financially and the economy as a whole.
• Higher educational attainment results in higher earnings for individuals. On average, high school graduates will earn $130,000 more over their lifetimes than high school dropouts.3 The dropouts from the Class of 2011 would have generated up to $154 billion in additional earnings over their lives had they graduated from high school.4
• Higher educational attainment lowers costs to taxpayers. Moving just one student from dropout status to graduate status would yield more than $200,000 in higher tax revenues and lower government expenditures over his or her lifetime.5 Graduating half of one class of dropouts would save the U.S. taxpayer $45 billion in that year.6

6 Building a Grad Nation March 2012
E x E c u t i v E s um m ary
• Education can help close the skills gap and ensure America remains globally competitive. Over the next decade, the nation needs 22 million students to earn a college degree to meet the demands of the workforce, but America is expected to fall short of this goal by at least three million.7 More than 53 percent of business leaders at large companies and 67 percent at small companies say it is difficult to recruit employees in the U.S. with the skills, training, and education their companies need, despite unemployment at over 8 percent and millions of Americans seeking jobs.8
• Improved education boosts the nation’s economic growth. If each state had met the Civic Marshall Plan goal of a 90 percent graduation rate, there would have been more than 580,000 additional high school graduates from the Class of 2011. These additional graduates would have earned $6 billion more in income with a high school diploma as compared to their earnings as dropouts. This would have created a ripple effect through the national economy, generating more than 37,000 new jobs and increasing the gross domestic product by $6.6 billion.
THE CIVIC MARSHALL PLAN TO BUILD A GRAD NATIONLaunched by America’s Promise Alliance in 2010, Grad Nation is now a large and growing movement of dedicated organizations, individuals, and communities working to end America’s dropout crisis. As a key part of the larger Grad Nation campaign, the Civic Marshall Plan sets two national goals over the next decade, establishes research-based benchmarks for assessing progress, and mobilizes national, state, and community stakeholders to focus their efforts on the schools with low graduation rates.
The Civic Marshall Plan to Build a Grad Nation has two clear goals:• A 90 percent nationwide high school graduation rate for the Class of 2020
(at 75.5 percent for the Class of 20099, an approximately 1.3 percentage point increase per year is needed through 2020).
• The highest college attainment rates in the world, with at least six in 10 students earning a college degree by 2020 (up from three in 10 today10).
The nation is making progress in the effort to build a Grad Nation. High school graduation rates are improving. The Adjusted Cohort Graduation Rate (ACGR) that all states will soon be using will enable accurate and common measurement of high school graduation rates across all high schools, school districts, and states.11 Graduation rates under the ACGR are not yet available for all states, so this report continues to use both the Averaged Freshmen Graduation Rate (AFGR) and Promoting Power to measure progress in meeting some of the most important elements of the Civic Marshall Plan.
• The graduation rate improved in the first decade of the 21st Century. The nation’s graduation rate increased three and a half percentage points from 2001 to 2009, and inched up half of a percentage point to 75.5 percent from 2008 to 2009. Wisconsin became the first state to achieve the Civic Marshall Plan goal of a 90 percent high school graduation rate and Vermont is only 0.4 of a point shy of this goal at 89.6 percent.
• The number of dropout factory high schools and the number of students who attend them are declining. There were 457 fewer dropout factory high schools in 2010 than in 2002, a 23 percent decline. During this period, 790,000 fewer students attended dropout factory high schools. From 2009 to 2010, the number
Launched by America’s Promise Alliance in 2010, Grad Nation is now a large and growing movement of dedicated organizations, individuals and communities working to end America’s dropout crisis.

Building a Grad Nation March 2012 7
E x E c u t i v E s um m ary
of dropout factories fell from 1,634 to 1,550. The rate of decline in the number of dropout factories and the number of students attending them was significantly faster between 2008 and 2010 than it was between 2002 and 2008.
• The rate of improvement has not been fast enough to achieve the goal of a 90 percent national graduation rate by the Class of 2020. If the rate of progress achieved during the first decade of the 21st Century continues during the second decade, the nation’s graduation rate will be closer to 80 percent than 90 percent. There will still be more than 1,000 high schools in which the odds of graduating are about a 50/50 proposition.
• There are state leaders and laggards in improving high school graduation rates. About half the states made gains in the past year and half did not. There are 12 states whose efforts accounted for the majority of additional high school graduates, collectively accounting for 104,000 of the nation’s 134,000 additional graduates in 2009.
• The leaders are Alabama, Florida, Georgia, Kentucky, Massachusetts, Missouri, New York, North Carolina, South Carolina, Tennessee, Texas and Wisconsin. Tennessee and New York continued to lead the way, each seeing nearly an average two percentage-point improvement per year. As a result, they are the only states to achieve double-digit gains since this research began in 2002, with 18 (Tennessee) and 13 (New York) percentage-point increases.
• The lagging states are Arizona, Arkansas, California, Connecticut, New Jersey, Nebraska, New Mexico, Nevada, Rhode Island and Utah—all states with lower high school graduation rates in 2009 than in 2002.
Progress and Challenge in Meeting Key Benchmarks of the Civic Marshall Plan. To ensure the Class of 2020 reaches a high school graduation rate of 90 percent, the Civic Marshall Plan Leadership Council established a phased approach with clear goals and benchmarks for the years ahead. The effort is data-driven, community-based, and organized at the local, state, and national levels. This Annual Update reports on the progress the country is making on these benchmarks. It also highlights key successes, opportunities, and challenges for the nation.
Benchmarks: Elementary and Middle School Years (2012-2016)
• Substantially increase the number of students reading with proficiency by 4th grade.
• Progress: From 2000 to 2011, modest gains were made in reading achievement. The percent of America’s 4th-graders scoring at or above proficient in reading increased from 29 percent in 2000 to 34 percent in 2011, according to the National Assessment of Educational Progress (NAEP).12
• Challenge: More than 65 percent of 4th-graders continue to score below proficiency in reading.
• Reduce chronic absenteeism.
• Progress: The importance of school attendance and the multiple negative consequences of chronic absenteeism are gaining national attention. Many mayors have taken up the cause, with positive initial results. Champions include Baltimore, Boston, New York City, and San Antonio.
the battle to meet the national high school graduation rate goal will be won or lost in 13 states: Arizona, Arkansas, california, connecticut, illinois, indiana, michigan, mississippi, Nevada, New mexico, Oklahoma, virginia, and Washington. These states have the largest numbers of students to get back on track to graduate and they need to be the most aggressive in accelerating their graduation rate by 2020.

8 Building a Grad Nation March 2012
E x E c u t i v E s um m ary
• Challenge: Despite the importance of addressing chronic absenteeism, few states currently report chronic absenteeism rates at the state, district, and school levels or hold districts and schools accountable for it.
• Establish early warning indicator and intervention systems that use the early predictors of potential dropout (attendance, behavior, and course performance in reading and math).13
• Progress: In the past few years, Early Warning Indicator and Intervention Systems (EWS) have grown from a powerful idea into an actionable, high-priority and research-based reform effort. One-third of states currently have all of the information for EWS in their state longitudinal data systems.
• Challenge: The next step is high-quality implementation of EWS—at scale. Sixteen states report that they have no plans or have not set a date for implementing an EWS.
• Redesign the middle grades to foster high student engagement and preparation for rigorous high school courses.
• Progress: The past year has seen growing recognition of the critical role the middle grades play in enabling all students to graduate from high school prepared for college, career, and civic life. Major initiatives include the Bush Institute’s Middle Grades Matter, the Forum to Accelerate Middle Grades Education, and New York City’s Chancellor‘s Middle Grade Initiative.
• Challenge: According to U.S. Secretary of Education Arne Duncan, “The middle grade years have been called the ‘Bermuda Triangle’ of K-12 education. It’s the time when students sink or swim.”14 In high-poverty schools, in particular, the middle grades can either put students on a path to college and careers—or they can steer them to dropping out and to unemployment.
• Provide sustained and quality adult and peer support to all students who want and need these supports, continual supports from adults serving in schools as “success coaches” for all off-track students, and intensive wraparound supports for the highest-need students.
• Progress: Several state and local Mentoring Partnerships, most notably the Massachusetts Mentoring Partnership and the Mentoring Partnership of Minnesota, have instituted quality-based mentoring initiatives. Success Mentors of New York City and City Year corps members are providing daily supports—mentoring, tutoring, coaching, and more—to promote student success and are getting good initial results. The site coordinator/case-managed support system of Communities in Schools has been recognized as a model for dropout prevention.
the past year has seen growing recognition of the critical role the middle grades play in enabling all students to graduate from high school prepared for college, career, and civic life.

Building a Grad Nation March 2012 9
E x E c u t i v E s um m ary
• Challenge: There are irregular and limited funding sources at the state and federal levels for continuous in-school supports for off-track students and continued wraparound services for the highest-need students. This limits the scale of effective programs.
Benchmarks: High School Years (2017-2020)
• Provide transition supports for struggling students in grades 8-10 in all schools with graduation rates below 75 percent, as well as their feeder middle and elementary schools.
• Progress: A recent study by the U.S. Department of Education’s National Center for Education Statistics, called Dropout Prevention Services and Programs in Public Schools and Districts, 2010 to 2011, provides a welcome first glimpse at support for students across the country. Many forms of in-school support in group settings are available in the middle and upper grades, as is personalized support offered by school staff.15
• Challenge: Systems of support for students vary by region of the country, locale (city, suburbs, towns and rural areas), size of school district and grade level and they are far from pervasive.16 In many cases, students moving to middle school receive only half as much help as students entering high school. Offerings are in many cases less available for students in rural areas.
• Transform or replace the nation’s high school dropout factories with effective schools.
• Progress: The number of dropout factory high schools declined by 84 from 2009 to 2010 and by 457 since 2002. The number of students enrolled in dropout factory high schools declined at an even faster rate, with 204,000 fewer students enrolled in these schools in 2010 than in 2009, and 790,000 fewer since 2002. Federal School Improvement Grants continued to target high schools with graduation rates below 60 percent and their feeder middle schools. The U.S. Department of Education formally established a School Turnaround office.
• Challenge: 1,550 high school dropout factories remain and at current rates of progress, more than 1,000 dropout factories will continue to exist by 2020. In some districts, multiple dropout factories exist.
• Raise the compulsory school attendance age to when students graduate or age 18 in all states, coupled with support for struggling students.
• Progress: Of the states with graduation rates above the national average, 63 percent have a compulsory school age law of 17 or 18. The majority of states now have a compulsory school age of 17 or 18 and in the past decade alone, 12 states such as Indiana, New Hampshire, and Rhode Island have updated their laws by increasing the legal dropout age.17 Some states, such as Tennessee and West Virginia, are following the recommendations of the National Conference of State Legislatures and creatively linking the compulsory school age law with enforcement, such as the suspension of drivers licenses.18 Legislation has been introduced in states such as Alaska, Delaware, Illinois, Kentucky, Maryland, and Wyoming to update their compulsory schooling laws.19 In his 2012 State of the Union Address, President Obama urged states to raise their compulsory school age laws to when students graduate or 18.
A recent study by the u.s. Department of Education’s National center for Education statistics, Dropout Prevention services and Programs in Public schools and Districts, 2010 to 2011, provides a welcome first glimpse at support for students across the country.

10 Building a Grad Nation March 2012
E x E c u t i v E s um m ary
• Challenge: Eighteen states have not updated their laws, most of which were written when a high school diploma was not necessary for most jobs, and still permit students to drop out at the age of 16 even though a high school diploma and some college are now needed for most jobs.
• Provide all students (including those who have dropped out) clear pathways from high school to college and career training.
• Progress: At the 2011 Grad Nation Summit, Vice President Biden challenged all 50 governors to hold college completion summits. Since that time, much progress has been made: the U.S. Department of Education released its College Competition Toolkit, and through Complete College America’s Completion Innovation Challenge, 10 states are implementing innovative, high-impact reforms to significantly boost student success and close achievement gaps for low-income students and minorities.20 The College Board’s State Capitals Campaign has held events in 13 cities.
• Challenge: Only three in 10 (32 percent) 25- to 29-year-olds in the U.S. have attained a bachelor’s degree.21
• Support comprehensive dropout recovery programs for disconnected youth.
• Progress: The White House Council for Community Solutions issued a report to highlight the numbers and economic costs of youth ages 16-24 who are out of school and work, and highlighted a national survey of such youth with recommendations on how best to reconnect them, including through an employer toolkit to help more companies hire and train these youth.22 Significant efforts are underway to give these youth a second chance to complete their secondary education and some college and to reconnect them to productive work, such as YouthBuild, YearUp, Transfer Schools in New York City, and Youth Connection Charter Schools in Chicago.
• Challenge: An estimated one in six, or 6.7 million, of the 38.9 million youth ages 16-24, are disconnected from the two institutions that give them hope for the future—school and work.23 These youth face severe challenges—many grew up in poverty and were raised by a single parent, and very few grew up in households with a parent who graduated from college. They cost taxpayers $1.6 trillion and society $4.7 trillion over their lifetimes, and represent significant untapped potential for the nation.24
PATHS FORWARDThe first Building a Grad Nation report in 2010 outlined a comprehensive set of policies and strategies to boost high school graduation rates. The landscape between federal and state policy is shifting and state efforts are becoming even more critical. In light of these changes and to capture new opportunities, supplemental federal policy recommendations and essential state strategies are highlighted here. The appendices include additional paths forward, including research gaps and ways each person can help build a Grad Nation.
Support Federal Policies to Promote High School Graduation for College and Career Readiness. Considering the persistent achievement gap and dropout crisis, federal education policy must be improved, ideally through the reauthorization of the Elementary and Secondary Education Act (ESEA), and if necessary, through temporary waivers issued by the U.S. Department of Education.
Eighteen states have not updated their laws, most of which were written when a high school diploma was not necessary for most jobs, and still permit students to drop out at the age of 16 even though a high school diploma and some college are now needed for most jobs.

Building a Grad Nation March 2012 11
E x E c u t i v E s um m ary
• Promote college and career ready standards. States have recently adopted college- and career-ready standards, and their leadership should be reinforced by policy at the federal level, including support for assessments aligned to these standards. States and schools that are increasing high school graduation rates are rising to a standard of excellence and ensuring a more rigorous curriculum that prepares students for college and career.
• Ensure 21st Century accountability for all students. Federal education policy should direct states to implement accountability systems that promote continuous improvement of all students and schools. Accountability systems should include all schools and all students, and tailor reform to schools’ and students’ specific needs. Graduation rates should be given equal weight to measures of achievement in order to avoid potential negative consequences of an accountability system based solely on standardized tests (e.g. the incentive to “push out” low-performing students in order to increase test scores).
• Support effective improvement strategies that leverage community resources. Federal policy should support state and district level systems for secondary school reform, including diagnosing problems and assessing capacity to determine the specific needs and potential resources to strengthen student achievement; targeted assistance for schools with achievement or graduation gaps; whole school transformation or replacement for chronically underperforming schools; and partnerships with nonprofit organizations and others to leverage resources.
• Launch a Race to the Top: Secondary School Challenge. Building on the success of previous Race to the Top efforts, including the Early Learning Challenge Fund, the Administration should launch a Race to the Top Secondary School Challenge focusing on several key areas of systemic reform to
• Raise the compulsory school age to 18 or the age when students graduate;
• Transform the pipeline of low-performing middle schools that feed into low-performing high schools;
• Implement 21st Century education models in high schools to prepare students for college and careers;
• Integrate the education, workforce and social support systems to put disconnected youth back on track toward education and employment success;
• Ensure accountability at the high school level that promotes college- and career-readiness;
• Implement Early Warning Indicator and Intervention Systems that identify and support both students who are off-track for high school graduation and not yet on-track for post-secondary success; and,
considering the persistent achievement gap and dropout crisis, federal education policy must be improved, ideally through the reauthorization of the Elementary and secondary Education Act (EsEA), and if necessary, through temporary waivers issued by the u.s. Department of Education.

12 Building a Grad Nation March 2012
E x E c u t i v E s um m ary
• Create accelerated pathways to post-secondary success by encouraging school systems and state university systems to collaborate.
Support Federal Policies to Promote the Success of Opportunity Youth25: There are millions of youth ages 16 to 24 who are out of school and out of work, costing the nation billions of dollars every year and over their lifetimes in lost productivity and increased social services. If they can be re-engaged in school and work, these “opportunity youth” represent an opportunity for the nation to increase productivity and fill a critical skills gap.
• Forge youth opportunity pathways. Youth Opportunity Grants should target low-income communities, foster community collaboration among multiple sectors, and adopt systemic approaches to re-enrolling dropouts into local charter or “back on track” schools or programs focused on dropout re-engagement and preparation for the labor market.
• Reinvest in success: Reward and scale up effective programs. All existing comprehensive programs designed for opportunity youth that have been shown to be effective and have waiting lists should be expanded to re-engage all the young people seeking a chance to get back on track.
• Measure performance and ensure accountability. The U.S. Government should more regularly collect and report information on youth who are disconnected from school and work, at least annually through the Current Population Survey or American Community Survey.
• Encourage employers to train and hire opportunity youth. The federal government took a step in that direction by authorizing the Disconnected Youth Opportunity Tax Credit (DYOTC) in the American Recovery and Reinvestment Act of 2010. This approach needs to become permanent and, rather than just rewarding employers for hiring opportunity youth, it should include incentives for employers to provide a range of valuable experiences to youth.
there are millions of youth ages 16 to 24 who are out of school and out of work, costing the nation billions of dollars every year and over their lifetimes in lost productivity and increased social services. if they can be re-engaged in school and work, these “opportunity youth” represent an opportunity for the nation to increase productivity and fill a critical skills gap.

Building a Grad Nation March 2012 13
E x E c u t i v E s um m ary
Leverage National Service as a Cross-Cutting Solution. National service has a proven track record of harnessing “people power” to accelerate academic achievement—both for those individuals enrolled in national service programs and for those they serve. National service is also a good bridge to full employment. The Corporation for National and Community Service is placing a greater emphasis on identifying strategies and programs that work, funding them, and driving innovation in education to build a Grad Nation. To this end, the funding and development of these programs should be supported.
• Improve our nation’s lowest-performing schools to promote high school completion. In high-poverty, low-performing schools and high schools with low graduation rates, large numbers of students often require intensive supports, which many schools do not have the capacity to provide. Policymakers should encourage districts and schools to partner with national service organizations and scale up national service positions that provide below-poverty stipends and education awards in exchange for a full year of national service as outlined in the bipartisan Edward M. Kennedy Serve America law.
• Re-engaging opportunity youth. National service programs also improve outcomes for opportunity youth through job training and skill-building opportunities, and have a record of setting participants on a successful career path. These programs should be strengthened and scaled.
Advance State Strategies to Accelerate Improvements. The federal government can play a powerful role in education, but 90 percent of education dollars are controlled at the state and local levels.27 Therefore, we make the following 10 recommendations to state-level stakeholders.
• Understanding the graduation rate in communities and states. There are many estimates of graduation rates, but most do not accurately capture the extent of the dropout crisis. See Part 2 of this report to find out which states and communities are using the adjusted cohort graduation rate method. Additional information on how states are doing, as measured by the Civic Marshall Plan Indices, is available at www.every1graduates.org
• Investing smartly in education. State budgets are tight, but the economic costs of failing to invest are greater. The waiver process from No Child Left Behind (NCLB) provides states flexibility on how to spend some of the federal education dollars. These dollars should be strategically invested in evidence-based programs for school readiness, school improvement and student support. States and corporations should invest to strengthen the link between high schools, community colleges and technical institutes, and employers to prepare young people for entry into skilled occupations. To learn more, see the Alliance for Excellent Education’s and the Economy project available at www.all4ed.org/publication_material/Econ
• Transparency in the NCLB Waivers and waiver process. These waivers, if granted, can affect policies at the school, district and state levels. Additional information on these waivers is available in the recent brief by the National Governors Association Center for Best Practices, Creating a College and Career Readiness Accountability Model for High Schools, available at www.nga.org/cms/center
• Raising the compulsory school age to when students graduate or 18. Existing research shows that raising the compulsory school age acts as a constraint on dropping out and boosts earnings. The report, The Case for Reform: Raising the Compulsory School Attendance Age, provides research and information from state legislators and governors on how these laws have been recently updated in certain states, available at www.civicenterprises.net/reports/the_case_for_reform.pdf
the federal government can play a powerful role in education, but 90 percent of education dollars are controlled at the state and local levels. therefore, we make the following 10 recommendations to state-level stakeholders.

14 Building a Grad Nation March 2012
E x E c u t i v E s um m ary
• Learning from models of success like Tennessee and New York. Reform efforts should benefit from models of success and help promote the use of evidence-based strategies, school turnaround and replacement models, and research-based interventions. The U.S. Department of Education’s Institute of Education Sciences (IES) What Works Clearinghouse (WWC) is a central source of scientific evidence for what works in education, available at http://ies.ed.gov/ncee/wwc
• Doing a policy audit at the school, district, and state levels. This audit should ensure basic school attendance, behavior and course passing policies support graduation for all. The Center for Public Education’s Guiding Questions informs this process, available at www.data-first.org/learning/guiding-questions
• Using longitudinal data systems to analyze graduation and dropout trends. Efforts should be undertaken to examine a recent year’s dropouts and analyze them by age and credits shy of graduation to identify which targeted strategies should be implemented to meet student needs. Such efforts can partner with an educational research institution, such as those listed in http://drdc.uchicago.edu/links/education-links.html
• Putting early warning indicator and intervention systems in place in every district with a low graduation rate high school. EWS should be in place no later than middle school. On Track for Success: The Use of Early Warning Indicator and Intervention Systems highlights best practices from across the country, available at www.civicenterprises.net/reports/on_track_for_success.pdf
• Measuring and reporting on chronic absenteeism at the school, district, and state levels. Collecting and reporting data on chronic absenteeism should become common practice at the school, district, and state levels. Efforts can be informed by the tools and strategies to promote attendance from Attendance Works, available at www.attendanceworks.org/what-can-i-do
• Developing a State Civic Marshall Plan. Creating results-driven partnerships with key leaders in the state who are interested in cradle to career education efforts is essential to success. States should work to identify major assets and needs related to the Civic Marshall Plan benchmarks, mobilize key partners in the state to align their efforts with those benchmarks, and report results every year. The Leadership Council of the Civic Marshall Plan to Build a Grad Nation can support these efforts (please see Appendix K for a list of Leadership Council Members).
Putting early warning indicator and intervention systems in place in every district with a low graduation rate high school. EWs should be in place no later than middle school. On track for success: the use of Early Warning indicator and intervention systems highlights best practices from across the country,

Introduction: Education and the Economy
Building a Grad Nation March 2012 15

16 Building a Grad Nation March 2012
E Duc At iO N A N D t h E E cO NO my
“In the long term… the best way by far to improve economic opportunity and to reduce inequality is to increase the educational attainment and skills of American workers.”—Ben Bernanke, Chairman of the Federal Reserve
A Note to the Reader The authors of this report have shared progress and challenge on the high school dropout epidemic, including best practices and recent developments at the local, state, and national levels. But we need you to continue to be successful. Solutions exist in your school, your youth center, and your community—and we want to learn about them. We are interested in learning about best practices, efforts that have been evaluated and tested, and information that may be of interest to other schools, communities, and states. If you have a suggestion, idea, or comment, please write us at [email protected]. We look forward to hearing from you.
This annual update on the high school dropout crisis describes what is at stake to our nation, the Grad Nation Campaign’s “Civic Marshall Plan” of action to address it, the latest data on progress and challenge, and paths forward to accelerate gains in graduating more students from high school prepared for college and productive work. (Please also see the appendices for additional information on the Civic Marshall Plan and other key Grad Nation initiatives.)
The high school dropout crisis in the United States claims more than one million students each year. This crisis costs the nation hundreds of billions of dollars in lost revenue, economic inactivity, and increased social services.29 The nation’s graduation rate increased three and a half percentage points from 2001 to 2009, and inched up a half percentage point to 75.5 percent from 2008 to 2009. Even with these increases, nearly one in four Americans and four in 10 minorities, do not complete high school with their class.30 (Appendix E: Graduation Rate Definitions, History, and Economic Considerations provides additional details on these calculations.)
Lagging high school graduation rates come at a time when the demands of today’s globally competitive economy have placed a premium on education. In the last 40 years, the equation has completely flipped—in 1973, 73 percent of all U.S. jobs required only a high school diploma, while in this and future decades, most jobs will require not only finishing high school, but also some college. More than 53 percent of business leaders at large companies and 67 percent at small companies say it is difficult to recruit employees in the U.S. with the skills, training, and education their companies need, despite unemployment at over 8
percent and millions of Americans seeking jobs.31
Worse yet, the education gap between the rich and the poor is growing, signaling a growing opportunity divide.32 Addressing these realities and increasing high school and college graduation rates in America will improve the life prospects of individuals, the nation’s financial health, and our competitiveness in the global economy.
Research supports the fact that better educational outcomes lead to greater economic returns. Increasing educational attainment means higher wages and greater social mobility for individuals and increased revenues from productive workers. It is also correlated with lower public expenditures on social services and a rise in gross domestic product. As more Americans receive their high school and college diplomas, the skills gap can close, and our workforce can become more globally competitive.
More specifically, we know that high school graduates earn on average $130,000 more over the course of their lifetimes.33 College graduates earn at least $1 million more over their lifetimes than high school dropouts.34 Educating our population would boost economic opportunity and reduce inequality, right at a time when the rates of social mobility in the U.S.—the ability of those in the lowest rungs of the economic ladder to climb to the top—are lower than in many European nations often viewed as class systems.35
Doing a better job educating our future workforce would also help close America’s skills gap. America needs three million more college-educated workers by 2018 than it is projected to have by that time and the share of American jobs requiring some postsecondary

Building a Grad Nation March 2012 17
E Duc At iO N A N D t h E E cO NO my
education will increase to 63 percent over the next decade.36 Education was responsible for up to one-third of the productivity growth in the United States from the 1950s to the 1990s. In fact, raising U.S. educational achievement levels to those of better-performing nations like Finland and Korea would have lifted our 2008 GDP from nine to 16 percent.37 Improving education could have the power to grow the economy by boosting the gross domestic product (GDP) and creating jobs.
Chairman Bernanke is right: we must educate our way out of the economic crisis. Addressing the dropout crisis requires the attention of and investment from all levels—local, state, and federal—and at all ages, starting from the earliest years. Communities across America are experiencing the economic effects of the dropout crisis and, in a tough fiscal climate, the need to act. The economic benefits of improving the educational outcomes of the nation’s high school students can be used to encourage community members and policymakers to invest time, energy, and financial resources into an effort to improve high school graduation rates. The reasons to invest are clear—the following pages outline the progress and challenge of those investments.
THE ECONOMIC COSTS OF A SINGLE CLASSOF DROPOUTS
If each state had met the Civic Marshall Plan goal of a 90 percent graduation rate, there would have been 580,000 additional high school graduates from the Class of 2011 . These additional graduates would have driven significant growth to local, state, and national economies due to the $5 .3 billion in additional income that they would have been expected to earn with a high school diploma as compared to their earnings as dropouts . This single class of additional graduates would have been expected to spend an extra $19 billion in
home sales by the midpoint of their careers and an additional $669 million on vehicle purchases each year . This and other increased spending would have created a ripple effect through the national economy, generating more than 37,000 new jobs and increasing the gross domestic product by $6 .6 billion . State governments would also benefit, likely generating an additional $1 .8 billion in additional tax revenue each year as a result of the increased economic activity .38 Because these benefits are just what would be expected from a single class of additional graduates, sustaining the goal over additional classes would yield multiple benefits .
Individual Economic Outcomes by Education
Unemployment Rate in 2010
Data Source: Bureau of Labor Statistics, Current Population Survey
Median Weekly Earnings in 2010Doctoral Degree
Professional Degree
Master's Degree
Bachelor’s Degree
Associate’s Degree
Some College, No Degree
High School Graduate
Less than a High School Diploma
$1,532
$1,610
$1,272
$1,038
$767
$712
$626
$444
2.5%
2.4%
4%
5.4%
7%
9.2%
10.3%
14.9%
America’s Workforce and Education Gap
Data Source: A. Carevale, et al. Help Wanted and U.S. Census Bureau, American Community Survey, 2009
Associates Degree
High School Dropouts
Bachelor’s Degree
High School Graduates
Graduate Degree
Some College
Projected 2018 Jobs
Postsecondary
2009 Population
0% 20% 40% 60% 80% 100%
10 23 12 17 28 10
10 18 7 20 29 16

18 Building a Grad Nation March 2012
E Duc At iO N A N D t h E E cO NO my
Cleveland: Urgent Action to Revitalize a School District – and Local Economy Using the recently released Adjusted Cohort Graduation Rate (ACGR) for 2010, Ohio has a 78 percent on-time graduation rate . Cleveland has a rate of 54 percent, lagging both the rate in Ohio and the nation .39 Of every 100 children who enter the 9th grade in Cleveland, only 23 will go to college, and of those, only seven will graduate from college within six years .40 Classified ads reveal that there are more than 650 job openings in engineering, medical fields and technology alone41—all of which require college degrees . Statewide, and ironically at a time of high unemployment, Ohio has 70,000 unfilled positions in search of skilled workers .42 Manpower’s latest Talent Shortage Survey found that 52 percent of U .S . employers are experiencing difficulty filling mission-critical positions within their organizations,43 while 67 percent of small business employers across America, which create more than half of all new jobs, reported that they have difficulty finding qualified U .S . workers .44 Civic leaders in Cleveland are coming together with a sense of urgency to ensure more Cleveland students graduate from high school and college .45 They recently launched the Higher Education Compact of Greater Cleveland, which aims to “help students prepare for college, get admitted, thrive, and earn degrees .” Leaders of this initiative explain that collaboration is the key, and that they “are trying to create a cultural expectation in Cuyahoga County that you better go to college… You better get a degree . If you don’t, you’d better have a pretty robust vocational plan .”46 For more information on the Higher Education Compact, visit www .highereducationcompact .org and www .highereducationcompact .org
Snapshot
$178 million**
If Ohio achieves the Grad Nation goal of a 90% high school graduation rate for just a single high school class, the state would likely see an increase in its Gross State Product* of more than
* The Gross State Product demonstrates the level of a state’s economic activity, measuring the fi nal market value of all goods and services produced in the state.
** Courtesy of the Alliance for Excellent Education

Building a Grad Nation March 2012 19
Part 1: The Civic Marshall Plan to Build a Grad Nation

20 Building a Grad Nation March 2012
t h E c i v i c m Ar s hALL P L A N t O Bu i LD A G r AD NAt iO N
Launched by America’s Promise Alliance in 2010, Grad Nation is now a large and growing movement of dedicated organizations, individuals and communities working to end America’s dropout crisis. The engine of the campaign is the Civic Marshall Plan.
The Civic Marshall Plan. A coalition of leading U.S. organizations gathered in March 2010 to develop a plan of action for ending the dropout crisis in America once and for all. The strategies for achieving this goal became known as the Civic Marshall Plan (CMP).
(Please see Appendix K for a full list of the Civic Marshall Plan Leadership Council.)
GRAD NATION AND THE CIVIC MARSHALL PLAN
In the aftermath of World War II, Secretary of State George C . Marshall instructed George Kennan and his policy planning staff to ”avoid trivia” in developing their plan to help rebuild Europe . A coalition of leading institutions has adopted this same approach in developing a “Civic Marshall Plan” to end the dropout epidemic . As the engine of the larger Grad Nation campaign, the Civic Marshall Plan has two clear goals:
– A 90 percent nationwide high school graduation rate for the Class of 2020 (at 75 .5 percent for the Class of 2009, an ~1 .3 percentage point increase per year is needed through 2020); and
– The highest college attainment rates in world, with at least six in 10 students earning a college degree by 2020 (up from three in 10 today47) .
The Goals. As a key part of the larger Grad Nation campaign, the Civic Marshall Plan’s two goals are, first, a 90 percent high school graduation rate nationwide by the Class of 2020 with all students ready for college and the 21st Century workforce, and, second, the highest college attainment rates in the world by 2020.
How to achieve these goals? We know that a small number of schools are responsible for about half of the dropouts, enabling a targeted response. Through early warning systems, we are able to know which students are likely to dropout, absent intervention.
We also know that evidence-based solutions exist to keep students on track to graduate from high school, ready for college and work. Thus, we are left with the challenge of getting the right supports to the right students at the scale and intensity required. So, like its namesake, the Civic Marshall Plan focuses on using the main evidenced-based levers to address the dropout crisis. The Civic Marshall Plan emphasizes a multi-sector approach that engages a range of stakeholders to affect individual, community, state, and national outcomes.
THE CIVIC MARSHALL PLAN HAS FOUR LEADING PRINCIPLES AND FOLLOWS A COHORT-BASED APPROACH.
PRINCIPLES
Strategic Focus: We must direct human, financial and technical capacities and resources to low-graduation rate communities, school systems, schools, and disadvantaged students .
High Expectations: All students deserve a world-class education and all children will succeed, if provided appropriate supports .
Accountability and Support: We must measure progress and challenge so that we know what’s working—and what is not . We must build state, school system, and school capacity to improve graduation and college readiness rates .
Thoughtful Collaboration: Ending the dropout crisis requires an all-hands-on-deck approach . To achieve collective impact, collaborations must be deliberately planned, guided by shared metrics and thoughtfully integrated to maximize efficiency and outcomes .
For additional information on these aspects of the Civic Marshall Plan, please see Appendices A and B .

Building a Grad Nation March 2012 21
t h E c i v i c m Ar s hALL P L A N t O Bu i LD A G r AD NAt iO N
Civic Marshall Plan BenchmarksTo ensure the Class of 2020 reaches a high school graduation rate of 90 percent, the Civic Marshall Plan Leadership Council established a phased approach with clear goals and benchmarks for the years ahead. The effort is data-driven, community-based, and organized at the local, state, and national levels.
Elementary and Middle School Years (2012-2016):
Grade level reading: Substantially increase the number of students reading with proficiency by 4th grade.
Chronic absenteeism: Reduce chronic absenteeism (missing 20 days or being absent 10 percent or more of school days), which is a key early warning indicator of a student being “off track” to graduate.
Early Warning Systems: Establish early warning indicators and intervention systems that use the early predictors of potential dropout (attendance, behavior, and course performance in reading and math).
The Middle Grades: Redesign the middle grades to foster high student engagement and preparation for rigorous high school courses.
Adult and Peer Supports: Provide sustained and quality adult and peer support to all students who want and need these supports, continual supports from adults serving in schools as “success coaches” for all off-track students, and intensive wraparound supports for the highest-need students.
High School Years (2017-2020):
Transition Supports: Provide transition supports for struggling students in grades 8-10 in all schools with graduation rates below 75 percent, as well as their feeder middle and elementary schools.
Dropout Factories: Transform or replace the nation’s high school dropout factories with effective schools.
Compulsory School Age: Raise the compulsory school attendance age to when students graduate or 18 in all states, coupled with support for struggling students.
Pathways to College and Career: Provide all youth (including those who have dropped out) clear pathways from high school to college and career.
Dropout Recovery: Support comprehensive dropout recovery programs for disconnected youth.
In the pages that follow, the report provides updates on our nation’s progress against the Civic Marshall Plan benchmarks. It includes snapshots of issues of importance to the nation, as well as powerful case studies of how states and school systems are beating the odds, serving as a challenge that others can too. (Detailed Civic Marshall Plan indices, which include the economic benefits of boosting high school graduation rates for every state, are available at www.every1graduates.org. A sample Civic Marshall Plan Index is also available in Appendix F).

22 Building a Grad Nation March 2012
Part 2:Update on the Civic Marshall Plan—What the Latest Data Tell Us
Building a Grad Nation March 2012 23
u P DAt E O N t h E c i v i c m Ar s hALL P L A N—W hAt t h E L At E s t DAtA t E LL u s
This section provides an update on the nation’s progress on graduation rates, the number of “dropout factory” high schools, and the number of students who attend dropout factories. It also names the state leaders and laggards in accelerating graduation rates.
The State of Graduation Rate DataThe landscape for calculating high school graduation rates in the United States has changed rapidly over the last decade. Through the 2000s, different calculations resulted in different rates, causing confusion and a limited ability to track progress. To make graduation rates more accurate and comparable, the U.S. Department of Education issued regulations in 2008 requiring every state, school system and school to report graduation rates based on the Adjusted Cohort Graduation Rate (ACGR), starting in the 2010-11 school year.48
With its foundation in the 2005 Graduation Counts Compact from the National Governors Association, the ACGR measures the proportion of first-time 9th-graders who graduate with a regular diploma four years after starting high school, after adjusting for transfers in and transfers out to other schools or degree-granting educational institutions during the high school years.
With ACGR, it will be possible to accelerate efforts to compare the extent to which students are graduating from high school, on time, across schools, and districts. It will be possible to identify from which schools, and districts others should learn, as well as which schools and districts continue to struggle with low graduation rates. As importantly, communities will be able to formulate data-based Civic Marshall Plans to raise their graduation rates by identifying the high schools producing most of their dropouts. This will enable communities to focus resources where they are needed most and will have the greatest impact.
Although all states were expected to use ACGR by spring 2012, only about 35 are reporting these data. Most others are expected to release them this year. A few states received extensions, further delaying release. By the 2013 Building a Grad Nation Update, the authors expect to have consistent and verifi ed ACGR from 48 states and the District of Columbia. The Everyone Graduates Center and Civic Enterprises will update ACGR data throughout the year. Absent ACGR data for all states, this report uses the Averaged Freshmen Graduation Rate (AFGR) and Promoting Power. AFGR, which identifi es graduation rates and numbers of graduates, is an interim measure adopted by the U.S. Department of Education after expert advice. Promoting Power identifi es schools with 60 percent or fewer seniors than freshmen three years earlier.
INTERPRETING, OR MISINTERPRETING,THE DROPOUT RATE
Dropout rates and graduation rates are often calculated in very different ways . Therefore, graduation rates are not the inverse of dropout rates (i .e . a 7 percent dropout rate does not imply a 93 percent graduation rate) . Typically, dropout rates are the total number of students who drop out from all grades in high school or all grades overall in a district or state in a given year . Moreover, states and districts often have particular criteria that need to be met for a student to be officially called a dropout . These criteria vary by location, and often do not account for all the students who leave school . As a result, it is possible to see dropout rates in the single digits, when a school, district, or state is graduating less than three-fourths of its students . (Please also see Appendix E for additional information on graduation rate definitions, history, and economic considerations .)
Progress and Challenge in Improving High School Graduation Rates Absent ACGR data for all states, this report uses the best and most recent data available: the Averaged Freshman Graduation Rate (AFGR) for 2009 and Promoting Power for 2010.
Recent Trends
The high school graduation rate improved in the fi rst decade of the 21st Century. The number of dropout factory schools also declined. The nation’s graduation rate increased three and a half percentage points from 2001 to 2009, and inched up half of a percentage point to 75.5 percent from 2008 to 2009, as measured by the AFGR. In 2009, Wisconsin became the fi rst state to achieve the Civic Marshall Plan goal of a 90 percent high school graduation rate and Vermont is only 0.4 of a point shy of this goal at 89.6 percent. (The 2011 book, Dropping Out: Why Students Drop Out of High School and What Can Be Done About It, chronicles the debate over dropout and graduation rates).
With the Class of 2010, there are 457 fewer dropout factory high schools (schools with promoting power of 60 percent or less) than in 2002, a decrease of 23 percent. As Table 1 shows, there was a net decline of 84 schools between 2009 and 2010, reducing the number from 1,634 to 1,550.

24 Building a Grad Nation March 2012
u P DAt E O N t h E c i v i c m Ar s hALL P L A N—W hAt t h E L At E s t DAtA t E LL u s
Table 1: Total Number and Change in Number of Dropout Factory High Schools*
A Closer Look at Declines in Dropout Factory High Schools, by Locale
There are several important trends apparent in the declining number of dropout factory high schools, when the data is examined by locale (Table 2).
First, since 2008, the decline in the number of dropout factories in cities has accelerated. Overall in these locales, there are 154 fewer dropout factory high schools in cities in 2010 than in 2002, with 116 fewer between 2008 and 2010. Second, the largest overall decline, since 2002, occurred in the suburbs, primarily in the South. Finally, progress in towns and rural areas has ebbed and flowed. Overall, the number of dropout factory high schools in these locales declined since 2002, even though the number increased from 2009 to 2010. One year of data has limitations, but these results show the need for a deeper understanding of what is occurring in the towns and rural areas with low graduation rate high schools. (Please see the case study on Washington County, Maryland for additional information on rural communities.)
Table 2: Number and Change in Number of High Schools with Promoting Power of 60% or Less, by Locale 2002 to 2010
Fewer Students Attend Dropout Factory High Schools
Perhaps the most encouraging statistic is that about 790,000 fewer students attended dropout factory high schools in 2010 than in 2002 (Table 3). Moreover, the rate appears to be accelerating. Between 2002 and 2008, about 402,000 fewer students were enrolled in high schools where graduation is not the norm. Between 2008 and 2010, this number fell by another 388,000 students. This indicates that the rate of improvement between 2008 and 2010 was almost three times as fast as it was between 2002 and 2008. Overall, the national decline is driven by fewer dropout factories and decreases in the enrollments of the remaining such schools. As such, the number of students attending dropout factory high schools captures the impact of school reform, school closure, increased alternatives, and students and families voting with their feet.
Total Number of High Schools with a Promoting Power of 60% or below
Class of 2002 2007Class of 2008 1746Class of 2009 1634Class of 2010 1550
Change in the Number of High Schools with a Promoting Power of 60% or below
Change 2002 to 2010 -457Change 2002 to 2008 -261Change 2008 to 2010 -196Change 2008 to 2009 -112Change 2009 to 2010 -84
Percent Change 2002 to 2010
23% fewer in 2010 than 2002
*The 2010 numbers do not include the District of Columbia.
Cities Suburbs Towns Rural
Class of 2002
905 477 247 378
Class of 2008
867 347 172 360
Class of 2009
849 367 123 295
Class of 2010
751 306 165 328
Change 2009-10
-98 -61 +42 +33
Change 2008-10
-116 -41 -7 -32
Change 2002-10
-154 -171 -82 -50
Percent Change 2002 to 2010
-17% -36% -33% -13%

Building a Grad Nation March 2012 25
u P DAt E O N t h E c i v i c m Ar s hALL P L A N—W hAt t h E L At E s t DAtA t E LL u s
Rural Success Story—Washington County Public Schools ACCELERATING PROGRESS ACROSS458 SQUARE MILES
In the Civic Marshall Plan Leadership Council discussions, members have raised the importance of accelerating progress in addressing the dropout challenge in rural areas . We, therefore, wanted to highlight an example of such progress . Since 2000, the Washington County Public Schools (WCPS) in Western Maryland has increased its high school graduation rate by nearly 15 percentage points, out-performing the state by more than 10 percentage points .49 By 2011, more than nine out of 10 students continued to graduate with their peers . Using the State of Maryland graduation rate data (the leaver rate), the 2000 graduation rate for WCPS and Maryland were 78 percent and 82 percent, respectively . By 2010, the WCPS graduation rate was 92 percent .
WCPS is part of the tri-state area that includes nearby Pennsylvania and West Virginia . Like many rural school systems, it faces challenges related to limited resources, transportation, and poverty . The district serves approximately 22,000 students (79 .9 percent White, 13 .5 percent African American, and 4 .4 percent Hispanic), including nearly half of whom are characterized as low-income50 and two percent who are described as English Language Learners .51 With 46 schools in its system, WCPS covers 458 square miles .
According to district leadership, even with continued increases in poverty indicators over the last 10 years (including an increase in the percentage of students who are receiving free or reduced meal benefits from 27 percent in 2000 to 46 .8 percent in 201152), Washington County’s efforts have positioned the system to maintain a high graduation rate, due in large part to numerous targeted initiatives designed to curtail dropouts . WCPS has learned that there is no one initiative or program that can effectively produce significant gains in dropout prevention and graduation rate improvement . Rather, the school district learned—through its successes and challenges—that leadership must continually refine and refocus efforts to address the needs of its students .
After recognizing the system’s graduation rate problem in 2001, a new superintendent and leadership team began to intensely focus on dropout prevention and graduation rate acceleration . District leaders credit the core of their success to the implementation of a prevention model for students who were at risk of dropping out, as opposed to an 11th hour crisis management model used previously . WCPS identified four key issues as critical to driving student achievement:53
Case Study
$99 million*
If Maryland achieves the Grad Nation goal of a 90% high school graduation rate for just a single high school class, the state would likely see an increase in its Gross State Product of more than
* Courtesy of the Alliance for Excellent Education

26 Building a Grad Nation March 2012
u P DAt E O N t h E c i v i c m Ar s hALL P L A N—W hAt t h E L At E s t DAtA t E LL u s
1 . A Focus on Attendance. WCPS recognized early on that there was a need to ensure that children were in school every day . Data reports regarding student attendance were published regularly and carefully analyzed to identify students with patterns of high absenteeism . Staff was specifically assigned to work with individual students to overcome poor attendance patterns at all levels . This concentrated effort affected attendance positively across the system . WCPS showed that school systems needed to start focusing on student attendance as early as primary and elementary grades .
2 . A Focus on Academic Success. WCPS recognized that students who were not passing core classes were at a greater risk of falling behind and eventually dropping out . Today, data on student academic progress continue to be reviewed regularly, and targeted academic resources and interventions are designed to encourage success . Specifically
– Teachers who have demonstrated an ability to work positively with struggling students are assigned to these students .
– WCPS’s budget has been realigned to provide resources for before-, during-, and after-school academic supports for struggling and failing students .
– Summer school programming has been redesigned to include additional sites, making it more accessible for all students .
– A credit recovery program has been designed for students who have failed a course but need only a minimal amount of remediation to achieve the course objective .
3 . A Focus on Alternative Learning. WCPS recognizes that not all students will achieve in a traditional learning environment . In response to this reality, district leaders developed programs to meet the needs of students who have a pattern of disruption, have other social issues, or need to work, which impede their success and sometimes even the success of classmates . Their efforts include
– Expansion of Evening High School, which allows students to complete graduation requirements at an alternative time and setting, in addition to attending their high school .
– Designated staff at a learning center to meet the needs of teen parents . This program provides academic, social, and community supports for mothers, fathers, and newborns, in partnership with local service and education agencies that can provide wraparound supports .
4 . A Focus on Student Advocacy. WCPS recognizes that some students need stronger supports to encourage their success . To achieve this, the budget was realigned for the creation of Student Intervention Specialists (SIS), hired specifically to identify students needing support and monitoring their success daily . Student Intervention Specialists
– Work with students to develop goals that are mutually agreed upon;
– Focus on building relationships with the students and their families to ensure that everyone is actively involved in the student’s success;
– Empower students to take responsibility for their success by setting goals, with a focus on graduation and career planning; and
– Increase support for students transitioning among schools, grade levels, and outside services .
Through these targeted and ongoing commitments to students, since 2004, the WCPS graduation rate has remained substantially higher than the state average .54
Case Study

Building a Grad Nation March 2012 27
u P DAt E O N t h E c i v i c m Ar s hALL P L A N—W hAt t h E L At E s t DAtA t E LL u s
Table 3: Change in the Number of Students Attending Dropout Factory High Schools
Progress is Not Fast Enough to Reach the Grad Nation Goal
While the data on graduation rates, dropout factory high schools, and students attending them indicate the nation is making progress, they also show that the improvement is not happening fast enough. If the rate of progress achieved during the first decade of the 21st century continues during the second decade, the nation’s graduation rate in 2020 will be closer to 80 percent than the goal of 90 percent. At the current rate, there will still be more than 1,000 high schools where the odds of graduating are typically no better than 50/50 in 2020.
State Differences in Improving High School Graduation RatesAn examination of where progress occurred and stalled in the last decade reveals a clearer picture of where efforts need to be intensified and accelerated.
A Sub-set of States is Driving National Progress
The most recent graduation rate data show clearly that the modest overall national improvement is the result of two very different sets of states. As the map shows, 20 states saw medium to high growth in their graduation rates, averaging improvements of more than one-half of one percentage point annually. Nine of these states averaged more than a percentage point improvement per year. Tennessee and New York led the way as the only states with double-digit gains. Each saw an average 2 percentage-point improvement per year, with truly impressive gains since 2002 (18 percentage points in Tennessee and 13 in New York). In addition, four states—Colorado, South Dakota, West Virginia, and Louisiana—had modest gains of about 3 percentage points over the last decade, equal to the national average. These improvements were counter-balanced by 25 other states that saw limited, stagnant or declining graduation rates over the last decade. In short, about half the states in the nation moved forward and about half did not.
Change in the Number of Students Enrolled in High Schools with a Promoting Power of 60% or Less
2009 to 2010 -204,000*2008 to 2009 -184,0002002 to 2008 -402,0002008 to 2010 -388,000
2002 to 2010 -790,000
*All numbers are rounded to nearest thousand
$578 million*
If Tennessee and New York achieve the Grad Nation goal of a 90% high school graduation rate for just a single high school class, they would see increases in their individual gross state products that together would likely total more than
* Courtesy of the Alliance for Excellent Education

28 Building a Grad Nation March 2012
u P DAt E O N t h E c i v i c m Ar s hALL P L A N—W hAt t h E L At E s t DAtA t E LL u s
Changes in Graduation Rates, by State 2002 to 2009
Tennessee 17 .8
New York 13 .0
South Carolina 8 .1
Alabama 7 .8
Kentucky 7 .8
Vermont 7 .6
Making large gains (7+ points)
North Carolina 6 .9
Alaska 6 .7
Georgia 6 .7
New Hampshire 6 .5
Missouri 6 .3
Wisconsin 5 .9
Massachusetts 5 .7
Florida 5 .5
Oregon 5 .5
Maine 4 .3
Delaware 4 .2
Minnesota 3 .5
Hawaii 3 .2
Kansas 3 .1
Colorado 2 .9
Louisiana 2 .9
West Virginia 2 .8
South Dakota 2 .7
Michigan 2 .4
North Dakota 2 .4
Montana 2 .2
Indiana 2 .1
Ohio 2 .1
Texas 1 .9
Virginia 1 .7
Iowa 1 .6
Washington 1 .5
Idaho 1 .3
Oklahoma 1 .3
Mississippi 0 .8
Wyoming 0 .8
Illinois 0 .6
Maryland 0 .4
Pennsylvania 0 .3
Rhode Island -0 .4
New Jersey -0 .5
Arkansas -0 .8
Nebraska -1 .0
Utah -1 .1
California -1 .7
Arizona -2 .2
New Mexico -2 .6
Connecticut -4 .3
Nevada -15 .6
Making moderate gains (3.0-6.9 points)
Making modest gains equal to national average (2.7-2.9 points)
Making limited or no progress (0-2.6 points)
Declines

Building a Grad Nation March 2012 29
u P DAt E O N t h E c i v i c m Ar s hALL P L A N—W hAt t h E L At E s t DAtA t E LL u s
Leaders and Laggards
Just 12 states drove the progress in graduation rates in the prior decade, taking states’ populations into account. As seen in Table 4 below, each of these state increases led to at least 4,000 more graduates in 2009 than if the graduation rate had remained at the 2002 level (in other words, with population held constant). These states collectively accounted for 104,000 of the 134,000 additional graduates. These gains were offset, in part, by 10 states that had lower graduation rates in 2009 than in 2002.
Table 4: Impact of Change in Graduation Rate from 2002 to 2009 on Number of Graduates in 2009
State Differences in the Number of Students Attending Dropout Factory SchoolsAs with graduation rates, some states improved substantially in reducing the number of students attending dropout factories, while others stagnated or saw increases.
As Table 5 encouragingly shows, 36 states have fewer students attending dropout factory high schools in 2010 than in 2002. Collectively, improvements in southern states account for 63 percent of the decline. This reflects both substantial improvement within these states and the fact that in 2002 over half the dropout factory high schools were in the South. Improvements in the West and Northeast account for 16 percent and 15 percent, respectively, of the improvement, while progress in the Midwest accounts for only 5 percent of the decline.
Just 15 states account for 85 percent of the overall decline in students attending dropout factory high schools between 2002 and 2010. There are now at least 15,000 fewer students in each of these states enrolled in schools where graduation is not the norm. This is counter-balanced by the 14 states that collectively saw an increase of about 96,000 students attending dropout factory high schools in the same time period.
Number of Additional/Fewer Graduates in 2009
National 116,706Leading StatesNew York 31,978Tennessee 13,880Florida 12,242Georgia 8,696North Carolina 7,969Texas 6,657South Carolina 4,801Missouri 4,775Alabama 4,693Massachusetts 4,468Wisconsin 4,253 Kentucky 4,205Sub-Total 12 Leading States 108,617Lagging StatesCalifornia -8,913Nevada -5,512Connecticut -1,994Arizona -1,892New Mexico -720New Jersey -557Utah -422Arkansas -303Nebraska -235Rhode Island -53Sub-Total 10 Lagging States -20,601

30 Building a Grad Nation March 2012
u P DAt E O N t h E c i v i c m Ar s hALL P L A N—W hAt t h E L At E s t DAtA t E LL u s
Region/State
2002 Total number of schools
2010 Total number of schools Change
Change in the number of high school students attending a high school with a Promoting Power of 60% or Less
Northeast
New York 145 130 -15 -64,777
Pennsylvania 48 47 -1 -19,832
Connecticut 13 4 -9 -14,928
Massachusetts 24 18 -6 -10,917
New Jersey 24 22 -2 -6,797
Maine 4 1 -3 -2,437
Vermont 3 0 -3 -2,311
Rhode Island 7 5 -2 -1,690
New Hampshire 5 3 -2 1,784
Subtotal 273 230 -43 -121,905
Midwest
Indiana 30 15 -15 -19,070
Michigan 79 82 3 -14,229
Wisconsin 16 9 -7 -7,893
Iowa 4 1 -3 -4,669
Minnesota 6 5 -1 -4,082
Kansas 9 8 -1 -3,074
South Dakota 3 1 -2 -2,864
Illinois 63 61 -2 -2,338
North Dakota 0 0 0 0
Missouri 25 25 0 1,604
Nebraska 4 5 1 2,015
Ohio 75 135 60 12,488
Subtotal 314 347 33 -42,112
Region/State
2002 Total number of schools
2010 Total number of schools Change
Change in the number of high school students attending a high school with a Promoting Power of 60% or Less
South
Texas 240 118 -122 -151,488
Florida 162 100 -62 -130,586
Georgia 156 102 -54 -55,302
South Carolina 101 58 -43 -44,221
Tennessee 58 19 -39 -39,506
Alabama 71 35 -36 -27,260
North Carolina 106 78 -28 -26,096
Kentucky 39 18 -21 -17,863
Mississippi 52 35 -17 -17,260
Louisiana 64 60 -4 -10,692
Delaware 8 7 -1 -3,533
West Virginia 6 3 -3 -2,824
Oklahoma 15 17 2 67
Virginia 26 26 0 3,144
Arkansas 5 12 7 4,964
Maryland 17 28 11 18,310
Subtotal 1,126 716 -410 -500,146
West
California 129 126 -3 -102,611
Arizona 37 22 -15 -21,945
Washington 32 15 -17 -21,442
Colorado 32 15 -17 -18,449
Oregon 7 0 -7 -5,945
Alaska 9 6 -3 -4,808
New Mexico 27 22 -5 -4,157
Montana 1 1 0 -216
Wyoming 1 2 1 135
Utah 1 2 1 1,914
Hawaii 6 13 7 5,732
Idaho 2 6 4 6,553
Nevada 8 27 19 39,790
Subtotal 292 257 -35 -125,449
total 2,005* 1,550 -455 -789,612
Table 5: Low Graduation Rate High Schools by Region/State 2002 - 2010
* District of Columbia not included in 2002 and 2010 data.

Building a Grad Nation March 2012 31
u P DAt E O N t h E c i v i c m Ar s hALL P L A N—W hAt t h E L At E s t DAtA t E LL u s
Comparing Graduation Rate Increases with Dropout Factory DeclinesStates Driving National Improvements: Raising Graduation Rates and Reducing the Number of Students Attending Dropout Factory High Schools
Eleven of the 12 states that had the greatest gains in the number of students graduating from high school also had large declines in the number of students attending dropout factory high schools.
About 20 percent of states have been driving overall national improvements, as seen by comparing the states with the greatest graduation rate gains with the states having the greatest declines in students attending dropout factory high schools. Nine of the 12 states (Alabama, Florida, Georgia, Kentucky, New York, North Carolina, South Carolina, Tennessee, and Texas) with the biggest increases in graduates were among the top 15 states with the biggest declines in students attending dropout factories. Massachusetts and Wisconsin also saw significant increases in the number of graduates and declines in the number of students attending dropout factory high schools. These two states, however, started with a smaller percentage of students in these high schools, so they are not listed among the top 15 states. Missouri stands out as having seen a substantial increase in graduates without a corresponding decline in the number of students attending dropout factory high schools.
The correlation between having a decline in the number of students attending low graduation rate high schools and increasing the number of high school graduates is also apparent, though less strong. Seven of the top 15 states with declining numbers of students attending dropout factory high schools are not among the top 12 states with gains in graduates. Indiana, Washington, and Colorado experienced small gains in high school graduates and larger decreases in the number of students attending dropout factory high schools. In these cases, the dropout factory data (2010) are one year ahead of the graduation data (2009), indicating that the most recent declines in students attending dropout factory high schools may have not fully translated into increasing numbers of graduates.
Warning Signs: No Graduate Gains, but Substantial Declines in the Number of Students Attending Dropout Factory High Schools
Four states—Arizona, California, Mississippi and Pennsylvania—had flat or even falling graduation rates but substantial declines in the number of students attending dropout factory high schools. By definition, dropout factory high schools are places where graduating is not the norm. However, leaving dropout factories and enrolling elsewhere does not guarantee better outcomes. For example, some charter, virtual, alternative and continuation schools have low graduation rates. States vary considerably in the number of options open to students, as well as the percent having strong graduation outcomes. Moving forward, it will be important to monitor whether an unintended outcome of increased graduation rate accountability is the transfer of more students from regular high schools to alternative or virtual schools that have low graduation rates. This consequence could lead to a decline in the number of students attending low graduation rate regular and vocational high schools, but not overall improvement in the state’s graduation rate.
Challenge Ahead--Moving the Nation to a 90 Percent High School Graduation RateThe data make clear that to reach a 90 percent high school graduation rate by 2020 the nation will need a 14.4 percentage point improvement from 2010 to 2020. Two states, Tennessee and New York, have demonstrated this level of improvement over the past decade, indicating that gains of this magnitude are possible. For the nation to meet this goal, two types of states will need increased attention and enhanced efforts.
First, approximately half of the states made limited or no progress in their graduation rates between 2002 and 2009. These states need to act on the lessons from states that have made substantial progress. Second are the states that made substantial progress, but did so from a very low starting point (graduation rates in the 60 percentiles). These states need to sustain and accelerate the improvements they have achieved. These include Alabama, Florida, Georgia, and North Carolina.

32 Building a Grad Nation March 2012
u P DAt E O N t h E c i v i c m Ar s hALL P L A N—W hAt t h E L At E s t DAtA t E LL u s
A Closer Look at the States that Have Not Made ProgressTable 6 organizes the states that made minimal or no progress through 2009 into one of four categories, combining two factors: (1) the distance a state’s current graduation rate is from 90 percent and (2) the number of students who need to be moved from dropouts to graduates. Together, these dimensions establish the extent of a state’s challenge. The table also provides appropriate peer role models from among the states that have made progress.
The categories are
1. States that need only moderate improvements in high school graduation rates to reach 90 percent, i.e. less than 1 percentage-point improvement per year over ten years;
2. States that need significant improvements in high school graduation rates to reach 90 percent, i.e. 1 or more percentage-point improvement per year over ten years;
3. States that have to improve the graduation outcomes for only a modest number of students to reach 90 percent, i.e. less than 2,000 students per cohort; and,
4. States that have to improve the graduation outcomes for a significant number of students to reach 90 percent, i.e. more than 5,000 per cohort.
Table 6: Categorizing States that Have Made Minimal or No Progress in Raising High School Graduation Rates from 2002 to 2009
Seen in this light, four groups emerge.
Near and Few, Far and Few
First, there are 14 states where fewer than 2,000 students per cohort need to be moved from dropouts to graduates to reach a 90 percent graduation rate. Of these 14, six (New Hampshire, Vermont, Maine, Delaware, Alaska, and Minnesota) have made substantial progress from 2002 to 2009. The others that have not, with the exception of Rhode Island, are geographically clustered among the plains and mountain states-Iowa, Nebraska, North Dakota, South Dakota, Montana, Wyoming, and Idaho. This suggests both a regional consortium approach (as has emerged among the New England states that have made progress) and the potential to learn from states with similar challenges and geography.
Needs to move fewer than 2,000 students per cohort from dropouts to HS Graduates to reach 90% HS Graduation Rate in 2020
Needs to move more than 5,000 students per cohort from dropouts to HS Graduates to reach 90% HS Graduation Rate in 2020
Needs less than 1 percentage point improvement per year to reach 90% HS Graduation Rate in 2020
Near and Few Idaho, Iowa, Montana, Nebraska, North Dakota, South Dakota
Near and Many Pennsylvania, Maryland, New Jersey, Ohio
Needs more than 1 percentage point improvement per year to reach 90% HS Graduation Rate in 2020
Far and Few Rhode Island, Wyoming
Far and Many Arkansas, Arizona, Connecticut, California, Illinois, Indiana, Michigan, Mississippi, Nevada, New Mexico, Oklahoma, Virginia, Washington
Role models Alaska, Delaware, Maine, Minnesota, New Hampshire, Vermont
Florida, Georgia, Massachusetts, New York, North Carolina, Oregon, Tennessee, Texas, Wisconsin

Building a Grad Nation March 2012 33
u P DAt E O N t h E c i v i c m Ar s hALL P L A N—W hAt t h E L At E s t DAtA t E LL u s
Near and Many
The second grouping is the “Near and Many” states of Pennsylvania, New Jersey, Maryland, and Ohio. These contiguous states stretching from the Mid-Atlantic to the Midwest all have high school graduation rates above the national average (in the 80 percentiles). New Jersey, Maryland, and Pennsylvania, however, have essentially made no progress in raising graduation rates between 2002 and 2009. Ohio experienced only modest progress (.3 of a percentage point per year). To reach a high school graduation rate of 90 percent by 2020, Ohio and Pennsylvania each need to graduate 15,000 more students in 2020 than 2009. Maryland must graduate 7,200 more and New Jersey 5,200. Each of these states can point to progress in some school districts (e.g. Baltimore City and Washington County in Maryland; Cincinnati and Canton in Ohio), but these gains have been offset by general stagnation or declines elsewhere. They also have capacity. Ohio and Maryland are both Race to the Top States. Maryland and New Jersey are two of the wealthiest states in the nation, but have been outdistanced in raising graduation rates by states of much more modest means.
Far and Many
The final grouping, the Far and Many states, is where the nation’s goal of a 90 percent graduation rate will in good part be won or lost. There are 13 states that have made very modest gains, no improvements, or slid backwards in their high school graduation rates between 2002 and 2009. They also have large numbers of students (5,000 or more per cohort) who need to be moved from dropouts to graduates, and they need to increase their graduation rate by 1 percentage point or more per year to achieve a 90 percent graduation rate by 2020. For these states and the nation to reach the 90 percent graduation rate, the Far and Many states need to collectively produce a quarter million more graduates in 2020 than in 2009. This comprises nearly 40 percent of the students that the nation needs to turn from dropouts to high school graduates to achieve the Grad Nation goal.
Far and Many states can learn from similar states that have made progress. A number of the Far and Many states also have potentially promising efforts underway. For example, Virginia is among the leaders in building statewide early warning systems (EWS)and requiring the lowest-performing high schools to use them. Education departments in California and Michigan are also piloting efforts to encourage the use of EWS. Nevada has taken its position as the state with the lowest graduation rate to heart: both Clark and Washoe counties have significant efforts underway to accelerate graduation rates. Overall, however, these states face significant challenges and need to accelerate existing efforts. They should develop more broad-based statewide responses to enable significantly more students to graduate from high school.
Key TakeawaysThe most current data on high school graduation rates and dropout factory high schools tells us two important things. First, progress is possible and substantial progress is occurring in a sub-set of states. This progress needs to continue and in a number of cases accelerate. Second, a clear set of states has emerged where both re-doubled local and state efforts and increased national focus and support will be required to achieve a 90 percent high school graduation rate by 2020. The task that remains is to better understand the location of the dropout challenge in those states, to build from the findings of the past decade, and to mobilize an informed and sustained response that is equal to the nature, scale, and scope of the dropout crisis.

34 Building a Grad Nation March 2012
u P DAt E O N t h E c i v i c m Ar s hALL P L A N—W hAt t h E L At E s t DAtA t E LL u s
Table 7: Grad Nation Progress and Challenge Index: Where We Stand on Civic Marshall Plan (CMP) Benchmarks at the Close of 2011
Progress ChallengesNational Average Freshman Graduation Rate (AFGR) increased from 72.6 to 75.5 percent between 2002 and 200955—an average of 0.4 percentage points per year.
The averaged long-term rate of growth in AFGR has declined since the March 2011 Annual Report. Future national growth in AFGR must increase 1.3* percentage points per year for the nation to reach 90 percent by 2020.
Class of 2009 had 116,706 more graduates than the Class of 2002 (holding population change constant).
Class of 2020 needs 583,530 more graduates than Class of 2009 for nation to reach 90 percent.
Twenty-five states had modest to large increases in high school graduation rates (AFGR), 2002 to 2009. Only Wisconsin reached a 90 percent AFGR. Vermont is close, with AFGR of 89.6.
AFGRs declined in 10 states from 2002 to 2009. Fifteen states had no growth or only minimal improvements in graduation rates (AFGR) 2002 to 2009.
States with the lowest high school graduation rates in 2002 are making the most progress. Of the 17 states that had AFGRs lower than the 2002 national average of 72.6, two (TN and NY) made double-digit growth by 2008-09, and six grew 6 to 8 percentage points in this period (AK, AL, GA, KY, NC, and SC). The states with the greatest growth were largely southern states.
The states with the highest high school graduation rates in 2002 are making less significant progress. Of the nine jurisdictions that had AFGRs higher than 80 percentage points in 2001-02, three (NJ, NE, UT) declined by 2008-09 and four (PA, IA, ND, MN) increased by less than 1 percentage point per year, often considerably less. Only two came close to increasing by 1 percentage point or slightly more per year (VT and WI).
African-American, Hispanic and Native American AFGR’s improved 2.0, 2.4, 0.6 percentage points, respectively, since 2008; the 2009 rates are 63.5, 65.9, and 64.8, respectively.
Gaps with White rates remain in 2009 (18.5 percentage points for African Americans, 16.1 for Hispanics and 17.2 for Native Americans).
About 35 states indicate that they have or will publish Adjusted Cohort Graduation rates (ACGR) by early 2012.
All 50 states will not be reporting the new rate until 2014.
457 fewer dropout factories in 2010 than in 2002. 1,550 dropout factories still remain.
789,612 fewer students attended dropout factories in 2010 than in 2002.
1,852,873 students still attend dropout factories.
Compared to 2009, in 2010 the number of urban and suburban dropout factories decreased by 11.5 and 16.6 percent, respectively.
The number of dropout factories has increased by 34.1 percent in towns and 11.2 percent in rural areas from 2009 to 2010.
Thirty two states and the District of Columbia require students to attend school until age 17 or 18.56
Eighteen states permit students to leave school by age 16.57
All 50 states and the District of Columbia have systems of individual student identifiers that enable following students over time. Thirty-nine states provide principals and school leaders with student data and 32 do so for counselors and academic coaches.58
Only eight states provide data on student progress tailored for parents, and five for students.
* 1.3 percentage points = (90% - 75.5%) / 11 [years]; 2020 – 2009 = 11 [years]

Building a Grad Nation March 2012 35
u P DAt E O N t h E c i v i c m Ar s hALL P L A N—W hAt t h E L At E s t DAtA t E LL u s
Georgia: Strategically Accelerating Improvement
GEORGIA IS MAKING GOOD PROGRESS IN ADDRESSING THE HIGH SCHOOLDROPOUT CRISIS.
• Oneofsixstateswiththelowesthighschool graduation rates in 2002, Georgia raised its rate 7 percentagepoints (from 61 percent to 68 percent) by 2010 .59
• From2002to2009,weakpromotingpowerhighschools decreased from about 40 percent of Georgia high schools to about one quarter, 2002 to 2009, across the state .60 Twelve percent of these high schools increased promoting power by 12 percentage points or more . Schools that improved graduation rates by 10 percentage points or more, from 2004 to 2008, to 85 percent or higher (using Georgia calculation methods)61 are primarily in the northern part of the state and metropolitan Atlanta .
• GwinnettCountyPublicSchools,Georgia’slargestdistrict and the 14th largest in the nation, with great diversity and more than 50 percent of its students eligible for free or reduced-price lunch, won the 2010 Broad Prize for Urban Education .
Georgia’s improving high school graduation rate illustrates what can occur when economic and community forces converge . Georgia has large income and education disparities . Metropolitan Atlanta, with 60 percent of the state’s population, is relatively affluent, educated and the hub of population growth; rural areas, small towns and cities are often the reverse . Over two decades, governors, legislators, educators, and corporate and nonprofit leaders have recognized that statewide educational improvement is necessary to drive economic well-being and improve the quality of life . Steps along this “Pathway to Prosperity” include
Funding for greater access to education– The Quality Basic Education Act (QBE) of 1986 attempted to adjust state education funding for revenue-
short school districts . Efforts to promote equity in the provision of funds continue .
– The Georgia Lottery, one of the nation’s first efforts to fund education through gambling proceeds, increased access to both pre-K and college . As a result of this funding, now nearly half the state’s eligible youngsters attend full-day pre-Kindergarten, while 187,00062 undergraduates annually attend Georgia colleges and universities, supported by the HOPE Scholarship .63
Case Study
$371 million*
If Georgia achieves the Grad Nation goal of a 90% high school graduation rate for just a single high school class, the state would likely see an increase in its Gross State Product of more than
* Courtesy of the Alliance for Excellent Education

36 Building a Grad Nation March 2012
u P DAt E O N t h E c i v i c m Ar s hALL P L A N—W hAt t h E L At E s t DAtA t E LL u s
Policy changes for improved curriculum, assessment and accountability – QBE set statewide curriculum standards for the first time . Georgia revised them to national standards in
2005, as part of the American Diploma Project .
– High school graduation and writing assessments began in 1991, with end-of-course testing later added in eight high school subjects . The stronger focus on student outcomes was emphasized with legislation establishing the Governor’s Office of Student Achievement in 2002 .
– The State Department of Education, and in some cases nonprofit partners, fostered leadership development and technical assistance to struggling schools, spurred by No Child Left Behind and its school sanctions .
– The four-tiered high school diploma system that set low expectations for some was eliminated for the class that entered in 2008 . Now, all students seek one diploma, marked by 23 credits and four high-level math and science courses . Simultaneously, the university system added one core credit requirement for entrants, and strengthened criteria for students to acquire and keep the HOPE Scholarship .
Cross-sector collaboration and joint goals for improvement– The Georgia Partnership for Excellence in Education was formed by the Georgia Chamber of Commerce 20 years
ago to foster innovation, promote leadership programs, publicize success, create awareness of needs, and advocate for sound education policies to help the state develop economically . Recently, the partnership joined the United Way, other nonprofits and corporations as a major player in Georgia’s new Ready by 21 initiative .
– University system leaders and the governor started a P-16 effort in 1995 to promote collaboration between school districts and colleges and raise expectations for outcomes . A later governor expanded this into a P-20 effort that aligned legally separate education and government organizations to coordinate strategies .64 Goals included increasing the high school graduation rate, post-secondary and workforce readiness, developing stronger teachers and leaders and raising student performance . The Association of Education Agency Heads (AEAH) established liaisons with workforce development efforts and leading nonprofit organizations .
Positive initiatives for turning dropouts into graduatesCreating positive school climates and identifying, supporting and coaching potential dropouts became a feature of the Georgia landscape in the mid-2000s . One governor promoted a case-managed “graduation coach” program that funded one coach per high school (and later each middle school) to use data to identify, counsel and motivate struggling students . Districts with good results often found local funds after state funding was cut . Separately, Graduate FIRST, a partnership between the state’s Department of Education and a regional education service agency, developed a cadre of coaches, and a model
Case Study

Building a Grad Nation March 2012 37
u P DAt E O N t h E c i v i c m Ar s hALL P L A N—W hAt t h E L At E s t DAtA t E LL u s
coaching process to assist teachers of students with disabilities to track students’ attendance, behavior and course-passing, respond with positive behavior interventions, and encourage receipt of the regular education diploma . Nearly 150 schools participated, and schools that implemented with fidelity appear to have increased graduation rates . A third initiative, by Georgia Appleseed, associated positive, equitable discipline with higher graduation rates, an approach supported by the Department of Education’s Georgia Student Health Survey .
Innovative collaboration between businesses and local education entities contribute to raising graduation rates. Examples include– Southwire, the nation’s largest manufacturer of electrical cables, requires high school diplomas for entry-
level jobs, yet not enough graduates were available from its community’s high schools . Southwire and district personnel developed “12 for Life” to turn around students who are likely to drop out without interventions . “12 for Life” is taught in a facility redesigned into a teaching plant . Students are paid and mentored, and learn entry-level manufacturing skills, work ethic and communication skills, and academics . In the first four years, 301 “12 for Life” students received the Georgia regular diploma, with the number doubling each year . The district graduation rate increased by 13 .4 percentage points (62 .7 in 2005 to 76 .1 in 2011) using Georgia’s graduation rate calculation .65 Southwire hired nearly 20 percent of these graduates from and nearly 40 percent went on to postsecondary education . Southwire was recently awarded an innovation grant from Georgia’s Race to the Top funds to expand and replicate “12 for Life .”
– Business and district partnerships, working with the Technical College System, have created 26 locally designed and managed charter schools (College and Career Academies, or CCAs) with advocacy from the lieutenant governor’s office . Their purpose is to build skills with interesting, rigorous career technical curriculum attuned to local workforce needs . Some serve several high schools within a district and a few are regional . Most offer dual enrollment, industry certification and adult education courses . Several have collaborated with Georgia Power Company and the technical college system to design an energy-related career pathway for the state as well as cost-effective training and certification programs for hard-to-fill skilled or math-related positions . Data from the first CCA show that 94 percent of the students graduate from high school on-time, 95 percent of those dual enrolled earned at least one Technical College certification, and 332 participated in local internships with high ratings from employers . Graduation rates are 14 percentage points higher than at the feeder high school .
The Challenge and Next Steps: The continuing challenge is to better organize the education infrastructure across divisions, further raise expectations, and set strategic policy directions that will apply local “know how” both to increase graduation rates and eliminate the achievement gap between affluent and disadvantaged, White and minority students . A second challenge is to use the Race to the Top awards strategically, developing STEM capacities among teachers and learners, expanding accountability, further building quality leadership and teaching, and promoting healthy school climates . A third challenge is to strengthen data use, at every level, and expand productive initiatives and retrench on efforts that produce few results . A final challenge is to continue the focus on “Pathways to Prosperity” advocated by the governor, state superintendent, other policymakers and business, community, and education leaders .
Case Study

38 Building a Grad Nation March 2012
Part 3: Progress and Challenge in Meeting Benchmarks of the Civic Marshall Plan

Building a Grad Nation March 2012 39
P r O G r E s s A N D chALLE NG E i N m E E t i NG BE Nch m Ar K s OF t h E c i v i c m Ar s hALL P L A N
As detailed earlier in this report, the Civic Marshall Plan to Build a Grad Nation is a cohort-based approach aiming to ensure the Class of 2020 (today’s current 4th graders) reaches a high school graduation rate of 90 percent. The campaign’s leadership determined benchmarks to track students’ progress through elementary school, the middle grades, and high school. The 2012 Annual Update provides an opportunity to report on these benchmarks, and highlight key successes, opportunities and challenges for the nation.
Benchmarks: Elementary and Middle School Years (2012-2016)Substantially increase the number of students reading with proficiency by 4th grade.
Children who do not read well by the end of third grade are four times more likely to drop out of high school than proficient readers. Poor children who do not read proficiently early on are 13 times more likely not to finish high school than good readers who have never lived in poverty.66 The proficiency rate has improved in the last decade, but not at a rate sufficient to reach the Grad Nation goals. According to the National Assessment of Educational Progress (NAEP)67, 34 percent of America’s 4th graders scored at or above proficient on the 2011 national exam, compared to 29 percent on the 2000 exam. More than 65 percent of fourth graders continue to score below proficiency. While there is significant variance within subgroups depending on many factors, a significant gap remains between the percentage of Asian and white 4th graders and their black and Hispanic peers reading at proficiency. All students have shown some improvement in the last decade (see Table 8). (Please also see Appendix H for additional information on graduation rates by racial subgroup.)
Table 8: Improvement in Percentage of Students Reading at or Above Proficiency (2000-2011)
The proficiency levels for low-income students and students with special needs have also shown limited improvement in the last decade. In 2011, only 17 percent of students eligible for free lunch and 27 percent of students eligible for reduced-price lunch were proficient compared to 48 percent of those students who were not eligible for free or reduced-price lunch. Students with special-needs (with disabilities and English language learners) remain significantly behind other students. Only 11 percent of students with disabilities reached proficiency in 2011 (up from 8 percent in 2000) compared to 36 percent of students without a disability. Additionally, of those students who are English language learners, only seven percent were reading at or above proficiency in 2011, compared to 37 percent of those who are not English language learners. States have different ways of determining whether a student is classified as special needs and collecting that data, so consistency of scores between the states may vary. This is a challenge that needs to be addressed, and many organizations are taking the challenge head on.
Race/Ethnicity % Reading at or above Proficiency (2000)
% Reading at or above Proficiency (2011)
White 38 44
Black 10 17Hispanic 13 18Asian/Pacific Islander
41 49

40 Building a Grad Nation March 2012
P r O G r E s s A N D chALLE NG E i N m E E t i NG BE Nch m Ar K s OF t h E c i v i c m Ar s hALL P L A N
The Campaign for Grade-Level ReadingThe Campaign for Grade-Level Reading is a collaborative effort by dozens of funders and nonprofit partners across the nation to ensure that more of our children from low-income families succeed in school and graduate prepared for college, a career, and active citizenship . The Campaign focuses on the most important predictor of school success and high school graduation—grade-level reading by the end of third grade .68 In the past year, the Campaign’s efforts have resulted in considerable advancements on this key benchmark of the Civic Marshall Plan .
In the fall of 2011, America’s Promise Alliance, United Way Worldwide, Mission: Readiness, the National League of Cities, and other sector-leading organizations signed on as Campaign partners . Specifically, ConvergeUS, a new coalition of high tech CEOs seeking to partner with the public and social services sector to develop technology-based solutions to social problems, plans to create mobile technology applications to help parents promote literacy . United Way Worldwide announced its plans to recruit and mobilize one million volunteer reading coaches and tutors, and the Corporation for National and Community Service committed to deploying its network of five million volunteers in service to grade-level reading proficiency . Target Corporation linked its multi-million Library Makeover initiative to the goal of grade-level reading by the end of 3rd grade in partnership with the Campaign . The Institute of Museum and Library Services, which provides federal support to the nation’s 123,000 libraries and 17,500 museums, committed up to $2 million of its National Leadership Grants to support the Campaign’s goals . The Education Commission of the States announced a special Chairman’s initiative to help governors use technology to improve early literacy in partnership with the Campaign and ConvergeUS . Other major partners include the United States Conference of Mayors and the Council for a Strong America, which brings a strong national security message to the Campaign and other efforts to improve the prospects of the nation’s youngest children .
The Campaign’s work and the efforts of its lead supporters are having ripple effects across states and within communities . For example, more than 160 communities have agreed to target early literacy as an urgent priority and are working with the Campaign and its partners to develop plans to address the barriers to grade-level reading . The communities are applying for the All-America City Award, a National Civic League award that, for the first time in its history, is being leveraged against a specific issue outlined in the Civic Marshall Plan: improving third grade literacy .
The national movement focusing on grade-level reading responds to a call to action issued by a special Annie E . Casey Foundation KIDS COUNT report, Early Warning! Why Reading by the End of Third Grade Matters . The 2010 report underscored the troubling data on student achievement and poverty: only 17 percent of children
from low-income families scored proficient in reading on the National Assessment of Educational Progress . Half of them hadn’t even mastered basic reading skills . The Campaign targets three roadblocks to student success; too many children come to school unprepared to learn; too many children miss too many days of school; and too many children lose too much ground during the summer months . Working with its partners in a coordinated and strategic way, the Campaign is determined to remove these and other barriers to student success . For more information, please visit www.gradelevelreading.net and www.allamericacityaward.com
Snapshot

Building a Grad Nation March 2012 41
P r O G r E s s A N D chALLE NG E i N m E E t i NG BE Nch m Ar K s OF t h E c i v i c m Ar s hALL P L A N
Benchmark: Elementary and Middle School Years Reduce Chronic Absenteeism.
Chronic absenteeism (missing 20 days or being absent 10 percent or more of school days) is a key early warning indicator of a student being “off track” to graduate.69 During the past year, recognition of the importance of school attendance and the multiple negative consequences of chronic absenteeism grew significantly. More and more mayors took up the cause. Initial efforts in Baltimore and New York City have spread to Boston, Chicago, San Antonio, and Seattle. Three examples of progress are highlighted here as the nation continues to show improvement.
In New York City, Every Student, Every Day, a comprehensive multi-agency effort led by the office of Mayor Michael Bloomberg had promising first year results. In NYC, one out of five students, more than 250,000, missed a month or more of school in 2009-2010 and 79 percent of the children in the juvenile justice system have records of chronic absenteeism. As part of a multi-tiered response, New York piloted a Success Mentor Corps in 25 elementary, middle and high schools. Teams of Success Mentors were typically matched with 10 to 15 students with records of chronic absenteeism whom they supported at least three days a week, at school, during the school day. The mentors also took part in weekly attendance reviews, led by the principal in which data was continually analyzed to identify trends, develop both whole school and targeted interventions aimed at increasing attendance, and regularly evaluate the effectiveness of the interventions applied. Success Mentors came from national service organizations (including City Year and Reserve) and also involved social worker interns, school staff members, and peers.
In their first year, the Success Mentors helped chronically absent students gain 7,000 additional days of school. Pilot schools with Success Mentors outperformed comparison schools and the city-wide average, with 17 percent more students exiting chronic absence status in elementary schools, and 27 percent more in high schools. This provides confirmation of the importance of the Civic Marshall Plan call to have one success mentor/coach for every 15 to 20 students with off track indicators.
Other facets of the New York City plan include new electronic data-sharing tools, new models for connecting schools to community services, a citywide Ad Council awareness campaign, and new attendance/engagement strategies for students living in shelters and those returning after suspension or juvenile detention.
A second model, Attendance Works, a national initiative that seeks student success by reducing chronic absence, released a three-district study in late 2011 titled Chronic Elementary Absenteeism: A Problem Hidden in Plain Sight, demonstrating that average daily attendance can mask problems with chronic absence. To help the more than 160 cities involved in the national Campaign for Grade Level Reading determine the impact of poor attendance on third-grade reading proficiency, Attendance Works developed district and school level excel-based data tools that calculate the prevalence of chronic absence by grade, school, and sub-population for elementary students. These tools will be available to all districts in late Spring 2012, once they have been fully tested and expanded to the secondary grades. Collaborating with key partners in Oregon, Attendance Works has also recently supported a statewide analysis of chronic absence, which discovered 23 percent of all students in Oregon were missing enough school to become academically at risk (generally recommended as more than 1 month or 10 percent of school days).
Finally, the Get Schooled Foundation, a non-profit that uses the “power of media, technology, and popular culture to motivate young people to graduate from high school”70 held its initial national contests to raise school attendance. A Diplomas Now middle school in Seattle won the fall contest. The Get Schooled Foundation is also partnering with the Everyone Graduates Center to prepare and release a national report on Chronic Absenteeism in late spring. The report will highlight that while every parent receives quarterly information on how many days of school their child has missed, few states, districts or schools report on how many students miss a week or less (on-track) and a month or more (off-track). Without this information, the extent of chronic absenteeism goes unknown within communities and, as a result, it is not possible to organize community-wide efforts to improve it. Yet, as the efforts in a growing number of cities have shown, chronic absenteeism is an issue that requires community-wide efforts involving the

42 Building a Grad Nation March 2012
P r O G r E s s A N D chALLE NG E i N m E E t i NG BE Nch m Ar K s OF t h E c i v i c m Ar s hALL P L A N
school system as well as other city agencies working with nonprofits and the community to solve. During the last year, there was also growing recognition of how strongly school achievement is affected by school attendance. The Georgia State Department of Education released research showing that “increasing attendance by just three percent (or 5 instructional days on a traditional 180 day school calendar) could have led to at least 10,000 more students passing the CRCT Reading test and some 30,000 more students passing the CRCT Mathematics test.” This in turn prompted the Augusta newspaper to take up the cause and publish detailed analyses for their community of the connection among attendance, school achievement, and graduation.
TEACHER EVALUATION AND SUPPORT EFFORTS
Teachers are the most important school-based factor in a child’s academic achievement .71 In fact, nearly half of dropouts report that a major reason for dropping out was that classes were not interesting, and more than two-thirds would have worked harder if more were demanded of them—factors that teachers can control .72 With
high quality evaluations, school systems can differentially retain, compensate, support and transition teachers in order to create a more effective teaching force .
Many states and school systems are in the early phases of creating rigorous evaluation and teacher support systems, including in Tennessee, Kentucky, Delaware, and Texas . The American Federation of Teachers Innovation Fund is supporting collaborative, teacher-led reforms, including new teacher evaluation systems in New York and Rhode Island .73
Nationally, the D .C . Public Schools (DCPS) evaluation system is among the furthest in its development, now in its third year of implementation . Although the launch of the system was met with controversy, DCPS is actively sharing its lessons learned and best practices with states and school systems that are developing their own evaluation models . To update the teacher evaluation system, DCPS held 100 focus groups involving 1,000 stakeholders . (For more information, visit http://dc.gov/DCPS) .
Across the country74—and around the world75—school leaders are stepping up and raising the bar for what it means to have the privilege of leading a classroom . Nationally, through Race to the Top, and with the support and encouragement of policymakers and private foundations, these leaders are linking teacher quality to student achievement, driving improvement where it matters most: in the classroom .
Benchmark: Elementary and Middle School YearsEstablish Early Warning Indicator and Intervention Systems that use the Early Predictors of Potential Dropout (attendance, behavior, and course performance in reading and math).
In the past few years, Early Warning Indicator and Intervention Systems (EWS) have grown from a powerful idea into an actionable, high-priority and research-based reform area. For too long, a lack of available data has resulted in educators missing key signs of early challenges for students—not providing
Snapshot
$17 million*
If Washington D.C. achieves the Grad Nation goal of a 90% high school graduation rate for just a single high school class, the district would likely see an increase in its Gross State Product of more than
* Courtesy of the Alliance for Excellent Education

Building a Grad Nation March 2012 43
P r O G r E s s A N D chALLE NG E i N m E E t i NG BE Nch m Ar K s OF t h E c i v i c m Ar s hALL P L A N
the appropriate interventions to those who need them the most. This can misallocate educators’ efforts and precious educational dollars.76 Now, the implementation of EWS is changing that, through champions at the state, district, and sometimes community levels. This emerging national trend has been embraced widely, and is correlated with both increased demand by users and federal encouragement.
Stakeholders at all levels are learning from best practices, as well as challenges. The 2011 Civic Enterprises/Everyone Graduates Center report, On Track for Success: The Use of Early Warning Indicator and Intervention Systems to Build a Grad Nation, represents the first national assessment of EWS at the district, state and national levels. The report shares evidence from the latest research and best practices, examining detailed progress being made in 16 districts and communities, and in seven states. It also offers a comprehensive definition of EWS as a collaborative approach among educators, administrators, parents, and communities to using data effectively to keep students on the pathway to graduation. A combination of features characterize the best EWS: rapid identification of students who are in trouble; rapid interventions targeted to students’ immediate and longer-term need for support, redirection and greater success; the frequent monitoring of the success of interventions; a rapid modification of interventions that are not working; and shared findings. EWS use “real time” or “near real time” data to identify students who are on off track to graduate.”77
In sum, EWS leverage key factors and accompanying thresholds that are the most highly predictive of student outcomes—the “ABCs.” They are
– Attendance: Missing 20 days or being absent 10 percent or more of school days;
– Behavior: Two or more mild or more serious behavior infractions; and
– Course performance: An inability to read at grade level by the end of 3rd grade; a failure in English or math in 6th through 9th grades; a GPA of less than 2.0; two or more failures in 9th grade; and failure to earn on-time promotion to 10th grade.
The next step is high-quality implementation of EWS—at scale. Nationally, at least 18 states report that they have developed early warning systems, though the level of use is less clear.78 A third of states currently have all of the information for EWS in their state longitudinal data systems. Sixteen states report that they have no plans or have not set date for implementing an EWS.79 In some communities, nonprofit organizations are playing a key leadership role in fostering the development of EWS, so that their interventions are more strategic and can generate better results. For example, Big Brothers Big Sisters of America and Big Brothers Big Sisters of Eastern Missouri are working together on a replication plan for ABCToday!, a program to track students’ Attendance, Behavior, and Classroom success as the first step in returning them to the graduation path.80 For more information and resources on how to create a local EWS, including a featured case study on Big Brothers Big Sisters of Eastern Missouri, see On Track for Success available at www.civicenterprises.net/reports/on_track_for_success.pdf
NATIONAL SERVICE: PEOPLE POWER TO BUILD A GRAD NATION
The fundamentals of a great education and the ABCs to keep students on track—improved Attendance, Behavior, and Course Performance—are a common denominator of success in national service programs . The Corporation for National and Community Service (CNCS) is stepping up its efforts—and investments—to accelerate success around these early warning indicators of progress and this key benchmark of the Civic Marshall Plan . CNCS invests more than $550 million—more than half of its funding—in education—all of which is fueled by ‘people power .’81 For example, the Minnesota Reading Corps engages more than 550 national service members as reading tutors for more than 15,000 struggling learners throughout the state . By using evidence-based practices and personalized tutoring, the program has demonstrated proven results to help close Minnesota’s growing achievement gap . Nearly 80 percent of Reading Corps students achieved more than a year’s worth of progress in one year’s time, exceeding state and national averages and dramatically surpassing what would have typically
Snapshot

44 Building a Grad Nation March 2012
P r O G r E s s A N D chALLE NG E i N m E E t i NG BE Nch m Ar K s OF t h E c i v i c m Ar s hALL P L A N
been expected . College access is also a priority . More than 400 national service members host college fairs in low-income schools, hold test-prep sessions, help students complete the Free Application for Federal Student Aid (FAFSA), and tutor students who struggle academically . Overall, national service programs tutor, mentor, and educate more than three million at-risk youth each year, helping the most vulnerable students learn, engage, and achieve . Moving forward, as part of its five-year strategic plan, CNCS is placing a greater emphasis on identifying strategies and programs that work, funding them and driving innovation in education to build a Grad Nation .82
Benchmark: Elementary and Middle School Years Redesign the Middle Grades to Foster High Student Engagement and Preparation for Rigorous High School Courses.
The past year has seen growing recognition of the critical role the middle grades play in enabling all students to graduate from high school prepared for college, career and civic life. The U.S. Secretary of
Education Arne Duncan elevated these grades at the national level in two major speeches on middle grade reform over the past year. At the annual meeting of the Association of Middle Level Education, the U.S. Secretary of Education Arne Duncan stated, “the middle grade years have been called the ‘Bermuda Triangle’ of K-12 education. It’s the time when students sink or swim.” In high-poverty schools, in particular, the middle grades can either put students on a path to college and careers—or it can steer them to dropping out and the unemployment line. And just as is the case in preschool, early intervention is easier—and more cost-effective—than waiting until high school.83
As a response to this important need, the National Forum to Accelerate Middle Grades Education launched its federal Investing in Innovation (I3) project with a consortium of 18 urban and rural middle schools. Its aim is to 1) strengthen their structures, norms, and processes for continuous improvement; 2) increase their academic rigor; 3) promote equity for all students, including those with disabilities and limited English profi ciency; and 4) develop an array of supports designed to meet the needs of young adolescents. The Forum also hosted a policy briefi ng on the importance of the middle grades in raising high school graduation and college success rates on Capitol Hill.
In addition, the George W. Bush Institute announced its Middle Grades Matter initiative in 2011. This effort has assembled evidence-based practice in middle grades leadership, use of data, reading, writing, mathematics, reasoning, the science of learning, dropout prevention, extended day, and school climate and culture into a platform that it will pilot. The ultimate aim is to create a middle grades model that uses evidence-based practices to prepare all students for high school courses linked to college and career readiness.
At the city level, New York City Chancellor Walcott focused his first major policy address on middle grades reform. In it, he identified five key elements of successful middle schools as 1) a robust literacy program; 2) stable, high quality leadership; 3) teams of teachers working together for a shared group of students; 4) a strong culture of discipline and academic routine; and 5) a close relationship with students and working in partnership with families.

Building a Grad Nation March 2012 45
P r O G r E s s A N D chALLE NG E i N m E E t i NG BE Nch m Ar K s OF t h E c i v i c m Ar s hALL P L A N
The challenge of middle grade reform can be seen in the nation’s most recent 8th-grade NAEP results. Just a little over a third of the nation’s 8th-graders scored proficient or higher in reading (34 percent) and mathematics (35 percent). Recent results from the Trial Urban District Assessment show that since the early 2000s, many urban districts have made substantial progress in raising 8th-grade proficiency levels, with urban performance improving faster than national performance. Overall proficiency levels are
still low. The distance between current performance captured by NAEP and the level detailed by the common core standards brings in stark relief the challenges the nation will face in upgrading the skills of its middle grade teaching corps, and engaging and motivating early adolescents to increase their academic effort and focus.
Las Vegas: “American Graduate: Let’s Make It Happen” Promising PracticesThe Clark County School District (CCSD) of Las Vegas, Nevada has one of the lowest graduation rates in the nation, with Nevada flagged in the 2010 Building a Grad Nation report as one of three states where graduation rates had noticeably declined . Plagued by high unemployment in one of the hardest-hit local economies, young people in Las Vegas often envision their futures in the local construction or entertainment industries—fields not necessarily dependent on a high school diploma . Like the rest of the nation, the economic downturn has changed Clark County . The housing bubble burst . There are fewer tourist dollars to spend at hotels and casinos . Today, many of Las Vegas’ dropouts are out of work and unable to jumpstart the economy because they lack the required credentials .
Armed with data,84 and in response to this crisis, community leaders in Las Vegas have worked to send a message that education is critical for the economic future of individuals—and of the community . Public media is among these leaders . Through American Graduate: Let’s Make It Happen, Vegas PBS (which is licensed to the Clark County School District) has asked, “How can we leverage media tools against the challenge?” In partnership with educators, Vegas PBS has identified three key strategies to implement within their community . Although the graduation rate in Las Vegas remains too low, these promising practices and partnerships are early indicators of good things to come in the Nevada desert .
1 . Convene key stakeholders to work collaboratively on ending the dropout crisis. This year, in collaboration with the Clark County School superintendent who is targeting resources at dropout factory high schools, the station has formed a Community Advisory Panel to identify key strategies to address the dropout crisis . Public media is using its convening power to bring together a broad group of stakeholders that represent
Snapshot
$101 million*
If Nevada achieves the Grad Nation goal of a 90% high school graduation rate for just a single high school class, the state would likely see an increase in its Gross State Product of more than
* Courtesy of the Alliance for Excellent Education

46 Building a Grad Nation March 2012
P r O G r E s s A N D chALLE NG E i N m E E t i NG BE Nch m Ar K s OF t h E c i v i c m Ar s hALL P L A N
the community and are committed to solving this problem . The Panel includes representatives from the Governor’s Office, the Consulate of Mexico, the Las Vegas Chamber of Commerce, and the Latino Chamber of Commerce, as well as school district officials, and other community service providers .
2 . Use data and technology to drive solutions. Of the more than 20,000 entering seniors in CCSD, just over half are on track to graduate .85 The other half is either credit deficient, have not passed the high school proficiency exam, or both . Vegas PBS houses and provides content support for a Virtual High School, which is managed by a certified state educator . The Virtual High School brings together the assets of educators and public media to support students who are credit deficient, providing more than 160 online courses aligned to the Nevada curriculum and state standards . Through the Virtual High School, students and teachers have access to more than 175,000 digital learning objects aligned to the curriculum, such as charts, videos, and maps, and viewed them more than 18 .5 million times per year . Because one-on-one personal communication is critical to keeping students on track, the Virtual High School requires weekly one-on-one communication with every student, enabled through PBS technology . The Virtual High School recently integrated an Academy of Independent Studies, utilizing a competency exam to identify which specific skills within a failed course each student needs to target . Educators are advancing Nevada’s curriculum and public media provides an online database of tools to target specific skills . In 2010-2011, the Virtual High School had 8,900 online class enrollments, with a 75 percent passing rate—higher than the district average . This year, the program had a 37 percent increase in enrollment, indicating that public media will have an even greater role to play in helping educators get students across the line to graduation .
The resources Vegas PBS provides reach beyond the students and teachers of the Virtual High School . Teachers in brick and mortar schools can also use these resources to augment their curriculum and to keep students engaged in the classroom .
3 . Share the successes—and the challenges of addressing the dropout crisis. Too often, students, educators, families, and the community are not aware of the complexities of the educational system—or do not know how they can help . To support the school system in its goals, Vegas PBS is producing and distributing content to increase the community’s understanding of the dropout crisis through television, radio, and online platforms . For example, the station is documenting CCSD’s “Reclaim Your Future” program, which deployed more than 300 volunteer mentors and staff to canvass door-to-door, providing information about graduation, and engaging students in conversations to get them to commit to returning to school .86 Vegas PBS has also created Public Service Announcements
Connect to a Public Media Community Hubs in Your Area
New York/ Thirteen WNET
Alabama APT
Detroit WTVS
Nashville WNPT
San Francisco KQED
Norfolk/ Hampton, VA WHRO
Las Vegas KLVX
Cincinnati CET
Saint Louis/ Nine Network KETC
Daytona, FL WCEU
Jacksonville, FL WJCT
Miami WLRN
Tallahassee WFSU
Tampa WUSF/WEDU
Washington DC Collaboration WETA/WHUT/WAMU
Southern California Collaboration KOCE/KLCS/KVCR
New Mexico KNME
Philadelphia WHYY
Indianapolis WFYI
Chicago WTTW
Snapshot

Building a Grad Nation March 2012 47
P r O G r E s s A N D chALLE NG E i N m E E t i NG BE Nch m Ar K s OF t h E c i v i c m Ar s hALL P L A N
to recruit and mobilize volunteer mentors to support students at risk of dropping out . District leaders are using the power of public media to communicate important reforms to teachers, families, and the broader community . CCSD is rolling out a new school performance framework . While the new framework is determining how teachers and schools are performing, public media is communicating the new framework to schools, parents, and the community in order to help promote understanding and support of this new system . Vegas PBS has produced a 30-minute program called “Road To Reform” featuring the CCSD Deputy Superintendent explaining the district’s plan to drive toward solutions and how viewers can help .
Vegas PBS is part of a nationwide public media effort to address the dropout crisis in a meaningful way. In 2011, the Corporation for Public Broadcasting (CPB) launched “American Graduate: Let’s Make It Happen .”87 With the support of American Graduate, public television and radio stations in 63 communities where the dropout crisis is most acute—including Las Vegas—are providing content, platforms, and services to “raise awareness, coordinate action with community partners, and work directly with students, parents, teachers, mentors, volunteers, and leaders to lower the dropout rate in their respective communities .”88 Aligned to the Civic Marshall Plan, public media’s response will continue to grow in order to make an impact . American Graduate’s early contributions indicate that Grad Nation’s call for “all hands on deck” was heard from Sesame Street to the famous Las Vegas Strip . For more information, please visit www.americangraduate.org .
Benchmark: Elementary and Middle School Years Provide sustained and quality adult and peer support to all students who want and need these supports, continual supports from adults serving in schools as “success coaches” for all off-track students, and intensive wraparound supports for the highest-need students.
Research has shown that mentoring, when designed and implemented to follow evidence-based best practices, helps young people reach their academic, emotional and social potential. Youth who participate in evidence-based mentoring relationships demonstrate better school attendance, a greater likelihood of going on to higher education and better attitudes toward school and adults—all outcomes that enhance the probability of staying in school.89 Many students require a continuum and range of supports. Yet, due to capacity limitations, only three million youth are in formal mentoring relationships, leaving nearly 15 million American young people—many of whom display early indicators of dropping out—still in need of mentors.90 Further, there is no clear and reliable funding source at state and federal levels for continuous in-school supports for off-track students and continued wraparound services for the highest need students. This challenge limits the scale of effective programs.
At the local and national levels, organizations like MENTOR, City Year, and Communities In Schools are aligning with the Civic Marshall Plan by taking targeted action in low graduation rate communities. MENTOR: The National Mentoring Partnership works with its network of State and Local Mentoring Partnerships to promote quality mentoring relationships nationwide. These best practices are codified in MENTOR’s Elements of Effective Practice for Mentoring™. Through its network of 28 Mentoring Partnerships, 5,000 mentoring programs and volunteer centers that increasingly intersect with academic supports, MENTOR is driving the increased quantity and quality of youth mentoring, which will provide the proven socio-emotional and academic supports that, along with effective education, will increase graduation rates.
At the local level, organizations like City Year are providing these continuous supports to off-track students before, during, and after the school day. City Year is a leader in this regard. Among students who received attendance coaching from City Year corps members in grades six through nine around the nation during the 2010-2011 school year, 58 percent who began the school year struggling in attendance had improved. In elementary schools, 85 percent of students tutored by City Year corps members in grades three-five improved their raw literacy scores. City Year’s long-term impact strategy
Snapshot

48 Building a Grad Nation March 2012
P r O G r E s s A N D chALLE NG E i N m E E t i NG BE Nch m Ar K s OF t h E c i v i c m Ar s hALL P L A N
Snapshot
includes academic, attendance, and social-emotional milestones to measure student progress across multiple years leading up to the 10th grade so that the students in City Year schools reach the 10th grade on time and on track.
United Way and Big Brothers Big Sisters Defining Shared Success
United Way and Big Brothers Big Sisters have been working together locally and nationally for years, including as partners in the Grad Nation campaign . Now, these organizations are taking their partnership a step further to increase the number of mentors working with disadvantaged students from kindergarten through middle school, especially those in high-risk schools .91 United Way and Big Brothers Big Sisters, joined by school leaders and community partners, are working in new ways to recruit more caring adults to help more students succeed in middle school and go on to graduate from high school prepared for success . Organizational leaders say the groups are uniting in defining shared success based on the Grad Nation campaign focus .
The goal of the partnership is to mobilize additional community resources, deepen strategic partnerships and develop best-practice models that every United Way and Big Brothers Big Sisters affiliate can use and adapt . This new collaboration focuses on 1) more partnerships with the elementary and middle schools that are feeders to the nation’s lowest-performing high schools, 2) enhanced accountability and the use of data in these partnerships to ensure educational success and improved mentoring programs, and 3) better mobilization of community resources demonstrating how volunteering, donating and advocating can change educational outcomes and benefit communities .
These high-impact partnerships are being piloted in Austin, Texas; Winston-Salem, North Carolina; Louisville, Kentucky; and Ft . Lauderdale, Florida . In Austin, Big Brothers Big Sisters and United Way are working together to help struggling middle-schoolers be successful . For more information or to get involved, please visit www.bbbs.org or www.liveunited.org

Building a Grad Nation March 2012 49
P r O G r E s s A N D chALLE NG E i N m E E t i NG BE Nch m Ar K s OF t h E c i v i c m Ar s hALL P L A N
Houston: Texas-sized Progress, Texas-sized ChallengeDriven by thriving petrochemical, health and science industries, the Houston metropolitan area is one of America’s most dynamic regions . In 2011, its economic growth and rate of job creation were top in the U .S . The area population jumped to 5 .9 million . Economic growth was 19th in the world .
Managing, sustaining and advancing Houston’s burgeoning economy, and maintaining quality of life means paying keen attention to educational advancement, building a workforce trained in science, mathematics, and technology, and cultivating parental and community support from diverse cultures and new residents . Leaders from the business sector, county commissions, school districts, campuses (Texas parlance for schools), universities, and nonprofit service organizations are banding together to accomplish these goals .
At the same time, Texas-sized challenges abound . Harris County, centered by the City of Houston, has two-thirds of the area’s 1 .1 million students, with 203,000 students in the Houston Independent School District (HISD), Texas’s largest district and the seventh largest in the nation . Eight other districts each educate between 30,000 and 104,000 students—what would be city-sized districts in many other states . The remaining 57 districts and 50 charter schools range in size from a few hundred to 21,000 students . There are vast disparities in income . Averaged freshman graduation rates 92 in the metro area’s 66 school districts range from 52 percent to above 90 percent .93
Improving outcomes to achieve the 90 percent graduation rate goals for all students will take bold ideas and even greater efforts, but the present foundation is strong.
– Harris County graduation rates increased by approximately 10 percentage points over the last decade .
– Fourteen Harris County schools, most in HISD, placed among U .S . News’ Top 100 schools in 2011 . HISD reports that graduation rates increased six percentage points from 2008 to 2011, capping a decade in which the district was the first winner, in 2002, of the national Broad Prize for Urban Education for reducing achievement gaps and improving outcomes .94 (HISD serves 62 percent Hispanic and 28 percent African American students, 80 percent from low-income households) .
– Aldine ISD, with demographics similar to HISD, and sustained accomplishments in raising achievement, received the Broad Prize in 2009, after being a four-time finalist .
– HISD 4th-and 8th- graders surpassed the average Texas gain on the 2011 National Assessment of Educational Progress, and in three of four assessments, outperformed their peers in 21 urban districts nationally .
Case Study
$603 million*
If Texas achieves the Grad Nation goal of a 90% high school graduation rate for just a single high school class, the state would likely see an increase in its Gross State Product of more than
* Courtesy of the Alliance for Excellent Education

50 Building a Grad Nation March 2012
P r O G r E s s A N D chALLE NG E i N m E E t i NG BE Nch m Ar K s OF t h E c i v i c m Ar s hALL P L A N
Long-standing attention to innovation, education and support for students living in poverty underlie these successes.
– A former HISD superintendent helped drive the important provision in the 2002 No Child Left Behind legislation that student data be disaggregated to reveal achievement differences by ethnicity, poverty level, disabilities and English skills – all as the basis for thoughtful interventions leading to greater student success .
– Two charter school models that were originally affiliated with HISD, the Knowledge is Power Program (KIPP) and the YES Prep academies, that are among those that have shown great promise in increasing graduation and college-going rates for minority and poor students .
– Project GRAD, initiated in Houston, was among the early programs to focus attention on enhancing college aspirations, access and graduation for students from high-poverty and minority communities .
– The Houston area pioneered social support to keep students on the graduation path . Working closely with educators in four metro-districts, charter schools and community centers, Communities in Schools (CIS), a national nonprofit with 200 local partners, placed case-managers at 96 sites . National evaluators have found the CIS model—case managers working closely with educators to organize social and emotional support for struggling students and sometimes their families—to be a highly effective dropout prevention effort95 and local adults concur . In some cases when state funding was cut, HISD principals and leadership teams found school funds for case managers; in others, central office educators helped principals and faith-based partners design similar programs using volunteers . Agencies with mental health, foster care, homeless, and juvenile justice responsibilities are close partners in these efforts .
Based on sheer numbers, HISD has the potential to drive overall improvement in metro-Houston . The major, research-based initiative to turn around 20 of the district’s lowest-performing schools, called Apollo 20, has gained national attention, and federal, corporate and foundation funding . It occurs amid renewed district-wide focus on achieving graduation improvement through campus- and district practices . HISD launched Apollo 20 a year and a half ago . Four high schools with graduation rates below 45 percent, five middle schools, and 11 elementary schools now work with university, corporate, and community partners to improve education outcomes . The Harvard Edlab
research on successful charter school practices led to the driving strategies: 1) extended learning time with an extra hour a day, four days a week, in secondary schools, and Saturday school every other week in elementary school; 2) high-dosage one-on-two tutoring for 6th- and 9th-graders, and one-on-three tutoring for 4th-graders during the school day (255 tutors were hired the first year and more than 300 in year two), and “double-dosing” in core academics for students in other grades; 3) data-driven instruction with feedback from formative assessments every three weeks; 4) careful selection of principals and teachers, and 5) cultural shifts into high expectations for all . Year one results show significant student improvement in mathematics .
Case Study

Building a Grad Nation March 2012 51
P r O G r E s s A N D chALLE NG E i N m E E t i NG BE Nch m Ar K s OF t h E c i v i c m Ar s hALL P L A N
There is a larger district context that undergirds and wraps around the Apollo 20 effort.
– Literacy enhancement K-12 and district-wide .
– Robust early warning and future-readiness data systems . The central office developed a user-friendly data system with reports provided to campus level committees . The reports offer clear windows into students’ academic performance, attendance, behavior, course-passing, achievement, and college-readiness .
– Robust intervention systems . The campus committees of administrators, case workers, school nurses, graduation coaches, and attendance monitors analyze the data reports, then identify, coordinate, and monitor the effectiveness of interventions . Each high school has a Grad Lab that gives 24/7 opportunities for credit recovery, staffed by a graduation coach; other opportunities include Twilight Academies and case-managed interventions .
– A future focus . In addition to school improvement plans, acceleration opportunities abound—in magnet schools, advanced placement programs, and recently, early college high schools (ECHS) that enable work toward both high school and associate’s degrees . Houston Community College is developing skilled degrees and career opportunities in tandem with an ECHS and may be expanded to other campuses soon .
– Building, supporting and rewarding educator’s capacity, including effective teacher and principal initiatives, with smart recruitment, revised appraisal systems, redesigned career ladders, and personalized professional development by teacher development specialists . In 2011, HISD staff earned $35 million in performance incentives for improving student achievement .
– Building a culture of trust through actions and strong engagement from internal and external stakeholders .
Challenges and next steps. Educators in the other districts around HISD are working equally hard . Houston leaders have recognized that “schools and districts can’t do it alone,” so partnerships with community agencies, corporations and foundation supporters wrap around the districts . Standout players include The Houston Endowment and the Greater Houston Partnership, an overarching organization of chambers of commerce and business leaders that work to achieve policies and practices for sound economic development and growth, with education as a foundation . Looking to the future, the All Kids Alliance, initiated by a local university leader and led by CEOs of major corporations, nonprofits, universities and several school districts, is in the early stages of creating a framework for regional partnerships . Each will choose a few key actions for its community, based on six academic and performance-based “readiness” goals—ready for middle school, high school, college, career, and life—and annually measure progress against specific indicators . To start this work, the United Way is mobilizing to determine the best way it can organize its assets—skilled volunteers, large reach, and ability to convene multiple partners from multiple sectors—to support others .
The overarching Houston challenge is to continue support for at least one million increasingly diverse young people as well as their teachers and families in increasing graduation rates and college and career readiness in the face of what area educators call some of the largest cuts in education funding in decades . Sustaining innovations, such as Apollo 20, high aspirations and outcomes that benefit individuals, their communities and their region are even more challenging with the growing class sizes, reduced access to support materials and services, and fewer teachers these cuts necessitate . But even in a region with vast economic disparities, progress is possible .
Case Study

52 Building a Grad Nation March 2012
P r O G r E s s A N D chALLE NG E i N m E E t i NG BE Nch m Ar K s OF t h E c i v i c m Ar s hALL P L A N
Benchmarks: The High School Years (2017-2020)Provide transition supports for struggling students in grades 8-10 in all schools with graduation rates below 75 percent, as well as their feeder middle and elementary schools.
Research has shown that transition years, when students move from the elementary to middle grades, and then from the middle grades to high school, can be particularly perilous.96 Without sufficient support, students can become disengaged from school and start on the path toward dropping out. Best practices also suggest that caring, knowledgeable and committed adults who set high standards and assist students in meeting these standards, coupled with supportive school conditions and climates, are critical to helping students make successful transitions.97
Many schools have programs that incorporate such attributes in varying degrees, often due to adults’ personal commitments to student success, as well as district, state or federal policies and funding requirements. A recent study by the U.S. Department of Education’s National Center for Education Statistics, Dropout Prevention Services and Programs in Public Schools and Districts, 2010 to 2011, gives a first glimpse at support for students across the country.98 Its “Fast Response Survey” sampled representative city, suburban, town and rural districts of many sizes, poverty levels, and grade bands (elementary, middle and high school).
The survey findings provided positive and disappointing news, all of which indicated the need for further work. There are differences in what is available in regions, rural and city districts, large and small districts, and grade bands. Overall the data make clear that only a subset of schools is providing transition supports. At the high school level, districts reported that in at least one school all students participated in an advisory class to help them make the transition from middle to high school (40 percent of reporting districts), had an assigned adult mentor (26 percent), or had an assigned student mentor (20 percent). Students moving to middle school often received only half as much help as students entering high school: the districts reported that in at least one middle school in the district, all students participated in an advisory class (24 percent) or had an assigned student mentor
(10 percent). Adult mentors in the middle grades were found in 17 percent of the cases.
The survey also found that one-on-one interventions are offered but less frequently: 77 percent of districts reported that school counselors, teachers, or administrators—in an expansion of their roles—formally mentor students at risk of dropping out in at least one high school. (Please also see Snapshot on school counseling for additional information.) In contrast, only 12 percent of the districts reported having adult mentors who were hired to perform this role as their only job in at least one high school. Collaborations expand district and school capacity by drawing on community resources: 30 percent of reporting high schools use community volunteers to mentor at-risk students in at least one high school. Districts reported working with child protective services (85 percent), a community mental health agency (73 percent), state or local government agencies that provide financial assistance to needy families (68 percent), churches or community organizations (54 percent), and a health clinic or hospital (50 percent).
Finally, the survey revealed it is much more difficult for small and rural districts to support students with alternative educational opportunities. At least one high school in 71 percent of larger districts (10,000 or more students) offered flexible school days, but

Building a Grad Nation March 2012 53
P r O G r E s s A N D chALLE NG E i N m E E t i NG BE Nch m Ar K s OF t h E c i v i c m Ar s hALL P L A N
Snapshot
only 32 percent of small districts (no more than 2,500 students) did so. Summer bridge programs, usually for incoming ninth-graders, are offered in 63 percent of the larger districts but only 16 percent of small districts, almost the same difference between cities and rural areas.
JUNIOR ACHIEVEMENT: DEDICATING RESOURCES TO THE TRANSITION YEARS
Organizations are increasingly recognizing the importance of dedicating resources to the transition years . Junior Achievement (JA), for example, recently completed a comprehensive review process to identify which elements of its program model had the highest potential for impacting key indicators of student achievement . Together, JA staff, board members, and educators in the four pilot cities (Cleveland, New York, Los Angeles, and Atlanta) developed an organizational model supporting the key benchmark of the Civic Marshall Plan: providing students targeted support during their transition years . Within the scope of their K-12 programming, they are redeveloping their program content to provide students with multiple, in-depth JA experiences at key intervention times with an emphasis on the sixth grade and continuing throughout their middle school years and into high school . Program content is being developed in alignment with the research findings, particularly content addressing the key drivers of high school graduation . Through this comprehensive review process, Junior Achievement has developed tools that would apply to other youth-serving organizations focused on supporting the Civic Marshall Plan, including research supporting transition years and key metrics . For more information, please visit www.ja.org/files/white_papers/JA-Graduation-Pathways-2011.pdf.
Benchmark: The High School Years Transform or replace the nation’s dropout factories with effective schools.
As noted in an earlier section of the report, both the number of dropout factory high schools and the number of students enrolled in them continued to decline during 2009-2010, the most recent year for which data exists. Federal school improvement grants continued to target high schools with graduation rates below 60 percent and their feeder middle schools. The number of schools receiving School Improvement Grants (SIG), and thus embarking on significant and ambitious reforms, topped 1,200.99
To further develop and spread understanding of what it takes to successfully turn around low-performing schools, particularly dropout factory high schools, the U.S. Department of Education formally established a School Turnaround office that among other efforts set up a web-based community of practice. In February, the office hosted a two-day School Turnaround Summit as a forum for the 26 districts with the largest number of schools receiving SIG grants, to learn from each other’s success and challenges. Equally significant, in establishing the process by which states could obtain waivers from NCLB, the Department of Education required states to submit ambitious plans for improving their lowest-performing schools, including all dropout factory high schools. In February, the President announced the first 10 states to receive waivers and each of them presented detailed plans to build state, regional, and/or district capacity, often in conjunction with external partners, to turn around their lowest-performing schools over the next three years. If all states obtain waivers and follow through on this requirement, the Civic Marshall Plan goal of having all dropout factory high schools transformed or replaced by 2016 can be achieved. Further, the National Governors Association Best Practices Office has recently released a series of recommendations on the key elements of next generation high school accountability systems, which encourage improvements in academic outcomes, graduation rates, and post-secondary success and preparation. (The brief Creating a College and Career Readiness Accountability Model for High Schools is available at www.nga.org/cms/center).
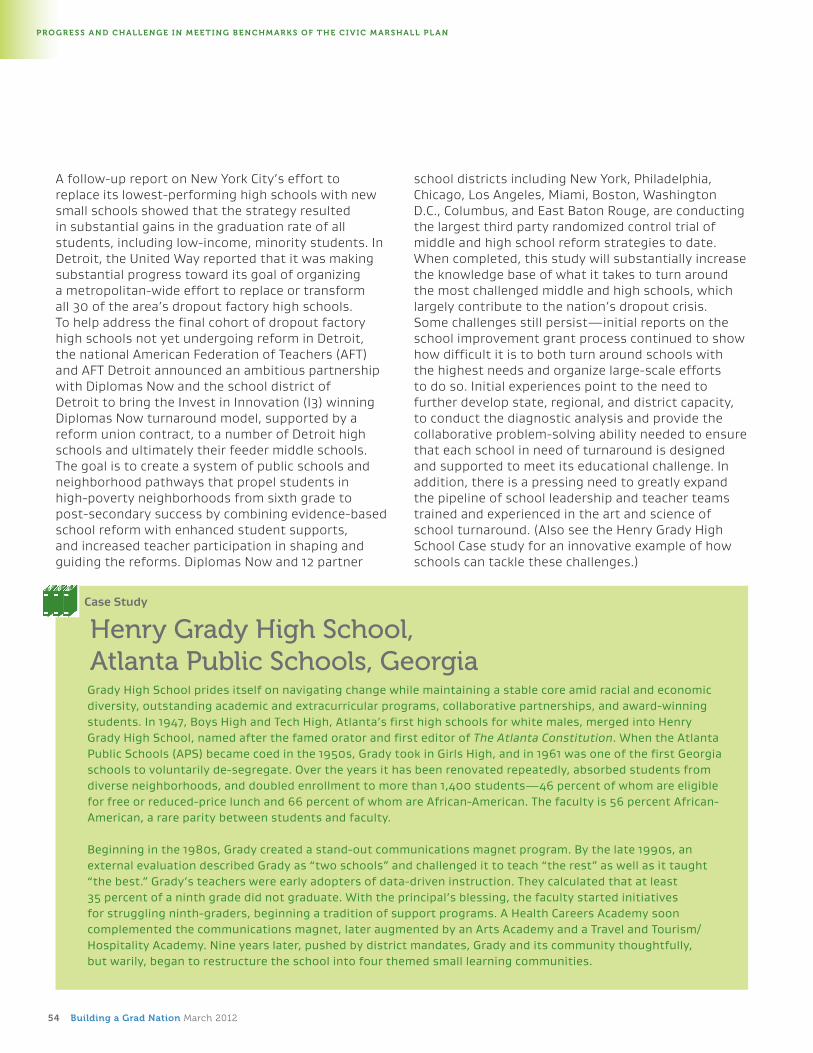
54 Building a Grad Nation March 2012
P r O G r E s s A N D chALLE NG E i N m E E t i NG BE Nch m Ar K s OF t h E c i v i c m Ar s hALL P L A N
A follow-up report on New York City’s effort to replace its lowest-performing high schools with new small schools showed that the strategy resulted in substantial gains in the graduation rate of all students, including low-income, minority students. In Detroit, the United Way reported that it was making substantial progress toward its goal of organizing a metropolitan-wide effort to replace or transform all 30 of the area’s dropout factory high schools. To help address the final cohort of dropout factory high schools not yet undergoing reform in Detroit, the national American Federation of Teachers (AFT) and AFT Detroit announced an ambitious partnership with Diplomas Now and the school district of Detroit to bring the Invest in Innovation (I3) winning Diplomas Now turnaround model, supported by a reform union contract, to a number of Detroit high schools and ultimately their feeder middle schools. The goal is to create a system of public schools and neighborhood pathways that propel students in high-poverty neighborhoods from sixth grade to post-secondary success by combining evidence-based school reform with enhanced student supports, and increased teacher participation in shaping and guiding the reforms. Diplomas Now and 12 partner
school districts including New York, Philadelphia, Chicago, Los Angeles, Miami, Boston, Washington D.C., Columbus, and East Baton Rouge, are conducting the largest third party randomized control trial of middle and high school reform strategies to date. When completed, this study will substantially increase the knowledge base of what it takes to turn around the most challenged middle and high schools, which largely contribute to the nation’s dropout crisis. Some challenges still persist—initial reports on the school improvement grant process continued to show how difficult it is to both turn around schools with the highest needs and organize large-scale efforts to do so. Initial experiences point to the need to further develop state, regional, and district capacity, to conduct the diagnostic analysis and provide the collaborative problem-solving ability needed to ensure that each school in need of turnaround is designed and supported to meet its educational challenge. In addition, there is a pressing need to greatly expand the pipeline of school leadership and teacher teams trained and experienced in the art and science of school turnaround. (Also see the Henry Grady High School Case study for an innovative example of how schools can tackle these challenges.)
Henry Grady High School, Atlanta Public Schools, GeorgiaGrady High School prides itself on navigating change while maintaining a stable core amid racial and economic diversity, outstanding academic and extracurricular programs, collaborative partnerships, and award-winning students . In 1947, Boys High and Tech High, Atlanta’s first high schools for white males, merged into Henry Grady High School, named after the famed orator and first editor of The Atlanta Constitution . When the Atlanta Public Schools (APS) became coed in the 1950s, Grady took in Girls High, and in 1961 was one of the first Georgia schools to voluntarily de-segregate . Over the years it has been renovated repeatedly, absorbed students from diverse neighborhoods, and doubled enrollment to more than 1,400 students—46 percent of whom are eligible for free or reduced-price lunch and 66 percent of whom are African-American . The faculty is 56 percent African-American, a rare parity between students and faculty .
Beginning in the 1980s, Grady created a stand-out communications magnet program . By the late 1990s, an external evaluation described Grady as “two schools” and challenged it to teach “the rest” as well as it taught “the best .” Grady’s teachers were early adopters of data-driven instruction . They calculated that at least 35 percent of a ninth grade did not graduate . With the principal’s blessing, the faculty started initiatives for struggling ninth-graders, beginning a tradition of support programs . A Health Careers Academy soon complemented the communications magnet, later augmented by an Arts Academy and a Travel and Tourism/Hospitality Academy . Nine years later, pushed by district mandates, Grady and its community thoughtfully, but warily, began to restructure the school into four themed small learning communities .
Case Study

Building a Grad Nation March 2012 55
P r O G r E s s A N D chALLE NG E i N m E E t i NG BE Nch m Ar K s OF t h E c i v i c m Ar s hALL P L A N
Throughout, Grady has received state and national recognition
– One of four high schools named a U .S . Department of Education Distinguished Title I School (2000) .
– One of 15 Georgia “85/10” schools100, that is, a school with graduation rates greater than 85 percent (with a high of 94 .4 percent in 2009) after a 10-year journey that included two years in which Grady did not make Adequate Yearly Progress (AYP) .
– Almost no graduation rate gap (5 percent or less) between African-American and economically disadvantaged students and White or affluent students . Ninety percent of Grady graduates attend four- or two-year colleges .
– Awards for debate, publications and presentations, with the Mock Trial team placing 3rd and 4th, respectively, in the 2010 and 2011, national championships .
– First runner-up in the College Board’s “Inspiration” awards, 2011, for an outstanding college-preparatory program supported by community partnerships through a collaboration between Grady counselors and parent volunteers .
Grady has managed to navigate change and thrive because of a culture that values high expectations . It offers 22 Advanced Placement courses, requires all students to complete 24 credits for graduation, and supports those high expectations with respect for diversity and collegiality . (“Individually we are different; together we are Grady .”)
Ingredients of the Grady approach include
Communicating and teaching expectations. As APS closed schools because of low enrollment, and as the provisions of No Child Left Behind enabled students from failing schools to choose higher-performing ones, Grady gained new students, some of whom were not used to working hard in school . Once at Grady, however, students learned that failure was not an option, that they must meet expectations and in a timely way . Students are held accountable for all assignments . Excuses are unacceptable, and students cannot participate in extracurriculars until they complete late assignments . Through phone calls and visits, the faculty sends the message to parents and students that attendance matters . The school also welcomes parents to class so they can understand teachers’ expectations .
Supporting the transition into high school. Across the country, students struggle with increased academic and social challenges in the transition from eighth to ninth grades . Grady students are no exception . In the 1990s, teachers recognized that students arrived from middle schools with differing exposure to content, and established summer transition
Case Study

56 Building a Grad Nation March 2012
P r O G r E s s A N D chALLE NG E i N m E E t i NG BE Nch m Ar K s OF t h E c i v i c m Ar s hALL P L A N
and orientation programs that continue . Teams of teachers and administrators visit parents, teachers and students in the feeder schools to teach expectations . Eighth-graders learn about pitfalls and opportunities from ninth-graders’ stories . Ninth-graders who are struggling readers in middle school attend a literacy support class . Some years, single-gender Algebra I courses are offered along with other “double dose” math courses . In the mid-2000s a graduation coach and an “at risk” coach began working with ninth-graders needing extra help . As Grady moves to an academy structure, it will continue to support students through academy-based instructional specialists . To focus students on their futures, parents operate the College and Career Center . Visits there are part of the ninth-grade English curriculum .
Schoolwide support system. Students who are behind in class work at the end of each week are assigned to frequent tutorials or after-school academic detention to complete their work . An Academic Recovery program runs on Saturdays during the second semester for students who struggle in core courses tested by the state .
Community partners. More than 30 partners support Grady with a variety of in-school and after-school programs . The Grady Foundation, for instance, sponsors the school’s writing center, which offers students help during and after school; a retired teacher runs the center with assistance from teachers who volunteer their time . Another partner, the National Football Foundation supports an academic coach program to enhance football players’ mathematics skills, with tutorials and SAT preparation . Other examples: The National Coalition of 100 Black Women mentored a group of ninth-grade African American girls, offering college scholarships as incentives to graduate, and collaborations among faculty, a charter school and faith-based groups that produce community-based tutorials in disadvantaged neighborhoods .
The Grady community. The principal, faculty, and parent leaders have collaborated for nearly 20 years, building on the tradition established by the previous principal . Faculty members have easy access to the principal, and work in an environment that emphasizes academic sharing and innovation . The PTSA is an active partner in decision-making . As the school restructuring commenced, faculty and parents participated in “transformation” meetings to lay the groundwork for the future, and work through concerns . Boys High alumni underwrite professional development . Perhaps mostly importantly, the school celebrates its successes, is on a course of continuous improvement, jettisons by mutual consent experiments and innovations that “don’t work” and fine-tunes and adds to those that do .
CHALLENGES AND NExT STEPS
The new APS superintendent, formerly chancellor of the Georgia university system, is instituting new measures to stabilize a school system challenged by a cheating scandal in the elementary and middle schools . The challenge for Grady, as it traverses its first full year of academies, is to capitalize on its capacity and culture to teach all students well and strengthen skills of students who come to high school unprepared . Graduation rates dropped slightly in the last two years . While there is only a small gap in graduation rates between African-American, and White students, there remain sizeable gaps in performance on the high school graduation tests, particularly at the advanced level and in mathematics .
Case Study

Building a Grad Nation March 2012 57
P r O G r E s s A N D chALLE NG E i N m E E t i NG BE Nch m Ar K s OF t h E c i v i c m Ar s hALL P L A N
COMMON CORE STATE STANDARDS: RAISING ExPECTATIONS AND ENGAGING STUDENTS
Setting relevant and rigorous expectations for students and schools is a critical step to addressing the dropout crisis . Students and their families must clearly see the link between education and opportunity . In order for students to stay in school and experience long-term success, it is critical that achievement in school and graduation signify genuine readiness to enter college and the workforce . Therefore, in 2009, the Council of Chief State School Officers (CCSSO) and the National Governors Association Center for Best Practices partnered to coordinate the state-led effort for the development and voluntary adoption of the Common Core State Standards . The Common Core State Standards set clear and ambitious expectations for what all students should know and be able to do in grades K-12 in English language arts and mathematics and set a consistently higher bar for student performance than has ever been expected in this country .
Forty-six states and the District of Columbia have adopted and are now implementing this single set of educational standards for English language arts and mathematics . (The five states that have not adopted the standards are Alaska, Texas, Nebraska, Minnesota, and Virginia . Minnesota has adopted the English language arts standards but not the mathematics standards .) This means that, in the United States, approximately 90 percent of the students in grades K-12 will be in jurisdictions that have adopted the same set of educational standards in English language arts and mathematics .
The adoption of new standards that will affect the vast majority of students in the country created an immediate need for new assessments that will measure student performance on the standards
and provide teachers, parents, districts, and states with timely and meaningful data . To support the development of these new assessments, the U .S . Department of Education provided funding to two consortia of states through its signature Race to the Top program . These two consortia—SMARTER Balanced Assessment Consortium (SBAC) and the Partnership for the Assessment of Readiness for College and Careers (PARCC)—are comprised of state education agencies and supported by nonprofit partners who help to organize the work of the states . In order to realize a fundamental transformation of the U .S . education system and classroom instruction to better serve all students, it is vital that both assessment consortia be successful in designing and implementing common assessments that measure the full range of knowledge and skills expected of students by the standards and provide data that is comparable across states and actionable to educators .
As states seek to implement Common Core State Standards, many local, state and national educational advocates are also working so that parents are educated and empowered to successfully advocate on behalf of their children throughout the implementation process . It is also critical that curriculum advance these standards— while engaging students . To address these needs, the National Urban League has launched the Equity and Excellence Project (EEP), which aims to improve the outcomes for underserved students by working closely with local, state, and national partners to provide tools, trainings, and strategies for parents to be invested in school reform . (For more information on EEP, see www.iamempowered.com/programs/equity-and-excellence-project .) In terms of curriculum, new models such as Mathalicious, are aligning to the Common Core State Standards while providing relevant lessons around real-world topics . (For more information on Mathalicious, please visit www.mathalicious.com) .
Snapshot
58 Building a Grad Nation March 2012
P r O G r E s s A N D chALLE NG E i N m E E t i NG BE Nch m Ar K s OF t h E c i v i c m Ar s hALL P L A N
Dothan, Alabama: Translating State Graduation Improvement Eff orts to the Local Level Overcoming low tax revenues and old divisions along racial lines, Dothan, a small city of 66,000 in southeastern Alabama, raised high school graduation rates above state increases over the last decade, standing as testimonial to “It takes a village to raise a child .” In Dothan’s case, it took a convergence of effort, commitment and data to make school improvement a reality . The city’s settlement, late in Alabama’s development, brought agrarian endeavors and business—first cotton, then peanuts, followed by shops, hospitals, a U .S . Army base, manufacturing, and more retail . Like all areas of this Alabama-Georgia-Florida panhandle region, Dothan was deeply segregated for most of its history . Enrollment in the Dothan City Schools (DCS) fluctuated between 8,500 and 10,000 students for the last 50 years with about one-quarter of the city’s students still attending private schools . Half of DCS students are African American, an increase from 30 percent in the 1970s; 61 percent are eligible for free or reduced-price lunch .
DCS emerged from the court desegregation order in 2007, at a time when key state leaders championed educational improvement and already-started education initiatives deepened their impact . In the last decade, Dothan’s two high schools graduated more students . The graduation rate was up nearly 15 percentage points at Dothan High School and 11 percentage points at Northview High .103 Reading and mathematics achievement gains by both elementary and middle school students brought recognition from the Public Affairs Research Council of Alabama, a “think tank” housed at Birmingham’s Samford University . Dothan students substantially outperformed their counterparts in southeastern Alabama and those in demographically similar districts and schools, despite lower per pupil tax revenues and spending .104
Dothan’s emerging success story entails the convergence of diverse efforts, personal commitments and growing community cohesiveness . In 2008, Dothan citizens formed Yes We Can Dothan! (YWCD!) to address education needs . After 47 community conversations, the group developed a strategic plan for improving education with five clear goals: graduate all students prepared for college and life, set high expectations, involve parents, increase financial support for schools, and communicate better to re-engage local citizens . District and high school leaders focused attention on low graduation rates, taking No Child Left Behind and its sanctions seriously . A new Dothan High principal brought stability to a fragile school after four years of administrative turnover contributed to its persistence on the state “needs improvement” list . The district office initiated an Academic Recovery Program targeted to the 100 students most academically (not behaviorally) at risk, based on the state database .
Case Study
$102 million*
If Alabama achieves the Grad Nation goal of a 90% high school graduation rate for just a single high school class, the state would likely see an increase in its Gross State Product of more than
* Courtesy of the Alliance for Excellent Education

Building a Grad Nation March 2012 59
P r O G r E s s A N D chALLE NG E i N m E E t i NG BE Nch m Ar K s OF t h E c i v i c m Ar s hALL P L A N
With focused leaders, the culture, organization and processes began to shift, to emphasize getting all students to school and giving all students the academic and behavioral tools to succeed. Their elements of successful practice include
Greater human capacity for responsiveness. The district appointed “graduation coaches” at each high school . The district also hired the energetic “dropout lady,” to help the graduation coach, counseling team, teachers and administrators at each school focus on “at risk” students . Parent specialists worked to engage both parents and disconnected youth .
Accurate data with a purpose. The “dropout lady” and her colleagues began to live by the names of struggling students, drawn from the state data system that tracked students’ performance on four indicators . Four information audits each year ensured that data’s accuracy and timeliness .
Relationships that change expectations. Counselors dedicated a day each week to the struggling students who were doing poorly on two or more indicators . Each counselor saw the same students, building relationships as the first step in helping disengaged youth . Coaches “nagged and nurtured” the struggling students who participated in club or extracurricular activities . Parent specialists had 10 days at the start of school to locate students who had not shown up and to convince them that adults cared and wanted them to graduate . They continued this work when students left during the school year .
Involved and responsible parents and community members. The mayor and city commissioners have worked to let parents know that they are needed . The district YWCD! Communications’ coordinator promotes “Better Schools, Better Dothan” by distributing tips for parents and connecting to the 3,000 Facebook friends she has acquired as part of her community outreach efforts . Parent specialists work hard to bring parents into schools (500-600 Dothan High parents now attend Parents’ Nights, nearly triple the number in earlier years) . Parent participation has blossomed at the elementary and middle schools . The faith-based community has sponsored standing room only Open Houses, and a January 2012 Education Summit sponsored by YWCD! brought more than 1,000 community members together at a local mall . A neighborhood organization specifically addresses issues in the minority community . By enhancing community efforts, teachers call and now even text parents when students who are asked to “redo” work fail to complete assignments . These outreach efforts have other consequences—district enrollment grew by approximately 100 students a year over the past few years as parents gained confidence in the schools .
Improved teaching and learning. Teachers have been re-thinking standards-based curriculum and instruction . Student teachers from nearby Troy State assist struggling students and contribute to on-line enrichment through the state ACCESS program . The Wiregrass Foundation augmented management classes for leaders with a two-year fellows program in which retired educators assist administrators in further developing instructional leadership skills .
Case Study

60 Building a Grad Nation March 2012
P r O G r E s s A N D chALLE NG E i N m E E t i NG BE Nch m Ar K s OF t h E c i v i c m Ar s hALL P L A N
CLEAR ExPECTATIONS FOR STAYING IN SCHOOL AND GRADUATING.
– The district created a contract that spelled out the personal improvement process for students that the data indicate are struggling . Those who did not show progress in two weeks (which includes a 10- point improvement in grades, no office referrals, no discipline problems in class) were referred to the graduation coach . If further progress was slow, they were referred to the Graduation Team (the principal, the graduation coach, three counselors, and the parental involvement specialist) for additional consultation and parental involvement . Graduation Teams are accountable for outcomes and must review their reports on recommendations and outcomes with district personnel .
– Recovery systems responded to student needs . Credits can be made up during P .E . time, during summers for freshmen and sophomores, or by replacing an elective for seniors . Seniors may also take two math or English courses to fulfill graduation requirements . The district established an Accelerated Recovery Center (ARC) offering three hours of classes for over-age, under-credited youth . In 2010-2011, 46 students graduated from the ARC, which now has a waiting list .
– District-required Dropout Plans made it more difficult for students to drop out, with stronger requirements for an “exit interview” than state guidelines suggest . Potential dropouts meet with an administrator, write an essay on why they want to drop out and what their plans are after doing so, and discuss it with a counselor . Those who persist take the practice GED and meet again with the counselor to review results and implications . Students who still wish to drop out meet again with an administrator and then with the Graduation Team . To date, only one student going through the process has dropped out .
The net result of these efforts is a new culture within the high schools and community . Most adults accept that high school graduation matters, marking a real change in a rural area where jobs and lives did not previously require this . Most have come to recognize that educational accountability systems are here to stay . Most now recognize the intangible importance of students’ relationships with caring adults, especially students who come to high school without the skills to help themselves .
A new challenge is on the horizon . As Alabama moves with all other states to a four-year cohort graduation rate calculation, its graduation rate is likely to fall . The reality will be no different, but how students are counted will change . Administrators have begun discussing that adults within schools will have to build on what they have learned about more students succeeding when expectations and processes don’t let students fall off the path . They will also need to identify struggling students even more rapidly, communicate more frequently, deploy support and interventions more quickly, knowing that with effort, success is possible . Community and parent education work will continue, and efforts to identify struggling students, through attendance, behavior, and course-performance indicators, will move into the early and middle grades so that over time, more students will arrive in high school ready to succeed .
Case Study

Building a Grad Nation March 2012 61
P r O G r E s s A N D chALLE NG E i N m E E t i NG BE Nch m Ar K s OF t h E c i v i c m Ar s hALL P L A N
SCHOOL COUNSELORS READY TO LEAD
For the past century, counselors have been hard at work performing many roles in their schools, from guiding student decision-making, helping students to address personal problems, and working with parents, to administering tests, teaching, and filling other gaps unrelated to counseling .105 Counselors’ roles have been as diverse as the students they serve, often resulting in an unclear mission and a lack of accountability for student success . Consequently, even though there are nearly as many school counselors as administrators across America,106 counselors have been largely left out of the education reform movement—until now . The College Board has joined the Civic Marshall Plan Leadership Council and is working to fill important gaps, like tapping the talents of counselors to be part of the high school and college completion missions . The College Board National Office for School Counselor Advocacy (NOSCA) is working to better define the role of the school counselor and support them in their success .
School counselors themselves report a desire to help build a Grad Nation . According to a 2011 national survey of school counselors commissioned by the College Board, a majority believes they should exercise leadership in schools . Most notably, more than eight in 10 (85 percent) counselors believe that a top mission of schools should be to ensure that all students complete 12th grade ready to succeed in college and careers, yet only 30 percent of them see this as their school’s mission in reality . They also endorse certain accountability measures as fair and appropriate in measuring their own success, indicating counselors are eager to be at the center of education reform . The majority of counselors support certain measures of accountability, including measures based on transcript audits of graduation readiness (62 percent), completion of a college-preparatory course sequence (61 percent), students’ gaining access to advanced classes/tests (60 percent), high school graduation rates (57 percent), and college application rates (57 percent) .107
Benchmark: The High School Years Raise Compulsory School Attendance Age to When Students Graduate or 18 in All States
In the 2012 State of the Union address, President Obama promoted one of the benchmarks of the Civic Marshall Plan when he said, “We also know that when students don’t walk away from their education, more of them walk the stage to get their diploma. When students are not allowed to drop out, they do better. So tonight, I am proposing that every state—every state—requires that all students stay in high school until they graduate or turn 18.”
Compulsory school-age laws are out of date and do not reflect the fact that most jobs require a high school diploma and some college. Many of the compulsory school age laws, which “refer to the minimum and maximum age required by each state in which a student must be enrolled in and attending public school or some equivalent education program defined by the law” were written before or around the turn of the century, at a time when many young people needed to leave school to begin working in factories, in family businesses, on farms, or in other jobs not requiring a high school diploma.109
Snapshot

62 Building a Grad Nation March 2012
P r O G r E s s A N D chALLE NG E i N m E E t i NG BE Nch m Ar K s OF t h E c i v i c m Ar s hALL P L A N
The case for raising the legal dropout age begins with expectations and how laws reflect values. States are sending a signal that dropping out is an acceptable option when they permit students to drop out at 16. In fact, in a 2005 national survey of dropouts, the dropouts themselves described how they “signed out of high school” forever on their 16th birthday in jurisdictions like Baltimore, Maryland that permitted them to do so.110 Yet, in the same survey, the vast majority of dropouts also reported that leaving school was the worst decision of their lives. Most wanted more expected of them and many knew that the state gave them permission to drop out at 16, a decision they would later regret as they struggled to find a job and support their families.
Data and research support raising the compulsory school age. In fact, 63 percent of the states with graduation rates above the national average have a compulsory school age law of 17 or 18. Research from MIT and Harvard and co-authored by now Chairman of the Council of Economic Advisers, Alan Krueger, provided two compelling findings—because of compulsory schooling laws, roughly 25 percent of potential dropouts remain in high school and will increase their earnings by more than seven percent with an additional year of schooling111. Another report, The Case for Reform: Raising the Compulsory School Attendance Age, highlights the research and provides information from state legislators and governors on how these laws can and should be updated, available at www.civicenterprises.net/reports/the_case_for_reform.pdf).
There is precedent to raise the compulsory school age. Nearly every developed country in the world has a compulsory schooling requirement and the United States is no exception. States have already made the judgment that compulsory school age laws are sound public policy—the key issue is the need to update those laws to reflect the fact that, in today’s economy, a high school diploma and some postsecondary education are prerequisites for most jobs. And the costs to taxpayers and society of students dropping out—in the billions of dollars—far exceed the costs associated with implementing these laws.
Furthermore, the National Conference of State Legislatures (NSCL) and the National Governors Association (NGA) endorse the importance of
updating compulsory school age laws. In Achieving Graduation for All: A Governors Guide to Dropout Prevention and Recovery, the NGA Center for Best Practices states, “to promote graduation for all, governors can raise the maximum compulsory and allowable school attendance ages.”112 NCSL’s Task Force on School Dropout Prevention and Recovery finds, “Evidence suggests that raising the maximum compulsory school age above 16 curtails dropout rates and produces other positive results… States can make maximum compulsory school attendance requirements more meaningful by revoking work permits and driving privileges of students who drop out before the state-set minimum school-leaving age. States also can require that students who withdraw from school before graduation receive information not only about the economic consequences of dropping out, but also how they can complete their high school diploma after they do so.”
There has been promising progress and action in many states to improve these laws. The majority of states now have a compulsory school age of 17 or 18 and in the past decade alone, 12 states such as Indiana, New Hampshire and Rhode Island have updated their laws. Unfortunately, 18 states still permit students to drop out at the age of 16 (see list on next page). In the vast majority of those states that have not updated their compulsory schooling laws, legislation has been introduced to increase the compulsory school age.113
Those who argue that the record is mixed in terms of increases in graduation rates in states with compulsory school age laws of 18 fail to recognize that simply raising the school attendance age is not a silver bullet that on its own will address the dropout crisis. Raising the age must be coupled with other key reforms around quality, including adoption of Common Core State Standards, holding high expectations for all students and surrounding them with high quality teachers, community based support, and multiple pathways for success.
Some states are using the law as a platform to share with students the costs to them and society of dropping out. Others, such as Tennessee and West Virginia, are following NCSL recommendations and creatively linking the compulsory school age law with enforcement that includes suspension of drivers’ licenses.

Building a Grad Nation March 2012 63
P r O G r E s s A N D chALLE NG E i N m E E t i NG BE Nch m Ar K s OF t h E c i v i c m Ar s hALL P L A N
In Tennessee, for example, the Departments of Education and Safety have partnered on the “Minor/Teenage Affidavit & Proof of School Attendance.” Through this policy, “If a student fifteen years of age or older drops out of school or fails to make satisfactory academic progress, the school is required to notify the Department of Safety. This suspends the student’s driving privileges. The first time a student drops out, he or she may regain the privilege to drive by returning to school and making satisfactory academic progress. There is no second chance, however. The second time a student drops out, he or she must wait to turn 18 years old before being eligible to apply.”114
Initial data show that the policy has had good effect: since implementation, the number of “offenders” (students who fail to meet academic and attendance requirements) has fallen each year (from more than 5,000 in the 2006-2007 school year, to 3,000 in 2010-2011).115 Department of Education officials emphasize that this policy is just one part of the state’s comprehensive plan, which emphasizes alternative methods to make school meaningful for students in diverse ways. (For more information, see Tennessee’s Center for Dropout Prevention and Dropout Prevention Toolkit, available at www.tn.gov/education/safe_schls/dropout/index.shtml). In February, the Tennessee House Education Committee introduced a bill (HB1185/SB0882) that requires the Department of Safety to report to the legislature on the number of students whose driver licenses are denied or suspended because of failure to make academic progress.116
Like in Tennessee—the state that leads the nation in gains in graduation rates—compulsory school-age laws must be part of comprehensive reform efforts. More research to identify best practices around implementation of these laws and sharing best practices would be beneficial in making these laws even more effective.
STATES WITH A COMPULSORY SCHOOL AGE OF 16
* States that have introduced legislation to increase the mandatory school age, as of February 2012.
Alaska*Arizona*Delaware*FloridaGeorgia*IdahoIowa*Kentucky*Maryland*
Massachusetts*Minnesota*MontanaNew Jersey*New YorkNorth CarolinaNorth DakotaVermont*Wyoming
$942 million*
If these states achieve the Grad Nation goal of a 90% high school graduation rate for just a single high school class, they would see increases in their individual Gross State Products that together would likely total more than
* Courtesy of the Alliance for Excellent Education

64 Building a Grad Nation March 2012
P r O G r E s s A N D chALLE NG E i N m E E t i NG BE Nch m Ar K s OF t h E c i v i c m Ar s hALL P L A N
Benchmark: The High School Years Provide All Students (including those who have dropped out) Clear Pathways from High School to College and Career Training
Just three in 10 (32 percent) of 25- to 29-year-olds in the U.S. have attained a bachelor’s degree.117 Just as one-size K-12 education does not fit all, post-secondary pathways need to be numerous with many access points. Research supports multiple pathways to high school graduation and beyond. Early college high schools, access to advanced placement classes, dual enrollment in high school and community college, and more schools with high standards and expectations are improving college-readiness rates and preparing more students for technical education opportunities. High school teachers and guidance counselors need to be aware of opportunities after graduation, and discuss options, particularly for students who lack focus and/or have little support from home on educational opportunities. Some sort of postsecondary training is becoming increasingly essential for success in today’s economy.
Even those students with well-developed dreams may be thwarted by financial challenges—both real and perceived. Research shows that 80 percent of students who complete the federal financial aid application (FAFSA) enrolled in post-secondary institutions. Yet many students do not complete these forms or do so incompletely. To overcome this, the U.S. Department of Education has recently expanded a pilot project to 80 additional school districts that provides the district with real time feedback on which of their students has successfully completed the FAFSA. This in turn enables the school districts to engage in targeted outreach to ensure all students complete the forms.
Without systems—beyond the FAFSA—to support students and families in one of the most important financial decisions of their lives, young people too often give up on college, face dream-crushing realizations when they compare their financial aid packages to their need or—years later—find themselves burdened with insurmountable debt.118 Research shows that students foreclose on the idea of a college education as early as the 9th grade because of misperceptions of college cost.119 According to a National Postsecondary Student Aid Study (2007-2008), 1.7 million students failed to complete the
FAFSA because they incorrectly believed they were ineligible; of the non-applicants, 33.1 percent would have qualified for a Pell Grant, and 17.1 percent would have qualified for the maximum Pell Grant.120 Limited financial education systems translate to lower rates of college completion for students from lower-income backgrounds. This is not a question of academic merit—the best-prepared students from the lowest socio-economic group have the same chance of attending college as the least-prepared students from the highest group.121 In fact, 76 percent of students from high-income families obtained a bachelor’s degree by age 24, compared with only 10 percent from low-income families.122
Students need to do many things to get to college, many of them difficult to navigate, especially those who may be the first in their families to go to college. Yet these students are no longer in high school or not yet in college, and thus have limited or no structured support beyond family members. To combat this, at last year’s Grad Nation Summit, Vice President Biden released a U.S. Department of Education College Completion Toolkit (available at www.whitehouse.gov/sites/default/files/college_completion_tool_kit.pdf).
Organizations, too, are making college completion a national priority. The Bill & Melinda Gates Foundation and Lumina Foundation are funding those innovators in college completion and financial education. Through its grant making efforts and policy convenings, Lumina is working toward three main outcomes: better pre-college preparation, greater support for student success, and improved productivity in higher education. The Gates Foundation has focused on high school and college completion, including its Postsecondary Success Strategy that aims to dramatically increase the number of young adults who complete their postsecondary education, setting them up for success in the workplace and life. The Action Center for Educational Services and Scholarships (ACCESS) is expanding its operations from Massachusetts to Miami, with plans to expand nationally, providing free financial aid advice and advocacy. ACCESS has helped 8,000 students secure more than $150 million in financial aid in the last three years, maintaining a 75 percent college graduation rate among the students they serve.123

P r O G r E s s A N D chALLE NG E i N m E E t i NG BE Nch m Ar K s OF t h E c i v i c m Ar s hALL P L A N
Complete College America (CCA) works to significantly increase the number of Americans with quality career certificates or college degrees, and to close attainment gaps for traditionally underrepresented populations. Based on research showing that time is the enemy of college completion, CCA’s work challenges and assists states to set completion goals, use transparent metrics to understand why students don’t complete their programs, and structure programs to reduce exit points. CCA’s Completion Innovation Challenge, supported by the Gates Foundation, challenged all 50 governors to implement innovative, high-impact reforms to significantly boost student success and close attainment gaps for low-income students and students of color. The 18-month implementation grants were awarded to states that produced the best plans to develop and deploy innovative, statewide strategies to substantially increase college completion in Arkansas, California, Colorado, Georgia, Indiana, Kentucky, Maryland, Tennessee, Texas, and West Virginia.124 The College Board’s State Capitals Campaign has also held events in 13 cities: Sacramento, California; Denver, Colorado; Miami, Florida; Boise, Idaho; Indianapolis, Indiana; Annapolis, Maryland; Boston, Massachusetts; Raleigh, North Carolina; Columbus, Ohio; Providence, Rhode Island; Nashville, Tennessee; Austin, Texas; and Charleston, West Virginia. This campaign celebrates successful and innovative policies and programs within each state that align to the 10 recommendations in the College Board’s College Completion Agenda Progress Report and the State Policy Guide.125 In January 2012, Jobs for the Future released a report that detailed how pathways to college are not only necessary for all high school students, but also a critical component of dropout recovery. Pathways to Recovery: Implementing a Back on Track through College Model highlights a number of effective efforts that can be scaled.
Benchmark: The High School Years (2017-2020)Support Comprehensive Dropout Recovery Programs
There are millions of youth ages 16 to 24 who are out of school and out of work, many of whom are high school dropouts. In fact, an estimated one in six, or 6 .7 million of the 38 .9 million youth 16-24 years old, are “opportunity youth,” meaning that they are not in school or work or college graduates.126 More than half—or 3.4 million—have been chronically disconnected from school and work since they were 16, highlighting the magnitude of the high school dropout epidemic. The other half—3.3 million—are under-attached in that they may have graduated from high school and even attended college, but they have not progressed through college or obtained a job. Opportunity youth cost the taxpayer $93 billion in 2011 alone as a result of lost tax payments and increased government spending on crime, health care, welfare and more. Over their lifetimes, they will cost taxpayers $1.6 trillion and society $4.7 trillion, acting as a further wake up call that we must address the dropout epidemic in both high school and college, and work smarter to reconnect these youth.127
In January 2012, Opportunity Road: The Challenge and Promise of America’s Forgotten Youth shared findings
Building a Grad Nation March 2012 65

66 Building a Grad Nation March 2012
P r O G r E s s A N D chALLE NG E i N m E E t i NG BE Nch m Ar K s OF t h E c i v i c m Ar s hALL P L A N
from a national cross-section of opportunity youth in 23 diverse locations across the United States to learn about common elements in their personal histories and their lives today, and to explore opportunities to reconnect them to work and school. The challenges these youth face are often severe—three in five surveyed grew up in poverty, nearly half were raised by a single parent, and very few grew up in households with a parent who graduated from college. Yet, more than half believe they will graduate from high school or college one day, accept responsibility for reconnecting to school or work, and want to work with successful peers, teachers, and business leaders who can guide them in their education and mentor them in the workplace. The report highlights the voices of these youth as well as the comprehensive approaches that are working to leverage the potential of these young Americans. 128
Comprehensive recovery programs are required to re-engage dropouts—including opportunity youth. These students require a comprehensive approach that integrates academic education, on-the-job training experience, holistic personal supports, and opportunities for community service and leadership development that culminates with a real opportunity of going on to college or into a meaningful job. National or regional networks of community-based, school systems, and state charter schools give dropouts a second chance to complete their secondary education, such as YouthBuild, Transfer Schools in NYC, and Youth Connection Charter Schools in Chicago. (To view the full report, including studies on programs including Year Up, Youth Build, Manchester Bidwell, Improved Solutions for Urban Systems, and “Earn and Learn” models, please visit www.civicenterprises.net/reports/opportunity_road.pdf).
The Business Case for Education
Corporate Social Responsibility (CSR) has undergone a dramatic transformation in the past decade . Increasingly, private sector organizations are transitioning from a charity-based model, where financial assistance alone is provided, to a partnership model with nonprofits and school systems, where there is an investment of funds and/or human capital in results-driven initiatives . Most often, this transformation is influenced by labor market realities and talent development needs . Today, many employers struggle to find qualified candidates to fill open positions . More than half of all new jobs in the next decade will require some postsecondary education,129 yet only three in 10 students today have a college degree .130 In the field of manufacturing, data from the Bureau of Labor Statistics show that “in a recent one-year period, job openings doubled, but hiring rose only 13 percent,” demonstrating this gap between available jobs and qualified workers . 131 A recent survey of Inc . 500 (a group of the fastest-growing companies in the United States) reported that the biggest impediment to growing their companies was “finding qualified people .”132
Businesses are responding to the skills gap reality in many ways, from lobbying for and hiring additional workers with H-1B skilled worker visas133 134 to creating in-house training programs .135 Forward thinking companies realize that their investments lead to an increase in visibility and community connections . Sixty-four percent of surveyed business leaders say that corporate engagement produces tangible contributions to business goals .136 Business goals could include higher revenues, lower marketing costs, name recognition, and an increase in employee productivity and loyalty .137 Programs that integrate aspects of working and learning are considered key to companies that need a future workforce skilled and ready to work .
Companies are making major investments in America’s birth-college educational pipeline . For example, Target, Cargill, General Mills, and Medtronic collaborated to provide student support in early literacy, STEM, and college preparation for Minneapolis Public School students . Likewise, the Bank of America Charitable Foundation, Belk Foundation, Duke Energy Foundation, Wells Fargo Foundation, and others came together around Project LIFT
Snapshot

Building a Grad Nation March 2012 67
P r O G r E s s A N D chALLE NG E i N m E E t i NG BE Nch m Ar K s OF t h E c i v i c m Ar s hALL P L A N
to boost graduation rates and narrow the achievement gap in the West Charlotte, North Carolina Corridor . Initiatives range from the local initiative (such as a retired Knoxville CEO working with the school district to oversee the creation of an early warning indicator and intervention system138) to the national (such as the Grad Nation campaign, which is made possible through the support of many partners, including State Farm, Target, AT&T, Pearson Foundation, Boeing, ING Foundation, and many others) .139
Some companies are making targeted investments in their nearby school systems . In the Chicago Public Schools (CPS), for example, Baxter International Inc ., (Baxter) a global healthcare company, “is ensuring that current students, as well as future generations, have the opportunity to learn and be inspired by math and science, while simultaneously meeting critical business needs . In 2008, the company launched Science@Work: Expanding Minds with Real-World Science, a multi-year partnership with Chicago Public Schools (CPS) to support teacher training and student development in biotechnology . The partnership represents the first and largest philanthropic contribution to biotech education in CPS history . Baxter’s objectives for the partnership include expanding curricula and professional development, providing hands on experience to students and teachers, and demonstrating Baxter’s commitment to a critical need in Chicago . A core tactical component is providing students and teachers with opportunities to experience science first-hand, through interactions with Baxter professionals .
In a breakthrough for closing the skills gap, the IBM Corporation has collaborated with the New York City Department of Education, the City University of New York (CUNY), and the New York City College of Technology to open Pathways in Technology Early College High School (P-TECH), an innovative public school spanning grade 9-14 . I-TEACH students will earn high school diplomas and a no-cost associates degree and will be positioned to secure entry-level positions in the highly competitive Information Technology fields and/or complete their studies in a four-year higher education institution . In addition to the focus on early college curriculum and career development, each student will move through a personalized academic pathway and be linked to a mentor .
Companies are also making major, long-term commitments to accelerating graduation rates . In 2008, AT&T launched Aspire, a $100M initiative focused on addressing high school success and college and career readiness for students from at-risk communities . In its first four years, Aspire impacted more than 1 million students through initiatives that ranged from career exploration, to family and youth engagement . AT&T has helped advance the Civic Marshall Plan to build a Grad Nation, including its leading efforts to support cutting-edge research on using data to drive decision making and its support of the Grad Nation Annual Update to the nation on the dropout epidemic .
Snapshot

68 Building a Grad Nation March 2012
P r O G r E s s A N D chALLE NG E i N m E E t i NG BE Nch m Ar K s OF t h E c i v i c m Ar s hALL P L A N
On March 19, 2012, AT&T announced its expanded commitment through Aspire. Going forward, the company will focus on driving innovation in education by:
• Investing locally through contributions to nonprofits, school districts and school foundations that deliver results, especially those that embrace social innovation or focus on STEM disciplines for at-risk students .
• Connecting people through Aspire Academy, which will build on the company’s successful job shadow program and broaden the platform to deepen employee engagement, as well as through engaging AT&T customers .
• Seeking exponential change in education working through collaboration with AT&T business units and national partnerships in order to stimulate promising ideas that support high school success .
Visit www.att.com/education-news for additional information .
As the private sector continues to hone its education investment strategies and make links to its business outcomes, best practices are being captured and shared . For example, the Corporate Voices for Working Families website provides a variety of tools for establishing these strategic partnerships, including the Call to Action and the Ready by 21 Business Engagement Menu: Increasing Communications Between Business and Community Leaders (available at www.corporatevoices.org/our-work/workforce-readiness/ready-21/tools-resources-business-community-leaders) . The White House Council for Community Solutions also recently released a Toolkit For Employers: Connecting Youth and Business (available at www.serve.gov/council_resources.asp) . MENTOR: The National Mentoring Partnership, in collaboration with Viacom Corporation, and Innovation Research and Training, recently released Mentor in a Box, which provides corporations and businesses with guidance on how to set up, operationalize, and develop a sustainable and successful mentoring program . For more information on Mentor in a Box and how to start a corporate mentoring program visit www.mentoring.org . Also see Appendix I for additional ways businesses can help to build a Grad Nation .
Snapshot

Building a Grad Nation March 2012 69
Part 4: Paths Forward

70 Building a Grad Nation March 2012
PAt hs F OrWAr D
All of us—students, families, educators, business leaders, nonprofits, and officials in federal, state, and local governments—must continue to work together to improve our partnerships and polices to stem the dropout tide. The pipeline of education —from early education through career—must be strengthened. In the first Building a Grad Nation report, we outlined a comprehensive set of policies and strategies to boost high school graduation rates. The landscape between federal and state policy is shifting and state efforts are becoming even more critical. In light of these changes and to capture new opportunities, we provide below supplemental policy recommendations and strategies at the federal, state and local levels to accelerate our progress in confronting the dropout epidemic. (For additional information on paths forward, including research gaps and ways you can help build a Grad Nation, please see Appendices D and I).
FEDERAL POLICIES 1. Policies to Promote High School Graduation
The Elementary and Secondary Education (ESEA) was last reauthorized more than 10 years ago as the No Child Left Behind Act (NCLB). At the time NCLB was signed into law, lawmakers and other stakeholders came together to improve educational outcomes for all children. We have learned much from this law and the policies that it enacted. Today, states and schools need both flexibility to adopt school improvement systems specific to their communities and accountability to ensure all students succeed.
The trajectory of educational achievement is failing to keep pace with the growing need for highly educated workers to maintain America’s competitive edge in the global economy. Considering the persistent achievement gap and dropout crisis, federal education policy must be improved, ideally through the reauthorization of ESEA, and if necessary, through temporary waivers issued by the U.S. Department of Education. To that end, these recommendations outline what we think federal education policy should look like, whether these changes occur through reauthorizing ESEA or through the Department of Education’s flexibility policy (i.e., waivers from requirements of the No Child Left Behind Act).
Promote College and Career-Ready Standards. College and career readiness, rather than mere proficiency in basic skills, must be the goal of K–12 education. States have recently adopted college- and career-ready standards, and their leadership should be reinforced by policy at the federal level, including support for assessments aligned to these standards. High standards ensure that, regardless of where a student lives and independent of his or her socioeconomic status, he or she will have access to an excellent education that will prepare him or her for college and a career in the 21st century.
Ensure 21st Century Accountability for All Students. It is critical that accountability systems drive the K-12 education system toward the ultimate goal of college- and career-readiness. Federal education policy should, therefore, direct states to implement accountability systems that promote continuous improvement of all students and schools. At the high school level, accountability systems should be comprised of achievement measures, high school graduation rates, and other measures of college- and career-readiness such as AP/IB performance, SAT/ACT performance, or the percentage of students enrolling in postsecondary education. Incorporating multiple measures of student achievement and attainment in accountability systems will promote a deeper learning experience for the nation’s students that will prepare them for the 21st Century. Graduation rates should be given equal weight to measures of achievement in order to avoid the potential negative consequences of an accountability system based solely on standardized tests (e.g. the incentive to push out low-performing students in order to increase test scores.) Goals and targets for each indicator should be established for all students and for subgroups of students, leading toward the ultimate goal of college- and career-readiness.
In elementary, middle and high schools, early warning indicator and intervention systems should be in place that include the indicators shown to most accurately predict a students’ risk of dropping out of high school, including measures of student achievement, chronic absenteeism rates, and the frequency of minor and major behavioral infractions. These indicators have a greater predictive value of student risk than do familial or socioeconomic factors and have been proven to identify students at risk of dropping out as early as 3rd grade. If we truly want to stem the dropout tide, it is imperative that early warning indicator systems be fully implemented to support school improvement.
Building a Grad Nation March 2012 71
PAt hs F OrWAr D
Additionally, while federal policy should focus on the lowest-performing schools, it should ensure that all low-performing schools receive the support needed to improve. Recent proposals to limit federal accountability and improvement policy to a small portion of a state’s lowest-performing schools would overlook thousands of schools in need of reform. Accountability systems should include all schools and all students, and tailor reform to schools’ and students’ specific needs.
Support Effective Improvement Strategies that Leverage Community Resources.
Federal policy should support state and district level systems for secondary school reform. Core components of such systems should include
– Diagnostic analyses and capacity assessments to determine the specific needs and potential resources to strengthen student achievement;
– Targeted assistance for low-performing schools that require modest reform;
– Whole school reform or replacement for chronically underperforming schools;
– Partnerships with nonprofit organizations and others to leverage resources, expertise, and to acquire the human capital needed to deliver the direct student support needed to address the academic and non-academic needs of struggling students; and,
– Specific attention to the challenge of chronic absenteeism, demonstrated by research to be a powerful predictor of dropping out.
Additionally, federal policy should support the growing evidence and practice of community-wide collaborations, such as Promise Neighborhoods, to improve student achievement from early learning through high school completion.
Launch a Race to the Top: Secondary School Challenge(See text box for additional information.)
The Obama Administration has leveraged substantive policy changes through its Race to the Top initiative. Just as the Early Learning Challenge Fund and recently proposed Race to the Top: College Affordability and Completion aims to advance these elements of the education pipeline, secondary school reform could
be advanced through this strategy. Doing so would leverage transformational reforms, such as increasing the compulsory school age as proposed by the President in the 2012 State of the Union Address and focusing systemic improvement efforts on chronically low performing middle and high schools.
RACE TO THE TOP FOR SECONDARY SCHOOLS
The Obama Administration has successfully used competitive grant programs to drive school reform, and should continue to do so with an emphasis on middle and high schools . During the 2012 State of the Union Address, President Barack Obama called on states to raise their compulsory school age to when students graduate or turn 18 . This is an important step that, if coupled with research-based reforms in middle and high schools, will help to ensure that students graduate college- and career-ready .
The Obama Administration should provide states with an incentive to raise their compulsory school age to 18 and institute meaningful secondary school reform by designating a portion of Race to the Top funds for this purpose . Similar to the Race to the Top Early Learning Challenge that is providing states with an incentive to develop systems for early learning and development, as well as the recently proposed Race to the Top: College Affordability and Completion that would advance post secondary education, a Race to the Top Secondary Challenge would spur transformational systemic reform among the middle and high school grades that are critical to college- and career-readiness .
Building on the success of previous Race to the Top efforts, the Race to the Top Secondary Challenge should set a high bar and focus on several key areas of systemic reform, including
– Raising the compulsory school age to 18 or the age that students graduate;
– Transforming the pipeline of low-performing middle schools that feed into low-performing high schools;
– Implementing 21st Century education models in high schools to prepare students for college and careers;

72 Building a Grad Nation March 2012
PAt hs F OrWAr D
– Integrating education, workforce, and social support systems to put disconnected youth back on track toward education and employment success;
– Harnessing the power of nonprofit and community-based partners that have a record of providing the direct student supports needed to dramatically, sustainably transform struggling schools;
– Implementing an accountability system at the high school level that promotes college- and career-readiness;
– Implementing Early Warning Systems that identify and support both students who are off-track for high school graduation and not yet on –track for post-secondary success; and,
– Creating accelerated pathways to post-secondary success .
2. Policies to Promote the Success of Opportunity Youth140
There are millions of youth ages 16 to 24 who are out of school and out of work. They cost the nation billions of dollars every year and over their lifetimes in lost productivity and increased social services. But if they can be re-engaged in school and work, they represent an opportunity for the nation to increase productivity and fill a critical skills gap.
Forge youth opportunity pathways. Youth Opportunity Grants should target low-income communities, foster community collaboration among multiple sectors, and adopt systemic approaches to re-enrolling dropouts into local charter or “back on track” schools or programs focused on dropout re-engagement and preparation for the labor market.
Reinvest in success: Reward and scale up effective programs. All existing comprehensive programs designed for opportunity youth that have been shown to be effective and have waiting lists should be expanded to welcome all young people seeking a chance to get back on track. When programs are successful at reconnecting youth, they do not necessarily receive additional funding. The money the government saves by successfully reconnecting youth is often saved by a different program or agency than the one that served the youth. Innovative funding
mechanisms such as the Maryland Opportunity Compact, Social Impact Bonds and Pay for Success Initiatives ensure that savings are reinvested in scaling up successful programs.
Measure performance and ensure accountability.As our call for integrated community solutions made clear, reconnecting opportunity youth requires a number of institutions, systems and organizations working together. To do so with precision, community leaders need rigorous data to hold decision-makers collectively accountable for results. Too often, instead of having one effective data and accountability system, communities have multiple fragmented data systems, each of which lacks the breadth and capacity to be used to drive overarching accountability for opportunity youth. These parallel data systems often make redundant technological expenditures, collect overlapping sets of information, and are built in ways that inhibit the flow and transfer of data among them. As a result, despite new resources devoted to data systems, most community leaders still do not have the information they need to be effective. The U.S. Government is also behind other industrialized nations in regularly reporting on youth who are out of school and out of work, presenting an opportunity for the U.S. to more regularly collect and report information on opportunity youth, at least annually through the Current Population Survey or American Community Survey.
Encourage employers to train and hire opportunity youth. Employers play an essential role in helping create career pathways for disconnected young adults. While some employers are actively providing career pathways for these young adults, incentives are needed to get more employers to the table as a partner in this critical role. The federal government took a small step in that direction by authorizing the Disconnected Youth Opportunity Tax Credit (DYOTC) in the American Recovery and Reinvestment Act of 2010. The DYOTC provided a tax credit to employers who hire opportunity youth, as defined by the law. This approach needs to become permanent and, rather than just reward employers for hiring opportunity youth, it should include incentives for employers to provide a range of valuable experiences such as training and internship opportunities provided directly by an employer or in partnership with a community-based program.

Building a Grad Nation March 2012 73
PAt hs F OrWAr D
NATIONAL SERVICE IS A CROSS CUTTING SOLUTION
In order to further encourage the re-engagement of opportunity youth, Congress should live up to the promise of the Edward M . Kennedy Serve America Act, and increase the number of national service opportunities available to our nation’s young people and leverage national service to promote high school graduation and re-engage opportunity youth .
Improve our Nation’s Lowest-Performing Schools to Promote High School Completion
In high-poverty, low-performing schools and high schools with low graduation rates, large numbers of students often require intensive supports, which many schools do not have the capacity to provide . National service organizations that leverage Corporation for National and Community Service programs, including AmeriCorps, Senior Corps, and AmeriCorps*VISTA, are uniquely positioned to partner with educators, principals, schools, and districts to infuse schools with the additional human capital required to effectively meet the scale and intensity of students’ needs . Policy makers should encourage partnerships between districts and national service organizations by incentivizing districts and schools to partner with national service organizations through the Reauthorization of the Elementary and Secondary Education Act or the waiver process .
Re-engaging Opportunity Youth
At a time when millions of Americans, especially young Americans, are struggling to find work, national service programs offer job training, skill-building opportunities, and have a record of setting participants on a successful career path . National service programs improve opportunities and outcomes for opportunity youth .
STATE STRATEGIESThe federal government can play a powerful role in education, but 90 percent of education dollars are controlled at the state and local levels.141 Therefore, we make the following 10 recommendations to state-level stakeholders.
– Understanding the graduation rate in communities and states. There are many estimates of graduation rates, but most do not accurately capture the extent of the dropout crisis. See Part 2 of this report to find out which states and communities are using the adjusted cohort graduation rate method. Additional information on how states are doing as measured by the Civic Marshall Plan Indices is available at www.every1graduates.org
– Investing smartly in education. State budgets are tight, but the economic costs of failing to invest are greater. The waiver process from No Child Left Behind (NCLB) provides states flexibility on how to spend some of the their federal education dollars. These dollars should be strategically invested in evidence-based programs for school readiness, school improvement and student support. States and corporations should invest to strengthen the link between high schools, community colleges and technical institutes, and employers to prepare young people for entry into skilled occupations. To learn more, see the Alliance for Excellent Education’s and the Economy project available at www.all4ed.org/publication_material/Econ
– Transparency in the NCLB waivers and waiver process. These waivers, if granted, can affect policies at the school, district and state levels. Additional information on these waivers is available in the recent brief by the National Governors Association Center for Best Practices, Creating a College and Career Readiness Accountability Model for High Schools available atwww.nga.org/cms/center
– Raising the compulsory school age to when students graduate or 18. Existing research shows that raising the compulsory school age acts as a constraint on dropping out and boosts earnings. The Case for Reform provides information from state legislators and governors on how these laws have been recently updated in certain states, available at: www.civicenterprises.net/reports/the_case_for_reform.pdf

74 Building a Grad Nation March 2012
PAt hs F OrWAr D
– Learning from models of success like Tennessee and New York. Reform efforts should benefit from models of success and help promote the use of evidence-based strategies, school turnaround and replacement models, and research-based interventions. The U.S. Department of Education’s Institute of Education Sciences (IES) What Works Clearinghouse (WWC) is a central source of scientific evidence for what works in education, available at http://ies.ed.gov/ncee/wwc
– Doing a policy audit at the school, district and state levels. This audit should ensure basic school attendance, behavior and course passing policies support graduation for all. The Center for Public Education’s Guiding Questions informs this process, available at www.data-first.org/learning/guiding-questions
– Using longitudinal data systems to analyze graduation and dropout trends. Efforts should be undertaken to examine a recent year’s dropouts and analyze them by age and credits shy of graduation to identify which targeted strategies should be implemented to meet student needs. Such efforts can partner with an educational research institution, such as those listed in http://drdc.uchicago.edu/links/education-links.html
– Putting early warning indicator and intervention systems in place in every district with a low graduation rate high school. EWS should be in place no later than middle school. On Track for Success: The Use of Early Warning Indicator and Intervention Systems highlights best practices from across the country, available at www.civicenterprises.net/reports/on_track_for_success.pdf
– Measuring and reporting on chronic absenteeism at the school, district and state levels. Collecting and reporting data on chronic absenteeism should become common practice at the school, district and state levels. Efforts can be informed by the tools and strategies to promote attendance from Attendance Works, available at www.attendanceworks.org/what-can-i-do
– Developing a State Civic Marshall Plan. Creating results-driven partnerships with key actors in the state who are interested in cradle to career education efforts is essential to success. States should work to identify major assets and needs related to the Civic Marshall Plan benchmarks, mobilize key partners in the state to align their efforts with those benchmarks, and report results every year. The Leadership Council of the Civic Marshall Plan to Build a Grad Nation can support these efforts (please see Appendix K for a list of Leadership Council Members).

Building a Grad Nation March 2012 75
Final Word: A Letter From Young LeadersIf You Want To Know, Just Ask. Why Youth Involvement is Imperative to Ending the Dropout Crisis.
We want to be involved by working alongside adults in leadership capacities, either by providing input and recommendations or by sharing the decision-making power.
Dear Adults,
Across the nation, students have mobilized together and are active in decreasing the nation’s dropout rate. From student-led conferences to after-school mentoring, youth have shown that they care about and are capable of making a difference. It is important for youth to be involved in their communities and in the national movement to end the dropout crisis. With support from caring adults, we can work together to ensure that every young person in America has the opportunity to graduate prepared for life after high school.
The brilliance of America’s success is its commitment to empower youth to create a better tomorrow. Students are essential pieces of the puzzle in achieving the goals of the Grad Nation movement.
Our Education Depends On Our Involvement at All Levels
Many students have recognized the positive influence they can have on their peers. We have the advantage of finding common ground with those who may be considering dropping out. In Cleveland, Ohio, a group of students in the Baldwin-Wallace College Scholars Program recognized the low performance of some ninth-grade students at their school. They developed a program that enabled upperclassmen to assist low-performing younger students through peer mentoring and supplemental academic support.
We want to be involved by working alongside adults in leadership capacities, either by providing input and recommendations or by sharing the decision-making power. For example, elected boards across the country have begun involving young people in their deliberations. Some, such as the Montgomery Board of Education in Maryland, give student representatives the power to vote, while others, such as the Hampton City School Board in Virginia, provide a young person with the opportunity to act as an advisor. Whether it is as high-level decision makers or community organizers, young people are already taking action to close the achievement gap, and further engaging us will ensure that we are valued stakeholders in our own success and are included in the efforts to enhance education.
Our Education Extends Outside the Classroom
Students across the country have realized how important out-of-school factors are in determining classroom achievement. We have shown that we can be active in tackling the issues at the heart of the achievement gap. Many young people are involved in service projects, which can be as brief as an hour or as long as a career. These service-learning initiatives play an integral role in meeting a community need that impacts students’ classroom performance. In Joplin, Missouri, for example, Missouri Southern State University students and Carthage Junior High School Students in Family and Consumer Science classes are partnering to discreetly distribute backpacks full of food, recipes, and other necessities each week to students whose families are not able to secure regular meals.

76 Building a Grad Nation March 2012
A group of students at the University of Chicago have recognized the importance of instilling youth with skills not always taught in the classroom. Through a community organization called Destination College, these students begin encouraging youth to attend college from early ages and emphasize that school does not stop when the bell rings. Destination College provides on-call homework help and reading discussions, and instills in youth a goal-oriented mindset and the skills they need to reach the goal of college attendance.
Our Education Determines Our Country’s Economic Future
Beyond the moral imperative to provide the best opportunity for the youth of America, it is also an economic imperative to ensure our country’s future sustainability and economic success. America needs youth like us to be equipped to fulfill the jobs of the future.
Our age does not affect our ability to set long-term goals for ourselves and put in the effort it will take to reach them. It is never too early for students to begin exploring options beyond high school and college. One 14-year old student in Indianapolis, Indiana chose to create a career exploration program in her community. She organized weekly opportunities for students to shadow adults who work in law and public policy fields, and also hosted a “Law Week” for students in neighboring schools. Exposure to the wide variety of careers that are available to us will encourage students to finish high school and pursue higher education, which will help our country be economically secure in the future.
As youth, we appreciate the many opportunities that our country provides for us. We want these opportunities for success to be available in our future, too, and in order for that to occur, our education must be a top priority. Someday, education equality will ensure that zip codes will not be the deciding factor in whether or not a student graduates from high school, and until then, youth will be valuable contributors to ending the dropout crisis.
Youth across the country have already shown the potential that lies in our generation. We are capable of helping peers, making important decisions, and choosing the right path to ensure future success. We can contribute valuable knowledge and work alongside adults to promote education and ensure that our peers have the support they need to stay in school. These examples are only the beginning of the work that can be accomplished by today’s youth; and with our help, our nation will reach its goal of becoming a Grad Nation.
Sincerely,
Young Leaders Planning Team Building a Grad Nation Summit 2012
The 2012 Young Leaders Planning Team is made up of 13 leaders (ages 15-22) from across the country representing active members of America’s Promise Alliance’s Impact Network.
someday, education equality will ensure that zip codes will not be the deciding factor in whether or not a student graduates from high school, and until then, youth will be valuable contributors to ending the dropout crisis.

Building a Grad Nation March 2012 77
The economic crisis has refocused the nation’s attention on the need to educate our young people. By doing so, we will be increasing their earnings, lowering costs to taxpayers, closing America’s skills gap, and boosting the economy as a whole. Higher educational attainment is also a key answer to increasing social mobility at a time when worries mount about the ability of low-income Americans to climb the economic ladder and access the American Dream.
Two years into the Civic Marshall Plan to build a Grad Nation, the country can point to important progress nationally and across states and communities.
Examples of states and school districts that are beating the odds and increasing high school graduation rates continue to rise to a standard of excellence and serve as a challenge that others can emulate. Yet, while progress is strong, the nation’s overall rates of increase in graduation rates are still too slow to stay on track to meet national goals. Millions of young people still fail to graduate on time, with huge consequences to them, the economy, and our society. It is time to redouble our efforts to ensure all children have access to a quality education and the chance to fulfill their dreams.
Many individuals have been wonderfully helpful in sharing their experience to build a Grad Nation. We offer great thanks to them for their willingness to share lessons learned and next steps envisioned in their own organizations and for the country, including advisors in Alabama, Georgia, Illinois, Maryland, Massachusetts, Nevada, Ohio, Texas, and Washington D.C. We express our utmost gratitude for the leadership and vision of General Colin and Mrs. Alma Powell, the America’s Promise Alliance Trustees, and the Civic Marshall Plan Leadership Council, without whom the Grad Nation campaign would not be possible.
A special thanks to the staff, fellows, interns, and volunteers of the co-convening organizations: America’s Promise Alliance, the Alliance for Excellent Education,
Civic Enterprises, and the Everyone Graduates Center of Johns Hopkins University, and all of the partner organizations of Grad Nation. Thank you especially for the significant contributions of Fred Jones, Phillip Lovell and Tara Tucci of the Alliance for Excellent Education; the tireless efforts of Liz Gubernatis, Diana Marsteller, Mary Maushard, Antonia Wang and Chris West of the Everyone Graduates Center; and the boundless energy and enthusiasm of the Civic Enterprises team, including Megan Hoot, John DiIulio, Rebecca Friant, Frederic Brizzi, Aaron Gold, Brian Goldman and Tess Mason-Elder. Thank you also for the insights of Felicia Brown, Jennifer Ney and Carolyn Trager of City Year; Sujata Bhat of DC Prep; and Jamie O’Leary of the Ohio Council of Community Schools.
Conclusion
Acknowledgments

78 Building a Grad Nation March 2012
Every school in every community has unique opportunities to accelerate achievement for their children. To do so, stakeholders at every level require a set of appropriate solutions for their unique needs. The Civic Marshall Plan is not meant to be a prescription, but rather an iterative, evolving, dynamic, solutions-oriented campaign to end America’s dropout crisis. Therefore, the Civic Marshall Plan’s action items are organized around Four Leading Principles: focus, high expectations, accountability, and collaboration. The principles offer stakeholders key themes that can guide all of their work, while the action items provide targeted issues on which they can focus to reach the goal of 90 percent graduation rate by 2020.
PRINCIPLE: Strategic FocusWe must direct human, financial and technical capacities and resources to low-graduation rate communities, school systems, schools, and disadvantaged students.
Action Items:
• Serve communities housing the “dropout factory high schools” that have 60 percent and lower high school graduation rates and their feeder middle and elementary schools.
• Serve communities housing the high schools that have 61 to 75 percent graduation rates and their feeder middle and elementary schools to ensure they do not slip into a “dropout factory”.
• Integrate multi-sector, business and community-based efforts in collaboration with individual school and school system efforts.
PRINCIPLE: High ExpectationsAll students deserve a world-class education and all children can succeed, if provided appropriate supports.
Action Items:
• Reduce chronic absenteeism with policies and practices that support students in coming to school, staying in school, and learning at school.
• Support, promote, or launch grade-level reading campaigns, ensuring all students read proficiently and with comprehension by fourth grade and beyond.
• Support students in advancing on grade level through school transitions.
• Redesign middle grades education, engaging, effective, academically directed schools.
• Provide engaging and demanding coursework that prepares students for college and careers, as outlined in the Common Core State Standards.
• Transform or replace “dropout factories.”
• Expand education options and choices for students, connecting high school and postsecondary opportunities, including quality career technical education, early college high schools, dual enrollment, back on track and recovery programs.
• Reauthorize the Elementary and Secondary Education Act; strengthen state and school system policies to accelerate student achievement.
PRINCIPLE: Accountability and SupportWe must measure our work so that we know what’s working—and what is not. We must build state, school system, and school capacity to improve graduation and college readiness rates.
Action Items:
• Use evidence-based strategies, promising practices, and data-driven decision making in all education-related sectors.
• Fully implement, use and improve linked educational data systems throughout the educational continuum.
• Develop and support highly effective and accountable teachers, counselors, youth-serving personnel, and administrators, working with those who represent teachers.
• Build Early Warning Indicator and Intervention Systems to identify and appropriately support “on track” and “off track” students.
• Measure the effectiveness of in-school and out-of-school interventions in order to promote and scale best practices.
• Maximize “time on task” in school and maximize extended learning time in school, out of school, afterschool, and during the summer.
PRINCIPLE: Thoughtful CollaborationEnding the dropout crisis requires an all-hands-on-deck approach. To achieve collective impact, collaborations must be deliberately planned, guided by shared metrics, and thoughtfully integrated to maximize efficiency and outcomes.
Action items:
• Showcase examples of success at the state and community levels, serving as a challenge to others.
• Create multi-sector and community-based efforts that harness the power of youth-serving agencies, nonprofits and businesses as education partners.
• Ensure parents and families are continuously engaged in their child’s education and provided appropriate resources to promote their child’s success.
• Elicit the perspectives of students, educators, and parents.
• Educate community members about the need for education, high school and beyond, using all available tools to keep Grad Nation a local, state, and national priority.
Civic Marshall Plan Leading Principles and Action Items
APPENDIX A

Building a Grad Nation March 2012 79
What key understandings guide our approach?Understand the implications of the goal. The goal is a national average graduation rate of 90 percent or higher by 2020. The national graduation rate is 75.5 percent (2008-09). That means as a nation we must gain almost 15 percentage points in 12 years, or approximately 1.3 points per year. Sounds easy? It will not be. A laser-like focus on results is needed to achieve it.
Averages are deceiving. As of 2008-09, only one state—Wisconsin—had a graduation rate of over 90 percent and only 15 states had graduation rates of 80 percent or higher, using the uniform federal graduation rate calculation. Nine states had graduation rates of less than 70 percent, with four under 65 percent, and one as low as 56 percent. Rates for African-American, Hispanic and economically-disadvantaged students are 30 to 40 percentage points lower than for white, Asian and affluent students. To reach the 2020 goal of 90 percent graduation rate, the lowest-achieving states must accelerate achievement by up to 25 percentage points, two to three points per year. Graduation rates for African-American, Hispanic and economically-disadvantaged students must rise significantly.
Average graduation rates in selected states may seemingly decrease in 2010-2011, changing local perceptions of how far a state must go to close gaps. Over the last five years, some states switched to the new calculation method, known as the cohort rate and used this to propel legislation and policies. Other states, while recognizing flaws in their methods, did not switch and instead publicized rates from older calculation methods that used less stringent definitions of who was considered a graduate. In those
states, audiences who may not have had access to the latest research may be surprised to learn in 2011-2012 that graduation rates are not as high as previously publicized. Underlying the new across-the-board capacity to count correctly is the adoption by states of systems of unique student identifiers which enable tracing student progress independent of mobility and transitions. State percentage point gains, regardless of baseline, are real.
A cohort approach enhances graduation rate improvement. Systems of unique student identifiers enable building student cohorts that satisfy certain conditions. From 2010-2011 forward (earlier in states which have had such systems in place previously), students’ progress as a cohort, based on their entering year, can be traced and evaluated. Achieving a 90 percent graduation rate for the class of 2020 means concentrating on the cohort of students in the fourth grade during the 2011-2012 school year, while sustaining such a rate after 2020 means concentrating on the entire pipeline for future cohorts.
A Seamless Infrastructure for 2020 and Beyond. We offer two over-arching strategies, composed of 1) efforts that focus on “getting the most impact for 2020” and 2) efforts with short, medium and long term outcomes for sustaining high school graduation rates. On the one hand, to achieve a 90 percent graduation rate by 2020 we must give all the support necessary to this year’s fourth grade cohort at key leverage points on the educational continuum. On the other hand, we must build a seamless infrastructure to support future cohorts’ success. Both are necessary, with advancing this year’s fourth grade cohort taking immediate precedence.
Civic Marshall Plan Cohort Approach Pipeline 2020
APPENDIX B
LEADING PRINCIPLES
Philosophy of the Civic Marshall Plan
to Build a Grad Nation
ACTION ITEMSTargeted
strategies for success
BENCHMARKSResearch-based strategies to the cohort approach,
tracking the advancment of the
Class of 2020
GOAL90% high school
graduation rate for Class of 2020 and all student college and career ready
INDICATORSMeasures on our progress

80 Building a Grad Nation March 2012
In order to measure the progress of the Civic Marshall Plan, a series of indicators were set by the leadership team. These indicators are divided into two categories: Civic Marshall Plan Benchmark Progress Indicators and Civic Marshall Plan Policy and System Indicators. Each of these indicators measures the impact of the Civic Marshall Plan on the Class of 2020 and beyond. There are also a number of potential indicators that need further development and analysis in order to measure the impact of additional Civic Marshall Plan action items, which are outlined in the Research Recommendations section of this report.
Civic Marshall Plan Benchmark Progress Indicators: These indicators offer quantifiable measures that can be used at the local, state, and national levels and linked to the Class of 2020 cohort.
• NAEP 4th grade reading and 8th grade math scores, disaggregated by race, ethnicity, income
• AP and IB, participation rates in all states; and percent of AP and IB scores at passing rate and above, in all states, annually
• High school graduation rates by state, school system, and school according to the Adjusted Four-Year Cohort Rate
• Numbers of dropout factories by state, locale and poverty and ELL status
• Numbers of students in dropout factories, by state
• Numbers of dropouts, by state
• Two-year college access and three-year completion rates
• Four-year college access and six-year completion rates
Civic Marshall Plan Policy and System Indicators: These indicators offer process measures of the policy and system changes at a state and national levels.
• National, state and local legislation, policies and practices addressing Civic Marshall Plan Guidelines and Strategies, particularly legislation regarding chronic absenteeism, Early Warning Systems, and initiatives focused on dropout factory schools
• Certification of middle grades teachers, by requirement and state
• Prevalence, content and use of early warning systems, including by partner organizations
• Use of longitudinal data systems
• Legal age for leaving school
Civic Marshall Plan: Measuring Our Progress
APPENDIX C

Building a Grad Nation March 2012 81
There are number of action items in the Civic Marshall Plan that directly impact student achievement but require additional research. These include
• Teacher, counselor and administrator preparation and evaluation;
• Nonprofit involvement in local districts, communities and states, by policies, strategies, number of personnel involved and outcomes;
• Parent involvement in local districts, communities, and states;
• Research personnel and institutions involved with local districts and with states—time, focus, results;
• Best practices in private-sector investment;
• The impact on state graduation rates as a result of new legislation increasing compulsory school age;
• One-year vocational access and completion rates;
• Student matriculation in home schooling environments;
• Best practices in and effectiveness of social emotional learning programs;
• The progress and challenge in the towns and rural areas with low graduation rate high schools; and
• The impact of movement of students from traditional schools to alternative schools and home schooling on graduation rates.
Civic Marshall Plan: Research Recommendations
APPENDIX D
82 Building a Grad Nation March 2012
Understanding Federal High School Graduation Rate PolicyPrevious Federal Policy: The No Child Left Behind Act (NCLB) defined graduation rates as “the percentage of students who graduate from secondary school with a regular diploma in the standard number of years.” However, the U.S. Department of Education (ED) approved a variety of state-proposed rates that do not meet this definition. As a result, graduation rates reported by states have historically been misleading and incomparable from state to state. Respected researchers from noted institutions, using a variety of methodologies, calculated states’ graduation rates and found wide differences between the rate that most states report and the independent estimates.
National Governors Association (NGA) Compact: In an effort to move states towards more common and rigorous calculations, in 2004 the National Governors Association developed the NGA Graduation Rate Compact—an agreement that signatories would calculate and report a commonly defined graduation rate. By 2005, the governors of all fifty states had signed the compact, committing their states to calculating and reporting the four-year adjusted cohort graduation rate, which relies on longitudinal student data to track students from high school entry to completion.
2008 Federal Regulations: In October 2008, ED released regulations that changed requirements for states’ calculations, reporting, and accountability systems for graduation rates under NCLB. As part of these regulations, ED built off of the consensus generated by the NGA Compact and required states to use the four-year adjusted cohort graduation rate for reporting and accountability purposes. All states were required to report this rate by the end of School Year (SY) 2010-11 and must use this rate for Adequate Yearly Progress (AYP) beginning in SY 2011-12.
In addition to a four-year rate, the regulations also permit states to use an additional “extended-year” graduation rate that measures how many students graduate in more than four years, which could be incorporated into AYP calculations. For example, a state could use a rate that measures how many students from an adjusted cohort graduate with a regular diploma within five, six, or seven years.
Independent Estimates of High School Graduation Rates
In an effort to provide a common and accurate estimate of graduation rates until the time that the 2008 regulations have fully phased in, researchers have developed several methods to approximate graduation rates. These graduation rate proxies, which include the Averaged Freshman Graduation Rate (AFGR) and the Cumulative Promotion Index (CPI), are designed to approximate the adjusted cohort rate in the absence of longitudinal student data. While these approximations are all similar, the specific methodology of each varies (see below for further detail).
Implications for Economic Benefit Calculations
Because of the varying methodologies of cohort rate approximations, each yields slightly different estimates of the number of graduates and dropouts from a given high school class. For example, depending on which calculation is used, the number of dropouts from the Class of 2011 ranges from approximately 1 million (AFGR) to 1.2 million (CPI). As a result, analyses (such as the economic benefits of reducing the number of dropouts) will vary slightly as well. An illustration of this is the projection of lifetime earnings loss to the nation as a result of a single class of dropouts, which ranges from $130 billion when using the AFGR estimate to $154 billion with the CPI estimate.
Most data in this report, including state economic benefits, are based on the AFGR. Some data in this report, including the $154 billion in estimated earning loss reported by the Alliance for Excellent Education, is calculated from the CPI.
Regardless of which graduation rate approximation is used, the data consistently tells the same story: as a nation, we have too many dropouts, resulting in major economic losses to individuals and the economy.
Key Graduate Rate Definitions and Related Terms
Dropout Factory is a school in which the ratio of 12th graders to 9th graders three years early is 60 percent or less. In other words, these are schools in which 12th grade enrollment is less than 40 percent of 9th grade enrollment three years earlier.
Promoting Power is the ratio of 12th graders to 9th graders three years earlier. Promoting Power is calculated by the Everyone Graduates Center at John Hopkins University from data that schools, school systems, and states are required to provide to the National Center for Education Statistics’ Common Core of Data.
National Governors Association (NGA) Compact Rate:
The NGA Compact also permits students who graduate with a modified diploma, such as a GED, to be counted as a regular graduate.
Averaged Freshman Graduation Rate (AFGR) provides an estimate of the percentage of high school students who graduate on time. The rate uses aggregate student enrollment data to estimate the size of an incoming freshman class and counts of the number of diplomas awarded 4 years later. The incoming freshman class size is estimated by summing the enrollment in 8th grade in
Graduation Rate Definitions, History and Related Terms142
APPENDIX E
# of graduates who receive a regular or advanced diploma in four years
# students in original ninth-grade cohort for the
graduation class
# students awarded alternative degrees
transfers in—transfers out
+
+
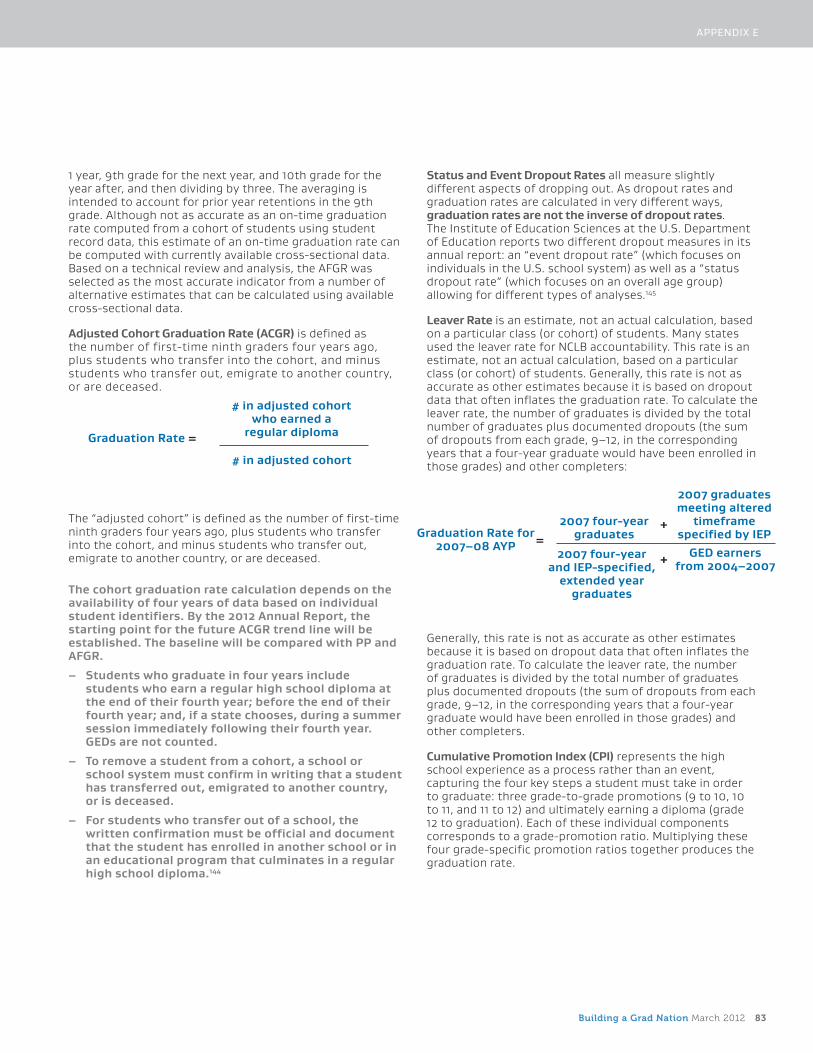
Building a Grad Nation March 2012 83
1 year, 9th grade for the next year, and 10th grade for the year after, and then dividing by three. The averaging is intended to account for prior year retentions in the 9th grade. Although not as accurate as an on-time graduation rate computed from a cohort of students using student record data, this estimate of an on-time graduation rate can be computed with currently available cross-sectional data. Based on a technical review and analysis, the AFGR was selected as the most accurate indicator from a number of alternative estimates that can be calculated using available cross-sectional data.
Adjusted Cohort Graduation Rate (ACGR) is defined as the number of first-time ninth graders four years ago, plus students who transfer into the cohort, and minus students who transfer out, emigrate to another country, or are deceased.
The “adjusted cohort” is defined as the number of first-time ninth graders four years ago, plus students who transfer into the cohort, and minus students who transfer out, emigrate to another country, or are deceased.
The cohort graduation rate calculation depends on the availability of four years of data based on individual student identifiers. By the 2012 Annual Report, the starting point for the future ACGR trend line will be established. The baseline will be compared with PP and AFGR.
– Students who graduate in four years include students who earn a regular high school diploma at the end of their fourth year; before the end of their fourth year; and, if a state chooses, during a summer session immediately following their fourth year. GEDs are not counted.
– To remove a student from a cohort, a school or school system must confirm in writing that a student has transferred out, emigrated to another country, or is deceased.
– For students who transfer out of a school, the written confirmation must be official and document that the student has enrolled in another school or in an educational program that culminates in a regular high school diploma.144
Status and Event Dropout Rates all measure slightly different aspects of dropping out. As dropout rates and graduation rates are calculated in very different ways, graduation rates are not the inverse of dropout rates. The Institute of Education Sciences at the U.S. Department of Education reports two different dropout measures in its annual report: an “event dropout rate” (which focuses on individuals in the U.S. school system) as well as a “status dropout rate” (which focuses on an overall age group) allowing for different types of analyses.145
Leaver Rate is an estimate, not an actual calculation, based on a particular class (or cohort) of students. Many states used the leaver rate for NCLB accountability. This rate is an estimate, not an actual calculation, based on a particular class (or cohort) of students. Generally, this rate is not as accurate as other estimates because it is based on dropout data that often inflates the graduation rate. To calculate the leaver rate, the number of graduates is divided by the total number of graduates plus documented dropouts (the sum of dropouts from each grade, 9–12, in the corresponding years that a four-year graduate would have been enrolled in those grades) and other completers:
Generally, this rate is not as accurate as other estimates because it is based on dropout data that often inflates the graduation rate. To calculate the leaver rate, the number of graduates is divided by the total number of graduates plus documented dropouts (the sum of dropouts from each grade, 9–12, in the corresponding years that a four-year graduate would have been enrolled in those grades) and other completers.
Cumulative Promotion Index (CPI) represents the high school experience as a process rather than an event, capturing the four key steps a student must take in order to graduate: three grade-to-grade promotions (9 to 10, 10 to 11, and 11 to 12) and ultimately earning a diploma (grade 12 to graduation). Each of these individual components corresponds to a grade-promotion ratio. Multiplying these four grade-specific promotion ratios together produces the graduation rate.
APPENDIX E
# in adjusted cohort who earned a
regular diploma
# in adjusted cohort
Graduation Rate =
2007 four-year graduates
2007 four-year and IEP-specified,
extended year graduates
2007 graduates meeting altered
timeframe specified by IEP
GED earners from 2004–2007
Graduation Rate for 2007–08 AYP =
+
+

84 Building a Grad Nation March 2012
ContextPoverty: New York ranks 14th in childhood poverty at 24.6 percent.
College Education: New York ranks 3rd in college completion at 41.3 percent.
Sources: Poverty: Current Population Survey (joint effort of Bureau of Labor Statistics and Census Bureau) College Education: 2009 American Community Survey (Census Bureau)
Economic Benefits*With a 90 percent graduation rate, the additional graduates could deliver an estimated $368 million in increased annual earnings, $129 million in increased annual state tax revenues, and $483 million in Gross State Product.
*Source: Previously unpublished Alliance for Excellent Education analysis of data from Economic Modeling Specialists, Inc.
Civic Marshall Plan to Build a Grad Nation 2012 Index Where Does New York Stand?
APPENDIX F
Progress Challenges
1Average Freshman Graduation Rate (AFGR): Increased from 60.5 to 73.5 percent from 2002 to 2009 Average of 1.9 points per year
Needs to increase 1.5 points per year starting in 2009 to reach 90 percent by 2020
2 Class of 2009 had 31,978 more graduates than Class of 2002 Class of 2020 needs 40,587 more graduates than Class of 2009 to reach 90 percent
3 15 fewer dropout factories in 2010 than 2002 In 2010, there were 130 dropout factories. To reach 0 by 2016, 22 schools need to improve per year
4 64,777 fewer students attended dropout factories in 2010 than 2002
169,863 students still attend dropout factories in 2010
5Percent of 4th graders testing at or above proficient in Reading (NAEP) increased from 34 percent to 35 percent,from 2003 to 2011
125,757 4th graders still not proficient in Reading
6Percent of 8th graders testing at or above proficient in Math (NAEP) decreased from 32 percent to 30 percent, from 2003 to 2011
139,083 8th graders still not proficient in Math
7Students who took at least one AP exam during high school increased 12.4 percentage points, from 27.9 percent to 40.3 percent, from 2001 to 2011
Only 65.8 percent of test-takers scored at least one “3” or higher
8New York has reported the new, four-year adjusted cohort graduate on rate (ACGR) that is now required by the U.S. Department of Education (USDOE). The ACGR for 2010 is76.0 percent
All 50 states will not be reporting the new rate until 2014

Building a Grad Nation March 2012 85
ContextPoverty: Tennessee ranks 16th in childhood poverty at 23.7 percent.
College Education: Tennessee ranks 36th in college completion at 26.7 percent.
Sources: Poverty: Current Population Survey (joint effort of Bureau of Labor Statistics and Census Bureau) College Education: 2009 American Community Survey (Census Bureau)
Economic BenefitsWith a 90 percent graduation rate, the additional graduates could deliver an estimated $79 million in increased annual earnings, $25 million in increased annual state tax revenues, and $95 million in Gross State Product.
Source: Previously unpublished Alliance for Excellent Education analysis of data from Economic Modeling Specialists, Inc.
Civic Marshall Plan to Build a Grad Nation 2012 Index Where Does Tennessee Stand?
APPENDIX F
Progress Challenges
1Average Freshman Graduation Rate (AFGR): Increased from 59.6 to 77.4 percent from 2002 to 2009 Average of 2.5 points per year
Needs to increase 1.1 points per year starting in 2009 to reach 90 percent by 2020
2 Class of 2009 had 13,880 more graduates than Class of 2002 Class of 2020 needs 9,825 more graduates than Class of 2009 to reach 90 percent
3 39 fewer dropout factories in 2010 than 2002 In 2010, there were 19 dropout factories. To reach 0 by 2016, 4 schools need to improve per year
4 39,506 fewer students attended dropout factories in 2010 than 2002
18,689 students still attend dropout factories in 2010
5 Percent of 4th graders testing at or above proficient in Reading (NAEP) remained the same at 26 percent, from 2003 to 2011
55,538 4th graders still not proficient in Reading
6Percent of 8th graders testing at or above proficient in Math (NAEP) increased from 21 percent to 24 percent,from 2003 to 2011
53,998 8th graders still not proficient in Math
7Students who took at least one AP exam during high school increased 8.0 percentage points, from 11.8 percent to 19.8 percent, from 2001 to 2011
Only 52.5 percent of test-takers scored at least one “3”or higher
8Tennessee has not yet reported the new, four-year adjusted cohort graduation rate (ACGR) that is now required by the U.S. Department of Education (USDOE)
All 50 states will not be reporting the new rate until 2014

86 Building a Grad Nation March 2012
State
Increase or Decrease
2002 Grad Rate
2009 Grad Rate
Nation 72.6 75.5
Alabama 62 .1 69 .9
Alaska 65 .9 72 .6
Arizona 74 .7 72 .5
Arkansas 74 .8 74 .0
California 72 .7 71 .0
Colorado 74 .7 77 .6
Connecticut 79 .7 75 .4
Delaware 69 .5 73 .7
District of Columbia 68 .4 62 .4
Florida 63 .4 68 .9
Georgia 61 .1 67 .8
Hawaii 72 .1 75 .3
Idaho 79 .3 80 .6
Illinois 77 .1 77 .7
Indiana 73 .1 75 .2
Iowa 84 .1 85 .7
Kansas 77 .1 80 .2
Kentucky 69 .8 77 .6
Louisiana 64 .4 67 .3
Maine 75 .6 79 .9
Maryland 79 .7 80 .1
Massachusetts 77 .6 83 .3
Michigan 72 .9 75 .3
Minnesota 83 .9 87 .4
Mississippi 61 .2 62 .0
State
Increase or Decrease
2002 Grad Rate
2009 Grad Rate
Missouri 76 .8 83 .1
Montana 79 .8 82 .0
Nebraska 83 .9 82 .9
Nevada 71 .9 56 .3
New Hampshire 77 .8 84 .3
New Jersey 85 .8 85 .3
New Mexico 67 .4 64 .8
New York 60 .5 73 .5
North Carolina 68 .2 75 .1
North Dakota 85 .0 87 .4
Ohio 77 .5 79 .6
Oklahoma 76 .0 77 .3
Oregon 71 .0 76 .5
Pennsylvania 80 .2 80 .5
Rhode Island 75 .7 75 .3
South Carolina 57 .9 66 .0
South Dakota 79 .0 81 .7
Tennessee 59 .6 77 .4
Texas 73 .5 75 .4
Utah 80 .5 79 .4
Vermont 82 .0 89 .6
Virginia 76 .7 78 .4
Washington 72 .2 73 .7
West Virginia 74 .2 77 .0
Wisconsin 84 .8 90 .7
Wyoming 74 .4 75 .2
Graduation Rates, by State
APPENDIX G
Source: Averaged Freshman Graduation Rate, Common Core of Data, National Center for Education Statistics, U. S. Department of Education, Washington, D.C.
Key:
Progress
Challenge
For additional information, please see map on page 28.

Building a Grad Nation March 2012 87
Graduation Rates, by Race
APPENDIX H
The national graduation rate is 75 .5 percent, as calculated by AFGR . This rate varies among subgroups, including with racial, economic, regional and jurisdictional (e .g . urban, rural) distinctions . Variety also exists within subgroups . For example, the AFGR by race/ethnicity for all reporting states is included here .
NATIONAL CENTER FOR EDUCATION STATISTICS
Public high school number of graduates and Averaged Freshman Graduation Rate (AFGR), by race/ethnicity and state or jurisdiction: School year 2008–09
American Indian/ Alaska Native
Asian/Pacific Islander Hispanic Black White
Graduates AFGR Graduates AFGR Graduates AFGR Graduates AFGR Graduates AFGR
31,859 64 .8 161,305 91 .8 476,568 65 .9 449,261 63 .5 1,859,262 82 .0
Source: Averaged Freshman Graduation Rate, Common Core of Data, National Center for Education Statistics, U. S. Department of Education, Washington, D.C.

88 Building a Grad Nation March 2012
The high school dropout crisis can seem like an intractable problem, especially in some of our nation’s toughest schools where educational challenges are coupled with poor health status, a lack of available jobs, poverty, and related disparities. Despite these challenges, we must act. The future of our nation, and the livelihood of its children, depend on it. Fortunately, when we as Americans decide to make a change, we make a change. We go to the moon. We race to the top.
As the previous pages have shown, we are making progress. As a child’s decision to drop out is not a sudden act, but a slow process of disengagement over time, so must our commitment to accelerating academic achievement be also over the long haul, snowballing successes. You can help. Many of you already are. So, we asked community groups, policy makers, teachers, parents, and youth themselves, “What can be done?” and they answered. Here are a few concrete and actionable ways that YOU can LEARN, SHARE, VOLUNTEER, DONATE, AND ADVOCATE to help build a grad nation. (Please also see Grad Nation A Guidebook to Help Communities Tackle The Dropout Crisis available at http://civicenterprises.net/reports.html for additional resources and recommendations)
This list is not meant to be exhaustive. Solutions exist in your school, church, and community centers that we have not been able to list here. If you have an idea or a suggestion you think we should feature, please contact [email protected]
Everyone: Whether you have a child in a school or not, we all have a stake in the quality of education in our communities. YOU can
– Mentor, tutor, read, support, or coach a young person.
– Volunteer with or donate resources to a community-based organization, school or library.
– Support families in crisis by helping them access social services.
– Provide support for or mentor youth whose families may not have the ability and information necessary to support their healthy development (children of teenage parents, parents in prison, ill parents, unemployed parents, etc).
– Donate a small (or large!) amount to your favorite education organization each month.
Parents and Families: As the parent, relative, or caregiver of a school-age child, you have a significant impact on your child’s educational success. YOU can
– Share a book with your child and let him or her see you reading. Share books in the language of the home, your child will benefit just as much.
– Join the PTA or other school-based parent organization and volunteer at the school.
– Create an optimal home learning environment (such as a quiet space for reading and homework) and establish routines for checking each child’s homework to keep him or her on progress.
– Learn what it takes to graduate from high school in your teen’s district and encourage him or her to stay on track.
– Meet all of your children’s teachers and arrange for them to communicate with you regularly before a problem in academic progress or behavior worsens.
– Know your child’s friends and meet their parents so that you know what other influences impact their ideas besides your teachings.
– Recognize your child’s academic accomplishments.
– Identify the resources in your community that can offer your child mentoring and positive activities after school, such as Boys & Girls Clubs, Big Brothers/Big Sisters, Scouts, YMCA, faith-based organizations, public library and museum programs.
– Visit postsecondary institutions (two-year and four-year colleges and trade schools) in your local community and around the country early on so that you and your child have a sense of what’s possible after high school graduation.
How to Get Involved – What You Can Do to Help Build A Grad Nation
APPENDIX I

Building a Grad Nation March 2012 89
Educators, including Teachers, School Counselors and Administrators: Quality schools with engaged teachers, counselors, and other administrators are critical to children’s education attainment. YOU can
– Develop and use early warning indicator and intervention systems in your schools and districts.
– Encourage faculty collaboration for sharing information and forming instructional teams within and across grades, particularly at key points of transition.
– Form creative partnerships with community agencies that can offer mentoring and tutoring support and fill possible gaps in school music, art, and sports programs.
– Design engaging events that encourage parent and community participation. Use existing resources to create opportunities, such as the Family Engagement for High School Success Toolkit (available at www.hfrp.org/HighSchoolSuccessToolkit).
– Engage young people in leadership capacities, either by seeking their input and recommendations, or by sharing the decision-making power.
– Take into account young people’s developmental needs and incorporate styles of learning that are engaging, relevant, and motivating.
– Recognize youth for outstanding achievements including through social media tools.
– Demonstrate to young people that you are genuinely interested in their interests. Ask them questions about their lives, their hobbies, things they like to read, listen to, and watch. Give them attention. Talk to them.
Businesses: To ensure America’s students are ready for the demands of the 21st Century economy and you can find qualified employees for your business, YOU can
– Recruit other local business leaders to become active in the educational success of the community’s youth
– Meet with state and local policy makers on education legislation to advocate for investment education.
– Provide job awareness and skills to local youth in high school through internships or job shadow programs to help guide students toward careers that match their interests. For more information on Mentor in a Box and how to start a corporate mentoring program visit www.mentoring.org. The White House Council for Community Solutions also recently released a Toolkit For Employers: Connecting Youth and Business (available at www.serve.gov/council_resources.asp).
– Develop workplace flexibility programs and family friendly leave policies that allow employees to attend school-sponsored events and support local school systems.
– Partner directly with nonprofits and the school system to develop and/or support afterschool and other programs that work to keep youth in school and on the path toward graduation.
– Provide in-kind and monetary donations to schools and local nonprofits.
– Learn more from Corporate Voices Call to Action and the Ready by 21 Business Engagement Menu: Increasing Communications Between Business and Community Leaders (available at www.corporatevoices.org/our-work/workforce-readiness/ready-21/tools-resources-business-community-leaders).
Youth: Our nation’s future depends on you! YOU can
– Set long-term personal goals and commit to take steps each day to reach them.
– Get involved in your school and community by participating in student-led conferences and assemblies, after-school mentoring or tutoring programs and other extra-curricular activities, volunteering and being civically engaged.
– Refuse to participate in or allow bullying to happen around you. Tell a parent, a guidance counselor, a teacher, a mentor or a friend what is going on when you see something or feel threatened.
– Encourage your friends to come to school by making sure they are up in time for school by calling or texting them.
APPENDIX I

90 Building a Grad Nation March 2012
The Grad Nation campaign needs everyone—dedicated community organizations, educators, parents, youth, business leaders, policymakers, and others—to act together to help millions of young people achieve their full potential. Key Grad Nation programs include
100 Best Communities for Young People – The annual 100 Best Communities for Young People competition provides a powerful vehicle for raising awareness and supporting communities. By recognizing outstanding, multi-sector efforts to improve graduation rates and the well-being of young people, 100 Best promotes increased collaboration, inspires other communities to take action and provides a platform for sharing best practices. Winners have included counties, cities, towns and school districts.
Building a Grad Nation Summit – The premier event of Grad Nation, the Building a Grad Nation Summit brings together hundreds of educators, local and state leaders, staff from nonprofit organizations and businesses, youth and others to share progress and inspire action. The annual event provides an important platform to build awareness about the issues, help participants create connections, highlight local, state and national successes, share tools and knowledge, and report on our nation’s progress toward reaching a 90 percent graduation rate by 2020.
Grad Nation Communities – Grad Nation Communities are on the front lines of helping young people succeed in school, work, and life. All communities can become Grad Nation Communities by working across sectors to pursue the Grad Nation goals, sharing best practices and providing annual updates on progress and challenges. Participating communities benefit significantly through support and a choice of services to help end the dropout crisis, including training and networking opportunities; connections to resources, tools and expertise; and possible funding opportunities.
Grad Nation Community Impact Fund – The Grad Nation Community Impact Fund will serve as a framework for corporate philanthropy focused on helping end the nation’s high school dropout crisis. It seeks to raise at least $50 million to directly seed community efforts to transform our nation’s lowest-performing schools and provide the needed support and services—the Five Promises—to the most vulnerable young people who attend those schools. The fund will provide seed grants to stimulate community engagement and investment to help transform these schools, their feeder schools, and the surrounding communities so they can reach Grad Nation goals.
Grad Nation Business Collaborative – The Grad Nation Business Collaborative is a series of regional roundtables designed to engage business leaders, educators and community leaders in driving cross-sector community action plans to address the dropout crisis locally, and nationally. These sessions orient participants to effective ways to engage with schools from pre-kindergarten through 12th grade, supply case studies of proven programs and highlight criteria businesses can use in deciding which efforts fit well with their interests.
Grad Nation Knowledge Center – The Grad Nation Knowledge Center is an online platform in development to connect evidence-based best practices with community wisdom by providing templates and technical assistance for strategic planning, goal-setting, action, and data reporting and analysis. With these tools, community members will be able to use the Knowledge Center to develop their collective visions, identify and implement successful and cost-effective solutions, and contribute to a network of peer communities, Grad Nation partners and researchers.
Grad Nation Leadership Collaborative Convening on College Readiness, Access and Completion – These gatherings being held in four major cities across the country in 2012 will gather best practices information from respected practitioners. Rather than having keynotes or extended presentations, the gatherings bring together professionals to discuss what works. Their exchanges will allow America’s Promise to collect successful methods for increasing college access and completion and help develop a concrete profile of the college-ready student.
ReadyNation – ReadyNation amplifies the voice of business leaders in support of early childhood policies that strengthen our economy and workforce. This business partnership, originally known as the Partnership for America’s Economic Success, transitioned to America’s Promise from the Pew Charitable Trusts and changed its name to Ready Nation in early 2012. It brings together business leaders committed to advancing evidence-based programs that children need to become “ready” to succeed.
Youth Impact Network – The Impact Network is the umbrella for America’s Promise youth-related opportunities. It enables young people to take action at both the local and national levels, such as identifying resource gaps in their communities and then proposing solutions to end the dropout crisis and improving outcomes for themselves and their peers.
To learn more about these programs, please visit America’s Promise Alliance website at www.americaspromise.org
Key Grad Nation Initiatives
APPENDIX J

Building a Grad Nation March 2012 91
Grad Nation Summit Conveners
Alliance for Excellent Education America’s Promise Alliance Civic Enterprises The Everyone Graduates Center at Johns Hopkins University
Civic Marshall Plan Leadership Council
Alliance for Excellent Education America’s Promise Alliance American Association of School Administrators American Federation of Teachers AT&T Big Brothers Big Sisters of America Boys & Girls Clubs of America City Year Civic Enterprises College Board Communities in Schools Corporation for Public Broadcasting Council of Chief State School Officers Data Quality Campaign Deloitte Everyone Graduates Center at Johns Hopkins University Forum for Youth Investment Bill and Melinda Gates Foundation George W. Bush Institute (Middle School Matters) Jobs for America’s Graduates Jobs for the Future National 4-H Council National Association of Secondary School Principals National Association of State Boards of Education National Conference of State Legislatures National Council of La Raza National Education Association National Governors Association National PTA National School Boards Association National Urban League Pearson Foundation Public Education Network Rural School and Community Trust State Farm United Way Worldwide Voices for National Service YMCA of the USA Youth Impact Network, America’s Promise Alliance
Civic Marshall Plan Leadership
APPENDIX K

92 Building a Grad Nation March 2012
Endnotes
1. “Diplomas Count 2010: Graduating by the Number: Putting Data to Work for Student Success.” Editorial Projects in Education. Special issue, Education Week 29, no. 34 (2010) in “Fact Sheet: High School Dropouts in America.” Alliance for Excellent Education. www.all4ed.org/files/HighSchoolDropouts.pdf Retrieved January 6, 2012.
2. “Trends in High School Dropout and Completion Rates.” National Center for Education Statistics. October 2011. http://nces.ed.gov/pubs2012/2012006.pdf Retrieved January 3, 2012.
3. Alliance for Excellent Education. Unpublished data. February 2012. Please also see Appendix E for additional information on the economic implications of graduation rate definitions, and the CMP state indices for information on your state. A sample CMP state index is available in Appendix F.
4. Alliance for Excellent Education, “The High Cost of High School Dropouts: What the Nation Pays for Inadequate High Schools.” www.all4ed.org/files/HighCost.pdf Retrieved February 16, 2012. Please also see Appendix E: Graduation Rate Definitions, History, and Economic Considerations for additional information.
5. H. Levin et al., “The Costs and Benefits of an Excellent Education for All of America’s Children” (New York, NY: Center for Benefit-Cost Studies of Education at Teachers College, Columbia University, 2007 in “The High Cost of High School Dropouts.” The Alliance for Excellent Education. www.all4ed.org/files/HighCost.pdf Retrieved February 13, 2012.
6. Levin, H., Belfield, C., Muennig, P., and Rouse, C., “The Costs and Benefits of an Excellent Education for All of America’s Children,” January 2007 in “The High Cost of High School Dropouts.” The Alliance for Excellent Education. www.all4ed.org/files/HighCost.pdf Retrieved February 13, 2012.
7. A. Carnevale, N. Smith, and J. Strohl, Help Wanted: Projections of Jobs and Education Requirements Through 2018 (Washington, DC: Georgetown University Center on Education and the Workforce, 2010).
8. The Employment Situation – JANUARY 2012.” The Bureau of Labor Statistics. www.bls.gov/news.release/pdf/empsit.pdf Retrieved February 13, 2012; Bridgeland, John M., et al. Across the Great Divide: Perspectives of CEOs and College Presidents on America’s Higher Education and Skills Gap. Civic Enterprises. March 2011. www.civicenterprises.net/reports/across_the_great_divide.pdf
9. This is the most recent data available based on the Averaged Freshman Graduation Rate from the U.S. Department of Education.
10. Aud, S. et. al. The Condition of Education 2011. U.S. Department of Education, National Center for Education Statistics. http://nces.ed.gov/pubsearch/pubsinfo.asp?pubid=2011033 Retrieved February 16, 2012.
11. “U.S. Secretary of Education Margaret Spellings Announces Guidance to Assist in Establishing Uniform High School Graduation Rate.” U.S. Department of Education. Press Release. December 23, 2008. www2.ed.gov/news/pressreleases/2008/12/12232008.html www2.ed.gov/news/pressreleases/2008/12/12232008.html Retrieved January 3, 2012.
12. All NAEP scores in this section are from The Nation’s Report Card, available at www.nationsreportcard.gov
13. “Data for Action 2010: DCQ’s State Analysis.” Data Quality Campaign. http://dataqualitycampaign.org/stateanalysis Retrieved February 6, 2012.
14. Duncan, Arne. “Making the Middle Grades Matter.” Secretary Arne Duncan’s Remarks at the National Forum’s Annual Schools to Watch Conference.
15. June 23, 2011 www.ed.gov/news/speeches/making-middle-grades-matter Retrieved January 10, 2012.
16. U.S. Department of Education’s National Center for Education Statistics, Dropout Prevention Services and Programs in Public Schools and Districts, 2010 to 2011. http://nces.ed.gov/pubs2011/2011037.pdf Retrieved February 8, 2012.
17. Deye, Sunny. National Conference of State Legislatures. Email and phone correspondence. December 2011 through February 16, 2012.
18. National Conference of State Legislatures. Task Force on Dropout Prevention and Recovery. www.ncsl.org/issues-research/educ/task-force-on-school-dropout-prevention-and-recove.aspx
19. Deye, Sunny. National Conference of State Legislatures. Email and phone correspondence. December 2011 through February 16, 2012.
20. “Completion Innovation Challenge.” Complete College America. www.completecollege.org/path_forward/innovation_challenge Retrieved January 14, 2012.
21. Aud, S. et. al. The Condition of Education 2011. U.S. Department of Education, National Center for Education Statistics. http://nces.ed.gov/pubsearch/pubsinfo.asp?pubid=2011033 Retrieved February 16, 2012; Bridgeland, J. et al. Across the Great Divide Perspectives of CEOs and College Presidents on America’s Higher Education and Skills Gap www.civicenterprises.net/reports/across_the_great_divide.pdf March 2011.
22. The White House Council for Community Solutions. www.serve.gov/council_home.asphttp://www.serve.gov/council_home.asp Retrieved February 6, 2012; Bridgeland, John & Milano, Jessica. “Opportunity Road: The Promise and Challenge of America’s Forgotten Youth.” Civic Enterprises. January 2012. www.civicenterprises.net/reports/opportunity_road.pdf Retrieved January 18, 2012; Belfield, Clive et al. “The Economic Value of Opportunity Youth.” January 2012. www.dol.gov/summerjobs/pdf/EconomicValue.pdf Retrieved February 6, 2012.
23. Bridgeland, John & Milano, Jessica. “Opportunity Road: The Promise and Challenge of America’s Forgotten Youth.” Civic Enterprises. January 2012. www.civicenterprises.net/reports/opportunity_road.pdf Retrieved January 18, 2012.
24. Bridgeland, John & Milano, Jessica. “Opportunity Road: The Promise and Challenge of America’s Forgotten Youth.” Civic Enterprises. January 2012. www.civicenterprises.net/reports/opportunity_road.pdf Retrieved January 18, 2012.
25. These policies recommendations are reflective of the work in the 2012 Civic Enterprises Report, Opportunity Road. For more information, including more detailed recommendations, please visit www.civicenterprises.net/reports/opportunity_road.pdf
26. “2011-2015 Strategic Plan.” Corporation for National and Community Service. www.nationalservice.gov/about/focus_areas/index.asp Retrieved February 6, 2012.
27. “The Federal Role in Education.” The U.S. Department of Education. www2.ed.gov/about/overview/fed/role.html Retrieved February 3, 2012.
28. Bernanke, B. (2008 June 4), Speech at Harvard University, Cambridge, Massachusetts.
29. “Diplomas Count 2010: Graduating by the Number: Putting Data to Work for Student Success.” Editorial Projects in Education. Special issue, Education Week 29, no. 34 (2010) in “Fact Sheet: High School Dropouts in America.” Alliance for Excellent Education. www.all4ed.org/files/HighSchoolDropouts.pdf Retrieved January 6, 2012.

Building a Grad Nation March 2012 93
30. “Trends in High School Dropout and Completion Rates.” National Center for Education Statistics. October 2011. http://nces.ed.gov/pubs2012/2012006.pdf Retrieved January 3, 2012.
31. “The Employment Situation - January 2012.” The Bureau of Labor Statistics. http://www.bls.gov/news.release/pdf/empsit.pdf Retrieved February 13, 2012; Bridgeland, John M., et al. Across the Great Divide: Perspectives of CEOs and College Presidents on America’s Higher Education and Skills Gap. Civic Enterprises. March 2011. www.civicenterprises.net/reports/across_the_great_divide.pdf
32. Tavernise, Sabrina. “Education Gap Grows Between Rich and Poor, Studies Say.” The New York Times. February 9, 2012. www.nytimes.com/2012/02/10/education/education-gap-grows-between-rich-and-poor-studies-show.html?hp Retrieved February 13, 2012.
33. Snyder, T. and S. A. Dillow, Digest of Education Statistics 2010 (2011-015), (Washington, DC: U.S. Department of Education, National Center for Education Statistics, Institute of Education Sciences, 2011) from The Alliance for Excellent Education’s “The High Cost of High School Dropouts: What the Nation Pays for Inadequate High Schools” Issue Brief (November 2011) www.all4ed.org/files/archive/publications/HighCost.pdf Retrieved February 2, 2012; Doland, E. (2001). Give Yourself the Gift of a Degree. Washington, DC: Employment Policy Foundation Alliance for Excellent Education. Unpublished data. February 2012. Economists have reported ranges of lost lifetime earnings based on varying economic assumption, including $121,000 to $294,000 in lost lifetime earnings reported in Cecilia Rouse’s 2005 paper The Labor Market Consequences of an Inadequate Education, available at http://devweb.tc.columbia.edu/manager/symposium/Files/77_Rouse_paper.pdf
34. “High School Dropouts in America Factsheet,” Alliance for Excellent Education. Updated September 2012. www.all4ed.org/files/GraduationRates_FactSheet.pdf Retrieved February 16, 2012.
35. Jantti, M. et al. American Exceptionalism in a New Light: A Comparison of Intergenerational Earnings and Mobility in the Nordic Countries, the United Kingdom, and the United States. Discussion Paper. January 2006. Retrieved February 28, 2012. http://ftp.iza.org/dp1938.pdf
36. Carnevale, Anthony. In Help Wanted: Projections of Jobs and Education Requirements Through 2018. Georgetown University Center on Education and the Workforce. http://cew.georgetown.edu/jobs2018 Retrieved February 2, 2012.
37. Barnes, Melody. “Education is Key to Winning the Future.” The Huffington Post. March 21, 2011. www.huffingtonpost.com/melody-barnes/education-is-key-to-winni_1_b_837958.html Retrieved January 15, 2012.
38. Alliance for Excellent Education. Unpublished data. February 2012.
39. 2010 National Education Clearinghouse, The Cleveland Foundation.
40. “The Higher Education Attainment Problem.” The Higher Education Compact of Greater Cleveland. http://highereducationcompact.org Retrieved February 13, 2012.
41. Merisotis, Jamie. “Ohio Must Aim to Increase the Rate of College Completion.” The Plain Dealer. Saturday, January 07, 2012. www.cleveland.com/opinion/index.ssf/2012/01/ohio_must_aim_to_increase_the.html Retrieved January 14, 2011.
42. Struble, Wayne. The Office of the Governor of Ohio. Email and phone correspondence. 2011.
43. Merisotis, Jamie. “Ohio Must Aim to Increase the Rate of College Completion.” The Plain Dealer. Saturday, January 07, 2012. www.cleveland.com/opinion/index.ssf/2012/01/ohio_must_aim_to_increase_the.html Retrieved January 14, 2011.
44. Bridgeland, John, Milano, J. Across the Great Divide: Perspectives of CEOs and College Presidents on America’s Higher Education and Skills Gap. Civic Enterprises. March 2011. www.civicenterprises.net/reports/across_the_great_divide.pdf
45. O’Donnell, Patrick. “Civic partnership, Higher Education Compact of Greater Cleveland, aims to boost college graduation rates.” The Plain Dealer. October 06, 2011 http://blog.cleveland.com/metro/2011/10/boosting_college_graduation_of.html Retrieved January 14, 2011.
46. O’Donnell, Patrick. “Civic Partnership, Higher Education Compact of Greater Cleveland, Aims to Boost College Graduation Rates.” The Plain Dealer. October 06, 2011 http://blog.cleveland.com/metro/2011/10/boosting_college_graduation_of.html Retrieved January 14, 2011.
47. Aud, S. et. al. The Condition of Education 2011. U.S. Department of Education, National Center for Education Statistics. http://nces.ed.gov/pubsearch/pubsinfo.asp?pubid=2011033 Retrieved February 16, 2012.
48. “U.S. Secretary of Education Margaret Spellings Announces Guidance to Assist in Establishing Uniform High School Graduation Rate.” U.S. Department of Education. Press Release December 23, 2008. http://www2.ed.gov/news/pressreleases/2008/12/12232008.html Retrieved January 3, 2012.
49. The State of Maryland graduation rate data uses Leaver rates, which show the 2000 graduation rate for WCPS and Maryland were 78% and 82%, respectively. By 2010, the WCPS graduation rate was 92% (“Leaver Graduation Rate Trends,” Washington County Public Schools, Email correspondence, 16 January 2012). According to Cumulative Promotion Index (CPI) method of calculating graduation rates used by the Editorial Projects in Education (EPE) Research Center, the 2000 WCPS and Maryland rates were 72.8% and 72.7%, respectively. In 2008, the WCPS graduation rate was 87.1% and Maryland’s rate was 76.8% (EPE Research Center Maps at www.edweek.org/apps/gmap/).
50. Kids Count Data Center. Washington County, Maryland Kids Count Indicators. Annie E. Casey Foundation. http://datacenter.kidscount.org/data/bystate/stateprofile.aspx?state=MD&group=Grantee&loc=3321&dt=1%2c3%2c2%2c4 Retrieved January 16, 2012.
51. Heinemann’s LLI Data Collection Project. 2009/2010 Report - Washington County Public Schools in Hagerstown, Maryland. www.heinemann.com/fountasandpinnell/research/LLIreports2009_2010/Heinemann%20LLI%20Report%202009-2010%20-%20Washington%20County%20MD.pdf Retrieved January 16, 2012.
52. “Free and Reduced Meals Eligibility By School For Compensatory Education Funding.” Washington County Public Schools Food and Nutrition Services. Email correspondence. January 29, 2012.
53. Washington County Public Schools. Email and phone correspondence. December 2011 and January 2012.
54. Maryland Report Card 2011. “Washington County Public Schools.” Maryland State Department of Education. www.mdreportcard.org Retrieved January 16, 2012.
55. 2009-2010 is the latest year for which AFGR has been reported by the National Center for Education Statistics, U.S. Department of Education.
56. Education Commission of the States. “Compulsory School Age Requirements.” Updated June 2010. Denver, Colo. Retrieved February 2012, www.ecs.org
57. Deye, Sunny. National Conference of State Legislatures. Email and phone correspondence. December 2011 through February 16, 2012.

94 Building a Grad Nation March 2012
Endnotes (continued)
58. “Data for Action 2011,” Data Quality State Analysis, Data Quality Campaign, Washington, D.C. Retrieved February 2012, www.dataqualitycampaign.org/stateanalysis
59. Rates are the Average Freshman Graduation Rate, U.S. Department of Education, until the Average Cohort Graduation Rate method is uniformly in place in 2012-2013.
60. Promoting Power is the ratio of 12th graders to 9th graders three years earlier. Please see Appendix E for additional information.
61. Definition of the Georgia “lever” formula is found at www.doe.k12.ga.us
62. Georgia College for All: Expand Your Opportunities. www.gacollege411.org
63. Recent-year and likely 2012 budget cuts reduced recipients from an all-time high of 256,000 and may continue.
64. Representatives from the Governor’s Office, the Student Finance Commission, the Professional Standards Commission, and the Governor’s Office of Student Achievement joined with commissioners of the Department of Early Care and Learning, the Technical College System, the University System, and the elected superintendent of the Department of Education; Alliance of Education Agency Heads or AEAH, 2005. www.gaeducationalliance.org
65. Deputy State Superintendent for Policy, Personal Communication. February 2012.
66. Hernandez, Donald. “Double Jeopardy: How Third-Grade Reading Skills and Poverty Influence High School Graduation.” The Annie E. Casey Foundation. April 2011. Retrieved from: www.gradelevelreading.net/wordpress/wp-content/uploads/2010/10/DoubleJeopardyReport040511FINAL.pdf
67. All NAEP scores in this section are from The Nation’s Report Card, available at www.nationsreportcard.gov
68. The Campaign for Grade Level Reading. www.gradelevelreading.net Retrieved February 8, 2012.
69. Bruce, Mary et al. On Track for Success: The Use of Early Warning Indicator and Intervention Systems to Build a Grad Nation. Civic Enterprises. November 2011. www.civicenterprises.net/reports/on_track_for_success.pdf
70. “About Us.” Get Schooled Foundation. http://getschooled.com/about Retrieved February 16, 2012.
71. Hanushek, Eric. The Difference is Teacher Quality,” in Karl Weber (ed.), Waiting for “Superman”: How We Can Save America’s Failing Public Schools. New York: Public Affairs, 2010, pp. 81-100; Hanushek, Eric. “The Quality and Distribution of Teachers under the No Child Left Behind Act” (with Steven G. Rivkin), Journal of Economic Perspectives 24(3), Summer 2010, pp. 133-150. “An Effective Teacher in Every Classroom: A lofty goal, but how to do it?” (with Kati Haycock), Education Next 10(3), Summer 2010, pp. 46-52.
72. Bridgeland, et al. The Silent Epidemic: The Perspectives of High School Dropouts. March 2006. www.civicenterprises.net/reports/the_silent_epidemic.pdf Retrieved on January 5, 2012.
73. “Focusing on Teacher Growth and Improvement.” Rhode Island Federation of Teachers and Health Professionals. www.aft.org/pdfs/about/IF_rhodeisland.pdf Accessed February 2, 2012; “Breaking New Ground on Teacher Evaluation.” New York State United Teachers. www.aft.org/pdfs/about/IF_newyork.pdf Retrieved February 16, 2012.
74. Tennessee ESES Flexibility Request. November 14, 2011. www.tn.gov/education/doc/ESEA_Flexibility_Request.pdf Retrieved January 5, 2012; Kentucky Prichard Committee. www.prichardcommittee.org Retrieved January 5, 2012.
75. Partanten, Anu. “What Americans Keep Ignoring About Finland’s School Success.” The Atlantic. December 29, 2011. www.theatlantic.com/national/archive/2011/12/what-americans-keep-ignoring-about-finlands-school-success/250564/ Retrieved January 5, 2012.
76. Bruce, Mary et al. On Track for Success: The Use of Early Warning Indicator and Intervention Systems to Build a Grad Nation. Civic Enterprises. November 2011. www.civicenterprises.net/reports/on_track_for_success.pdf
77. Bruce, Mary et al. On Track for Success: The Use of Early Warning Indicator and Intervention Systems to Build a Grad Nation. Civic Enterprises. November 2011. www.civicenterprises.net/reports/on_track_for_success.pdf
78. “Supporting Early Warning Systems.” Hot Topic. Data for Action 2011. Data Quality Campaign. http://dataqualitycampaign.org/files/Hot%20Topic_Early%20Warning.pdf Retrieved January 16, 2012.
79. “Data for Action 2010: DCQ’s State Analysis.” Data Quality Campaign. http://dataqualitycampaign.org/stateanalysis Retrieved February 6, 2012.
80. Mesco, Cindy. Big Brothers Big Sisters. Email correspondence. January 16, 2012; Bruce, Mary, et al. On Track for Success: The Use of Early Warning Indicator and Intervention Systems to Build a Grad Nation. Civic Enterprises. November 2011.
81. Fiscal Year 2012 Budget Request. The Corporation for National and Community Service. (2011) Fiscal Year 2012 Budget Justification. www.nationalservice.gov/about/budget/index.asp Retrieved February 6, 2012.
82. “2011-2015 Strategic Plan.” Corporation for National and Community Service. (2011) 2011-2015 Strategic Plan. www.nationalservice.gov/about/focus_areas/index.asp Retrieved February 6, 2012.
83. Duncan, Arne. “Making the Middle Grades Matter.” Secretary Arne Duncan’s Remarks at the National Forum’s Annual Schools to Watch Conference. June 23, 2011 www.ed.gov/news/speeches/making-middle-grades-matter Retrieved February 16, 2012.
84. Vegas PBS. Phone and email correspondence. January 2012.
85. Vegas PBS. Presentation on CCSD. January 2012.
86. “It’s Not to Late to Graduate.” News. Clark County Schools. January 31, 2012. http://ccsd.net/district/news/students/2012/jan/31/its-not-too-late-to-graduate-staff-and-volunteers-reclaim-futures-one-student-at-a-time Retrieved February 16, 2012
87. American Graduate. “CPB Combats the High School Dropout Crisis.” www.cpb.org/americangraduate Retrieved January 14, 2012.
88. “The Corporation for Public Broadcasting Introduces Initiative to Combat the Dropout Crisis.” Press Release May 3, 2011. CPB Media Room. www.cpb.org/pressroom/release.php?prn=882 Retrieved January 14, 2012.
89. For additional research on the impact of mentoring on children’s lives, please see the work of DuBois (www.ihrp.uic.edu/researcher/david-dubois-phd); Karcher (http://education.utsa.edu/counseling/profile/mkarcher); Keller (http://pdx.edu/profile/mentor-center); Rhodes (www.rhodeslab.org/lab/index.html); and Spencer (www.bu.edu/ssw/about/facultystaff/faculty/spencer/).
90. “Closing the Mentoring Gap.” MENTOR: The National Mentoring Partnership. www.mentoring.org/about_mentor/value_of_mentoring/closing_the_mentoring_gap Retrieved February 3, 2012.
91. Big Brothers Big Sisters of America and United Way. Email, telephone, and in-person correspondence. December 2011 – January 2012; Big Brothers Big Sisters of America and United Way. “Partnership Message.” November 3, 2011.

Building a Grad Nation March 2012 95
92. The U.S. Department of Education’s preferred graduation rate calculation through 2010.
93. Characteristics of the 100 Largest Public Elementary and Secondary School districts in the United States 2008-09, national Center for Education Statistics, Washington, D.C., November 2010. http://nces.ed.gov/pubs2010/100largest0809/index.asp
94. http://education.usnews.rankingsandreviews.com/best-high-schools
95. “Communities In Schools National Evaluation Five Year Executive Summary,” ICF International, Fairfax, VA., October 2010 www.communitiesinschools.org/about/publications/publication/five-year-national-evaluation-summary-report
96. Balfanz, R. Herzog, L. & D. J. Mac Iver (2007). Preventing Student Disengagement and Keeping Students on the Graduation Path in Urban Middle-Grades Schools: Early Identification and Effective Interventions. Educational Psychologist, 42(4): 223-235.
97. Breaking Ranks. National Association of Secondary School Principals. www.nassp.org/school-improvement/breaking-ranks-publications
98. U.S. Department of Education’s National Center for Education Statistics, Dropout Prevention Services and Programs in Public Schools and Districts, 2010 to 2011. http://nces.ed.gov/pubs2011/2011037.pdf Retrieved February 8, 2012.
99. Hurlburt, Steven et al. “Baseline Analyses of SIG Applications and SIG-Eligible and SIG-Awarded Schools.” American Institutes for Research. www.air.org/focus-area/education/index.cfm?fa=viewContent&content_id=1282&id=110 Retrieved February 16, 2012. For FY10, out of 1228 total SIG awarded schools, 32.2 percent were elementary, 22.1 percent were Middle, 40.4 percent were High, and 5.2 percent were non-standard.
100. “85/10 Commonalities Report – Successful High Schools’ Graduation Rates Sustained Over Time” April, 2010. www.gpee.org Retrieved October, 2011.
101. Using the Georgia Department of Education calculation methods. With the switch to Adjusted Cohort Graduation Rate, rates will likely drop but the trends remain.
102. Common Core State Standards Initiative. (n.d.). In the States. www.corestandards.org/in-the-states Retrieved February 14, 2012.
103. For Dothan High School, from 71 percent to 86 percent, for Northview High School, from 79 percent to 90 percent, using the Alabama AYP calculation method rather than the four-year cohort graduation calculation.
104. Performance Comparisons for Dothan City Schools, Public Affairs Research Council of Alabama, September 19, 2011, available on web site as 2011 PARCA Report, www.dothan.k12.al.us The best comparisons of results plus expenditures, are found in a PowerPoint on the same site, as 2010 PARCA report, Dothan Schools Performance Comparison 2010, September 27, 2010, with an embedded reference to [email protected]
105. Bridgeland, John M. and Mary Bruce. 2011 National Survey of School Counselors: Counseling at a Crossroads. Civic Enterprises. November 2011. www.civicenterprises.net/reports/counseling_at_a_crossroads.pdf Retrieved February 3, 2012.
106. United States Department of Labor. 2011. “Education Administrators.” Bureau of Labor Statistics Occupational Outlook Handbook, 2010–2011. www.bls.gov/oco/ocos007.htm Retrieved January 3, 2012; United States Department of Labor. 2011. “Counselors.” Bureau of Labor Statistics Occupational
Outlook Handbook, 2010–2011. www.bls.gov/oco/ocos067.htm Retrieved January 3, 2012. www.civicenterprises.net/reports/counseling_at_a_crossroads.pdf Retrieved February 16, 2012.
107. Bridgeland, John M. and Mary Bruce. 2011 National Survey of School Counselors: Counseling at a Crossroads. Civic Enterprises. November 2011. www.civicenterprises.net/reports/counseling_at_a_crossroads.pdf Retrieved February 16, 2012.
108. Bush, Melody. ECS State Notes: “Attendance.” Compulsory School Age Attendance. Last Updated June 2010. www.ecs.org/clearinghouse/86/62/8662.pdf Retrieved January 14, 2012.
109. In the aftermath of the Civil War, high school education was unneeded: only two percent of the U.S. 17-year old population graduated from public and private high schools. Thirty years later, at the turn of the century, though high school participation had increased it was still low, with only six percent of 17 year olds having graduated. But then the tide changed. By 1920, nearly a third of 17 year olds had completed high school, and by 1940 the figure was 50 percent. The all-time high of 76.9 percent was reached in 1970, followed by two decades of stagnation and decline to a modern low of 67.5 (1997-1998). From “High School Graduates, by Sex and Control of School: Selected years, 1869-70 through 2019-20.” Digest of Education Statistics 2010, Table 110. www.nces.ed.gov/programs/digest/d10/tables/dt10_110.asp Retrieved January 7, 2012.
110. Bridgeland, et al. The Silent Epidemic: The Perspectives of High School Dropouts. March 2006. Transcripts: Baltimore, Maryland. www.civicenterprises.net/reports/the_silent_epidemic.pdf Retrieved on January 5, 2012.
111. Agostino, Becky & Reese, Alex. “Does Raising the Compulsory School Attendance Age Increase Graduation Rates?” Duke University. November 2010. Retrieved from: http://ncpeo.org/wp-content/uploads/2011/02/Impact-of-Raising-the-Age-of-Compulsory-School-Attendance_BA-AR.pdf Retrieved February 16, 2012.
112. Princiotta, Daniel and Ryan Reyna. “Achieving Graduation for All: A Governors Guide to Dropout Prevention and Recovery.” The NGA Center for Best Practices. 2009. www.nga.org/files/live/sites/NGA/files/pdf/0910ACHIEVINGGRADUATION.PDF Retrieved February 10, 2012.
113. Deye, Sunny. National Conference of State Legislatures. Email and phone correspondence. December 2011 – February 16, 2012.
114. Tennessee Department of Safety and Homeland Security. “Minor/Teenage Affidavit & Proof of School Attendance.” www.tn.gov/safety/driverlicense/minor.shtml Retrieved January 9, 2012.
115. Herrmann, Mike and Nicole Cobb. Tennessee Department of Education. Email and phone correspondence. February 2012.
116. HB1185/SB0882. Tennessee General Assembly. http://wapp.capitol.tn.gov/apps/Billinfo/default.aspx?BillNumber=HB1185&ga=107 Retrieved February 13, 2012
117. Aud, S. et. al. The Condition of Education 2011. U.S. Department of Education, National Center for Education Statistics. http://nces.ed.gov/pubsearch/pubsinfo.asp?pubid=2011033 Retrieved February 16, 2012.
118. Cox, Erin. Email and Phone Correspondence. ACCESS. January, 2012.
119. “Promoting Economic Mobility by Increasing Postsecondary Education.” Economic Mobility Project, An Initiative of the Pew Charitable Trusts, 2009.
120. National Postsecondary Student Aid Study; http://nces.ed.gov/surveys/npsas/ Retrieved January 14, 2012.

96 Building a Grad Nation March 2012
121. “Reclaiming the American Dream,” Bridgespan Group, 2006. www.bridgespan.org/kno_articles_americandream.html Retrieved January 14, 2012.
122. “Reclaiming the American Dream,” Bridgespan Group, 2006. www.bridgespan.org/kno_articles_americandream.html Retrieved January 14, 2012; Wyner, Joshua S. et al, The Achievement Trap: How America is Failing Millions of High-achieving Students from Lower-income Families. Jack Kent Cooke Foundation and Civic Enterprises. www.civicenterprises.net/reports/achievement_trap.pdf
123. “About.” ACCESS. www.accessboston.org/about/overview Retrieved January 14, 2012.
124. “Completion Innovation Challenge.” Complete College America. www.completecollege.org/path_forward/innovation_challenge/ Retrieved January 14, 2012.
125. “State Capitals Campaign 2011.” The College Board. http://completionagenda.collegeboard.org/state-capitals-campaign Retrieved February 13, 2012.
126. Bridgeland, John & Milano, Jessica. “Opportunity Road: The Promise and Challenge of America’s Forgotten Youth.” Civic Enterprises. January 2012. www.civicenterprises.net/reports/opportunity_road.pdf Retrieved January 18, 2012.
127. Belfield, Clive et al. “The Economic Value of Opportunity Youth.” January 2012. www.dol.gov/summerjobs/pdf/EconomicValue.pdf Retrieved February 6, 2012.
128. Belfield, Clive et al. “The Economic Value of Opportunity Youth.” January 2012. www.dol.gov/summerjobs/pdf/EconomicValue.pdf Retrieved February 6, 2012.
129. “Help Wanted: Projections of Jobs and Education Requirements Through 2018.” The Georgetown University Center on Education and the Workforce (2010).
130. Aud, S. et. al. The Condition of Education 2011. U.S. Department of Education, National Center for Education Statistics. http://nces.ed.gov/pubsearch/pubsinfo.asp?pubid=2011033 Retrieved February 16, 2012.
131. Arnold, Chris. “To Fill Job Skills, Firm Brings Training In House” November 1, 2010. www.npr.org/2010/11/16/131362831/boston-factory-takes-training-into-its-own-hands Retrieved January 10, 2012.
132. Huhman, Heather. “New Survey Highlights Skills Gap in Labor Market.” On Careers. U.S. News and World Report. November 4, 2011. http://money.usnews.com/money/blogs/outside-voices-careers/2011/11/04/new-survey-highlights-skills-gap-in-labor-market Retrieved February 14, 2012; Chief Learning Officer, CLO Talent Strategy. www.nxtbook.com/nxtbooks/mediatec/clo0112/index.php Retrieved February 16, 2012.
133. Evans-Brown, Sam. “Guest Workers Help to Fill the Skills Gap in NH”. NHPR.Org. November 15, 2011. www.nhpr.org/post/guest-workers-help-fill-skills-gap-nh Retrieved February 16, 2012.
134. Hazard, John. “Tech CEOs Visit Capital to Lobby for Tax Reform, H-1B Visas.” ZDNet. May 10, 2011. www.zdnet.com/blog/btl/tech-ceos-visit-capital-to-lobby-for-tax-reform-h-1b-visas/45924 Retrieved February 16, 2012.
135. Arnold, Chris. “To Fill Job Skills, Firm Brings Training In House.” November 1, 2010. www.npr.org/2010/11/16/131362831/boston-factory-takes-training-into-its-own-hands Retrieved February 16, 2012.
136. Boston College Center for Corporate Citizenship, State of Corporate Citizenship (2005).
137. “Opportunities in the Workforce Readiness Pipeline: A Community Engagement Toolkit for Business.” Corporate Voices and Ready by 21. 2011. www.corporatevoices.org
138. Bridgeland, et al. “On Track for Success: The Use of Early Warning Indicator and Intervention Systems.” Civic Enterprises and the Everyone Graduates Center. November 2011. Retrieved from: www.civicenterprises.net/reports.html
139. “Strategic Private-sector Investments in STEM Education.” The Seattle Times. November 4, 2011. http://seattletimes.nwsource.com/html/editorials/2014538719_edit21stem.html Retrieved February 16, 2012.
140. These policy recommendations are reflective of the work in the 2012 Civic Enterprises Report, Opportunity Road. For more information, including more detailed recommendations, please visit www.civicenterprises.net/reports/opportunity_road.pdf
141. “The Federal Role in Education.” The U.S. Department of Education. http://www2.ed.gov/about/overview/fed/role.html Retrieved February 3, 2012.
142. The document is based on many sources, including “Graduation Rate Policy Frequently Asked Questions” from the Alliance for Excellent Education” available at www.all4ed.org; the National Center for Education Statistics U.S. Department of Education, National Center for Education Statistics. (2011). The Condition of Education 2011 (NCES 2011-033), available at http://nces.ed.gov and conversations with researchers at the Alliance or Excellent Education, the Everyone Graduates Center at Johns Hopkins University and Civic Enterprises.
143. Seastrom et al. 2006a, 2006b. For additional information, see the National Center for Education Statistics “User’s Guide to Computing High School Graduation Rates, Volume 1: Review of Current and Proposed Graduation Indicators.” http://nces.ed.gov/pubsearch/pubsinfo.asp?pubid=2006604 Retrieved February 16, 2012.
144. “A Uniform, Comparable Graduation Rate.” U.S. Department of Education. http://www2.ed.gov/policy/elsec/reg/proposal/uniform-grad-rate.html Retrieved January 3, 2012.
145. “Trends in High School Dropout and Completion Rates in the United States: 1972–2009 Compendium Report.” Institute of Education Sciences. The U.S. Department of Education. http://nces.ed.gov/pubs2012/2012006.pdf Retrieved February 8, 2012.
Endnotes (continued)

About Civic Enterprises Civic Enterprises is a public policy firm that helps corporations, nonprofits, foundations, universities and governments develop and spearhead innovative public policies to strengthen our communities and country. Created to enlist the private, public and nonprofit sectors to help address our Nation’s toughest problems, Civic Enterprises fashions new initiatives and strategies that achieve measurable results in the fields of education, civic engagement, economic mobility, and many other domestic policy issues. For information about Civic Enterprises, please visit www.civicenterprises.net
About The Everyone Graduates CenterThe Everyone Graduates Center at Johns Hopkins University seeks to identify the barriers that stand in the way of all students graduating from high school prepared for adult success, to develop strategic solutions to overcome the barriers, and to build local capacity to implement and sustain them. For more information, please visit www.every1graduates.org
About America’s Promise Alliance America’s Promise Alliance is the nation’s largest partnership organization dedicated to improving the lives of children and youth. We bring together more than 400 national organizations representing nonprofit groups, businesses, communities, educators and policymakers. Through our Grad Nation campaign, we mobilize Americans to end the high school dropout crisis and prepare young people for college and the 21st century workforce. Building on the legacy of our Founding Chairman General Colin Powell, America’s Promise believes the success of young people is grounded in Five Promises: caring adults; safe places; a healthy start; an effective education; and opportunities to help others. For more information, visit www.americaspromise.org
About The Alliance for Excellent Education The Alliance for Excellent Education is a Washington, DC-based national policy and advocacy organization that works to improve national and federal policy so that all students can achieve at high academic levels and graduate from high school ready for success in college, work, and citizenship in the twenty-first century. For more information about the Alliance for Excellent Education, please visit www.all4ed.org
The views reflected in this document are those of the authors and do not necessarily reflect the views of AT&T and the Pearson Foundation.