Embed Size (px)
Citation preview

Volume I
Building a Foundation to Achieve Global Competitiveness
San Diego Regional Economic Prosperity Strategy

ii REPS Volume 1 - Executive Summary
THE SANDAG BOARD OF DIRECTORSThe 18 cities and county government are SANDAG serving as the forum for regional decision-making. SANDAG builds consensus; plans, engineers, and
builds public transit; makes strategic plans; obtains and allocates resources; and provides information on a broad range of topics pertinent to the region’s
quality of life.
Chair
Hon. Mary Teresa Sessom
First Vice Chair
Hon. Lori Holt Pfeiler
Second Vice Chair
Hon. Jerome Stocks
Executive Director
Gary L. Gallegos
City of Carlsbad
Hon. Matt Hall, Councilmember
(A) Hon. Bud Lewis, Mayor
(A) Hon. Ann Kulchin, Mayor Pro Tem
City of Chula Vista
Hon. Cheryl Cox, Mayor
(A) Hon. Jerry Rindone, Deputy Mayor
(A) Hon. John McCann, Councilmember
City of Coronado
Hon. Phil Monroe, Councilmember
(A) Hon. Carrie Downey, Mayor Pro Tem
(A) Hon. Al Ovrom, Councilmember
City of Del Mar
Hon. Crystal Crawford, Deputy Mayor
(A) Hon. David Druker, Mayor
(A) Hon. Richard Earnest, Councilmember
City of El Cajon
Hon. Mark Lewis, Mayor
(A) Hon. Jillian Hanson-Cox, Councilmember
City of Encinitas
Hon. Jerome Stocks, Mayor
(A) Hon. Teresa Barth, Councilmember
City of Escondido
Hon. Lori Holt Pfeiler, Mayor
(A) Hon. Ed Gallo, Councilmember
(A) Hon. Sam Abed, Mayor Pro Tem
City of Imperial Beach
Hon. Jim Janney, Mayor
(A) Hon. Patricia McCoy, Mayor Pro Tem
(A) Hon. Mayda Winter, Councilmember
City of La Mesa
Hon. Art Madrid, Mayor
(A) Hon. David Allan, Councilmember
(A) Hon. Mark Arapostathis, Councilmember
City of Lemon Grove
Hon. Mary Teresa Sessom, Mayor
(A) Hon. Jerry Jones, Councilmember
(A) Hon. Jerry Selby, Councilmember
City of National City
Hon. Ron Morrison, Mayor
(A) Hon. Frank Parra, Vice Mayor
(A) Hon. Louie Natividad, Councilmember
City of Oceanside
Hon. Jim Wood, Mayor
(A) Hon. Jerry Kern, Councilmember
(A) Hon. Jack Feller, Councilmember
City of Poway
Hon. Mickey Cafagna, Mayor
(A) Hon. Robert Emery, Deputy Mayor
(A) Hon. Don Higginson, Councilmember
City of San Diego
Hon. Jerry Sanders, Mayor
Hon. Jim Madaffer, Councilmember
(A) Hon. Anthony Young, Council President
Pro Tem
(A) Hon. Scott Peters, Council President
City of San Marcos
Hon. Jim Desmond, Mayor
(A) Hon. Hal Martin, Vice Mayor
(A) Hon. Rebecca Jones, Councilmember
City of Santee
Hon. Jack Dale, Councilmember
(A) Hon. Hal Ryan, Councilmember
(A) Hon. John Minto, Councilmember
City of Solana Beach
Hon. Lesa Heebner, Councilmember
(A) Hon. Dave Roberts, Deputy Mayor
(A) Hon. Mike Nichols, Councilmember
City of Vista
Hon. Judy Ritter, Councilmember
(A) Hon. Bob Campbell, Councilmember
(A) Hon. Steve Gronke, Councilmember
County of San Diego
Hon. Greg Cox, Chairman
Hon. Dianne Jacob, Vice Chairwoman
(A) Hon. Pam Slater-Price, Chair Pro Tem
(A) Hon. Bill Horn, Supervisor
ADVISORY MEMBERS
Imperial County
Hon. Victor Carrillo, Chairman
(A) Hon. David Ouzan, Councilmember
California Department of Transportation
Will Kempton, Director
(A) Pedro Orso-Delgado, District 11 Director
Metropolitan Transportation System
Harry Mathis, Chairman
(A) Hon. Jerry Rindone, Vice Chairman
(A) Hon. Robert Emery, Board Member
North County Transit District
Hon. Ed Gallo, Chairman
(A) Hon. Jerome Stocks,
Planning Committee Chair
(A) Hon. Chris Orlando,
Monitoring Committee Chair
U.S. Department of Defense
CAPT Steve Wirsching, USN, CEC,
Southwest Division Naval Facilities Engineering
Command
(A) CAPT Robert Farley, USN, CEC
Southwest Division Naval Facilities Engineering
Command
San Diego Unified Port District
Laurie Black, Commissioner
(A) Michael Najera, Commissioner
San Diego County Water Authority
Marilyn Dailey, Commissioner
(A) Mark Muir, Commissioner
(A) Gary Croucher, Commissioner
Southern California Tribal
Chairmen’s Association
Chairman Robert Smith (Pala), SCTCA Chair
(A) Chairman Allen Lawson (San Pasqual)
Mexico
Hon. Remedios Gómez-Arnau
Cónsul General of Mexico
As of March 11, 2008
iiiREPS Volume 1 - Executive Summary
ABSTRACT
TITLE: Building a Foundation to Achieve Global Competitiveness: San Diego Regional Economic Prosperity Strategy
AUTHOR: San Diego Association of Governments
DATE: March 2008
SOURCE OF COPIES: San Diego Association of Governments
401 B Street, Suite 800
San Diego, CA 92101
(619) 699-1900
www.sandag.org
NUMBER OF PAGES: 107

iv REPS Volume 1 - Executive Summary
Achieving economic prosperity is one of the major
challenges and should be one of the highest priorities for
public and private sector leaders in the San Diego region
today. This is a different challenge than our region faced
during the 1990s when we experienced our worst recession
in more than half a century as our economy restructured
and diversified itself.
To identify and analyze our region’s most pressing challenges,
the Advisory Group overseeing the update of the Prosperity Strategy employed a strategic assessment system. The
assessment system provides a framework for evaluating
the region’s economic health by benchmarking ourselves
against 24 similar regions, as well as broader statewide
and national trends. By benchmarking ourselves we have
a way of measuring progress, or lack of progress, to solve
recognized problems based on the principle of “what gets
measured gets done.”
Our research shows that certain measures of our economic
prosperity are not keeping pace with our major competitors
or with trends nationwide. In addition, our research points
out that the region is not adequately equipped or prepared
to compete in an increasingly global market place. As we did
during the 1990s, we must respond to current challenges,
such as the slow growth in our standard of living, aging
infrastructure and capacity constraints, and our region’s
ability to continue to participate in an increasingly global
marketplace. On the latter point, it is clear that our region
competes against other regions worldwide, and whether we
succeed or fail will largely depend on our public investments
and policy priorities regarding human and physical
infrastructure, interregional cooperation, and the ability of
the nation and our region to engage in free trade.
MESSAGE FROM THE
CO‑CHAIRS AND ADVISORY GROUP
One traditional metric used to assess economic prosperity is
standard of living, measured by “real” per capita income. The rate
at which our standard of living is growing has been outpaced by
growth at the national level by nearly two to one. At the current
rate, in order for the nation to double its standard of living it would
take 35 years, about a generation. At our current rate of growth,
it will take the San Diego region twice as long, or 70 years,
to achieve the same doubling in its standard of living, about
two generations. If we continue on this path of slow economic
growth, the region’s future standard of living is at risk.
In response to these and similar challenges, our Advisory Group
learned that regions like San Diego are seeking strategies they
can use to make their communities more competitive and to attract
and retain technology-based enterprises. Here San Diego has an
impressive track record and a leg up on some of the competition;
now with more than 3,000 technology–producing companies,
San Diego has transformed itself within two decades into one of
the most innovative regions in the U.S. Once known mostly for our
defense-related businesses, military establishments, and vibrant
visitor attractions, the San Diego region now hosts a diversified
set of research-oriented businesses and knowledge-based
institutions that together form eight high-technology clusters.
Despite this impressive transformation, too few of our residents
have benefited from this important regional accomplishment.
For example, our research shows that since 1990, for every job
created with wages in the top one-third of total earnings we
have created eight jobs with wages in the bottom one-third.
The Advisory Group believes that this economic transformation
will likely never be complete and is still underway today.
Communities like San Diego, to sustain their past success,
must continue to evolve and change. Based on what we have
learned about the success of other regions similar to San Diego,
it is becoming clear that by acting in an “enterprising” manner,
communities can help shape the attractiveness of their region

vREPS Volume 1 - Executive Summary
and enhance their relative competitiveness in an increasingly
global marketplace. In so doing they will raise their standard of
living by providing the resources necessary for economic growth
and improved quality of life. To ignore these competitive issues,
the Advisory Group believes, would be a mistake that would
likely relegate the San Diego region to a diminishing role in the
global economy and ultimately to a lower standard of living and
quality of life.
How a region goes about carrying out a regional strategy
designed to change the direction of economic growth can be
achieved in a number of ways, as shown by the many and varied
comments we received on the study, which can be found in the
“Comments and Responses” chapter. To help our region move
forward, the Prosperity Strategy recommends 10 strategic
goals, 27 recommended actions, and identifies who should
carry them out, relying on the proven and successful process
of using existing agencies and organizations to implement the
Strategy’s goals. To be successful every jurisdiction must play
a role implementing the Strategy; all local leaders will need to
take the Strategy’s message back to their Councils and Boards
and begin the necessary and imperative steps toward putting the
Strategy into practice. The Strategy’s recommended actions
call for infrastructure investments and public policy support to
strengthen the region’s economic foundation. More importantly,
these policies and investments will allow the region to continue
to reinvent itself and begin to produce job opportunities that can
raise the rate of growth in our standard of living on par with or
greater than the national rate.
Our hope is that this report will inform and encourage those
interested in economic prosperity to respond to its call for
collaborative action.
Julie Meier Wright
Co-Chair, Prosperity Strategy Advisory Group
President & CEO, San Diego Regional
Economic Development Corporation
Hon. Phil Monroe
Co-Chair, Prosperity Strategy Advisory Group
Councilmember, City of Coronado
Public policies and investments designed to improve the region’s standard of living
must be broad based and address economic, environmental, and social equity issues.
During discussions over economic growth, tension generally surfaces over the trade‑off between the investments
required to achieve long‑term, broad‑based prosperity, and dealing with the short‑term
needs of our citizens.

vi REPS Volume 1 - Executive Summary
ACKNOWLEDGEMENTS
Co‑Chair
Hon. Phil Monroe
Councilmember, City of Coronado
Co‑Chair
Julie Meier Wright President & CEO,
San Diego Regional Economic Development Corporation
This report was prepared with the assistance of the 2007 REGIONAL ECONOMIC EVALUATION AND PROSPERITY STRATEGY ADVISORY WORKING GROUP.
ADVISORY WORKING GROUP
American Electronics Association
of San Diego
Kevin Carroll
Balancing Interests in Economics
Curt Dowds
BIOCOM San Diego
Jimmy Jackson
Building & Construction Trades
Council
Tom Lemmon
California State University
San Marcos
Dennis Guseman
Center on Policy Initiatives
Murtaza Baxamusa
Don Cohen
City of Carlsbad
Cynthia Haas
City of Chula Vista
Gustavo Perez
Dana Smith
City of Escondido
Hon. Sam Abed, Mayor Pro Tem
City of San Diego
William Anderson
Frank Hafner
Scott Kessler
City of Santee
Pamela White
City of Vista
Kevin Ham
CONNECT
June Chocheles
Michael Coleman
Ruprecht von Buttlar
County Office of Education
Karen LaBonte
County of San Diego
Chantal Saipe
Endangered Habitats League
Michael Beck
Mexican Consulate
Monica Adame
Lydia Antonio
Roman Fernandez
Otay Mesa Chamber of Commerce
Alejandra Mier y Teran
San Diego Building Industry Association
Matthew Adams
San Diego Community College District
Henry Ingle
Sharon Rhodes
San Diego Convention and
Visitors Bureau
Sal Giametta
San Diego County Regional Airport
Authority
Thella Bowens
San Diego County Water Authority
Dana Friehauf
San Diego Dialogue
Nathan Owens
San Diego Gas & Electric
J.C. Thomas
San Diego Mesa College
Rita Cepeda
Otto Lee
San Diego North Economic Development
Council
Gary Knight
San Diego Regional Chamber of
Commerce
Michael Nagy
Carmen Sandoval
Angelika Villagrana
DeeDee White
San Diego Regional Economic
Development Corporation
Michael Schuerman
San Diego Regional Energy Office
Irene Stillings
San Diego Taxpayers Association
Lani Lutar
San Diego Unified Port District
Dan Wilkens
San Diego Unified School District
Roy MacPhail
San Diego World Trade Center
Beth Abbott
Hugh Constant
Judy Long
Bella Huele
San Diego Workforce Partnership
Gary Moss
South County Economic
Development Council
Cindy Gompper Graves
Tijuana Economic Development
Corporation
Fernando Cervantes Guajardo
Alejandro Rivera
United States Department of Defense
CAPT. Michael Giorgione
University of California San Diego
Steven Relyea
The following individuals contributed to the
technical work:
SANDAG STAFF
Gary Gallegos, Executive Director
Diane Eidam, Deputy Executive Director
Marney Cox, Chief Economist
Karen Lamphere, Principal Research Analyst
Monika Clark, Associate Research Analyst
Gabriel Renteria, Research Analyst II
Gwen Kruger, Administrative Office Specialist III
Megan Womack, Administrative Office Specialist II
CONSULTANTS
Jun Onaka, Onaka Planning & Economics

viiREPS Volume 1 - Executive Summary
TABLE OF CONTENTS
9 Executive Summary
10 What We Found
16 Sources of Economic Growth and Prosperity
19 A Strategy to Raise Our Standard of Living
21 Labor Force and Income Mobility
22 Preparing to Compete Globally – Southern California Mega-Region
24 Global Opportunities – Embracing Free Trade
31 STRATEGIC GOALS AND RECOMMENDED ACTIONS
31 Call to Action
31 Leadership – Rising to the Challenge
32 Performance – Measuring Our Progress
33 Strategic Goal 1: Produce a goods movement strategy for the San Diego region to improve our capability to participate in international trade, and help increase mobility for the region’s residents.
37 Strategic Goal 2: Provide an adequate supply of energy from a diverse portfolio and ensure it is delivered in a timely, reliable and competitively priced manner.
39 Strategic Goal 3: Provide an adequate supply of water from a diverse portfolio and ensure it is delivered in a timely, reliable and competitively priced manner.
43 Strategic Goal 4: Reserve existing and vacant prime employment land for light industrial and research and development uses and establish a redevelopment process that would renew and retain existing industrial lands for similar uses in the future.
45 Strategic Goal 5: Provide for the timely delivery of housing units sufficient to stabilize prices.
49 Strategic Goal 6: Prepare the labor force to be competitive for jobs created by the San Diego economy and better able to adapt to changing work and skill requirements.
51 Strategic Goal 7: Increase the facilities and resources necessary to provide region-wide opportunities for all children to receive preschool education.
53 Strategic Goal 8: Reduce the public costs imposed on businesses and assure that activities funded by public expenditures meet their objectives and are efficiently and effectively implemented.
57 Strategic Goal 9: Continue and expand our collaboration with communities in the Southern California Mega- Region to solve infrastructure issues.
61 Strategic Goal 10: Monitor and report on the region’s progress in meeting the challenges and goals identified
in Evaluating the Competition and Assessing our Strategic Position and San Diego’s Regional Economic Prosperity Strategy.
65 STRATEGIC ASSESSMENT SYSTEM
67 Indicator Group 1. Economic and Social Performance
71 Indicator Group 2. Business Vitality
85 Indicator Group 3. Resources for Economic Growth
89 Indicator Group 4. Regional Infrastructure Capacity
95 COMMENTS AND RESPONSES

viii REPS Volume 1 - Executive Summary
68 1: San Diego’s Rate of Population Growth has Declined Relative to That of California and the United States
68 2: San Diego’s Growth in Civilian Employment has Exceeded That of California and the United States
69 3: San Diego has the Lowest Average Wage per Job, When Adjusted for Cost of Living
70 4: San Diego has a Relatively High Level of per Capita Personal Income
70 5: San Diego Lags Both California and the United States in Cumulative Growth of Real per Capita Personal Income Since 1970
72 6: San Diego Ranks High Among Comparable Metro Areas in Terms of Gross Regional Product per Capita
72 7: San Diego has Recently Lagged California and the United States in the Growth of Real Gross Regional Product per Capita
73 8: San Diego has the Second Highest Gap Between Gross Regional Product per Worker and Average Wage per Worker Among Comparable Metropolitan Areas
74 9: San Diego’s Real Average Wage per Job Since 1970 has Lagged That of California and the Nation
75 10: Average Wage of Industries in Top 20 Percent of Total Payroll is Three and One-Half Times the Average Wage of Industries in Bottom 20 Percent
75 11: Job Increase in Industries With the Bottom 20 Percent of Total Payroll Since 1990 is 24 Times the Job Increase in Industries With the Top 20 Percent of Total Payroll
77 12: San Diego has a Diverse Group of Traded Clusters
77 13: San Diego’s Traded Clusters Generally Pay Wages Higher Than the Regional Average of $43,801
81 14: San Diego’s Growths in Exports, Imports, and Gross Regional Product
81 15: Hispanic-Owned Businesses in San Diego Have Declined as Proportion of all Businesses with Employees Since 1997
83 16: The Growth of Venture Capital Funding in San Diego Since 1995 has Exceeded Growths in California and the Nation
83 17: Biotechnology and Software Industries Receive the Largest Shares of Venture Capital Funding
86 18: San Diego has a Relatively High Proportion of Persons 25 and Over with a Bachelor’s or Higher Degree
86 19: San Diego has a Relatively Low Proportion of its 3- and 4-Year-Olds Enrolled in Nursery or Preschool
87 20: Employment Growth in San Diego Since 1998 has Outpaced Growth in Total Housing Units
88 21: San Diego’s Housing Opportunity Index is the Lowest Among Comparable Metropolitan Areas
88 22: San Diego’s Housing Opportunity Index has Declined Sharply Since 1998
90 23: San Diego has Not Increased its Freeway Capacity as Fast as Other Metropolitan Areas in the United States
90 24: Number of Northbound Trucks Entering San Diego Through International Land Ports of Entry (Thousands of Vehicles)
92 25: Number of Passengers (in Millions) Using the San Diego International Airport is Increasing Over Time
92 26: Current and Future Sources of Energy for the SDG&E Service Area
LIST OF FIGURES

�REPS Volume 1 - Executive Summary
The Regional Economic Prosperity Strategy identifies the
demographic and economic challenges facing the San Diego
region, and promotes a strategy to meet these challenges and
improve the competitiveness of our local economy.
The complete analysis of our economy requires two volumes.
This report’s companion document (Volume II), Evaluating the Competition and Assessing Our Strategic Position, benchmarks the San Diego region against 24 similar regions,
as well as against broader statewide and national trends. A
strategic assessment system was created to accomplish this
analysis. By benchmarking ourselves against competitors, we
have a way of measuring progress, or lack of progress, to solve
recognized problems.
EXECUTIVE SUMMARY
SAN DIEGO REGIONAL ECONOMIC PROSPERITY STRATEGY
This document (Volume I), the San Diego Regional Economic Prosperity Strategy, builds on the evaluation completed
in Volume II by summarizing the key challenges, laying out a
strategy to meet these challenges, identifying strategic goals,
recommended actions, and the agencies and organizations
most responsible for implementation. Volume I also includes
a summary of the Strategic Assessment System as well as a
Comments and Responses section.
By benchmarking ourselves against competitors, we have a way of measuring
progress, or lack of progress, to solve recognized problems.

10 REPS Volume 1 - Executive Summary
What We Found
What are our region’s most important economic challenges?
One of our most significant and insidious challenges has been
with us for some time. Over the past three decades the rate
of increase in the region’s standard of living has not kept
pace with the nation’s. Our research shows that this has been
occurring for two reasons: first, the San Diego region has been
adding proportionately more jobs at the low end of the pay
scale than jobs in the middle or at the high end of the pay
scale. Second, this “unbalanced job growth” problem has been
made worse by a widening gap between wages received at the
high and low ends of the pay scale. These two trends combined
with a relatively high rate of inflation (high cost of living) are
responsible for the low rate of growth in the region’s standard
of living.
The impacts of inflation over long periods are not readily
understood, so an illustration may help explain these
effects on the purchasing power of our residents’ income.
During 2005 our region’s per capita income, unadjusted for
inflation and therefore not a measure of standard of living, was
$40,569, nearly $6,100 or 17.7 percent above the national per
capita income level of $34,471. Adjusting these figures for
the inflation that has occurred over past three decades (so we
can see the purchasing power of income today versus income
in 1970) shows San Diego’s per capita income, expressed
in 1970 dollars, to be $6,271 and the nation at $6,848, some
$577 or 9.2 percent above San Diego. San Diego’s standard
of living, measured in inflation adjusted 1970 dollars, dropped
below the nation during the 1981-1982 recession. It has
remained below and the gap has become wider. Furthermore,
research shows that the rise in home prices and rents has been
the primary cause of the relatively high rates of inflation (high
cost of living) in San Diego.
Rate of Growth in Real Per Capita Income, a measure of the growth rate in the region’s standard of living
San Diego California United States
0%
10%
20%
30%
40%
50%
60%
70%
19
70
19
72
19
74
19
76
19
78
19
82
19
84
19
80
19
86
19
88
19
90
19
92
19
94
19
96
19
98
2000
20
02
$3,500
$4,000
$4,500
$5,000
$5,500
$6,000
$6,500
$7,000
$7,500
19
70
19
72
19
74
19
76
19
78
19
80
19
82
19
84
19
86
19
88
19
90
19
92
19
94
19
96
19
98
20
00
20
02
20
04
S a n D ie g oC a lifo rn iaU n ite d S ta te s
Real Per Capita Personal Income a Measure of Standard of Living: 1970-2005, 1970 dollars
San DiegoCaliforniaUnited States
The rate of increase in the region’s standard of living has not kept pace with
the nation’s.
Our standard of living fell below the nation’s during the 1981‑1982 recession
and the gap is widening.

11REPS Volume 1 - Executive Summary
Job and Wage Growth, San Diego Region
Earnings Distribution by Top-, Middle-, and Low-Paying Jobs, San Diego Region, 1990-2004
0%
10%
20%
30%
40%
50%
60%
1990 1995 2000 2004
1990-2004 Growth ($2004)
Salary Distribution/Median Wage
Average Salary Increase
Salary Rate of Change
Job Growth
Highest Paying Jobs (Top 1/3)/$79,800 $19,977 33.4% 20,280
Mid-Level Paying Jobs (Middle 1/3)/$51,000 $8,208 19.2% 57,310
Low-Level Paying Jobs (Lowest 1/3)/$24,500 $2,000 8.9% 158,400
Top 1/3 Middle 1/3 Lowest 1/3
Since 1990, the region has been adding eight low-paying jobs for every one
high-paying job.
The wage gap between high- and low-paying jobs is widening.
12 REPS Volume 1 - Executive Summary
One issue that arose during our evaluation process that
we did not have an opportunity to analyze as a separate or
individual challenge is “climate change” or more specifically,
green house gases, such as carbon dioxide (CO2) emissions.
Although a full integrated analysis will have to wait until the
Prosperity Strategy is next updated, we would like to point
out that most of our recommendations are in line with and
very much support the general discussions on reducing CO2
emissions. For example, most of our recommendations support
conservation as part of the solution, if it is relevant. More
specifically, our strategic goal addressing housing is based
on smart growth principles, putting jobs close to housing to
reduce commute times, urban sprawl, and CO2 emissions from
tailpipes. Also, our recommended actions encourage meeting
the statewide objectives of moving toward more renewable
energy sources, including monitoring policy-level discussions
involving nuclear power.
What caused these problems?
Our research determined that unbalanced job growth was
partly responsible for the relatively low rate of growth in our
standard of living, measured by the annual changes in per
capita income adjusted for inflation. Although all businesses
and industries (and jobs) contribute to economic growth, it
is important to distinguish between those industries that are
primarily local serving and those that sell their products and
services nationally and internationally. These two types of
industries play very different roles in economic growth. This
latter group of businesses, referred to “traded clusters” set the
pace for economic growth.
Our research shows that our region has a long track record
of investing public resources in traded clusters that offer low
wage jobs that require a low or minimal amount of education
and training. Our region, for example, has provided the
companies in this select group of traded clusters with world
class infrastructure providing them with the foundation to
be competitive and successful worldwide. In turn, these low
wage clusters are setting a slow pace of economic growth
in the region. Think of it as a “rate of return” on our public
investments; steady and stable, but slow. Furthermore, these
low wage traded clusters are not likely to disappear anytime
soon; more likely they will continue to grow because the region
continues to invest in and create new capacity to support
additional jobs.
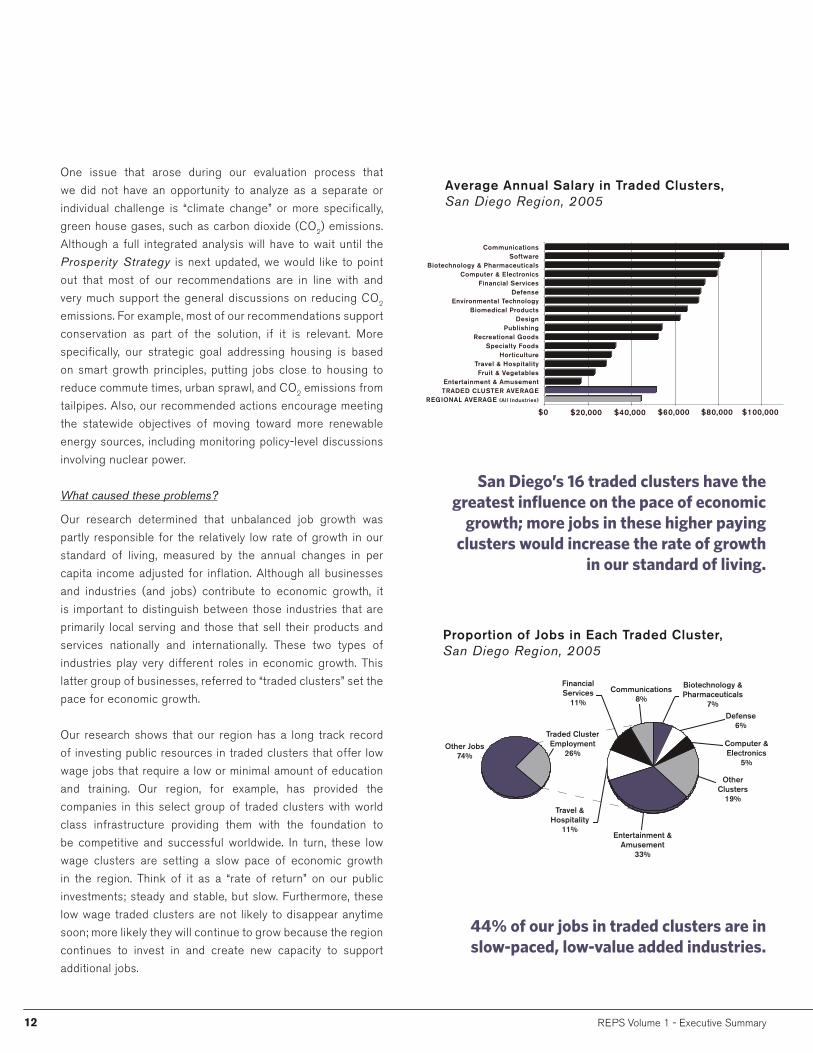
Average Annual Salary in Traded Clusters, San Diego Region, 2005
CommunicationsSoftware
Biotechnology & PharmaceuticalsComputer & Electronics
Financial ServicesDefense
Environmental TechnologyBiomedical Products
DesignPublishing
Recreational GoodsSpecialty Foods
HorticultureTravel & HospitalityFruit & Vegetables
Entertainment & AmusementTRADED CLUSTER AVERAGE
REGIONAL AVERAGE (All Industries)
$0 $20,000 $40,000 $60,000 $80,000 $100,000
Proportion of Jobs in Each Traded Cluster, San Diego Region, 2005
FinancialServices
11%
Traded Cluster Employment
26%Other Jobs
74%
Communications8%
Biotechnology & Pharmaceuticals
7%
Entertainment & Amusement
33%
Travel &Hospitality
11%
Computer & Electronics
5%
OtherClusters
19%
Defense6%
San Diego’s 16 traded clusters have the greatest influence on the pace of economic
growth; more jobs in these higher paying clusters would increase the rate of growth
in our standard of living.
44% of our jobs in traded clusters are in slow‑paced, low‑value added industries.

13REPS Volume 1 - Executive Summary
In addition to unbalanced job growth, our research determined
that the slow rate of growth in our standard of living was partly
caused by relatively high rates of inflation primarily fueled by
rising home prices and rental rates. A shortage in the supply of
housing units during the times that demand increased rapidly
has contributed significantly to high home prices and rental
rates, which are a major impediment to sustainable economic
growth.
One reason for the lack of housing supply in the region is that
local jurisdictions are reluctant to approve new residential
development, particularly in urbanized areas, due to inequities
in the distribution of tax revenues. Since the passage of
Proposition 13 in 1978 and subsequent decisions by the state to
reserve large portions of property tax revenues for public schools,
local jurisdictions receive only a small part of those revenues.
These property tax revenues by themselves are now inadequate
to pay for the provision and maintenance of the many public
facilities and services expected by residents. Without sufficient
funding to pay for these public facilities and services, existing
residents believe that these new units and people reduce their
quality of life. Accordingly, jurisdictions have little incentive and
constituency support to approve new, especially high density,
housing whose primary revenue contribution is the property tax.
Instead, jurisdictions have a greater motivation to approve land
uses that generate revenues, such as sales taxes and transient
occupancy taxes.1 This “fiscalization of land use” leads to distorted
public policy: the health of the municipal budget is mistaken
for the community’s economic prosperity; retail development is
confused with economic development; and the most important
community need — housing — is regarded as a loser.
Local government should not be heavily criticized for trying to
regain some control over their fiscal powers through land use
policies; however, the state-local tax system must be reformed to
fix the dysfunctional state-local financial relationship in order for
regions throughout California to make headway on the goal of
having the marketplace provide affordable “workforce” housing.
1 Redevelopment areas partly circumvent these property tax
limitations, shifting incremental revenue from school districts
to cities.
0
10
20
30
40
50
60
70
19
92
19
93
19
94
19
95
19
97
19
96
19
98
19
99
20
00
20
01
20
02
20
03
20
04
20
05
20
06
Percent of Households That can Afford the Median-Priced Home
32%Housing
OtherExpenditures
68%
OtherExpenditures
62%
38%Housing
Household Expenditures for Housing, 2004
San Diego Region
United States
San Diego Region United States
The percentage of housing units affordable to San Diegans is at an all time low.
During 2004, San Diegans spent 38% of their income on housing while the national
average was 32%.

14 REPS Volume 1 - Executive Summary
Lack of affordable “workforce” housing also leads to urban
sprawl and longer commuting distances, as residents seek
less expensive housing in outlying areas. For example,
SANDAG’s most recent Regional Growth Forecast Update,
based on the existing General Plans of the cities and County of
San Diego, show that, between 2004 and 2030, some
93,000 households with workers in San Diego County
will find homes in Riverside and Imperial Counties and in
Baja California. If these trends continue unabated, what will
look like a transportation problem in 2030 will actually have
been caused by a housing problem that could have been
prevented by acting today.
What are we to do?
To address these major challenges the Prosperity Strategy
identifies 10 strategic goals and 27 actions and lists
who should take responsibility for carrying them out. The
Prosperity Strategy points out that our region needs a more
balanced approach in our public investment strategies. This can
be accomplished by identifying and investing public resources
in areas that support traded clusters that offer higher paying
jobs and require higher levels of education, skill and training.
Our region’s public policies and capital investments influence
the demand and supply of production inputs through business
retention, expansion and attraction. In turn these businesses
influence the rates of productivity, economic growth, and
income in the region.
Putting our region on a new economic growth track and
sustaining its upward momentum depends on our ability to
connect companies in high value-added traded clusters to world-
class infrastructure and supportive public polices. This will allow
the region to reinvent itself, influencing the quality and balance
of our economic growth. More importantly, our recommended
actions are designed to create middle-income jobs that will
provide the opportunity for a rising standard of living for all our
residents.
In addition, the Prosperity Strategy recognizes that the
region must provide a sufficient number of housing units to
maintain stable prices, keeping what could be rapidly rising
home prices and rents from adding to our already relatively
high rates of inflation and cost of living. Increasing the supply
of housing as the demand rises is the most effective way to
moderate a rapid rise in home prices. Local jurisdictions can
undertake advance planning and impact analysis of new housing
in their Smart Growth Opportunity Areas (SGOA) even before
private landowners submit development proposals, to in effect,
pre-approve the opportunity for development to occur. The
development proposals would be consistent with approved plans
and current environmental review. The change would be to allow
for the product (housing units) to be supplied quickly, as the
demand is increasing, keeping the upward pressure on prices in
check. In addition to keeping home prices in check, preapproving
housing development in SGOA would encourage growth to occur
where we are planning to accommodate it.
Furthermore, streamlining the development and regulatory
process also would free up financial resources to fund additional
development, provided the market demand had not been fully
met. The more quickly a developer can plan, construct, and
sell a unit, the faster those funds can be reinvested to develop
additional units to meet the market demand and limit upward
pressure on prices.
Public Policies and Investments Influence Economic Growth and Standard of Living
LocalBusinesses
(Traded Clusters)
Wages and
Productivity
Policy Actions & InfrastructureInvestments
Labor Force
Rising Standardof Living
If we want world‑class companies and their high paying jobs, we must provide world‑class
infrastructure – both human and physical – and supportive, flexible public policies.

15REPS Volume 1 - Executive Summary
W age Per Job/Cost of Living
San Jose, 1
San Diego, 3
Riverside, 20
Dallas, 1
San Diego, 9
San Diego, 20
San Francisco, 1
Dallas, 20
Highest
Lowest
Cost ofLiving
W agePer Job
San Diego Region’s Average Wages and Cost of Living Ranked Against Similar Regions
Relatively low wages and a high cost of living are a corrosive combination eroding
our region’s purchasing power.
The failure of growth today is the young worker with a family who must drive an
hour or two to work each day to find affordable housing.

16 REPS Volume 1 - Executive Summary
This research identified 16 traded clusters that play an
important and influential role in setting the pace for economic
growth in the San Diego region. Many of San Diego’s
16 traded clusters are in high technology sectors, such as
biotechnology, pharmaceuticals, biomedical instruments,
communications, software, environmental technology,
computers, and electronics. Other traded clusters have a long
history and tradition in the region, such as defense, certain
agricultural and food processing industries, and visitor-serving
industries including entertainment, amusement, travel, and
hospitality. These traded clusters are a diverse lot, and not as
homogenous as the industries that made up the manufacturing
sector during its heyday.
Sources of Economic Growth and Prosperity
Beginning with the 1998 Prosperity Strategy, the study of
San Diego’s economy has recognized the importance of “cluster
analysis” to identify the region’s traded clusters – businesses
in industries that compete nationally and internationally
and have the greatest influence on the long-term pace and
potential of economic growth. Cluster analysis began as a
way to supplement the traditional approach to analyzing firms
and employment based strictly on industrial classifications.
In the past quarter century, the U.S. has moved increasingly
from an economy driven by goods production to one driven by
knowledge- and service-based delivery. To better understand
our economy and what makes it tick, it made sense to group
industries according to shared characteristics, such as
specialized technologies, demand for certain types of skilled
labor, and firm-to-firm buyer-supplier relationships.
19571957
30%M anufacturing
Jobs70%O ther Jobs
19571957
20052005
26%TradedClusters
74%O ther Jobs
20052005
Proportion of Local Jobs That are Primarily Export-Oriented, San Diego Region, 1957 and 2005All industries contribute to determining
the output per worker of our economy, but industries that compete nationally and
internationally have far greater long‑term economic growth potential.

17REPS Volume 1 - Executive Summary
In 2005, San Diego’s traded clusters accounted for about
one-quarter of the region’s employment. Average pay for these
clusters was 16 percent higher than the region as a whole. High
technology traded clusters comprised about 10 percent of the
region’s employment, with an average wage more than 60 percent
higher than the region’s average. This latter point is important to
economic growth; traded clusters deserve our attention because
they are an important starting point for raising the region’s
standard of living. However, 44 percent of the jobs in our traded
clusters are in two areas – entertainment, and leisure and
hospitality – which are setting a slow, steady pace for economic
growth, a pace below the national rate of growth. (A complete
list and discussion of San Diego’s traded clusters can be found
on pages 78 and 79 of this report. Additional information on
our clusters is located in the companion document, Evaluating the Competition and Assessing our Strategic Position, on
pages 36 to 41.)
A point worth clarifying is that although these traded clusters
set the pace for economic growth they do not contain all of
the middle- and high-paying job opportunities. While traded
clusters are an important starting point for raising the region’s
standard of living, they are not the end point. Expanding job
opportunities in some of the traded cluster industries will provide
some middle-and high-paying job opportunities, but there are
many such jobs outside the traded cluster industries that will
benefit greatly from a heightened pace of economic growth. Our
research is focused on select high value-added traded clusters
because they have the greatest impact on setting the pace of
economic growth. Successfully increasing the pace of economic
growth provides an opportunity for all workers and industries in
the region to benefit, not just the traded cluster industries.
The export‑oriented industries that influence the pace of economic growth
have changed.
The key to building middle‑ and high‑paying jobs is the expansion of job
opportunities in the businesses that make up our high value‑added traded clusters.

18 REPS Volume 1 - Executive Summary
General Theory and Model for Raising the Standard of Living in the San Diego Region
Local Businesses(Entrepreneurs inTraded Clusters)
Wages and
Productivity
Policy Actions & InfrastructureInvestments
Labor Force
Rising Standardof Living
·Energy·Water·Transportation·Education·Workforce
Development·Housing
Strategy’s Focus:
Global and U.S.EconomicConditions
SocialConditions
NaturalEnvironment
TechnologicalChanges
Exogenous Factors:
Public policies and capital investments are catalysts that influence the supply and demand of production inputs, through
business retention and attraction, whose entrepreneurial actions in turn are responsible for creating jobs with relatively
high rates of productivity, supporting higher wages and a quicker pace of economic growth.

1�REPS Volume 1 - Executive Summary
This framework suggests that our public investments and
policies provide companies with the foundation and some of
the essential resources needed to be competitive and to help
eliminate, nullify, or circumvent the limitations of local factors.
This framework does not call for our region to compete based
on what economists call factor costs, such as land, labor, or
raw materials. In today’s economy, globalization allows firms to
source their factors from the international marketplace and to
locate their production and service activities off-shore.
These public policies and infrastructure investments should
not be thought of as factors of production, but rather as a
condition for high rates of economic growth to occur. This
growth would take place primarily through the retention and
attraction of businesses that facilitate technological progress
and stimulate innovation in the economy.2 In other words,
public policies and capital investments influence the demand
and supply of production inputs, through business retention
and attraction, which in turn are responsible for jobs with
relatively high rates of productivity, supporting income and
economic growth in a region.
2 In 1956, economist Robert Solow developed a model
explaining the basis for economic growth that is still
considered a mainstay of macroeconomics today. Solow
showed that an economy’s ability to raise per capita income
evolves from gains in productivity, most of which come from
advances in technology and innovation.
A Strategy to Raise Our Standard of Living
How do we use what we know about our economy to address
our major challenges? First, we must recognize that we face
two challenges. One is that the demand for unskilled workers in
all industries is dwindling, even inside the traded clusters that
offer the lowest wages today. This trend will keep the wage rates
for unskilled labor relatively low. In other words, the economic
plight of the unskilled worker is expected to get worse, and
these workers may find it difficult to get a job in the industries
that today require minimal education and training as those jobs
become available. A second challenge is our region’s track
record of investing heavily in traded cluster industries offering
low wage job opportunities that require a low or minimal amount
of education and training. These low value-added industries are
setting the pace of economic growth in the region. Also, these
businesses are not likely to disappear any time soon; more likely
they will continue to grow because the region continues to invest
in and create new capacity to employ more people.
In response, the Prosperity Strategy offers a framework to
meet these challenges. The framework shown on the previous
page illustrates the dynamic relationship and influence that
public policies and infrastructure investments have on local
business growth, labor force requirements, wage rates and
ultimately the rate of growth in the region’s standard of living.
The graph shows that public policy and investment actions can
work together to raise the standard of living by adding human
and physical infrastructure capacity for jobs with high levels of
output per worker (productivity).
A salient feature of successful traded clusters is that they are self‑regenerating.
Competitive advantage today is driven by the ability of firms to continuously innovate
and upgrade, providing these businesses with the ability to eliminate, nullify, or circumvent weakness in local factors.

20 REPS Volume 1 - Executive Summary
In addition to investments in physical capital, the Strategy is
focused on the labor force and increasing its education, skill,
and training. One of the most effective and well documented
ways for workers to earn higher pay is to raise their productivity
through education and training. The importance of education to
wage earners at the low end of the spectrum can be illustrated
by using national data from the 2001 Current Population
Survey, which shows that individuals earning $5.15 to
$7.15 per hour have notably different levels of education
compared to those earning between $8.15 and $10.15 per
hour. The main educational difference between these two
groups is the prevalence of high school dropouts. Workers
earning at the low end have a high school dropout rate (31%)
twice that of workers earning the higher wages.
The framework graph on page 18 also shows that the
interrelationships among the San Diego region’s public policy,
traded cluster industries, labor force, and standard of living
operate within a national and global context of competitive
markets and technological change.
They also operate within a regional context influenced by
the availability of housing, social infrastructure (particularly
education), the natural environment, and other components of
quality of life. This report focuses on selected indicators of social
condition, such as health and crime, and the role of environmental
conservation and quality. The report thus recognizes that public
actions to improve the region’s standard of living cannot be
limited to economic interventions, but also must consider and
address social and environmental issues.
Median Annual Earnings by Educational Attainment, United States, $2006
$0 $20 ,000 $40 ,000 $60 ,000 $80 ,000
Doctoral Degree
Professional Degree
Master’s Degree
Bachelor’s Degree
Associate Degree
Some College, No Degree
High School Graduate
Less than a High School Diploma
Median Annual Earnings
Public policies and investments designed to improve the region’s standard of living
must be broad based and address economic, environmental, and social equity issues.

21REPS Volume 1 - Executive Summary
Median real earnings grew from $39,652 in
1988 to $49,054 in 2000, an increase of 24 percent.
The change in earnings varied: approximately
30 percent of the sample showed a decline in real
earnings, while another third of the workers showed
gains of more than 50 percent. These differences
indicate a fluid earnings ladder, with ample opportunity
to move up or down.
Of those workers initially in the bottom quintile of the
earnings distribution in 1988, approximately 38 percent
remained in the bottom quintile in 1992. By 2000,
one in five (20%) remained in the bottom quintile. At
the other end of the distribution, 80 percent of the
workers in the top quintile in 1988 were still earning
wages in the top quintile 12 years later.
Of the workers earning less than $12,000 in
1988 (adjusted for inflation) approximately 15 percent
remained in this category by 2000. At the other end
of the earnings spectrum, more than 77 percent of
the individuals in the top quintile retained their top
position.
Those in the bottom quintile nearly doubled their
real annual earnings over the 12 years (adjusted for
inflation). The top quintile showed a 9.2 percent gain,
most occurring before 1992.
»
»
»
»
Labor Force and Income Mobility
Implied in the Prosperity Strategy is the opportunity for
income mobility through education and training. The issue of
income mobility has been taken up in various studies over many
years and not all of them agree or highlight the same findings
as important. One such study was produced by the California
Employment Development Department in 2002.3 Overall the
study found “fairly high” levels of absolute earnings mobility, with
the highest rate of mobility among the lowest earners. Some
points from the study are worth noting here because of their
relevance to the Strategy.
3 Wage Mobility in California: An Analysis of Annual Earnings.
Labor Market Information Division, California Employment
Development Department, April 2002. The report examines the
wages of a large sample of California workers of all ages and
income levels drawn from administrative data collected by the
California Employment Development Department. The results
were largely consistent with research done using national
samples.
During discussions over economic growth, tension generally surfaces over the trade‑off between the investments
required to achieve long‑term, broad‑based prosperity, and dealing with the short‑term
needs of our citizens.

22 REPS Volume 1 - Executive Summary
How we define our region becomes a basis for defining our
region’s competitive assets. These assets should be woven into
our collaborative strategic planning, infrastructure investments,
and policy actions. For example:
Our region (San Diego) depends on the transportation
infrastructure located in the greater Los Angeles area
for access to the national and international marketplace
(do we need our own facilities or should we work with
our mega-region partners to the north to expand their
infrastructure and at the same time achieve better
access?).
We are dependent on Baja California and, increasingly,
on southern Riverside County for an important part of our
labor force, housing, manufacturing facilities, and product
distribution centers (do we need all the labor, housing,
and business facilities located in San Diego, or do we
all need more efficient and better access to each others’
facilities?).
We are dependent on outside sources for a majority
of the region’s potable water supply. Recently the
San Diego County Water Authority reduced this risk by
entering into agreements with our neighbor to the east
to purchase water from Imperial Irrigation District (IID)
and the All-American Canal Lining and Coachella Canal
Lining projects, effectively strengthening and diversifying
our water supply to meet projected population and
economic growth requirements (should California be
considering more of these agricultural-to-urban water
transfers through a statewide water market mechanism
that includes the Central Valley Project?).
We are dependent on outside sources for a majority of
our energy supply and recent legislation requires that an
increasing proportion of the energy we consume come
from renewable sources. This may require a significant
increase in our transmission capacity, which the local
utility, San Diego Gas & Electric, is proposing to bring in
from sources in Imperial County.
»
»
»
»
Preparing to Compete Globally – Southern California Mega-Region
As the United States embarks on its third century of growth
and development, the Regional Plan Association of New York
produced a report calling for a strategy to address national
challenges on a regional scale.4 The report points out that
the U.S.. needs a “Third Century Strategy” to contend with the
140 million additional people expected by the year 2050 and
the challenges of competing in a global economy. Today, the
U.S. has delegated most economic development and planning
initiatives to municipalities. There is no unifying plan or strategy,
as we had, for example, with the Interstate Highway System.
Yet, over the next 50 years, if the nation’s population increases
by 40 percent as expected, we will need to build a sufficient
number of housing units to accommodate the growth and as
much commercial development and infrastructure as we have
constructed over the past two centuries.
Most of the nation’s population growth, and even a larger
share of its economic expansion, is expected to occur in eight
emerging “mega-regions.” These are large, interconnected
metropolitan areas, each spread over thousands of square
miles, and located in every region of the country. The
Southern California mega-region extends south from
Ventura County and across the U.S.-Mexico international
border into Baja California. Many growth-related issues, such as
transportation, environmental quality, innovation, energy, water,
solid and hazardous waste, and job creation affect the entire
Southern California mega-region and require collaboration
and coordination of its members for their solutions.
4 America 2050: A Prospectus, 2006.
Nationally, there seems to be a growing consensus that mega‑regions — not cities
or the suburban counties that surround them — are becoming the geographic
units that define global competitiveness.

23REPS Volume 1 - Executive Summary
These and other collaborative initiatives are
required for economic growth to continue
and to help us remain competitive in a global
marketplace. On this latter point, while
San Diego has been a pioneer in life science
research (along with Northern California
and the Northeastern U.S.), other regions
and countries, such as those in Europe and
Asia, have established research centers and
production capacities to attract scientists, create new products,
and compete with regions in the United States. Singapore has
identified development of life science research and industry as
a national priority and has invested substantial funds to attract
researchers. Similar developments have occurred in computers,
communications, and other high technology industries.
Closer to home, other states and regions are engaged in
cut-throat competition to attract San Diego’s entrepreneurs
and convince them that they can grow their companies faster
and create greater value for their stakeholders. Florida, for
example, has made available nearly a billion dollars worth of
investment capital for fostering their life science industries and
has successfully attracted satellite operations of two of our local
research institutions. Florida policymakers have expressed their
goal to build a world class biotechnology cluster that is on par
with San Diego. Other regions offer aggressive tax breaks and
other economic development incentives to attract these fast
growing, technology-oriented businesses.
Competitive forces, global or otherwise, affect communities
differently. Communities with collaborative ties to their
mega-region may be better equipped with the resources
necessary to successfully compete at this broader scale. By
acting in an enterprising and collaborative manner with our
mega-region partners, places like San Diego can help shape
the attractiveness of their mega-region, enhancing its relative
competitiveness in an increasingly global marketplace. Locally,
we have only begun to test our ability to form broad regional
partnerships to implement problem solving strategies to address
the changing needs of our economy.
Emerging Globally Competitive Mega-Regions, United States
Mega‑regions of the U.S. are located in every part of the country delineated by common
history, geographic location, and topography. Between now and 2050, more than two‑thirds
of U.S. population growth and economic growth are expected to occur in these
ten mega‑regions.
A fundamental goal of the “Third Century Strategy” is to promote the creation of
regional infrastructure around anticipated demands of the nation’s growing
mega‑regions and gateways to global markets.

24 REPS Volume 1 - Executive Summary
The underlying point for economists is that free trade stimulates
economic growth, usually by increasing productive resources
and/or technological change. In practice, these increases are
triggered by the spur of competition when countries liberalize
trade. Economists’ support for free trade rests primarily on the
fact that imposing or removing trade restrictions invariably helps
some firms and people and hurts others, but results in a positive
net benefit for the country as it moves toward freer trade.
The principle of comparative advantage, implemented through
exchange and specialization, is the same whether the trading
partners are individuals, cities, counties, states, or countries. In
other words, would our lives be better if each of us individually
grew all of our food, made all of our clothes, pumped and refined
all of our oil and gas, built our own houses, and made all of our
own movies? These are rhetorical questions, but the point is that
pure self-sufficiency is a recipe for a “Stone Age” standard of
living. Instead, to improve our standard of living we trade our
output for the goods and services that we are not especially
adept at producing, and the result is a higher standard of living
for all involved.7
7 Economic growth is further stimulated in the following ways:
(1) trade raises a country’s real income, some of which is
saved. The increased saving raises the availability of funds
for investment spending, augmenting a country’s productive
capital stock, allowing for economic growth; (2) faced with
increased competition from trade, firms must act to improve
their efficiency and responsiveness to customers raising
productivity and output; (3) as trade barriers are reduced the
size of the market that a firm faces increases, thus offering
opportunities for more sales, lower per unit cost, and increased
research and development spending.
Global Opportunities – Embracing Free Trade
Preparing our region to compete in the increasingly global
marketplace also means embracing free trade. Yet, discussions
over free trade seem to polarize the participants. “Are you fer
it or agin’ it?” Most economists support free trade polices,
however, public support for these policies can be characterized
as lukewarm or in some cases adamantly opposed. On
one side, it is not unusual to hear or read reservations expressed
about trade, for example: “Trade harms large segments of
U.S. workers.” “Trade exploits poor countries.” On the other
side, most economists agree with the proposition that the use
of tariffs and import quotas to regulate free trade reduces
the average standard of living. Why is there such disconnect
between economists and the general public?5
More than 200 years ago, economists Adam Smith and
David Ricardo demonstrated the benefits of trade through the
principle of comparative advantage and the “economic gains”
that can flow from trade through the application of “exchange”
and “specialization.6” Given the amount of time that has passed
it is safe to conclude that economists have not done a good
job addressing these concerns, in part because there is a little
bit of truth in each of these public perceptions concerning
free trade.
5 For example, see the San Diego Union-Tribune, “What’s that
sour taste? It’s the U.S. trade deficit” by Dean Calbreath,
April 1, 2007.6 An important point here is that the gains from trade depend
on comparative and not absolute advantage. What is crucial
for comparative advantage is that the ratio of production
costs, and therefore prices, between two goods or services
in one country is different from the ratio of the same goods
or services in another country. Absolute advantage generally
refers to the efficiency or productivity of one country in
producing a product, measured by output per worker.
Intuitively one might conclude (wrongly) that absolute
advantage eliminates the possibility of mutual gains from
trade; leading to the perception that a high productivity (high
income) country could not engage in mutually beneficial
trade with a low productivity (low income) country. Absolute
advantage is important in determining incomes, but is
irrelevant in whether trade can benefit both countries.
Free trade raises society’s standard of living.

25REPS Volume 1 - Executive Summary
If the logic and evidence supporting free trade is so convincing
(at least for economists) why is the general public reluctant to
embrace free trade? Surveys show that the public seems to
focus or emphasize the costs rather than the net benefits of free
trade, and their perspective is one of an individual evaluating
how their current economic status is affected without regard for
the national well-being.
These reservations about free trade expressed by the public8
are specific. In other words, the general public understands
the benefits from free trade in terms of increased product
selection, higher quality, and lower prices. Despite an intuitive
understanding of the benefits, the general public has expressed
specific and strong reservations about embracing a broad public
policy supporting free trade, such as:
8 A wealth of information on trade opinions can be found at the
following Web site maintained by the Program on International
Policy Attitudes: www.americans-world.org.
Distributional effects – workers are not seen as
benefiting from trade. The public perceives that the
benefits from trade flow to businesses and the wealthy,
and to those abroad rather than to workers in the
United States.
Disruptive effects – trade causes painful adjustments
for those who lose their jobs. The perception is that the
costs incurred by these workers are not necessarily
offset by the creation of new and possibly better jobs.
U.S. trade deficit – the public believes that deficits
are not sustainable, we are living beyond our means,
and the U.S. should not have a trade deficit; rather,
exports should be greater than or equal to imports, in
the aggregate and with each country. If there is a trade
deficit with a country, the public believes it is because
of unfair competition, such as public subsidies, tax
breaks and/or an artificially low currency.
Economists generally disagree with these and other
observations about free trade. People see the costs imposed
by free trade on workers who lose their jobs because of
imports, but fail to see or fully appreciate the benefits to
consumers of lower priced goods and services from abroad.
For example, restricting imports of a raw material will have
positive effects on domestic producers of the raw material,
and their employees, but will hurt domestic users of the raw
material (focused benefits, distributed costs). Saving jobs in
the industry producing the raw material comes at the cost
of diffused impacts like reduced jobs in industries using the
raw material and higher costs to consumers of the finished
product.
»
»
»
Cumulative Growth of Exports, Imports, and Gross Regional Product, Nominal Dollars, San Diego Region, 1991-2004
0%
100%
200%
300%
400%
500%
19
91
19
92
19
93
19
94
19
95
19
96
19
97
19
98
19
99
20
00
20
01
20
02
20
03
20
04
Gross Regional ProductImports Exports
The effects from a policy designed to halt free trade would be similar to a policy
directed at holding back improvements in technology and innovation.

26 REPS Volume 1 - Executive Summary
Another related public perception is that exports add jobs
and imports cost jobs when workers in the home country
find they cannot compete with low-cost goods or services
from abroad. This gives the impression that a country could
add jobs by subsidizing exports and blocking imports. In
practice, for the U.S. to export, another country must import
and pay for those imports, preferably with dollars. How will
foreigners obtain dollars unless they export and are paid in
dollars? Will the U.S. banks lend the dollars, even though
the foreign firms have no way of selling goods in the U.S.?
If the U.S. firms accept the foreign currencies as payment,
they cannot use the money because imports are blocked. This
makes it clear that a policy that restricts imports also restricts
exports; every dollar of blocked imports is also, eventually, a
dollar of blocked exports. In this way, imports and exports are
connected in a very fundamental way. Furthermore, saving
jobs by restricting imports saves only jobs in the particular
protected industry, and saving those jobs necessarily means
losing jobs in another import-competing industry or export
industry. The public perception that imports destroy some jobs
is certainly correct; however, the key point is that trade causes
a change in the distribution of jobs and no major change in the
number of jobs, once the disruptive adjustments to changing
trade patterns are complete. In this way, economists are not
insensitive to workers whose job has been lost as a result of
trade; they are confident that additional jobs are created in
the areas where we have a comparative advantage. However,
economists question the wisdom and effectiveness of a policy
that is more concerned about job losses from international
trade than jobs lost from domestic competition or changing
technology; regardless of the source of the disruption the
result is the same, resources (jobs) are shuffled away from
one area of the economy to another.
Lastly, the general public is concerned about large U.S. trade
deficits. Some economists are not as concerned about the
trade deficit, although there is not the same unanimity among
economists on trade deficits as there is on the benefits of
trade.
When a country has a trade deficit it is spending more than it
has earned and has saved, so it must sell assets to foreigners
in order to spend beyond its income. A common mistake is to
treat international capital flows as though they are passively
responding to what is happening in the current account, or trade
deficit. Investors abroad buy U.S. assets not for the purpose of
financing the U.S. trade deficit but because they believe these
assets are sound investments, promising a combination of
safety and return. The U.S. has created for itself a comparative
advantage in capital markets; we should not be surprised that
investors all over the world come to buy the product. As these
investors exploit the investment opportunities offered by U.S.
financial markets, trade deficits can arise. The U.S. trade deficits
are funded by foreign savings invested in U.S. assets.
If savings in the U.S. increased, our trade deficit would decrease.

27REPS Volume 1 - Executive Summary
Viewing trade deficits as investments provides a different
way of thinking about their value.� From this perspective, the
current account (trade surplus or deficit) is the difference
between a country’s savings and investment. Savings is the
difference between what a country produces, measured as
Gross Domestic Product (GDP), and what is consumed privately
and by the government. When investment exceeds savings, a
country finances this gap by borrowing from abroad. The trade
deficit may reflect a country’s firms or government investing in
physical capital to take advantage of productive opportunities.
These investments would expand the infrastructure, build
capacity to access natural resources, and take advantage of new
technologies. By borrowing from international sources a country
can invest more without cutting current spending (consumption).
When a country repays this borrowing in the future, the trade
balance increases or becomes a surplus. The trade deficit,
therefore, may be a sign of a robust economy, increasing the
economy’s productive capacity and the unbalanced trade flows
that are vital to sustaining the economy’s expansion into the
future.
� Itisnotunusualforcountriestoborrowfromothercountriesto
makecapital investments in theircountry.TheU.S.borrowed
heavily from primarily European sources to finance the
constructionofthetranscontinentalrailroad.Norwayborrowed
heavily from foreign sources to develop its NorthSea oil
deposits.
Trade deficits are not always bad. Beneficial impacts include shifting
production to its most productive location and “borrowing from abroad”
to increase investment today that contributes to future prosperity without
reducing current consumption.


STRATEGIC GOALS AND RECOMMENDED ACTIONS


STRATEGIC GOALS AND RECOMMENDED ACTIONS
Call to Action What more can we do to re-orientate land, resources, and institutions to influence and accommodate the needs of our economy in the 21st century? The short answer is, if we want world-class companies and their high-value added job opportunities we need to provide them with access to world-class – human and physical – infrastructure and supportive, flexible public policies. In the face of intense global competition, local companies that drive economic growth are involved in an on-going revolution that is fundamentally changing how they do business. To help keep up with these changes, companies are focusing on what they do best and contracting out the rest, not necessarily by choice but in order to remain competitive. They are locating activities globally to take advantage of each region’s unique offerings, including ours. Companies increasingly look beyond their walls for resources and relationships to help them compete. Companies require access to highly skilled people and international markets, advanced telecommunication capacity, information networks, and competitively priced and reliable resources like energy and water, to be successful. This “regional infrastructure” must be quality-oriented in terms of customer satisfaction, cycle-time reduction, and as flexible as the companies it supports. Flexible, supportive public policies and world class – human and physical – infrastructure provided in a timely fashion will provide local companies with the opportunity to compete effectively in the national and global market-place. In return for these investments and support, these high value added traded cluster companies will set a robust pace for economic growth offering more high paying jobs opportunities which will boost the rate at which our standard of living has been rising.
Leadership – Rising to the Challenge How does a region go about carrying out a regional strategy? There are many answers to this question as shown by the many and varied comments we received on the Prosperity Strategy. Local leaders, both civic and public, as well as most of the Advisory Group have chosen to rely on existing organizations and agencies to implement the Prosperity Strategy’s actions. The Strategy contains a set of strategic goals, with suggested ways to achieve them, in the form of recommended actions. The agencies and/or organizations most responsible for carrying out the recommended actions are identified and encouraged to take on the responsibility of implementation and achieving results. This process ensures a broad-based collaborative approach and minimizes the problems that arise when a new organization or agency is formed to oversee the implementation of the recommended actions.
REPS Volume I 31

Performance – Measuring Our Progress This organizational structure to implement the recommended actions and move the region forward has generally proved to be successful. Since 1992 when the first Prosperity Strategy was adopted, SANDAG has been keeping track of progress, or in some cases lack of progress, as part of its implementation responsibilities, The current Advisory Group’s evaluation of the 10 recommended actions from the 1998 Prosperity Strategy concluded that significant “Reasonable Progress” had been made on five of the actions; “Little Progress” had been made on three of the actions; and “No Progress” had been made on one of the actions. One of the recommended actions contained multiple objectives and received a split score; some parts received a “Reasonable Progress” score and other parts received a “Little Progress” score. Making progress on the recommended actions illustrates the commitment and effort on the part of the many agencies and organizations involved. Significant accomplishments since 1998 include: the collaborative effort to restructure and diversify the local economy; securing and diversifying the region’s sources of water; the expansion and improved access to venture capital investment resources; and the willingness of voters in the region to tax themselves to pay for transportation infrastructure improvements. On the downside, the Advisory Group determined that little or no progress had been made in: making housing more affordable, providing for storage and disposal of hazardous waste, improving access to adequate air service capacity for passengers and cargo, and increasing processing capacity at our international land ports of entry. More information on the Advisory Group’s evaluation of the region’s progress can be found in Volume II Evaluating the Competition and Assessing Our Strategic Position. The recommendations below are focused on the economy and are not meant to be comprehensive. For a more comprehensive evaluation of the region, SANDAG has produced the Regional Comprehensive Plan, of which the Prosperity Strategy is a part. The information and recommended actions in the 2008 Prosperity Strategy will be integrated into the Comprehensive Plan when it is updated.
32 REPS Volume I

REPS Volume I 33
Strategic Goal 1 Produce a goods movement strategy for the San Diego region to improve our capability to participate in international trade, and help increase mobility for the region’s residents. Recommended Actions 1.1 Produce a goods movement strategy for the San Diego region that is integrated into
the goods movement network of Southern California and the nation to ensure that we can take advantage of the economic growth gains that flow from free trade (lead organization: SANDAG).
1.2 Develop a comprehensive plan to meet the region’s long-term air service needs,
ensuring adequate air passenger and cargo service, that can be integrated into and adopted as part of SANDAG’s Regional Transportation Plan (lead organizations: San Diego County Regional Airport Authority, SANDAG).
1.3 Increase crossing and processing capacity to reduce wait times at San Diego’s
international land ports of entry without jeopardizing security, to take advantage of the cross-border economic growth opportunities (lead organizations: Caltrans, SANDAG, San Diego Dialogue, U.S. Customs and Border Protection, Mexico’s Secretariat of Foreign Relations through the Consulate General of Mexico).
Locally, when it comes to public infrastructure and polices that would facilitate economic growth, the San Diego region is behind. Generally speaking, there are five ways to get goods, services, information, and people in and out of the region and to access global markets: through airports, water ports, rail, highways, and digital communication. Our evaluation of San Diego’s strategic position shows that we are poorly endowed in four of these five “trade”-related infrastructure categories. Currently, our best link to the increasingly global marketplace is electronic, through both wired and wireless networks. The movement of goods across international borders by air, sea, and land is anticipated to be an increasingly important ingredient for achieving economic growth and a rising standard of living for both the regional and national economies. Also imperative is the implementation of an efficient and reliable transportation system to meet the needs of our growing population and rising demand, SANDAG’s Regional Transportation Plan (RTP) lays out a plan to better connect our freeway, transit, and road networks to our homes, schools, work, shopping, and other activities, as well as offers regional transportation funding incentives to support smarter, more sustainable land use. The RTP represents a means by which the region can make bold moves and decisive actions to achieve mobility for both goods and people. The following recommended actions are designed to focus and increase our region’s access to global marketplaces and enhance mobility for all of the region’s residents. Produce a goods movement strategy for the San Diego region that is integrated into the goods movement network of Southern California and the nation to ensure that we can take advantage of the economic growth gains that flow from free trade. In the face of rising global competition and opportunities, San Diego needs a goods movement strategy that addresses how our economy can best be connected to the southern California mega-region and the global economy. Through an integrated strategy, we can better identify which infrastructure investments

will provide the greatest return in economic growth. SANDAG has completed some of this work already, producing a draft Goods Movement Action Plan under the guidance of the Freight Working Group. Following federal guidelines in the Safe, Accountable, Flexible, Efficient Transportation Equity Act – Legacy for Users (SAFETEA-LU), SANDAG is employing a systems approach to identify current and future needs for the region’s goods movement system and how these potentially separate systems can work together as one integrated system. The federal initiatives also place emphasis on planning for inter-regional and international trade corridors, identifying infrastructure requirements necessary to support both the regional and national supply chains, and preparation of a plan of finance for freight infrastructure separate from other transportation. To move toward implementation, SANDAG’s Goods Movement Action Plan needs to be completed, integrated, and adopted as part of the Regional Transportation Plan.
Develop a comprehensive plan to meet the region’s long-term air service needs, ensuring adequate air passenger and cargo service that can be integrated into and adopted as part of SANDAG’s Regional Transportation Plan. Air service is playing an increasingly important role as a facilitator of economic growth in the local and state economy. As much as 60 percent of the value of goods exported out of the state is shipped by air, much of it in the cargo bays of wide-body passenger planes. These goods represent less than one percent of the total tonnage, meaning that most products shipped by air are lightweight and high-value. Typically, the higher the value or price of a good, the greater the skill required to produce the good and the higher the wages paid to the workers. In this way, access to adequate air cargo service capacity provides an opportunity to increase the number of businesses offering mid- to high-income jobs. Today, Lindbergh Field offers limited air cargo service, shipping about half of what a comparable-sized region exports by air. An estimated 80 percent of the region’s air cargo is trucked out of the region to depart from alternative airports, adding to shipping time and exacerbating freeway congestion. As Lindbergh has experienced an increase in passengers, it has not been able to address cargo service improvements. In 2007, 18.3 million passengers utilized Lindbergh Field, a 5 percent increase from 2006. According to the San Diego County Regional Airport Authority (Airport Authority), investments in airport improvements at Lindbergh Field, such as additional gates and taxiway extensions, are needed to meet the forecast increase from 209,000 annual operations in 2004 to 300,000 annual operations expected between 2021 and 2030. The aviation activity forecast prepared by the Airport Authority shows that between 2015 and 2022, existing runway capacity at Lindbergh Field will begin to constrain growth in air traffic, and that sometime between 2021 and 2030, no further air service growth can be accommodated. The lead times necessary to plan, process and make adjustments at Lindbergh Field are significant. Immediate action is required to avoid infrastructure capacity constraints that would hinder economic growth opportunities in the San Diego region. With the failure of an advisory vote regarding joint military-public use of the Marine Corps Air Station (MCAS) Miramar, placed by the Airport Authority on the November 2006 ballot, it is of utmost importance to develop an alternative approach to meet the region’s long-term need for air service, both passenger and cargo. As part of the goods movement strategy implementation, all remaining air service options should be explored. This should include maximum utilization of Lindbergh Field and the other airports in the region—notably, air service providers in San Diego and the larger Southern California mega-region should act as a united conglomerate in order to address Southern California’s air service needs. This conglomerate should take corporate air traffic, as well as passenger and cargo, into consideration when discussing capacity, and cooperate with all airports in surrounding regions, including March GlobalPort and the Tijuana International Airport.
34 REPS Volume I

Increase processing capacity and reduce wait times at San Diego’s international land ports of entry without jeopardizing security to take advantage of cross-border economic growth opportunities. The San Diego region shares its southern border with the Municipalities of Tijuana and Tecate in Baja California, Mexico. The San Ysidro, Otay Mesa, and Tecate border crossings link this binational region and are the gateways for a growing economic relationship that provides a competitive advantage in the global economy. SANDAG and Caltrans, working together, need to complete SR 905, the principal east-west transportation link providing access to the Otay Mesa Port of Entry, and move forward on establishing a process and financial strategy to build SR 11 and a third commercial port of entry in East Otay Mesa. Both the San Ysidro and Otay Mesa ports of entry stand out compared to the rest of the United States-Mexico border crossings. The San Ysidro-Puerta México Port of Entry (POE) is the busiest international land crossing along the United States-Mexico border, if not the busiest in the Western Hemisphere. In 2005, more than 17 million private vehicles, nearly 10 million pedestrians, and more than 100,000 buses crossed at the San Ysidro POE from Mexico. The Otay Mesa-Mesa de Otay POE continues to accommodate the third-highest dollar value of trade among all southern border POEs. In 2006, this POE handled $28.6 billion worth in 1.4 million trucks that transported goods in both directions. The volume of cross-border vehicle and pedestrian crossings has been increasing, along with an increase in border delays in the last several years, especially in the northbound direction. Also, since September 11, 2001, the U.S. Customs and Border Protection has stepped up security measures at the POEs. Longer and often unpredictable waits are influencing people’s ability and desire to cross the border. Delay hinders the ability of border regions like San Diego to support the kind of businesses, such as maquiladora plants, that depend on reliable logistics for the production and distribution of traded goods. In an increasingly just-in-time economy, unpredictable wait times for trucks at the border are kinks in the supply chain that act as a deterrent to trade and the potential growth in cross-border economic investment opportunities. Cross-border traffic also generates significant income for retailers, hotels, and recreation businesses on both sides of the border. However, longer wait times discourage some from making these types of trips, further inhibiting economic growth. Inadequate infrastructure capacity, in which investments fail to keep up with the increase in trade and security requirements at the principal border crossings between San Diego County and Baja California, creates traffic congestion and delays that cost the U.S. and Mexican economies an estimated US$6 billion in foregone gross output in 2005. Fully 51,300 jobs are sacrificed because of the reduction in output. In fact, traffic congestion and delays are bad enough today that nearly 60 percent of the cross-border travelers surveyed said they would be willing to pay a $3 toll to cross at a potential new East Otay Mesa Port of Entry if it provided a faster way to cross the border. Similarly, interviews with the trucking industry revealed that investment potential has been curbed due to increasing delays at the border. Budget constraints have limited the ability for the federal government to contribute to border infrastructure needs. Where funds are available, long lead times are required between project design and funding allocation. Under these conditions, SANDAG, working together with Caltrans, the U.S. Customs and Border Protection, and representatives from Mexico, needs to pursue innovative financing mechanisms such as public-private partnerships to help fund improvements necessary to reduce border wait times. Public-private partnerships present a way to attract private capital to build needed public infrastructure. Typically these infrastructure investments depend on the ability to generate a revenue stream, such as a toll road would generate, to pay for using private sector funds.
REPS Volume I 35

This allows the public sector to build infrastructure that would otherwise not be built and pay for that infrastructure with user fees (tolls).
36 REPS Volume I

REPS Volume I 37
Strategic Goal 2 Provide an adequate supply of energy from a diverse portfolio and ensure it is delivered in a timely, reliable and competitively priced manner. Recommended Actions 2.1 Update the Regional Energy Strategy to provide the region with a clear direction and
a schedule for meeting the new energy source requirements (lead organizations: SANDAG, San Diego Gas & Electric, California Center for Sustainable Energy [formerly the San Diego Regional Energy Office]).
2.2 Monitor the State of California’s Nuclear Power Plant Assessment (AB 1632) and
similar legislation to keep informed on the role of nuclear power to meet future energy needs and advancements in nuclear technology, and waste disposal (lead organization: SANDAG).
The most recent Regional Energy Strategy (RES) was prepared by the San Diego Regional Energy Office (SDREO) and adopted by the SANDAG Board of Directors in 2003. The Strategy was incorporated into the SANDAG Regional Comprehensive Plan (RCP) in 2004. The RES describes a vision of the energy future for the San Diego region. This vision includes a reduction in energy consumed per person; use of an efficient and balanced energy supply, including renewable sources; and transmission interconnects to other regions. The Regional Energy Strategy also contains specific goals, such as targets for in-county electric power generation. Update the Regional Energy Strategy to provide the region with a clear direction and a schedule for meeting the new energy source requirements. The San Diego region should actively participate in furthering energy resource diversification, periodically review progress in meeting diversification targets, with emphasis on demand reduction and use of renewable energy as well as generation and transmission, and make such information available to the general public. A close collaboration among SANDAG, San Diego Gas & Electric (SDG&E), and the California Center for Sustainable Energy (CCSE) is necessary to achieve this goal, including addressing specific land use conflicts when siting needed energy infrastructure. The RES is an excellent forum in which to address the region’s energy policy and planning. The RES has served as the energy policy blueprint for the region, similar to the state’s Integrated Energy Policy Report (IEPR), which is prepared by the California Energy Commission (CEC). Significant changes in the energy policy landscape have occurred since the last RES plan was developed and adopted. Particularly, state minimum renewable energy requirements, climate change laws and mandates, and state priorities on conservation, energy efficiency, and clean distributed generation (such as solar panels and wind power) over large-scale fossil-fuel power plants. These changes in energy policy should serve as a framework for the update of the region’s energy plan. The decision to undertake the 2003 RES came at a time when the State of California had removed the investor-owned utilities (IOU) from long-term resource planning. As the RES was in development, the state changed course and again required SDG&E and other IOUs (Investor Owned Utilities) to conduct long-term resource planning. This resulted in two distinct energy plans for the region; the RES supplying a vision and policy direction for meeting future needs through increased renewable, distributed and energy-efficient resources, and the SDG&E long-term procurement plan (LTPP)

38 REPS Volume I
outlining how the utility will ensure adequate energy supply to meet future consumer demand and state requirements. SDG&E’s LTPP emphasizes the need for a diverse portfolio of supply- and demand-side options, as well as transmission, in order to balance lowest cost with reduced volatility and risk. SDG&E is required to update this plan every two years and should continue to seek input from SANDAG, the California Center for Sustainable Energy, and other stakeholders when planning and implementing energy infrastructure, as should SANDAG during the RES update. Due to the competing interests in this area it is essential to coordinate the two planning strategy efforts in order to reach as close agreement between the documents as possible. At the state level, the California Public Utilities Commission (CPUC) regulates the IOUs and sets requirements for achieving energy efficiency savings. The state also has assessed progress to date on meeting renewable energy requirements. The CEC’s 2006 update to the Integrated Energy Policy Report (IEPR), states that progress has been slow in achieving state- law for using renewable energy to meet 20 percent of demand by 2010 and a state goal of 33 percent by 2020. CEC reports that the three investor-owned utilities – Pacific Gas and Electric, Southern California Edison, and SDG&E – have entered into contracts for nearly 4,000 megawatts (MW) of renewable capacity. However, only 242MW of those contracts represent new facilities that are on-line and delivering electricity at this time. To meet the goal of 20 percent by 2010, the investor-owned utilities will need to add 1,500MW of renewable generating capacity. Only one percent of SDG&E’s purchases came from renewable resources in 2002. Since that time, SDG&E has increased its percentage of energy obtained from renewable resources, reaching 5.2 percent in 2005. Much more progress must be made to meet the 20 percent goal by 2010. In addition to in-region renewable power, the options for achieving state renewable energy requirements include upgrading existing transmission lines, siting of new lines, utilizing lines currently used predominantly for fossil-fuel based power, or a combination of the above. SDG&E has proposed to the CPUC that the Sunrise Power Link transmission line be built to address the region’s renewable power needs. During its review of the Sunrise Power Link, the CPUC conducts assessments of the proposed line, as well as alternate scenarios for meeting the region’s needs for power. The CPUC expects to make a final determination on the Sunrise Power Link in January 2008. In light of the state law requiring renewable energy to meet 20 percent demand by 2010, the region must continue to aggressively pursue viable options for renewable energy wherever possible. According to SDG&E, peak demand for energy will continue to grow at an estimated rate of about 100 megawatts (MW) per year. Even after state-mandated energy efficiency programs, demand-reduction programs, and implementation of the California Solar Initiative, the energy needs of the region will require significant investment in additional local power plants and transmission lines. Monitor the State of California’s Nuclear Power Plant Assessment (AB 1632) and similar legislation to keep informed on the role of nuclear power to meet future energy needs and advancements in nuclear technology, and waste disposal. SANDAG should keep abreast of the CEC’s assessment of the state’s two nuclear power plants, Diablo Canyon and the San Onofre Nuclear Generating Station. The assessment will examine the effects of major disruptions to the two power plants, including a seismic event or plant aging, as well as costs and impacts of accumulating spent nuclear fuel. The assessment will also evaluate major issues related to the future role of nuclear power plants in the state. SANDAG should also monitor the U.S. Department of Energy’s research and development on next-generation nuclear technology and waste disposal. Some energy experts indicate that reduced dependence on foreign oil as well as clean energy must involve increased use of nuclear energy, while ensuring safe disposal of nuclear waste. Implementing any nuclear program would require a focus and reliance on scientific data in an effort to achieve ambitious energy goals.

REPS Volume I 39
Strategic Goal 3 Provide an adequate supply of water from a diverse portfolio and ensure it is delivered in a timely, reliable and competitively priced manner. Recommended Actions 3.1 Implement the long-range plan for water source diversification adopted by the San
Diego County Water Authority (CWA) to ensure reliable sources of water for the region (lead organization: CWA).
3.2 Local, state and federal elected officials should consider creating a statewide
competitive water market to help provide a more reliable service without affecting water rights (lead organizations: local, state and federal elected officials).
3.3 Undertake cooperative programs to increase water conservation and acceptance of
100 percent of reclaimed water for domestic use to help the region meet its goals of water source diversification (lead organizations: CWA, local water districts, local jurisdictions).
3.4 Assess the need to integrate potential effects of global climate change in planning for
the region’s future water supply to better prepare the region for those effects (lead organizations: CWA, research institutions at local universities).
Of the 645,000 acre-feet (AF) of water consumed in the service area of San Diego County Water Authority (CWA) in 2005, approximately 79 percent was supplied by the Metropolitan Water District (MWD). Since 1990, CWA has imported from 75 to 95 percent of the region’s water supply from MWD (CWA, Regional Water Facilities Master Plan, 2004). A key goal of the CWA and also of the 1998 Prosperity Strategy recommendation is to diversify the sources of water used in the service area, which accounts for most of the San Diego region. Continued and cooperative efforts will be necessary to implement the goals of water source diversification. The 2003 water transfer agreement between CWA and the Imperial Irrigation District (IID) secured a key alternative source of water, which will account for 22 percent of water used in the service area by 2020. Additionally, supplies from CWA’s All American Canal Lining and Coachella Canal Lining projects will account for nine percent of the region’s supply by 2020. However, in order to meet the region’s growing demand for water and also to maintain diverse sources of supply, additional work is needed to increase reclamation (or reuse), seawater desalination, and conservation. The San Diego region has already made substantial investment in water reclamation. The City of San Diego has constructed two reclamation facilities – North City Water Reclamation Plant (NCWRP) and South Bay Water Reclamation Plant (SBWRP). NCWRP has capacity to produce up to 24 million gallons per day (MGD) of recycled water, but existing beneficial reuse, consisting mostly of irrigation and some industrial purposes, total only about 6 MGD (City of San Diego, Water Reuse Study [2006]). The SBWRP produces from five to six MGD of recycled water that is then disposed through the ocean outfall, without application for domestic or industrial reuse. Thus, although the region has substantial capacity to produce recycled water with adequate quality, actual demand for recycled water has not matched that capacity. None of the recycled water is currently used as potable water, due to lack of public acceptance.

The following actions are recommended to further diversify water supply for the region. Implement the long-range plan adopted by the San Diego County Water Authority to ensure reliable sources of water for the region. The San Diego County Water Authority (CWA) has prepared the 2005 Urban Water Management Plan, which identifies a diverse mix of water resources to be developed over the next 25 years. CWA should implement the goals of this plan, with periodic updates to respond to changing conditions. Local, state and federal elected officials should consider creating a competitive water market within the state the state to help provide a more reliable service without affecting water rights. In order to complement the CWA’s short term management plans, local, state, and federal elected officials should consider creating a competitive water market within the state. A water market would need to consider water resources throughout the state, including the Central Valley Project, which is currently controlled by the Federal Government, preventing the state from considering a statewide water policy. For example, the Central Valley Project is not willing to equally share in the burden of reducing water supplies to their primarily agricultural customers over the coming year should the drought continue, forcing other users of the state’s system to absorb a greater share of the possible cutback. Greater control of our state’s water supply combined with a flexible water market that can be tapped into during water shortages would help water authorities throughout the state, such as CWA, provide a more reliable service. A water market would enable owners of water rights, primarily in agricultural areas, to sell water to other users, primarily in urban areas, at a market-determined price. From a broad economic perspective, transferring water from agricultural to urban use may make sense. Agricultural production in the state consumes between 50 and 70 percent of the water and contributes between 2 and 6 percent to the state gross product. Transfer agreements, such as those established by the CWA and the Imperial Irrigation District (IID) attempt to increase economic return from water use. However, they reflect economic goals of only the agencies directly involved in the transaction, not of the other water suppliers and consumers in the state. A statewide water market would likely provide a more efficient mechanism for allocation among users. One possible outcome from installing a competitive water market in the state may be that water suppliers would have a choice on how to use their water “rights”, choosing, for example, between growing water intensive crops like cotton, alfalfa and rice or selling it on the market to urban users. Today this choice cannot be made because of restrictions on the consumption of water. Undertake cooperative programs to increase water conservation and acceptance of 100 percent of reclaimed water for domestic use to help the region meet its goals of water source diversification. Unlike the IID Transfer Agreement, actions to secure additional local sources of water, particularly conservation and domestic use of reclaimed water, will require cooperation of water users (households and businesses), local water agencies, and local jurisdictions. That is, future success in the diversification of water sources will require concerted action by the region’s public and private organizations, as well as the CWA. In particular, substantial effort will be needed to obtain public acceptance of recycled water as an additional source of domestic potable water, as was successfully implemented in Singapore. Currently, a substantial portion of the reclaimed water processed by the MWD is never utilized. Instead, it is pumped back into the general wastewater lines where it is run through treatment processes again at the Point Loma water treatment facility, and disposed of in the Pacific Ocean. This represents a waste of water and the energy used to process and pump it. The San Diego region needs
40 REPS Volume I

REPS Volume I 41
to take whatever measures necessary to ensure that 100 percent of the reclaimed water that is processed is utilized in an effective manner – it’s too expensive to reclaim it and then dispose of it into the Pacific Ocean. Assess the need to integrate potential impacts of global climate change on the region’s water supply to better prepare the region for those effects. Scientific studies indicate that global climate change – or even cyclical changes in climate – could severely affect the availability and quality of the water supply in the southwestern United States. The CWA and research institutions in the region need to conduct appropriate studies to monitor the potential effects of global climate change on the region’s future water supply and quality.


REPS Volume I 43
Strategic Goal 4 Reserve prime employment land (existing and vacant) for light industrial and research and development uses and establish a redevelopment process that would renew and retain existing industrial lands for similar uses in the future. Recommended Actions 4.1 Update the Employment Lands Inventory and request that all jurisdictions keep the
on-line inventory up-to-date to maintain timely and accurate data on land availability (lead organizations: SANDAG, local jurisdictions).
4.2 Identify vacant lands to be reserved for future non-retail employment use, specifically
light industrial and research and development, to provide an opportunity for growth in our region’s traded employment clusters (lead organizations: local jurisdictions, economic development agencies/organizations).
4.3 Adopt local land use policies to reserve developed prime industrial land and establish
an industrial land redevelopment process to retain the integrity of its clustered location and its productive and market value (lead organizations: local jurisdictions).
4.4 Identify compatible areas for potential co-location or co-development of jobs and
housing to clarify where this should occur and where it should not occur (lead organizations: SANDAG, local jurisdictions).
The San Diego region has a limited supply of prime industrial land, which is suitable for immediate development or redevelopment for employment use, while traded cluster industries, many of which are in high technology sectors such as biotechnology and communications, require space for expansion or for start-up operations. A 2001 study by SANDAG and the San Diego Regional Economic Development Corporation found that of the nearly 15,000 acres of designated employment land in the region, only 1,420 acres were immediately available for development. Vacant employment lands are also being developed at a faster rate than they are being made ready for use. Between 1995 and 2000, 3,196 acres of employment land were developed in the region, while only 1,040 acres were added to the inventory. The shortage of employment land is affected by the rapid rise in housing prices, creating incentives for landowners to convert land designated for non-residential to residential uses. An example of a pro-active policy to reserve the supply of prime industrial land is the City of San Diego’s “Economic Prosperity Element” of the General Plan. This element proposes to reserve “prime industrial land,” which supports employment in traded cluster industries, and provides guidelines for the conversion or co-location of compatible development on such land. Other cities in the region should consider and adopt similar policies. The following actions are recommended to assure that land suitable for the region’s key cluster industries will remain available. Update the Employment Lands Inventory and request that all jurisdictions keep the online inventory up-to-date to maintain timely and accurate data on land availability. SANDAG should update its previous work on the Employment Lands Inventory, prepared with input from local

44 REPS Volume I
jurisdictions and intended to provide information on the type and location of available lands ready for development, particularly for light industrial and research and development use. Local jurisdictions should provide at least quarterly information on changes in existing and planned land use which will be incorporated into the updated Employment Lands Inventory. Identify vacant lands to be reserved for future employment use, specifically light industrial and research and development, to provide an opportunity for growth in our region’s traded employment clusters. Local jurisdictions, economic development agencies, and organizations need to identify vacant lands in their community to be reserved for future employment use. Adopt local land use policies to reserve developed prime industrial land and establish an industrial land redevelopment process to retain the integrity of its clustered location and its productive and market value. Local jurisdictions should adopt policies to reserve developed prime industrial and R&D land from being converted to non-employment uses, except in context of compatible co-location. Such policies may be incorporated in local General Plans, zoning ordinances, or land development policies. Identify compatible areas for potential co-location or co-development of jobs and housing to clarify where this should occur and where it should not occur. Local jurisdictions need to identify areas appropriate for co-location or co-development of jobs and housing where such uses may complement and further the objectives of smart growth policies. SANDAG has found that from 80 to 85 percent of employment land uses are compatible with housing. SANDAG should build on this finding and work with local jurisdictions to identify potential areas for co-location and incorporate them in the Regional Comprehensive Plan.

REPS Volume I 45
Strategic Goal 5 Provide for the timely delivery of housing units sufficient to stabilize prices. Recommended Actions 5.1 Plan for the expeditious construction of residential units in Smart Growth
Opportunity Areas identified in SANDAG’s Regional Comprehensive Plan by pre-approving residential projects in order to meet market demand in a timely manner and increase the efficiency of capital used for new development (lead organizations: local jurisdictions and SANDAG).
5.2 Reform the state-local government fiscal relationship to help achieve sound, balanced
and sustainable growth (lead organizations: local jurisdictions and SANDAG). A shortage in the supply of housing units has contributed significantly to high home prices, which are a major impediment to economic growth and prosperity in the San Diego region. Between 1990 and 2004, new housing unit construction did not keep pace with population growth in San Diego. Less than 15 percent of homes sold during 2004 were affordable to households earning the median income1. In contrast, over 43 percent of homes sold during 1998 were affordable to median-income households. The availability of affordable housing is important to a region’s quality of life. High and unaffordable housing prices force the region’s residents to spend more of their household budget on housing, leaving less available for discretionary spending. Lack of affordable housing makes it difficult to retain and recruit new workers to the region. Higher housing prices typically translate into higher land values, increasing the pressure to convert limited, important industrial and R&D lands to residential use. Lack of affordable housing also leads to urban sprawl and longer commuting distances, straining infrastructure as residents seek less expensive housing in outlying areas. Without change, these past trends are expected to continue. For example, SANDAG’s most recent Regional Growth Forecast, based on the existing General Plans of the Cities and County of San Diego, show that, between 2004 and 2030, some 93,000 households with workers in San Diego County will find homes in Riverside and Imperial Counties and in Baja California. If these trends are allowed to continue unabated, what will look like a transportation problem in 2030, will actually be a housing problem that could have been prevented. Traditional “subsidy” approaches such as reducing development impact fees, mandating inclusionary housing, and providing density bonuses have proven to be woefully inadequate to solve the housing affordability problem. What is required is a market-based solution that provides for the opportunity to increase the supply of “market-priced” housing in a timely manner. Yet, we must be realistic; even with this proposed change, it will also be necessary for the region to work closely with its neighbors to the north, east, and south to meet the transportation needs of those who choose to live outside the region and travel to the San Diego region for work, recreation, and other activities. SANDAG is participating directly in these broad solution strategies, first by creating the Smart Growth Incentive Program, and second by addressing the issue of interregional commuting in its Regional Transportation Plan.
1 Locally, the median price of homes sold peaked in early 2006 and have since fallen (through the end of 2007, the most recent data available).
The fall in the median price of homes sold, after adjusting for structure type (attached and detached units) and square footage has been about 5% annually; insufficient to have much impact on the affordability index.

Each of the proposed recommended actions is more fully discussed below. Plan for the expeditious construction of residential units in Smart Growth Opportunity Areas identified in SANDAG’s Regional Comprehensive Plan by pre-approving residential projects in order to meet market demand in a timely manner and increase the efficiency of capital used for new development. Increasing the supply of housing as the demand rises is the most effective way to moderate the rapid rise of home prices. Local jurisdictions can undertake advanced planning and impact analysis of new housing in their Smart Growth Opportunity Areas (SGOAs), even before private landowners submit development proposals, in effect pre-approving the opportunity for development to occur. The development proposals would be consistent with approved plans and current environmental review. The change would be to allow for the product (housing units) to be supplied quickly, as the demand is increasing, keeping the otherwise upward pressure on prices in check. An initial step in this direction has been undertaken by SANDAG’s Regional Comprehensive Plan (RCP), which identifies potential SGOAs with access to transit and major transportation corridors. These SGOAs are where the region’s collective General Plans call for growth to occur first and they are areas that can best support increased housing density. In other words, through our regional planning process our jurisdictions have identified where they would prefer growth occur, now our jurisdictions should first, remove as many hurdles and obstacles that would keep them from achieving their objectives and second, promote this outcome by pre-approving development through a master planning process. To encourage and support this change, SANDAG’s TransNet Smart Growth Incentive Program provides funding for infrastructure improvements in the SGOAs. In addition, SANDAG’s Smart Growth Opportunity funding could be utilized to aid in off-setting the costs imposed upon the jurisdictions from the developmental pre-approval process. In addition to reducing the upward pressure on home prices and encouraging growth to occur where we are planning to accommodate it so growth can help improve the urban character of communities, streamlining the development and regulatory process would also free up financial resources to fund additional development, provided the market demand had not been fully met. The quicker a developer can plan, construct, and sell a unit, the faster those funds can be reinvested to develop additional units to meet the market demand and limit upward pressure on prices. Implementation of this strategy will require a cooperative and concerted effort by all local jurisdictions, the development industry, and non-profit organizations to encourage and facilitate construction of high-density, primarily attached housing units and the required infrastructure improvements and public services. Reform the state-local government fiscal relationship to help achieve sound, balanced and sustainable growth. One reason for the lack of housing supply in the region is that local jurisdictions are reluctant to approve new residential development, particularly in urbanized areas, due to inadequate tax revenues. Since the passage of Proposition 13 in 1978 and subsequent decisions by the state to reserve large portions of property tax revenues for public schools, local jurisdictions receive only a small portion of those revenues, which by themselves are now inadequate to pay for the provision, maintenance and upkeep of the many public facilities and services expected by residents. Without sufficient funding to pay for these public facilities and services, existing residents believe that these new units and people reduce their quality of life. Accordingly, jurisdictions have little incentive and constituency support to approve new, especially high-density, housing developments whose primary revenue contribution is the property tax, and to prefer land uses that
46 REPS Volume I

REPS Volume I 47
generate revenues, such as retail sales taxes and transient occupancy taxes, and have far less of a need for new and improved public facilities and services. Many cities employ aggressive practices against their neighbors in order to attract retail developments, but they do not display similar aggressive practices to attract new housing, even amidst housing shortages. The current tax system is thus an impediment to the development of sustainable communities. It restricts the freedom of local jurisdictions to manage their own affairs. It impedes residential construction and encourages cities to compete with each other for the weakest contributors to economic prosperity: retail establishments and hotels. If the government is going to “incentivize” land use decision-making, as its fiscal polices are de facto doing for retail development and hotels, the incentives should be consistent with overall goals and objectives, such as making workforce housing available and affordable. At a minimum, local jurisdictions, working through associations such as the League of California Cities, need to work with the state to “equalize” the impacts from the “fiscalization of land use” in order to make cities fiscally neutral, less biased, in the choice between land use for retail/ hotels or housing units.


REPS Volume I 49
Strategic Goal 6 Prepare the labor force to be competitive for jobs created by the San Diego economy and better able to adapt to changing work and skill requirements. Recommended Actions 6.1 Connect school district databases regionwide to track and assess student performance
to better ensure a match between education and skill requirements and attainment (lead organizations: San Diego County Board of Education and all school districts in the region).
6.2 Explore new approaches to providing education and training opportunities to workers
employed by temporary staffing agencies to improve the efficiency and effectiveness of job turnover and transition (lead organizations: San Diego Workforce Partnership and temporary staffing agencies).
6.3 Develop programs to prepare older workers for the opportunity to remain actively
employed (lead organizations: community colleges and university extension programs).
A region’s economic prosperity depends foremost on the availability of a knowledgeable and skilled workforce. Keeping our region competitive in the global economy requires that our workers have the education, training and skills to be competitive in the global marketplace. The San Diego region will experience major changes and shifts in its population over the next 30 years, which in turn will affect its labor force. We are growing and are expected to add nearly one million people; we are becoming more ethnically diverse – the Hispanic and Asian populations will nearly double, and the non-Hispanic White population will shrink by more than one percent; our median age is increasing and we are living longer – the number of seniors will double, and the number of octogenarians will nearly triple; and an increasing number of us are using temporary employment agencies to find jobs throughout our careers. The following recommended actions are intended to develop and increase the productivity of the region’s human capital. Connect school district databases regionwide to track and assess student performance to better ensure a match between education and skill requirements and attainment. We live in an increasingly knowledge-based economy where disparities in education and training are likely the most significant, long-term cause of income inequality. Our region’s demographic changes, in both size and diversity, bring with them challenges. One of the most threatening trends, locally and statewide, is the potential mismatch between the skill and knowledge requirements of the new economy and the amount of education its future population is likely to have. For example, our economy continues to shift to service-oriented industries whose workers are at least twice as likely as a manufacturing employee to have graduated from high school. In fact, the fastest growing service-oriented industries have the highest share of employees with college degrees. The problem is that education trends locally and statewide are not keeping pace, and this trend is expected to worsen because projected population growth is concentrated among groups that have typically attained lower levels of education or inadequate skills.

50 REPS Volume I
Reversing this trend will test the public’s commitment to education. As a first step, to help establish accountability, school districts in the San Diego region need to collaborate to create a database to track and assess individual student performance. A regional, computerized database that is diagnostic and performance-based can be designed to keep track of what works and what does not work. A centerpiece of this diagnostic database should be accurate middle and high school student drop-out rates. Explore and test new approaches to providing education and training opportunities to workers employed by temporary staffing agencies to improve the efficiency and effectiveness of job turnover and transition. The growing importance of temporary staffing agencies in the region’s economy presents an opportunity to promote education and training of workers, who are looking for work, changing jobs or considering changing careers or industries. Temporary staffing agencies’ detailed knowledge of the market’s demand for people and skills can be combined with public and non-profit organizations’ programs for general education and worker training, not only to help supply workers with the needed knowledge and skills, but also to help individual workers adjust to a changing market. A pilot program should be developed to test the viability and effectiveness of this strategy. As a way to organize the pilot program, the San Diego Workforce Partnership could use its career centers to establish a close working relationship with temporary staffing agencies. Develop programs to prepare older workers for the opportunity to remain actively employed. Between 1990 and 2000, the median age of San Diego’s population increased from 31 to 33.2 years. By 2030, SANDAG’s Regional Growth Forecast projects that the median age will increase to 38.9 years. An aging population requires special services, such as health care, and reduces the need for services for the young, such as primary education. It is anticipated that many workers reaching retirement age will in fact remain in the workforce, although they may do so in different capacities or even in different industries. As part of this effort our region should monitor labor force trends to assess the possibility of a shortage as the post WW II baby boom population begins to retire in 2010. Implementation of this action should come from the education community, led by the community colleges and Workforce Partnership, identifying challenging trends, as well as strategies and programs that provide opportunities for older workers who wish to remain in the labor force to acquire new skills or to apply their current skills to new tasks.

REPS Volume I 51
Strategic Goal 7 Increase the facilities and resources necessary to provide region-wide opportunities for all children to receive preschool education. Recommended Actions 7.1 Implement a universal preschool education program in San Diego County to help
increase the educational success rate of each child (lead organization: San Diego County Office of Education).
7.2 Pursue a legislative program to qualify military families for state-subsidized preschool
programs in order to expand the reach of current preschool opportunities in the state and the region (lead organization: current supporters of AB 170 [Saldaña], including the San Diego Unified School District (sponsor), San Diego County Office of Education, and San Diego Regional Chamber of Commerce).
Many studies have shown the economic benefits of investment in preschool education. For example, a 2005 study conducted by RAND estimated that investment required to make preschool available to every 4-year-old in California would generate $2 to $4 in benefits for every dollar spent. The benefits identified by the study include reduced need for special education, less grade repetition in K-12, less youth and adult crime, and a more productive workforce. High quality preschool education represents one of the best opportunities for investment in human capital. However, enrollment in preschool education has been limited both in this region and elsewhere, due to lack of facilities, qualified teachers, and funding. Among 25 comparative metro areas, San Diego ranks 18th in the proportion of 3- and 4-year-olds enrolled in nursery or preschool in 2000. San Diego’s proportion declined slightly between 1990 and 2000 (to 58.4 percent), while that of the nation increased (to 64.4 percent). Implement a universal preschool education program in San Diego County to help increase the educational success rate of each child. The San Diego County Office of Education (SDCOE) should continue its efforts in advocating an increase in preschool enrollment and identifying resources to be applied to this goal. The SDCOE should investigate methods to standardize the content of publicly funded preschool learning experiences. The intent of this recommendation is to provide public preschool opportunities that co-exist with privately funded options, thus setting 100 percent enrollment as the metric for success. The San Diego County Preschool for All Draft Master Plan was approved in December 2005 and was developed with funds from the David and Lucille Packard Foundation and the First 5 Commission of San Diego. The draft Master Plan outlined the guiding principles toward achieving preschool for all, identified barriers to achieving the goal, and tasked itself to find strategies to address those issues. The San Diego County Office of Education is currently working collaboratively with the First 5 Commission of San Diego to provide free, voluntary, quality preschool in six local communities. This effort should be continued and expanded. The First 5 Commission of San Diego is responsible for allocating San Diego County's Proposition 10 funding. Proposition 10, also known as the California Children and Families Act of 1998, added a tax to tobacco products to fund programs promoting the health and well-being of children from prenatal to age five. The funding is granted to local agencies for programs such as parenting education, stipends for childcare providers, health and developmental assessments, and school readiness programs in communities with low performing schools. The Preschool for All initiative falls under the banner of school readiness.

52 REPS Volume I
Despite the acknowledged benefits of preschool education, lack of funding is the primary impediment to increasing enrollment. Although public funding would make economic sense, because of a high benefit-cost ratio, it is likely that a variety of sources will be required, including charitable contributions and the participation of businesses and nongovernmental organizations. Pursue a legislative program to qualify military families for state-subsidized preschool in order to expand the reach of current preschool opportunities in the state and the region. The San Diego Unified School District (SDUSD), along with other named supporters, should continue to support proposed legislation (AB 170, Saldaña) to expand the reach of current preschool opportunities by amending existing regulations for providing state funds. Currently, many military families are not eligible for state-subsidized preschool if their Basic Housing Allowance (BHA) is paid directly to private property managers providing on- and off-base housing. In this situation, the BHA is calculated as income and places many military families above the income ceiling for free state preschool. If the BHA is paid through traditional military-run programs, the allowance is not considered income. The non-traditional payment of BHA to private property managers denies subsidized preschool to military families who had previously qualified for these services. The Saldaña measure would exclude the BHA when determining eligibility for state preschool in an amount equivalent to the lowest allowance rate for the military housing area in which the individual lives. The San Diego region’s public and private organizations, including the San Diego County Office of Education and the San Diego Regional Chamber of Commerce, should provide additional support to this legislation. This issue could be addressed concurrent with or prior to implementing the larger agenda of the Strategic Goal, achieving a universal preschool education program in the region.

REPS Volume I 53
Strategic Goal 8 Reduce the public costs imposed on businesses and assure that activities funded by public expenditures meet their objectives and are efficiently and effectively implemented. Recommended Actions 8.1 Establish a competitive bidding and contracting process for providing public services
modeled on the California Performance Review and the City of San Diego’s managed competition initiative in order to ensure services are provided in a cost-effective manner (lead organizations: local jurisdictions).
8.2 Explore and implement alternative ways for meeting public facility and service
standards to minimize the need for raising taxes to pay for new infrastructure (lead organizations: major infrastructure and service providers in the region, including SANDAG, Caltrans, San Diego County Water Authority and water districts, San Diego Gas & Electric, and the San Diego County Regional Airport Authority).
8.3 Improve the linkage between infrastructure investments and SANDAG’s Regional
Comprehensive Plan to achieve regionwide smart growth goals and objectives (lead organizations: SANDAG, Caltrans, and other infrastructure providers in the region, such as the San Diego County Water Authority, the San Diego County Regional Airport Authority, the San Diego Unified Port District, and San Diego Gas & Electric).
Upon his election, Governor Schwarzenegger called for an exhaustive audit of state operations to uncover waste, fraud, and abuse. He also called for a transformation of state to return power and authority to the residents of the state. As a way to act on these assertions the Governor produced the California Performance Review (CPR) to examine state operations and recommended reforms. Locally, City of San Diego Mayor Jerry Sanders led a successful effort to get city residents to vote for a managed competition initiative to help provide cost effective public services. As the CPR report points out, increasing the performance of government is difficult. Leon Panetta, who served California and the nation in Congress, and later as director of the Office of Management and Budget and as President’s Clinton’s Chief of Staff, offered the following remarks on implementing CPR: “My experience is that nobody in any bureaucracy likes to change their turf. That is just a hard reality. If change happens, it occurs in one of two ways. It happens by crisis, which we saw with 9/11 – we would not now have a Homeland Security Agency if not for that event. Or it happens by leadership.” With his advice in mind, and using the CPR as a guide for identifying possible statewide initiatives to reform and improve government programs, actions, and effectiveness, the following recommended actions were developed. Establish a competitive bidding and contracting process for providing public services modeled on the California Performance Review and the City of San Diego’s managed competition initiative, to help ensure public services are provided in a cost-effective manner. Many governments – including the State of California and the City of San Diego – have recognized that introducing competition into providing external services (to residents and taxpayers) and internal services (to city departments) is an effective strategy for improving quality and productivity. Using market forces to improve the bottom line recognizes that most public service agencies operate as monopolies – exclusive providers of the services. For example, when service

agencies have the authority to set policy and service standards, they tend to adopt standards favoring themselves over their customers. Separating responsibilities for delivering services from setting procurement standards helps to prevent this conflict. Implementation of this action at all levels of government will provide the public with the confidence that the public sector has a way to judge the efficiency and reliability of the services and to choose the most cost-effective provider. Neither the public nor the private sector is innately more efficient and reliable than the other, but competition will bring out the best in both to serve the customer: residents of the San Diego region. Explore alternative ways to meet public facility and service standards to minimize the need for raising taxes to pay for new infrastructure. Some long-time Californians call for a return to the state’s “golden era” of major infrastructure investment, which has had a lot to do with shaping California. Many believe that, historically, the state’s prosperity is due to the state’s vision and commitment to build three grand systems: aqueducts, highways, and universities. The systems were, and still are, the cornerstones of the state’s economy and society. Traditional supply-side infrastructure planning made sense in the 1950s when these sectors were in their infancy, California was growing rapidly, and there was a broad consensus supporting growth. But today, the atmosphere has changed. Not all citizens view the state’s economic and demographic growth as desirable. State and local residents resist building to meet projected demands of a growing population on at least two grounds: they don’t want their taxes raised, and they don’t want facilities built in their backyards. In short, the context in which the state and regions plan and fund capital infrastructure investments is vastly different now than during the eras of former Governors Earl Warren and Pat Brown. Most infrastructure agencies do not explore alternative forms of service delivery or identify non-capital alternatives for meeting future needs. Strategic infrastructure planning poses some basic questions, such as: Are there ways to meet infrastructure needs without investing in new capital equipment? For example, is the only way to accommodate more roadway trips to widen existing or build new freeways? It may be possible to manage the demand for existing infrastructure in ways that encourage its most efficient use and thereby minimize the need for new investment. This sort of demand management contrasts with traditional planning approaches, which focus almost exclusively on increasing the supply of infrastructure. Generally, supply-oriented planning forecasts infrastructure needs based on per capita estimates of consumption. These per capita estimates, in turn, are based on historic patterns of infrastructure use. Demand management, in contrast, begins with consumers’ willingness, and ability, to pay for services. It recognizes that the demand for infrastructure is dynamic, and it seeks to control the key drivers of that demand using a variable price mechanism to make the most efficient use of existing resources. This strategy can best be implemented by the major infrastructure providers, applying non-traditional strategies of meeting demand, including adding managed lanes to our roadway system that employ dynamic pricing to improve mobility by efficiently allocating capacity. Improve the linkage between infrastructure investments and SANDAG’s Regional Comprehensive Plan to achieve regionwide smart growth goals and objectives. Our region spends billions annually to maintain, operate, and construct infrastructure facilities. Given the amount of money we invest annually on infrastructure, expenditure plans should be consistent with the overall long-term vision or strategic plan for supplying and delivering services. Today, however, most infrastructure planning is done without a coordinated “vertical” or “horizontal” framework that prioritizes and synchronizes the annual expenditures of capital improvement programs to meet the goals of the longer-term strategic plans that form the basis of facility master plans. With notable exceptions, most infrastructure programming and planning is not coordinated or prioritized with
54 REPS Volume I

REPS Volume I 55
respect to regional plans. A broader prioritization of infrastructure expenditures requires that a regional framework be established, based on regionwide goals, such as those contained in SANDAG’s Regional Comprehensive Plan, that can be incorporated into and addressed as part of the evaluation of infrastructure projects. Local jurisdictions, acting together as SANDAG, have endorsed and adopted resolutions of support for an urban form that channels much of the region’s future growth into existing urban (primarily incorporated) communities, preserving and protecting the lifestyle and sensitive environment of our rural (primarily unincorporated) areas. For example, over time, if the RCP’s goals and objectives are implemented, an increasing proportion of the growth will occur as redevelopment and urban infill. To adequately prepare for this change, the urban form and design goals in the RCP should be universally embraced to help ensure that infrastructure is in place prior to or concurrent with the land use decisions that implement the urban form goals. Major transit infrastructure investments, for example, need to be supported by land uses that can provide the ridership to justify the investment. Public-private partnerships should be considered as one way to achieve these goals.
In this way, strategic planning and visioning drive the capital decision making process. In the absence of a unified strategic vision, the budget process paints a large part of the “big picture” for infrastructure planning by default. Each infrastructure provider develops its own vision of the region’s future from various board actions, administration edicts, and overall climate of opinion and builds its capital budget from individual construction project proposals. This project-based budgeting, using an annual snapshot or limited horizon, attempts to replace the big picture.


REPS Volume I 57
Strategic Goal 9 Continue and expand our collaboration with communities in the Southern California Mega- Region to solve infrastructure issues. Recommended Actions 9.1 Coordinate future improvements in infrastructure systems, such as air transportation,
land ports of entry, water supply, and energy delivery with communities in the Southern California Mega-Region (lead organizations: local jurisdictions, special districts, water, air and energy service providers, SANDAG, State of California).
9.2 Encourage our region’s elected representatives to actively promote free trade and
help achieve fast and secure movement of people and goods across international borders (lead organizations: San Diego Regional Economic Development Corporation, San Diego Regional Chamber of Commerce, San Diego World Trade Center, SANDAG).
Nearly 200 years ago, economist David Ricardo demonstrated the benefits of trade through the principle of comparative advantage and gains in economic growth that can flow from trade through the application of “exchange” and “specialization.” The benefits from trade are as valid today as they were 200 years ago. The underlying point for economists is that free trade stimulates economic growth, usually by increasing productive resources and/or inducing technological change. In practice, these increases are triggered by the spur of competition when countries liberalize trade. The principle of comparative advantage, implemented through exchange and specialization, is the same whether the trading partners are individuals, cities, counties, states, or countries. In other words, would our lives be better if each of us individually grew all of our food, made all of our clothes, pumped and refined all of our oil and gas, built our own houses, and made all of our own movies? These are rhetorical questions, but the point is that pure self-sufficiency is a recipe for a “Stone Age” standard of living. Instead, to improve our standard of living we “trade” our output for the goods and services that we are not especially adept at producing, and the result is a higher standard of living for all involved. The natural competitive advantages of the San Diego region and the legacy of advanced research institutions and the businesses that have developed around them have, thus far, succeeded in providing substantial economic benefits to the region, even in the absence of strong institutional support. As other regions and nations have taken proactive measures to attract high-skill and high value-added industries, it is clear that the San Diego region must also invest more of its public and private resources toward supporting these industries. To assume that San Diego’s research institutions and industries can maintain their leadership roles unaided in a global economy is to risk possible erosion and a slower growth in the region’s standard of living, and neglects to acknowledge the critical role they play in securing future prosperity. The goals and actions outlined in this section address the region’s specific and immediate needs to improve and make use of its competitive advantages. However, it must also be recognized that these actions cannot be pursued in isolation. Public and private organizations in the region must cooperate to resolve problems in housing and public finance. The region as a whole must collaborate with its neighbors to the north, east, and south to address issues of the wider Southern California mega-region. These issues include transportation, water, energy, and environmental protection. Finally,

both the region and its neighbors must proactively engage in the global economy, reducing barriers to trade and realizing the gains from increasing the movement of people and goods across international borders. Work with San Diego County’s regional neighbors to coordinate improvements in infrastructure systems, such as air transportation, land ports of entry, water supply, and energy delivery. One way in which globalization has affected economic competition is the scale at which regions make use of their resources and respond to the global market. In the past, a region such as San Diego’s represented a reasonably self-contained economic unit, which could compete with similar regions in the nation. Now, resources of a much larger area, called a mega-region, are needed to compete effectively. The San Diego region already relies upon its neighboring regions for access to international markets, water supply, electricity, and environmental protection. Thus, interregional cooperation is a key ingredient of several strategic goals and recommended actions noted above, including preparation of a goods movement strategy (Strategic Goal 2), securing a balanced and diverse portfolio of energy supply (Strategic Goal 3), and continued effort for diversification of water sources (Strategic Goal 6). Some of the most successful local initiatives to date are based on interregional collaboration. The 2003 Colorado River Quantification Settlement Agreement (among the San Diego County Water Authority (CWA), Coachella Valley Water District, Imperial Irrigation District (IID), Metropolitan Water District, and the U.S. Department of the Interior) provided the State (and its water users, including the San Diego region) a transition program to implement water transfer and supply programs. A key component of this arrangement is the agreement between CWA and the IID by which the San Diego region will have access to 200,000 acre-feet of Colorado River water per year for 75 years. Interregional approaches exist for other issues, notably energy, where additional transmission capacity could substantially increase access to energy from renewable sources generated outside the region. In the future, disposal of hazardous waste and possibly municipal waste may also require cooperation of neighboring regions. SANDAG has taken steps to increase interregional cooperation through the work of its Borders Committee, which brings together representatives from Imperial, Orange, Riverside and San Diego Counties and Baja California, Mexico, to explore common issues, such as jobs and housing, transportation, energy and water supply, the environment, economic development, and border crossing/security. SANDAG and the Western Riverside Council of Governments (WRCOG) have also established the I-15 Interregional Partnership (I-15 IRP) to study coordinated solutions to transportation corridor improvements, housing supply, and economic development. Encourage our region’s elected representatives to actively promote free trade and help achieve fast and secure movement of people and goods across international borders. San Diego’s future economic prosperity is becoming increasingly tied to globalization and the worldwide integration of markets, labor migration, and investment. Although foreign trade policies are generally set at the federal level, their effects are regional. As San Diego is part of the southern California mega-region, global trade is becoming an increasingly larger part of our economy. Of the nation’s imports, 43 percent of all container goods and 12 percent of all imports from Mexico flow through southern California’s land and sea ports. Trade through the San Diego Customs District totaled nearly $40 billion during 2004. The growth in trade has been rapid; between 1991 and 2004 exports rose by 142 percent and imports increased by 259 percent, far outpacing the 50 percent growth of San Diego’s gross regional product (a measure of the total value of goods and services produced in the region).
58 REPS Volume I

REPS Volume I 59
Economists have had 200 years to explain the benefits of free trade to the public; however, there are significant public reservations concerning these benefits. Public surveys have shown that the discussion regarding the benefits of free trade needs to shift to jobs and production and away from the consumption aspects, that is, away from stressing that trade allows consumers to buy more and varied goods at lower prices. Business and trade advocacy groups and organizations such as the San Diego Regional Economic Development Corporation, the San Diego Regional Chamber of Commerce, and the San Diego World Trade Center are best able to implement this recommended action. To build broad public support for free trade it may be necessary to broaden the topics discussed, for example: linking labor and environmental issues with trade negotiations. Other areas include multilateral negotiations to deal with investment policy, competition policy, electronic commerce, and better enforcement of intellectual property rights.


REPS Volume I 61
Strategic Goal 10 Monitor and report on the region’s progress in meeting the challenges and goals identified in Evaluating the Competition and Assessing our Strategic Position and San Diego’s Regional Economic Prosperity Strategy. Recommended Actions 10.1 Conduct periodic updates of both the evaluation of current conditions and the
recommended strategies to achieve economic prosperity, to provide elected officials and community leaders with information to help them make informed decisions and take actions to address our future challenges (lead organization: SANDAG).
10.2 Review monitoring efforts conducted by SANDAG and other organizations for
additional information, insight, and directions for future action to identify opportunities for collaboration and coordination (lead organization: SANDAG).
The objective of these strategic actions is to measure progress toward meeting the regional goals with respect to standard of living, income, education, infrastructure investment, and other indicators of economic prosperity. To this end, SANDAG should undertake the following actions: Conduct periodic updates of both evaluation of current conditions and the recommended strategies to achieve economic prosperity, to provide elected officials and community leaders with information to help them make informed decisions and take actions to address our future challenges. As it has done in the past, SANDAG should periodically update the evaluation of San Diego’s economic condition and prosperity, review progress toward goals identified in the Regional Economic Prosperity Strategy, and revise or identify new goals and actions as necessary. In these future updates, SANDAG should solicit input from a broad range of public and private organizations engaged in regional economic development. Review monitoring efforts conducted by SANDAG and other organizations for additional information, insight, and directions for future action to identify opportunities for collaboration and coordination. The Regional Economic Prosperity Strategy should also review other evaluation and monitoring studies conducted by SANDAG and others, such as Indicators of Sustainable Competitiveness, prepared in association with the San Diego Regional Economic Development Corporation. SANDAG should continue annually updating the Regional Comprehensive Plan Monitoring Report. Started in 2006 with a “baseline” study, the Monitoring Report provided a baseline and indicator analysis by which to measure the region’s performance toward RCP implementation. Several of the indicators in the Monitoring Report overlap indicators from the Prosperity Strategy. Although these studies emphasize different perspectives extending beyond economic issues, they provide valuable insight into the status of the region and its future direction. In addition to these activities, the San Diego Regional Economic Development Corporation (EDC) is launching the “Partnership for the Global Economy,” which will bring an essential and valuable private-sector perspective to region-wide planning, providing input from those who make critical decisions on where their companies will locate and expand. The current initiative builds upon a highly successful initiative in 1999 that helped to catalyze the regional focus on creating the Rady School of

62 REPS Volume I
Management at UCSD, High Tech High, and other K-12 investment initiatives, capital formation initiatives now led by BIOCOM and CONNECT, and the EDC’s leadership on TransNet, which has added more than $14 billion of future funding for the region’s transportation infrastructure. SANDAG should strongly support the Partnership for the Global Economy and use its outcomes to augment San Diego’s Regional Economic Prosperity Strategy.

STRATEGIC ASSESSMENT SYSTEM


REPS Volume I 65
STRATEGIC ASSESSMENT SYSTEM
A major component of this report is a framework for measuring progress and comparing the San Diego region against similar competitive places. A vast array of information is available to benchmark and assess ourselves against our competitors for the purpose of identifying the challenges and opportunities facing the San Diego region. Perhaps the most difficult task is organizing the information so it portrays the big picture. Who is the competition? How do we stack up against them? What are the region’s assets? Where do we need to improve? What investments do we need to make today to be healthy and prosperous tomorrow? Are our goals realistic in terms of available resources? What additional resources are needed in order for the region’s goals to be achieved? For the San Diego region, these questions were addressed in terms of the following groups of issues and statistical indicators:
1. How well is the region performing?
2. How well are the businesses in the region faring?
3. What resources are available to support the region’s future economic and social well being?
4. What is the capacity of the region’s infrastructure to ensure its economic and social well being in the future?
For each group, the following data were examined. First, the San Diego region was compared to 24 other metropolitan areas, selected on the basis of comparable population size and demographic and economic characteristics. Second, historical changes in the San Diego region were compared to changes in California and the U.S. And, third, additional data were collected for the San Diego region to provide a closer look at the issues as they have emerged in the region. Detailed discussion of indicators is contained in the companion volume to this report (Evaluating the Competition and Assessing our Strategic Position). The following provides a summary of the evaluation, with focus on selected issues.


Indicator Group 1. Economic and Social Performance Population and Employment. The growth rate of San Diego’s population is declining. As a result, the population is becoming older, and the newer residents, whether from natural growth or from in-migration, are more diverse in racial and ethnic composition than the older residents. An aging population requires special services, such as health care, and reduces the need for services for the young, such as primary education. Growth of the Hispanic population accounts for nearly 80 percent of total regional population growth, creating new opportunities for businesses. Increasing diversity in the workforce requires additional investment in education and training. San Diego’s workforce population has historically responded to changing economic conditions through migration. New workers have migrated to the region during times of economic growth. And many workers have left the region during times of slow growth or contraction. Mobility of the labor force has been important in maintaining jobs-workforce balance in the region and its relatively low unemployment rate. While the cumulative increase in the region’s population since 1990 has not kept pace with corresponding increases in California and the nation (Figure 1), the increase in the region’s civilian employment has exceeded those of the state and the nation (Figure 2). This is due in part to the fact that a larger proportion of the region’s residents are seeking work, but also reflects the out-migration of workers who now commute to San Diego region from other areas, such as Riverside and Imperial counties. There is thus a growing imbalance between the region’s need for workers and the opportunities to find suitable housing in the region.
REPS Volume I 67

Figure 1 San Diego’s Rate of Population Growth has Declined Relative to That of California and the United States
0%
4%
8%
12%
16%
20%
24%
1990 1991 1992 1993 1994 1995 1996 1997 1998 1999 2000 2001 2002 2003 2004
United StatesCaliforniaSan Diego
Source: U.S. Census Bureau, Population Estimates Program, Population Division
Figure 2 San Diego’s Growth in Civilian Employment has Exceeded
That of California and the United States
-5%
0%
5%
10%
15%
20%
25%
1990
1991
1992
1993
1994
1995
1996
1997
1998
1999
2000
2001
2002
2003
2004
United States CaliforniaSan Diego
Source: U.S: Bureau of Labor Statistics, Downloaded File: Labor Force Statistics from the
Current Population Survey. California and metropolitan areas: Bureau of Labor Statistics, Downloaded File: Local Area Unemployment Statistics.
68 REPS Volume I

Wages and Income. In nominal, or current dollar, terms, wages and per capita personal income (PCPI) in San Diego appear to be increasing as fast as, or faster than, wages and income in California and the U.S. However, there has been some erosion in the growth of real average wage and PCPI due to a higher local rate of inflation. On a broader scale, the slight increase in wage inequality appears to be following a similar trend that is occurring nationwide. Among the 24 metro areas selected for comparison, San Diego ranks 8th in per capita personal income (see Figure 4). However, since 1970, the cumulative growth in real PCPI in the region, after adjusting for inflation, is around 30 percent (Figure 5), less than cumulative increases for both the state (38%) and the nation (62%). Average Wage and Cost of Living. A characteristic which stands out is the region’s high cost of living, which more than offsets its high per capita personal income. The high living cost, due in large part to the high cost of its housing, reduces the purchasing power of its residents’ wages and income, particularly in comparison to other metropolitan areas. Figure 4 shows that, with respect to average wage per job, San Diego ranks in the middle of the range of metro areas. San Diego, however, has one of the highest living costs, as measured by income required to maintain the same standard of living as elsewhere in the nation. When average wage is adjusted to reflect this ‘standard’ income, the region ranks last in terms of wages per cost of living (Figure 3).
Figure 3 San Diego has the Lowest Average Wage Per Job,
When Adjusted for Cost of Living
Wage Per Job Cost of Living Wage Per Job/Cost of
Living
San Jose, 1
Riverside, 20
Dallas, 1
Highest
Lowest
San Diego, 9
San Diego, 20
SanFrancisco,1
San Diego, 3
Dallas, 20
Source: Bureau of Economic Analysis; CNNMoney.com (data provided by ACCRA)
REPS Volume I 69

Figure 4 San Diego has a Relatively High Level of per Capita Personal Income
San Diego, 8San Diego, 8San Diego, 8
1990 1995 2003
San Francisco, 1
San Francisco, 1
San Francisco, 1
Salt Lake City, 25
Riverside, 25 Riverside, 25Lowest
Highest
Source: Bureau of Economic Analysis
Figure 5 San Diego Lags Both California and the United States in
Cumulative Growth of Real per Capita Personal Income Since 1970
0%
10%
20%
30%
40%
50%
60%
70%
1970
1972
1974
1976
1978
1980
1982
1984
1986
1988
1990
1992
1994
1996
1998
2000
2002
San DiegoCaliforniaUnited States
Source: Bureau of Economic Analysis
70 REPS Volume I

Indicator Group 2. Business Vitality It is somewhat easier today than during the early 1990s to conclude that the San Diego region has a very dynamic and vibrant economy with significant growth potential. During the first half of the 90s decade our region, as well as most of southern California, was mired in the worst economic recession on record, a downturn that broke records dating back half a century and created doubt about our future prosperity. The businesses and industries once responsible for initiating economic growth were being replaced; our defense and manufacturing businesses employ about half the number of workers today as they did at the end of the 1980s and all four of the financial institutions that had their corporate head quarters here have disappeared. Looking back we now see that our region was caught up in a turbulent restructuring of the local economy, a dynamic that continues today as our economy grows and its job base diversifies. In light of the changes that have occurred to the businesses that make up our regional economy, the evaluation is focused on how existing and new businesses are faring. The reason for this focus is straight forward: most of a region’s economic growth comes from “home grown” entrepreneurs and businesses, not from outsiders. Much of the diversification of our economic growth during the 1990s has been traced to local sources, small business start ups and expansions from companies with local ties. Gross Regional Product. Gross regional product (GRP) is the most comprehensive measure of business activity in a state or region. Average gross regional product per person, or per capita GRP, in San Diego in 2004 ($47,172) was higher than both per capita gross state product (GSP) of California ($42,727) and per capita gross domestic product (GDP) of the U.S. ($39,588). San Diego’s per capita GRP also ranks high among comparable metropolitan areas — 4th among 25 metros in 2004. Between 1990 and 2004, San Diego region’s real total GRP grew 43 percent. This growth exceeded that of the state (40%) and the U.S. (35%) over the same time period. However, the growth has not kept pace with population, resulting in a decline in San Diego’s per capita GRP relative to that of the state and the nation. Gross regional product can also be considered as a measure of output by the region’s workers. When GRP is divided by the number of workers in the region, the resulting ratio represents average output per worker. Since output per worker is a measure of labor productivity, it can be compared to average wage per worker. That is, in order to raise wages, it is first necessary to raise productivity. The San Diego region has one of the highest ratios of output per worker to wages when compared against other similar regions. In 2004 San Diego’s average output per worker ranked the 5th highest whereas average wage per worker ranked 12th. The region produces more per dollar paid in wages than all its peers except Houston, Texas. This combination (high ratio of output per worker to wage per worker) results in the 2nd highest difference between productivity and wages of $51,586 per worker and output per worker, with nearly 225 percent above the average wage rate in the region (Figure 9). Thus, while GRP is a comprehensive measure of the region’s economic activity, it must be considered in conjunction with wages received by workers, as well as the distribution of such wages between high- and low-wage industries.
REPS Volume I 71

Figure 6 San Diego Ranks High Among Comparable Metro Areas
in Terms of Gross Regional Product per Capita
1990 1997 2004
SanFrancisco, 1 San Jose, 1
Miami, 25 Miami, 25 Miami, 25
Lowest
HighestSan Francisco, 1
San Diego, 3 San Diego, 3 San Diego,
Source: Economy.com; SANDAG
Figure 7 San Diego has Recently Lagged California and the United States
in the Growth of Real Gross Regional Product per Capita
-2%
1%
4%
7%
10%
13%
16%
19%
22%
1990 1991 1992 1993 1994 1995 1996 1997 1998 1999 2000 2001 2002 2003 2004
San DiegoCaliforniaUnited States
Source: Economy.com; SANDAG
72 REPS Volume I

Figure 8
San Diego has the Second Highest Gap Between Gross Regional Product per Worker and Average Wage per Worker
Among Comparable Metropolitan Areas
0 20,000 40,000 60,000 80,000 100,000 120,000
California
United States
Miami
Washington
Boston
Baltimore
San Jose
Kansas City
Virginia Beach
Salt Lake City
Minneapolis
Orlando
Austin
Tampa
Pittsburgh
Portland
Phoenix
Las Vegas
Atlanta
Denver
Dallas
Seattle
Riverside
San Francisco
Sacramento
San Diego
Houston
Average Wage Gross Regional Product
Source: Economy.com; Bureau of Economic Analysis
Note: Metro areas are arranged in order of decreasing difference between output per worker and average wage per worker. California and the United States have not been sorted by this difference.
REPS Volume I 73

Job Quality. Though San Diego has a relatively high level of economic output, as measured by gross regional product, real average wage in the region, adjusted for inflation, has not kept pace with the state or the nation. Compared to the level attained in 1970, real average wage in San Diego has declined by nearly 5 percent, while that in the nation increased by 15 percent and the state, by 10 percent (Figure 9). In addition to declining real average wage, the region has also experienced an unbalanced growth in job quality, adding fewer jobs in sectors with higher wages and many more jobs in sectors with lower wages. When industries are ranked according to average wage, slightly less than 300,000 jobs with the lowest average wages in 1990 accounted for 20 percent of the total aggregate payroll in the region, while 88,600 jobs with the highest average wages also represented 20 percent of total payroll, resulting in a ratio of 3.5 to 1 in terms of lower-wage jobs to higher-wage jobs (Figure 10). This ratio has increased to 4.4 to 1 in 2004. From 1990 to 2004, the increase in the number of jobs with the lowest average wages (110,500 jobs), accounting for 20 percent of the region’s total payroll, was 24 times that of increase in the number of jobs with the highest average wages (4,600 jobs) (Figure 11). The substantial increase in lower wage jobs has been assisted by strong public policy and investment, targeting industries such as tourism, entertainment, the uniformed military, and retail trade, without compensating investments for high value-added industries. Part of the reason for declining average wage is due to the loss of defense and manufacturing jobs in the region since 1990. Manufacturing’s share of total non-farm employment fell from 12.8 percent in 1990 to 8.3 percent in 2004, while professional and business services increased its share from 12.8 percent in 1990 to 16.3 percent in 2004.
Figure 9 San Diego’s Real Average Wage per Job Since 1970
has Lagged That of California and the Nation
-30%
-20%
-10%
0%
10%
20%
1970
1971
1972
1973
1974
1975
1976
1977
1978
1979
1980
1981
1982
1983
1984
1985
1986
1987
1988
1989
1990
1991
1992
1993
1994
1995
1996
1997
1998
1999
2000
2001
2002
2003
2004
United StatesCaliforniaSan Diego
Source: Bureau of Economic Analysis, Regional Economic Information System, Local Area
Personal Income, Table: CA34
74 REPS Volume I

Figure 10 Average Wage of Industries in Top 20 Percent of Total Payroll is Three and
One-Half Times the Average Wage of Industries in Bottom 20 Percent
$0
$20,000
$40,000
$60,000
$80,000
$100,000
$120,000
1990 1995 2000 2004
Ave
rage
Wag
e (R
eal 2
004
Dol
lars
)
Industries With Highest Average Wages Representing 20% of Total PayrollIndustries With Lowest Average Wages Representing 20% of Total Payroll
Source: Bureau of Labor Statistics, Quarterly Census of Employment and Wages; SANDAG
Figure 11 Job Increase in Industries With the Bottom 20 Percent of Total Payroll Since 1990 Is 24 Times the Job Increase in
Industries With the Top 20 Percent of Total Payroll
0
50,000
100,000
150,000
200,000
250,000
300,000
350,000
400,000
450,000
1990 1995 2000 2004
Num
ber o
f Job
s
Industries With Highest Average Wages Representing 20% of Total PayrollIndustries With Lowest Average Wages Representing 20% of Total Payroll
Source: Bureau of Labor Statistics, Quarterly Census of Employment and Wages; SANDAG
REPS Volume I 75

Traded Clusters as Engines of Economic Growth. Businesses in industries that compete nationally and internationally drive the regional economy’s economic growth and have far greater long-term growth potential. These are called traded cluster industries. Because the cluster industries compete at a national and global level, their opportunities for growth are not constrained by the size of the local market, and they can expand far beyond it. Firms in traded clusters compete nationally and globally, hence they must continuously “innovate” their products or services to remain competitive. In economic terms, innovation can refer to technological advancement, or to the process by which companies create new economic value by using resources more effectively. At one time, businesses did compete on what economists call factor costs (e.g., labor, land, capital, and infrastructure) and the firm with the lowest factor costs won. But as the rock poet Bob Dylan noted, “The times they are a-changing.” In today’s economy, globalization allows these traded cluster firms to source their factors from international markets and to locate their production and service activities “off-shore.” Our ability to initiate economic growth is dependent on the health of these traded, or export oriented, industries. Without healthy clusters of export-oriented businesses, the rest of our region’s economy – retail, services and government – cannot prosper. More importantly, the key to balancing our job growth, rebuilding our middle class jobs, and raising our standard of living, is the expansion of high value-added employment opportunities in the clusters of businesses that make our export-oriented industries. The San Diego region has 16 traded clusters with a total of 320,067 local jobs in 2005 (Figure 12). These cluster jobs represent one-quarter of the region’s total employment. On average, cluster jobs pay higher wages ($51,018) than the regional average ($43,801) (Figure 13). Companies within traded clusters tend to be among the region’s leaders in research and development funding, patent awards, and other key indicators of innovation. Many of the clusters also pay high wages, although some do not. All traded clusters are economic drivers for the region because they are export-oriented. A complete list and discussion of the clusters can be found on page 46 and 47. Although all traded clusters generate revenues for the region, not all clusters provide high living standards. The largest cluster, Entertainment and Amusement, pays the lowest average wage, $16,143 per year, or about one-third of the regional average. Clusters with the highest average wages, such as Communications and Software represent relatively small proportions of overall employment. The challenge for the region is to encourage the growth of higher-wage clusters and reduce dependence on lower-wage clusters for economic growth. Of the 16 clusters identified for the San Diego region, eight may be classified as high technology clusters: Biomedical Products, Biotechnology & Pharmaceuticals, Communications, Computer & Electronics, Defense and Transportation Equipment, Design, Environmental Technology, and Software. Employment in these clusters totaled 124,669 persons, representing 9.7 percent of 1,282,100 non-farm employment in San Diego in 2005 (California Employment Development Department, Industry Employment). Wages in the eight high technology clusters averaged $82,437, about 62 percent higher than the average wage for the 16 traded clusters ($51,018) and nearly twice as high as the average wage in the region as a whole ($43,801). Thus, high technology clusters help raise the region’s standard of living, and public policy and investment should be directed to helping those clusters grow.
76 REPS Volume I

REPS Volume I 77
Figure 12 San Diego has a Diverse Group of Traded Clusters
Defense2%
Biotechnology & Pharmaceuticals
2%
Entertainment & Amusement
8%
Travel & Hospitality
3%
Financial Services3%
Communications2%
Other RegionEmployment
ClusterEmployment
25% OtherClusters
5%
Computer &Electronics
1%
Source: SANDAG; California Employment Development Department; Bureau of Labor
Statistics
Figure 13 San Diego’s Traded Clusters Generally Pay Wages
Higher Than the Regional Average of $43,801
$16,143
$22,647
$30,185
$32,183
$51,904
$53,400
$61,831
$65,050
$70,321
$71,185
$73,103
$78,826
$80,022
$82,011
$27,798
$112,825
$0 $20,000 $40,000 $60,000 $80,000 $100,000 $120,000
Entertainment and Amusement
Fruit and Vegetables
Travel and Hospitality
Horticulture
Specialty Foods
Recreational Goods
Publishing
Design
Biomedical Products
Environmental Technology
Defense
Financial Services
Computer and Electronics
Biotechnology and Pharmaceuticals
Softw are
Communications
2005
2001
Source: California Employment Development Department; SANDAG

ENGINES OF GROWTH CLUSTER DEFINITIONS,
EMPLOYMENT, AND WAGES
The San Diego region has 16 clusters with a total of 320,067 local jobs in 2005. These cluster jobs represent one-quarter of the region’s total employment. On average, cluster jobs pay higher wages ($51,018) than the regional average ($43,801).
BIOMEDICAL PRODUCTS
In 2003, San Diego region institutions (both public and private) received more than a billion dollars in funding from the National Institutes of Health (NIH). Only Boston and New York City received more health research funds, demonstrating San Diego’s position as one of the nation’s premier research locations.
The Biomedical Products cluster consists primarily of products for surgical, medical, dental, and laboratory applications. In the San Diego region there also is a great deal of research in the Biomedical cluster. One change from prior years is that Electromedical Apparatus Manu-facturing is now included in the Computer and Electronics cluster, due to its buyer-supplier relationships with that cluster.
The Biomedical Products cluster has 7,500 employees. The average wage for employees in this cluster is roughly $65,000.
BIOTECHNOLOGY AND PHARMACEUTICALS
The San Diego region is a national leader in total venture capital funding received by local companies. Since 2000, more than one third of the region’s venture capital funds received have gone to Biotechnology and Pharmaceuticals companies.
Also, as noted above, San Diego region institutions lead the nation in federal research funding received for Biotechnology and for Biomedical Products. Not surprisingly, the region has a strong concentration of jobs in the general Research and Development (R&D) industry, and more than half of the region’s R&D jobs are in Biotechnology. In addition to research, this cluster also includes the manufacture of medicinal and diagnostic substances.
The Biotechnology and Pharmaceuticals cluster has 21,800 employees. The average wage for employees in this cluster is about $80,000.
COMMUNICATIONS
San Diego’s Communications cluster includes equipment manufacture, communications service, and research and development. The region is home to both globally recognized wireless communications companies as well as dozens of small companies (50 or fewer employees). The region attracts a significant amount of venture capital for telecommunications, accounting for roughly 10 percent of local venture capital funding since 2000. In 2004, the region also received one of only 27 competitively-awarded Technology Opportunity Program research grants from the National Telecommunications and Information Administration.
The Communications cluster has nearly 25,500 em-ployees. The average wage for employees in this cluster is nearly $112,900, the highest of all clusters.
COMPUTER AND ELECTRONICS
The Computer and Electronics cluster in San Diego is largely composed of manufacturing industries. San Diego computer and electronics companies attracted more than half a billion dollars in venture capital funding since 2000.
The Computer and Electronics cluster has about 15,400 employees. The average wage for employees in this cluster is just over $78,800.
DEFENSE AND TRANSPORTATION EQUIPMENT
Given San Diego’s large military presence, it is no surprise that the region has a thriving Defense and Transportation Equipment cluster. This cluster is evolving over time, as shipbuilding takes on increasing significance and aircraft manufacturing declines in local importance.
The Defense and Transportation Equipment cluster has 20,300 employees. The average wage for employees in this cluster is $71,200.
DESIGN
The Design cluster is a branch of what was formerly known as “Business Services.” This newly defined cluster incorporates the design principles required for architec-ture, engineering, interior, industrial, and graphic design.
The Design cluster has 6,500 employees. The average wage for employees in this cluster is just over $61,800.
ENVIRONMENTAL TECHNOLOGY
The Environmental Technology cluster relates to those industries that improve environmental conditions – either through the manufacture of analytical or cleaning equip-ment, or through design and consulting services – both indoors and out.
The Environmental Technology cluster has slightly more than 13,700 employees. The average wage for employees in this cluster is about $70,300.
78 DRAFT REPS Volume I

DRAFT REPS Volume I 79
ENTERTAINMENT AND AMUSEMENT PUBLISHING
The Entertainment and Amusement cluster reflects San Diego’s international reputation as a tourist destination. At the heart of this industry are local attractions, such as Balboa Park with its museums and the zoo. The cluster also includes other recreational attractions, such as athletic activities, theatre, and dining.
San Diego’s Publishing cluster includes traditional book printing and publishing as well as periodical, directory, and other publishing activities. Several publishers in the region have ties with other clusters. For example, local companies publish materials for the Defense and Transportation Equipment cluster. There also are local publishers that specialize in sports and recreation publications, which ties in with the region’s Entertain-ment and Amusement and Recreational Goods clusters.
The Entertainment and Amusement cluster has just under 104,400 employees, by far the largest cluster in the region. The average wage for employees in this cluster is $14,600, the lowest of all clusters. This reflects the generally low wages of many food service jobs.
The Publishing cluster has 4,000 employees. The average wage for employees in this cluster is approximately $53,400.
FINANCIAL SERVICES RECREATIONAL GOODS Financial Services includes banking and lending institu-
tions, as well as investment services. While the Financial Services sector is not generally thought of as a venture capital magnet, the San Diego region has been awarded more than $100 million in venture funding for Financial Services since 2000.
Recreational Goods is the only single-industry cluster in the region. With an extraordinarily high concentration of golf club, surfboard, and other recreational goods manu-facturers in the region, it is clear that this industry is a highly export-oriented economic driver.
The Financial Services cluster has about 36,300 em-ployees. The average wage for employees in this cluster is just over $73,100.
The Recreational Goods cluster has about 3,200 em-ployees. The average wage for employees in this cluster is about $51,900.
FRUIT AND VEGETABLES SOFTWARE San Diego produces roughly half of the nation’s avocados. (California produces approximately 90 percent of the nation’s avocado crop by volume, and San Diego produces about half of that.) Thus, it is no surprise that the region has a strong fruits and vegetables cluster.
The region attracts a significant amount of venture capital for software development. Since 2000, San Diego region software companies have been awarded nearly $700 million in venture capital funding. The region’s software cluster includes software programming services as well as software publishing and computer training. Other regional specialties include citrus and other fruits
and vegetables. The market value of all fruits and vegetables produced in the region was $260 million in 2002. The Fruit and Vegetables cluster includes these farming production activities as well as related farm services and fruit and vegetable canning.
The Software cluster has 14,000 employees. The average wage for employees in this cluster is $82,000.
SPECIALTY FOODS
San Diego, in part as a result of its geographic location, has regional specializations in the production of foods such as tortillas and seafood. Those industries, combined with other food processing industries, form the Specialty Foods cluster.
The Fruit and Vegetables cluster has 3,700 employees. The average wage for employees in this cluster is approximately $22,600.
HORTICULTURE The Specialty Foods cluster has 3,800 employees. The average wage for employees in this cluster is just under $32,200.
More than three quarters of the poinsettias in the nation come from San Diego. While this is but one example, it clearly demonstrates San Diego’s preeminence in the field of horticulture. In 2003, San Diego County accounted for more than four percent of the nation’s and 20 percent of the state’s sales of nursery products, amounting to $616 million. Likewise, San Diego accounts for 20 percent of the state’s greenhouse square footage.
TRAVEL AND HOSPITALITY
With over 26 million total visitors and 15 million overnight visitors in 2003, San Diego’s Travel and Hospitality industry thrives. These visitors spent an estimated $5 billion in the county in 2003. Local hotels and transportation services, which accommodate these visitors, account for the bulk of the Travel and Hospitality cluster. Local convention bureaus, travel agents, and tour operators round out the cluster.
Nursery and Tree Production and Floriculture Production are thriving industries in the region. Those, along with their supporting industries, make up the Horticulture cluster.
The Horticulture cluster has 6,500 employees. The average wage for employees in this cluster is nearly $30,200.
The Travel and Hospitality cluster has 33,500 employees. The average wage for employees in this cluster is nearly $27,800.

International Trade and Goods Movement. In 2004, exports through the San Diego Customs District totaled $14 billion, and imports totaled $25.5 billion, for a combined total of $39.5 billion in goods movement. In real 2004 dollars, exports and imports through San Diego increased by 142 percent and 259 percent, respectively, between 1991 and 2004. In comparison, exports and imports through all California’s ports increased 20 percent and 96 percent, respectively. Nationally, exports and imports increased by 40 percent and 118 percent during the same period (Figure 14). The trade flows through the San Diego Customs District are dominated by transactions with Mexico. Most of the products are transported by trucks and pass through the Port of Entry at Otay Mesa. In 2004, this POE handled $22.2 billion worth of goods in both directions that were transported by more than 1.4 million trucks. Minority- and Women-Owned Businesses. In San Diego, and generally in California, minority populations are rapidly growing. Compared to 24 other metropolitan areas, San Diego ranks 4th in proportion of business firms with employees which are owned by Hispanics (6.5%), 7th in proportions of firms owned by Asians (8.8%), 14th in proportion of business firms owned by women (16.9%), and 18th in proportion of firms owned by Blacks (1%). Proportions of San Diego’s firms with employees and owned by Hispanics, Blacks and women are small, particularly when compared with the proportions of the region’s population who are Hispanic (27%), Black (6%), or women (50%), according to the 2000 Census. Between 1997 and 2002, minority- and women-owned firms with employees have increased in proportion to all businesses with employees, with the exception of Hispanic-owned firms (Figure 15). This runs counter to the increasing proportion of Hispanic population in the region.
80 REPS Volume I

Figure 14 San Diego’s Growths in Exports, Imports, and Gross Regional Product
0%
100%
200%
300%
400%
500%
1991 1992 1993 1994 1995 1996 1997 1998 1999 2000 2001 2002 2003 2004
ExportsImportsGross Regional Product
Source: US Census Bureau; Bureau of Economic Analysis
Figure 15 Hispanic-Owned Businesses in San Diego Have Declined as
Proportion of all Businesses with Employees Since 1997
1997
1997
1997
1997
2002
2002
2002
2002
0%
5%
10%
15%
20%
Asian Black Hispanic Women
Source: U.S. Census Bureau, Economic Census (1997 and 2002)
Note: Only businesses with employees are shown.
REPS Volume I 81

Venture Capital Investment. Venture capital investment is a key ingredient in the San Diego region’s business vitality. Traditionally, banks provided much of the capital needed by business for start-up or expansion. However, after the consolidation of the banking industry, no banks are headquartered in San Diego, limiting the opportunity for entrepreneurs to create relationships with lending institutions that are invested in the local community. Venture capital investors represent an important alternative source of funds, at least for firms in key cluster industries, to fund research, development, and investment. The San Diego region attracts a large amount of venture capital. Between 1995 and 1998, growth in venture capital investment in the San Diego region generally matched that of the state and the nation. There was an explosive growth in 1999 and 2000, followed by a substantial decline in 2003 and an increase in 2004. Between 1995 and 2004, the real value of venture capital invested in the region increased by 260 percent, substantially more than the growth experienced in the nation as a whole (100%) (Figure 16). However, there is substantial volatility in the volume of venture capital deals in San Diego. The volume declined from $1.5 billion in 2001 to $782 million in 2003, and then rose to nearly $1.2 billion in 2004. This volatility comes from both national economic changes and local companies’ ability to attract funds, limiting the extent to which the region can rely on venture capital as a consistent source of investment financing. Biotechnology firms received the greatest share (35%) of venture capital invested in San Diego between 1995 and 2004, followed by software (14%), telecommunications (9%), and semiconductors (7%) (Figure 17).
82 REPS Volume I

REPS Volume I 83
Figure 16 The Growth of Venture Capital Funding in San Diego Since 1995
has Exceeded Growths in California and the Nation
0%
200%
400%
600%
800%
1000%
1200%
1995 1996 1997 1998 1999 2000 2001 2002 2003 2004
San DiegoCaliforniaUnited States
Source: Price-Waterhouse-Coopers/Moneytree; Thompson Venture Economic
Figure 17 Biotechnology and Software Industries Receive the Largest Shares of Venture Capital Funding
35%
3%
7%14%
9%
32% Biotechnology
Medical Devices
Semiconductors
Software
Telecommunications
Other
Source: Price-Waterhouse-Coopers/Moneytree; Thompson Venture Economics


Indicator Group 3. Resources for Economic Growth This is an assessment of the region’s capacity for economic growth and the critical resources that people in the San Diego region will draw upon for prosperity and growth. Issues include the population’s level of educational attainment and the supply and affordability of housing in the region, measured by housing construction, housing density, and the share of homes sold in an area that could be purchased by a family earning the median income. Education. The quality of a region’s current and future labor force is a fundamental factor that influences its standard of living. The San Diego region has been following state and national trends in both the percent of adults aged 25 and older who have completed high school and those who have completed college. Across the nation, the proportion of the population aged 25 and older who have completed high school or more rose to 80.4 percent in 2000, from 75.2 percent in 1990. In 2000, the San Diego region’s high school completion rate was 82.6 percent, two percentage points higher than the national rate, and nearly six percentage points higher than California’s rate of 76.8 percent. San Diego’s college completion rate in 2000 also was higher than the state’s and the nation’s, though the difference is much less, 29.5 percent versus 26.6 and 24.4 percent, respectively. In 2000, among 22 metro areas for which data are available, San Diego ranked 16th in proportion of its adult population with a high school diploma and 9th in proportion of adult population with a Bachelor's degree or higher (see Figure 18). Average educational attainment in San Diego is thus comparable to the nation, the state, and other metro areas, without any clear advantage. At the beginning of the education process, San Diego ranks low (18th out of 25 metro areas; see Figure 19) and below the U.S. average in the proportion of 3- and 4-year-olds enrolled in a nursery or preschool in 2000. Between 1990 and 2000, San Diego’s proportion of 3- and 4-year-olds enrolled in early childhood education programs fell from 59.9 percent to 58.4 percent; while the nation’s proportion increased from 61.4 percent to 64.4 percent. Although there is no standard definition of “preschool” education, according to the National Center for Education Statistics, there are several common definitions of what constitutes preschool. These include pre-kindergarten programs serving mostly 3- or 4-year-old children and programs providing non-parental care and education of children in a nonresidential setting.
REPS Volume I 85

Figure 18 San Diego has a Relatively High Proportion of Persons 25 and
Over with a Bachelor's or Higher Degree
1990 2000 2004
Las Vegas, 22
Better
Worse
San Diego, 10San Diego, 8
Washington DC, 1 San Francisco, 1
Tampa, 17
San Francisco, 1
San Diego, 9
Las Vegas, 22
Source: U.S. Census Bureau, 1990 Summary Tape File 3 (STF 3); Census 2000 Summary File 3
(SF 3); 2004 American Community Survey
Figure 19 San Diego has a Relatively Low Proportion of
its 3- and 4-Year-Olds Enrolled in Nursery or Preschool
1990 2000
Washington DC, 1 Atlanta, 1
Las Vegas, 22 Las Vegas, 22
Better
Worse
San Diego, 16San Diego, 18
Sources: U.S. Census Bureau, 1990 Summary Tape File 3 (STF 3); Census 2000 Summary File 3
(SF 3); 2004 American Community Survey.
Note: "Better" represents higher percentage of the population enrolled in nursery or preschool.
86 REPS Volume I

Housing. A shortage in the supply of housing units has resulted in high home prices, which are a major impediment to greater economic prosperity in San Diego region. Lack of affordable housing diminishes the quality of life for local residents by forcing them to spend more of their household budget on housing, leaving less available for discretionary spending. Primary cause of high housing prices is lack of housing supply. Since 1998, total housing stock in the region increased by less than 8 percent, while total number of jobs increased by 14 percent (Figure 20). Among 22 comparable metros for which data are available, San Diego ranks last in affordability of owner-occupied homes in 2003, measured by the share of homes sold that could be purchased by a family earning the median income (Figure 21). Only 11.1 percent of the units sold would have been affordable to a household with the region’s median income; in other words, 50 percent of the households could not afford 89 percent to the units sold. Among the comparable metro areas, the San Diego region has been one of the three least affordable housing markets since 1999. San Diego has consistently had one of the highest median home prices out of the comparable metros, increasing from $217,000 in 1995 to $394,000 in 2003 (both values are in 2004 dollars). In 2003, Pittsburgh had the lowest median home price ($108,000) in contrast to San Francisco’s median price of $574,000. San Diego’s value has consistently been above the nation’s, increasing rapidly after 2001 and reducing affordability (Figure 22). With limited land for urbanization, it may be necessary to increase average housing density to achieve greater housing production. Increasing the supply of units may be the most reliable way to broadly address the housing shortage and lack of affordability. At this time, housing affordability cannot be solved with government programs that are designed to produce a limited and temporary supply of subsidized units with below-market prices or rents.
Figure 20 Employment Growth in San Diego Since 1998 has Outpaced
Growth in Total Housing Units
-10%
0%
10%
20%
30%
1990 1991 1992 1993 1994 1995 1996 1997 1998 1999 2000 2001 2002 2003 2004
Housing UnitsJobs
Source: California Department of Finance, City/County Population and Housing Estimates; Bureau of
Economic Analysis, Regional Economic Information System, Table CA34, December 2004.
Note: Housing data from 1990 to 1999 are based on 1980 Census controls. Housing data from 2000 to 2004 are based on 2000 Census controls.
REPS Volume I 87

88 REPS Volume I
Figure 21 San Diego’s Housing Opportunity Index is the
Lowest Among Comparable Metropolitan Areas
1995 2000 2003
Minneapolis, 1 Salt Lake City, 1
San Francisco, 22 San Diego, 22
Better
Worse
San Diego, 19
Washington DC, 1
San Francisco, 22
San Diego, 20
Source: National Association of Home Builders
Note: The Housing Opportunity Index for a given area is defined as the share of homes sold in that area that would have been affordable to a family earning the median income. A "better" Housing Opportunity Index represents a greater affordability.
Figure 22 San Diego’s Housing Opportunity Index
has Declined Sharply Since 1998
0%
10%
20%
30%
40%
50%
60%
70%
80%
1991 1992 1993 1994 1995 1996 1997 1998 1999 2000 2001 2002 2003
San Diego United States Source: National Association of Home Builders
Note: The Housing Opportunity Index for a given area is defined as the share of homes sold in that area that would have been affordable to a family earning the median income.

Indicator Group 4. Regional Infrastructure Capacity Demand for infrastructure is driven by population growth. In the next 30 years, the San Diego region is expected to add more than one million people, bringing the total population to just less than four million. As the region continues to grow, it is necessary to assess the ability of the region’s infrastructure to handle change and to maintain services and support required for economic prosperity. Steps need to be taken to help ensure that adequate infrastructure systems – for transportation, water, sewerage, solid waste, and energy – are in place prior to or concurrent with the region’s growth in population and employment. At a minimum the region will need to address the following issues: (i) increasing air transportation capacity through facilities other than the San Diego International Airport; (ii) improving access to the national rail network through alignments other than the San Diego-Los Angeles corridor; and (iii) substantially increasing processing capacity and reducing wait times to cross the U.S.-Mexico border. San Diego’s access to international markets, suppliers, and distributors is an increasingly important element of the regional economy. In particular, movement of people and goods across the U.S.-Mexico border is a significant contributor to the region’s prosperity, and constraints on such movement, both at border crossings and in access to and from the border, impose a substantial cost to the regional economy. Freeways. San Diego’s investments in transportation system capacity, measured in terms of freeway lane-miles, lag behind growth in demand for vehicle transportation, measured in terms of vehicle miles traveled, although this is not a problem that is unique to the region (Figure 23). Lack of system capacity is also indicated by measures of congestion and commuting time. A combination of actions, such as demand management, increased use of transit, and new land use policies will be required to maintain mobility in the region. International Land Ports of Entry. In 2005, persons crossing northbound at San Diego’s three U.S.-Mexico ports of entry (Otay Mesa, San Ysidro, and Tecate) totaled 58.1 million persons, representing an increase of three percent over the 56.6 million persons recorded in 1996. During the same period (1996 to 2005), the number of northbound truck crossings increased 38 percent, from 580,000 vehicles to 799,800 vehicles (Figure 24). Freight value (imports plus exports) increased by an even larger percentage, 130 percent, during this period, from $11.1 billion in 1996 to $25.6 billion in 2005. Increased traffic and heightened security have combined to increase delays at the border crossings. A 2006 study by SANDAG and Caltrans District 11 found the average delay per crossing was 45 minutes for passengers and around two hours for trucks. This same study on the economic impacts of border wait times found that these delays result in $2.7 billion (2005 dollars) of lost potential output and a loss of over 33,000 potential jobs in the San Diego region, due to foregone business opportunities. Similar economic impacts are experienced at the state, national, and international levels, as well as negative environmental impacts of numerous vehicles waiting near the border to cross. Investments to our international ports of entry that reduce wait times to cross the border would likely provide the most significant returns in economic growth.
REPS Volume I 89

Figure 23 San Diego has Not Increased its Freeway Capacity as Fast as
Other Metropolitan Areas in the United States
0%
20%
40%
60%
80%
100%
120%
140%
1983
1984
1985
1986
1987
1988
1989
1990
1991
1992
1993
1994
1995
1996
1997
1998
1999
2000
2001
2002
2003
SD Vehicle Miles of Travel US Vehicle Miles of TravelSD Lane Miles US Lane Miles
Source: Texas Transportation Institute
Figure 24 Number of Northbound Trucks Entering San Diego Through
International Land Ports of Entry (Thousands of Vehicles)
0
100
200
300
400
500
600
700
800
900
1996 1997 1998 1999 2000 2001 2002 2003 2004 2005
Source: U.S. Bureau of Transportation Statistics; U.S. Customs Service
Note: Represents the Tecate and Otay Mesa Ports of Entry.
90 REPS Volume I

Airport. San Diego International Airport (SDIA) faces many challenges in providing the region with adequate air service. SDIA is convenient, but its urban location limits the airport’s hours of operation, constrains ground access, and has runways that are too short to accommodate major international air traffic. These issues combined with limited direct routes to major destinations and the fact that the facility’s ability to handle additional operations (take-offs and landings) is expected to peak around 2015, limits the ability of the airport to accommodate the region’s economic growth. Passenger traffic continues to increase, from 14.9 million passengers in 2002 to 17.4 million in 2005 (Figure 25). Cargo traffic, on the other hand, decreased from 159,000 tons in 2002 to 152,000 tons in 2005. While some improvements can be made in processing passenger traffic through ground facilities, it is clear that capacity limitations will affect the region’s economic growth. There is anecdotal evidence that locally generated air freight is trucked to Los Angeles-area airports for subsequent air transportation. San Diego has invested an average of $4,900 per 1,000 persons in air transportation-related projects, compared to $6,800 for the state and $14,600 for the nation. Energy. A safe and reliable source of energy is essential for future economic development in the region. However, a combination of aging local infrastructure and expected declines in local production, increasing consumption per capita, expected growth and recent regulatory changes requiring renewable energy supplies have made the concern over the regions energy supply one of the most significant immediate threats to the region’s economy and economic growth. Providing an adequate supply of energy to meet projected future demand will require a combination of actions, including energy efficiency, demand reduction, renewable sources of power, importation and transmission of energy from outside the region, and additional local generation. A goal of the “Regional Energy Strategy: 2030,” adopted by SANDAG in 2003, would increase the share of energy consumed from renewable sources, such as wind, solar and geothermal. State legislation requires utilities to add new renewable resources each year equaling one percent of energy requirements and replace current renewable contracts with like resources as they expire. By 2017, according to the legislation, 20 percent of the utilities’ total supply should come from renewable sources. Currently, the only way for the San Diego region to meet this goal is to import energy generated with renewable sources. According to the San Diego Regional Energy Office (SDREO), between 2002 and 2030, the region will experience a near doubling of demand for electric energy, requiring a peak capacity of over 8,000 MW. SDG&E, which is responsible for securing the energy supply needed for most of the region, is undertaking a number of initiatives, including construction of new transmission capacity and increased energy conservation, intended to diversify future sources of energy (Figure 26).
REPS Volume I 91

92 REPS Volume I
Figure 25 Number of Passengers (in Millions) Using the San Diego
International Airport is Increasing Over Time
0
2
4
6
8
10
12
14
16
18
20
2000 2001 2002 2003 2004 2005
Source: San Diego International Airport Authority, 2004-2005 Financial Report
Figure 26 Current and Future Sources of Energy
for the SDG&E Service Area
0%
5%
10%
15%
20%
25%
30%
35%
40%
45%
50%
DWR Nuclear Congeneration Renewables Utility Owned andContracts
2007
2015
Source: SDG&E

COMMENTS AND RESPONSES


REPS Volume I 95
COMMENTS AND RESPONSES
This section summarizes the public comments received on the draft Preparing for Regional and Global Collaboration two-volume report: Evaluating the Competition and Assessing our Strategic Position (Volume II) and San Diego Regional Economic Prosperity Strategy (Volume I). The comments are organized chronologically, based on the date of the letter, memo, facsimile, or email. 1. San Diego Convention and Visitors Bureau (May 3, 2007)
COMMENT: (1) It would be inappropriate to characterize lower paying service sector jobs as exclusively or even predominately hospitality/visitor industry, as the service sector is not exclusively comprised of the hospitality/tourism industry but also includes retail and professional services. (2) While front line jobs in the hospitality industry may include some unskilled, entry level positions, the industry also employs much higher compensated and better educated/trained professionals in a wide variety of areas ranging from marketing, finance and operations, to human resources, legal and sales. (3) There has been very little if any proactive planning on the part of government to ensure the success of the visitor industry. The industry faces the same bureaucratic hurdles/costs often cited by other business sectors. The significant Investment(s) that have occurred are primarily private dollars. Incentives, if any, provided by government on these projects are no different than incentives that are provided to developers of industrial parks, etc.
RESPONSE: (1) We concur with the observation that the service sector is not comprised only of the hospitality/tourism industry. Under the (new) NAICS classification system there are two major classifications under total private employment, goods producing (18%) and service providing (82%), the hospitality/tourism sectors are part of the service providing category along with a vast majority of the private employment in the region; using this classification system four out of five jobs are service jobs. In the older employment classification system, services were one of about eight major categories. (2) We agree that all industry sectors have hierarchical job structures, which are connected by career ladders. The more similar jobs are to one another in each industry the simpler the career ladder. If significant differences exist between jobs in one industry the more complicated the ladders become. As pointed out, the hospitality industry has a significant variety of jobs that makes its career ladders more complex, getting experience in one area may not help you obtain a job in another area within the same industry. In addition the hospitality/visitor industry has a large base of workers that for a variety of reasons receive relatively low wages or salaries, bringing down the overall average. This structure cannot be altered easily, if at all. For example a hotel cannot add a significant number of workers in their finance department without adding workers in many of the other areas that make up their employee profile. A hotel may employ one worker in the finance department for every 50 or 100 other employees and until the hotel adds 50 or 100 additional workers it will not hire another worker in their finance department. For this reason the broad base of workers earning low wages or a low salary will likely continue into the foreseeable future.

96 REPS Volume I
The main point of the Prosperity Strategy is to balance our job growth better than we have in the past, not to stop jobs being created in one sector at the expense of another. This type of approach is neither reasonable nor feasible. Looking at the many plans being discussed throughout the region, we should conclude that the visitor/hospitality sector will continue to add capacity and grow; but recognize that the structure of the industry does not allow for a balance of high and low paying jobs to be created. The balance must come from the expansion of businesses and job opportunities in the other traded cluster areas. (3) We disagree with the assertion that all sectors are treated the same. A good example of this is the convention center, clearly a visitor industry establishment built primarily, if not completely with public dollars, to say nothing of its location; we do not believe the Biotech industry would have been given the same opportunity. Other visitor facilities that have been provided preferential treatment are Sea World, Lego Land, the Wild Animal Park, the Zoo, and the Cruise Ship terminals. Even the hotels along the Bay and Harbor have been provided a location that is not available to many if not most other sectors. When Mission Bay was initially dredged and created Shelter and Harbor Islands it was with the duel purpose of expanding tourism and providing a recreational park for residents. The bonds that paid for the creation of Mission Bay were General Obligation Bonds, funded by taxpayers. There are more examples of the region’s investment and continuing commitment to the visitor industry; with more on the horizon, such as the Gaylord development in Chula Vista. These investments and preferential treatment, combined with good weather and the Pacific Ocean, have provided our region with a nearly $6 billion visitor industry. The Prosperity Strategy points out the type of investments and preferential treatments the other sectors need with the objective of providing balanced job growth.
2. Endangered Habitats League (May 4, 2007)
COMMENT: (1) Endangered Habitats League (EHL) recommends the following specific objectives and standards be included in Strategic Goal 6 that address the water needs of the region.
a) Identification of specific standards for water conservation b) Advancement of a regional policy on water reclamation including dissemination of factual
technical data on reclaimed water constituent components c) Advancement of a policy for underground water storage in existing aquifers d) Development of a regional funding strategy to implement state water quality standards and
mandates (2) Strategic Goal 3, which calls for a strategic approach to meet the region’s energy needs, should include a land use and transportation focus to address climate change. (3) EHL disagrees that sufficient progress has been made on regional habitat plans to warrant removing this issue from the list of recommended actions. RESPONSE: (1) EHL’s comments regarding water supply and quality and recommendations to develop goals, policies, and funding are thoughtful and consistent with public interest and with policy guidelines developed by the state and local agencies and organizations with responsibility or interest in water issues. The comments are directed toward the April 2007 draft of San Diego Regional Economic Prosperity Strategy (Volume I of Preparing for Regional and Global Collaboration). The May 2007 draft addressed two of the issues identified in these comments – water conservation and reclamation/recycling – and the need for the region to collaboratively pursue further progress in these

REPS Volume I 97
areas. Following are responses to the other two issues raised by EHL – aquifer recharge and (storm) water standards. Recharge or replenishment of local aquifers using both surface and recycled water has been implemented in other areas of California, where current and historical extraction of underground water has introduced risks of potential subsidence or salt water infiltration. Both Los Angeles and Orange counties have implemented groundwater recharge projects using recycled water under the oversight of the Regional Water Quality Control Boards and the California Department of Health Services. In San Diego, groundwater has not historically been a major source of domestic or industrial water, due to limited aquifer capacity and high concentrations of total dissolved solids (salts). As a result, groundwater recharge has also not been a significant issue. However, some local water agencies, such as Sweetwater Authority, are investigating the use of groundwater as source of potable water through demineralization. As groundwater plays a more important role in the future, its recharge, particularly with recycled water, will also need to be addressed. With respect to stormwater discharge and assuring that the quality of water being discharged meets state health and environmental standards, SANDAG in collaboration with other local agencies is developing action programs and a funding strategy as part of the Regional Comprehensive Plan and its component, Integrated Regional Infrastructure Strategy. Stormwater quality is also a focus of numerous state and local initiatives, including the recently released Draft Integrated Regional Water Management (IRWM) Plan, along with pollution prevention and wetlands and habitat protection. The San Diego Regional Economic Prosperity Strategy has identified goals and recommended actions to improve the region’s economic prosperity, including strategies to meet key constraints or challenges to economic development, such as water supply. Although stormwater quality is an important element in maintaining the region’s quality of life and has both direct and indirect influence on the hospitality industry, it was not considered to have the same impact on economic development as other infrastructure issues. (2). Although, the Prosperity Strategy does not identify global climate change as one of its Strategic Goals, there are a number of recommended actions in several of the Goals that are supportive of climate change objectives. For example, in Strategic Goal 1 there is a recommended action that emphasizes smart growth, including land use and transportation decisions that reduce the number of roadway trips and the number of vehicle miles traveled; both would reduce the demand for and consumption of gasoline. In Strategic Goal 2 there is a recommended action that would reduce the length of the time it takes cars and trucks to cross our international border with Mexico. This action would reduce both car and truck idling time and reduce air emissions from their exhaust. In Strategic Goal 3 the recommended actions support achieving a higher proportion of our energy supply from renewable sources, limiting our consumption of energy derived from burning fossil fuel. Last, Strategic Goal 6 specifically recommends assessing the need to address the effects of global climate change in planning for the region’s future water supply. (3) The initial Prosperity Strategy produced in 1992 contained a recommendation concerning the importance of creating multiple species habitat plans as the most cost effective way to provide a predictable administrative process for reviewing and approving project development proposals, reducing the risk of widespread development embargos that would create uncertainty and disruption. Since 1992 cities in the region have adopted at least four habitat conservation programs (HCP), the Multiple Habitat Conservation Program South (MSCP), the Multiple Habitat Conservation Program (MHCP), and smaller programs in the cities of Carlsbad and Poway. In addition, the County of San

98 REPS Volume I
Diego is spearheading two efforts, North and East MSCP, which are scheduled to be completed over the next two years. Once completed these combined HCP’s will cover most, if not all, of the habitat sensitive areas in the region. These Plans are consistent with the State of California’s Natural Communities Conservation Planning Program which provides a procedure for regions to move forward with both habitat conservation and development simultaneously. These Conservation Plans have replaced the ineffective approach of piecemeal habitat conservation planning, and are recognized nationally as a successful model that should be emulated. Although more work is needed to ensure these plans are completed, funded and carried out, the region’s progress was considered sufficient to warrant removing the recommendation to establish HCP’s in the region.
3. San Diego Workforce Partnership (May 4, 2007)
COMMENT: San Diego Workforce Partnership’s comments deal with the following three issues: (1) Whether the educational system, from elementary to higher education, should be considered as part of the public infrastructure; (2) whether an aging population would lead to a decreasing need for public services for the young; and (3) how to address the drop-out problem in the region’s schools. RESPONSE: (1) In its organization, the Prosperity Strategy considers education as an aspect of human resources and not as part of the region’s physical infrastructure. Thus, education is included in Indicator Group 3, Resources for Economic Growth, while Group 4, Regional Infrastructure Capacity, addresses transportation, water and wastewater, solid and hazardous waste, energy, communication, and parks and open space. Both of these areas are important for the region’s economic growth and social well-being. (2) As the region’s population ages, additional services would be needed by the older segments of the population. The need for investments in services for the young would certainly remain, but may decline in relative terms, such as obtaining sites for new schools. This has been clarified in Volume II, Section 1.1, of the report, as follows: “An aging population requires services for the elderly, such as health care and transportation. This will require a re-examination of priorities with respect to investments in public services for the different segments of the population.” (3) Regarding the drop-out problem in the region’s public schools, Strategic Goal 4 and its recommended actions (REPS, Volume I) emphasize that the first requirement is for an improved understanding of how individual students progress through the educational system and accomplish learning. Once the current situation is accurately understood, the region can set concrete objectives to improve this process, and the educators can determine the best methods to achieve those objectives. Other comments regarding data for a figure and abbreviation for San Diego Workforce Partnership have been incorporated in the final report. It is also important to note that SDWP has participated actively in implementing the recommendations of the 1998 Prosperity Strategy, particularly with respect to detailed studies of the region’s traded clusters, as described in Volume II.

REPS Volume I 99
4. Larry Glavinic, Regional Planning Stakeholder Working Group (May 22, 2007)
COMMENT: The recommended actions should address obtaining more traded clusters, including goods movement, through (1) drastically improving transportation infrastructure capacity and (2) providing significant economic incentives. RESPONSE: (1) The Prosperity Strategy believes that goods movement is an essential part of the future standard of living in the San Diego region, which is uniquely situated along the busiest international land border crossing in the world. Prioritizing projects that will effectively increase goods movement capacity is covered in the Draft Goods Movement Action Plan in the Regional Transportation Plan. The Prosperity Strategy emphasized transportation infrastructure investment in Volume 1, Strategic Goal 2, which states that an effective Goods Movement Action Plan needs to be completed and adopted as part of the Regional Transportation Plan in order to effectively increase the goods movement capacity of the region. Furthermore, the Prosperity Strategy advocates immediate enhancement of cross border capacity, specifically in Strategic Goal 2, which states that increasing processing capacity and reducing border wait times, without jeopardizing security at the international land ports of entry, will allow the region to realize the gains of increased international trade activity, gains which are currently foregone. Strategic Goal 2 advocates the completion of SR-905 and establishing a financial strategy to construct SR-11 and a third land port of entry. (2) The Prosperity Strategy does not address providing economic incentives specifically to industries or potential cluster industries, but rather feels that the investments outlined in the Prosperity Strategy Strategic Goals will enhance the attractiveness of the region to potential new cluster firms. Included in the Strategic Goals and Recommended Actions are items which directly address the physical infrastructure and capital shortcomings from which San Diego currently suffers. As stated in the Introduction to the Strategic Goals and Recommended Actions, the recommended actions are designed to expand and create high and middle-income job opportunities. The Advisory Working Group feels that the region will be an attractive location for high value added traded cluster industries if efficient and effective infrastructure investments are made to ensure adequate capacity to serve industrial needs. Historically, the San Diego region has invested in infrastructure components that have proven attractive to lower value added, and thus, lower paying service-oriented clusters – exactly what the Prosperity Strategy hopes to change.
5. Steven E. Otto, Regional Planning Stakeholder Working Group (June 7, 2007)
COMMENT: According to SANDAG forecasts, more and more people will be cross-border commuting in the future to work in San Diego. The Prosperity Strategy does not adequately consider the Northern Baja region in terms of foregone opportunities to increase the regional standard of living. (1) It would be of interest to determine what portion of the 99,000 households being “exported” to find homes outside the region while continuing to work in the region can be attributed to Northern Baja. (2) It would also be of interest to forecast how many persons of Hispanic origin (which will account for 80 percent of the total regional population growth over the next 26 years) will choose to live in Northern Baja and commute to San Diego because of the lack of affordable housing.

100 REPS Volume I
(3) Many “Smart Growth” areas are located in older neighborhoods, one element of which is in-deficit current condition of most basic infrastructure. To accomplish Smart Growth, additional developer incentives are essential to overcome the cost of ensuring adequate infrastructure to support new housing development. (4) Regarding infrastructure investment, rail must be an important part of the goods movement solution, meaning not only new double-tracked rail lines to the north, but also maximizing the great potential of the desert line to the east to connect with the national rail grid. (5) Regarding water, and what steps can be taken to ensure adequate clean water supplies in the future, given the high costs of installing the necessary special piping, reclaimed water usage will never take off without corresponding major public and private incentives. RESPONSE: We disagree with the characterization that the Baja region was not taken into consideration in compiling the recommended actions of the Prosperity Strategy. According to SANDAG forecasts, (1) approximately 30% of the 99,000 households “exported” out of the region will choose Baja California to relocate to, Riverside County being a larger draw. (2) It is currently not possible to use SANDAG’s Growth Forecast to project how much of the region’s future Hispanic population will choose to live in Baja. The Forecast predicts population growth occurring in San Diego County only. SANDAG does not track the number of daily work-commuters into the San Diego region from Baja California. However, anecdotal evidence supports the statement that many workers in the region commute from Baja California, Riverside County, and Imperial County. (3) SANDAG’s Smart Growth Incentive Program addresses the issue of providing sufficient incentives to developers for building Smart Growth housing in the designated areas. (4) SANDAG advocates a collaborative approach to addressing the infrastructure capacity requirements of the region, and believes that goods movement will be an essential part of the future regional economy. Recommended Action 2.1 states that the draft Goods Movement Action Plan needs to be completed, integrated, and adopted as part of the Regional Transportation Plan. Rail, as well as other modes of goods movement, is addressed in the Draft Goods Movement Action Plan. (5) San Diego currently has water reclamation plants. At these plants, the reclaimed water that is not utilized by end-users is discharged into the Pacific Ocean, along with treated wastewater. The Prosperity Strategy emphasizes utilizing the reclaimed water, which we currently have the capacity to produce, as well as conservation and further diversification of water sources.
6. Center on Policy Initiatives (June 7, 2007)
COMMENT: CPI’s evaluation of SANDAG’s Prosperity Strategy is organized into four general areas: (1) The current report rehashes the same old recommendations from the 1998 report; (2) The social and economic indicators from the strategic assessment system show that these recommendations have failed to generate economic prosperity for San Diego’s low-wage earners; (3) The recommendations are not based on data; and (4) A different approach to economic development is needed.

REPS Volume I 101
RESPONSE: Each of these areas of concern is addressed below. (1) This is the third update of the Prosperity Strategy. Each time it is updated an Advisory Group (including CPI) evaluates the progress on the most recent past Strategy’s recommended actions using a procedure that classifies progress into one of three categories: reasonable, little, or none. Based on the Advisory Group’s evaluation, recommended actions are added and removed from the list primarily based upon performance and progress. The region has successfully met many of the goals set in previous Prosperity Strategies, including: improvements in air quality, open space conservation and regional habitat preservation plans, solid waste disposal capacity and waste recycling programs, diversifying the sources of our water supply, venture capital funding, and restructuring the local economy after the collapse of the defense sector during the early 1990s. On the downside, the 2007 Advisory Group determined that little or no progress had been made in: making housing more affordable; providing a hazardous waste storage and disposal site; improving access to international markets including adequate air service capacity for passengers and cargo and increasing the capacity at our international land ports of entry. None of these achievements was easy, all were time consuming, and each has had a very real and lasting effect on the regional economy. Making progress on the recommended actions illustrates the commitment and effort on the part of the many agencies and organizations involved. To suggest that the 2007 Prosperity Strategy “rehashes” the same old recommendations from the 1998 report is an incorrect and misleading statement with no basis in fact. (2) The Prosperity Strategy recognizes and highlights the fact that the region is generating far more low paying jobs than middle and high paying jobs and that this is keeping the overall average wage rate and standard of living from rising at a pace equal to or greater than the nation. However, generating low paying jobs is not an indication of failure by the Prosperity Strategy, as CPI has suggested, but rather the success of the public and private investments that have been made in the region. Our region has a very successful track record of investing in certain “traded cluster” industries offering low wage job opportunities that require a low or minimal amount of education and training. These successful industries, helped by supportive pubic policy and infrastructure investments, are setting the pace of economic growth in the region. Also, these businesses are not likely to disappear any time soon; more likely they will continue to grow because the region continues to invest and create new capacity for their growth. The Prosperity Strategy offers a framework and specific recommended actions to better balance our investments that will, in turn, influence the quality of our job growth. This framework suggests that our public investments and policies provide companies with the foundation and some of the essential resources needed to be competitive; similar, for example, as our public policies and investments have done for the region’s very successful and robust visitor industry. In this way the Prosperity Strategy provides a framework built on a successful model that will influence a set of traded employment clusters that offer middle and high paying job opportunities, helping balance the region’s propensity for creating a high proportion of its employment growth in low paying jobs. (3) The Prosperity Strategy’s strategic evaluation system compiles hundreds of variables and groups them into four broad areas for evaluation. This array of information is available to benchmark and assess ourselves against comparable regions for the purpose of identifying the challenges and opportunities facing the San Diego region. First, the San Diego region was compared to 24 other metropolitan areas, selected on the basis of comparable population size and demographic and economic characteristics. Second, historical changes in the San Diego region were compared to

102 REPS Volume I
changes in California and the U.S. to determine if our trends were the same or different from a broad perspective. And, third, additional data were collected for the San Diego region to provide a closer look at issues as they emerged during our research and analysis. Based on the evaluation of this data, two trends have been identified that differentiate the San Diego region from all others; first, middle of the pack wage rates that are growing relatively slowly, and second, a high cost of living; combined, these two trends are wreaking havoc on residents’ purchasing power and standard of living. Contrary to CPI’s assertion, all of the Prosperity Strategy’s strategic goals and recommended actions are aimed at alleviating the economic pain caused by one or both of these challenges which were identified by the data collected and evaluated by the Advisory Group. (4) The Prosperity Strategy offers a public policy and investment framework with different goals and objectives than the economic development procedures being implemented today, providing an opportunity for achieving different results. The Prosperity Strategy, unlike CPI’s suggestions, is focused on generating private sector jobs as a way to secure this region’s future prosperity through a rising standard of living on par with or greater than the nation’s. Rather than suggest that the private sector has failed, the Prosperity Strategy suggests that the private sector is providing the public sector with a return commensurate with its investment. If the public sector wants a higher return on its investment (in the form of higher wages for workers) it needs to invest in different parts of the economy. To suggest, as CPI has, that local government through regulation can set private sector wages and solve the housing affordability problem is to ask the San Diego region’s private sector for a return that is greater than its current capabilities, which in part are governed by the public sector’s investments. A related point worth clarifying, because it is often misunderstood, is that although the traded clusters identified in the Prosperity Strategy set the pace for economic growth they do not contain all of the middle and high paying job opportunities. The Prosperity Strategy is designed to affect the pace of economic growth and provide an opportunity to raise the overall standard of living locally; one focus of the Strategy is on traded cluster industries because they are most responsible for setting the pace of economic growth. Successfully increasing the pace of economic growth provides an opportunity for all workers and industries in the region to benefit, not just the traded cluster industries.
7. Patricia McCoy, Councilmember, City of Imperial Beach; Borders Committee (June 19, 2007)
COMMENT: The Prosperity Strategy should emphasize a balance between ecological and cultural sustainability. There is a fatal disconnect between national policies geared toward faster economic growth and scientific understanding of limits to growth. We must rethink our growth oriented policies and bring them into balance by utilizing a renewable resource base in conjunction with new technologies. RESPONSE: The Prosperity Strategy will be amended, where appropriate, to reference the San Diego region’s collective recognition of the importance of ecological sustainability and ongoing efforts toward achieving the same. The region has adopted regional habitat conservation plans that link sensitive habitat areas throughout the region to maintain viable habitat areas for the region’s most sensitive plant and animal species. Linking these plans to water quality improvement and smart growth development can sustain quality of life in the region into the future. Smart growth development is the use of coordinated regional planning to bring transit service, housing, and employment together in an effort to use land more efficiently. Additionally, land use and regional planning agencies are now beginning to examine how adopted and proposed regional and local plans

REPS Volume I 103
have an impact on climate change and greenhouse gas emissions. Cooperation and innovation will be needed among all levels of government as well as with private and public organizations to reduce greenhouse gas emissions to 80 percent below 1990 levels by the year 2050 (per AB 32 – Global Warming Solutions Act of 2006).
8. San Diego Workforce Partnership (July 10, 2007)
COMMENT: The Workforce Partnership (SDWP) would like the Prosperity Strategy Recommended Action 4.2, which calls for exploring new approaches to providing education and training opportunities to workers employed by temporary staffing agencies, to detail the SDWP’s existing efforts to take advantage of the knowledge base and activities of the region’s temporary staffing industry. RESPONSE: Recommended Action 4.2 will be amended to reference SDWP’s March 2004 publication, Point Counterpoint: A Profile of San Diego’s Temporary Staffing Industry; the presence of temporary staffing industry representatives on SDWP governing boards; and SDWP One-Stop Career Centers, where temporary staffing agencies look to find employees for their client employers and SDWP gains employers for its job seekers. The Recommended Action will emphasize that the SDWP recognizes temporary staffing agencies as a key link between job seekers and employers; and that working closely with these agencies will allow SDWP to leverage the resources temporary staffing agencies are devoting to employment and training activities.
9. City of Vista (July 12, 2007)
COMMENT: The City of Vista would like Recommended Action 1.3 concerning the “fiscalization of land use” to discuss the influence of Proposition 13. RESPONSE: Staff will amend Recommended Action 1.3 to include the following discussion. “Many statewide studies, including the Speaker’s Commission on State & Local Government Finance completed in March 2000, that have analyzed the “fiscalization of land use”, trace the rise in its importance back to the passage of Proposition 13 (1978). One of the unintended consequences of Proposition 13, which sought to limit the increases in property taxes, was to give the state control over the allocation of property tax revenue. The State Legislature passed Assembly Bill 8 in 1979 establishing a formula to distribute property tax revenue to cities and counties. This formula dramatically reduced the extent to which local governments depend on property tax revenue to fund local services; more importantly after Proposition 13 some land use types were more valuable than others and jurisdictions land use decisions began to be influenced by the property’s net tax revenue generating capabilities. Cities quickly recognized that sales tax revenue was their best option to replace lost property tax revenue without going to the voters for approval. However, local government’s 1% share of the sales tax revenue collected is distributed based upon the location of the sales transaction, providing cities with the motivation to compete for retail stores. As a result of these unintended consequences, the tax base for supporting local services now is influenced by constitutionally embedded fiscal incentives that distort local growth and development policies. In particular, shopping centers, auto dealerships, hotels, and other commercial developments are

104 REPS Volume I
enormously attractive to local officials because they produce abundant sales tax revenue for the jurisdictions where they are sited, but not necessarily where the services are needed. Indeed, fiscalization of land use leads to distorted public policy: the health of the municipal budget is mistaken for the community’s economic prosperity; retail development is confused with economic development; and the most important community need – housing – is regarded as a loser. The fiscalization of land use has made the current tax system an impediment to sustainable communities: it restricts the freedom of local governments to manage their own fiscal affairs and destabilizes them; and it penalizes and impedes residential construction and encourages cites to compete among themselves for the weakest contributors to economic prosperity – retail outlets.”
10. County of San Diego (July 20, 2007)
COMMENT: (1) The County of San Diego (the County) believes that the Prosperity Strategy should include a discussion on the impact of military spending on local businesses; specifically in the Strategic Goals and Recommended Actions section of San Diego Regional Economic Prosperity Strategy and in an appropriate location in the Evaluating the Competition and Assessing our Strategic Position volume. (2) The County described in detail some of the plans and programs it offers regarding: providing attached housing units; streamlining the discretionary review process; improving plan check and map check processes; the type, quantity, and plans for industrial land; and co-location of jobs and housing. (3) The County questions the accuracy of the estimation of adverse impacts of traffic congestion and delays at land ports of entry at the U.S.-Mexico border. RESPONSE: (1) We agree that the U.S. Military presence has a significant impact on the San Diego economy, providing uniformed military jobs and indirect support jobs. Also, the impacts from military defense contracts awarded to local companies are accounted for separately, primarily under the Defense and Transportation employment cluster. The uniformed military portion is not a focus of the Prosperity Strategy nor does it appear in the Strategic Goals and Recommended Actions section because the armed services lay outside the influence of the local public planning process. The quantity, nature, and location of military jobs are under the purview of the U.S. Federal Government and are based upon the needs of military objectives and the interests of national defense and security. Developing a strategy to expand or influence employment in the military is beyond the scope of local government and the Prosperity Strategy. Also, the objective of the Evaluating the Competition and Assessing our Strategic Position volume is to compare the San Diego region with 24 similar regions across the country in a number of indicators grouped into four broad categories: Economic and Social Performance, Business Vitality, Resources for Economic Growth, and Regional Infrastructure Capacity. The presence or absence of military personnel alone (which is the only data available for comparison across all 25 regions) is not an indicator of how well a region is performing economically and therefore is not included in the set of indicators used for comparison. (2) We are aware that some jurisdictions have pre-existing or recently initiated programs to address areas identified in the Prosperity Strategy as Recommended Actions. While the Prosperity Strategy does not discount these programs, they are only viewed as a starting point. The intent of the report is to produce a strategy by which the region can move into the next phase of creating economic prosperity for all the region’s residents. Taking that next step requires new and innovative ways to address old problems that have plagued the region and hindered economic success. Programs that have been in place for a number of years are oftentimes part of the problem, providing outdated

REPS Volume I 105
solutions for an issue that has quickly grown to crisis proportions. While the examples the County provided of their own programs, including its draft General Plan 2020, were put in place fairly recently, there are jurisdictions that still rely on plans and programs adopted and implemented during another era. It is essential that those jurisdictions are called upon to update and enhance their services in the areas identified in the Strategic Goals and Recommended Actions. (3) The figures cited in the Prosperity Strategy estimating the loss of gross output and potential output and jobs due to traffic congestion and delays at the international border are from a January 2006 report put forth by SANDAG and the California Department of Transportation, Economic Impacts of Wait Times as the San Diego-Baja California Border. The study examined the economic effects of congestion on personal trips (in autos and on foot) and cross-border freight operations using the IMPLAN Input-Output Model for U.S. impacts and multipliers developed by the Autonomous University of Baja California for Mexican impacts. The study uses baseline data from two primary surveys (for personal trip impacts) and from official international trade and border crossing statistics (for freight movement impacts). The results from the study were evaluated against the findings from a set of interviews with private businesses that have operations on both sides of the border, verifying the direct link between a reduction in economic activity and increased border crossing wait times; businesses referred to the higher wait times as “supply chain kinks” that prevent them from making “just in time” deliveries of their products to outlets worldwide. The report and results were presented to a June 2005 joint meeting of SANDAG’s Borders Committee and Committee on Binational Regional Opportunities, to SANDAG’s Public Safety Committee in July 2005, and during a SANDAG Board of Directors Bus Tour of Tijuana, Baja California in August 2005. The County of San Diego is represented in each of these groups and did not raise these concerns when the report was presented to them on these occasions.
11. General Comments – Housing
COMMENT: The Prosperity Strategy was presented to several of SANDAG’s committees during the public comment period. Staff heard several comments regarding housing during the discussion portion of the meetings that were of similar nature. The comments heard most often centered on reducing the amount of time it takes to get a housing unit on the market and the need for advanced planning for essential facilities that would support multifamily housing construction. RESPONSE: The Strategic Goal regarding housing will be amended to address increased construction of multifamily units in Smart Growth Opportunity Areas (SGOAs), which are targeted areas where the region’s jurisdictions would like growth and development to occur; streamlining of permitting and regulatory requirements; and reforming the state-local government fiscal relationship to render local governments indifferent between the potential location of a retail establishment or housing in their jurisdictions.
12. General Comments – Water
COMMENT: The Prosperity Strategy was presented to several of SANDAG’s groups and committees during the document’s public comment period. During the discussion portion of the meetings, staff received comments regarding the region’s water supply that stressed the current drought conditions in the state, emphasized that the region is heavily dependent on imported water, and stated that

106 REPS Volume I
more work is required to improve the reliability of this resource. Suggestions included groundwater desalination and/or recharging, a better transmission system to deliver reclaimed water, and seawater desalination. RESPONSE: The recommended action in the Strategic Goal dealing with water supply will be amended to include actions addressing cooperative programs to encourage water conservation; a commercially viable desalination plant; public acceptance of reclaimed water as potable drinking water for domestic use; the need for local, state and federal elected officials to consider creating a competitive water market within the state; and responsiveness to effects of climate change, which has the potential to significantly affect the region’s water supply. These actions will be in addition to the existing recommendation to implement the long-range master plan prepared by the San Diego County Water Authority (CWA).
13. General Comments – Climate Change
COMMENT: The Prosperity Strategy was presented to several of SANDAG’s groups and committees during the public comment period. Staff heard several comments regarding climate change during the discussion portion of the meetings that were of similar nature. The comments heard most often focused on the need to somehow address the issue of climate change in the Prosperity Strategy. RESPONSE: The Prosperity Strategy will be amended to include the following introductory narrative addressing climate change: “One issue that arose during our evaluation process that we did not have an opportunity to analyze as a separate or individual challenge is “climate change” or carbon dioxide emissions. Although a full integrated analysis will have to wait until the Prosperity Strategy is next updated, we would like to point out that most of our recommendations are in line with and very much support the general discussions on reducing CO2 emissions. For example, most all our recommendations support conservation as part of the solution, if it is relevant. More specifically, our strategic goal addressing housing is based on smart growth principles, putting jobs close to housing and reducing commute times and urban sprawl. Also, our recommended actions encourage meeting the statewide objectives of moving towards more renewable energy sources, including keeping track of discussions involving nuclear power.“
14. General Comments – Long-Term Vision vs. Immediate Actions
COMMENT: The Prosperity Strategy was presented to several of SANDAG’s groups and committees during the document’s public comment period. During the discussion portion of the meetings, staff heard several comments regarding the long-term vision for the San Diego region. RESPONSE: Some of our infrastructure service providers such as, water, energy air service and border ground access have expressed concern over the next 10 to 15 years as opposed to the long-term. For example, several comments concerned the Strategic Goal to invest in energy infrastructure. In particular, that the Prosperity Strategy’s current emphasis on the construction of new electric transmission capacity should be broadened to seek greater reliance on renewable energy such as solar power. That the region needs to find diverse sources for its energy portfolio is certainly not disputed, but the most viable projects in the near-term center on obtaining electric power from traditional sources. It is for this reason that the Strategy focuses on such – it is designed to identify actions that

REPS Volume I 107
can be undertaken immediately to meet the current needs of the region. It is the charge of other documents, such as the Regional Energy Strategy, to provide a detailed direction for the region’s long-term energy needs. It is the charge of the Prosperity Strategy to identify what can be done now and with the highest probability of success.