Embed Size (px)
DESCRIPTION
Report
Citation preview
BERKSHIRE HATHAWAY INC.
2003 ANNUAL REPORT
TABLE OF CONTENTS
Business Activities.................................................... Inside Front Cover
Corporate Performance vs. the S&P 500 ................................................ 2
Chairman’s Letter* ................................................................................. 3
Selected Financial Data For ThePast Five Years .................................................................................. 24
Acquisition Criteria ................................................................................ 25
Independent Auditors’ Report ................................................................ 25
Consolidated Financial Statements ......................................................... 26
Management’s Discussion ...................................................................... 52
Owner’s Manual ..................................................................................... 69
Common Stock Data............................................................................... 75
Operating Companies ............................................................................. 76
Directors and Officers of the Company .........................Inside Back Cover
*Copyright © 2004 By Warren E. BuffettAll Rights Reserved

Business Activities
Berkshire Hathaway Inc. is a holding company owning subsidiaries engaged ina number of diverse business activities. The most important of these is the property andcasualty insurance business conducted on both a direct and reinsurance basis through anumber of subsidiaries. Included in this group of subsidiaries is GEICO, the fifth largestauto insurer in the United States, General Re, one of the four largest reinsurers in theworld, and the Berkshire Hathaway Reinsurance Group.
Numerous business activities are conducted through non-insurance subsidiaries.Included in the non-insurance subsidiaries are several large manufacturing businesses.Shaw Industries is the world’s largest manufacturer of tufted broadloom carpet. BenjaminMoore is a formulator, manufacturer and retailer of architectural and industrial coatings.Johns Manville is a leading manufacturer of insulation and building products. AcmeBuilding Brands is a manufacturer of face brick and concrete masonry products. MiTekInc. produces steel connector products and engineering software for the buildingcomponents market. Fruit of the Loom, Garan, Fechheimer, H.H. Brown, Lowell, JustinBrands and Dexter manufacture, license and distribute apparel and footwear under avariety of brand names. McLane Company is a wholesale distributor of groceries andnonfood items to convenience stores, wholesale clubs, mass merchandisers, quick servicerestaurants and others.
FlightSafety International provides training of aircraft and ship operators.NetJets provides fractional ownership programs for general aviation aircraft. NebraskaFurniture Mart, R.C. Willey Home Furnishings, Star Furniture and Jordan’s Furnitureare retailers of home furnishings. Borsheim’s, Helzberg Diamond Shops and Ben BridgeJeweler are retailers of fine jewelry. Berkshire’s finance and financial productsbusinesses primarily engage in proprietary investing strategies (BH Finance), commercialand consumer lending (Berkshire Hathaway Credit Corporation and Clayton Homes),transportation equipment and furniture leasing (XTRA and CORT) and risk managementactivities (General Re Securities).
In addition, Berkshire’s other non-insurance business activities include: BuffaloNews, a publisher of a daily and Sunday newspaper; See’s Candies, a manufacturer andseller of boxed chocolates and other confectionery products; Scott Fetzer, a diversifiedmanufacturer and distributor of commercial and industrial products, the principalproducts are sold under the Kirby and Campbell Hausfeld brand names; Albecca, adesigner, manufacturer, and distributor of high-quality picture framing products; CTBInternational, a manufacturer of equipment for the livestock and agricultural industries;International Dairy Queen, a licensor and service provider to about 6,000 stores thatoffer prepared dairy treats and food; and The Pampered Chef, the premier direct seller ofkitchen tools in the U.S.
Operating decisions for the various Berkshire businesses are made by managersof the business units. Investment decisions and all other capital allocation decisions aremade for Berkshire and its subsidiaries by Warren E. Buffett, in consultation withCharles T. Munger. Mr. Buffett is Chairman and Mr. Munger is Vice Chairman ofBerkshire's Board of Directors.
************
2
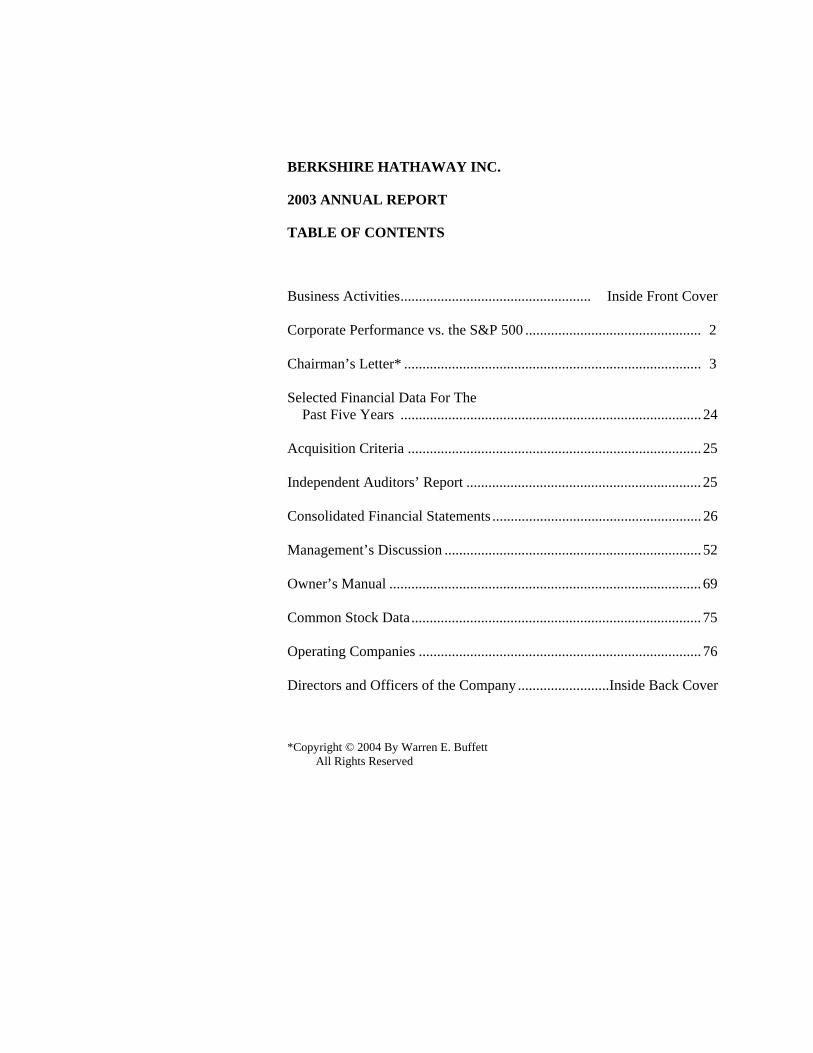
Note: The following table appears in the printed Annual Report on the facing page of theChairman's Letter and is referred to in that letter.
Berkshire’s Corporate Performance vs. the S&P 500
Annual Percentage Change in Per-Share in S&P 500
Book Value of with Dividends RelativeBerkshire Included Results
Year (1) (2) (1)-(2) 1965 .................................................. 23.8 10.0 13.81966 .................................................. 20.3 (11.7) 32.01967 .................................................. 11.0 30.9 (19.9)1968 .................................................. 19.0 11.0 8.01969 .................................................. 16.2 (8.4) 24.61970 .................................................. 12.0 3.9 8.11971 .................................................. 16.4 14.6 1.81972 .................................................. 21.7 18.9 2.81973 .................................................. 4.7 (14.8) 19.51974 .................................................. 5.5 (26.4) 31.91975 .................................................. 21.9 37.2 (15.3)1976 .................................................. 59.3 23.6 35.71977 .................................................. 31.9 (7.4) 39.31978 .................................................. 24.0 6.4 17.61979 .................................................. 35.7 18.2 17.51980 .................................................. 19.3 32.3 (13.0)1981 .................................................. 31.4 (5.0) 36.41982 .................................................. 40.0 21.4 18.61983 .................................................. 32.3 22.4 9.91984 .................................................. 13.6 6.1 7.51985 .................................................. 48.2 31.6 16.61986 .................................................. 26.1 18.6 7.51987 .................................................. 19.5 5.1 14.41988 .................................................. 20.1 16.6 3.51989 .................................................. 44.4 31.7 12.71990 .................................................. 7.4 (3.1) 10.51991 .................................................. 39.6 30.5 9.11992 .................................................. 20.3 7.6 12.71993 .................................................. 14.3 10.1 4.21994 .................................................. 13.9 1.3 12.61995 .................................................. 43.1 37.6 5.51996 .................................................. 31.8 23.0 8.81997 .................................................. 34.1 33.4 .71998 .................................................. 48.3 28.6 19.71999 .................................................. .5 21.0 (20.5)2000 .................................................. 6.5 (9.1) 15.62001 .................................................. (6.2) (11.9) 5.72002 .................................................. 10.0 (22.1) 32.12003 .................................................. 21.0 28.7 (7.7)
Average Annual Gain — 1965-2003 22.2 10.4 11.8Overall Gain — 1964-2003 259,485 4,743
Notes: Data are for calendar years with these exceptions: 1965 and 1966, year ended 9/30; 1967, 15 months ended 12/31.
Starting in 1979, accounting rules required insurance companies to value the equity securities they hold at marketrather than at the lower of cost or market, which was previously the requirement. In this table, Berkshire's resultsthrough 1978 have been restated to conform to the changed rules. In all other respects, the results are calculated usingthe numbers originally reported.The S&P 500 numbers are pre-tax whereas the Berkshire numbers are after-tax. If a corporation such as Berkshirewere simply to have owned the S&P 500 and accrued the appropriate taxes, its results would have lagged the S&P 500in years when that index showed a positive return, but would have exceeded the S&P in years when the index showed anegative return. Over the years, the tax costs would have caused the aggregate lag to be substantial.
3
BERKSHIRE HATHAWAY INC.
To the Shareholders of Berkshire Hathaway Inc.:
Our gain in net worth during 2003 was $13.6 billion, which increased the per-share book value ofboth our Class A and Class B stock by 21%. Over the last 39 years (that is, since present management tookover) per-share book value has grown from $19 to $50,498, a rate of 22.2% compounded annually.*
It’s per-share intrinsic value that counts, however, not book value. Here, the news is good:Between 1964 and 2003, Berkshire morphed from a struggling northern textile business whose intrinsicvalue was less than book into a widely diversified enterprise worth far more than book. Our 39-year gainin intrinsic value has therefore somewhat exceeded our 22.2% gain in book. (For a better understanding ofintrinsic value and the economic principles that guide Charlie Munger, my partner and Berkshire’s vice-chairman, and me in running Berkshire, please read our Owner’s Manual, beginning on page 69.)
Despite their shortcomings, book value calculations are useful at Berkshire as a slightlyunderstated gauge for measuring the long-term rate of increase in our intrinsic value. The calculation isless relevant, however, than it once was in rating any single year’s performance versus the S&P 500 index(a comparison we display on the facing page). Our equity holdings, including convertible preferreds, havefallen considerably as a percentage of our net worth, from an average of 114% in the 1980s, for example, toan average of 50% in 2000-03. Therefore, yearly movements in the stock market now affect a muchsmaller portion of our net worth than was once the case.
Nonetheless, Berkshire’s long-term performance versus the S&P remains all-important. Ourshareholders can buy the S&P through an index fund at very low cost. Unless we achieve gains in per-share intrinsic value in the future that outdo the S&P’s performance, Charlie and I will be adding nothing towhat you can accomplish on your own.
If we fail, we will have no excuses. Charlie and I operate in an ideal environment. To begin with,we are supported by an incredible group of men and women who run our operating units. If there were aCorporate Cooperstown, its roster would surely include many of our CEOs. Any shortfall in Berkshire’sresults will not be caused by our managers.
Additionally, we enjoy a rare sort of managerial freedom. Most companies are saddled withinstitutional constraints. A company’s history, for example, may commit it to an industry that now offerslimited opportunity. A more common problem is a shareholder constituency that pressures its manager todance to Wall Street’s tune. Many CEOs resist, but others give in and adopt operating and capital-allocation policies far different from those they would choose if left to themselves.
At Berkshire, neither history nor the demands of owners impede intelligent decision-making.When Charlie and I make mistakes, they are – in tennis parlance – unforced errors.
*All figures used in this report apply to Berkshire’s A shares, the successor to the only stock that
the company had outstanding before 1996. The B shares have an economic interest equal to 1/30th that ofthe A.
4
Operating Earnings
When valuations are similar, we strongly prefer owning businesses to owning stocks. Duringmost of our years of operation, however, stocks were much the cheaper choice. We therefore sharply tiltedour asset allocation in those years toward equities, as illustrated by the percentages cited earlier.
In recent years, however, we’ve found it hard to find significantly undervalued stocks, a difficultygreatly accentuated by the mushrooming of the funds we must deploy. Today, the number of stocks thatcan be purchased in large enough quantities to move the performance needle at Berkshire is a small fractionof the number that existed a decade ago. (Investment managers often profit far more from piling up assetsthan from handling those assets well. So when one tells you that increased funds won’t hurt his investmentperformance, step back: His nose is about to grow.)
The shortage of attractively-priced stocks in which we can put large sums doesn’t bother us,providing we can find companies to purchase that (1) have favorable and enduring economic charac-teristics; (2) are run by talented and honest managers and (3) are available at a sensible price. We havepurchased a number of such businesses in recent years, though not enough to fully employ the gusher ofcash that has come our way. In buying businesses, I’ve made some terrible mistakes, both of commissionand omission. Overall, however, our acquisitions have led to decent gains in per-share earnings.
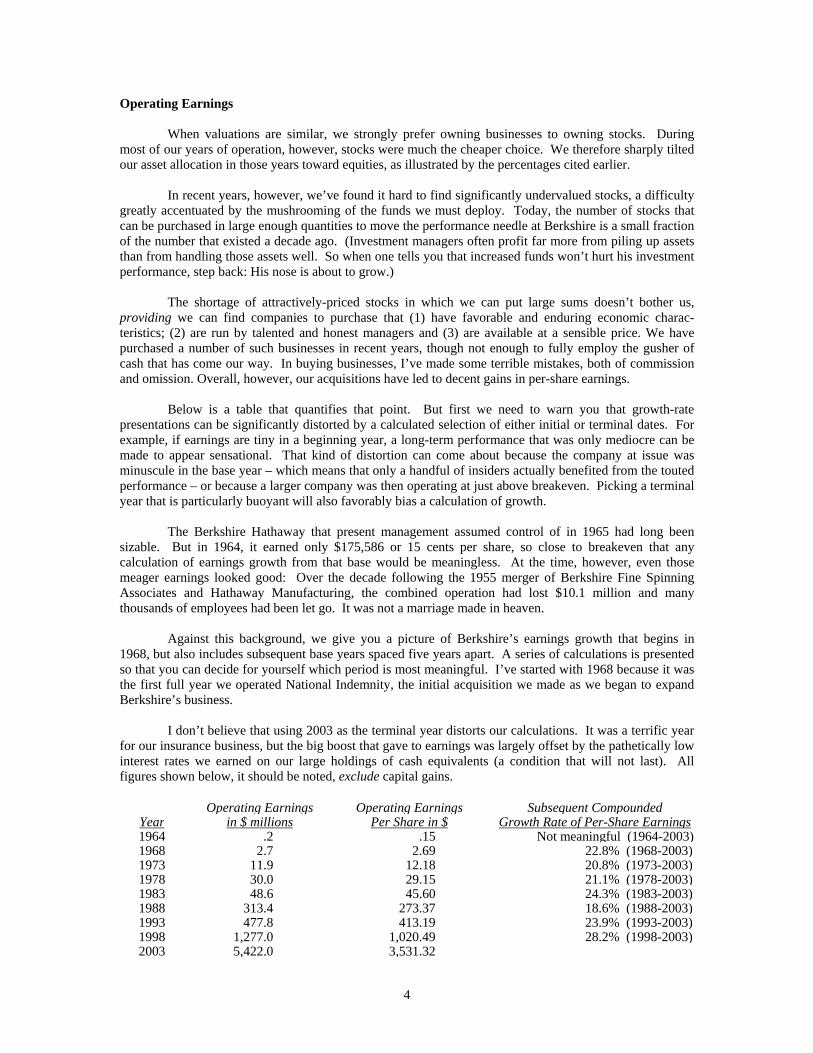
Below is a table that quantifies that point. But first we need to warn you that growth-ratepresentations can be significantly distorted by a calculated selection of either initial or terminal dates. Forexample, if earnings are tiny in a beginning year, a long-term performance that was only mediocre can bemade to appear sensational. That kind of distortion can come about because the company at issue wasminuscule in the base year – which means that only a handful of insiders actually benefited from the toutedperformance – or because a larger company was then operating at just above breakeven. Picking a terminalyear that is particularly buoyant will also favorably bias a calculation of growth.
The Berkshire Hathaway that present management assumed control of in 1965 had long beensizable. But in 1964, it earned only $175,586 or 15 cents per share, so close to breakeven that anycalculation of earnings growth from that base would be meaningless. At the time, however, even thosemeager earnings looked good: Over the decade following the 1955 merger of Berkshire Fine SpinningAssociates and Hathaway Manufacturing, the combined operation had lost $10.1 million and manythousands of employees had been let go. It was not a marriage made in heaven.
Against this background, we give you a picture of Berkshire’s earnings growth that begins in1968, but also includes subsequent base years spaced five years apart. A series of calculations is presentedso that you can decide for yourself which period is most meaningful. I’ve started with 1968 because it wasthe first full year we operated National Indemnity, the initial acquisition we made as we began to expandBerkshire’s business.
I don’t believe that using 2003 as the terminal year distorts our calculations. It was a terrific yearfor our insurance business, but the big boost that gave to earnings was largely offset by the pathetically lowinterest rates we earned on our large holdings of cash equivalents (a condition that will not last). Allfigures shown below, it should be noted, exclude capital gains.
Operating Earnings Operating Earnings Subsequent CompoundedYear in $ millions Per Share in $ Growth Rate of Per-Share Earnings1964 .2 .15 Not meaningful (1964-2003)1968 2.7 2.69 22.8% (1968-2003)1973 11.9 12.18 20.8% (1973-2003)1978 30.0 29.15 21.1% (1978-2003)1983 48.6 45.60 24.3% (1983-2003)1988 313.4 273.37 18.6% (1988-2003)1993 477.8 413.19 23.9% (1993-2003)1998 1,277.0 1,020.49 28.2% (1998-2003)2003 5,422.0 3,531.32
5
We will continue the capital allocation practices we have used in the past. If stocks becomesignificantly cheaper than entire businesses, we will buy them aggressively. If selected bonds becomeattractive, as they did in 2002, we will again load up on these securities. Under any market or economicconditions, we will be happy to buy businesses that meet our standards. And, for those that do, the biggerthe better. Our capital is underutilized now, but that will happen periodically. It’s a painful condition to bein – but not as painful as doing something stupid. (I speak from experience.)
Overall, we are certain Berkshire’s performance in the future will fall far short of what it has beenin the past. Nonetheless, Charlie and I remain hopeful that we can deliver results that are modestly aboveaverage. That’s what we’re being paid for.
Acquisitions
As regular readers know, our acquisitions have often come about in strange ways. None, however,had a more unusual genesis than our purchase last year of Clayton Homes.
The unlikely source was a group of finance students from the University of Tennessee, and theirteacher, Dr. Al Auxier. For the past five years, Al has brought his class to Omaha, where the group toursNebraska Furniture Mart and Borsheim’s, eats at Gorat’s and then comes to Kiewit Plaza for a session withme. Usually about 40 students participate.
After two hours of give-and-take, the group traditionally presents me with a thank-you gift. (Thedoors stay locked until they do.) In past years it’s been items such as a football signed by Phil Fulmer anda basketball from Tennessee’s famous women’s team.
This past February, the group opted for a book – which, luckily for me, was the recently-publishedautobiography of Jim Clayton, founder of Clayton Homes. I already knew the company to be the class actof the manufactured housing industry, knowledge I acquired after earlier making the mistake of buyingsome distressed junk debt of Oakwood Homes, one of the industry’s largest companies. At the time of thatpurchase, I did not understand how atrocious consumer-financing practices had become throughout most ofthe manufactured housing industry. But I learned: Oakwood rather promptly went bankrupt.
Manufactured housing, it should be emphasized, can deliver very good value to home purchasers.Indeed, for decades, the industry has accounted for more than 15% of the homes built in the U.S. Duringthose years, moreover, both the quality and variety of manufactured houses consistently improved.
Progress in design and construction was not matched, however, by progress in distribution andfinancing. Instead, as the years went by, the industry’s business model increasingly centered on the abilityof both the retailer and manufacturer to unload terrible loans on naive lenders. When “securitization” thenbecame popular in the 1990s, further distancing the supplier of funds from the lending transaction, theindustry’s conduct went from bad to worse. Much of its volume a few years back came from buyers whoshouldn’t have bought, financed by lenders who shouldn’t have lent. The consequence has been hugenumbers of repossessions and pitifully low recoveries on the units repossessed.
Oakwood participated fully in the insanity. But Clayton, though it could not isolate itself fromindustry practices, behaved considerably better than its major competitors.
Upon receiving Jim Clayton’s book, I told the students how much I admired his record and theytook that message back to Knoxville, home of both the University of Tennessee and Clayton Homes. Althen suggested that I call Kevin Clayton, Jim’s son and the CEO, to express my views directly. As I talkedwith Kevin, it became clear that he was both able and a straight-shooter.
Soon thereafter, I made an offer for the business based solely on Jim’s book, my evaluation ofKevin, the public financials of Clayton and what I had learned from the Oakwood experience. Clayton’sboard was receptive, since it understood that the large-scale financing Clayton would need in the futuremight be hard to get. Lenders had fled the industry and securitizations, when possible at all, carried far
6
more expensive and restrictive terms than was previously the case. This tightening was particularly seriousfor Clayton, whose earnings significantly depended on securitizations.
Today, the manufactured housing industry remains awash in problems. Delinquencies continuehigh, repossessed units still abound and the number of retailers has been halved. A different businessmodel is required, one that eliminates the ability of the retailer and salesman to pocket substantial moneyup front by making sales financed by loans that are destined to default. Such transactions cause hardship toboth buyer and lender and lead to a flood of repossessions that then undercut the sale of new units. Under aproper model – one requiring significant down payments and shorter-term loans – the industry will likelyremain much smaller than it was in the 90s. But it will deliver to home buyers an asset in which they willhave equity, rather than disappointment, upon resale.
In the “full circle” department, Clayton has agreed to buy the assets of Oakwood. When thetransaction closes, Clayton’s manufacturing capacity, geographical reach and sales outlets will besubstantially increased. As a byproduct, the debt of Oakwood that we own, which we bought at a deepdiscount, will probably return a small profit to us.
And the students? In October, we had a surprise “graduation” ceremony in Knoxville for the 40who sparked my interest in Clayton. I donned a mortarboard and presented each student with both a PhD(for phenomenal, hard-working dealmaker) from Berkshire and a B share. Al got an A share. If you meetsome of the new Tennessee shareholders at our annual meeting, give them your thanks. And ask them ifthey’ve read any good books lately.
* * * * * * * * * * * *
In early spring, Byron Trott, a Managing Director of Goldman Sachs, told me that Wal-Martwished to sell its McLane subsidiary. McLane distributes groceries and nonfood items to conveniencestores, drug stores, wholesale clubs, mass merchandisers, quick service restaurants, theaters and others. It’sa good business, but one not in the mainstream of Wal-Mart’s future. It’s made to order, however, for us.
McLane has sales of about $23 billion, but operates on paper-thin margins – about 1% pre-tax –and will swell Berkshire’s sales figures far more than our income. In the past, some retailers had shunnedMcLane because it was owned by their major competitor. Grady Rosier, McLane’s superb CEO, hasalready landed some of these accounts – he was in full stride the day the deal closed – and more will come.
For several years, I have given my vote to Wal-Mart in the balloting for Fortune Magazine’s“Most Admired” list. Our McLane transaction reinforced my opinion. To make the McLane deal, I had asingle meeting of about two hours with Tom Schoewe, Wal-Mart’s CFO, and we then shook hands. (Hedid, however, first call Bentonville). Twenty-nine days later Wal-Mart had its money. We did no “duediligence.” We knew everything would be exactly as Wal-Mart said it would be – and it was.
I should add that Byron has now been instrumental in three Berkshire acquisitions. Heunderstands Berkshire far better than any investment banker with whom we have talked and – it hurts me tosay this – earns his fee. I’m looking forward to deal number four (as, I am sure, is he).
Taxes
On May 20, 2003, The Washington Post ran an op-ed piece by me that was critical of the Bush taxproposals. Thirteen days later, Pamela Olson, Assistant Secretary for Tax Policy at the U.S. Treasury,delivered a speech about the new tax legislation saying, “That means a certain midwestern oracle, who, itmust be noted, has played the tax code like a fiddle, is still safe retaining all his earnings.” I think she wastalking about me.
Alas, my “fiddle playing” will not get me to Carnegie Hall – or even to a high school recital.Berkshire, on your behalf and mine, will send the Treasury $3.3 billion for tax on its 2003 income, a sumequaling 2½% of the total income tax paid by all U.S. corporations in fiscal 2003. (In contrast, Berkshire’smarket valuation is about 1% of the value of all American corporations.) Our payment will almost

7
certainly place us among our country’s top ten taxpayers. Indeed, if only 540 taxpayers paid the amountBerkshire will pay, no other individual or corporation would have to pay anything to Uncle Sam. That’sright: 290 million Americans and all other businesses would not have to pay a dime in income, socialsecurity, excise or estate taxes to the federal government. (Here’s the math: Federal tax receipts, includingsocial security receipts, in fiscal 2003 totaled $1.782 trillion and 540 “Berkshires,” each paying $3.3billion, would deliver the same $1.782 trillion.)
Our federal tax return for 2002 (2003 is not finalized), when we paid $1.75 billion, covered a mere8,905 pages. As is required, we dutifully filed two copies of this return, creating a pile of paper seven feettall. At World Headquarters, our small band of 15.8, though exhausted, momentarily flushed with pride:Berkshire, we felt, was surely pulling its share of our country’s fiscal load.
But Ms. Olson sees things otherwise. And if that means Charlie and I need to try harder, we areready to do so.
I do wish, however, that Ms. Olson would give me some credit for the progress I’ve already made.In 1944, I filed my first 1040, reporting my income as a thirteen-year-old newspaper carrier. The returncovered three pages. After I claimed the appropriate business deductions, such as $35 for a bicycle, my taxbill was $7. I sent my check to the Treasury and it – without comment – promptly cashed it. We lived inpeace.
* * * * * * * * * * * *
I can understand why the Treasury is now frustrated with Corporate America and prone tooutbursts. But it should look to Congress and the Administration for redress, not to Berkshire.
Corporate income taxes in fiscal 2003 accounted for 7.4% of all federal tax receipts, down from apost-war peak of 32% in 1952. With one exception (1983), last year’s percentage is the lowest recordedsince data was first published in 1934.
Even so, tax breaks for corporations (and their investors, particularly large ones) were a major partof the Administration’s 2002 and 2003 initiatives. If class warfare is being waged in America, my class isclearly winning. Today, many large corporations – run by CEOs whose fiddle-playing talents make yourChairman look like he is all thumbs – pay nothing close to the stated federal tax rate of 35%.
In 1985, Berkshire paid $132 million in federal income taxes, and all corporations paid $61billion. The comparable amounts in 1995 were $286 million and $157 billion respectively. And, asmentioned, we will pay about $3.3 billion for 2003, a year when all corporations paid $132 billion. Wehope our taxes continue to rise in the future – it will mean we are prospering – but we also hope that therest of Corporate America antes up along with us. This might be a project for Ms. Olson to work on.
Corporate Governance
In judging whether Corporate America is serious about reforming itself, CEO pay remains the acidtest. To date, the results aren’t encouraging. A few CEOs, such as Jeff Immelt of General Electric, haveled the way in initiating programs that are fair to managers and shareholders alike. Generally, however, hisexample has been more admired than followed.
It’s understandable how pay got out of hand. When management hires employees, or whencompanies bargain with a vendor, the intensity of interest is equal on both sides of the table. One party’sgain is the other party’s loss, and the money involved has real meaning to both. The result is an honest-to-God negotiation.
But when CEOs (or their representatives) have met with compensation committees, too often oneside – the CEO’s – has cared far more than the other about what bargain is struck. A CEO, for example,will always regard the difference between receiving options for 100,000 shares or for 500,000 asmonumental. To a comp committee, however, the difference may seem unimportant – particularly if, as
8
has been the case at most companies, neither grant will have any effect on reported earnings. Under theseconditions, the negotiation often has a “play-money” quality.
Overreaching by CEOs greatly accelerated in the 1990s as compensation packages gained by themost avaricious– a title for which there was vigorous competition – were promptly replicated elsewhere.The couriers for this epidemic of greed were usually consultants and human relations departments, whichhad no trouble perceiving who buttered their bread. As one compensation consultant commented: “Thereare two classes of clients you don’t want to offend – actual and potential.”
In proposals for reforming this malfunctioning system, the cry has been for “independent”directors. But the question of what truly motivates independence has largely been neglected.
In last year’s report, I took a look at how “independent” directors – as defined by statute – hadperformed in the mutual fund field. The Investment Company Act of 1940 mandated such directors, andthat means we’ve had an extended test of what statutory standards produce. In our examination last year,we looked at the record of fund directors in respect to the two key tasks board members should perform –whether at a mutual fund business or any other. These two all-important functions are, first, to obtain (orretain) an able and honest manager and then to compensate that manager fairly.
Our survey was not encouraging. Year after year, at literally thousands of funds, directors hadroutinely rehired the incumbent management company, however pathetic its performance had been. Just asroutinely, the directors had mindlessly approved fees that in many cases far exceeded those that could havebeen negotiated. Then, when a management company was sold – invariably at a huge price relative totangible assets – the directors experienced a “counter-revelation” and immediately signed on with the newmanager and accepted its fee schedule. In effect, the directors decided that whoever would pay the mostfor the old management company was the party that should manage the shareholders’ money in the future.
Despite the lapdog behavior of independent fund directors, we did not conclude that they are badpeople. They’re not. But sadly, “boardroom atmosphere” almost invariably sedates their fiduciary genes.
On May 22, 2003, not long after Berkshire’s report appeared, the Chairman of the InvestmentCompany Institute addressed its membership about “The State of our Industry.” Responding to those whohave “weighed in about our perceived failings,” he mused, “It makes me wonder what life would be like ifwe’d actually done something wrong.”
Be careful what you wish for.
Within a few months, the world began to learn that many fund-management companies hadfollowed policies that hurt the owners of the funds they managed, while simultaneously boosting the fees ofthe managers. Prior to their transgressions, it should be noted, these management companies were earningprofit margins and returns on tangible equity that were the envy of Corporate America. Yet to swell profitsfurther, they trampled on the interests of fund shareholders in an appalling manner.
So what are the directors of these looted funds doing? As I write this, I have seen none that haveterminated the contract of the offending management company (though naturally that entity has often firedsome of its employees). Can you imagine directors who had been personally defrauded taking such a boys-will-be-boys attitude?
To top it all off, at least one miscreant management company has put itself up for sale,undoubtedly hoping to receive a huge sum for “delivering” the mutual funds it has managed to the highestbidder among other managers. This is a travesty. Why in the world don’t the directors of those fundssimply select whomever they think is best among the bidding organizations and sign up with that partydirectly? The winner would consequently be spared a huge “payoff” to the former manager who, havingflouted the principles of stewardship, deserves not a dime. Not having to bear that acquisition cost, thewinner could surely manage the funds in question for a far lower ongoing fee than would otherwise havebeen the case. Any truly independent director should insist on this approach to obtaining a new manager.

9
The reality is that neither the decades-old rules regulating investment company directors nor thenew rules bearing down on Corporate America foster the election of truly independent directors. In bothinstances, an individual who is receiving 100% of his income from director fees – and who may wish toenhance his income through election to other boards – is deemed independent. That is nonsense. The samerules say that Berkshire director and lawyer Ron Olson, who receives from us perhaps 3% of his very largeincome, does not qualify as independent because that 3% comes from legal fees Berkshire pays his firmrather than from fees he earns as a Berkshire director. Rest assured, 3% from any source would not torpedoRon’s independence. But getting 20%, 30% or 50% of their income from director fees might well temperthe independence of many individuals, particularly if their overall income is not large. Indeed, I think it’sclear that at mutual funds, it has.
* * * * * * * * * * *
Let me make a small suggestion to “independent” mutual fund directors. Why not simply affirmin each annual report that “(1) We have looked at other management companies and believe the one wehave retained for the upcoming year is among the better operations in the field; and (2) we have negotiateda fee with our managers comparable to what other clients with equivalent funds would negotiate.”
It does not seem unreasonable for shareholders to expect fund directors – who are often receivingfees that exceed $100,000 annually – to declare themselves on these points. Certainly these directorswould satisfy themselves on both matters were they handing over a large chunk of their own money to themanager. If directors are unwilling to make these two declarations, shareholders should heed the maxim“If you don’t know whose side someone is on, he’s probably not on yours.”
Finally, a disclaimer. A great many funds have been run well and conscientiously despite theopportunities for malfeasance that exist. The shareholders of these funds have benefited, and theirmanagers have earned their pay. Indeed, if I were a director of certain funds, including some that chargeabove-average fees, I would enthusiastically make the two declarations I have suggested. Additionally,those index funds that are very low-cost (such as Vanguard’s) are investor-friendly by definition and arethe best selection for most of those who wish to own equities.
I am on my soapbox now only because the blatant wrongdoing that has occurred has betrayed thetrust of so many millions of shareholders. Hundreds of industry insiders had to know what was going on,yet none publicly said a word. It took Eliot Spitzer, and the whistleblowers who aided him, to initiate ahousecleaning. We urge fund directors to continue the job. Like directors throughout Corporate America,these fiduciaries must now decide whether their job is to work for owners or for managers.
Berkshire Governance
True independence – meaning the willingness to challenge a forceful CEO when something iswrong or foolish – is an enormously valuable trait in a director. It is also rare. The place to look for it isamong high-grade people whose interests are in line with those of rank-and-file shareholders – and are inline in a very big way.
We’ve made that search at Berkshire. We now have eleven directors and each of them, combinedwith members of their families, owns more than $4 million of Berkshire stock. Moreover, all have heldmajor stakes in Berkshire for many years. In the case of six of the eleven, family ownership amounts to atleast hundreds of millions and dates back at least three decades. All eleven directors purchased theirholdings in the market just as you did; we’ve never passed out options or restricted shares. Charlie and Ilove such honest-to-God ownership. After all, who ever washes a rental car?
In addition, director fees at Berkshire are nominal (as my son, Howard, periodically reminds me).Thus, the upside from Berkshire for all eleven is proportionately the same as the upside for any Berkshireshareholder. And it always will be.

10
The downside for Berkshire directors is actually worse than yours because we carry no directorsand officers liability insurance. Therefore, if something really catastrophic happens on our directors’watch, they are exposed to losses that will far exceed yours.
The bottom line for our directors: You win, they win big; you lose, they lose big. Our approachmight be called owner-capitalism. We know of no better way to engender true independence. (Thisstructure does not guarantee perfect behavior, however: I’ve sat on boards of companies in which Berkshirehad huge stakes and remained silent as questionable proposals were rubber-stamped.)
In addition to being independent, directors should have business savvy, a shareholder orientationand a genuine interest in the company. The rarest of these qualities is business savvy – and if it is lacking,the other two are of little help. Many people who are smart, articulate and admired have no realunderstanding of business. That’s no sin; they may shine elsewhere. But they don’t belong on corporateboards. Similarly, I would be useless on a medical or scientific board (though I would likely be welcomedby a chairman who wanted to run things his way). My name would dress up the list of directors, but Iwouldn’t know enough to critically evaluate proposals. Moreover, to cloak my ignorance, I would keep mymouth shut (if you can imagine that). In effect, I could be replaced, without loss, by a potted plant.
Last year, as we moved to change our board, I asked for self-nominations from shareholders whobelieved they had the requisite qualities to be a Berkshire director. Despite the lack of either liabilityinsurance or meaningful compensation, we received more than twenty applications. Most were good,coming from owner-oriented individuals having family holdings of Berkshire worth well over $1 million.After considering them, Charlie and I – with the concurrence of our incumbent directors – asked fourshareholders who did not nominate themselves to join the board: David Gottesman, Charlotte Guyman,Don Keough and Tom Murphy. These four people are all friends of mine, and I know their strengths well.They bring an extraordinary amount of business talent to Berkshire’s board.
The primary job of our directors is to select my successor, either upon my death or disability, orwhen I begin to lose my marbles. (David Ogilvy had it right when he said: “Develop your eccentricitieswhen young. That way, when you get older, people won’t think you are going gaga.” Charlie’s family andmine feel that we overreacted to David’s advice.)
At our directors’ meetings we cover the usual run of housekeeping matters. But the realdiscussion – both with me in the room and absent – centers on the strengths and weaknesses of the fourinternal candidates to replace me.
Our board knows that the ultimate scorecard on its performance will be determined by the recordof my successor. He or she will need to maintain Berkshire’s culture, allocate capital and keep a group ofAmerica’s best managers happy in their jobs. This isn’t the toughest task in the world – the train is alreadymoving at a good clip down the track – and I’m totally comfortable about it being done well by any of thefour candidates we have identified. I have more than 99% of my net worth in Berkshire and will be happyto have my wife or foundation (depending on the order in which she and I die) continue this concentration.
Sector Results
As managers, Charlie and I want to give our owners the financial information and commentary wewould wish to receive if our roles were reversed. To do this with both clarity and reasonable brevitybecomes more difficult as Berkshire’s scope widens. Some of our businesses have vastly differenteconomic characteristics from others, which means that our consolidated statements, with their jumble offigures, make useful analysis almost impossible.
On the following pages, therefore, we will present some balance sheet and earnings figures fromour four major categories of businesses along with commentary about each. We particularly want you tounderstand the limited circumstances under which we will use debt, since typically we shun it. We willnot, however, inundate you with data that has no real value in calculating Berkshire’s intrinsic value.Doing so would likely obfuscate the most important facts. One warning: When analyzing Berkshire, be

11
sure to remember that the company should be viewed as an unfolding movie, not as a still photograph.Those who focused in the past on only the snapshot of the day sometimes reached erroneous conclusions.
Insurance
Let’s start with insurance – since that’s where the money is.
The fountain of funds we enjoy in our insurance operations comes from “float,” which is moneythat doesn’t belong to us but that we temporarily hold. Most of our float arises because (1) premiums arepaid upfront though the service we provide – insurance protection – is delivered over a period that usuallycovers a year and; (2) loss events that occur today do not always result in our immediately paying claims,since it sometimes takes years for losses to be reported (think asbestos), negotiated and settled.
Float is wonderful – if it doesn’t come at a high price. The cost of float is determined byunderwriting results, meaning how losses and expenses paid compare with premiums received. Theproperty-casualty industry as a whole regularly operates at a substantial underwriting loss, and thereforeoften has a cost of float that is unattractive.
Overall, our results have been good. True, we’ve had five terrible years in which float cost usmore than 10%. But in 18 of the 37 years Berkshire has been in the insurance business, we have operatedat an underwriting profit, meaning we were actually paid for holding money. And the quantity of thischeap money has grown far beyond what I dreamed it could when we entered the business in 1967.
Yearend Float (in $ millions)Other Other
Year GEICO General Re Reinsurance Primary Total1967 20 201977 40 131 1711987 701 807 1,5081997 2,917 4,014 455 7,3861998 3,125 14,909 4,305 415 22,7541999 3,444 15,166 6,285 403 25,2982000 3,943 15,525 7,805 598 27,8712001 4,251 19,310 11,262 685 35,5082002 4,678 22,207 13,396 943 41,2242003 5,287 23,654 13,948 1,331 44,220
Last year was a standout. Float reached record levels and it came without cost as all majorsegments contributed to Berkshire’s $1.7 billion pre-tax underwriting profit.
Our results have been exceptional for one reason: We have truly exceptional managers. Insurerssell a non-proprietary piece of paper containing a non-proprietary promise. Anyone can copy anyone else’sproduct. No installed base, key patents, critical real estate or natural resource position protects an insurer’scompetitive position. Typically, brands do not mean much either.
The critical variables, therefore, are managerial brains, discipline and integrity. Our managershave all of these attributes – in spades. Let’s take a look at these all-stars and their operations.
• General Re had been Berkshire’s problem child in the years following our acquisition of it in1998. Unfortunately, it was a 400-pound child, and its negative impact on our overallperformance was large.
That’s behind us: Gen Re is fixed. Thank Joe Brandon, its CEO, and his partner, TadMontross, for that. When I wrote you last year, I thought that discipline had been restored toboth underwriting and reserving, and events during 2003 solidified my view.
12
That does not mean we will never have setbacks. Reinsurance is a business that is certain todeliver blows from time to time. But, under Joe and Tad, this operation will be a powerfulengine driving Berkshire’s future profitability.
Gen Re’s financial strength, unmatched among reinsurers even as we started 2003, furtherimproved during the year. Many of the company’s competitors suffered credit downgradeslast year, leaving Gen Re, and its sister operation at National Indemnity, as the only AAA-rated companies among the world’s major reinsurers.
When insurers purchase reinsurance, they buy only a promise – one whose validity may notbe tested for decades – and there are no promises in the reinsurance world equaling thoseoffered by Gen Re and National Indemnity. Furthermore, unlike most reinsurers, we retainvirtually all of the risks we assume. Therefore, our ability to pay is not dependent on theability or willingness of others to reimburse us. This independent financial strength could beenormously important when the industry experiences the mega-catastrophe it surely will.
• Regular readers of our annual reports know of Ajit Jain’s incredible contributions toBerkshire’s prosperity over the past 18 years. He continued to pour it on in 2003. With astaff of only 23, Ajit runs one of the world’s largest reinsurance operations, specializing inmammoth and unusual risks.
Often, these involve assuming catastrophe risks – say, the threat of a large Californiaearthquake – of a size far greater than any other reinsurer will accept. This means Ajit’sresults (and Berkshire’s) will be lumpy. You should, therefore, expect his operation to havean occasional horrible year. Over time, however, you can be confident of a terrific result fromthis one-of-a-kind manager.
Ajit writes some very unusual policies. Last year, for example, PepsiCo promoted a drawingthat offered participants a chance to win a $1 billion prize. Understandably, Pepsi wished tolay off this risk, and we were the logical party to assume it. So we wrote a $1 billion policy,retaining the risk entirely for our own account. Because the prize, if won, was payable overtime, our exposure in present-value terms was $250 million. (I helpfully suggested that anywinner be paid $1 a year for a billion years, but that proposal didn’t fly.) The drawing washeld on September 14. Ajit and I held our breath, as did the finalist in the contest, and we lefthappier than he. PepsiCo has renewed for a repeat contest in 2004.
• GEICO was a fine insurance company when Tony Nicely took over as CEO in 1992. Now itis a great one. During his tenure, premium volume has increased from $2.2 billion to $8.1billion, and our share of the personal-auto market has grown from 2.1% to 5.0%. Moreimportant, GEICO has paired these gains with outstanding underwriting performance.
(We now pause for a commercial)
It’s been 67 years since Leo Goodwin created a great business idea at GEICO, one designedto save policyholders significant money. Go to Geico.com or call 1-800-847-7536 to seewhat we can do for you.
(End of commercial)
In 2003, both the number of inquiries coming into GEICO and its closure rate on theseincreased significantly. As a result our preferred policyholder count grew 8.2%, and ourstandard and non-standard policies grew 21.4%.
GEICO’s business growth creates a never-ending need for more employees and facilities.Our most recent expansion, announced in December, is a customer service center in – I’mdelighted to say – Buffalo. Stan Lipsey, the publisher of our Buffalo News, was instrumentalin bringing the city and GEICO together.
13
The key figure in this matter, however, was Governor George Pataki. His leadership andtenacity are why Buffalo will have 2,500 new jobs when our expansion is fully rolled out.Stan, Tony, and I – along with Buffalo – thank him for his help.
• Berkshire’s smaller insurers had another terrific year. This group, run by Rod Eldred, JohnKizer, Tom Nerney, Don Towle and Don Wurster, increased its float by 41%, whiledelivering an excellent underwriting profit. These men, though operating in unexciting ways,produce truly exciting results.
* * * * * * * * * * * *
We should point out again that in any given year a company writing long-tail insurance (coveragesgiving rise to claims that are often settled many years after the loss-causing event takes place) can reportalmost any earnings that the CEO desires. Too often the industry has reported wildly inaccurate figures bymisstating liabilities. Most of the mistakes have been innocent. Sometimes, however, they have beenintentional, their object being to fool investors and regulators. Auditors and actuaries have usually failed toprevent both varieties of misstatement.
I have failed on occasion too, particularly in not spotting Gen Re’s unwitting underreserving a fewyears back. Not only did that mean we reported inaccurate figures to you, but the error also resulted in ourpaying very substantial taxes earlier than was necessary. Aaarrrggghh. I told you last year, however, that Ithought our current reserving was at appropriate levels. So far, that judgment is holding up.
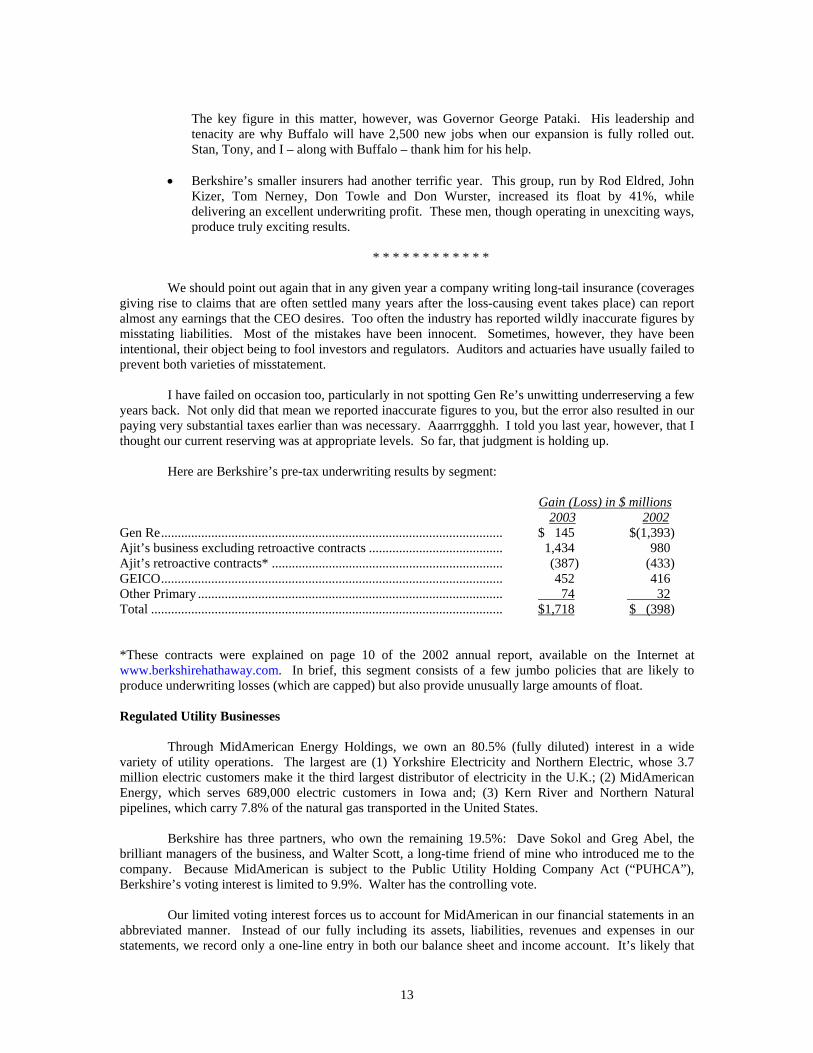
Here are Berkshire’s pre-tax underwriting results by segment:
Gain (Loss) in $ millions2003 2002
Gen Re...................................................................................................... $ 145 $(1,393)Ajit’s business excluding retroactive contracts ........................................ 1,434 980Ajit’s retroactive contracts* ..................................................................... (387) (433)GEICO...................................................................................................... 452 416Other Primary ........................................................................................... 74 32Total ......................................................................................................... $1,718 $ (398)
*These contracts were explained on page 10 of the 2002 annual report, available on the Internet atwww.berkshirehathaway.com. In brief, this segment consists of a few jumbo policies that are likely toproduce underwriting losses (which are capped) but also provide unusually large amounts of float.
Regulated Utility Businesses
Through MidAmerican Energy Holdings, we own an 80.5% (fully diluted) interest in a widevariety of utility operations. The largest are (1) Yorkshire Electricity and Northern Electric, whose 3.7million electric customers make it the third largest distributor of electricity in the U.K.; (2) MidAmericanEnergy, which serves 689,000 electric customers in Iowa and; (3) Kern River and Northern Naturalpipelines, which carry 7.8% of the natural gas transported in the United States.
Berkshire has three partners, who own the remaining 19.5%: Dave Sokol and Greg Abel, thebrilliant managers of the business, and Walter Scott, a long-time friend of mine who introduced me to thecompany. Because MidAmerican is subject to the Public Utility Holding Company Act (“PUHCA”),Berkshire’s voting interest is limited to 9.9%. Walter has the controlling vote.
Our limited voting interest forces us to account for MidAmerican in our financial statements in anabbreviated manner. Instead of our fully including its assets, liabilities, revenues and expenses in ourstatements, we record only a one-line entry in both our balance sheet and income account. It’s likely that

14
some day, perhaps soon, either PUHCA will be repealed or accounting rules will change. Berkshire’sconsolidated figures would then take in all of MidAmerican, including the substantial debt it utilizes.
The size of this debt (which is not now, nor will it be, an obligation of Berkshire) is entirelyappropriate. MidAmerican’s diverse and stable utility operations assure that, even under harsh economicconditions, aggregate earnings will be ample to very comfortably service all debt.
At yearend, $1.578 billion of MidAmerican’s most junior debt was payable to Berkshire. Thisdebt has allowed acquisitions to be financed without our three partners needing to increase their alreadysubstantial investments in MidAmerican. By charging 11% interest, Berkshire is compensated fairly forputting up the funds needed for purchases, while our partners are spared dilution of their equity interests.
MidAmerican also owns a significant non-utility business, Home Services of America, the secondlargest real estate broker in the country. Unlike our utility operations, this business is highly cyclical, butnevertheless one we view enthusiastically. We have an exceptional manager, Ron Peltier, who, throughboth his acquisition and operational skills, is building a brokerage powerhouse.
Last year, Home Services participated in $48.6 billion of transactions, a gain of $11.7 billion from2002. About 23% of the increase came from four acquisitions made during the year. Through our 16brokerage firms – all of which retain their local identities – we employ 16,343 brokers in 16 states. HomeServices is almost certain to grow substantially in the next decade as we continue to acquire leadinglocalized operations.
* * * * * * * * * * * *
Here’s a tidbit for fans of free enterprise. On March 31, 1990, the day electric utilities in the U.K.were denationalized, Northern and Yorkshire had 6,800 employees in functions these companies continuetoday to perform. Now they employ 2,539. Yet the companies are serving about the same number ofcustomers as when they were government owned and are distributing more electricity.
This is not, it should be noted, a triumph of deregulation. Prices and earnings continue to beregulated in a fair manner by the government, just as they should be. It is a victory, however, for those whobelieve that profit-motivated managers, even though they recognize that the benefits will largely flow tocustomers, will find efficiencies that government never will.
Here are some key figures on MidAmerican’s operations:
Earnings (in $ millions)2003 2002
U.K. Utilities ...................................................................................................... $ 289 $ 267Iowa.................................................................................................................... 269 241Pipelines ............................................................................................................. 261 104Home Services.................................................................................................... 113 70Other (Net) ......................................................................................................... 144 108Earnings before corporate interest and tax ......................................................... 1,076 790Corporate Interest, other than to Berkshire......................................................... (225) (192)Interest Payments to Berkshire ........................................................................... (184) (118)Tax...................................................................................................................... (251) (100)Net Earnings ....................................................................................................... $ 416 $ 380
Earnings Applicable to Berkshire*..................................................................... $ 429 $ 359Debt Owed to Others .......................................................................................... 10,296 10,286Debt Owed to Berkshire ..................................................................................... 1,578 1,728
*Includes interest paid to Berkshire (net of related income taxes) of $118 in 2003 and $75 in 2002.
15
Finance and Financial Products
This sector includes a wide-ranging group of activities. Here’s some commentary on the mostimportant.
• I manage a few opportunistic strategies in AAA fixed-income securities that have been quiteprofitable in the last few years. These opportunities come and go – and at present, they aregoing. We sped their departure somewhat last year, thereby realizing 24% of the capital gainswe show in the table that follows.
Though far from foolproof, these transactions involve no credit risk and are conducted inexceptionally liquid securities. We therefore finance the positions almost entirely withborrowed money. As the assets are reduced, so also are the borrowings. The smallerportfolio we now have means that in the near future our earnings in this category will declinesignificantly. It was fun while it lasted, and at some point we’ll get another turn at bat.
• A far less pleasant unwinding operation is taking place at Gen Re Securities, the trading andderivatives operation we inherited when we purchased General Reinsurance.
When we began to liquidate Gen Re Securities in early 2002, it had 23,218 outstanding ticketswith 884 counterparties (some having names I couldn’t pronounce, much lesscreditworthiness I could evaluate). Since then, the unit’s managers have been skillful anddiligent in unwinding positions. Yet, at yearend – nearly two years later – we still had 7,580tickets outstanding with 453 counterparties. (As the country song laments, “How can I missyou if you won’t go away?”)
The shrinking of this business has been costly. We’ve had pre-tax losses of $173 million in2002 and $99 million in 2003. These losses, it should be noted, came from a portfolio ofcontracts that – in full compliance with GAAP – had been regularly marked-to-market withstandard allowances for future credit-loss and administrative costs. Moreover, our liquidationhas taken place both in a benign market – we’ve had no credit losses of significance – and inan orderly manner. This is just the opposite of what might be expected if a financial crisisforced a number of derivatives dealers to cease operations simultaneously.
If our derivatives experience – and the Freddie Mac shenanigans of mind-blowing size andaudacity that were revealed last year – makes you suspicious of accounting in this arena,consider yourself wised up. No matter how financially sophisticated you are, you can’tpossibly learn from reading the disclosure documents of a derivatives-intensive companywhat risks lurk in its positions. Indeed, the more you know about derivatives, the less youwill feel you can learn from the disclosures normally proffered you. In Darwin’s words,“Ignorance more frequently begets confidence than does knowledge.”
* * * * * * * * * * * *
And now it’s confession time: I’m sure I could have saved you $100 million or so, pre-tax, if Ihad acted more promptly to shut down Gen Re Securities. Both Charlie and I knew at thetime of the General Reinsurance merger that its derivatives business was unattractive.Reported profits struck us as illusory, and we felt that the business carried sizable risks thatcould not effectively be measured or limited. Moreover, we knew that any major problemsthe operation might experience would likely correlate with troubles in the financial orinsurance world that would affect Berkshire elsewhere. In other words, if the derivativesbusiness were ever to need shoring up, it would commandeer the capital and credit ofBerkshire at just the time we could otherwise deploy those resources to huge advantage. (Ahistorical note: We had just such an experience in 1974 when we were the victim of a majorinsurance fraud. We could not determine for some time how much the fraud would ultimatelycost us and therefore kept more funds in cash-equivalents than we normally would have.
16
Absent this precaution, we would have made larger purchases of stocks that were thenextraordinarily cheap.)
Charlie would have moved swiftly to close down Gen Re Securities – no question about that.I, however, dithered. As a consequence, our shareholders are paying a far higher price thanwas necessary to exit this business.
• Though we include Gen Re’s sizable life and health reinsurance business in the “insurance”sector, we show the results for Ajit Jain’s life and annuity business in this section. That’sbecause this business, in large part, involves arbitraging money. Our annuities range from aretail product sold directly on the Internet to structured settlements that require us to makepayments for 70 years or more to people severely injured in accidents.
We’ve realized some extra income in this business because of accelerated principal paymentswe received from certain fixed-income securities we had purchased at discounts. Thisphenomenon has ended, and earnings are therefore likely to be lower in this segment duringthe next few years.
• We have a $604 million investment in Value Capital, a partnership run by Mark Byrne, amember of a family that has helped Berkshire over the years in many ways. Berkshire is alimited partner in, and has no say in the management of, Mark’s enterprise, which specializesin highly-hedged fixed-income opportunities. Mark is smart and honest and, along with hisfamily, has a significant investment in Value.
Because of accounting abuses at Enron and elsewhere, rules will soon be instituted that arelikely to require that Value’s assets and liabilities be consolidated on Berkshire’s balancesheet. We regard this requirement as inappropriate, given that Value’s liabilities – whichusually are above $20 billion – are in no way ours. Over time, other investors will join us aspartners in Value. When enough do, the need for us to consolidate Value will disappear.
• We have told you in the past about Berkadia, the partnership we formed three years ago withLeucadia to finance and manage the wind-down of Finova, a bankrupt lending operation. Theplan was that we would supply most of the capital and Leucadia would supply most of thebrains. And that’s the way it has worked. Indeed, Joe Steinberg and Ian Cumming, whotogether run Leucadia, have done such a fine job in liquidating Finova’s portfolio that the $5.6billion guarantee we took on in connection with the transaction has been extinguished. Theunfortunate byproduct of this fast payoff is that our future income will be much reduced.Overall, Berkadia has made excellent money for us, and Joe and Ian have been terrificpartners.
• Our leasing businesses are XTRA (transportation equipment) and CORT (office furniture).Both operations have had poor earnings during the past two years as the recession causeddemand to drop considerably more than was anticipated. They remain leaders in their fields,and I expect at least a modest improvement in their earnings this year.
• Through our Clayton purchase, we acquired a significant manufactured-housing financeoperation. Clayton, like others in this business, had traditionally securitized the loans itoriginated. The practice relieved stress on Clayton’s balance sheet, but a by-product was the“front-ending” of income (a result dictated by GAAP).
We are in no hurry to record income, have enormous balance-sheet strength, and believe thatover the long-term the economics of holding our consumer paper are superior to what we cannow realize through securitization. So Clayton has begun to retain its loans.
We believe it’s appropriate to finance a soundly-selected book of interest-bearing receivablesalmost entirely with debt (just as a bank would). Therefore, Berkshire will borrow money tofinance Clayton’s portfolio and re-lend these funds to Clayton at our cost plus one percentage
17
point. This markup fairly compensates Berkshire for putting its exceptional creditworthinessto work, but it still delivers money to Clayton at an attractive price.
In 2003, Berkshire did $2 billion of such borrowing and re-lending, with Clayton using muchof this money to fund several large purchases of portfolios from lenders exiting the business.A portion of our loans to Clayton also provided “catch-up” funding for paper it had generatedearlier in the year from its own operation and had found difficult to securitize.
You may wonder why we borrow money while sitting on a mountain of cash. It’s because ofour “every tub on its own bottom” philosophy. We believe that any subsidiary lending moneyshould pay an appropriate rate for the funds needed to carry its receivables and should not besubsidized by its parent. Otherwise, having a rich daddy can lead to sloppy decisions.Meanwhile, the cash we accumulate at Berkshire is destined for business acquisitions or forthe purchase of securities that offer opportunities for significant profit. Clayton’s loanportfolio will likely grow to at least $5 billion in not too many years and, with sensible creditstandards in place, should deliver significant earnings.
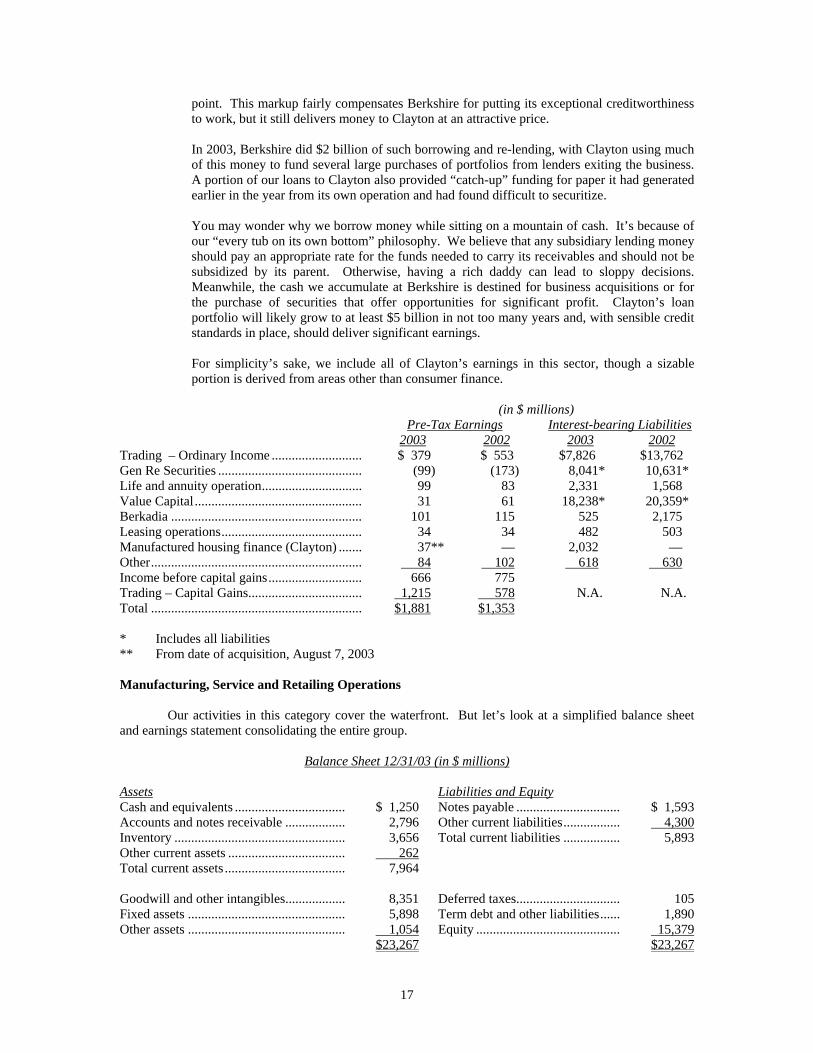
For simplicity’s sake, we include all of Clayton’s earnings in this sector, though a sizableportion is derived from areas other than consumer finance.
(in $ millions)Pre-Tax Earnings Interest-bearing Liabilities
2003 2002 2003 2002Trading – Ordinary Income ........................... $ 379 $ 553 $7,826 $13,762Gen Re Securities ........................................... (99) (173) 8,041* 10,631*Life and annuity operation.............................. 99 83 2,331 1,568Value Capital.................................................. 31 61 18,238* 20,359*Berkadia ......................................................... 101 115 525 2,175Leasing operations.......................................... 34 34 482 503Manufactured housing finance (Clayton) ....... 37** — 2,032 —Other............................................................... 84 102 618 630Income before capital gains............................ 666 775Trading – Capital Gains.................................. 1,215 578 N.A. N.A.Total ............................................................... $1,881 $1,353
* Includes all liabilities** From date of acquisition, August 7, 2003
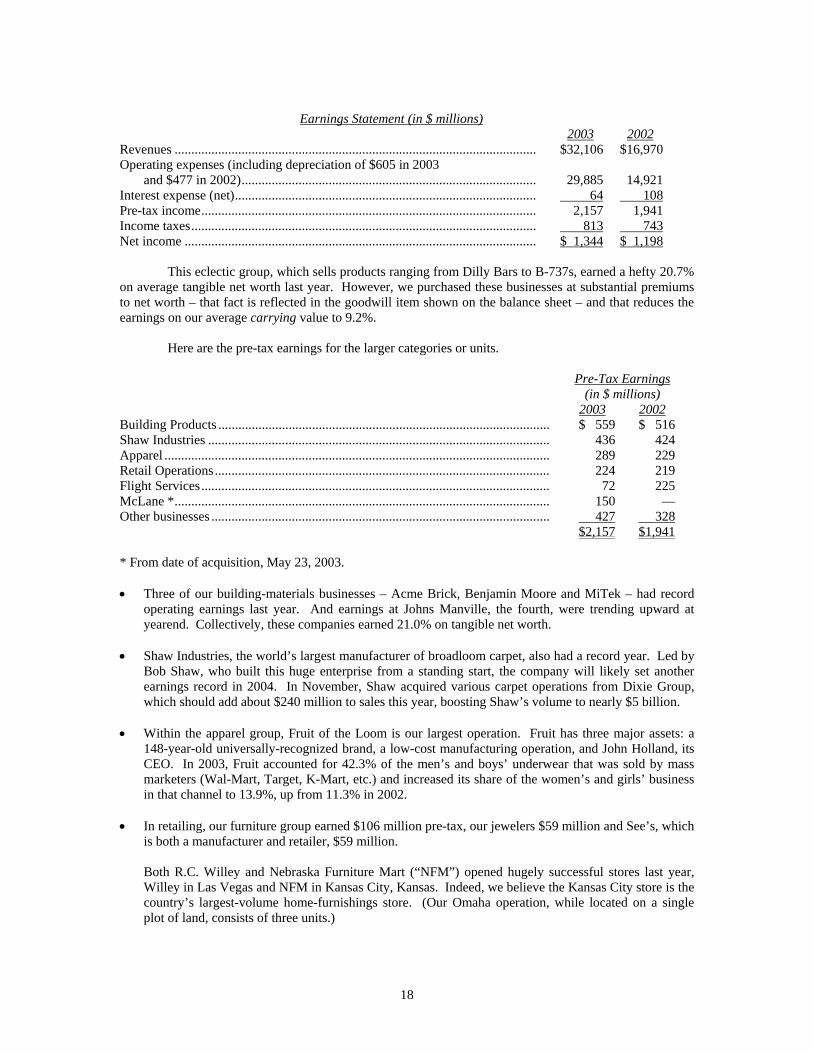
Manufacturing, Service and Retailing Operations
Our activities in this category cover the waterfront. But let’s look at a simplified balance sheetand earnings statement consolidating the entire group.
Balance Sheet 12/31/03 (in $ millions)
Assets Liabilities and EquityCash and equivalents ................................. $ 1,250 Notes payable ............................... $ 1,593Accounts and notes receivable .................. 2,796 Other current liabilities................. 4,300Inventory ................................................... 3,656 Total current liabilities ................. 5,893Other current assets ................................... 262Total current assets .................................... 7,964
Goodwill and other intangibles.................. 8,351 Deferred taxes............................... 105Fixed assets ............................................... 5,898 Term debt and other liabilities...... 1,890Other assets ............................................... 1,054 Equity ........................................... 15,379
$23,267 $23,267
18
Earnings Statement (in $ millions)2003 2002
Revenues ............................................................................................................ $32,106 $16,970Operating expenses (including depreciation of $605 in 2003
and $477 in 2002)........................................................................................ 29,885 14,921Interest expense (net).......................................................................................... 64 108Pre-tax income.................................................................................................... 2,157 1,941Income taxes....................................................................................................... 813 743Net income ......................................................................................................... $ 1,344 $ 1,198
This eclectic group, which sells products ranging from Dilly Bars to B-737s, earned a hefty 20.7%on average tangible net worth last year. However, we purchased these businesses at substantial premiumsto net worth – that fact is reflected in the goodwill item shown on the balance sheet – and that reduces theearnings on our average carrying value to 9.2%.
Here are the pre-tax earnings for the larger categories or units.
Pre-Tax Earnings(in $ millions)
2003 2002Building Products ................................................................................................... $ 559 $ 516Shaw Industries ...................................................................................................... 436 424Apparel ................................................................................................................... 289 229Retail Operations.................................................................................................... 224 219Flight Services........................................................................................................ 72 225McLane *................................................................................................................ 150 —Other businesses ..................................................................................................... 427 328
$2,157 $1,941
* From date of acquisition, May 23, 2003.
• Three of our building-materials businesses – Acme Brick, Benjamin Moore and MiTek – had recordoperating earnings last year. And earnings at Johns Manville, the fourth, were trending upward atyearend. Collectively, these companies earned 21.0% on tangible net worth.
• Shaw Industries, the world’s largest manufacturer of broadloom carpet, also had a record year. Led byBob Shaw, who built this huge enterprise from a standing start, the company will likely set anotherearnings record in 2004. In November, Shaw acquired various carpet operations from Dixie Group,which should add about $240 million to sales this year, boosting Shaw’s volume to nearly $5 billion.
• Within the apparel group, Fruit of the Loom is our largest operation. Fruit has three major assets: a148-year-old universally-recognized brand, a low-cost manufacturing operation, and John Holland, itsCEO. In 2003, Fruit accounted for 42.3% of the men’s and boys’ underwear that was sold by massmarketers (Wal-Mart, Target, K-Mart, etc.) and increased its share of the women’s and girls’ businessin that channel to 13.9%, up from 11.3% in 2002.
• In retailing, our furniture group earned $106 million pre-tax, our jewelers $59 million and See’s, whichis both a manufacturer and retailer, $59 million.
Both R.C. Willey and Nebraska Furniture Mart (“NFM”) opened hugely successful stores last year,Willey in Las Vegas and NFM in Kansas City, Kansas. Indeed, we believe the Kansas City store is thecountry’s largest-volume home-furnishings store. (Our Omaha operation, while located on a singleplot of land, consists of three units.)

19
NFM was founded by Rose Blumkin (“Mrs. B”) in 1937 with $500. She worked until she was 103(hmmm . . . not a bad idea). One piece of wisdom she imparted to the generations following her was,“If you have the lowest price, customers will find you at the bottom of a river.” Our store servinggreater Kansas City, which is located in one of the area’s more sparsely populated parts, has provedMrs. B’s point. Though we have more than 25 acres of parking, the lot has at times overflowed.
“Victory,” President Kennedy told us after the Bay of Pigs disaster, “has a thousand fathers, but defeatis an orphan.” At NFM, we knew we had a winner a month after the boffo opening in Kansas City,when our new store attracted an unexpected paternity claim. A speaker there, referring to the Blumkinfamily, asserted, “They had enough confidence and the policies of the Administration were workingsuch that they were able to provide work for 1,000 of our fellow citizens.” The proud papa at thepodium? President George W. Bush.
• In flight services, FlightSafety, our training operation, experienced a drop in “normal” operatingearnings from $183 million to $150 million. (The abnormals: In 2002 we had a $60 million pre-taxgain from the sale of a partnership interest to Boeing, and in 2003 we recognized a $37 million lossstemming from the premature obsolescence of simulators.) The corporate aviation business has slowedsignificantly in the past few years, and this fact has hurt FlightSafety’s results. The companycontinues, however, to be far and away the leader in its field. Its simulators have an original cost of$1.2 billion, which is more than triple the cost of those operated by our closest competitor.
NetJets, our fractional-ownership operation lost $41 million pre-tax in 2003. The company had amodest operating profit in the U.S., but this was more than offset by a $32 million loss on aircraftinventory and by continued losses in Europe.
NetJets continues to dominate the fractional-ownership field, and its lead is increasing: Prospectsoverwhelmingly turn to us rather than to our three major competitors. Last year, among the four of us,we accounted for 70% of net sales (measured by value).
An example of what sets NetJets apart from competitors is our Mayo Clinic Executive TravelResponse program, a free benefit enjoyed by all of our owners. On land or in the air, anywhere in theworld and at any hour of any day, our owners and their families have an immediate link to Mayo.Should an emergency occur while they are traveling here or abroad, Mayo will instantly direct them toan appropriate doctor or hospital. Any baseline data about the patient that Mayo possesses issimultaneously made available to the treating physician. Many owners have already found this serviceinvaluable, including one who needed emergency brain surgery in Eastern Europe.
The $32 million inventory write-down we took in 2003 occurred because of falling prices for usedaircraft early in the year. Specifically, we bought back fractions from withdrawing owners atprevailing prices, and these fell in value before we were able to remarket them. Prices are now stable.
The European loss is painful. But any company that forsakes Europe, as all of our competitors havedone, is destined for second-tier status. Many of our U.S. owners fly extensively in Europe and wantthe safety and security assured by a NetJets plane and pilots. Despite a slow start, furthermore, we arenow adding European customers at a good pace. During the years 2001 through 2003, we had gains of88%, 61% and 77% in European management-and-flying revenues. We have not, however, yetsucceeded in stemming the flow of red ink.
Rich Santulli, NetJets’ extraordinary CEO, and I expect our European loss to diminish in 2004 and alsoanticipate that it will be more than offset by U.S. profits. Overwhelmingly, our owners love theNetJets experience. Once a customer has tried us, going back to commercial aviation is like goingback to holding hands. NetJets will become a very big business over time and will be one in which weare preeminent in both customer satisfaction and profits. Rich will see to that.

20
Investments
The table that follows shows our common stock investments. Those that had a market value ofmore than $500 million at the end of 2003 are itemized.
12/31/03
Shares CompanyPercentage of
Company Owned Cost Market(in $ millions)
151,610,700 American Express Company ................ 11.8 $ 1,470 $ 7,312200,000,000 The Coca-Cola Company ..................... 8.2 1,299 10,15096,000,000 The Gillette Company .......................... 9.5 600 3,52614,610,900 H&R Block, Inc.................................... 8.2 227 80915,476,500 HCA Inc. .............................................. 3.1 492 6656,708,760 M&T Bank Corporation ....................... 5.6 103 659
24,000,000 Moody’s Corporation ........................... 16.1 499 1,4532,338,961,000 PetroChina Company Limited .............. 1.3 488 1,340
1,727,765 The Washington Post Company ........... 18.1 11 1,36756,448,380 Wells Fargo & Company...................... 3.3 463 3,324
Others ................................................... 2,863 4,682Total Common Stocks .......................... $ 8,515 $35,287
We bought some Wells Fargo shares last year. Otherwise, among our six largest holdings, we lastchanged our position in Coca-Cola in 1994, American Express in 1998, Gillette in 1989, Washington Postin 1973, and Moody’s in 2000. Brokers don’t love us.
We are neither enthusiastic nor negative about the portfolio we hold. We own pieces of excellentbusinesses – all of which had good gains in intrinsic value last year – but their current prices reflect theirexcellence. The unpleasant corollary to this conclusion is that I made a big mistake in not selling several ofour larger holdings during The Great Bubble. If these stocks are fully priced now, you may wonder what Iwas thinking four years ago when their intrinsic value was lower and their prices far higher. So do I.
In 2002, junk bonds became very cheap, and we purchased about $8 billion of these. Thependulum swung quickly though, and this sector now looks decidedly unattractive to us. Yesterday’sweeds are today being priced as flowers.
We’ve repeatedly emphasized that realized gains at Berkshire are meaningless for analyticalpurposes. We have a huge amount of unrealized gains on our books, and our thinking about when, and if,to cash them depends not at all on a desire to report earnings at one specific time or another. Nevertheless,to see the diversity of our investment activities, you may be interested in the following table, categorizingthe gains we reported during 2003:
Category Pre-Tax Gain(in $ million)
Common Stocks .............................................................................................................. $ 448U.S. Government Bonds.................................................................................................. 1,485Junk Bonds ...................................................................................................................... 1,138Foreign Exchange Contracts ........................................................................................... 825Other................................................................................................................................ 233
$4,129
The common stock profits occurred around the edges of our portfolio – not, as we alreadymentioned, from our selling down our major positions. The profits in governments arose from our

21
liquidation of long-term strips (the most volatile of government securities) and from certain strategies Ifollow within our finance and financial products division. We retained most of our junk portfolio, sellingonly a few issues. Calls and maturing bonds accounted for the rest of the gains in the junk category.
During 2002 we entered the foreign currency market for the first time in my life, and in 2003 weenlarged our position, as I became increasingly bearish on the dollar. I should note that the cemetery forseers has a huge section set aside for macro forecasters. We have in fact made few macro forecasts atBerkshire, and we have seldom seen others make them with sustained success.
We have – and will continue to have – the bulk of Berkshire’s net worth in U.S. assets. But inrecent years our country’s trade deficit has been force-feeding huge amounts of claims on, and ownershipin, America to the rest of the world. For a time, foreign appetite for these assets readily absorbed thesupply. Late in 2002, however, the world started choking on this diet, and the dollar’s value began to slideagainst major currencies. Even so, prevailing exchange rates will not lead to a material letup in our tradedeficit. So whether foreign investors like it or not, they will continue to be flooded with dollars. Theconsequences of this are anybody’s guess. They could, however, be troublesome – and reach, in fact, wellbeyond currency markets.
As an American, I hope there is a benign ending to this problem. I myself suggested one possiblesolution – which, incidentally, leaves Charlie cold – in a November 10, 2003 article in Fortune Magazine.Then again, perhaps the alarms I have raised will prove needless: Our country’s dynamism and resiliencyhave repeatedly made fools of naysayers. But Berkshire holds many billions of cash-equivalentsdenominated in dollars. So I feel more comfortable owning foreign-exchange contracts that are at least apartial offset to that position.
These contracts are subject to accounting rules that require changes in their value to becontemporaneously included in capital gains or losses, even though the contracts have not been closed. Weshow these changes each quarter in the Finance and Financial Products segment of our earnings statement.At yearend, our open foreign exchange contracts totaled about $12 billion at market values and were spreadamong five currencies. Also, when we were purchasing junk bonds in 2002, we tried when possible to buyissues denominated in Euros. Today, we own about $1 billion of these.
When we can’t find anything exciting in which to invest, our “default” position is U.S. Treasuries,both bills and repos. No matter how low the yields on these instruments go, we never “reach” for a littlemore income by dropping our credit standards or by extending maturities. Charlie and I detest taking evensmall risks unless we feel we are being adequately compensated for doing so. About as far as we will godown that path is to occasionally eat cottage cheese a day after the expiration date on the carton.
* * * * * * * * * * * *
A 2003 book that investors can learn much from is Bull! by Maggie Mahar. Two other books I’drecommend are The Smartest Guys in the Room by Bethany McLean and Peter Elkind, and In an UncertainWorld by Bob Rubin. All three are well-reported and well-written. Additionally, Jason Zweig last year dida first-class job in revising The Intelligent Investor, my favorite book on investing.
Designated Gifts Program
From 1981 through 2002, Berkshire administered a program whereby shareholders could directBerkshire to make gifts to their favorite charitable organizations. Over the years we disbursed $197 millionpursuant to this program. Churches were the most frequently named designees, and many thousands ofother organizations benefited as well. We were the only major public company that offered such a programto shareholders, and Charlie and I were proud of it.
We reluctantly terminated the program in 2003 because of controversy over the abortion issue.Over the years numerous organizations on both sides of this issue had been designated by our shareholdersto receive contributions. As a result, we regularly received some objections to the gifts designated for pro-choice operations. A few of these came from people and organizations that proceeded to boycott products
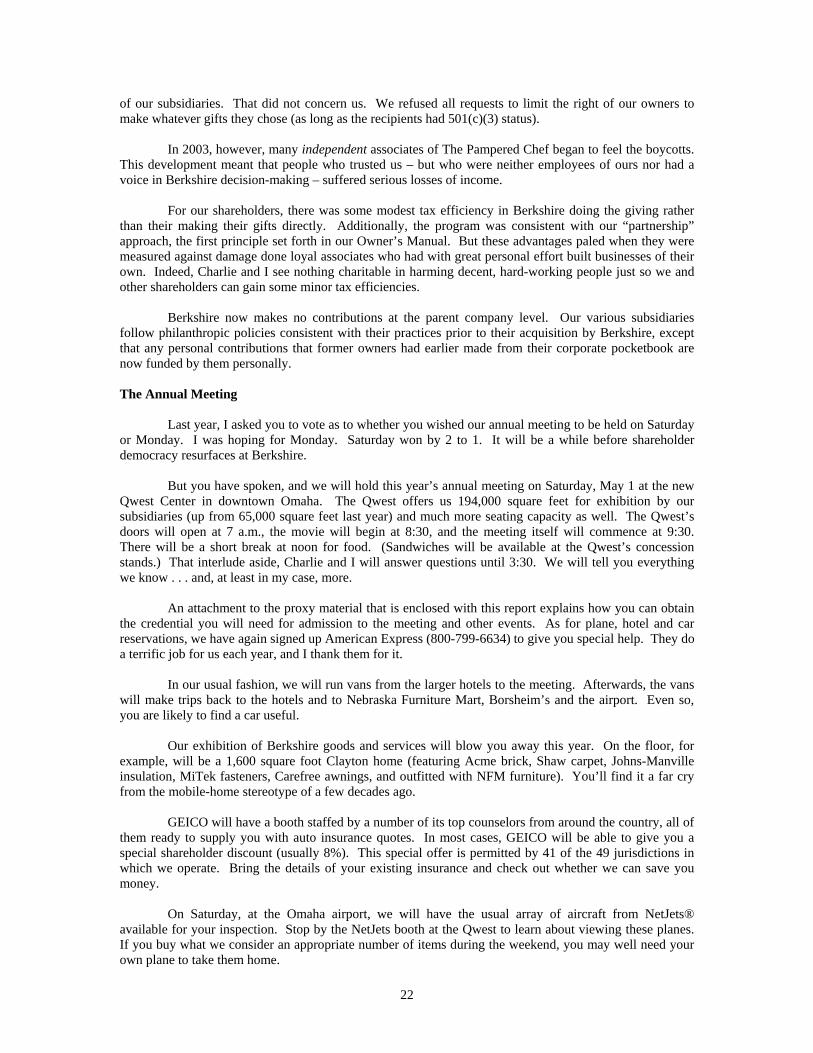
22
of our subsidiaries. That did not concern us. We refused all requests to limit the right of our owners tomake whatever gifts they chose (as long as the recipients had 501(c)(3) status).
In 2003, however, many independent associates of The Pampered Chef began to feel the boycotts.This development meant that people who trusted us – but who were neither employees of ours nor had avoice in Berkshire decision-making – suffered serious losses of income.
For our shareholders, there was some modest tax efficiency in Berkshire doing the giving ratherthan their making their gifts directly. Additionally, the program was consistent with our “partnership”approach, the first principle set forth in our Owner’s Manual. But these advantages paled when they weremeasured against damage done loyal associates who had with great personal effort built businesses of theirown. Indeed, Charlie and I see nothing charitable in harming decent, hard-working people just so we andother shareholders can gain some minor tax efficiencies.
Berkshire now makes no contributions at the parent company level. Our various subsidiariesfollow philanthropic policies consistent with their practices prior to their acquisition by Berkshire, exceptthat any personal contributions that former owners had earlier made from their corporate pocketbook arenow funded by them personally.
The Annual Meeting
Last year, I asked you to vote as to whether you wished our annual meeting to be held on Saturdayor Monday. I was hoping for Monday. Saturday won by 2 to 1. It will be a while before shareholderdemocracy resurfaces at Berkshire.
But you have spoken, and we will hold this year’s annual meeting on Saturday, May 1 at the newQwest Center in downtown Omaha. The Qwest offers us 194,000 square feet for exhibition by oursubsidiaries (up from 65,000 square feet last year) and much more seating capacity as well. The Qwest’sdoors will open at 7 a.m., the movie will begin at 8:30, and the meeting itself will commence at 9:30.There will be a short break at noon for food. (Sandwiches will be available at the Qwest’s concessionstands.) That interlude aside, Charlie and I will answer questions until 3:30. We will tell you everythingwe know . . . and, at least in my case, more.
An attachment to the proxy material that is enclosed with this report explains how you can obtainthe credential you will need for admission to the meeting and other events. As for plane, hotel and carreservations, we have again signed up American Express (800-799-6634) to give you special help. They doa terrific job for us each year, and I thank them for it.
In our usual fashion, we will run vans from the larger hotels to the meeting. Afterwards, the vanswill make trips back to the hotels and to Nebraska Furniture Mart, Borsheim’s and the airport. Even so,you are likely to find a car useful.
Our exhibition of Berkshire goods and services will blow you away this year. On the floor, forexample, will be a 1,600 square foot Clayton home (featuring Acme brick, Shaw carpet, Johns-Manvilleinsulation, MiTek fasteners, Carefree awnings, and outfitted with NFM furniture). You’ll find it a far cryfrom the mobile-home stereotype of a few decades ago.
GEICO will have a booth staffed by a number of its top counselors from around the country, all ofthem ready to supply you with auto insurance quotes. In most cases, GEICO will be able to give you aspecial shareholder discount (usually 8%). This special offer is permitted by 41 of the 49 jurisdictions inwhich we operate. Bring the details of your existing insurance and check out whether we can save youmoney.
On Saturday, at the Omaha airport, we will have the usual array of aircraft from NetJets®available for your inspection. Stop by the NetJets booth at the Qwest to learn about viewing these planes.If you buy what we consider an appropriate number of items during the weekend, you may well need yourown plane to take them home.
23
At Nebraska Furniture Mart, located on a 77-acre site on 72nd Street between Dodge and Pacific,we will again be having “Berkshire Weekend” pricing, which means we will be offering our shareholders adiscount that is customarily given only to employees. We initiated this special pricing at NFM seven yearsago, and sales during the “Weekend” grew from $5.3 million in 1997 to $17.3 million in 2003. Every yearhas set a new record.
To get the discount, you must make your purchases between Thursday, April 29 and Monday,May 3 inclusive, and also present your meeting credential. The period’s special pricing will even apply tothe products of several prestigious manufacturers that normally have ironclad rules against discounting butthat, in the spirit of our shareholder weekend, have made an exception for you. We appreciate theircooperation. NFM is open from 10 a.m. to 9 p.m. Monday through Saturday, and 10 a.m. to 6 p.m. onSunday. On Saturday this year, from 5:30 p.m. to 8 p.m., we are having a special affair for shareholdersonly. I’ll be there, eating barbeque and drinking Coke.
Borsheim’s ⎯ the largest jewelry store in the country except for Tiffany’s Manhattan store ⎯ willhave two shareholder-only events. The first will be a cocktail reception from 6 p.m. to 10 p.m. on Friday,April 30. The second, the main gala, will be from 9 a.m. to 4 p.m. on Sunday, May 2. Ask Charlie toautograph your sales ticket.
Shareholder prices will be available Thursday through Monday, so if you wish to avoid the largecrowds that will assemble on Friday evening and Sunday, come at other times and identify yourself as ashareholder. On Saturday, we will be open until 6 p.m. Borsheim’s operates on a gross margin that is fullytwenty percentage points below that of its major rivals, so the more you buy, the more you save – at leastthat’s what my wife and daughter tell me. (Both were impressed early in life by the story of the boy who,after missing a street car, walked home and proudly announced that he had saved 5¢ by doing so. Hisfather was irate: “Why didn’t you miss a cab and save 85¢?”)
In the mall outside of Borsheim’s, we will have Bob Hamman and Sharon Osberg, two of theworld’s top bridge experts, available to play with our shareholders on Sunday afternoon. Additionally,Patrick Wolff, twice U.S. chess champion, will be in the mall, taking on all comers ⎯ blindfolded! I’vewatched, and he doesn’t peek.
Gorat’s ⎯ my favorite steakhouse ⎯ will again be open exclusively for Berkshire shareholders onSunday, May 2, and will be serving from 4 p.m. until 10 p.m. Please remember that to come to Gorat’s onSunday, you must have a reservation. To make one, call 402-551-3733 on April 1 (but not before). IfSunday is sold out, try Gorat’s on one of the other evenings you will be in town. Flaunt your mastery offine dining by ordering, as I do, a rare T-bone with a double order of hash browns.
We will have a special reception on Saturday afternoon from 4:00 to 5:00 for shareholders whocome from outside of North America. Every year our meeting draws many people from around the globe,and Charlie and I want to be sure we personally meet those who have come so far. Any shareholder whocomes from other than the U.S. or Canada will be given special credentials and instructions for attendingthis function.
Charlie and I have a great time at the annual meeting. And you will, too. So join us at the Qwestfor our annual Woodstock for Capitalists.
Warren E. BuffettFebruary 27, 2004 Chairman of the Board
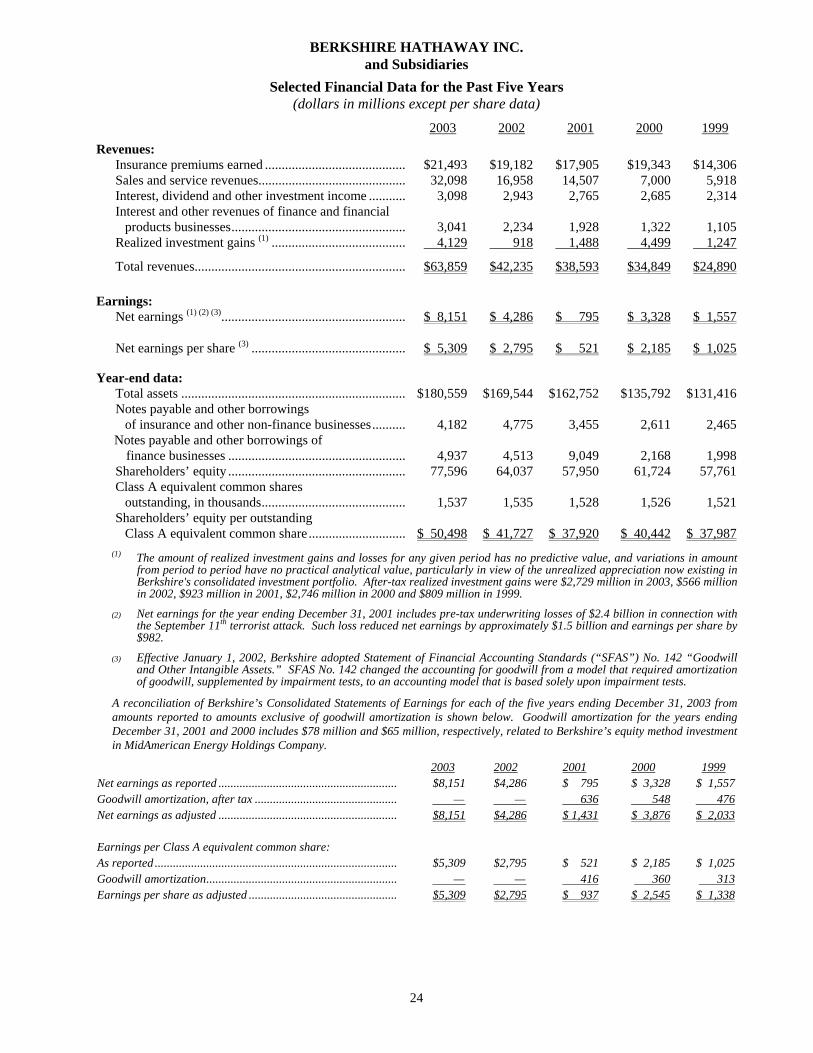
24
BERKSHIRE HATHAWAY INC.and Subsidiaries
Selected Financial Data for the Past Five Years(dollars in millions except per share data)
2003 2002 2001 2000 1999Revenues:
Insurance premiums earned .......................................... $21,493 $19,182 $17,905 $19,343 $14,306Sales and service revenues............................................ 32,098 16,958 14,507 7,000 5,918Interest, dividend and other investment income ........... 3,098 2,943 2,765 2,685 2,314Interest and other revenues of finance and financial
products businesses.................................................... 3,041 2,234 1,928 1,322 1,105Realized investment gains (1) ........................................ 4,129 918 1,488 4,499 1,247
Total revenues............................................................... $63,859 $42,235 $38,593 $34,849 $24,890
Earnings:Net earnings (1) (2) (3)....................................................... $ 8,151 $ 4,286 $ 795 $ 3,328 $ 1,557
Net earnings per share (3) .............................................. $ 5,309 $ 2,795 $ 521 $ 2,185 $ 1,025
Year-end data:Total assets ................................................................... $180,559 $169,544 $162,752 $135,792 $131,416Notes payable and other borrowings
of insurance and other non-finance businesses.......... 4,182 4,775 3,455 2,611 2,465Notes payable and other borrowings of
finance businesses ..................................................... 4,937 4,513 9,049 2,168 1,998Shareholders’ equity ..................................................... 77,596 64,037 57,950 61,724 57,761Class A equivalent common shares
outstanding, in thousands........................................... 1,537 1,535 1,528 1,526 1,521Shareholders’ equity per outstanding
Class A equivalent common share ............................. $ 50,498 $ 41,727 $ 37,920 $ 40,442 $ 37,987(1) The amount of realized investment gains and losses for any given period has no predictive value, and variations in amount
from period to period have no practical analytical value, particularly in view of the unrealized appreciation now existing inBerkshire's consolidated investment portfolio. After-tax realized investment gains were $2,729 million in 2003, $566 millionin 2002, $923 million in 2001, $2,746 million in 2000 and $809 million in 1999.
(2) Net earnings for the year ending December 31, 2001 includes pre-tax underwriting losses of $2.4 billion in connection withthe September 11th terrorist attack. Such loss reduced net earnings by approximately $1.5 billion and earnings per share by$982.
(3) Effective January 1, 2002, Berkshire adopted Statement of Financial Accounting Standards (“SFAS”) No. 142 “Goodwilland Other Intangible Assets.” SFAS No. 142 changed the accounting for goodwill from a model that required amortizationof goodwill, supplemented by impairment tests, to an accounting model that is based solely upon impairment tests.
A reconciliation of Berkshire’s Consolidated Statements of Earnings for each of the five years ending December 31, 2003 fromamounts reported to amounts exclusive of goodwill amortization is shown below. Goodwill amortization for the years endingDecember 31, 2001 and 2000 includes $78 million and $65 million, respectively, related to Berkshire’s equity method investmentin MidAmerican Energy Holdings Company.
2003 2002 2001 2000 1999Net earnings as reported ........................................................... $8,151 $4,286 $ 795 $ 3,328 $ 1,557Goodwill amortization, after tax ............................................... — — 636 548 476Net earnings as adjusted ........................................................... $8,151 $4,286 $ 1,431 $ 3,876 $ 2,033
Earnings per Class A equivalent common share:As reported ................................................................................ $5,309 $2,795 $ 521 $ 2,185 $ 1,025Goodwill amortization............................................................... — — 416 360 313Earnings per share as adjusted ................................................. $5,309 $2,795 $ 937 $ 2,545 $ 1,338
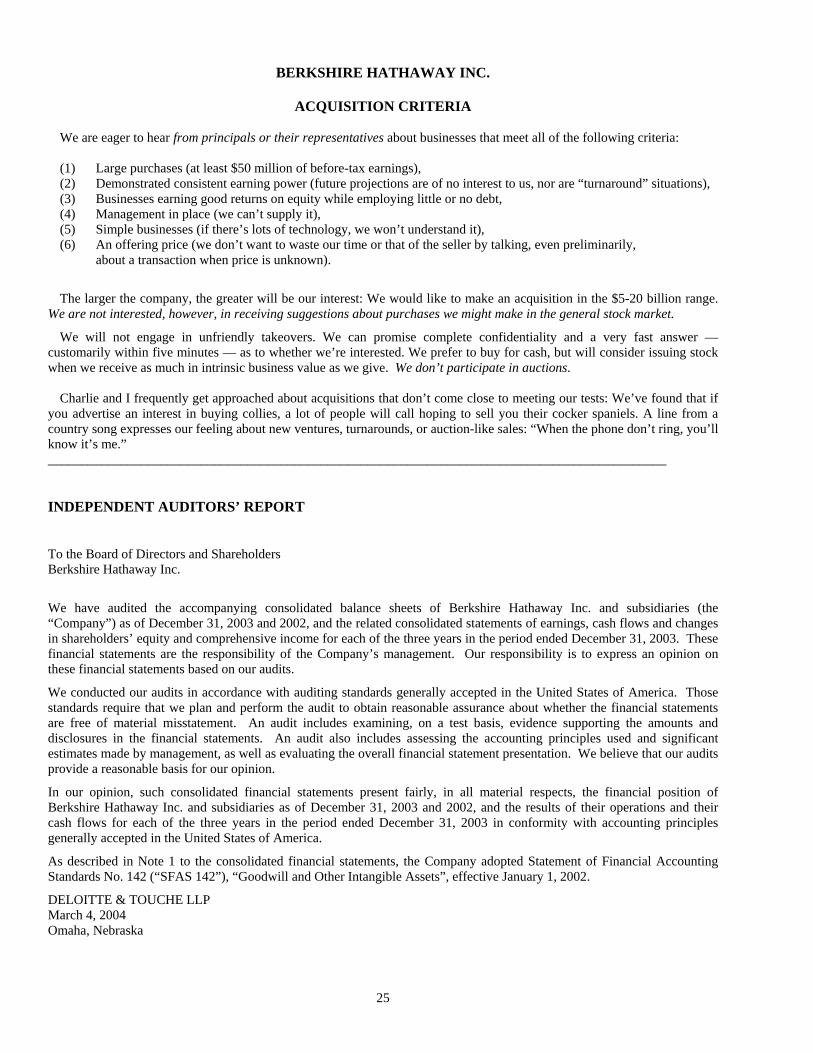
25
BERKSHIRE HATHAWAY INC.
ACQUISITION CRITERIA
We are eager to hear from principals or their representatives about businesses that meet all of the following criteria:
(1) Large purchases (at least $50 million of before-tax earnings),(2) Demonstrated consistent earning power (future projections are of no interest to us, nor are “turnaround” situations),(3) Businesses earning good returns on equity while employing little or no debt,(4) Management in place (we can’t supply it),(5) Simple businesses (if there’s lots of technology, we won’t understand it),(6) An offering price (we don’t want to waste our time or that of the seller by talking, even preliminarily,
about a transaction when price is unknown).
The larger the company, the greater will be our interest: We would like to make an acquisition in the $5-20 billion range.We are not interested, however, in receiving suggestions about purchases we might make in the general stock market.
We will not engage in unfriendly takeovers. We can promise complete confidentiality and a very fast answer —customarily within five minutes — as to whether we’re interested. We prefer to buy for cash, but will consider issuing stockwhen we receive as much in intrinsic business value as we give. We don’t participate in auctions.
Charlie and I frequently get approached about acquisitions that don’t come close to meeting our tests: We’ve found that ifyou advertise an interest in buying collies, a lot of people will call hoping to sell you their cocker spaniels. A line from acountry song expresses our feeling about new ventures, turnarounds, or auction-like sales: “When the phone don’t ring, you’llknow it’s me.”_____________________________________________________________________________________________
INDEPENDENT AUDITORS’ REPORT
To the Board of Directors and ShareholdersBerkshire Hathaway Inc.
We have audited the accompanying consolidated balance sheets of Berkshire Hathaway Inc. and subsidiaries (the“Company”) as of December 31, 2003 and 2002, and the related consolidated statements of earnings, cash flows and changesin shareholders’ equity and comprehensive income for each of the three years in the period ended December 31, 2003. Thesefinancial statements are the responsibility of the Company’s management. Our responsibility is to express an opinion onthese financial statements based on our audits.
We conducted our audits in accordance with auditing standards generally accepted in the United States of America. Thosestandards require that we plan and perform the audit to obtain reasonable assurance about whether the financial statementsare free of material misstatement. An audit includes examining, on a test basis, evidence supporting the amounts anddisclosures in the financial statements. An audit also includes assessing the accounting principles used and significantestimates made by management, as well as evaluating the overall financial statement presentation. We believe that our auditsprovide a reasonable basis for our opinion.
In our opinion, such consolidated financial statements present fairly, in all material respects, the financial position ofBerkshire Hathaway Inc. and subsidiaries as of December 31, 2003 and 2002, and the results of their operations and theircash flows for each of the three years in the period ended December 31, 2003 in conformity with accounting principlesgenerally accepted in the United States of America.
As described in Note 1 to the consolidated financial statements, the Company adopted Statement of Financial AccountingStandards No. 142 (“SFAS 142”), “Goodwill and Other Intangible Assets”, effective January 1, 2002.
DELOITTE & TOUCHE LLPMarch 4, 2004Omaha, Nebraska

26
BERKSHIRE HATHAWAY INC.and Subsidiaries
CONSOLIDATED BALANCE SHEETS(dollars in millions except per share amounts)
December 31,2003 2002
ASSETSInsurance and Other:
Cash and cash equivalents.............................................................................................. $ 31,262 $ 10,283Investments:
Fixed maturity securities............................................................................................. 26,116 38,096Equity securities ......................................................................................................... 35,287 28,363Other ........................................................................................................................... 2,924 3,752
Receivables .................................................................................................................... 12,314 13,153Inventories...................................................................................................................... 3,656 3,030Property, plant and equipment........................................................................................ 6,260 5,368Goodwill of acquired businesses.................................................................................... 22,948 22,298Deferred charges reinsurance assumed .......................................................................... 3,087 3,379Other............................................................................................................................... 4,468 4,023
148,322 131,745Investments in MidAmerican Energy Holdings Company ............................................. 3,899 3,651Finance and Financial Products:
Cash and cash equivalents.............................................................................................. 4,695 2,465Investments in fixed maturity securities:
Available-for-sale ....................................................................................................... 9,092 15,666Other ........................................................................................................................... 711 1,187
Trading account assets ................................................................................................... 4,519 6,874Loans and finance receivables........................................................................................ 4,951 3,863Other............................................................................................................................... 4,370 4,093
28,338 34,148$180,559 $169,544
LIABILITIES AND SHAREHOLDERS’ EQUITYInsurance and Other:
Losses and loss adjustment expenses ............................................................................. $ 45,393 $ 43,771Unearned premiums ....................................................................................................... 6,308 6,694Life and health insurance benefits.................................................................................. 2,872 2,642Other policyholder liabilities.......................................................................................... 3,635 4,218Accounts payable, accruals and other liabilities............................................................. 6,386 4,995Income taxes, principally deferred ................................................................................. 11,479 8,051Notes payable and other borrowings .............................................................................. 4,182 4,775
80,255 75,146Finance and Financial Products:
Securities sold under agreements to repurchase ............................................................. 7,931 13,789Trading account liabilities .............................................................................................. 5,445 7,274Notes payable and other borrowings .............................................................................. 4,937 4,513Other............................................................................................................................... 3,650 3,394
21,963 28,970Total liabilities .............................................................................................................. 102,218 104,116
Minority shareholders’ interests........................................................................................ 745 1,391Shareholders’ equity:
Common stock - Class A, $5 par value and Class B, $0.1667 par value........................ 8 8Capital in excess of par value......................................................................................... 26,151 26,028Accumulated other comprehensive income.................................................................... 19,556 14,271Retained earnings ........................................................................................................... 31,881 23,730
Total shareholders’ equity ........................................................................................ 77,596 64,037$180,559 $169,544
See accompanying Notes to Consolidated Financial Statements

27
BERKSHIRE HATHAWAY INC.and Subsidiaries
CONSOLIDATED STATEMENTS OF EARNINGS(dollars in millions except per share amounts)
Year Ended December 31,2003 2002 2001
Revenues:Insurance and Other:
Insurance premiums earned.............................................................. $21,493 $19,182 $17,905Sales and service revenues ............................................................... 32,098 16,958 14,507Interest, dividend and other investment income ............................... 3,098 2,943 2,765Realized investment gains ................................................................ 2,914 340 1,363
59,603 39,423 36,540Finance and Financial Products:
Interest income ................................................................................. 1,093 1,497 1,377Realized investment gains ................................................................ 1,215 578 125Other................................................................................................. 1,948 737 551
4,256 2,812 2,053
63,859 42,235 38,593Costs and expenses:Insurance and Other:
Insurance losses and loss adjustment expenses ................................ 14,927 15,256 18,385Insurance underwriting expenses...................................................... 4,848 4,324 3,574Cost of sales and services ................................................................. 25,737 11,971 10,340Selling, general and administrative expenses ................................... 4,228 3,033 2,735Goodwill amortization...................................................................... — — 572Interest expense ................................................................................ 153 192 205
49,893 34,776 35,811Finance and Financial Products:
Interest expense................................................................................ 319 533 763Other................................................................................................. 2,056 926 715
2,375 1,459 1,478
52,268 36,235 37,289
Earnings before income taxes and equity in earnings of MidAmerican Energy Holdings Company................................... 11,591 6,000 1,304
Equity in earnings of MidAmerican Energy Holdings Company ....... 429 359 134
Earnings before income taxes and minority interests .................... 12,020 6,359 1,438Income taxes..................................................................................... 3,805 2,059 590Minority shareholders’ interests ....................................................... 64 14 53
Net earnings ....................................................................................... $ 8,151 $ 4,286 $ 795
Average common shares outstanding * ............................................ 1,535,405 1,533,294 1,527,234
Net earnings per common share *.................................................... $ 5,309 $ 2,795 $ 521
* Average shares outstanding include average Class A common shares and average Class B commonshares determined on an equivalent Class A common stock basis. Net earnings per common shareshown above represents net earnings per equivalent Class A common share. Net earnings per Class Bcommon share is equal to one-thirtieth (1/30) of such amount or $177 per share for 2003, $93 per sharefor 2002, and $17 per share for 2001.
See accompanying Notes to Consolidated Financial Statements

28
BERKSHIRE HATHAWAY INC.and Subsidiaries
CONSOLIDATED STATEMENTS OF CASH FLOWS(dollars in millions)
Year Ended December 31,2003 2002 2001
Cash flows from operating activities: Net earnings................................................................................................ $ 8,151 $ 4,286 $ 795 Adjustments to reconcile net earnings to cash flows
from operating activities:Realized investment gains .......................................................................... (4,129) (918) (1,488)Depreciation and amortization.................................................................... 520 520 945Changes in assets and liabilities before effects from
business acquisitions:Losses and loss adjustment expenses....................................................... 397 3,209 7,571Deferred charges reinsurance assumed .................................................... 292 (147) (498)Unearned premiums................................................................................. (585) 1,880 929Receivables .............................................................................................. 2,018 (896) 219Accounts payable, accruals and other liabilities ...................................... (907) 1,062 (339)Finance businesses operating activities.................................................... 1,558 2,940 (1,083)Income taxes ............................................................................................ 505 195 (329)
Other........................................................................................................... 437 (996) (148)
Net cash flows from operating activities .................................................... 8,257 11,135 6,574Cash flows from investing activities:
Purchases of securities with fixed maturities.............................................. (9,924) (16,288) (16,475) Purchases of equity securities..................................................................... (1,842) (1,756) (1,075) Proceeds from sales of securities with fixed maturities.............................. 17,650 9,108 8,427 Proceeds from redemptions and maturities of securities
with fixed maturities ................................................................................ 9,847 6,740 4,305 Proceeds from sales of equity securities..................................................... 3,159 1,340 3,881 Loans and investments originated in finance businesses............................ (3,046) (2,281) (9,502) Principal collection on loans and investments
originated in finance businesses............................................................... 4,241 5,226 4,126 Acquisitions of businesses, net of cash acquired........................................ (3,213) (2,620) (4,697) Other........................................................................................................... (759) (780) (684)
Net cash flows from investing activities..................................................... 16,113 (1,311) (11,694)Cash flows from financing activities:
Proceeds from borrowings of finance businesses ....................................... 2,479 211 6,288 Proceeds from other borrowings................................................................. 822 1,472 824 Repayments of borrowings of finance businesses ...................................... (2,260) (3,802) (865) Repayments of other borrowings................................................................ (783) (774) (798) Change in short term borrowings of finance businesses............................. (63) (1,207) 794 Changes in other short term borrowings..................................................... (642) 380 (345) Other........................................................................................................... (714) 146 116
Net cash flows from financing activities .................................................... (1,161) (3,574) 6,014
Increase in cash and cash equivalents......................................................... 23,209 6,250 894Cash and cash equivalents at beginning of year ............................................... 12,748 6,498 5,604
Cash and cash equivalents at end of year *.................................................. $35,957 $12,748 $ 6,498
* Cash and cash equivalents at end of year are comprised of the following:Insurance and Other................................................................................... $31,262 $10,283 $ 5,313Finance and Financial Products ................................................................ 4,695 2,465 1,185
$35,957 $12,748 $ 6,498
See accompanying Notes to Consolidated Financial Statements
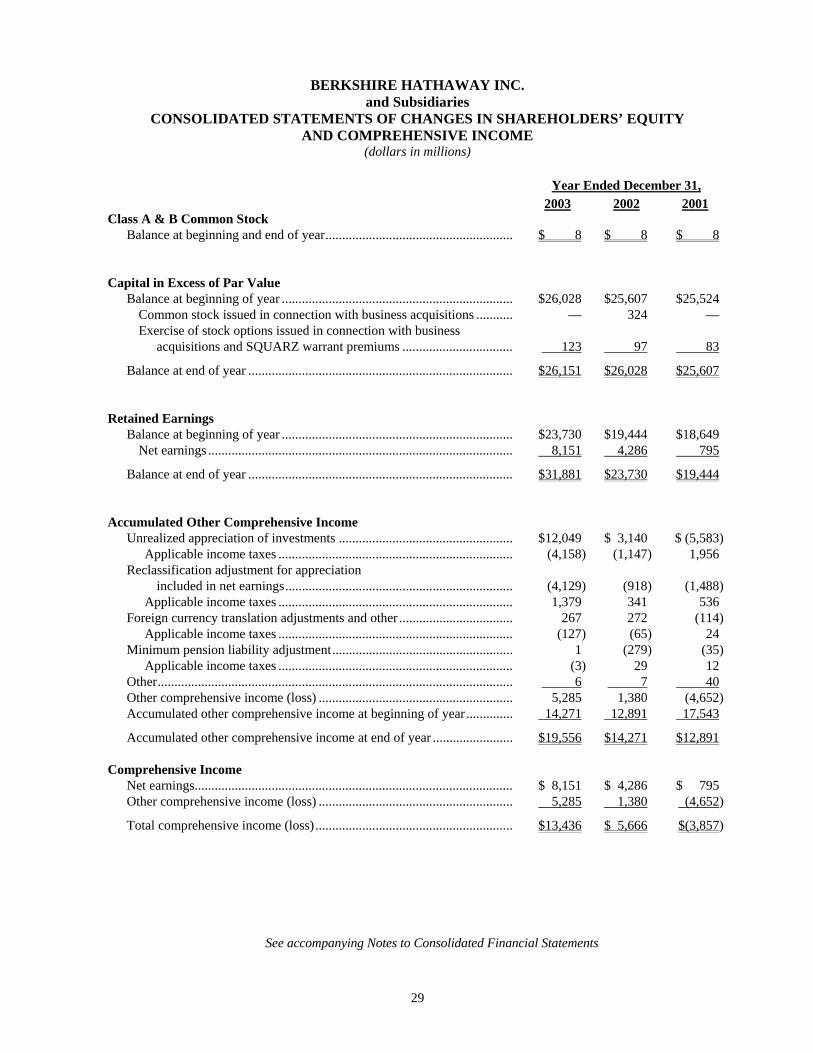
29
BERKSHIRE HATHAWAY INC.and Subsidiaries
CONSOLIDATED STATEMENTS OF CHANGES IN SHAREHOLDERS’ EQUITYAND COMPREHENSIVE INCOME
(dollars in millions)
Year Ended December 31,2003 2002 2001
Class A & B Common StockBalance at beginning and end of year........................................................ $ 8 $ 8 $ 8
Capital in Excess of Par ValueBalance at beginning of year ..................................................................... $26,028 $25,607 $25,524
Common stock issued in connection with business acquisitions ........... — 324 —Exercise of stock options issued in connection with business
acquisitions and SQUARZ warrant premiums ................................. 123 97 83
Balance at end of year ............................................................................... $26,151 $26,028 $25,607
Retained EarningsBalance at beginning of year ..................................................................... $23,730 $19,444 $18,649
Net earnings ........................................................................................... 8,151 4,286 795
Balance at end of year ............................................................................... $31,881 $23,730 $19,444
Accumulated Other Comprehensive IncomeUnrealized appreciation of investments .................................................... $12,049 $ 3,140 $ (5,583)
Applicable income taxes ...................................................................... (4,158) (1,147) 1,956Reclassification adjustment for appreciation
included in net earnings.................................................................... (4,129) (918) (1,488)Applicable income taxes ...................................................................... 1,379 341 536
Foreign currency translation adjustments and other .................................. 267 272 (114)Applicable income taxes ...................................................................... (127) (65) 24
Minimum pension liability adjustment...................................................... 1 (279) (35)Applicable income taxes ...................................................................... (3) 29 12
Other.......................................................................................................... 6 7 40Other comprehensive income (loss) .......................................................... 5,285 1,380 (4,652)Accumulated other comprehensive income at beginning of year .............. 14,271 12,891 17,543
Accumulated other comprehensive income at end of year ........................ $19,556 $14,271 $12,891
Comprehensive IncomeNet earnings............................................................................................... $ 8,151 $ 4,286 $ 795Other comprehensive income (loss) .......................................................... 5,285 1,380 (4,652)
Total comprehensive income (loss)........................................................... $13,436 $ 5,666 $(3,857)
See accompanying Notes to Consolidated Financial Statements
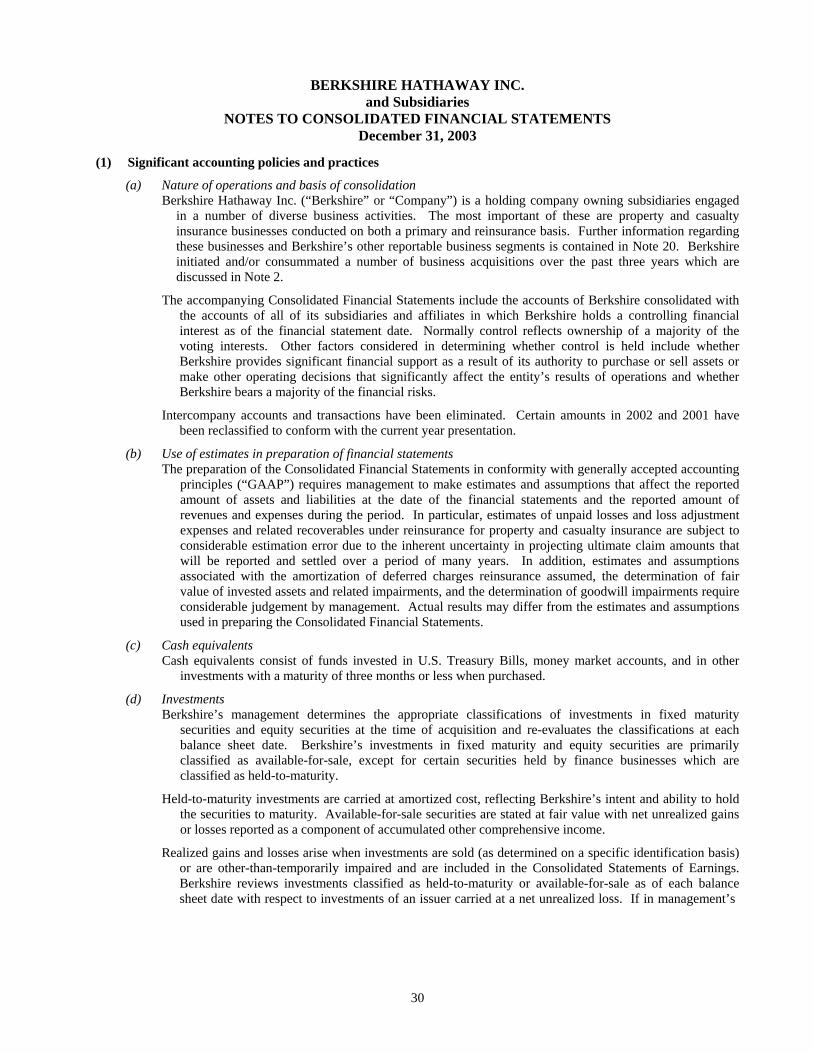
30
BERKSHIRE HATHAWAY INC.and Subsidiaries
NOTES TO CONSOLIDATED FINANCIAL STATEMENTSDecember 31, 2003
(1) Significant accounting policies and practices
(a) Nature of operations and basis of consolidationBerkshire Hathaway Inc. (“Berkshire” or “Company”) is a holding company owning subsidiaries engaged
in a number of diverse business activities. The most important of these are property and casualtyinsurance businesses conducted on both a primary and reinsurance basis. Further information regardingthese businesses and Berkshire’s other reportable business segments is contained in Note 20. Berkshireinitiated and/or consummated a number of business acquisitions over the past three years which arediscussed in Note 2.
The accompanying Consolidated Financial Statements include the accounts of Berkshire consolidated withthe accounts of all of its subsidiaries and affiliates in which Berkshire holds a controlling financialinterest as of the financial statement date. Normally control reflects ownership of a majority of thevoting interests. Other factors considered in determining whether control is held include whetherBerkshire provides significant financial support as a result of its authority to purchase or sell assets ormake other operating decisions that significantly affect the entity’s results of operations and whetherBerkshire bears a majority of the financial risks.
Intercompany accounts and transactions have been eliminated. Certain amounts in 2002 and 2001 havebeen reclassified to conform with the current year presentation.
(b) Use of estimates in preparation of financial statementsThe preparation of the Consolidated Financial Statements in conformity with generally accepted accounting
principles (“GAAP”) requires management to make estimates and assumptions that affect the reportedamount of assets and liabilities at the date of the financial statements and the reported amount ofrevenues and expenses during the period. In particular, estimates of unpaid losses and loss adjustmentexpenses and related recoverables under reinsurance for property and casualty insurance are subject toconsiderable estimation error due to the inherent uncertainty in projecting ultimate claim amounts thatwill be reported and settled over a period of many years. In addition, estimates and assumptionsassociated with the amortization of deferred charges reinsurance assumed, the determination of fairvalue of invested assets and related impairments, and the determination of goodwill impairments requireconsiderable judgement by management. Actual results may differ from the estimates and assumptionsused in preparing the Consolidated Financial Statements.
(c) Cash equivalentsCash equivalents consist of funds invested in U.S. Treasury Bills, money market accounts, and in other
investments with a maturity of three months or less when purchased.
(d) InvestmentsBerkshire’s management determines the appropriate classifications of investments in fixed maturity
securities and equity securities at the time of acquisition and re-evaluates the classifications at eachbalance sheet date. Berkshire’s investments in fixed maturity and equity securities are primarilyclassified as available-for-sale, except for certain securities held by finance businesses which areclassified as held-to-maturity.
Held-to-maturity investments are carried at amortized cost, reflecting Berkshire’s intent and ability to holdthe securities to maturity. Available-for-sale securities are stated at fair value with net unrealized gainsor losses reported as a component of accumulated other comprehensive income.
Realized gains and losses arise when investments are sold (as determined on a specific identification basis)or are other-than-temporarily impaired and are included in the Consolidated Statements of Earnings.Berkshire reviews investments classified as held-to-maturity or available-for-sale as of each balancesheet date with respect to investments of an issuer carried at a net unrealized loss. If in management’s
31
(1) Significant accounting policies and practices (Continued)
(d) Investments (Continued)judgement, the decline in value is other-than-temporary, the cost of the investment is written down tofair value with a corresponding charge to earnings. Factors considered in determining whether animpairment exists include: the financial condition, business prospects and creditworthiness of the issuer,the length of time that the asset’s fair value has been less than cost, and Berkshire’s ability and intent tohold such investments until the fair value recovers.
Berkshire utilizes the equity method of accounting with respect to investments where it exercises significantinfluence, but not control, over the policies of the investee. A voting interest of at least 20% and nogreater than 50% is normally a prerequisite for utilizing the equity method. However Berkshire mayapply the equity method with less than 20% voting interests based upon the facts and circumstancesincluding representation on the Board of Directors, contractual veto or approval rights, participation inpolicy making processes and the existence or absence of other significant owners. Berkshire applies theequity method to investments in common stock and investments in preferred stock when such preferredstock possesses substantially identical subordinated interests to common stock. Berkshire accounts forinvestments in unconsolidated limited partnerships under the equity method.
In applying the equity method, investments are recorded at cost and subsequently increased or decreased bythe proportionate share of net earnings or losses of the investee. Berkshire also records its proportionateshare of other comprehensive income items of the investee as a component of its comprehensive income.Dividends or other equity distributions are recorded as a reduction of the investment. In the event thatnet losses of the investee have reduced the equity method investment to zero, additional net losses maybe recorded if additional investments in the investee are at-risk, even if Berkshire has not committed toprovide financial support to the investee. Berkshire bases such additional equity method loss amounts, ifany, on the change in its claim on the investee’s book value.
(e) Loans and finance receivablesLoans and finance receivables consist of commercial and consumer loans originated or purchased by
Berkshire’s finance and financial products businesses. Loans and finance receivables are carried atamortized cost.
(f) DerivativesDerivative contracts are predominantly used to manage economic risks associated with financial
instruments of finance and financial products businesses, including other derivative contracts. Inaddition, Berkshire enters into derivative contracts to manage general economic risks of the Company asa whole. Derivative instruments include interest rate, currency and equity swaps and options, interestrate caps and floors, futures and forward contracts and foreign currency exchange contracts.
Berkshire carries all derivative contracts at estimated fair value. These contracts are classified as tradingaccount assets or trading account liabilities in the accompanying Consolidated Balance Sheets andreflect reductions permitted under master netting agreements with counterparties. The fair values ofthese instruments represent the present value of expected future cash flows under the contract, which isa function of underlying interest rates, currency rates, security values, related volatility, thecreditworthiness of counterparties and duration of the contract. Future changes in these factors or acombination thereof may affect the fair value of these instruments. Most derivative contracts enteredinto by Berkshire are not designated as hedges for accounting purposes. Realized and unrealized gainsand losses from such contracts are included in the Consolidated Statements of Earnings.
(g) Securities sold under agreements to repurchaseSecurities sold under agreements to repurchase are accounted for as collateralized borrowings and are
recorded at the contractual repurchase amounts.

32
Notes to Consolidated Financial Statements (Continued)(1) Significant accounting policies and practices (Continued)
(h) InventoriesInventories are stated at the lower of cost or market. Cost with respect to manufactured goods includes raw
materials, direct and indirect labor and factory overhead. As of December 31, 2003, approximately 59%of the total inventory cost was determined using the last-in-first-out (“LIFO”) method, 28% using thefirst-in-first-out (“FIFO”) method, with the remainder using the specific identification method. Withrespect to inventories carried at LIFO cost, the aggregate difference in value between LIFO cost and costdetermined under FIFO methods was not material as of December 31, 2003 and December 31, 2002.
(i) Property, plant and equipmentProperty, plant and equipment is recorded at cost. Depreciation is provided principally on the straight-line
method over estimated useful lives as follows: aircraft, simulators, training equipment and spare parts, 4to 20 years; buildings and improvements, 10 to 40 years; machinery, equipment, furniture and fixtures, 3to 20 years. Leasehold improvements are amortized over the life of the lease or the life of theimprovement, whichever is shorter. Interest is capitalized as an integral component of cost during theconstruction period of simulators and facilities and is amortized over the life of the related assets.
(j) Goodwill of acquired businessesGoodwill of acquired businesses represents the difference between purchase cost and the fair value of net
assets of acquisitions accounted for under the purchase method. Prior to 2002, goodwill from eachacquisition was generally amortized as a charge to earnings over periods not exceeding 40 years, andwas reviewed for impairment if conditions were identified that indicated possible impairment.
Effective January 1, 2002, Berkshire adopted Statement of Financial Accounting Standards (“SFAS”) No.142 “Goodwill and Other Intangible Assets.” SFAS No. 142 eliminated the periodic amortization ofgoodwill in favor of an accounting model that is based solely upon impairment tests. Goodwill isreviewed for impairment using a variety of methods at least annually, and impairments, if any, arecharged to earnings. Annual impairment tests are performed in the fourth quarter.
(k) Revenue recognitionInsurance premiums for prospective property/casualty insurance and reinsurance and health reinsurance
policies are earned in proportion to the level of insurance protection provided. In most cases, premiumsare recognized as revenues ratably over their terms with unearned premiums computed on a monthly ordaily pro rata basis. Premium adjustments on contracts and audit premiums are based on estimates madeover the contract period. Premiums for retroactive reinsurance policies are earned at the inception of thecontracts. Premiums for life reinsurance contracts are earned when due. Premiums earned are stated netof amounts ceded to reinsurers. Premiums are estimated with respect to certain reinsurance contractswhere premiums are based upon reports from ceding companies for the reporting period that arecontractually due after the balance sheet date.
Revenues from product sales are recognized upon passage of title to the customer, which generallycoincides with customer pickup, product shipment, delivery or acceptance, depending on terms of thesales arrangement. Service revenues are recognized as the services are performed. Services providedpursuant to a contract are either recognized over the contract period, or upon completion of the elementsspecified in the contract, depending on the terms of the contract.
(l) Losses and loss adjustment expensesLiabilities for unpaid losses and loss adjustment expenses represent estimated claim and claim settlement
costs of property/casualty insurance and reinsurance contracts with respect to losses that have occurredas of the balance sheet date. The liabilities for losses and loss adjustment expenses are recorded at theestimated ultimate payment amounts, except that amounts arising from certain workers’ compensationreinsurance business are discounted as discussed below. Estimated ultimate payment amounts are basedupon (1) individual case estimates, (2) reports of losses from ceding insurers and (3) estimates ofincurred but not reported (“IBNR”) losses.
The estimated liabilities of workers’ compensation claims assumed under reinsurance contracts are carriedin the Consolidated Balance Sheets at discounted amounts. Discounted amounts are based upon anannual discount rate of 4.5% for claims arising prior to 2003 and 1% for claims arising after 2002. The

33
(1) Significant accounting policies and practices (Continued)
(l) Losses and loss adjustment expenses (Continued)lower rate for post-2002 claims reflects the lower interest rate environment prevailing in the UnitedStates. The discount rates are the same rates used under statutory accounting principles. The periodicdiscount accretion is included in the Consolidated Statements of Earnings as a component of losses andloss adjustment expenses.
(m) Deferred charges reinsurance assumedThe excess of estimated liabilities for claims and claim costs over the consideration received with respect to
retroactive property and casualty reinsurance contracts that provide for indemnification of insurance riskis established as a deferred charge at inception of such contracts. The deferred charges are subsequentlyamortized using the interest method over the expected claim settlement periods. The periodicamortization charges are reflected in the accompanying Consolidated Statements of Earnings as lossesand loss adjustment expenses.
Changes to the expected timing and estimated amount of loss payments produce changes in the unamortizeddeferred charge balance. Such changes in estimates are accounted for retrospectively with the net effectincluded in amortization expense in the period of the change.
(n) ReinsuranceProvisions for losses and loss adjustment expenses are reported in the accompanying Consolidated
Statements of Earnings after deducting amounts recovered and estimates of amounts recoverable underreinsurance contracts. Reinsurance contracts do not relieve the ceding company of its obligations toindemnify policyholders with respect to the underlying insurance and reinsurance contracts.
(o) Insurance premium acquisition costsCertain costs of acquiring insurance premiums are deferred, subject to ultimate recoverability, and charged
to income as the premiums are earned. Acquisition costs consist of commissions, premium taxes,advertising and other underwriting costs. The recoverability of premium acquisition costs, generally,reflects anticipation of investment income. The unamortized balances of deferred premium acquisitioncosts are included in other assets and were $1,278 million and $1,303 million at December 31, 2003 and2002, respectively.
(p) Foreign currencyThe accounts of foreign-based subsidiaries are measured using the local currency as the functional currency.
Revenues and expenses of these businesses are translated into U.S. dollars at the average exchange ratefor the period. Assets and liabilities are translated at the exchange rate as of the end of the reportingperiod. Gains or losses from translating the financial statements of foreign-based operations areincluded in shareholders’ equity as a component of accumulated other comprehensive income. Gainsand losses arising from other transactions denominated in a foreign currency are included in theConsolidated Statements of Earnings.
(q) Deferred income taxesDeferred income taxes are calculated under the liability method. Deferred tax assets and liabilities are
recorded based on differences between the financial statement and tax bases of assets and liabilities atthe enacted tax rates. Changes in deferred income tax assets and liabilities that are associated withcomponents of other comprehensive income, primarily unrealized investment gains, are charged orcredited directly to other comprehensive income. Otherwise, changes in deferred income tax assets andliabilities are included as a component of income tax expense.
(r) Accounting pronouncements to be adopted in 2004In December 2003, the Financial Accounting Standards Board (“FASB”) issued a revision to Statement No.
132, “Employers’ Disclosures about Pension Plans and Other Post Retirement Benefits”, which requiresadditional quantitative and qualitative disclosures concerning plan assets and benefit obligations. Certainof the new disclosures are effective immediately for U.S. plans and are included in Note 17.

34
Notes to Consolidated Financial Statements (Continued)(1) Significant accounting policies and practices (Continued)
(r) Accounting pronouncements to be adopted in 2004 (Continued)In December 2003, the FASB issued a revision to Interpretation No. 46, “Consolidation of Variable Interest
Entities” (“FIN 46”), which was originally issued in January 2003. FIN 46, as revised, providesguidance on the consolidation of certain entities when control exists through other than voting (orsimilar) interests and was effective immediately with respect to entities created after January 31, 2003.For certain special purpose entities created prior to February 1, 2003, FIN 46, as revised, becameeffective for financial statements issued after December 15, 2003. FIN 46, as revised, is effective for allother entities created prior to February 1, 2003 beginning with financial statements for reporting periodsending after March 15, 2004.
FIN 46, as revised, requires consolidation by the majority holder of expected residual gains and losses of theactivities of a variable interest entity (“VIE”). Berkshire is a limited partner in Value Capital L.P.(“Value Capital”), whose objective is to achieve income and capital growth from investment andarbitrage of fixed maturity securities. See Note 10. Neither Berkshire nor any of its subsidiaries possessany management authority over Value Capital and possess no voting or similar rights. Berkshireconducts no business activities with Value Capital. Berkshire does not guaranty or provide any financialsupport with respect to the obligations of Value Capital beyond its direct equity investment.
Berkshire has concluded that Value Capital meets the definition of a VIE under FIN 46, as revised. As theprimary beneficiary of the VIE, Berkshire is required to consolidate Value Capital beginning in the firstquarter of 2004. This change will have no effect on previously reported net earnings. Berkshire’sconsolidated assets and liabilities will increase approximately $18.5 billion based upon the assets andliabilities of Value Capital as of December 31, 2003.
(2) Significant business acquisitions
Berkshire’s long-held acquisition strategy is to purchase businesses with consistent earning power, good returns onequity, able and honest management and at sensible prices. Businesses with these characteristics typically have marketvalues that exceed net asset value, thus producing goodwill for accounting purposes.
On May 23, 2003, Berkshire acquired McLane Company, Inc. (“McLane”), from Wal-Mart Stores, Inc. for cashconsideration of approximately $1.5 billion. McLane is one of the nation’s largest wholesale distributors of groceriesand nonfood items to convenience stores, wholesale clubs, mass merchandisers, quick service restaurants, theaters andothers.
On August 7, 2003, Berkshire acquired all the outstanding common stock of Clayton Homes, Inc. (“Clayton”) forcash consideration of approximately $1.7 billion in the aggregate. Clayton is a vertically integrated manufactured housingcompany with 20 manufacturing plants, 306 company owned stores, 535 independent retailers, 89 manufactured housingcommunities and financial services operations that provide mortgage services and insurance protection.
During 2002, Berkshire completed five business acquisitions for cash consideration of approximately $2.3 billionin the aggregate. Information concerning these acquisitions follows.
Albecca Inc. (“Albecca”)On February 8, 2002, Berkshire acquired all of the outstanding shares of Albecca. Albecca designs, manufactures
and distributes a complete line of high-quality custom picture framing products primarily under the Larson-Juhl name.Fruit of the Loom (“FOL”)On April 30, 2002, Berkshire acquired the basic apparel business of Fruit of the Loom, LTD. FOL is a leading
vertically integrated basic apparel company manufacturing and marketing underwear, activewear, casualwear andchildrenswear. FOL operates on a worldwide basis and sells its products principally in North America under the Fruit ofthe Loom and BVD brand names.
Garan, Incorporated (“Garan”)On September 4, 2002, Berkshire acquired all of the outstanding common stock of Garan. Garan is a leading
manufacturer of children’s, women’s, and men’s apparel bearing the private labels of its customers as well as several ofits own trademarks, including GARANIMALS.
CTB International (“CTB”)On October 31, 2002, Berkshire acquired all of the outstanding shares of CTB, a manufacturer of equipment and
systems for the poultry, hog, egg production and grain industries.

35
(2) Significant business acquisitions (Continued)The Pampered Chef, LTD (“The Pampered Chef”)On October 31, 2002, Berkshire acquired The Pampered Chef, LTD. The Pampered Chef is the premier direct
seller of kitchen tools in the U.S., primarily through branded product lines.In addition, Berkshire completed four business acquisitions during 2001. Information concerning these
acquisitions follows.Shaw Industries, Inc. (“Shaw”)On January 8, 2001, Berkshire acquired approximately 87.3% of the common stock of Shaw for $19 per share, or
$2.1 billion in the aggregate and in January 2002, Berkshire acquired the remaining shares in exchange for 4,505 sharesof Berkshire Class A common stock and 7,063 shares of Berkshire Class B common stock. The aggregate market valueof Berkshire stock issued was approximately $324 million. Shaw is the world’s largest manufacturer of tuftedbroadloom carpet and rugs for residential and commercial applications throughout the U.S. Shaw markets its residentialand commercial products under a variety of brand names.
Johns Manville Corporation (“Johns Manville”)On February 27, 2001, Berkshire acquired all of the outstanding shares of Johns Manville for $13 per share, or
$1.8 billion in the aggregate. Johns Manville is a leading manufacturer of insulation and building products. JohnsManville manufactures and markets products for building and equipment insulation, commercial and industrial roofingsystems, high-efficiency filtration media, and fibers and non-woven mats used as reinforcements in building andindustrial applications.
MiTek Inc. (“MiTek”)On July 31, 2001, Berkshire acquired a 90% interest in MiTek for approximately $400 million. Existing MiTek
management acquired the remaining 10% interest. MiTek produces steel connector products, design engineeringsoftware and ancillary services for the building components market.
XTRA Corporation (“XTRA”)On September 20, 2001, Berkshire acquired all of the outstanding shares of XTRA for approximately $578
million. XTRA is a leading operating lessor of transportation equipment, including over-the-road trailers, marinecontainers and intermodal equipment.
The results of operations for each of the entities acquired are included in Berkshire’s consolidated results ofoperations from the effective date of each acquisition. The following table sets forth certain unaudited consolidatedearnings data for 2003 and 2002, as if each of the acquisitions discussed above were consummated on the same terms atthe beginning of each year. Dollars are in millions, except per share amounts.
2003 2002Total revenues ............................................................................................................................ $72,945 $66,194Net earnings ............................................................................................................................... 8,203 4,512Earnings per equivalent Class A common share........................................................................ 5,343 2,942
(3) Investments in MidAmerican Energy Holdings Company
On March 14, 2000, Berkshire acquired 900,942 shares of common stock and 34,563,395 shares of convertiblepreferred stock of MidAmerican Energy Holdings Company (“MidAmerican”) for $35.05 per share, or approximately$1.24 billion in the aggregate. During March 2002, Berkshire acquired 6,700,000 additional shares of the convertiblepreferred stock for $402 million. Such investments currently give Berkshire about a 9.9% voting interest and an 83.7%economic interest in the equity of MidAmerican (80.5% on a diluted basis). Since March 2000, Berkshire and certain ofits subsidiaries also acquired approximately $1,728 million of 11% non-transferable trust preferred securities, of which$150 million were redeemed in August 2003. Mr. Walter Scott, Jr., a member of Berkshire’s Board of Directors,controls approximately 88% of the voting interest in MidAmerican.
MidAmerican is a U.S. based global energy company whose principal businesses are regulated electric and naturalgas utilities, regulated interstate natural gas transmission and electric power generation. Through its subsidiaries it ownsand operates a combined electric and natural gas utility company in the United States, two natural gas pipelinecompanies in the United States, two electricity distribution companies in the United Kingdom and a diversified portfolioof domestic and international electric power projects. It also owns the second largest residential real estate brokeragefirm in the United States.
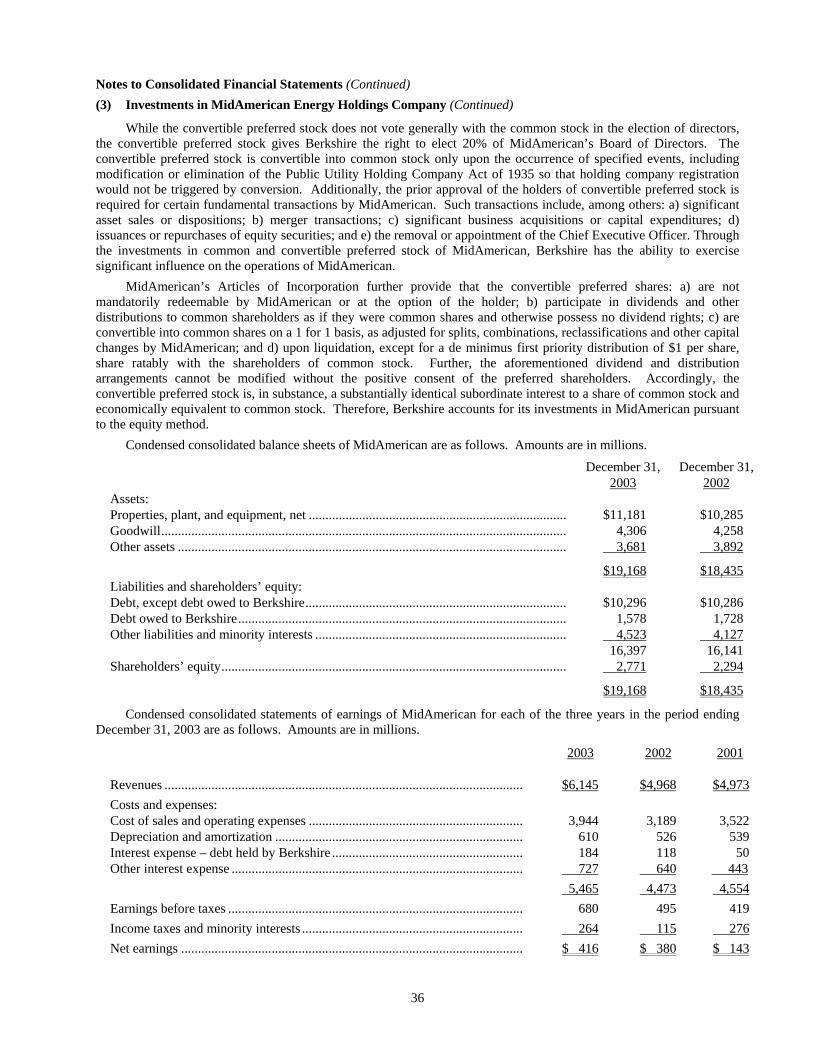
36
Notes to Consolidated Financial Statements (Continued)(3) Investments in MidAmerican Energy Holdings Company (Continued)
While the convertible preferred stock does not vote generally with the common stock in the election of directors,the convertible preferred stock gives Berkshire the right to elect 20% of MidAmerican’s Board of Directors. Theconvertible preferred stock is convertible into common stock only upon the occurrence of specified events, includingmodification or elimination of the Public Utility Holding Company Act of 1935 so that holding company registrationwould not be triggered by conversion. Additionally, the prior approval of the holders of convertible preferred stock isrequired for certain fundamental transactions by MidAmerican. Such transactions include, among others: a) significantasset sales or dispositions; b) merger transactions; c) significant business acquisitions or capital expenditures; d)issuances or repurchases of equity securities; and e) the removal or appointment of the Chief Executive Officer. Throughthe investments in common and convertible preferred stock of MidAmerican, Berkshire has the ability to exercisesignificant influence on the operations of MidAmerican.
MidAmerican’s Articles of Incorporation further provide that the convertible preferred shares: a) are notmandatorily redeemable by MidAmerican or at the option of the holder; b) participate in dividends and otherdistributions to common shareholders as if they were common shares and otherwise possess no dividend rights; c) areconvertible into common shares on a 1 for 1 basis, as adjusted for splits, combinations, reclassifications and other capitalchanges by MidAmerican; and d) upon liquidation, except for a de minimus first priority distribution of $1 per share,share ratably with the shareholders of common stock. Further, the aforementioned dividend and distributionarrangements cannot be modified without the positive consent of the preferred shareholders. Accordingly, theconvertible preferred stock is, in substance, a substantially identical subordinate interest to a share of common stock andeconomically equivalent to common stock. Therefore, Berkshire accounts for its investments in MidAmerican pursuantto the equity method.
Condensed consolidated balance sheets of MidAmerican are as follows. Amounts are in millions.
December 31, December 31,2003 2002
Assets:Properties, plant, and equipment, net ............................................................................. $11,181 $10,285Goodwill......................................................................................................................... 4,306 4,258Other assets .................................................................................................................... 3,681 3,892
$19,168 $18,435Liabilities and shareholders’ equity:Debt, except debt owed to Berkshire.............................................................................. $10,296 $10,286Debt owed to Berkshire.................................................................................................. 1,578 1,728Other liabilities and minority interests ........................................................................... 4,523 4,127
16,397 16,141Shareholders’ equity....................................................................................................... 2,771 2,294
$19,168 $18,435
Condensed consolidated statements of earnings of MidAmerican for each of the three years in the period endingDecember 31, 2003 are as follows. Amounts are in millions.
2003 2002 2001
Revenues ........................................................................................................... $6,145 $4,968 $4,973Costs and expenses:Cost of sales and operating expenses ................................................................ 3,944 3,189 3,522Depreciation and amortization .......................................................................... 610 526 539Interest expense – debt held by Berkshire ......................................................... 184 118 50Other interest expense ....................................................................................... 727 640 443
5,465 4,473 4,554Earnings before taxes ........................................................................................ 680 495 419Income taxes and minority interests .................................................................. 264 115 276Net earnings ...................................................................................................... $ 416 $ 380 $ 143
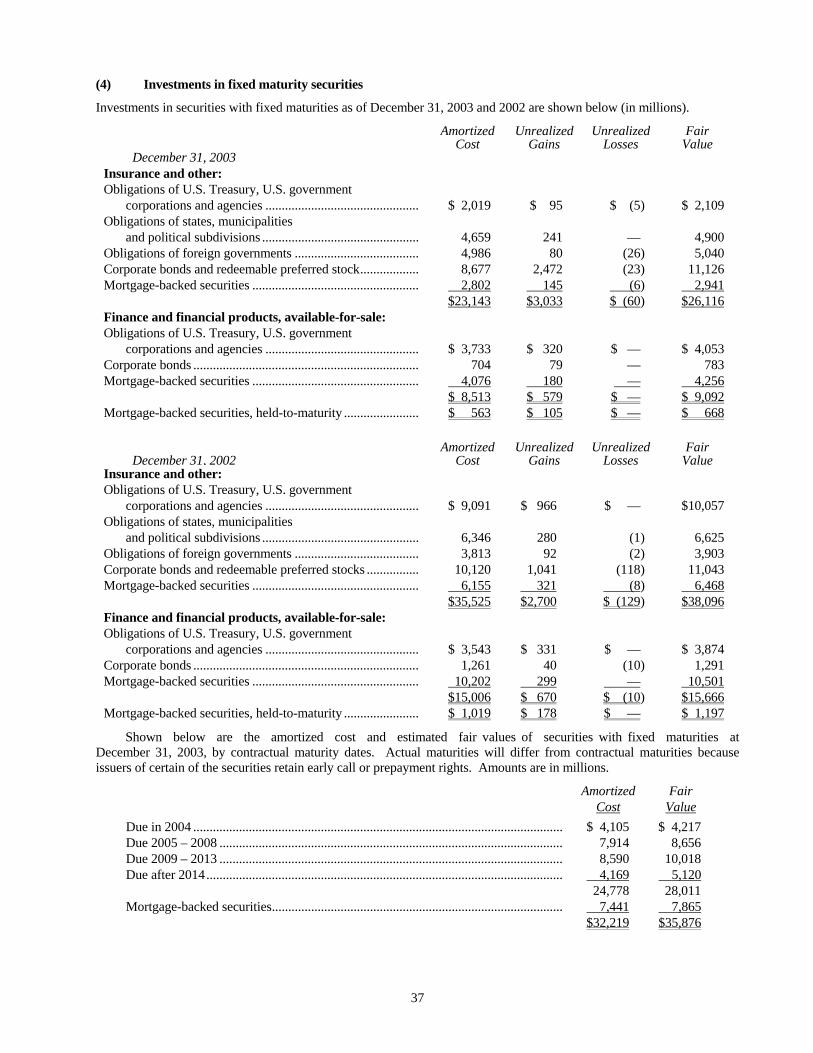
37
(4) Investments in fixed maturity securities
Investments in securities with fixed maturities as of December 31, 2003 and 2002 are shown below (in millions).
Amortized Unrealized Unrealized FairCost Gains Losses Value
December 31, 2003Insurance and other:Obligations of U.S. Treasury, U.S. government
corporations and agencies ............................................... $ 2,019 $ 95 $ (5) $ 2,109Obligations of states, municipalities
and political subdivisions ................................................ 4,659 241 — 4,900Obligations of foreign governments ...................................... 4,986 80 (26) 5,040Corporate bonds and redeemable preferred stock.................. 8,677 2,472 (23) 11,126Mortgage-backed securities ................................................... 2,802 145 (6) 2,941
$23,143 $3,033 $ (60) $26,116Finance and financial products, available-for-sale:Obligations of U.S. Treasury, U.S. government
corporations and agencies ............................................... $ 3,733 $ 320 $ — $ 4,053Corporate bonds ..................................................................... 704 79 — 783Mortgage-backed securities ................................................... 4,076 180 — 4,256
$ 8,513 $ 579 $ — $ 9,092Mortgage-backed securities, held-to-maturity ....................... $ 563 $ 105 $ — $ 668
Amortized Unrealized Unrealized FairDecember 31, 2002 Cost Gains Losses Value
Insurance and other:Obligations of U.S. Treasury, U.S. government
corporations and agencies ............................................... $ 9,091 $ 966 $ — $10,057Obligations of states, municipalities
and political subdivisions ................................................ 6,346 280 (1) 6,625Obligations of foreign governments ...................................... 3,813 92 (2) 3,903Corporate bonds and redeemable preferred stocks ................ 10,120 1,041 (118) 11,043Mortgage-backed securities ................................................... 6,155 321 (8) 6,468
$35,525 $2,700 $ (129) $38,096Finance and financial products, available-for-sale:Obligations of U.S. Treasury, U.S. government
corporations and agencies ............................................... $ 3,543 $ 331 $ — $ 3,874Corporate bonds ..................................................................... 1,261 40 (10) 1,291Mortgage-backed securities ................................................... 10,202 299 — 10,501
$15,006 $ 670 $ (10) $15,666Mortgage-backed securities, held-to-maturity ....................... $ 1,019 $ 178 $ — $ 1,197
Shown below are the amortized cost and estimated fair values of securities with fixed maturities atDecember 31, 2003, by contractual maturity dates. Actual maturities will differ from contractual maturities becauseissuers of certain of the securities retain early call or prepayment rights. Amounts are in millions.
Amortized FairCost Value
Due in 2004 ................................................................................................................. $ 4,105 $ 4,217Due 2005 – 2008 ......................................................................................................... 7,914 8,656Due 2009 – 2013 ......................................................................................................... 8,590 10,018Due after 2014............................................................................................................. 4,169 5,120
24,778 28,011Mortgage-backed securities......................................................................................... 7,441 7,865
$32,219 $35,876
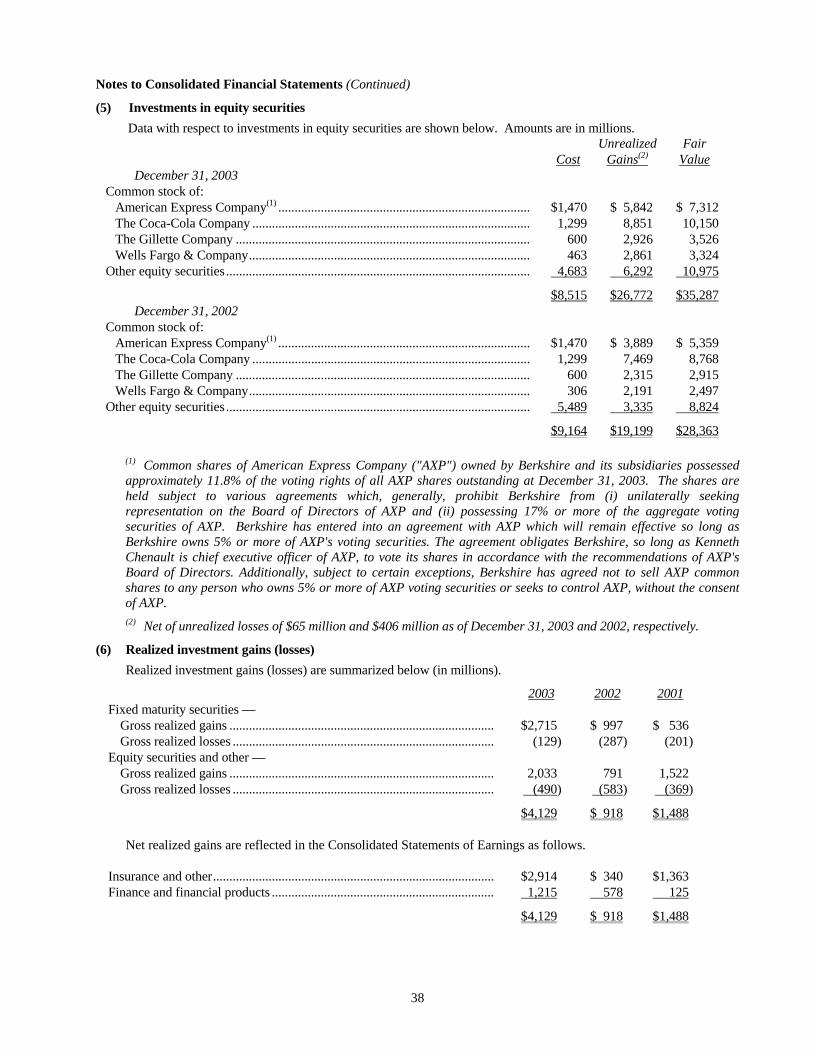
38
Notes to Consolidated Financial Statements (Continued)
(5) Investments in equity securitiesData with respect to investments in equity securities are shown below. Amounts are in millions.
Unrealized FairCost Gains(2) Value
December 31, 2003Common stock of:
American Express Company(1) ............................................................................. $1,470 $ 5,842 $ 7,312The Coca-Cola Company ..................................................................................... 1,299 8,851 10,150The Gillette Company .......................................................................................... 600 2,926 3,526Wells Fargo & Company...................................................................................... 463 2,861 3,324
Other equity securities............................................................................................. 4,683 6,292 10,975
$8,515 $26,772 $35,287December 31, 2002
Common stock of:American Express Company(1) ............................................................................. $1,470 $ 3,889 $ 5,359The Coca-Cola Company ..................................................................................... 1,299 7,469 8,768The Gillette Company .......................................................................................... 600 2,315 2,915Wells Fargo & Company...................................................................................... 306 2,191 2,497
Other equity securities............................................................................................. 5,489 3,335 8,824
$9,164 $19,199 $28,363
(1) Common shares of American Express Company ("AXP") owned by Berkshire and its subsidiaries possessedapproximately 11.8% of the voting rights of all AXP shares outstanding at December 31, 2003. The shares areheld subject to various agreements which, generally, prohibit Berkshire from (i) unilaterally seekingrepresentation on the Board of Directors of AXP and (ii) possessing 17% or more of the aggregate votingsecurities of AXP. Berkshire has entered into an agreement with AXP which will remain effective so long asBerkshire owns 5% or more of AXP's voting securities. The agreement obligates Berkshire, so long as KennethChenault is chief executive officer of AXP, to vote its shares in accordance with the recommendations of AXP'sBoard of Directors. Additionally, subject to certain exceptions, Berkshire has agreed not to sell AXP commonshares to any person who owns 5% or more of AXP voting securities or seeks to control AXP, without the consentof AXP.(2) Net of unrealized losses of $65 million and $406 million as of December 31, 2003 and 2002, respectively.
(6) Realized investment gains (losses)Realized investment gains (losses) are summarized below (in millions).
2003 2002 2001Fixed maturity securities —
Gross realized gains ................................................................................. $2,715 $ 997 $ 536Gross realized losses ................................................................................ (129) (287) (201)
Equity securities and other —Gross realized gains ................................................................................. 2,033 791 1,522Gross realized losses ................................................................................ (490) (583) (369)
$4,129 $ 918 $1,488
Net realized gains are reflected in the Consolidated Statements of Earnings as follows.
Insurance and other...................................................................................... $2,914 $ 340 $1,363Finance and financial products .................................................................... 1,215 578 125
$4,129 $ 918 $1,488
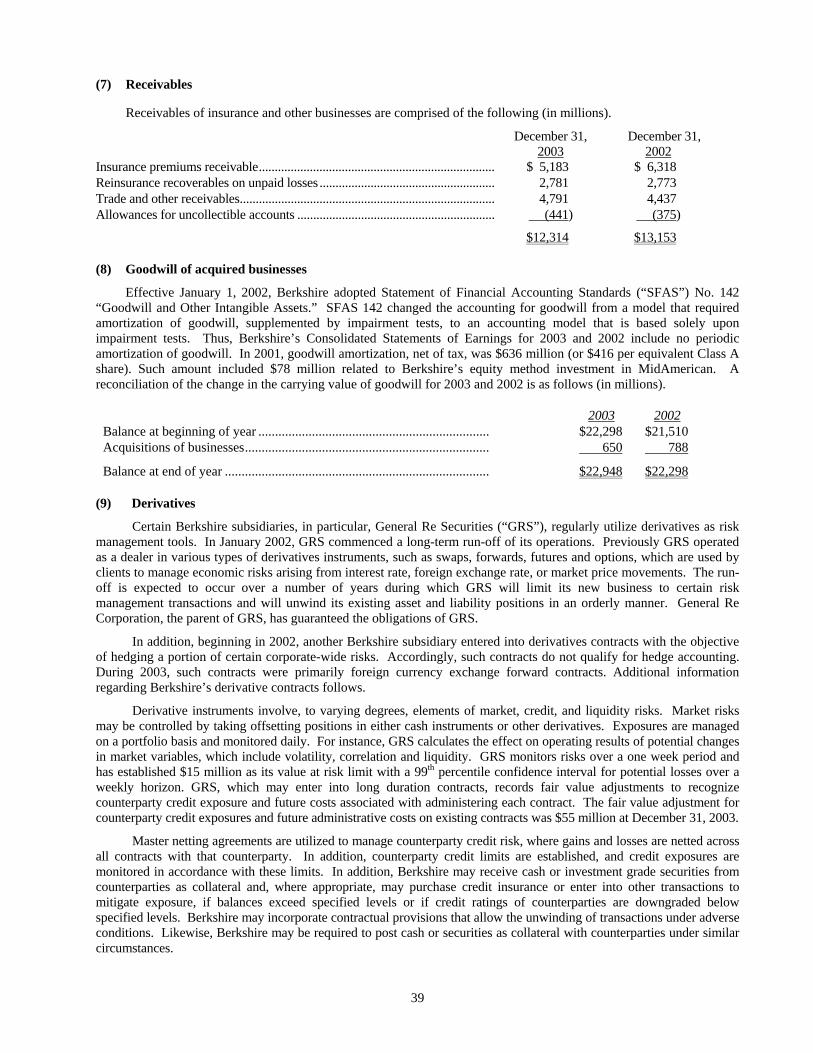
39
(7) Receivables
Receivables of insurance and other businesses are comprised of the following (in millions).
December 31, December 31,2003 2002
Insurance premiums receivable.......................................................................... $ 5,183 $ 6,318Reinsurance recoverables on unpaid losses ....................................................... 2,781 2,773Trade and other receivables................................................................................ 4,791 4,437Allowances for uncollectible accounts .............................................................. (441) (375)
$12,314 $13,153
(8) Goodwill of acquired businesses
Effective January 1, 2002, Berkshire adopted Statement of Financial Accounting Standards (“SFAS”) No. 142“Goodwill and Other Intangible Assets.” SFAS 142 changed the accounting for goodwill from a model that requiredamortization of goodwill, supplemented by impairment tests, to an accounting model that is based solely uponimpairment tests. Thus, Berkshire’s Consolidated Statements of Earnings for 2003 and 2002 include no periodicamortization of goodwill. In 2001, goodwill amortization, net of tax, was $636 million (or $416 per equivalent Class Ashare). Such amount included $78 million related to Berkshire’s equity method investment in MidAmerican. Areconciliation of the change in the carrying value of goodwill for 2003 and 2002 is as follows (in millions).
2003 2002Balance at beginning of year ..................................................................... $22,298 $21,510Acquisitions of businesses......................................................................... 650 788
Balance at end of year ............................................................................... $22,948 $22,298
(9) Derivatives
Certain Berkshire subsidiaries, in particular, General Re Securities (“GRS”), regularly utilize derivatives as riskmanagement tools. In January 2002, GRS commenced a long-term run-off of its operations. Previously GRS operatedas a dealer in various types of derivatives instruments, such as swaps, forwards, futures and options, which are used byclients to manage economic risks arising from interest rate, foreign exchange rate, or market price movements. The run-off is expected to occur over a number of years during which GRS will limit its new business to certain riskmanagement transactions and will unwind its existing asset and liability positions in an orderly manner. General ReCorporation, the parent of GRS, has guaranteed the obligations of GRS.
In addition, beginning in 2002, another Berkshire subsidiary entered into derivatives contracts with the objectiveof hedging a portion of certain corporate-wide risks. Accordingly, such contracts do not qualify for hedge accounting.During 2003, such contracts were primarily foreign currency exchange forward contracts. Additional informationregarding Berkshire’s derivative contracts follows.
Derivative instruments involve, to varying degrees, elements of market, credit, and liquidity risks. Market risksmay be controlled by taking offsetting positions in either cash instruments or other derivatives. Exposures are managedon a portfolio basis and monitored daily. For instance, GRS calculates the effect on operating results of potential changesin market variables, which include volatility, correlation and liquidity. GRS monitors risks over a one week period andhas established $15 million as its value at risk limit with a 99th percentile confidence interval for potential losses over aweekly horizon. GRS, which may enter into long duration contracts, records fair value adjustments to recognizecounterparty credit exposure and future costs associated with administering each contract. The fair value adjustment forcounterparty credit exposures and future administrative costs on existing contracts was $55 million at December 31, 2003.
Master netting agreements are utilized to manage counterparty credit risk, where gains and losses are netted acrossall contracts with that counterparty. In addition, counterparty credit limits are established, and credit exposures aremonitored in accordance with these limits. In addition, Berkshire may receive cash or investment grade securities fromcounterparties as collateral and, where appropriate, may purchase credit insurance or enter into other transactions tomitigate exposure, if balances exceed specified levels or if credit ratings of counterparties are downgraded belowspecified levels. Berkshire may incorporate contractual provisions that allow the unwinding of transactions under adverseconditions. Likewise, Berkshire may be required to post cash or securities as collateral with counterparties under similarcircumstances.

40
Notes to Consolidated Financial Statements (Continued)(9) Derivatives (Continued)
At December 31, 2003, Berkshire subsidiaries accepted collateral with a fair value of $1,220 million to secureunrealized gains on derivatives. Of the securities held as collateral, approximately $31 million were repledged as ofDecember 31, 2003. At December 31, 2003, securities with a fair value of approximately $441 million (which includes$31 million of repledged securities as described above) were pledged against derivative liabilities with a fair value of$733 million. Contractual terms with counterparties often require additional collateral to be posted immediately in theevent of a decline in the financial rating of the counterparty or its guarantor.
Assuming non-performance by all counterparties on all contracts potentially subject to a loss, the maximumpotential loss, based on the cost of replacement, net of collateral held, at market rates prevailing at December 31, 2003approximated $3,439 million. The following table presents derivatives portfolios by counterparty credit quality andmaturity at December 31, 2003. The amounts shown under gross exposure in the table are before consideration of nettingarrangements and collateral held by Berkshire affiliates. Net fair value shown in the table represents unrealized gains onfinancial instrument contracts in gain positions, net of any unrealized loss owed to these counterparties on offsettingpositions. Net exposure shown in the table that follows is net fair value less collateral held. Amounts are in millions.
Gross ExposureNet Fair Net Percentage
0 – 5 6 – 10 Over 10 Total Value Exposure of TotalCredit quality (years)
AAA ....................................... $1,119 $ 443 $ 631 $ 2,193 $ 557 $ 557 16%AA.......................................... 3,236 1,781 1,969 6,986 2,187 1,578 46A............................................. 2,341 1,035 1,517 4,893 1,554 1,132 33BBB and Below...................... 361 175 39 575 221 172 5
Total $7,057 $3,434 $4,156 $14,647 $4,519 $3,439 100%
Liquidity risk can arise from funding the portfolio of open transactions. Movements in underlying market variablesaffect both future cash flows related to the transactions and collateral required to cover the value of open positions.
(10) Investment in Value Capital
Value Capital L.P., (“Value Capital”), a limited partnership, commenced operations in 1998. A wholly ownedBerkshire subsidiary is a limited partner in Value Capital. The partnership’s objective is to achieve income and capitalgrowth from investments and arbitrage in fixed income investments. Profits and losses (after fees to the general partner)are allocated to the partners based upon each partner’s investment. Through December 31, 2003, Berkshire accountedfor its limited partnership investment pursuant to the equity method. At December 31, 2003, the carrying value of $634million (including Berkshire’s share of accumulated undistributed earnings of $204 million) is included as a componentof other assets of finance and financial products businesses. In January of 2004, Berkshire received a cash distributionof $30 million from Value Capital. As a limited partner, Berkshire’s exposure to loss is limited to the carrying value ofits investment. Beginning in 2004, Berkshire will consolidate Value Capital in connection with the adoption of FIN 46,as revised. See Note 1 (r) for additional information.
As of December 31, 2003, Value Capital had total assets of $19.2 billion, total liabilities of $18.5 billion andcapital of $688 million. For the year ending December 31, 2003, revenues were $596 million, expenses were $564million and net earnings were $32 million.
(11) Unpaid losses and loss adjustment expenses
The balances of unpaid losses and loss adjustment expenses are based upon estimates of the ultimate claim costsassociated with claim occurrences as of the balance sheet dates including estimates for incurred but not reported(“IBNR”) claims. Considerable judgment is required to evaluate claims and establish estimated claim liabilities,particularly with respect to certain casualty or liability claims, which are typically reported over long periods of time andsubject to changing legal and litigation trends. This delay in claim reporting is exacerbated in reinsurance of liability orcasualty claims as claim reporting by ceding companies is further delayed by contract terms.

41
(11) Unpaid losses and loss adjustment expenses (Continued)
Supplemental data with respect to unpaid losses and loss adjustment expenses of property/casualty insurancesubsidiaries (in millions) is as follows.
2003 2002 2001Unpaid losses and loss adjustment expenses:
Gross liabilities at beginning of year ................................................................ $43,771 $40,562 $32,868Ceded losses and deferred charges.................................................................... (6,002) (6,189) (5,590)
Net balance........................................................................................................ 37,769 34,373 27,278
Incurred losses recorded:Current accident year ........................................................................................ 13,135 12,206 15,607All prior accident years ..................................................................................... 480 1,540 1,152
Total incurred losses ......................................................................................... 13,615 13,746 16,759
Payments with respect to:Current accident year ........................................................................................ 4,493 4,042 4,435All prior accident years ..................................................................................... 8,092 6,653 5,352
Total payments .................................................................................................. 12,585 10,695 9,787
Unpaid losses and loss adjustment expenses:Net balance at end of year................................................................................. 38,799 37,424 34,250Ceded losses and deferred charges.................................................................... 5,684 6,002 6,189Foreign currency translation adjustment........................................................... 910 345 30Net liabilities assumed in connection with business acquisitions..................... — — 93
Gross liabilities at end of year.............................................................................. $45,393 $43,771 $40,562
Incurred losses “all prior accident years” reflects the amount of estimation error charged or credited to earnings ineach year with respect to the liabilities established as of the beginning of that year. Berkshire recorded additional lossesof $480 million in 2003, $1,540 million in 2002 and $1,152 million in 2001 with respect to losses occurring in prioryears. Such amounts as percentages of the net balance as of the beginning of the year were 1.3%, 4.5% and 4.2% in2003, 2002 and 2001, respectively.
Prior accident years’ losses incurred also include amortization of deferred charges related to retroactivereinsurance contracts incepting prior to January 1, 2003. Amortization charges included in prior accident years’ losseswere $432 million in 2003, $430 million in 2002 and $328 million in 2001. Certain workers’ compensation reserves ofGeneral Re are discounted. Net discounted liabilities at December 31, 2003 and 2002 were $2,211 million and $2,015million, respectively, and are net of discounts totaling $2,435 million and $2,405 million. Periodic accretions of thesediscounts are also a component of prior years’ losses incurred. The accretion of discounted liabilities is included inincurred losses for all prior accident years and was approximately $85 million in 2003, $81 million in 2002 and $69million in 2001. The most significant component of losses from prior years’ occurrences in both 2002 and 2001 wasreserve increases with respect to General Re’s North American and international property/casualty reinsurancebusinesses.
Berkshire’s insurance subsidiaries are exposed to environmental, asbestos and other latent injury claims arisingfrom insurance and reinsurance contracts. Loss reserve estimates for environmental and asbestos exposures include casebasis reserves, which also reflect reserves for legal and other loss adjustment expenses and IBNR reserves. IBNRreserves are determined based upon Berkshire’s historic general liability exposure base and policy language, previousenvironmental and loss experience and the assessment of current trends of environmental law, environmental cleanupcosts, asbestos liability law and judgmental settlements of asbestos liabilities.
The liabilities for environmental, asbestos, and latent injury claims and claims expenses net of reinsurancerecoverables were approximately $5.5 billion at December 31, 2003 and $6.6 billion at December 31, 2002. Theseliabilities include $4.4 billion at December 31, 2003 and $5.4 billion at December 31, 2002, of liabilities assumed under

42
Notes to Consolidated Financial Statements (Continued)(11) Unpaid losses and loss adjustment expenses (Continued)
retroactive reinsurance contracts written by the Berkshire Hathaway Reinsurance Group. The decline in these liabilitiesover the last twelve months was primarily attributed to commutations of certain contracts in 2003. Claim liabilitiesarising from the retroactive contracts are subject to aggregate policy limits. Thus, Berkshire’s exposure toenvironmental and latent injury claims under these contracts is, likewise, limited. Claims paid or reserved under thesepolicies were approximately 86% of aggregate policy limits as of the end of 2003.
Berkshire monitors evolving case law and its effect on environmental and latent injury claims. Changinggovernment regulations, newly identified toxins, newly reported claims, new theories of liability, new contractinterpretations and other factors could result in significant increases in these liabilities. Such development could bematerial to Berkshire’s results of operations. It is not possible to reliably estimate the amount of additional net loss, orthe range of net loss, that is reasonably possible.
(12) Notes payable and other borrowings
Notes payable and other borrowings of Berkshire and its subsidiaries as of December 31, 2003 and 2002 aresummarized below. Amounts are in millions.
2003 2002Insurance and other:
Issued by Berkshire:SQUARZ notes 3% due 2007................................................................ $ 400 $ 400Investment agreements due 2012-2033 ................................................. 632 386
Issued by subsidiaries and guaranteed by Berkshire:Commercial paper and other short-term borrowings............................. 1,527 1,834Other debt due 2006-2035..................................................................... 315 275
Issued by subsidiaries and not guaranteed by Berkshire:Commercial paper and other short-term borrowings............................. 14 349Borrowings under investment agreements due 2004-2041.................... 271 384Other debt due 2004-2032..................................................................... 1,023 1,147
$4,182 $4,775Finance and financial products:
Issued by subsidiaries and guaranteed by Berkshire:Commercial paper and other short-term borrowings............................. $ 83 $ 223.375% notes due 2008 ......................................................................... 744 —4.20% notes due 2010 ........................................................................... 497 —4.625% notes due 2013 ......................................................................... 744 —Bank borrowings due 2006.................................................................... 525 2,175Other...................................................................................................... 201 196
Issued by subsidiaries and not guaranteed by Berkshire:Commercial paper and other short-term borrowings............................. 80 204Other debt due 2004-2037..................................................................... 2,063 1,916
$4,937 $4,513
Commercial paper and other short-term borrowings are obligations of certain businesses that utilize short-termborrowings as part of financing their operations. Weighted average interest rates as of December 31, 2003 and 2002were 1.3% and 2.4% respectively. Berkshire affiliates have approximately $6.6 billion available unused lines of creditand commercial paper capacity to support their short-term borrowing programs and, otherwise, provide additionalliquidity.
Investment agreements represent numerous individual contractual borrowing arrangements under whichBerkshire is required to periodically pay interest over contract terms, which range from a few months to over 30 years.Interest under such contracts may be at fixed or variable rates. The weighted average interest rate on amountsoutstanding as of December 31, 2003 and 2002 was 3.1% and 3.9%, respectively. Under certain conditions, principalamounts may be redeemed without premium prior to the contractual maturity date at the option of the counterparties.
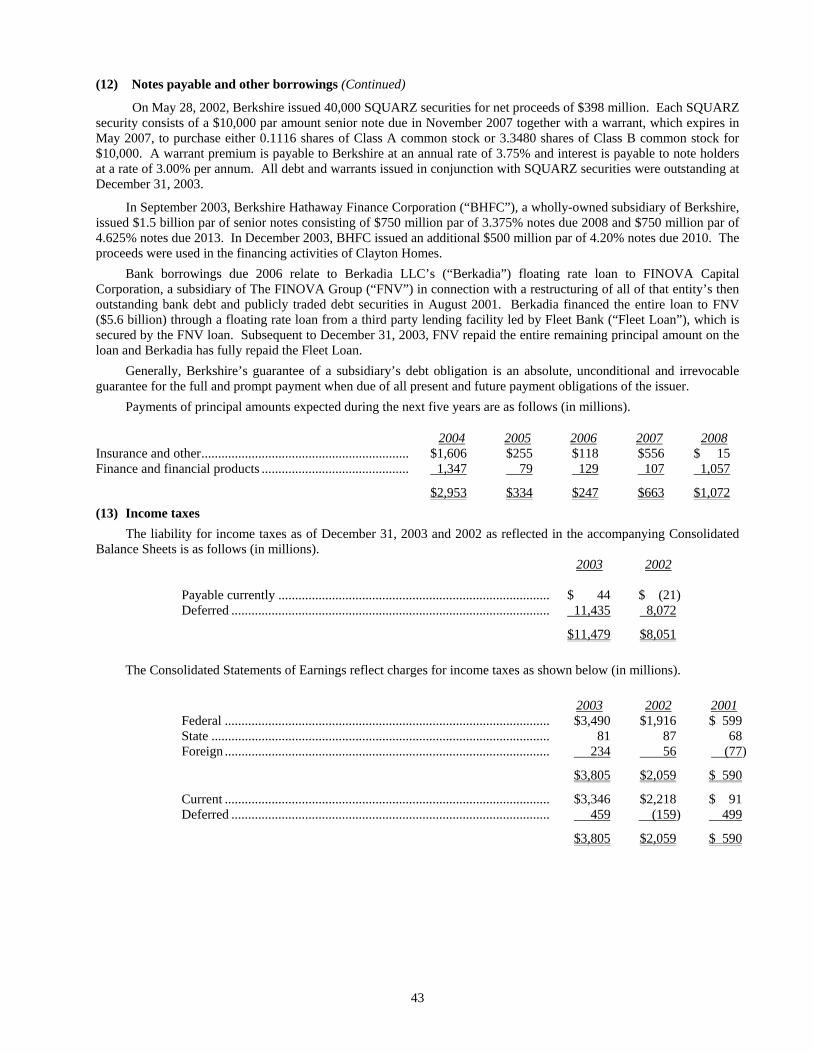
43
(12) Notes payable and other borrowings (Continued)
On May 28, 2002, Berkshire issued 40,000 SQUARZ securities for net proceeds of $398 million. Each SQUARZsecurity consists of a $10,000 par amount senior note due in November 2007 together with a warrant, which expires inMay 2007, to purchase either 0.1116 shares of Class A common stock or 3.3480 shares of Class B common stock for$10,000. A warrant premium is payable to Berkshire at an annual rate of 3.75% and interest is payable to note holdersat a rate of 3.00% per annum. All debt and warrants issued in conjunction with SQUARZ securities were outstanding atDecember 31, 2003.
In September 2003, Berkshire Hathaway Finance Corporation (“BHFC”), a wholly-owned subsidiary of Berkshire,issued $1.5 billion par of senior notes consisting of $750 million par of 3.375% notes due 2008 and $750 million par of4.625% notes due 2013. In December 2003, BHFC issued an additional $500 million par of 4.20% notes due 2010. Theproceeds were used in the financing activities of Clayton Homes.
Bank borrowings due 2006 relate to Berkadia LLC’s (“Berkadia”) floating rate loan to FINOVA CapitalCorporation, a subsidiary of The FINOVA Group (“FNV”) in connection with a restructuring of all of that entity’s thenoutstanding bank debt and publicly traded debt securities in August 2001. Berkadia financed the entire loan to FNV($5.6 billion) through a floating rate loan from a third party lending facility led by Fleet Bank (“Fleet Loan”), which issecured by the FNV loan. Subsequent to December 31, 2003, FNV repaid the entire remaining principal amount on theloan and Berkadia has fully repaid the Fleet Loan.
Generally, Berkshire’s guarantee of a subsidiary’s debt obligation is an absolute, unconditional and irrevocableguarantee for the full and prompt payment when due of all present and future payment obligations of the issuer.
Payments of principal amounts expected during the next five years are as follows (in millions).
2004 2005 2006 2007 2008Insurance and other.............................................................. $1,606 $255 $118 $556 $ 15Finance and financial products ............................................ 1,347 79 129 107 1,057
$2,953 $334 $247 $663 $1,072(13) Income taxes
The liability for income taxes as of December 31, 2003 and 2002 as reflected in the accompanying ConsolidatedBalance Sheets is as follows (in millions).
2003 2002
Payable currently ................................................................................. $ 44 $ (21)Deferred ............................................................................................... 11,435 8,072
$11,479 $8,051
The Consolidated Statements of Earnings reflect charges for income taxes as shown below (in millions).
2003 2002 2001Federal ................................................................................................. $3,490 $1,916 $ 599State ..................................................................................................... 81 87 68Foreign ................................................................................................. 234 56 (77)
$3,805 $2,059 $ 590
Current ................................................................................................. $3,346 $2,218 $ 91Deferred ............................................................................................... 459 (159) 499
$3,805 $2,059 $ 590
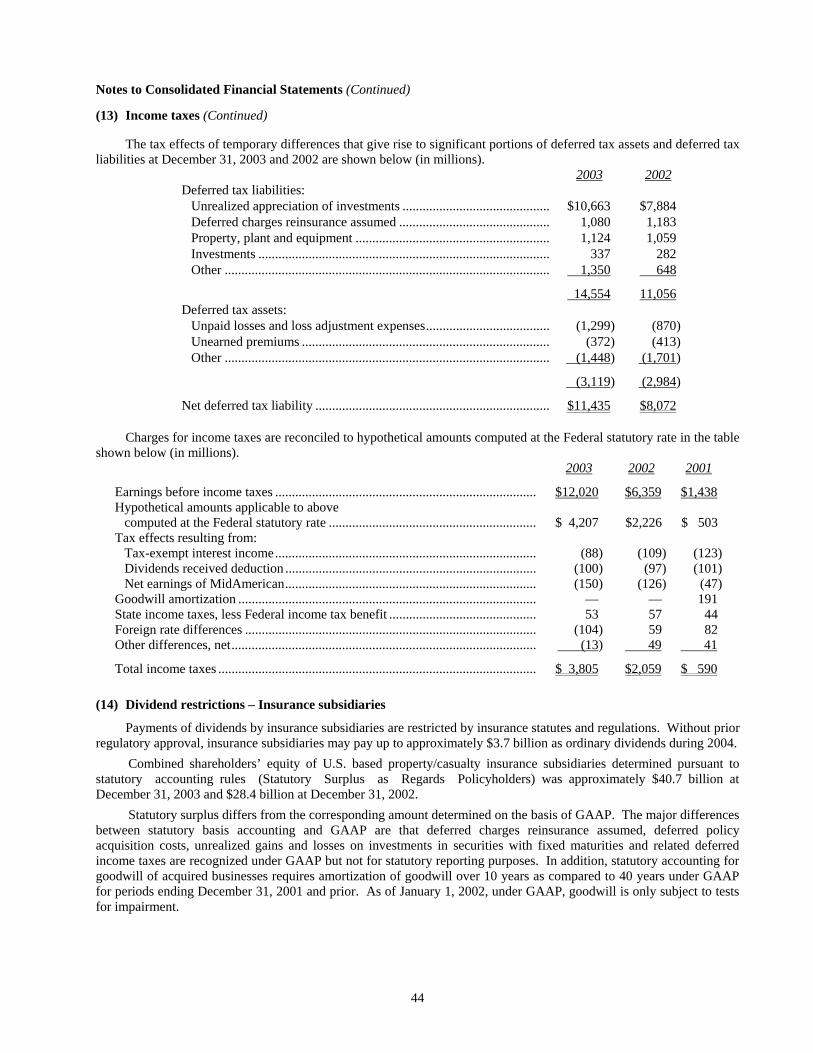
44
Notes to Consolidated Financial Statements (Continued)
(13) Income taxes (Continued)
The tax effects of temporary differences that give rise to significant portions of deferred tax assets and deferred taxliabilities at December 31, 2003 and 2002 are shown below (in millions).
2003 2002Deferred tax liabilities:
Unrealized appreciation of investments ............................................ $10,663 $7,884Deferred charges reinsurance assumed ............................................. 1,080 1,183Property, plant and equipment .......................................................... 1,124 1,059Investments ....................................................................................... 337 282Other ................................................................................................. 1,350 648
14,554 11,056Deferred tax assets:
Unpaid losses and loss adjustment expenses..................................... (1,299) (870)Unearned premiums .......................................................................... (372) (413)Other ................................................................................................. (1,448) (1,701)
(3,119) (2,984)
Net deferred tax liability ...................................................................... $11,435 $8,072
Charges for income taxes are reconciled to hypothetical amounts computed at the Federal statutory rate in the tableshown below (in millions).
2003 2002 2001
Earnings before income taxes .............................................................................. $12,020 $6,359 $1,438Hypothetical amounts applicable to above
computed at the Federal statutory rate .............................................................. $ 4,207 $2,226 $ 503Tax effects resulting from:
Tax-exempt interest income.............................................................................. (88) (109) (123)Dividends received deduction ........................................................................... (100) (97) (101)Net earnings of MidAmerican........................................................................... (150) (126) (47)
Goodwill amortization ......................................................................................... — — 191State income taxes, less Federal income tax benefit ............................................ 53 57 44Foreign rate differences ....................................................................................... (104) 59 82Other differences, net........................................................................................... (13) 49 41
Total income taxes ............................................................................................... $ 3,805 $2,059 $ 590
(14) Dividend restrictions – Insurance subsidiaries
Payments of dividends by insurance subsidiaries are restricted by insurance statutes and regulations. Without priorregulatory approval, insurance subsidiaries may pay up to approximately $3.7 billion as ordinary dividends during 2004.
Combined shareholders’ equity of U.S. based property/casualty insurance subsidiaries determined pursuant tostatutory accounting rules (Statutory Surplus as Regards Policyholders) was approximately $40.7 billion atDecember 31, 2003 and $28.4 billion at December 31, 2002.
Statutory surplus differs from the corresponding amount determined on the basis of GAAP. The major differencesbetween statutory basis accounting and GAAP are that deferred charges reinsurance assumed, deferred policyacquisition costs, unrealized gains and losses on investments in securities with fixed maturities and related deferredincome taxes are recognized under GAAP but not for statutory reporting purposes. In addition, statutory accounting forgoodwill of acquired businesses requires amortization of goodwill over 10 years as compared to 40 years under GAAPfor periods ending December 31, 2001 and prior. As of January 1, 2002, under GAAP, goodwill is only subject to testsfor impairment.
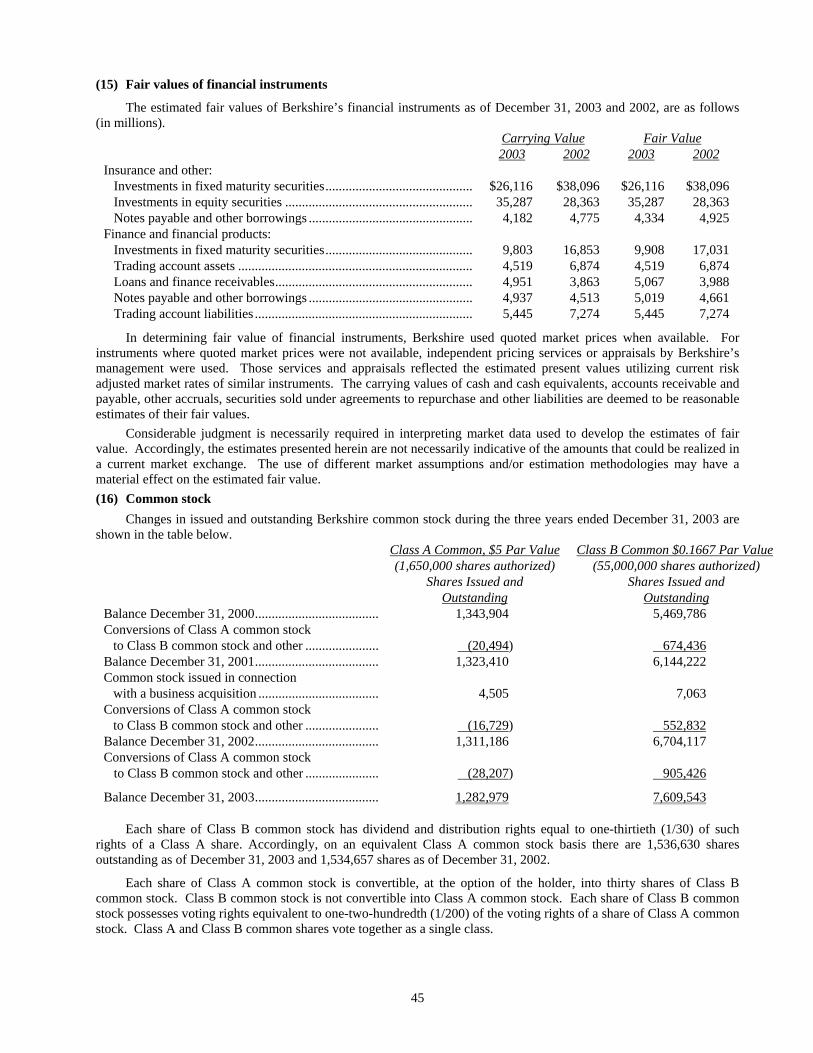
45
(15) Fair values of financial instruments
The estimated fair values of Berkshire’s financial instruments as of December 31, 2003 and 2002, are as follows(in millions).
Carrying Value Fair Value2003 2002 2003 2002
Insurance and other:Investments in fixed maturity securities............................................ $26,116 $38,096 $26,116 $38,096Investments in equity securities ........................................................ 35,287 28,363 35,287 28,363Notes payable and other borrowings ................................................. 4,182 4,775 4,334 4,925
Finance and financial products:Investments in fixed maturity securities............................................ 9,803 16,853 9,908 17,031Trading account assets ...................................................................... 4,519 6,874 4,519 6,874Loans and finance receivables........................................................... 4,951 3,863 5,067 3,988Notes payable and other borrowings ................................................. 4,937 4,513 5,019 4,661Trading account liabilities ................................................................. 5,445 7,274 5,445 7,274
In determining fair value of financial instruments, Berkshire used quoted market prices when available. Forinstruments where quoted market prices were not available, independent pricing services or appraisals by Berkshire’smanagement were used. Those services and appraisals reflected the estimated present values utilizing current riskadjusted market rates of similar instruments. The carrying values of cash and cash equivalents, accounts receivable andpayable, other accruals, securities sold under agreements to repurchase and other liabilities are deemed to be reasonableestimates of their fair values.
Considerable judgment is necessarily required in interpreting market data used to develop the estimates of fairvalue. Accordingly, the estimates presented herein are not necessarily indicative of the amounts that could be realized ina current market exchange. The use of different market assumptions and/or estimation methodologies may have amaterial effect on the estimated fair value.(16) Common stock
Changes in issued and outstanding Berkshire common stock during the three years ended December 31, 2003 areshown in the table below.
Class A Common, $5 Par Value Class B Common $0.1667 Par Value(1,650,000 shares authorized) (55,000,000 shares authorized)
Shares Issued and Shares Issued andOutstanding Outstanding
Balance December 31, 2000..................................... 1,343,904 5,469,786Conversions of Class A common stock
to Class B common stock and other ...................... (20,494) 674,436Balance December 31, 2001..................................... 1,323,410 6,144,222Common stock issued in connection
with a business acquisition .................................... 4,505 7,063Conversions of Class A common stock
to Class B common stock and other ...................... (16,729) 552,832Balance December 31, 2002..................................... 1,311,186 6,704,117Conversions of Class A common stock
to Class B common stock and other ...................... (28,207) 905,426
Balance December 31, 2003..................................... 1,282,979 7,609,543
Each share of Class B common stock has dividend and distribution rights equal to one-thirtieth (1/30) of suchrights of a Class A share. Accordingly, on an equivalent Class A common stock basis there are 1,536,630 sharesoutstanding as of December 31, 2003 and 1,534,657 shares as of December 31, 2002.
Each share of Class A common stock is convertible, at the option of the holder, into thirty shares of Class Bcommon stock. Class B common stock is not convertible into Class A common stock. Each share of Class B commonstock possesses voting rights equivalent to one-two-hundredth (1/200) of the voting rights of a share of Class A commonstock. Class A and Class B common shares vote together as a single class.
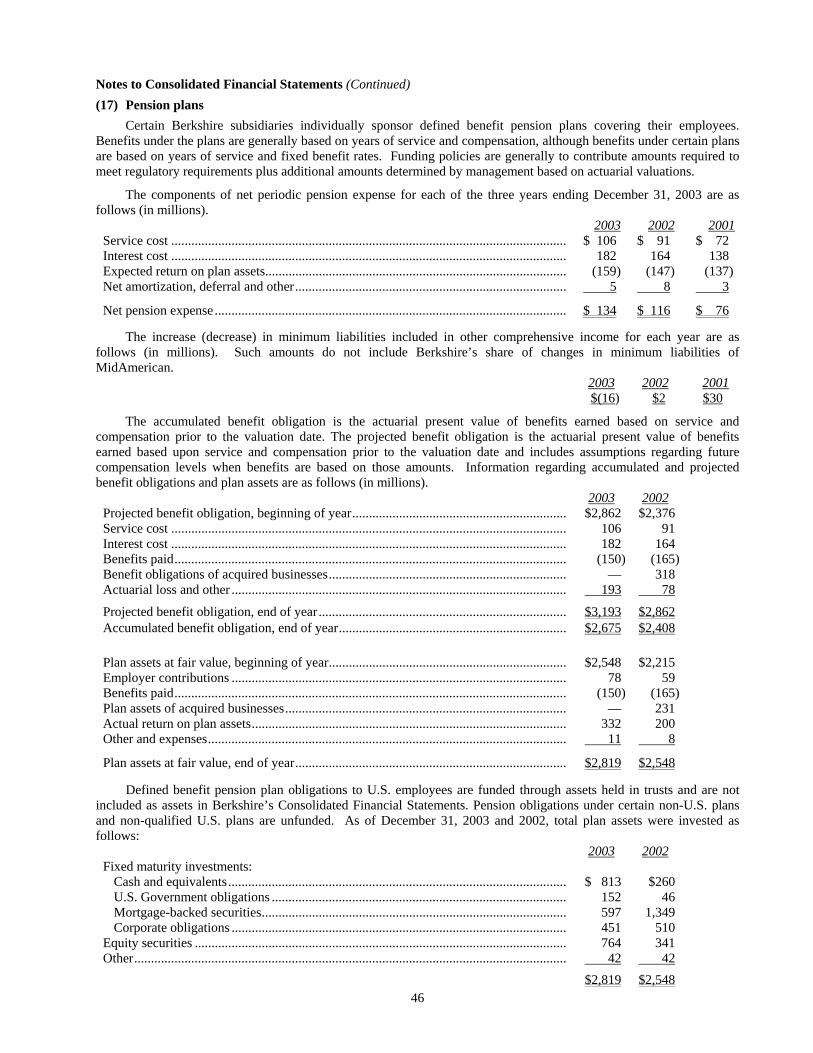
46
Notes to Consolidated Financial Statements (Continued)(17) Pension plans
Certain Berkshire subsidiaries individually sponsor defined benefit pension plans covering their employees.Benefits under the plans are generally based on years of service and compensation, although benefits under certain plansare based on years of service and fixed benefit rates. Funding policies are generally to contribute amounts required tomeet regulatory requirements plus additional amounts determined by management based on actuarial valuations.
The components of net periodic pension expense for each of the three years ending December 31, 2003 are asfollows (in millions).
2003 2002 2001Service cost ...................................................................................................................... $ 106 $ 91 $ 72Interest cost ...................................................................................................................... 182 164 138Expected return on plan assets.......................................................................................... (159) (147) (137)Net amortization, deferral and other................................................................................. 5 8 3
Net pension expense ......................................................................................................... $ 134 $ 116 $ 76
The increase (decrease) in minimum liabilities included in other comprehensive income for each year are asfollows (in millions). Such amounts do not include Berkshire’s share of changes in minimum liabilities ofMidAmerican.
2003 2002 2001$(16) $2 $30
The accumulated benefit obligation is the actuarial present value of benefits earned based on service andcompensation prior to the valuation date. The projected benefit obligation is the actuarial present value of benefitsearned based upon service and compensation prior to the valuation date and includes assumptions regarding futurecompensation levels when benefits are based on those amounts. Information regarding accumulated and projectedbenefit obligations and plan assets are as follows (in millions).
2003 2002Projected benefit obligation, beginning of year................................................................ $2,862 $2,376Service cost ...................................................................................................................... 106 91Interest cost ...................................................................................................................... 182 164Benefits paid..................................................................................................................... (150) (165)Benefit obligations of acquired businesses....................................................................... — 318Actuarial loss and other .................................................................................................... 193 78
Projected benefit obligation, end of year.......................................................................... $3,193 $2,862Accumulated benefit obligation, end of year.................................................................... $2,675 $2,408
Plan assets at fair value, beginning of year....................................................................... $2,548 $2,215Employer contributions .................................................................................................... 78 59Benefits paid..................................................................................................................... (150) (165)Plan assets of acquired businesses.................................................................................... — 231Actual return on plan assets.............................................................................................. 332 200Other and expenses........................................................................................................... 11 8
Plan assets at fair value, end of year................................................................................. $2,819 $2,548
Defined benefit pension plan obligations to U.S. employees are funded through assets held in trusts and are notincluded as assets in Berkshire’s Consolidated Financial Statements. Pension obligations under certain non-U.S. plansand non-qualified U.S. plans are unfunded. As of December 31, 2003 and 2002, total plan assets were invested asfollows:
2003 2002Fixed maturity investments:
Cash and equivalents..................................................................................................... $ 813 $260U.S. Government obligations ........................................................................................ 152 46Mortgage-backed securities........................................................................................... 597 1,349Corporate obligations .................................................................................................... 451 510
Equity securities ............................................................................................................... 764 341Other................................................................................................................................. 42 42
$2,819 $2,548

47
(17) Pension plans (Continued)
Pension plan assets are generally invested with the long-term objective of earning sufficient amounts to coverexpected benefit obligations, while assuming a prudent level of risk. There are no target allocation investmentpercentages with respect to individual or categories of investments. Allocations may change rapidly as a result ofchanging market conditions and investment opportunities. The expected rates of return on plan assets reflect Berkshire’ssubjective assessment of expected invested asset returns over a period of several years, given the current low interestrate environment and current equity security valuations, in general. Actual experience will differ from the assumedrates, in particular over quarterly or annual periods as a result of market volatility and changes in the mix of assets.
The funded status of the plans as of December 31, 2003 and 2002 is as follows (in millions).2003 2002
Excess of projected benefit obligations over plan assets .................................................. $374 $314Unrecognized net actuarial gains and other...................................................................... 134 108
Accrued benefit cost liability............................................................................................ $508 $422
The total net deficit status for plans (including unfunded plans) with accumulated benefit obligations in excess ofplan assets was $378 million and $320 million as of December 31, 2003 and 2002, respectively. Expected contributionsto plans during 2004 are estimated to be $72 million.
The benefit payments, which reflect expected future service as appropriate, are expected to be paid as follows (inmillions).
2004 2005 2006 2007 2008 2009 to 2013$144 $144 $152 $157 $166 $955
Weighted average assumptions used in determining projected benefit obligations were as follows. These rates aresubstantially the same as the weighted average rates used in determining the net periodic pension expense.
2003 2002Discount rate............................................................................................................................ 6.0 6.4Discount rate – non-U.S. plans................................................................................................ 5.3 5.9Long-term expected rate of return on plan assets .................................................................... 6.5 6.5Rate of compensation increase ................................................................................................ 4.6 4.7Rate of compensation increase – non-U.S. plans..................................................................... 2.6 3.8
Most Berkshire subsidiaries also sponsor defined contribution retirement plans, such as a 401(k) or profit sharingplans. The plans generally cover all employees who meet specified eligibility requirements. Employee contributions tothe plans are subject to regulatory limitations and the specific plan provisions. Berkshire subsidiaries generally matchthese contributions up to levels specified in the plans, and may make additional discretionary contributions asdetermined by management. The total expenses related to employer contributions for these plans were $242 million,$202 million and $77 million for the years ended December 31, 2003, 2002 and 2001, respectively.
(18) Litigation
GEICO is a defendant in a number of class action lawsuits related to the use of replacement repair parts notproduced by the original auto manufacturer, the calculation of “total loss” value and whether to pay diminished value aspart of the settlement of certain claims. Management intends to vigorously defend GEICO’s position on these claimsettlement procedures. However, these lawsuits are in various stages of development and the ultimate outcome cannotbe reasonably determined.
Berkshire and its subsidiaries are parties in a variety of legal actions arising out of the normal course of business.In particular, such legal actions affect Berkshire’s insurance and reinsurance businesses. Such litigation generally seeksto establish liability directly through insurance contracts or indirectly through reinsurance contracts issued by Berkshiresubsidiaries. Plaintiffs occasionally seek punitive or exemplary damages. Berkshire does not believe that such normaland routine litigation will have a material effect on its financial condition or results of operations.

48
Notes to Consolidated Financial Statements (Continued)(19) Supplemental cash flow information
A summary of supplemental cash flow information for each of the three years ending December 31, 2003 ispresented in the following table (in millions).
2003 2002 2001Cash paid during the year for:
Income taxes.................................................................................................................. $3,309 $1,945 $ 905Interest of finance and financial products businesses .................................................... 372 509 726Interest of insurance and other businesses..................................................................... 215 207 221
Non-cash investing and financing activities:Liabilities assumed in connection with acquisitions of businesses................................ 2,167 700 3,507Common shares issued in connection with acquisitions of businesses.......................... — 324 —Securities sold (purchased) offset by decrease (increase) in repurchase agreements .... 5,936 6,666 (6,731)
(20) Business segment dataInformation related to Berkshire’s reportable business operating segments is shown below. Berkshire’s reportable
segments are reported in a manner consistent with the way management evaluates the businesses. As such, insuranceunderwriting activities are evaluated separately from investment activities. Realized investment gains are not consideredrelevant in evaluating investment performance on an annual basis. Amortization of purchase accounting adjustments isnot considered by management in evaluating the results of the business segments.
Business Identity Business ActivityGEICO Underwriting private passenger automobile insurance
mainly by direct response methodsGeneral Re Underwriting excess-of-loss, quota-share and facultative
reinsurance worldwideBerkshire Hathaway Reinsurance Group Underwriting excess-of-loss and quota-share reinsurance for
property and casualty insurers and reinsurersBerkshire Hathaway Primary Group Underwriting multiple lines of property and casualty
insurance policies for primarily commercial accountsFruit of the Loom, Garan, Fechheimer Brothers,H.H. Brown Shoe, Lowell Shoe, Justin Brandsand Dexter Shoe (“Apparel”)
Manufacturing and distribution of a variety of footwear andclothing products, including underwear, activewear,children’s clothes and uniforms
Acme Building Brands, Benjamin Moore, JohnsManville and MiTek (“Building products”)
Manufacturing and distribution of a variety of buildingmaterials and related products and services
BH Finance, Clayton Homes, XTRA, CORT,Berkshire Hathaway Life and General ReSecurities (“Finance and financial products”)
Proprietary investing, manufactured housing and relatedconsumer financing, transportation equipment leasing,furniture leasing, life annuities and risk managementproducts
FlightSafety and NetJets (“Flight services”) Training to operators of aircraft and ships and providingfractional ownership programs for general aviation aircraft
McLane Wholesale distributing of groceries and non-food itemsNebraska Furniture Mart, R.C. Willey HomeFurnishings, Star Furniture Company, Jordan’sFurniture, Borsheim’s, Helzberg Diamond Shopsand Ben Bridge Jeweler (“Retail”)
Retail sales of home furnishings, appliances, electronics,fine jewelry and gifts
Shaw Industries Manufacturing and distribution of carpet and floorcoverings under a variety of brand names
Other businesses not specifically identified consist of: Scott Fetzer, a diversified manufacturer and distributor ofcommercial and industrial products; Buffalo News, a newspaper publisher in Western New York; International DairyQueen, which licenses and services a system of about 6,000 Dairy Queen stores; See’s Candies, a manufacturer anddistributor of boxed chocolates and other confectionery products; Larson-Juhl, which designs, manufactures, anddistributes custom picture framing products; CTB International, a manufacturer of equipment and systems for thepoultry, hog, egg production and grain industries and The Pampered Chef, a direct seller of kitchen tools.

49
(20) Business segment data (Continued)A disaggregation of Berkshire’s consolidated data for each of the three most recent years is presented in the tables
which follow on this and the following page. Amounts are in millions.Operating Businesses: RevenuesInsurance group: 2003 2002 2001
Premiums earned:GEICO.................................................................................................... $ 7,784 $ 6,670 $ 6,060General Re .............................................................................................. 8,245 8,500 8,353Berkshire Hathaway Reinsurance Group................................................ 4,430 3,300 2,991Berkshire Hathaway Primary Group....................................................... 1,034 712 501
Investment income..................................................................................... 3,238 3,067 2,844Total insurance group................................................................................... 24,731 22,249 20,749Apparel......................................................................................................... 2,075 1,619 726Building products ......................................................................................... 3,846 3,702 3,269Finance and financial products..................................................................... 3,073 2,234 1,928Flight services .............................................................................................. 2,431 2,837 2,563McLane Company ........................................................................................ 13,743 — —Retail ............................................................................................................ 2,311 2,103 1,998Shaw Industries ............................................................................................ 4,660 4,334 4,012Other businesses........................................................................................... 3,040 2,375 1,957
59,910 41,453 37,202Reconciliation of segments to consolidated amount:
Realized investment gains ......................................................................... 4,129 918 1,488Other revenues........................................................................................... 39 29 35Eliminations............................................................................................... (83) (56) (65)Purchase-accounting adjustments.............................................................. (136) (109) (67)
$63,859 $42,235 $38,593
Operating Businesses: Earnings (loss) before taxesInsurance group: 2003 2002 2001
Underwriting gain (loss):GEICO.................................................................................................... $ 452 $ 416 $ 221General Re .............................................................................................. 145 (1,393) (3,671)Berkshire Hathaway Reinsurance Group................................................ 1,047 547 (634)Berkshire Hathaway Primary Group....................................................... 74 32 30
Net investment income .............................................................................. 3,223 3,050 2,824Total insurance group................................................................................... 4,941 2,652 (1,230)Apparel......................................................................................................... 289 229 (33)Building products ......................................................................................... 559 516 461Finance and financial products..................................................................... 619 726 402Flight services .............................................................................................. 72 225 186McLane Company ........................................................................................ 150 — —Retail ............................................................................................................ 165 166 175Shaw Industries ............................................................................................ 436 424 292Other businesses........................................................................................... 486 381 320
7,717 5,319 573Reconciliation of segments to consolidated amount:
Realized investment gains ......................................................................... 4,121 884 1,445Equity in earnings of MidAmerican Energy Holdings Company.............. 429 359 134Interest expense, excluding interest allocated to business segments ......... (94) (86) (92)Corporate and other ................................................................................... 24 2 8Goodwill amortization and other purchase-accounting adjustments ......... (177) (119) (630)
$12,020 $ 6,359 $ 1,438
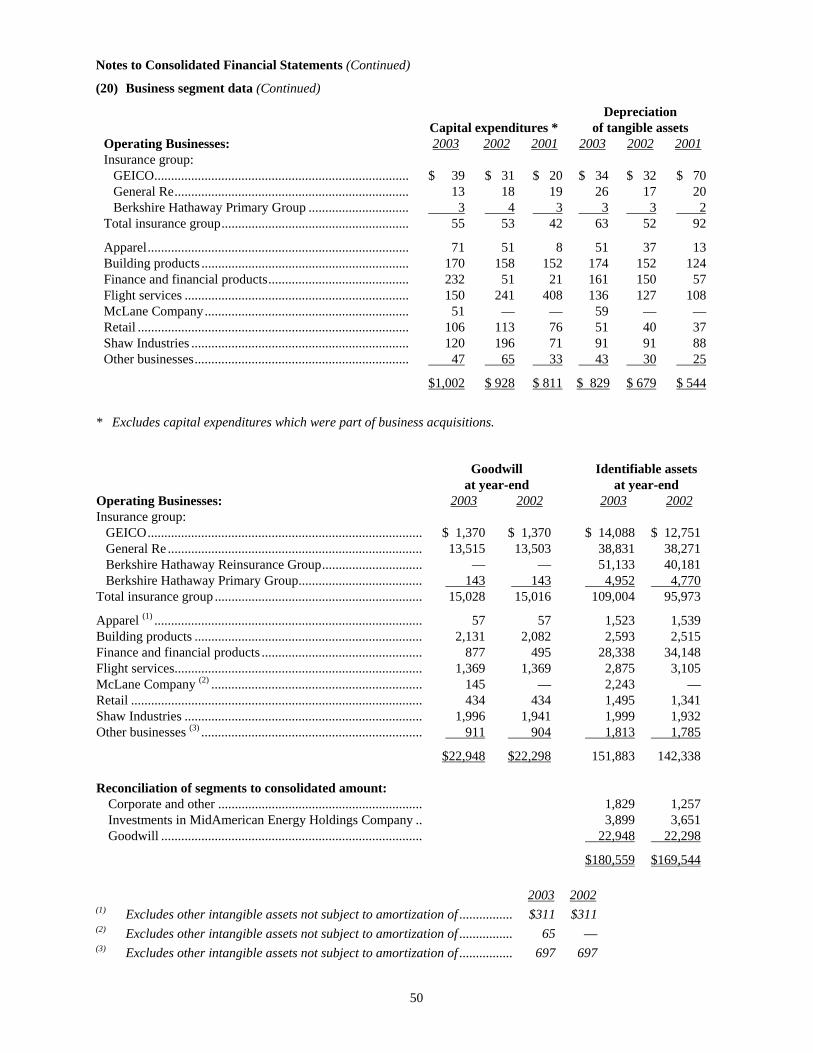
50
Notes to Consolidated Financial Statements (Continued)
(20) Business segment data (Continued)
DepreciationCapital expenditures * of tangible assets
Operating Businesses: 2003 2002 2001 2003 2002 2001Insurance group:
GEICO............................................................................ $ 39 $ 31 $ 20 $ 34 $ 32 $ 70General Re...................................................................... 13 18 19 26 17 20Berkshire Hathaway Primary Group .............................. 3 4 3 3 3 2
Total insurance group........................................................ 55 53 42 63 52 92
Apparel.............................................................................. 71 51 8 51 37 13Building products .............................................................. 170 158 152 174 152 124Finance and financial products.......................................... 232 51 21 161 150 57Flight services ................................................................... 150 241 408 136 127 108McLane Company............................................................. 51 — — 59 — —Retail ................................................................................. 106 113 76 51 40 37Shaw Industries ................................................................. 120 196 71 91 91 88Other businesses................................................................ 47 65 33 43 30 25
$1,002 $ 928 $ 811 $ 829 $ 679 $ 544
* Excludes capital expenditures which were part of business acquisitions.
Goodwill Identifiable assetsat year-end at year-end
Operating Businesses: 2003 2002 2003 2002Insurance group:
GEICO.................................................................................. $ 1,370 $ 1,370 $ 14,088 $ 12,751General Re ............................................................................ 13,515 13,503 38,831 38,271Berkshire Hathaway Reinsurance Group.............................. — — 51,133 40,181Berkshire Hathaway Primary Group..................................... 143 143 4,952 4,770
Total insurance group .............................................................. 15,028 15,016 109,004 95,973
Apparel (1) ................................................................................ 57 57 1,523 1,539Building products .................................................................... 2,131 2,082 2,593 2,515Finance and financial products ................................................ 877 495 28,338 34,148Flight services.......................................................................... 1,369 1,369 2,875 3,105McLane Company (2) ............................................................... 145 — 2,243 —Retail ....................................................................................... 434 434 1,495 1,341Shaw Industries ....................................................................... 1,996 1,941 1,999 1,932Other businesses (3) .................................................................. 911 904 1,813 1,785
$22,948 $22,298 151,883 142,338
Reconciliation of segments to consolidated amount:Corporate and other ............................................................. 1,829 1,257Investments in MidAmerican Energy Holdings Company .. 3,899 3,651Goodwill .............................................................................. 22,948 22,298
$180,559 $169,544
2003 2002(1) Excludes other intangible assets not subject to amortization of ................ $311 $311(2) Excludes other intangible assets not subject to amortization of ................ 65 —(3) Excludes other intangible assets not subject to amortization of ................ 697 697
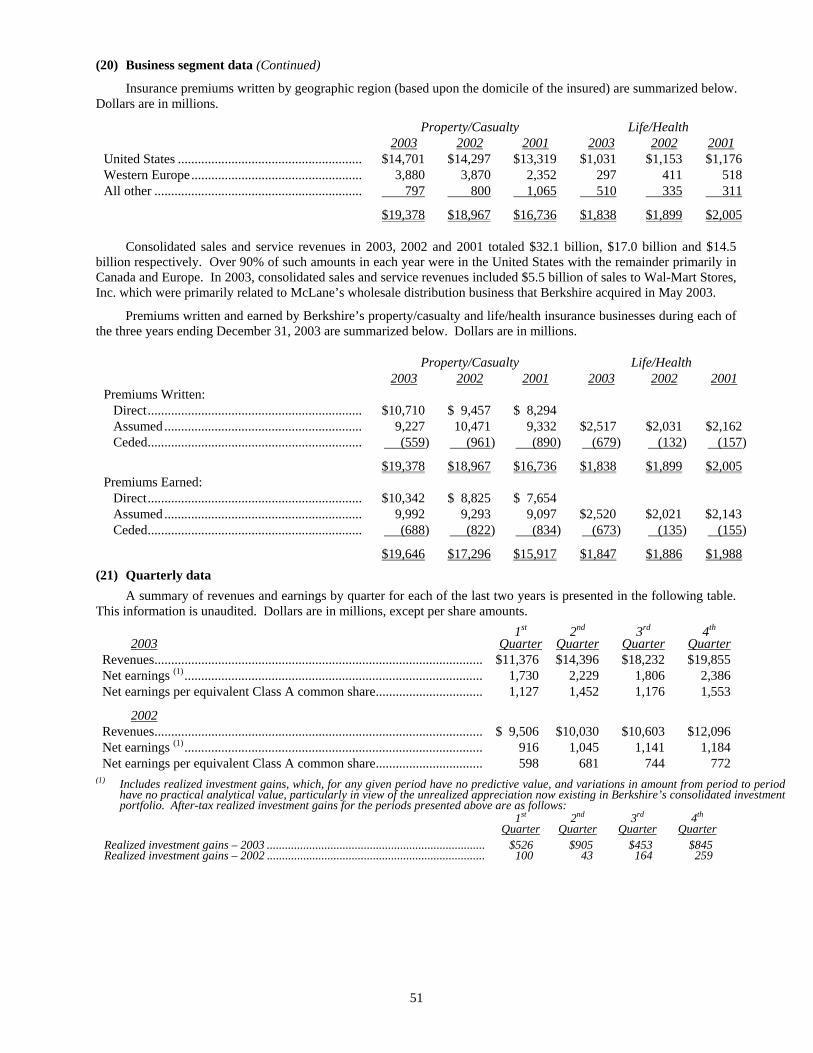
51
(20) Business segment data (Continued)
Insurance premiums written by geographic region (based upon the domicile of the insured) are summarized below.Dollars are in millions.
Property/Casualty Life/Health2003 2002 2001 2003 2002 2001
United States ....................................................... $14,701 $14,297 $13,319 $1,031 $1,153 $1,176Western Europe................................................... 3,880 3,870 2,352 297 411 518All other .............................................................. 797 800 1,065 510 335 311
$19,378 $18,967 $16,736 $1,838 $1,899 $2,005
Consolidated sales and service revenues in 2003, 2002 and 2001 totaled $32.1 billion, $17.0 billion and $14.5billion respectively. Over 90% of such amounts in each year were in the United States with the remainder primarily inCanada and Europe. In 2003, consolidated sales and service revenues included $5.5 billion of sales to Wal-Mart Stores,Inc. which were primarily related to McLane’s wholesale distribution business that Berkshire acquired in May 2003.
Premiums written and earned by Berkshire’s property/casualty and life/health insurance businesses during each ofthe three years ending December 31, 2003 are summarized below. Dollars are in millions.
Property/Casualty Life/Health2003 2002 2001 2003 2002 2001
Premiums Written:Direct................................................................ $10,710 $ 9,457 $ 8,294Assumed ........................................................... 9,227 10,471 9,332 $2,517 $2,031 $2,162Ceded................................................................ (559) (961) (890) (679) (132) (157)
$19,378 $18,967 $16,736 $1,838 $1,899 $2,005Premiums Earned:
Direct................................................................ $10,342 $ 8,825 $ 7,654Assumed ........................................................... 9,992 9,293 9,097 $2,520 $2,021 $2,143Ceded................................................................ (688) (822) (834) (673) (135) (155)
$19,646 $17,296 $15,917 $1,847 $1,886 $1,988(21) Quarterly data
A summary of revenues and earnings by quarter for each of the last two years is presented in the following table.This information is unaudited. Dollars are in millions, except per share amounts.
1st 2nd 3rd 4th
2003 Quarter Quarter Quarter QuarterRevenues.................................................................................................. $11,376 $14,396 $18,232 $19,855Net earnings (1) ......................................................................................... 1,730 2,229 1,806 2,386Net earnings per equivalent Class A common share................................ 1,127 1,452 1,176 1,553
2002Revenues.................................................................................................. $ 9,506 $10,030 $10,603 $12,096Net earnings (1) ......................................................................................... 916 1,045 1,141 1,184Net earnings per equivalent Class A common share................................ 598 681 744 772
(1) Includes realized investment gains, which, for any given period have no predictive value, and variations in amount from period to periodhave no practical analytical value, particularly in view of the unrealized appreciation now existing in Berkshire’s consolidated investmentportfolio. After-tax realized investment gains for the periods presented above are as follows:
1st 2nd 3rd 4th
Quarter Quarter Quarter QuarterRealized investment gains – 2003 ........................................................................ $526 $905 $453 $845Realized investment gains – 2002 ........................................................................ 100 43 164 259
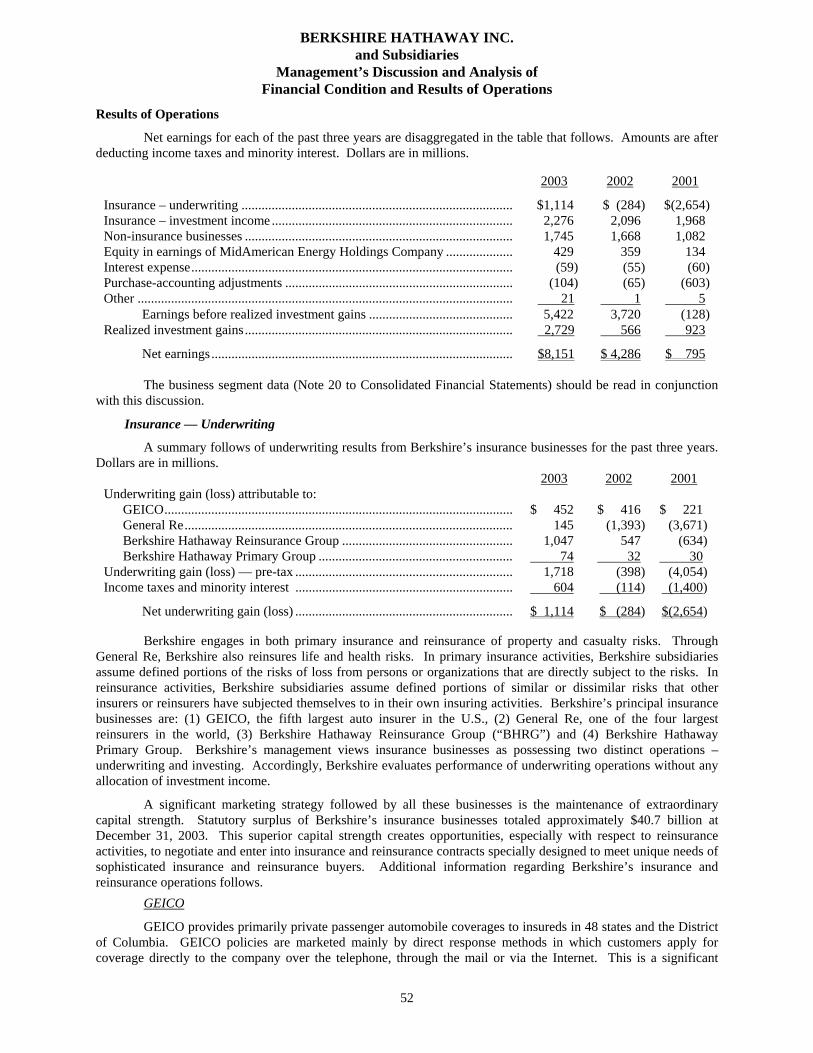
52
BERKSHIRE HATHAWAY INC.and Subsidiaries
Management’s Discussion and Analysis ofFinancial Condition and Results of Operations
Results of Operations
Net earnings for each of the past three years are disaggregated in the table that follows. Amounts are afterdeducting income taxes and minority interest. Dollars are in millions.
2003 2002 2001
Insurance – underwriting ................................................................................. $1,114 $ (284) $(2,654)Insurance – investment income ........................................................................ 2,276 2,096 1,968Non-insurance businesses ................................................................................ 1,745 1,668 1,082Equity in earnings of MidAmerican Energy Holdings Company .................... 429 359 134Interest expense................................................................................................ (59) (55) (60)Purchase-accounting adjustments .................................................................... (104) (65) (603)Other ................................................................................................................ 21 1 5
Earnings before realized investment gains ........................................... 5,422 3,720 (128)Realized investment gains................................................................................ 2,729 566 923
Net earnings.......................................................................................... $8,151 $ 4,286 $ 795
The business segment data (Note 20 to Consolidated Financial Statements) should be read in conjunctionwith this discussion.
Insurance — Underwriting
A summary follows of underwriting results from Berkshire’s insurance businesses for the past three years.Dollars are in millions.
2003 2002 2001Underwriting gain (loss) attributable to:
GEICO........................................................................................................ $ 452 $ 416 $ 221General Re.................................................................................................. 145 (1,393) (3,671)Berkshire Hathaway Reinsurance Group ................................................... 1,047 547 (634)Berkshire Hathaway Primary Group .......................................................... 74 32 30
Underwriting gain (loss) — pre-tax ................................................................. 1,718 (398) (4,054)Income taxes and minority interest ................................................................. 604 (114) (1,400)
Net underwriting gain (loss) ................................................................. $ 1,114 $ (284) $(2,654)
Berkshire engages in both primary insurance and reinsurance of property and casualty risks. ThroughGeneral Re, Berkshire also reinsures life and health risks. In primary insurance activities, Berkshire subsidiariesassume defined portions of the risks of loss from persons or organizations that are directly subject to the risks. Inreinsurance activities, Berkshire subsidiaries assume defined portions of similar or dissimilar risks that otherinsurers or reinsurers have subjected themselves to in their own insuring activities. Berkshire’s principal insurancebusinesses are: (1) GEICO, the fifth largest auto insurer in the U.S., (2) General Re, one of the four largestreinsurers in the world, (3) Berkshire Hathaway Reinsurance Group (“BHRG”) and (4) Berkshire HathawayPrimary Group. Berkshire’s management views insurance businesses as possessing two distinct operations –underwriting and investing. Accordingly, Berkshire evaluates performance of underwriting operations without anyallocation of investment income.
A significant marketing strategy followed by all these businesses is the maintenance of extraordinarycapital strength. Statutory surplus of Berkshire’s insurance businesses totaled approximately $40.7 billion atDecember 31, 2003. This superior capital strength creates opportunities, especially with respect to reinsuranceactivities, to negotiate and enter into insurance and reinsurance contracts specially designed to meet unique needs ofsophisticated insurance and reinsurance buyers. Additional information regarding Berkshire’s insurance andreinsurance operations follows.
GEICO
GEICO provides primarily private passenger automobile coverages to insureds in 48 states and the Districtof Columbia. GEICO policies are marketed mainly by direct response methods in which customers apply forcoverage directly to the company over the telephone, through the mail or via the Internet. This is a significant
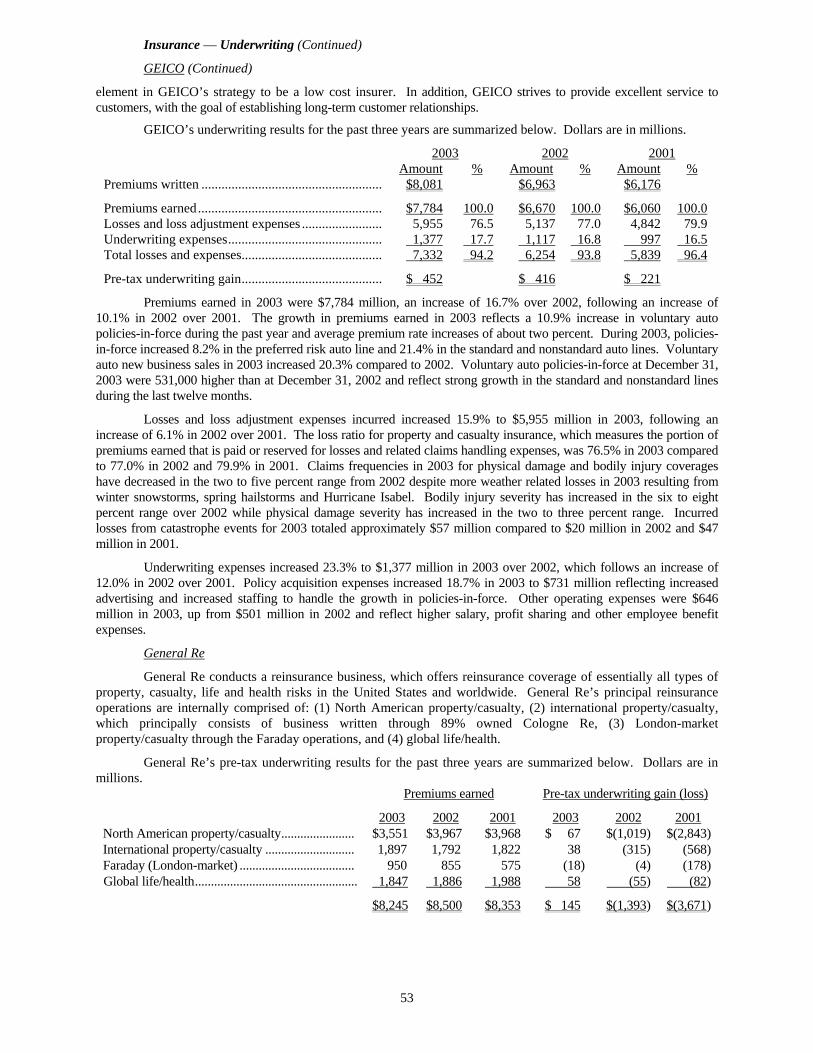
53
Insurance — Underwriting (Continued)
GEICO (Continued)
element in GEICO’s strategy to be a low cost insurer. In addition, GEICO strives to provide excellent service tocustomers, with the goal of establishing long-term customer relationships.
GEICO’s underwriting results for the past three years are summarized below. Dollars are in millions.
2003 2002 2001Amount % Amount % Amount %
Premiums written ...................................................... $8,081 $6,963 $6,176
Premiums earned....................................................... $7,784 100.0 $6,670 100.0 $6,060 100.0Losses and loss adjustment expenses ........................ 5,955 76.5 5,137 77.0 4,842 79.9Underwriting expenses.............................................. 1,377 17.7 1,117 16.8 997 16.5Total losses and expenses.......................................... 7,332 94.2 6,254 93.8 5,839 96.4
Pre-tax underwriting gain.......................................... $ 452 $ 416 $ 221
Premiums earned in 2003 were $7,784 million, an increase of 16.7% over 2002, following an increase of10.1% in 2002 over 2001. The growth in premiums earned in 2003 reflects a 10.9% increase in voluntary autopolicies-in-force during the past year and average premium rate increases of about two percent. During 2003, policies-in-force increased 8.2% in the preferred risk auto line and 21.4% in the standard and nonstandard auto lines. Voluntaryauto new business sales in 2003 increased 20.3% compared to 2002. Voluntary auto policies-in-force at December 31,2003 were 531,000 higher than at December 31, 2002 and reflect strong growth in the standard and nonstandard linesduring the last twelve months.
Losses and loss adjustment expenses incurred increased 15.9% to $5,955 million in 2003, following anincrease of 6.1% in 2002 over 2001. The loss ratio for property and casualty insurance, which measures the portion ofpremiums earned that is paid or reserved for losses and related claims handling expenses, was 76.5% in 2003 comparedto 77.0% in 2002 and 79.9% in 2001. Claims frequencies in 2003 for physical damage and bodily injury coverageshave decreased in the two to five percent range from 2002 despite more weather related losses in 2003 resulting fromwinter snowstorms, spring hailstorms and Hurricane Isabel. Bodily injury severity has increased in the six to eightpercent range over 2002 while physical damage severity has increased in the two to three percent range. Incurredlosses from catastrophe events for 2003 totaled approximately $57 million compared to $20 million in 2002 and $47million in 2001.
Underwriting expenses increased 23.3% to $1,377 million in 2003 over 2002, which follows an increase of12.0% in 2002 over 2001. Policy acquisition expenses increased 18.7% in 2003 to $731 million reflecting increasedadvertising and increased staffing to handle the growth in policies-in-force. Other operating expenses were $646million in 2003, up from $501 million in 2002 and reflect higher salary, profit sharing and other employee benefitexpenses.
General Re
General Re conducts a reinsurance business, which offers reinsurance coverage of essentially all types ofproperty, casualty, life and health risks in the United States and worldwide. General Re’s principal reinsuranceoperations are internally comprised of: (1) North American property/casualty, (2) international property/casualty,which principally consists of business written through 89% owned Cologne Re, (3) London-marketproperty/casualty through the Faraday operations, and (4) global life/health.
General Re’s pre-tax underwriting results for the past three years are summarized below. Dollars are inmillions.
Premiums earned Pre-tax underwriting gain (loss)
2003 2002 2001 2003 2002 2001North American property/casualty....................... $3,551 $3,967 $3,968 $ 67 $(1,019) $(2,843)International property/casualty ............................ 1,897 1,792 1,822 38 (315) (568)Faraday (London-market) .................................... 950 855 575 (18) (4) (178)Global life/health................................................... 1,847 1,886 1,988 58 (55) (82)
$8,245 $8,500 $8,353 $ 145 $(1,393) $(3,671)
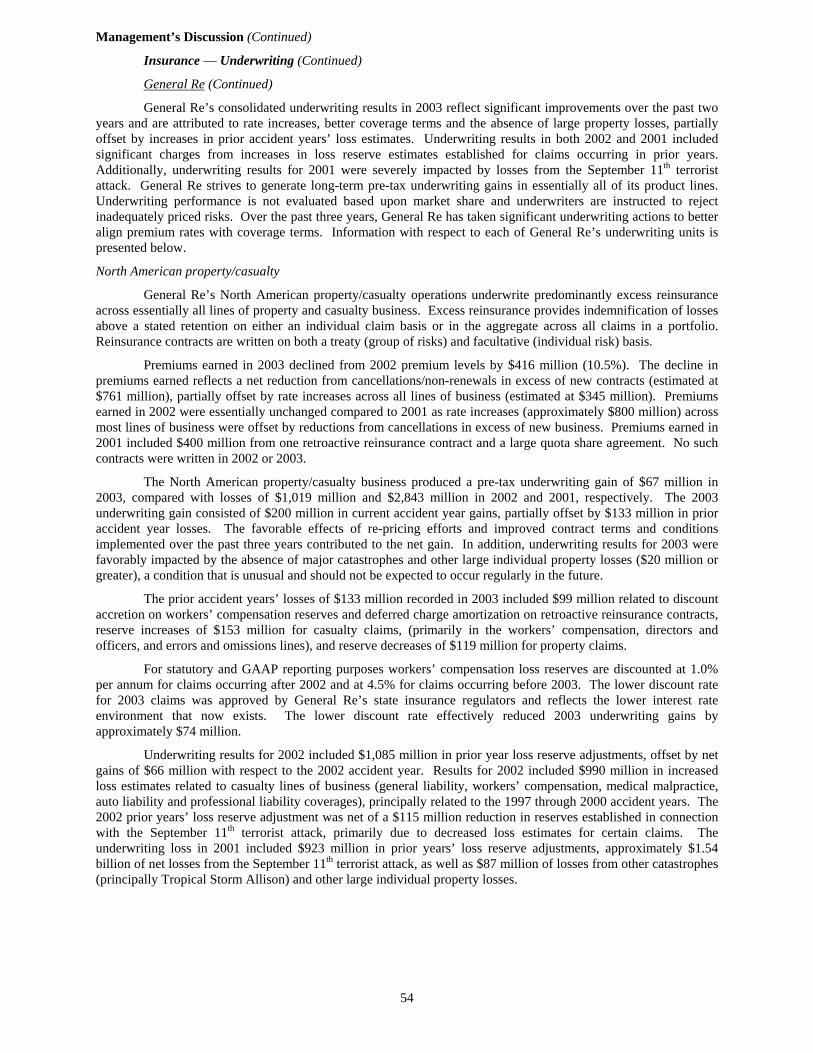
54
Management’s Discussion (Continued)
Insurance — Underwriting (Continued)
General Re (Continued)
General Re’s consolidated underwriting results in 2003 reflect significant improvements over the past twoyears and are attributed to rate increases, better coverage terms and the absence of large property losses, partiallyoffset by increases in prior accident years’ loss estimates. Underwriting results in both 2002 and 2001 includedsignificant charges from increases in loss reserve estimates established for claims occurring in prior years.Additionally, underwriting results for 2001 were severely impacted by losses from the September 11th terroristattack. General Re strives to generate long-term pre-tax underwriting gains in essentially all of its product lines.Underwriting performance is not evaluated based upon market share and underwriters are instructed to rejectinadequately priced risks. Over the past three years, General Re has taken significant underwriting actions to betteralign premium rates with coverage terms. Information with respect to each of General Re’s underwriting units ispresented below.
North American property/casualty
General Re’s North American property/casualty operations underwrite predominantly excess reinsuranceacross essentially all lines of property and casualty business. Excess reinsurance provides indemnification of lossesabove a stated retention on either an individual claim basis or in the aggregate across all claims in a portfolio.Reinsurance contracts are written on both a treaty (group of risks) and facultative (individual risk) basis.
Premiums earned in 2003 declined from 2002 premium levels by $416 million (10.5%). The decline inpremiums earned reflects a net reduction from cancellations/non-renewals in excess of new contracts (estimated at$761 million), partially offset by rate increases across all lines of business (estimated at $345 million). Premiumsearned in 2002 were essentially unchanged compared to 2001 as rate increases (approximately $800 million) acrossmost lines of business were offset by reductions from cancellations in excess of new business. Premiums earned in2001 included $400 million from one retroactive reinsurance contract and a large quota share agreement. No suchcontracts were written in 2002 or 2003.
The North American property/casualty business produced a pre-tax underwriting gain of $67 million in2003, compared with losses of $1,019 million and $2,843 million in 2002 and 2001, respectively. The 2003underwriting gain consisted of $200 million in current accident year gains, partially offset by $133 million in prioraccident year losses. The favorable effects of re-pricing efforts and improved contract terms and conditionsimplemented over the past three years contributed to the net gain. In addition, underwriting results for 2003 werefavorably impacted by the absence of major catastrophes and other large individual property losses ($20 million orgreater), a condition that is unusual and should not be expected to occur regularly in the future.
The prior accident years’ losses of $133 million recorded in 2003 included $99 million related to discountaccretion on workers’ compensation reserves and deferred charge amortization on retroactive reinsurance contracts,reserve increases of $153 million for casualty claims, (primarily in the workers’ compensation, directors andofficers, and errors and omissions lines), and reserve decreases of $119 million for property claims.
For statutory and GAAP reporting purposes workers’ compensation loss reserves are discounted at 1.0%per annum for claims occurring after 2002 and at 4.5% for claims occurring before 2003. The lower discount ratefor 2003 claims was approved by General Re’s state insurance regulators and reflects the lower interest rateenvironment that now exists. The lower discount rate effectively reduced 2003 underwriting gains byapproximately $74 million.
Underwriting results for 2002 included $1,085 million in prior year loss reserve adjustments, offset by netgains of $66 million with respect to the 2002 accident year. Results for 2002 included $990 million in increasedloss estimates related to casualty lines of business (general liability, workers’ compensation, medical malpractice,auto liability and professional liability coverages), principally related to the 1997 through 2000 accident years. The2002 prior years’ loss reserve adjustment was net of a $115 million reduction in reserves established in connectionwith the September 11th terrorist attack, primarily due to decreased loss estimates for certain claims. Theunderwriting loss in 2001 included $923 million in prior years’ loss reserve adjustments, approximately $1.54billion of net losses from the September 11th terrorist attack, as well as $87 million of losses from other catastrophes(principally Tropical Storm Allison) and other large individual property losses.

55
Insurance — Underwriting (Continued)General Re (Continued)
Management believes the revised estimates in 2003 on prior years’ casualty loss reserves were primarilydue to escalating medical inflation and utilization that adversely affect workers’ compensation and other casualtylines; and an increased frequency in corporate bankruptcies, scandals and accounting restatements which increasedlosses under errors and omissions and directors and officers coverages. Otherwise, reported casualty losses for prioryears were generally consistent with management estimates. In addition to the above listed factors, revisedestimates in 2002 and 2001 for prior years’ loss reserves were due to (1) an increase in claim severity, which has aleveraged effect on excess of loss coverages provided by General Re by producing a disproportionate increase inclaims exceeding General Re’s attachment point; (2) broadened coverage terms under General Re’s reinsurancecontracts during 1997 through 2000; (3) increased ceding companies’ reserve inadequacies, likely arising frombroadened terms and conditions, as well as previously unrecognized premium inadequacies; and (4) increasedprimary company insolvencies, which changed historical claim reporting patterns. See the discussion regarding“Critical Accounting Policies” for information about the processes used in estimating loss reserves.
In addition, General Re continuously estimates its liabilities and related reinsurance recoverables forenvironmental and asbestos claims and claim expenses. Most liabilities for such claims arise from exposures inNorth America. Environmental and asbestos exposures do not lend themselves to traditional methods of lossdevelopment determination and therefore reserves related to these exposures may be considered less reliable thanreserves for standard lines of business (e.g., automobile). The estimate for environmental and asbestos losses iscomposed of four parts: known claims, development on known claims, incurred but not reported (“IBNR”) lossesand direct excess coverage litigation expenses. At December 31, 2003, environmental and asbestos loss reserves forNorth America were $1,050 million ($890 million net of reinsurance). As of December 31, 2002 such amountstotaled $1,161 million ($1,008 million net of reinsurance). The changing legal environment concerning asbestos andenvironmental claims has made quantification of potential exposures very difficult. Future changes to the legalenvironment may precipitate significant changes in reserves.
Due to the long-tail nature of casualty business, a very high degree of estimation is involved in establishingloss reserves for current accident year casualty occurrences. Thus, the ultimate level of underwriting gain or losswith respect to the 2003 accident year will not be fully known for many years. North American property/casualtyloss reserves were $15.5 billion ($14.3 billion net of reinsurance) at December 31, 2003 and $16.2 billion ($14.9billion net of reinsurance) at December 31, 2002. About 52% of this amount at December 31, 2003 representsestimates of IBNR losses.
Although loss reserve levels are now believed to be adequate, there can be no guarantees. A relativelysmall change in the estimate of net reserves can produce large changes in annual underwriting results. For instance,a one percentage point change in net loss reserves at year end 2003 would produce a pre-tax underwriting gain orloss of $143 million, or roughly 4% of premiums earned in 2003. In addition, the timing and magnitude ofcatastrophe and large individual property losses are expected to continue to contribute to volatile periodicunderwriting results in the future.
International property/casualty
The international property/casualty operations write quota-share and excess reinsurance on risks around theworld, with its largest markets in Continental Europe and the United Kingdom. International property/casualtybusiness is written on a direct reinsurance basis primarily through Cologne Re.
Premiums earned in 2003 increased $105 million (5.9%) from 2002 amounts, reflecting the increase invalues of most foreign currencies relative to the U.S. dollar. In local currencies, premiums earned declined 8.1% in2003 versus 2002. The decrease in premiums earned was primarily due to the non-renewal of unprofitable businessin Continental Europe, the United Kingdom, Latin America and Australia. In local currencies, premiums earned in2002 declined 2.1% from 2001, primarily due to a substantial decline in premiums in Argentina, the non-renewal ofunder-performing business in Continental Europe and parts of Asia, partially offset by increases in the UnitedKingdom and Australia.
The international property/casualty operations produced a pre-tax underwriting gain of $38 million during2003, compared with pre-tax underwriting losses of $315 million and $568 million for 2002 and 2001, respectively.The net underwriting gain for 2003 included $69 million of gains in the current underwriting year, which reflectedrate increases and the absence of large property losses, and losses of $31 million from increases to reserves for prioryears’ loss occurrences. Results for 2002 included $240 million of net increases to prior years’ loss reserves, andapproximately $107 million in catastrophe and other large individual property losses, principally European flood

56
Management’s Discussion (Continued)
Insurance — Underwriting (Continued)
General Re (Continued)
losses in August and European storm Jeanette in October. The underwriting loss of $568 million in 2001 included$247 million of net losses related to the September 11th terrorist attack and $143 million resulting from other largeindividual property losses.
At December 31, 2003, the international property/casualty operations had gross loss reserves of $6.4billion, ($6.0 billion net of reinsurance) compared to $5.4 billion in gross loss reserves at December 31, 2002 ($5.1billion net of reinsurance). The increase in reserves during 2003 was primarily due to changes in foreign currencyrates. The overall economic effect of foreign currency changes were mitigated because foreign denominatedliabilities are largely offset by assets denominated in those currencies.
Faraday (London-market)
London-market business is written through Faraday Holdings Limited (“Faraday”). Faraday owns themanaging agent of Syndicate 435 at Lloyd’s of London and provides capacity and participates in the results ofSyndicate 435. Through Faraday, General Re’s participation in Syndicate 435 was 100% in 2003. Also included inthe London-market segment are Cologne Re’s UK and Continental Europe broker-market subsidiaries.
Premiums earned in the London-market operations increased $95 million (11.1%) in 2003 as compared to2002. Premiums earned in 2002 increased $280 million (48.7%) over 2001 amounts. In local currencies, premiumsearned in 2003 were unchanged from 2002 and increased 41.9% in 2002 over 2001. In 2003, premiums earnedfrom Cologne Re’s Continental Europe broker-market subsidiary, which was placed in run-off, declined but wereoffset by increases in earned premiums in Faraday Syndicate 435. Premiums earned in 2002 increased primarilydue to the increased participation in Faraday Syndicate 435 from 60.6% in 2001 to 96.7% in 2002.
London-market operations produced a pre-tax underwriting loss of $18 million in 2003, compared withpre-tax underwriting losses of $4 million and $178 million in 2002 and 2001, respectively. The underwriting loss in2003 included $73 million of reserve increases related to prior years’ loss events. These losses occurred primarilyin casualty lines. In 2003, underwriting gains were earned in property and aviation lines, reflecting more selectiveunderwriting and a lack of catastrophes and other large losses. Underwriting results in 2002 were adverselyimpacted by $80 million of increases in prior years’ casualty loss reserve estimates and $17 million of Europeanflood losses. Offsetting these amounts were gains in property business. The London-market underwriting loss in2001 included $66 million of losses from the September 11th terrorist attack as well as relatively high propertylosses.
At December 31, 2003, the Faraday operations had gross loss reserves of $1.9 billion, ($1.7 billion net ofreinsurance) compared to $1.7 billion in gross reserves at December 31, 2002 ($1.3 billion net of reinsurance). Theincrease in reserves during 2003 was primarily due to changes in foreign currency rates.
Global life/health
General Re’s global life/health affiliates reinsure such risks worldwide. Premiums earned in 2003decreased by $39 million (2.1%) compared with 2002. Premiums earned in 2002 for the global life/healthoperations declined $102 million (5.1%) from 2001. Adjusting for the effects of foreign currency exchange,premiums earned declined 9.6% in 2003, and 6.7% in 2002. The decline in 2003 was primarily due to decreases inthe group and individual health businesses in the U.S. life/health operations.
Underwriting results for the global life/health operations produced a pre-tax underwriting gain of $58million in 2003, compared with underwriting losses of $55 million and $82 million in 2002 and 2001, respectively.While both the U.S. and international life/health segments were profitable in 2003, most of the gains were earned inthe international life segment. The underwriting losses for 2002 and 2001 were principally due to increasedreserves on run-off business in the U.S. life/health operations. Underwriting results for 2001 also include $19million of net losses related to the September 11th terrorist attack.

57
Insurance — Underwriting (Continued)
Berkshire Hathaway Reinsurance Group
The Berkshire Hathaway Reinsurance Group (“BHRG”) underwrites excess-of-loss and quota-sharereinsurance coverages for insurers and reinsurers around the world. BHRG is believed to be one of the leaders inproviding catastrophe excess-of-loss reinsurance and writing coverages for large or otherwise unusual discretecommercial property risks on a direct and facultative reinsurance basis, referred to as individual risk business.BHRG’s underwriting results are summarized in the table below.
Premiums earned Pre-tax underwriting gain (loss)2003 2002 2001 2003 2002 2001
Catastrophe and individual risk............................. $1,330 $1,283 $ 553 $1,108 $1,006 $ (150)Retroactive reinsurance......................................... 526 407 1,993 (387) (433) (358)Traditional multi-line ............................................ 2,574 1,610 445 326 (26) (126)
Total ...................................................................... $4,430 $3,300 $2,991 $1,047 $ 547 $ (634)
During the second half of 2001, opportunities for BHRG to write catastrophe and individual risk businessincreased significantly, particularly subsequent to September 11th. Contracts written may provide exceptionallylarge limits of indemnification, often several hundred million dollars and occasionally in excess of $1 billion, andmay cover catastrophe risks (such as hurricanes, earthquakes or other natural disasters) or other property risks (suchas aviation and aerospace, commercial multi-peril or terrorism). Catastrophe and individual business written totaledabout $1.2 billion in 2003 and $1.5 billion in 2002. The level of business written in future periods will vary,perhaps materially, based upon market conditions and management’s assessment of the adequacy of premium rates.
The catastrophe and individual risk business produced substantial underwriting gains in 2003 and 2002 dueto the lack of catastrophic or otherwise large loss events. The net underwriting loss in 2001 included about $410million from the September 11th terrorist attack. Losses related to the September 11th terrorist attack were reducedby about $85 million in 2002, as payments to settle claims under certain policies were below original estimates.Although very large underwriting gains were achieved in 2003 and 2002, a single loss event could have easilyeliminated those gains. The pre-tax maximum probable loss from a single event at December 31, 2003 is estimatedto be approximately $6.7 billion resulting from potential risk of loss from a major earthquake in California.
BHRG, as a matter of general practice, does not cede catastrophe and individual risks to other reinsurersdue to the uncertainty of collecting recoverable losses ceded to financially weaker companies if a natural orfinancial mega-catastrophe should occur. Underwriting results of this business will remain subject to extremevolatility. Nevertheless, Berkshire’s management remains willing to accept such volatility provided there is areasonable prospect of long-term underwriting profitability.
Retroactive reinsurance contracts indemnify ceding companies for losses arising under insurance orreinsurance contracts written in the past, usually many years ago. While contract terms vary, losses under thecontracts are subject to a very large aggregate dollar limit, occasionally exceeding $1 billion under a single contract.Generally, it is also anticipated, although not assured, that claims under retroactive contracts will be paid over longtime periods. These contracts do not produce an immediate underwriting loss for financial reporting purposes. Theexcess of the estimated ultimate claims payable over the premiums received is established as a deferred chargewhich is subsequently amortized over the expected claim settlement periods. Such amortization is included as acomponent of losses incurred and essentially represents the net underwriting losses from this business in each of thepast three years. In addition, underwriting results in 2003 included a net gain of $41 million from the commutationof contracts written in prior years in exchange for commutation payments of $710 million.
Retroactive reinsurance contracts are expected to generate significant underwriting losses over time due tothe amortization of deferred charges. This business is accepted due to the exceptionally large amounts of floatgenerated, which totaled about $7.7 billion at December 31, 2003. Unamortized deferred charges under BHRGretroactive reinsurance contracts were $2.8 billion at December 31, 2003 and $3.2 billion as of December 31, 2002.
During the last two years, BHRG wrote a significant amount of business under traditional multi-linecontracts. Such contracts included several quota-share participations in, and contracts with, Lloyd’s syndicates and aquota-share contract written in 2002 with a major U.S. based insurer, which was cancelled in 2003. These contractsand participations generated written premiums of about $1.6 billion in 2003 and $2.0 billion in 2002. In a quota-
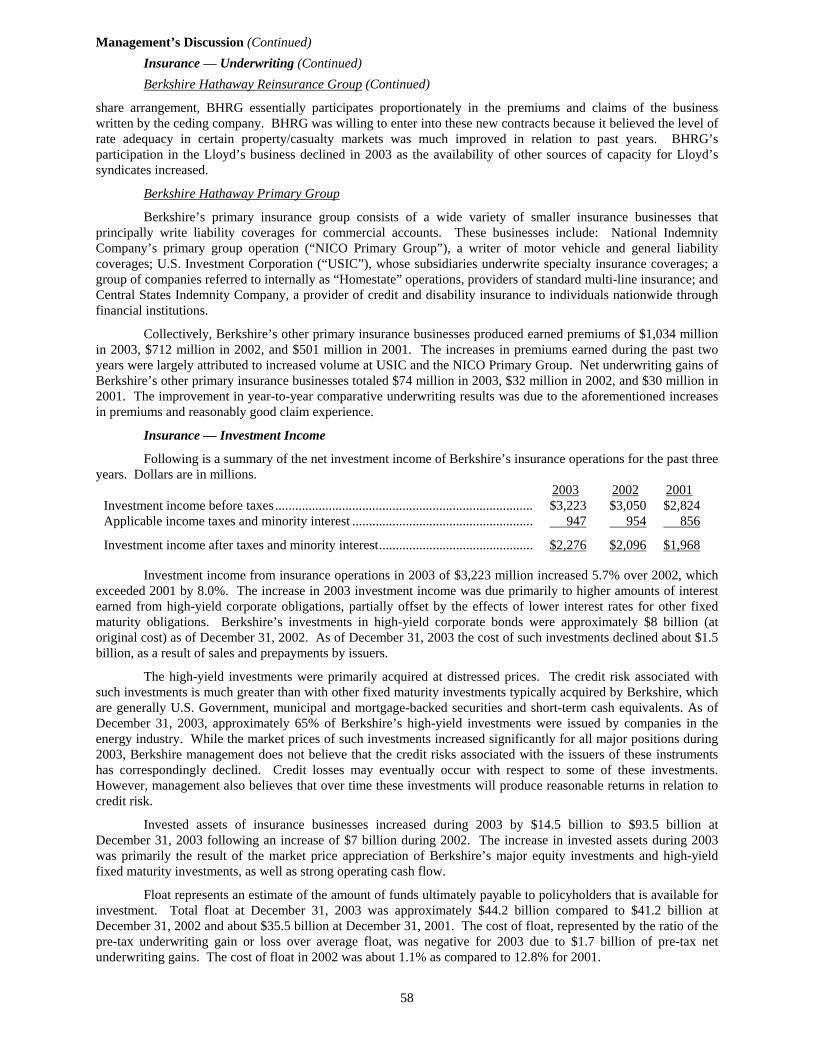
58
Management’s Discussion (Continued)Insurance — Underwriting (Continued)Berkshire Hathaway Reinsurance Group (Continued)
share arrangement, BHRG essentially participates proportionately in the premiums and claims of the businesswritten by the ceding company. BHRG was willing to enter into these new contracts because it believed the level ofrate adequacy in certain property/casualty markets was much improved in relation to past years. BHRG’sparticipation in the Lloyd’s business declined in 2003 as the availability of other sources of capacity for Lloyd’ssyndicates increased.
Berkshire Hathaway Primary Group
Berkshire’s primary insurance group consists of a wide variety of smaller insurance businesses thatprincipally write liability coverages for commercial accounts. These businesses include: National IndemnityCompany’s primary group operation (“NICO Primary Group”), a writer of motor vehicle and general liabilitycoverages; U.S. Investment Corporation (“USIC”), whose subsidiaries underwrite specialty insurance coverages; agroup of companies referred to internally as “Homestate” operations, providers of standard multi-line insurance; andCentral States Indemnity Company, a provider of credit and disability insurance to individuals nationwide throughfinancial institutions.
Collectively, Berkshire’s other primary insurance businesses produced earned premiums of $1,034 millionin 2003, $712 million in 2002, and $501 million in 2001. The increases in premiums earned during the past twoyears were largely attributed to increased volume at USIC and the NICO Primary Group. Net underwriting gains ofBerkshire’s other primary insurance businesses totaled $74 million in 2003, $32 million in 2002, and $30 million in2001. The improvement in year-to-year comparative underwriting results was due to the aforementioned increasesin premiums and reasonably good claim experience.
Insurance — Investment Income
Following is a summary of the net investment income of Berkshire’s insurance operations for the past threeyears. Dollars are in millions.
2003 2002 2001Investment income before taxes............................................................................. $3,223 $3,050 $2,824Applicable income taxes and minority interest ...................................................... 947 954 856
Investment income after taxes and minority interest.............................................. $2,276 $2,096 $1,968
Investment income from insurance operations in 2003 of $3,223 million increased 5.7% over 2002, whichexceeded 2001 by 8.0%. The increase in 2003 investment income was due primarily to higher amounts of interestearned from high-yield corporate obligations, partially offset by the effects of lower interest rates for other fixedmaturity obligations. Berkshire’s investments in high-yield corporate bonds were approximately $8 billion (atoriginal cost) as of December 31, 2002. As of December 31, 2003 the cost of such investments declined about $1.5billion, as a result of sales and prepayments by issuers.
The high-yield investments were primarily acquired at distressed prices. The credit risk associated withsuch investments is much greater than with other fixed maturity investments typically acquired by Berkshire, whichare generally U.S. Government, municipal and mortgage-backed securities and short-term cash equivalents. As ofDecember 31, 2003, approximately 65% of Berkshire’s high-yield investments were issued by companies in theenergy industry. While the market prices of such investments increased significantly for all major positions during2003, Berkshire management does not believe that the credit risks associated with the issuers of these instrumentshas correspondingly declined. Credit losses may eventually occur with respect to some of these investments.However, management also believes that over time these investments will produce reasonable returns in relation tocredit risk.
Invested assets of insurance businesses increased during 2003 by $14.5 billion to $93.5 billion atDecember 31, 2003 following an increase of $7 billion during 2002. The increase in invested assets during 2003was primarily the result of the market price appreciation of Berkshire’s major equity investments and high-yieldfixed maturity investments, as well as strong operating cash flow.
Float represents an estimate of the amount of funds ultimately payable to policyholders that is available forinvestment. Total float at December 31, 2003 was approximately $44.2 billion compared to $41.2 billion atDecember 31, 2002 and about $35.5 billion at December 31, 2001. The cost of float, represented by the ratio of thepre-tax underwriting gain or loss over average float, was negative for 2003 due to $1.7 billion of pre-tax netunderwriting gains. The cost of float in 2002 was about 1.1% as compared to 12.8% for 2001.
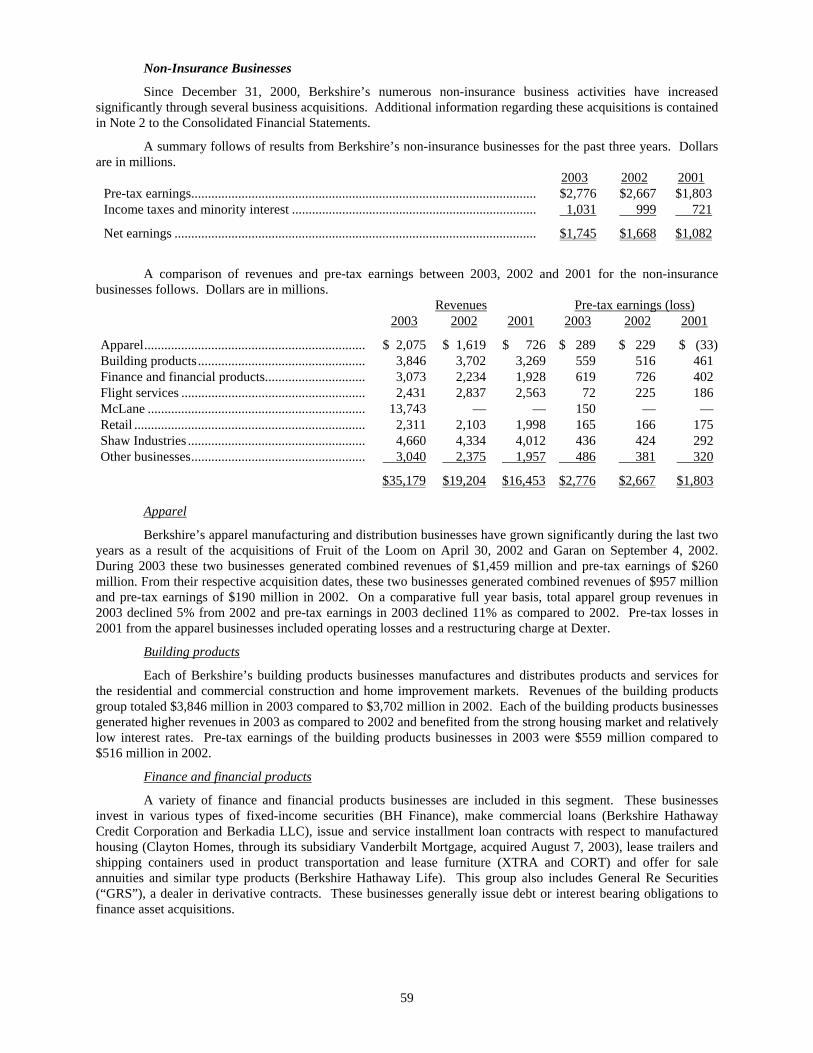
59
Non-Insurance Businesses
Since December 31, 2000, Berkshire’s numerous non-insurance business activities have increasedsignificantly through several business acquisitions. Additional information regarding these acquisitions is containedin Note 2 to the Consolidated Financial Statements.
A summary follows of results from Berkshire’s non-insurance businesses for the past three years. Dollarsare in millions.
2003 2002 2001Pre-tax earnings....................................................................................................... $2,776 $2,667 $1,803Income taxes and minority interest ......................................................................... 1,031 999 721
Net earnings ............................................................................................................ $1,745 $1,668 $1,082
A comparison of revenues and pre-tax earnings between 2003, 2002 and 2001 for the non-insurancebusinesses follows. Dollars are in millions.
Revenues Pre-tax earnings (loss)2003 2002 2001 2003 2002 2001
Apparel.................................................................. $ 2,075 $ 1,619 $ 726 $ 289 $ 229 $ (33)Building products.................................................. 3,846 3,702 3,269 559 516 461Finance and financial products.............................. 3,073 2,234 1,928 619 726 402Flight services ....................................................... 2,431 2,837 2,563 72 225 186McLane ................................................................. 13,743 — — 150 — —Retail ..................................................................... 2,311 2,103 1,998 165 166 175Shaw Industries ..................................................... 4,660 4,334 4,012 436 424 292Other businesses.................................................... 3,040 2,375 1,957 486 381 320
$35,179 $19,204 $16,453 $2,776 $2,667 $1,803
Apparel
Berkshire’s apparel manufacturing and distribution businesses have grown significantly during the last twoyears as a result of the acquisitions of Fruit of the Loom on April 30, 2002 and Garan on September 4, 2002.During 2003 these two businesses generated combined revenues of $1,459 million and pre-tax earnings of $260million. From their respective acquisition dates, these two businesses generated combined revenues of $957 millionand pre-tax earnings of $190 million in 2002. On a comparative full year basis, total apparel group revenues in2003 declined 5% from 2002 and pre-tax earnings in 2003 declined 11% as compared to 2002. Pre-tax losses in2001 from the apparel businesses included operating losses and a restructuring charge at Dexter.
Building products
Each of Berkshire’s building products businesses manufactures and distributes products and services forthe residential and commercial construction and home improvement markets. Revenues of the building productsgroup totaled $3,846 million in 2003 compared to $3,702 million in 2002. Each of the building products businessesgenerated higher revenues in 2003 as compared to 2002 and benefited from the strong housing market and relativelylow interest rates. Pre-tax earnings of the building products businesses in 2003 were $559 million compared to$516 million in 2002.
Finance and financial products
A variety of finance and financial products businesses are included in this segment. These businessesinvest in various types of fixed-income securities (BH Finance), make commercial loans (Berkshire HathawayCredit Corporation and Berkadia LLC), issue and service installment loan contracts with respect to manufacturedhousing (Clayton Homes, through its subsidiary Vanderbilt Mortgage, acquired August 7, 2003), lease trailers andshipping containers used in product transportation and lease furniture (XTRA and CORT) and offer for saleannuities and similar type products (Berkshire Hathaway Life). This group also includes General Re Securities(“GRS”), a dealer in derivative contracts. These businesses generally issue debt or interest bearing obligations tofinance asset acquisitions.

60
Management’s Discussion (Continued)
Non-Insurance Businesses (Continued)
Finance and financial products (Continued)
Revenues of the finance group consist of interest, rentals, and sales of manufactured homes, transportationequipment and furniture. Revenues in 2003 totaled $3,073 million, an increase of 37.6% over 2002. The increasein 2003 was primarily due to the inclusion of Clayton (approximately $500 million), revenues from the issuance ofannuity products of approximately $700 million versus none in 2002 and was partially offset by lower interestincome.
Pre-tax earnings of the finance group in 2003, which exclude realized investment gains, declined $107million (14.7%) from 2002. Much of the comparative decline in pre-tax earnings was due to lower net interestearned by BH Finance. BH Finance’s fixed maturity investment portfolio declined about $6 billion during 2003 asa result of sales and prepayments and was offset by corresponding declines in repurchase agreement obligations.
During 2003, pre-tax earnings included about $101 million from Berkadia as compared to $115 million in2002. Earnings of Berkadia are directly correlated with the outstanding amount of a term loan to FINOVA, whichtotaled $525 million at December 31, 2003 compared to $2.175 billion at December 31, 2002 and $4.9 billion atDecember 31, 2001. Most of Berkadia’s pre-tax earnings in 2003 were represented by the accelerated recognitionin earnings of fees received in 2001 from FINOVA in connection with origination of the loan as a result of loanrepayments being at a much faster rate than originally anticipated. In February 2004, the FINOVA loan was repaidin full. Thus, earnings from Berkadia in 2004 will be nominal.
GRS had a pre-tax loss in 2003 of $99 million versus a loss of $173 million in 2002. GRS’s operation hasbeen in run-off since January 2002. During the run-off period, GRS has limited new business to certain riskmanagement transactions and is unwinding existing asset and liability positions in an orderly manner. Since therun-off commenced, approximately two-thirds of GRS’s open trades have been terminated. It is expected that therun-off will take at least several more years to complete. The pre-tax losses in the last two years reflect related run-off costs as well as net transaction and position losses. Additional losses will almost certainly be incurred over timein connection with the run-off. The timing and amounts of such losses is uncertain.
Flight services
This segment includes FlightSafety, a leading provider of high technology training to operators of aircraftand ships and NetJets, the world’s leading provider of fractional ownership programs for general aviation aircraft.FlightSafety’s worldwide clients include corporations, regional airlines, the military and government agencies. Thedecline in revenues was split between FlightSafety (about $96 million) and NetJets (about $310 million). A declinein FlightSafety training revenues accounted for most of that businesses revenue decline. The decline in trainingrevenues was due to a decline in regional airline training somewhat offset by increased U.S. Government trainingrevenues. The decline in revenues at NetJets was due to a reduction of revenues from sales of aircraft of $514million partially offset by increased flight services and other revenues of about $204 million. Pre-tax earnings fromthese businesses was $72 million in 2003 as compared to $225 million in 2002. The results for 2002 include a gainof $60 million from the sale of a partnership interest to Boeing and the results for 2003 include the recognition ofpre-tax charges of $69 million related to write downs of certain simulators and aircraft inventory. Excluding theaforementioned gain and write downs, “normal earnings” from these businesses were $141 million in 2003 versus$165 million in 2002. The reduction in combined “normal” pre-tax earnings from these businesses is due toreduced “normal” pre-tax earnings at FlightSafety of $34 million somewhat offset by improved results at NetJetswhere its pre-tax loss before write downs was $9 million in 2003 versus about $19 million in 2002. The corporateaviation business has slowed significantly in the past few years which has hurt FlightSafety’s results. NetJetscontinues to be the leader in the fractional ownership field.
McLane
On May 23, 2003, Berkshire acquired McLane Company, Inc. from Wal-Mart Stores, Inc. Results ofMcLane’s business operations are included in Berkshire’s consolidated results beginning on that date. McLane’srevenues were $13,743 million and pre-tax earnings totaled $150 million for the period from May 23 to December31. Approximately 35% of McLane’s revenues derived from sales to Wal-Mart Stores, Inc. McLane’s business ismarked by high sales volume and low profit margins. For its most recently completed fiscal year prior to theacquisition, McLane’s sales and pre-tax earnings totaled approximately $21.9 billion and $220 million, respectively.See Note 2 to the Consolidated Financial Statements for information regarding the acquisition and McLane’sbusiness.
61
Non-Insurance Businesses (Continued)
Retail
Berkshire’s retailing businesses consist of four independently managed retailers of home furnishings(Nebraska Furniture Mart and its subsidiaries (“NFM”), R.C. Willey Home Furnishings (“R.C. Willey”), StarFurniture (“Star”) and Jordan’s Furniture) and three independently managed retailers of fine jewelry (Borsheim’sJewelry, Helzberg’s Diamond Shops (“Helzberg”), and Ben Bridge Jeweler). Revenues of the retail businesses in2003 increased $208 million (9.9%) as compared to 2002, and 2002 revenues increased 5.3% over 2001. Theincrease in revenues in 2003 was primarily attributed to Nebraska Furniture Mart’s new store in Kansas City,Kansas, which opened in August 2003 and R.C. Willey’s second Nevada location, which opened in May 2003.Comparative pre-tax earnings of the retail group in 2003 were relatively unchanged from 2002. Higher earningsassociated with the new R.C. Willey store were offset by start-up and depreciation costs incurred in connection withNFM’s new store.
Shaw Industries
Shaw is a leading manufacturer and distributor of carpet and rugs for residential and commercial use.Shaw also provides installation services and offers hardwood floor and other floor coverings. Berkshire acquired87.3% of the common stock of Shaw in January 2001 and the remainder of the outstanding stock in January 2002.Shaw’s revenues in 2003 of $4,660 million increased by $326 million (7.5%) over 2002, and 2002 revenuesincreased 8.0% over 2001. The increase in 2003 revenues reflects a 6.1% increase in carpet sales revenues as wellas increased sales of hard floor surfaces. Shaw’s revenues in 2003 also include the results from Dixie Group, acarpet and rug manufacturer acquired in November. In 2003, Shaw’s pre-tax earnings totaled $436 million, anincrease of $12 million (2.8%) over 2002. Shaw’s operating results in 2003 benefited from increased sales andlower borrowing costs.
Other businesses
Revenues in 2003 from Berkshire’s other businesses as compared to 2002 increased $665 million to $3,040million and pre-tax earnings increased $105 million to $486 million. Berkshire’s other non-insurance businessesconsist of the results of numerous smaller businesses. The increase in revenues and pre-tax earnings of otherbusinesses in 2003 was primarily due to the inclusion of the results of businesses acquired in 2002 from theirrespective acquisition dates (Larson-Juhl—February 8, 2002, The Pampered Chef and CTB International—bothOctober 31, 2002).
Equity in earnings of MidAmerican Energy Holdings Company
Earnings from MidAmerican represent Berkshire’s share of MidAmerican’s net earnings, as determinedunder the equity method. Earnings from MidAmerican totaled $429 million in 2003, $359 million in 2002 and $134million in 2001. MidAmerican’s earnings increased in 2003 due to improved results in its utility businesses, theeffects of the acquisition during 2002 and the subsequent expansion during 2003 of two natural gas pipelines andincreased earnings from its real estate brokerage business due to acquisitions and increased transaction volume. SeeNote 3 to the Consolidated Financial Statements for additional information regarding Berkshire’s investments inMidAmerican.
Purchase-Accounting Adjustments
Purchase-accounting adjustments reflect the after-tax effect on net earnings with respect to the amortizationof fair value adjustments to certain assets and liabilities recorded at various business acquisition dates. Prior to2002, this amount also included goodwill amortization. Effective January 1, 2002, Berkshire ceased amortizinggoodwill of previously acquired businesses in accordance with the provisions of SFAS No. 142.
Realized Investment Gains
Realized investment gains and losses have been a recurring element in Berkshire’s net earnings for manyyears. Such amounts are recorded when investments are: (1) sold or disposed; (2) impaired; or (3) marked-to-market with a corresponding gain or loss included in earnings. Such amounts also include realized and unrealizedgains or losses associated with certain derivatives contracts. Realized investment gains may fluctuate significantlyfrom period to period, resulting in a meaningful effect on reported net earnings. However, the amount of realizedgains in a given period has no practical analytical value, given the magnitude of unrealized gains existing inBerkshire’s consolidated investment portfolio.

62
Management’s Discussion (Continued)
Realized Investment Gains (Continued)
The Consolidated Statements of Earnings include after-tax realized investment gains of $2,729 million in2003, $566 million in 2002 and $923 million in 2001. These gains were net of after-tax losses of $188 million in2003, $373 million in 2002 and $161 million in 2001 related to “other-than-temporary” impairments. Managementevaluates investments for impairment as of each balance sheet date. Factors considered in determining whether animpairment charge is warranted include the length of time the unrealized loss has existed, the financial condition ofthe investee, future business prospects and creditworthiness of the investee, and Berkshire’s ability and intent tohold the investment until the value recovers. When an impairment charge is recorded, the cost of the investment iswritten down to fair value through a charge to earnings. Consequently, impairment charges from essentially all ofBerkshire’s “other-than-temporarily” impaired investments produced little effect on total shareholders’ equitybecause these investments were already carried at fair value with the difference between fair value and cost includedin shareholders’ equity as a component of accumulated other comprehensive income.
After-tax realized gains also included $536 million in 2003 and $193 million in 2002 of realized andunrealized gains on foreign currency forward contracts entered into during the last two years. After-tax unrealizedgains included in earnings with respect to open contracts totaled $414 million as of December 31, 2003 and $193million at December 31, 2002. The gains in each year were due primarily to the decline in the value of the U.S.dollar against certain foreign currencies.
Financial Condition
Berkshire’s balance sheet continues to reflect significant liquidity and a strong capital base. Consolidatedshareholders’ equity at December 31, 2003 totaled $77.6 billion. Consolidated cash and invested assets, excludingassets of finance and financial products businesses, totaled approximately $95.6 billion at December 31, 2003,(including $31.3 billion in cash and cash equivalents) and totaled $80.5 billion at December 31, 2002. During 2003,the market prices of Berkshire’s holdings in equity and fixed maturity securities increased significantly and cashflow generated from operations was about $8.2 billion. During 2003, Berkshire deployed about $3.2 billion ininternally generated cash for business acquisitions and during the preceding two years, cash of $7.3 billion wasutilized in business acquisitions, and $1.7 billion was utilized for additional investments in MidAmerican.
Berkshire’s consolidated notes payable and other borrowings, excluding borrowings of finance businesses,totaled $4.2 billion at December 31, 2003 and $4.8 billion at December 31, 2002. During 2003, commercial paperand short-term borrowings of subsidiaries declined $642 million from prepayments arising from strong operatingcash flow at Shaw and utilization of excess cash by General Re. Other borrowings consist primarily of debt ofsubsidiaries and investment contracts issued by Berkshire.
In May 2002, Berkshire issued the SQUARZ securities, which consist of $400 million par amount of seniornotes due in November 2007 together with warrants to purchase 4,464 Class A equivalent shares of Berkshirecommon stock, which expire in May 2007. A warrant premium is payable to Berkshire at an annual rate of 3.75%and interest is payable to note holders at a rate of 3.00%. Each warrant provides the holder the right to purchaseeither 0.1116 shares of Class A or 3.348 shares of Class B stock for $10,000. In addition, holders of the seniornotes have the option to require Berkshire to repurchase the senior notes at par annually each May 15 from 2004through 2006, provided that the holders also surrender a corresponding amount of warrants for cancellation. Allwarrants and senior notes were outstanding as of December 31, 2003.
Assets of the finance and financial products businesses totaled $28.3 billion at December 31, 2003 and$34.1 billion at December 31, 2002. The overall decline reflects a $6 billion decline in assets of BH Finance as aresult of the liquidation of certain fixed income investments, FINOVA loan prepayments totaling $1.65 billion and adecline in assets of GRS, which is in run-off. The outstanding loan to FINOVA as of December 31, 2003 andcorresponding borrowing from Fleet (each $525 million) were fully repaid in February 2004.
As of December 31, 2003, finance assets included approximately $3.8 billion in assets of Clayton, whichwas acquired by Berkshire in August 2003. Clayton is a leading builder of manufactured housing, providesfinancing and services loans to customers, and acquires other installment loan portfolios. Prior to its acquisition,Clayton securitized and sold a significant portion of its installment loans through special purpose entities. In early2003, Clayton discontinued loan securitizations and sales. Since being acquired by Berkshire, Clayton retained loanportfolios have increased by about $1.3 billion. Loan portfolios are expected to continue to grow over time.
Notes payable and other borrowings of Berkshire’s finance and financial products businesses totaled $4.9billion at December 31, 2003 and $4.5 billion at December 31, 2002. During the last four months of 2003,Berkshire Hathaway Finance Corporation issued a total of $2.0 billion par amount of medium term notes due from

63
Financial Condition (Continued)
2008 through 2013. The proceeds of these issues were used to finance new and existing loans of Clayton. Themedium term notes are guaranteed by Berkshire. Additional borrowings are expected in the future as retained loanportfolios continue to increase.
Berkshire believes that it currently maintains sufficient liquidity to cover its existing requirements andprovide for contingent liquidity.Contractual Obligations
Berkshire and its subsidiaries have contractual obligations associated with ongoing business and financingactivities, which will result in cash payments in future periods. Certain of those obligations, such as notes payableand other borrowings and related interest payments, are reflected in the Consolidated Financial Statements. Inaddition, Berkshire and subsidiaries have entered into long-term contracts to acquire goods or services in the future,which are not currently reflected in the financial statements and will be reflected in future periods as the goods aredelivered or services provided. A summary of contractual obligations follows. Amounts are in millions.
Payments due by periodContractual obligations Total 2004 2005-2006 2007-2008 2009 and afterNotes payable and other borrowings (1).................... $12,107 $ 3,225 $1,015 $2,104 $5,763Securities sold under agreements to repurchase (1)... 7,958 7,958 — — —Operating leases ....................................................... 1,508 322 505 334 347Purchase obligations (2) ............................................ 6,842 2,561 1,808 1,418 1,055Other (3) .................................................................... 924 202 173 125 424Total ......................................................................... $29,339 $14,268 $3,501 $3,981 $7,589
(1) Includes interest
(2) Principally relates to NetJets aircraft purchases
(3) Principally employee benefits and deferred compensation
Critical Accounting Policies
In applying certain accounting policies, Berkshire’s management is required to make estimates andjudgments regarding transactions that have occurred and ultimately will be settled several years in the future.Amounts recognized in the financial statements from such estimates are necessarily based on assumptions aboutnumerous factors involving varying, and possibly significant, degrees of judgment and uncertainty. Accordingly,the amounts currently recorded in the financial statements may prove, with the benefit of hindsight, to be inaccurate.The balance sheet items most significantly affected by these estimates are property and casualty insurance andreinsurance related liabilities.
Berkshire records liabilities for unpaid losses and loss adjustment expenses under property and casualtyinsurance and reinsurance contracts based upon estimates of the ultimate amounts payable under the contractsrelated to losses occurring on or before the balance sheet date. Berkshire uses a variety of techniques to establishand review the liabilities for unpaid losses recorded as of the balance sheet date. While techniques may vary,significant judgments and assumptions are necessary in projecting the ultimate amount payable in the future withrespect to loss events that have occurred as of the balance sheet date.
Reserves for unpaid losses and loss adjustment expenses are established by policy type (or line) orindividual coverage within the policy type. Reserves may consist of individual case estimates, supplemental caseestimates, development estimates and incurred-but-not-reported (“IBNR”) claim estimates. Once reported, certaincasualty claims may take years to settle, especially if legal action is involved. Liabilities may also reflect implicit orexplicit assumptions regarding the potential effects of future economic and social inflation, judicial decisions, lawchanges, and recent trends in such factors.
Berkshire uses a variety of techniques as tools in establishing and evaluating aggregate reserve amounts.Techniques used vary within each business depending upon the availability of reliable information. Statisticaltechniques may include detailed analysis of historical amounts of losses incurred or paid, claim frequency andseverity data, average paid or incurred loss data, closed claim data, paid or incurred loss ratios or othermeasurements. Statistical techniques are more reliable when a sufficient volume of historical loss informationexists. Significant changes to policy terms or coverages or in volumes of business written (and, therefore, lossexposures), or changes in the insurance laws or legal environment can cause historical statistical data to be lessreliable in projecting the ultimate amount of losses as of the balance sheet date. Statistical analysis may be basedupon internally developed loss experience, the experience of individual clients or groups of clients, or overallindustry-wide experience. Reserving techniques are based more upon informed judgment when statistical data isinsufficient or unavailable. Management must make judgments regardless of the techniques used.
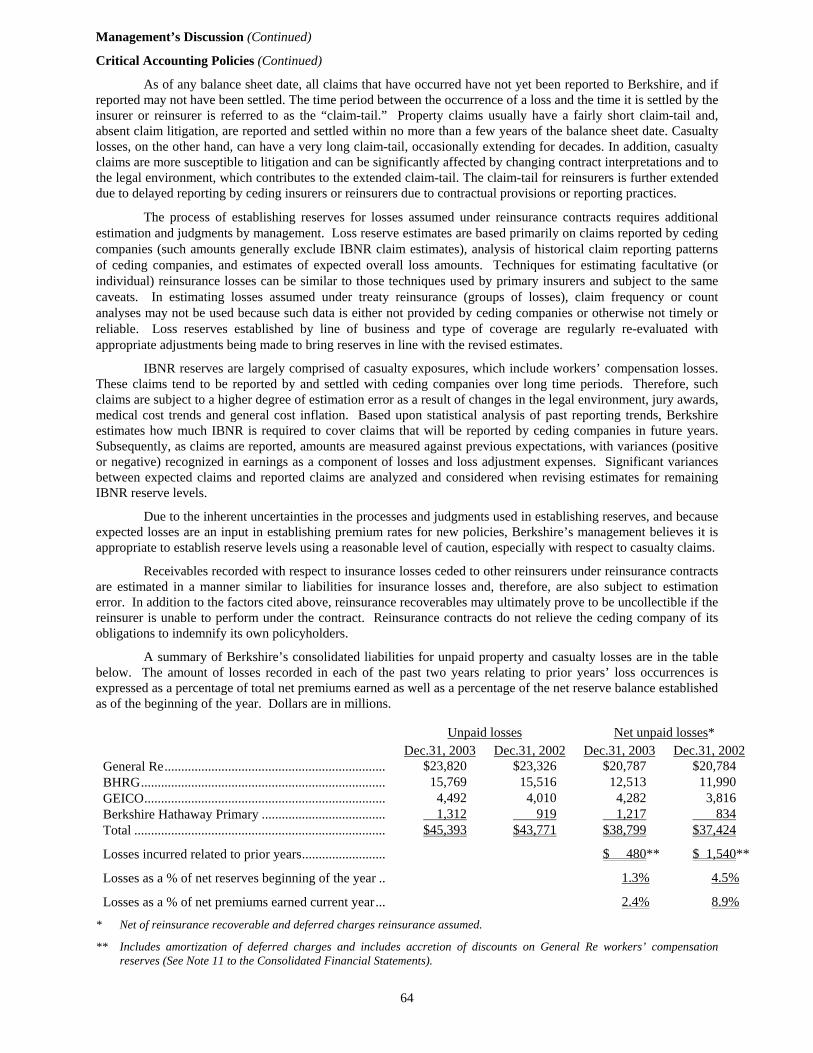
64
Management’s Discussion (Continued)
Critical Accounting Policies (Continued)
As of any balance sheet date, all claims that have occurred have not yet been reported to Berkshire, and ifreported may not have been settled. The time period between the occurrence of a loss and the time it is settled by theinsurer or reinsurer is referred to as the “claim-tail.” Property claims usually have a fairly short claim-tail and,absent claim litigation, are reported and settled within no more than a few years of the balance sheet date. Casualtylosses, on the other hand, can have a very long claim-tail, occasionally extending for decades. In addition, casualtyclaims are more susceptible to litigation and can be significantly affected by changing contract interpretations and tothe legal environment, which contributes to the extended claim-tail. The claim-tail for reinsurers is further extendeddue to delayed reporting by ceding insurers or reinsurers due to contractual provisions or reporting practices.
The process of establishing reserves for losses assumed under reinsurance contracts requires additionalestimation and judgments by management. Loss reserve estimates are based primarily on claims reported by cedingcompanies (such amounts generally exclude IBNR claim estimates), analysis of historical claim reporting patternsof ceding companies, and estimates of expected overall loss amounts. Techniques for estimating facultative (orindividual) reinsurance losses can be similar to those techniques used by primary insurers and subject to the samecaveats. In estimating losses assumed under treaty reinsurance (groups of losses), claim frequency or countanalyses may not be used because such data is either not provided by ceding companies or otherwise not timely orreliable. Loss reserves established by line of business and type of coverage are regularly re-evaluated withappropriate adjustments being made to bring reserves in line with the revised estimates.
IBNR reserves are largely comprised of casualty exposures, which include workers’ compensation losses.These claims tend to be reported by and settled with ceding companies over long time periods. Therefore, suchclaims are subject to a higher degree of estimation error as a result of changes in the legal environment, jury awards,medical cost trends and general cost inflation. Based upon statistical analysis of past reporting trends, Berkshireestimates how much IBNR is required to cover claims that will be reported by ceding companies in future years.Subsequently, as claims are reported, amounts are measured against previous expectations, with variances (positiveor negative) recognized in earnings as a component of losses and loss adjustment expenses. Significant variancesbetween expected claims and reported claims are analyzed and considered when revising estimates for remainingIBNR reserve levels.
Due to the inherent uncertainties in the processes and judgments used in establishing reserves, and becauseexpected losses are an input in establishing premium rates for new policies, Berkshire’s management believes it isappropriate to establish reserve levels using a reasonable level of caution, especially with respect to casualty claims.
Receivables recorded with respect to insurance losses ceded to other reinsurers under reinsurance contractsare estimated in a manner similar to liabilities for insurance losses and, therefore, are also subject to estimationerror. In addition to the factors cited above, reinsurance recoverables may ultimately prove to be uncollectible if thereinsurer is unable to perform under the contract. Reinsurance contracts do not relieve the ceding company of itsobligations to indemnify its own policyholders.
A summary of Berkshire’s consolidated liabilities for unpaid property and casualty losses are in the tablebelow. The amount of losses recorded in each of the past two years relating to prior years’ loss occurrences isexpressed as a percentage of total net premiums earned as well as a percentage of the net reserve balance establishedas of the beginning of the year. Dollars are in millions.
Unpaid losses Net unpaid losses*Dec.31, 2003 Dec.31, 2002 Dec.31, 2003 Dec.31, 2002
General Re.................................................................. $23,820 $23,326 $20,787 $20,784BHRG......................................................................... 15,769 15,516 12,513 11,990GEICO........................................................................ 4,492 4,010 4,282 3,816Berkshire Hathaway Primary ..................................... 1,312 919 1,217 834Total ........................................................................... $45,393 $43,771 $38,799 $37,424
Losses incurred related to prior years......................... $ 480** $ 1,540**
Losses as a % of net reserves beginning of the year .. 1.3% 4.5%
Losses as a % of net premiums earned current year... 2.4% 8.9%
* Net of reinsurance recoverable and deferred charges reinsurance assumed.
** Includes amortization of deferred charges and includes accretion of discounts on General Re workers’ compensationreserves (See Note 11 to the Consolidated Financial Statements).
65
Critical Accounting Policies (Continued)
In each year, General Re’s casualty reserve estimates for prior years’ losses have increased. In addition,the net reserves of BHRG’s retroactive reinsurance policies have increased each year, primarily as a consequence ofamortization of deferred charges. As shown in the table, a relatively small percentage change in estimates of thismagnitude will result in a material effect on reported earnings. A hypothetical 5% increase in estimated net unpaidlosses at December 31, 2003, would produce a $1.9 billion charge to pre-tax earnings. Future effects from changesin these estimates will be recorded as a component of losses incurred in the period of the change.
Berkshire records deferred charges as assets on its balance sheet with respect to liabilities assumed underretroactive reinsurance contracts. At the inception of these contracts the deferred charges represent the differencebetween the consideration received and the estimated ultimate liability for unpaid losses. The deferred charges areamortized as a component of losses incurred using the interest method over an estimate of the ultimate claimpayment period. The deferred charge balance may be adjusted periodically to reflect new projections of the amountand timing of loss payments. Adjustments to these assumptions are applied retrospectively from the inception of thecontract. Unamortized deferred charges totaled $3.1 billion at December 31, 2003. Significant changes in either thetiming or ultimate amount of loss payments may have a significant effect on unamortized deferred charges and theamount of periodic amortization.
Berkshire’s Consolidated Balance Sheet as of December 31, 2003 includes goodwill of acquired businessesof approximately $22.9 billion. These amounts have been recorded as a result of Berkshire’s numerous priorbusiness acquisitions accounted for under the purchase method. Prior to 2002, goodwill from each acquisition wasgenerally amortized as a charge to earnings over periods not exceeding 40 years. Under SFAS No. 142, which wasadopted by Berkshire as of January 1, 2002, periodic amortization ceased, in favor of an impairment-onlyaccounting model.
A significant amount of judgment is required in performing goodwill impairment tests. Such tests includeperiodically determining or reviewing the estimated fair value of Berkshire’s reporting units. Under SFAS No. 142,fair value refers to the amount for which the entire reporting unit may be bought or sold. There are several methodsof estimating reporting unit values, including market quotations, asset and liability fair values and other valuationtechniques, such as discounted cash flows and multiples of earnings or revenues. If the carrying amount of areporting unit, including goodwill, exceeds the estimated fair value, then individual assets, including identifiableintangible assets and liabilities of the reporting unit are estimated at fair value. The excess of the estimated fairvalue of the reporting unit over the estimated fair value of net assets would establish the implied value of goodwill.The excess of the recorded amount of goodwill over the implied value is then charged to earnings as an impairmentloss.
Berkshire’s consolidated financial position reflects large amounts of invested assets, including assets of itsfinance and financial products businesses. A substantial portion of these assets are carried at fair values based uponcurrent market quotations and, when not available, based upon fair value pricing models. Certain fixed maturitysecurities Berkshire owns are not actively traded in the markets. Further, Berkshire’s finance businesses maintainsignificant balances of finance receivables, which are carried at amortized cost. Considerable judgment is requiredin determining the assumptions used in certain pricing models, including interest rate, loan prepayment speed, creditrisk and liquidity risk assumptions. Significant changes in these assumptions can have a significant effect oncarrying values.Market Risk Disclosures
Berkshire’s Consolidated Balance Sheets include a substantial amount of assets and liabilities whose fairvalues are subject to market risks. Berkshire’s significant market risks are primarily associated with interest ratesand equity prices and to a lesser degree derivatives. The following sections address the significant market risksassociated with Berkshire’s business activities.
Interest Rate RiskBerkshire’s management prefers to invest in equity securities or to acquire entire businesses based upon the
principles discussed in the following section on equity price risk. When unable to do so, management mayalternatively invest in bonds, loans or other interest rate sensitive instruments. Berkshire’s strategy is to acquiresecurities that are attractively priced in relation to the perceived credit risk. Management recognizes and acceptsthat losses may occur. Berkshire has historically utilized a modest level of corporate borrowings and debt. Further,Berkshire strives to maintain the highest credit ratings so that the cost of debt is minimized. Berkshire utilizesderivative products to manage interest rate risks to a very limited degree.
The fair values of Berkshire’s fixed maturity investments and notes payable and other borrowings willfluctuate in response to changes in market interest rates. Increases and decreases in prevailing interest ratesgenerally translate into decreases and increases in fair values of those instruments. Additionally, fair values of
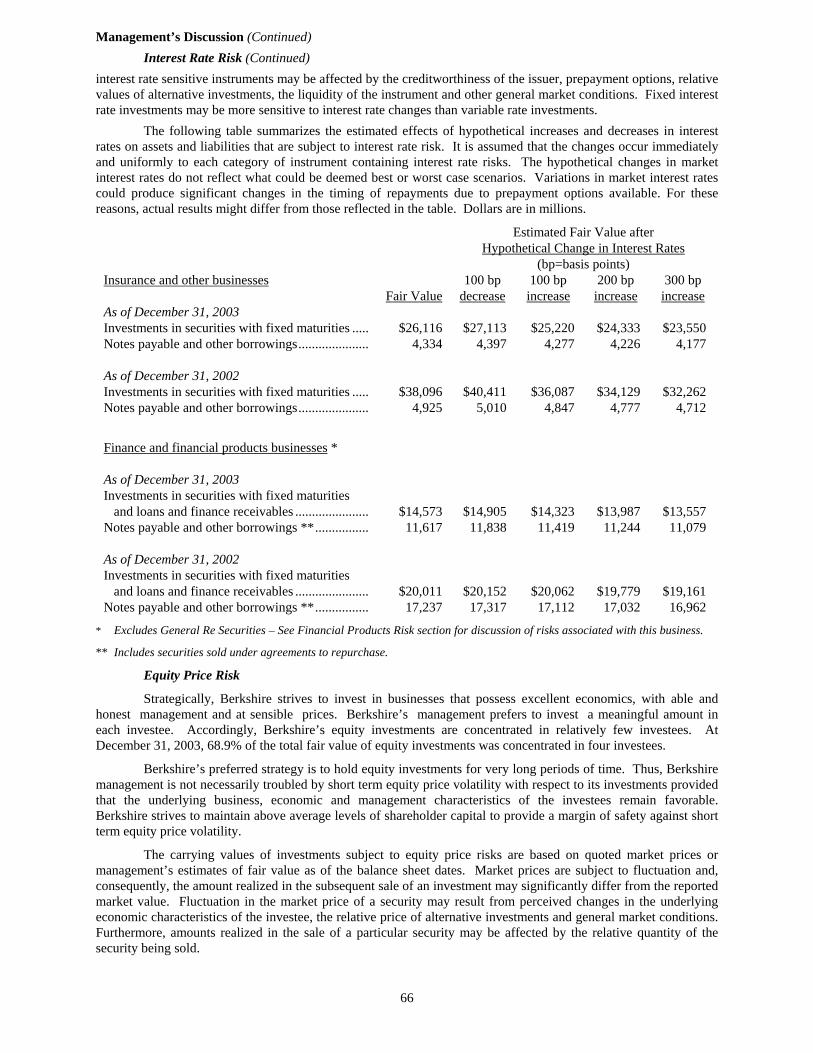
66
Management’s Discussion (Continued)Interest Rate Risk (Continued)
interest rate sensitive instruments may be affected by the creditworthiness of the issuer, prepayment options, relativevalues of alternative investments, the liquidity of the instrument and other general market conditions. Fixed interestrate investments may be more sensitive to interest rate changes than variable rate investments.
The following table summarizes the estimated effects of hypothetical increases and decreases in interestrates on assets and liabilities that are subject to interest rate risk. It is assumed that the changes occur immediatelyand uniformly to each category of instrument containing interest rate risks. The hypothetical changes in marketinterest rates do not reflect what could be deemed best or worst case scenarios. Variations in market interest ratescould produce significant changes in the timing of repayments due to prepayment options available. For thesereasons, actual results might differ from those reflected in the table. Dollars are in millions.
Estimated Fair Value afterHypothetical Change in Interest Rates
(bp=basis points)Insurance and other businesses 100 bp 100 bp 200 bp 300 bp
Fair Value decrease increase increase increaseAs of December 31, 2003Investments in securities with fixed maturities ..... $26,116 $27,113 $25,220 $24,333 $23,550Notes payable and other borrowings..................... 4,334 4,397 4,277 4,226 4,177
As of December 31, 2002Investments in securities with fixed maturities ..... $38,096 $40,411 $36,087 $34,129 $32,262Notes payable and other borrowings..................... 4,925 5,010 4,847 4,777 4,712
Finance and financial products businesses *
As of December 31, 2003Investments in securities with fixed maturities
and loans and finance receivables ...................... $14,573 $14,905 $14,323 $13,987 $13,557Notes payable and other borrowings **................ 11,617 11,838 11,419 11,244 11,079
As of December 31, 2002Investments in securities with fixed maturities
and loans and finance receivables ...................... $20,011 $20,152 $20,062 $19,779 $19,161Notes payable and other borrowings **................ 17,237 17,317 17,112 17,032 16,962
* Excludes General Re Securities – See Financial Products Risk section for discussion of risks associated with this business.
** Includes securities sold under agreements to repurchase.
Equity Price Risk
Strategically, Berkshire strives to invest in businesses that possess excellent economics, with able andhonest management and at sensible prices. Berkshire’s management prefers to invest a meaningful amount ineach investee. Accordingly, Berkshire’s equity investments are concentrated in relatively few investees. AtDecember 31, 2003, 68.9% of the total fair value of equity investments was concentrated in four investees.
Berkshire’s preferred strategy is to hold equity investments for very long periods of time. Thus, Berkshiremanagement is not necessarily troubled by short term equity price volatility with respect to its investments providedthat the underlying business, economic and management characteristics of the investees remain favorable.Berkshire strives to maintain above average levels of shareholder capital to provide a margin of safety against shortterm equity price volatility.
The carrying values of investments subject to equity price risks are based on quoted market prices ormanagement’s estimates of fair value as of the balance sheet dates. Market prices are subject to fluctuation and,consequently, the amount realized in the subsequent sale of an investment may significantly differ from the reportedmarket value. Fluctuation in the market price of a security may result from perceived changes in the underlyingeconomic characteristics of the investee, the relative price of alternative investments and general market conditions.Furthermore, amounts realized in the sale of a particular security may be affected by the relative quantity of thesecurity being sold.
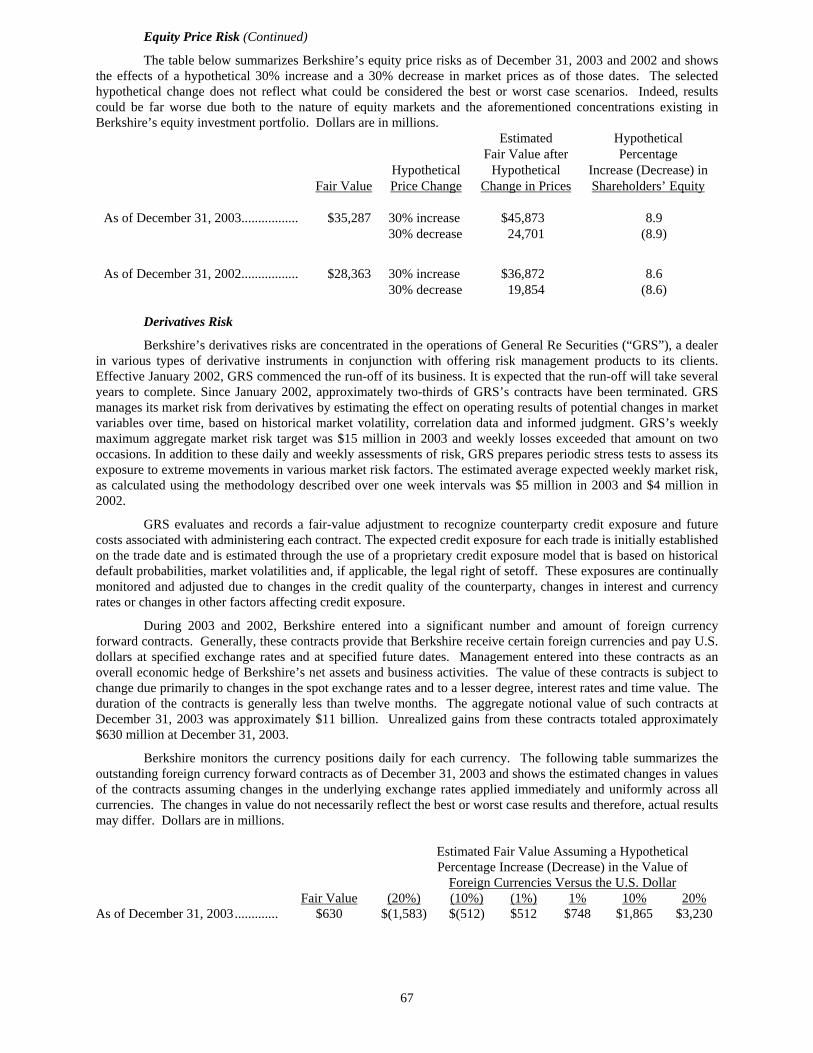
67
Equity Price Risk (Continued)
The table below summarizes Berkshire’s equity price risks as of December 31, 2003 and 2002 and showsthe effects of a hypothetical 30% increase and a 30% decrease in market prices as of those dates. The selectedhypothetical change does not reflect what could be considered the best or worst case scenarios. Indeed, resultscould be far worse due both to the nature of equity markets and the aforementioned concentrations existing inBerkshire’s equity investment portfolio. Dollars are in millions.
Estimated HypotheticalFair Value after Percentage
Hypothetical Hypothetical Increase (Decrease) inFair Value Price Change Change in Prices Shareholders’ Equity
As of December 31, 2003................. $35,287 30% increase $45,873 8.930% decrease 24,701 (8.9)
As of December 31, 2002................. $28,363 30% increase $36,872 8.630% decrease 19,854 (8.6)
Derivatives Risk
Berkshire’s derivatives risks are concentrated in the operations of General Re Securities (“GRS”), a dealerin various types of derivative instruments in conjunction with offering risk management products to its clients.Effective January 2002, GRS commenced the run-off of its business. It is expected that the run-off will take severalyears to complete. Since January 2002, approximately two-thirds of GRS’s contracts have been terminated. GRSmanages its market risk from derivatives by estimating the effect on operating results of potential changes in marketvariables over time, based on historical market volatility, correlation data and informed judgment. GRS’s weeklymaximum aggregate market risk target was $15 million in 2003 and weekly losses exceeded that amount on twooccasions. In addition to these daily and weekly assessments of risk, GRS prepares periodic stress tests to assess itsexposure to extreme movements in various market risk factors. The estimated average expected weekly market risk,as calculated using the methodology described over one week intervals was $5 million in 2003 and $4 million in2002.
GRS evaluates and records a fair-value adjustment to recognize counterparty credit exposure and futurecosts associated with administering each contract. The expected credit exposure for each trade is initially establishedon the trade date and is estimated through the use of a proprietary credit exposure model that is based on historicaldefault probabilities, market volatilities and, if applicable, the legal right of setoff. These exposures are continuallymonitored and adjusted due to changes in the credit quality of the counterparty, changes in interest and currencyrates or changes in other factors affecting credit exposure.
During 2003 and 2002, Berkshire entered into a significant number and amount of foreign currencyforward contracts. Generally, these contracts provide that Berkshire receive certain foreign currencies and pay U.S.dollars at specified exchange rates and at specified future dates. Management entered into these contracts as anoverall economic hedge of Berkshire’s net assets and business activities. The value of these contracts is subject tochange due primarily to changes in the spot exchange rates and to a lesser degree, interest rates and time value. Theduration of the contracts is generally less than twelve months. The aggregate notional value of such contracts atDecember 31, 2003 was approximately $11 billion. Unrealized gains from these contracts totaled approximately$630 million at December 31, 2003.
Berkshire monitors the currency positions daily for each currency. The following table summarizes theoutstanding foreign currency forward contracts as of December 31, 2003 and shows the estimated changes in valuesof the contracts assuming changes in the underlying exchange rates applied immediately and uniformly across allcurrencies. The changes in value do not necessarily reflect the best or worst case results and therefore, actual resultsmay differ. Dollars are in millions.
Estimated Fair Value Assuming a HypotheticalPercentage Increase (Decrease) in the Value of
Foreign Currencies Versus the U.S. DollarFair Value (20%) (10%) (1%) 1% 10% 20%
As of December 31, 2003............. $630 $(1,583) $(512) $512 $748 $1,865 $3,230

68
Management’s Discussion (Continued)
Forward-Looking Statements
Investors are cautioned that certain statements contained in this document, as well as some statements bythe Company in periodic press releases and some oral statements of Company officials during presentations aboutthe Company, are “forward-looking” statements within the meaning of the Private Securities Litigation Reform Actof 1995 (the “Act”). Forward-looking statements include statements which are predictive in nature, which dependupon or refer to future events or conditions, which include words such as “expects,” “anticipates,” “intends,”“plans,” “believes,” “estimates,” or similar expressions. In addition, any statements concerning future financialperformance (including future revenues, earnings or growth rates), ongoing business strategies or prospects, andpossible future Company actions, which may be provided by management are also forward-looking statements asdefined by the Act. Forward-looking statements are based on current expectations and projections about futureevents and are subject to risks, uncertainties, and assumptions about the Company, economic and market factors andthe industries in which the Company does business, among other things. These statements are not guaranties offuture performance and the Company has no specific intention to update these statements.
Actual events and results may differ materially from those expressed or forecasted in forward-lookingstatements due to a number of factors. The principal important risk factors that could cause the Company’s actualperformance and future events and actions to differ materially from such forward-looking statements, include, butare not limited to, changes in market prices of Berkshire’s significant equity investees, the occurrence of one ormore catastrophic events, such as an earthquake, hurricane or an act of terrorism that causes losses insured byBerkshire’s insurance subsidiaries, changes in insurance laws or regulations, changes in Federal income tax laws,and changes in general economic and market factors that affect the prices of securities or the industries in whichBerkshire and its affiliates do business, especially those affecting the property and casualty insurance industry.

69
In June 1996, Berkshire’s Chairman, Warren E. Buffett, issued a booklet entitled “An Owner’s Manual”to Berkshire’s Class A and Class B shareholders. The purpose of the manual was to explain Berkshire’s broadeconomic principles of operation. An updated version is reproduced on this and the following five pages.
____________________________________________________________________
OWNER-RELATED BUSINESS PRINCIPLES
At the time of the Blue Chip merger in 1983, I set down 13 owner-related business principles that I thoughtwould help new shareholders understand our managerial approach. As is appropriate for “principles,” all 13 remainalive and well today, and they are stated here in italics.
1. Although our form is corporate, our attitude is partnership. Charlie Munger and I think of ourshareholders as owner-partners, and of ourselves as managing partners. (Because of the size of ourshareholdings we are also, for better or worse, controlling partners.) We do not view the company itself asthe ultimate owner of our business assets but instead view the company as a conduit through which ourshareholders own the assets.
Charlie and I hope that you do not think of yourself as merely owning a piece of paper whose price wigglesaround daily and that is a candidate for sale when some economic or political event makes you nervous.We hope you instead visualize yourself as a part owner of a business that you expect to stay withindefinitely, much as you might if you owned a farm or apartment house in partnership with members ofyour family. For our part, we do not view Berkshire shareholders as faceless members of an ever-shiftingcrowd, but rather as co-venturers who have entrusted their funds to us for what may well turn out to be theremainder of their lives.
The evidence suggests that most Berkshire shareholders have indeed embraced this long-term partnershipconcept. The annual percentage turnover in Berkshire’s shares is a small fraction of that occurring in thestocks of other major American corporations, even when the shares I own are excluded from thecalculation.
In effect, our shareholders behave in respect to their Berkshire stock much as Berkshire itself behaves inrespect to companies in which it has an investment. As owners of, say, Coca-Cola or Gillette shares, wethink of Berkshire as being a non-managing partner in two extraordinary businesses, in which we measureour success by the long-term progress of the companies rather than by the month-to-month movements oftheir stocks. In fact, we would not care in the least if several years went by in which there was no trading,or quotation of prices, in the stocks of those companies. If we have good long-term expectations, short-term price changes are meaningless for us except to the extent they offer us an opportunity to increase ourownership at an attractive price.
2. In line with Berkshire’s owner-orientation, most of our directors have a major portion of their net worthinvested in the company. We eat our own cooking.
Charlie’s family has 90% or more of its net worth in Berkshire shares; my wife, Susie, and I have morethan 99%. In addition, many of my relatives — my sisters and cousins, for example — keep a huge portionof their net worth in Berkshire stock.
Charlie and I feel totally comfortable with this eggs-in-one-basket situation because Berkshire itself owns awide variety of truly extraordinary businesses. Indeed, we believe that Berkshire is close to being unique inthe quality and diversity of the businesses in which it owns either a controlling interest or a minorityinterest of significance.
Charlie and I cannot promise you results. But we can guarantee that your financial fortunes will move inlockstep with ours for whatever period of time you elect to be our partner. We have no interest in largesalaries or options or other means of gaining an “edge” over you. We want to make money only when ourpartners do and in exactly the same proportion. Moreover, when I do something dumb, I want you to beable to derive some solace from the fact that my financial suffering is proportional to yours.
*Copyright © 1996 By Warren E. Buffett
All Rights Reserved

70
3. Our long-term economic goal (subject to some qualifications mentioned later) is to maximize Berkshire’saverage annual rate of gain in intrinsic business value on a per-share basis. We do not measure theeconomic significance or performance of Berkshire by its size; we measure by per-share progress. We arecertain that the rate of per-share progress will diminish in the future — a greatly enlarged capital basewill see to that. But we will be disappointed if our rate does not exceed that of the average large Americancorporation.
4. Our preference would be to reach our goal by directly owning a diversified group of businesses thatgenerate cash and consistently earn above-average returns on capital. Our second choice is to own partsof similar businesses, attained primarily through purchases of marketable common stocks by our insurancesubsidiaries. The price and availability of businesses and the need for insurance capital determine anygiven year’s capital allocation.
In the last three years we have made eleven acquisitions. Though there will be dry years, we expect tomake a number of acquisitions in the decades to come, and our hope is that they will be large. If thesepurchases approach the quality of those we have made in the past, Berkshire will be well served.
The challenge for us is to generate ideas as rapidly as we generate cash. In this respect, a depressed stockmarket is likely to present us with significant advantages. For one thing, it tends to reduce the prices atwhich entire companies become available for purchase. Second, a depressed market makes it easier for ourinsurance companies to buy small pieces of wonderful businesses — including additional pieces ofbusinesses we already own — at attractive prices. And third, some of those same wonderful businesses,such as Coca-Cola, are consistent buyers of their own shares, which means that they, and we, gain from thecheaper prices at which they can buy.
Overall, Berkshire and its long-term shareholders benefit from a sinking stock market much as a regularpurchaser of food benefits from declining food prices. So when the market plummets — as it will fromtime to time — neither panic nor mourn. It’s good news for Berkshire.
5. Because of our two-pronged approach to business ownership and because of the limitations ofconventional accounting, consolidated reported earnings may reveal relatively little about our trueeconomic performance. Charlie and I, both as owners and managers, virtually ignore such consolidatednumbers. However, we will also report to you the earnings of each major business we control, numbers weconsider of great importance. These figures, along with other information we will supply about theindividual businesses, should generally aid you in making judgments about them.
To state things simply, we try to give you in the annual report the numbers and other information thatreally matter. Charlie and I pay a great deal of attention to how well our businesses are doing, and we alsowork to understand the environment in which each business is operating. For example, is one of ourbusinesses enjoying an industry tailwind or is it facing a headwind? Charlie and I need to know exactlywhich situation prevails and to adjust our expectations accordingly. We will also pass along ourconclusions to you.
Over time, practically all of our businesses have exceeded our expectations. But occasionally we havedisappointments, and we will try to be as candid in informing you about those as we are in describing thehappier experiences. When we use unconventional measures to chart our progress — for instance, you willbe reading in our annual reports about insurance “float” — we will try to explain these concepts and whywe regard them as important. In other words, we believe in telling you how we think so that you canevaluate not only Berkshire’s businesses but also assess our approach to management and capitalallocation.
6. Accounting consequences do not influence our operating or capital-allocation decisions. When acquisitioncosts are similar, we much prefer to purchase $2 of earnings that is not reportable by us under standardaccounting principles than to purchase $1 of earnings that is reportable. This is precisely the choice thatoften faces us since entire businesses (whose earnings will be fully reportable) frequently sell for doublethe pro-rata price of small portions (whose earnings will be largely unreportable). In aggregate and overtime, we expect the unreported earnings to be fully reflected in our intrinsic business value through capitalgains.

71
We have found over time that the undistributed earnings of our investees, in aggregate, have been fully asbeneficial to Berkshire as if they had been distributed to us (and therefore had been included in theearnings we officially report). This pleasant result has occurred because most of our investees are engagedin truly outstanding businesses that can often employ incremental capital to great advantage, either byputting it to work in their businesses or by repurchasing their shares. Obviously, every capital decision thatour investees have made has not benefitted us as shareholders, but overall we have garnered far more thana dollar of value for each dollar they have retained. We consequently regard look-through earnings asrealistically portraying our yearly gain from operations.
7. We use debt sparingly and, when we do borrow, we attempt to structure our loans on a long-term fixed-rate basis. We will reject interesting opportunities rather than over-leverage our balance sheet. Thisconservatism has penalized our results but it is the only behavior that leaves us comfortable, consideringour fiduciary obligations to policyholders, lenders and the many equity holders who have committedunusually large portions of their net worth to our care. (As one of the Indianapolis “500” winners said:“To finish first, you must first finish.”)
The financial calculus that Charlie and I employ would never permit our trading a good night’s sleep for ashot at a few extra percentage points of return. I’ve never believed in risking what my family and friendshave and need in order to pursue what they don’t have and don’t need.
Besides, Berkshire has access to two low-cost, non-perilous sources of leverage that allow us to safely ownfar more assets than our equity capital alone would permit: deferred taxes and “float,” the funds of othersthat our insurance business holds because it receives premiums before needing to pay out losses. Both ofthese funding sources have grown rapidly and now total about $45 billion.
Better yet, this funding to date has often been cost-free. Deferred tax liabilities bear no interest. And aslong as we can break even in our insurance underwriting the cost of the float developed from that operationis zero. Neither item, of course, is equity; these are real liabilities. But they are liabilities withoutcovenants or due dates attached to them. In effect, they give us the benefit of debt — an ability to havemore assets working for us — but saddle us with none of its drawbacks.
Of course, there is no guarantee that we can obtain our float in the future at no cost. But we feel ourchances of attaining that goal are as good as those of anyone in the insurance business. Not only have wereached the goal in the past (despite a number of important mistakes by your Chairman), our 1996acquisition of GEICO, materially improved our prospects for getting there in the future.
8. A managerial “wish list” will not be filled at shareholder expense. We will not diversify by purchasingentire businesses at control prices that ignore long-term economic consequences to our shareholders. Wewill only do with your money what we would do with our own, weighing fully the values you can obtain bydiversifying your own portfolios through direct purchases in the stock market.
Charlie and I are interested only in acquisitions that we believe will raise the per-share intrinsic value ofBerkshire’s stock. The size of our paychecks or our offices will never be related to the size of Berkshire’sbalance sheet.
9. We feel noble intentions should be checked periodically against results. We test the wisdom of retainingearnings by assessing whether retention, over time, delivers shareholders at least $1 of market value foreach $1 retained. To date, this test has been met. We will continue to apply it on a five-year rolling basis.As our net worth grows, it is more difficult to use retained earnings wisely.
We continue to pass the test, but the challenges of doing so have grown more difficult. If we reach thepoint that we can’t create extra value by retaining earnings, we will pay them out and let our shareholdersdeploy the funds.
10. We will issue common stock only when we receive as much in business value as we give. This rule appliesto all forms of issuance — not only mergers or public stock offerings, but stock-for-debt swaps, stockoptions, and convertible securities as well. We will not sell small portions of your company — and that iswhat the issuance of shares amounts to — on a basis inconsistent with the value of the entire enterprise.
72
When we sold the Class B shares in 1996, we stated that Berkshire stock was not undervalued — and somepeople found that shocking. That reaction was not well-founded. Shock should have registered instead hadwe issued shares when our stock was undervalued. Managements that say or imply during a public offeringthat their stock is undervalued are usually being economical with the truth or uneconomical with theirexisting shareholders’ money: Owners unfairly lose if their managers deliberately sell assets for 80¢ thatin fact are worth $1. We didn’t commit that kind of crime in our offering of Class B shares and we neverwill. (We did not, however, say at the time of the sale that our stock was overvalued, though many mediahave reported that we did.)
11. You should be fully aware of one attitude Charlie and I share that hurts our financial performance:Regardless of price, we have no interest at all in selling any good businesses that Berkshire owns. We arealso very reluctant to sell sub-par businesses as long as we expect them to generate at least some cash andas long as we feel good about their managers and labor relations. We hope not to repeat the capital-allocation mistakes that led us into such sub-par businesses. And we react with great caution tosuggestions that our poor businesses can be restored to satisfactory profitability by major capitalexpenditures. (The projections will be dazzling and the advocates sincere, but, in the end, major additionalinvestment in a terrible industry usually is about as rewarding as struggling in quicksand.) Nevertheless,gin rummy managerial behavior (discard your least promising business at each turn) is not our style. Wewould rather have our overall results penalized a bit than engage in that kind of behavior.
We continue to avoid gin rummy behavior. True, we closed our textile business in the mid-1980’s after 20years of struggling with it, but only because we felt it was doomed to run never-ending operating losses.We have not, however, given thought to selling operations that would command very fancy prices nor havewe dumped our laggards, though we focus hard on curing the problems that cause them to lag.
12. We will be candid in our reporting to you, emphasizing the pluses and minuses important in appraisingbusiness value. Our guideline is to tell you the business facts that we would want to know if our positionswere reversed. We owe you no less. Moreover, as a company with a major communications business, itwould be inexcusable for us to apply lesser standards of accuracy, balance and incisiveness whenreporting on ourselves than we would expect our news people to apply when reporting on others. We alsobelieve candor benefits us as managers: The CEO who misleads others in public may eventually misleadhimself in private.
At Berkshire you will find no “big bath” accounting maneuvers or restructurings nor any “smoothing” ofquarterly or annual results. We will always tell you how many strokes we have taken on each hole andnever play around with the scorecard. When the numbers are a very rough “guesstimate,” as theynecessarily must be in insurance reserving, we will try to be both consistent and conservative in ourapproach.
We will be communicating with you in several ways. Through the annual report, I try to give allshareholders as much value-defining information as can be conveyed in a document kept to reasonablelength. We also try to convey a liberal quantity of condensed but important information in the quarterlyreports we post on the internet, though I don’t write those (one recital a year is enough). Still anotherimportant occasion for communication is our Annual Meeting, at which Charlie and I are delighted tospend five hours or more answering questions about Berkshire. But there is one way we can’tcommunicate: on a one-on-one basis. That isn’t feasible given Berkshire’s many thousands of owners.
In all of our communications, we try to make sure that no single shareholder gets an edge: We do notfollow the usual practice of giving earnings “guidance” or other information of value to analysts or largeshareholders. Our goal is to have all of our owners updated at the same time.
13. Despite our policy of candor, we will discuss our activities in marketable securities only to the extentlegally required. Good investment ideas are rare, valuable and subject to competitive appropriation just asgood product or business acquisition ideas are. Therefore we normally will not talk about our investmentideas. This ban extends even to securities we have sold (because we may purchase them again) and tostocks we are incorrectly rumored to be buying. If we deny those reports but say “no comment” on otheroccasions, the no-comments become confirmation.
73
Though we continue to be unwilling to talk about specific stocks, we freely discuss our business andinvestment philosophy. I benefitted enormously from the intellectual generosity of Ben Graham, thegreatest teacher in the history of finance, and I believe it appropriate to pass along what I learned from him,even if that creates new and able investment competitors for Berkshire just as Ben’s teachings did for him.
AN ADDED PRINCIPLE
To the extent possible, we would like each Berkshire shareholder to record a gain or loss in market valueduring his period of ownership that is proportional to the gain or loss in per-share intrinsic value recordedby the company during that holding period. For this to come about, the relationship between the intrinsicvalue and the market price of a Berkshire share would need to remain constant, and by our preferences at1-to-1. As that implies, we would rather see Berkshire’s stock price at a fair level than a high level.Obviously, Charlie and I can’t control Berkshire’s price. But by our policies and communications, we canencourage informed, rational behavior by owners that, in turn, will tend to produce a stock price that isalso rational. Our it’s-as-bad-to-be-overvalued-as-to-be-undervalued approach may disappoint someshareholders. We believe, however, that it affords Berkshire the best prospect of attracting long-terminvestors who seek to profit from the progress of the company rather than from the investment mistakes oftheir partners.
INTRINSIC VALUE
Now let’s focus on a term that I mentioned earlier and that you will encounter in future annual reports.
Intrinsic value is an all-important concept that offers the only logical approach to evaluating the relativeattractiveness of investments and businesses. Intrinsic value can be defined simply: It is the discounted value of thecash that can be taken out of a business during its remaining life.
The calculation of intrinsic value, though, is not so simple. As our definition suggests, intrinsic value is anestimate rather than a precise figure, and it is additionally an estimate that must be changed if interest rates move orforecasts of future cash flows are revised. Two people looking at the same set of facts, moreover — and this wouldapply even to Charlie and me — will almost inevitably come up with at least slightly different intrinsic valuefigures. That is one reason we never give you our estimates of intrinsic value. What our annual reports do supply,though, are the facts that we ourselves use to calculate this value.
Meanwhile, we regularly report our per-share book value, an easily calculable number, though one oflimited use. The limitations do not arise from our holdings of marketable securities, which are carried on our booksat their current prices. Rather the inadequacies of book value have to do with the companies we control, whosevalues as stated on our books may be far different from their intrinsic values.
The disparity can go in either direction. For example, in 1964 we could state with certitude that Berkshire’sper-share book value was $19.46. However, that figure considerably overstated the company’s intrinsic value, sinceall of the company’s resources were tied up in a sub-profitable textile business. Our textile assets had neither going-concern nor liquidation values equal to their carrying values. Today, however, Berkshire’s situation is reversed:Now, our book value far understates Berkshire’s intrinsic value, a point true because many of the businesses wecontrol are worth much more than their carrying value.
Inadequate though they are in telling the story, we give you Berkshire’s book-value figures because theytoday serve as a rough, albeit significantly understated, tracking measure for Berkshire’s intrinsic value. In otherwords, the percentage change in book value in any given year is likely to be reasonably close to that year’s changein intrinsic value.
You can gain some insight into the differences between book value and intrinsic value by looking at oneform of investment, a college education. Think of the education’s cost as its “book value.” If this cost is to beaccurate, it should include the earnings that were foregone by the student because he chose college rather than a job.
For this exercise, we will ignore the important non-economic benefits of an education and focus strictly onits economic value. First, we must estimate the earnings that the graduate will receive over his lifetime and subtractfrom that figure an estimate of what he would have earned had he lacked his education. That gives us an excessearnings figure, which must then be discounted, at an appropriate interest rate, back to graduation day. The dollarresult equals the intrinsic economic value of the education.

74
Some graduates will find that the book value of their education exceeds its intrinsic value, which meansthat whoever paid for the education didn’t get his money’s worth. In other cases, the intrinsic value of an educationwill far exceed its book value, a result that proves capital was wisely deployed. In all cases, what is clear is thatbook value is meaningless as an indicator of intrinsic value.
THE MANAGING OF BERKSHIRE
I think it’s appropriate that I conclude with a discussion of Berkshire’s management, today and in thefuture. As our first owner-related principle tells you, Charlie and I are the managing partners of Berkshire. But wesubcontract all of the heavy lifting in this business to the managers of our subsidiaries. In fact, we delegate almost tothe point of abdication: Though Berkshire has about 172,000 employees, only 16 of these are at headquarters.
Charlie and I mainly attend to capital allocation and the care and feeding of our key managers. Most ofthese managers are happiest when they are left alone to run their businesses, and that is customarily just how weleave them. That puts them in charge of all operating decisions and of dispatching the excess cash they generate toheadquarters. By sending it to us, they don’t get diverted by the various enticements that would come their waywere they responsible for deploying the cash their businesses throw off. Furthermore, Charlie and I are exposed to amuch wider range of possibilities for investing these funds than any of our managers could find in his or her ownindustry.
Most of our managers are independently wealthy, and it’s therefore up to us to create a climate thatencourages them to choose working with Berkshire over golfing or fishing. This leaves us needing to treat themfairly and in the manner that we would wish to be treated if our positions were reversed.
As for the allocation of capital, that’s an activity both Charlie and I enjoy and in which we have acquiredsome useful experience. In a general sense, grey hair doesn’t hurt on this playing field: You don’t need good hand-eye coordination or well-toned muscles to push money around (thank heavens). As long as our minds continue tofunction effectively, Charlie and I can keep on doing our jobs pretty much as we have in the past.
On my death, Berkshire’s ownership picture will change but not in a disruptive way: None of my stockwill have to be sold to take care of bequests and taxes; all of it will go to my wife, Susan, if she survives me, or to afamily foundation if she doesn’t. In either event, Berkshire will possess a controlling shareholder guided by thesame philosophy and objectives that now set our course.
At that juncture, the Buffett family will not be involved in managing the business, only in picking andoverseeing the managers who do. Just who those managers will be, of course, depends on the date of my death. ButI can anticipate what the management structure will be: Essentially my job will be split into two parts, with oneexecutive becoming responsible for investments and another, who will be CEO, for operations. If the acquisition ofnew businesses is in prospect, the two will cooperate in making the decisions needed. Both executives will report toa board of directors who will be responsive to the controlling shareholder, whose interests will in turn be alignedwith yours.
Were we to need the management structure I have just described on an immediate basis, our directors knowwho I would recommend for both posts. All candidates currently work for Berkshire and are people in whom I havetotal confidence.
I will continue to keep the directors posted on the succession issue. Since Berkshire stock will make upvirtually my entire estate and will account for a similar portion of the assets of either my wife or the foundation for aconsiderable period after my death, you can be sure that I have thought through the succession question carefully.You can be equally sure that the principles we have employed to date in running Berkshire will continue to guidethe managers who succeed me.
Lest we end on a morbid note, I also want to assure you that I have never felt better. I love runningBerkshire, and if enjoying life promotes longevity, Methuselah’s record is in jeopardy.
Warren E. BuffettChairman
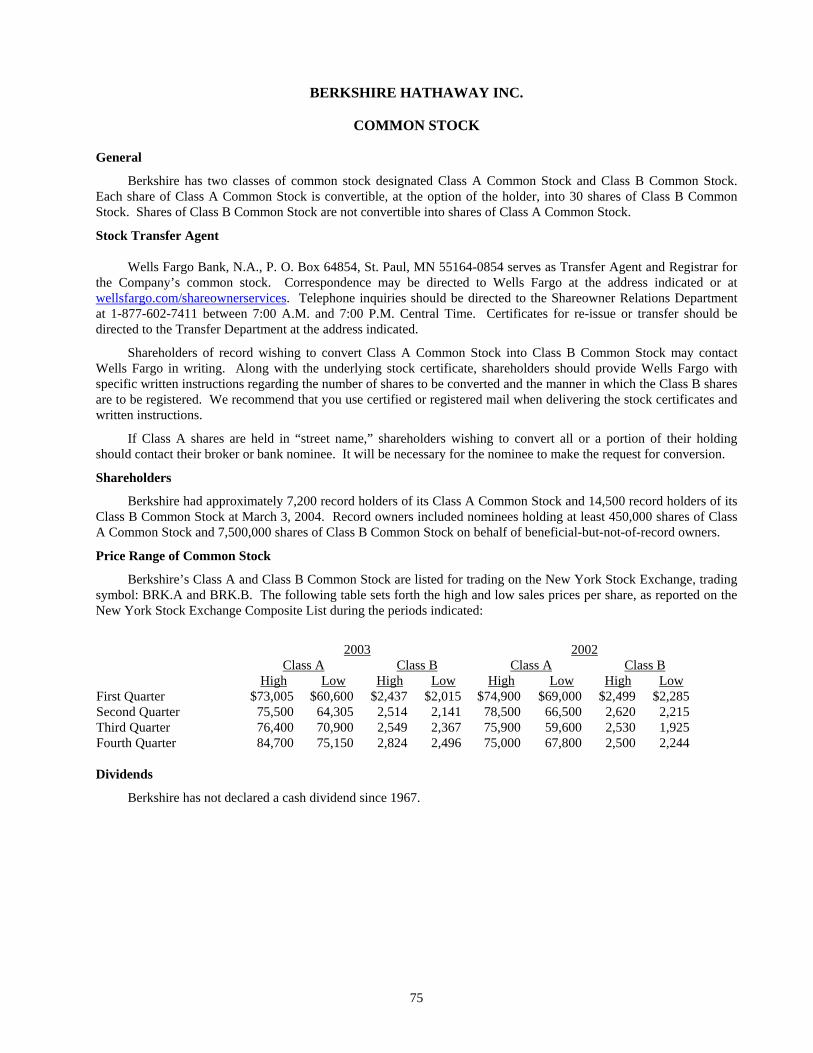
75
BERKSHIRE HATHAWAY INC.
COMMON STOCK
General
Berkshire has two classes of common stock designated Class A Common Stock and Class B Common Stock.Each share of Class A Common Stock is convertible, at the option of the holder, into 30 shares of Class B CommonStock. Shares of Class B Common Stock are not convertible into shares of Class A Common Stock.
Stock Transfer Agent
Wells Fargo Bank, N.A., P. O. Box 64854, St. Paul, MN 55164-0854 serves as Transfer Agent and Registrar forthe Company’s common stock. Correspondence may be directed to Wells Fargo at the address indicated or atwellsfargo.com/shareownerservices. Telephone inquiries should be directed to the Shareowner Relations Departmentat 1-877-602-7411 between 7:00 A.M. and 7:00 P.M. Central Time. Certificates for re-issue or transfer should bedirected to the Transfer Department at the address indicated.
Shareholders of record wishing to convert Class A Common Stock into Class B Common Stock may contactWells Fargo in writing. Along with the underlying stock certificate, shareholders should provide Wells Fargo withspecific written instructions regarding the number of shares to be converted and the manner in which the Class B sharesare to be registered. We recommend that you use certified or registered mail when delivering the stock certificates andwritten instructions.
If Class A shares are held in “street name,” shareholders wishing to convert all or a portion of their holdingshould contact their broker or bank nominee. It will be necessary for the nominee to make the request for conversion.
Shareholders
Berkshire had approximately 7,200 record holders of its Class A Common Stock and 14,500 record holders of itsClass B Common Stock at March 3, 2004. Record owners included nominees holding at least 450,000 shares of ClassA Common Stock and 7,500,000 shares of Class B Common Stock on behalf of beneficial-but-not-of-record owners.
Price Range of Common Stock
Berkshire’s Class A and Class B Common Stock are listed for trading on the New York Stock Exchange, tradingsymbol: BRK.A and BRK.B. The following table sets forth the high and low sales prices per share, as reported on theNew York Stock Exchange Composite List during the periods indicated:
2003 2002Class A Class B Class A Class B
High Low High Low High Low High LowFirst Quarter $73,005 $60,600 $2,437 $2,015 $74,900 $69,000 $2,499 $2,285Second Quarter 75,500 64,305 2,514 2,141 78,500 66,500 2,620 2,215Third Quarter 76,400 70,900 2,549 2,367 75,900 59,600 2,530 1,925Fourth Quarter 84,700 75,150 2,824 2,496 75,000 67,800 2,500 2,244
Dividends
Berkshire has not declared a cash dividend since 1967.
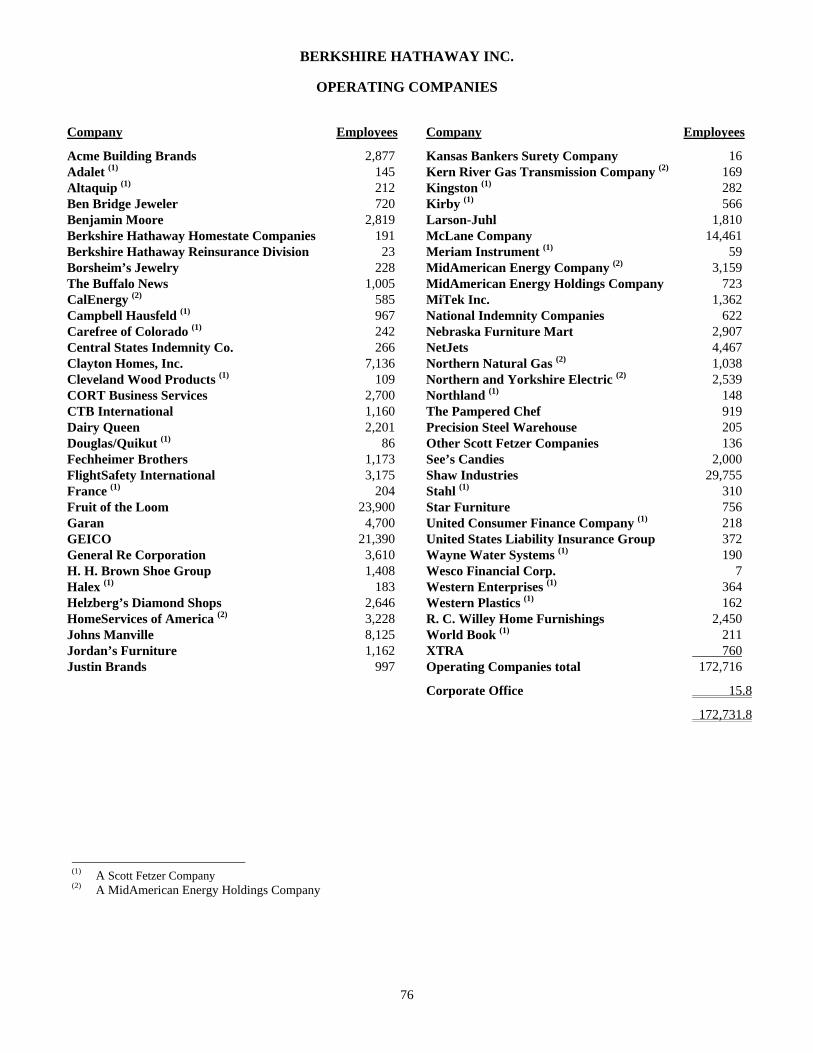
76
BERKSHIRE HATHAWAY INC.
OPERATING COMPANIES
Company Employees Company Employees
Acme Building Brands 2,877 Kansas Bankers Surety Company 16Adalet (1) 145 Kern River Gas Transmission Company (2) 169Altaquip (1) 212 Kingston (1) 282Ben Bridge Jeweler 720 Kirby (1) 566Benjamin Moore 2,819 Larson-Juhl 1,810Berkshire Hathaway Homestate Companies 191 McLane Company 14,461Berkshire Hathaway Reinsurance Division 23 Meriam Instrument (1) 59Borsheim’s Jewelry 228 MidAmerican Energy Company (2) 3,159The Buffalo News 1,005 MidAmerican Energy Holdings Company 723CalEnergy (2) 585 MiTek Inc. 1,362Campbell Hausfeld (1) 967 National Indemnity Companies 622Carefree of Colorado (1) 242 Nebraska Furniture Mart 2,907Central States Indemnity Co. 266 NetJets 4,467Clayton Homes, Inc. 7,136 Northern Natural Gas (2) 1,038Cleveland Wood Products (1) 109 Northern and Yorkshire Electric (2) 2,539CORT Business Services 2,700 Northland (1) 148CTB International 1,160 The Pampered Chef 919Dairy Queen 2,201 Precision Steel Warehouse 205Douglas/Quikut (1) 86 Other Scott Fetzer Companies 136Fechheimer Brothers 1,173 See’s Candies 2,000FlightSafety International 3,175 Shaw Industries 29,755France (1) 204 Stahl (1) 310Fruit of the Loom 23,900 Star Furniture 756Garan 4,700 United Consumer Finance Company (1) 218GEICO 21,390 United States Liability Insurance Group 372General Re Corporation 3,610 Wayne Water Systems (1) 190H. H. Brown Shoe Group 1,408 Wesco Financial Corp. 7Halex (1) 183 Western Enterprises (1) 364Helzberg’s Diamond Shops 2,646 Western Plastics (1) 162HomeServices of America (2) 3,228 R. C. Willey Home Furnishings 2,450Johns Manville 8,125 World Book (1) 211Jordan’s Furniture 1,162 XTRA 760Justin Brands 997 Operating Companies total 172,716
Corporate Office 15.8
172,731.8
(1) A Scott Fetzer Company(2) A MidAmerican Energy Holdings Company
BERKSHIRE HATHAWAY INC.
DIRECTORS OFFICERS
WARREN E. BUFFETT,Chairman and CEO of Berkshire
WARREN E. BUFFETT, Chairman and CEO
CHARLES T. MUNGER,Vice Chairman of Berkshire
CHARLES T. MUNGER, Vice Chairman
MARC D. HAMBURG, Vice President, Treasurer
SUSAN T. BUFFETT DANIEL J. JAKSICH, Controller
HOWARD G. BUFFETT,President of Buffett Farms and BioImages, a photography
and publishing company.
FORREST N. KRUTTER, Secretary
MALCOLM G. CHACE,Chairman of the Board of Directors of BankRI, a
community bank located in the State of Rhode Island.
DAVID S. GOTTESMAN,Senior Managing Director of First Manhattan Company, an
investment advisory firm.
CHARLOTTE GUYMAN,Chairman of Finance Committee of the Board of Directors
of UW Medicine, an academic medical center.
DONALD R. KEOUGH,Chairman of Allen and Company Incorporated, an investment
banking firm.
REBECCA K. AMICK, Director of Internal Auditing
JERRY W. HUFTON,
THOMAS S. MURPHY,Former Chairman of the Board and CEO of Capital
Cities/ABC.
Director of Taxes
MARK D. MILLARD, Director of Financial Assets
RONALD L. OLSON,Partner of the law firm of Munger, Tolles & Olson LLP.
WALTER SCOTT, JR.,Chairman of Level 3 Communications, a successor to certain
businesses of Peter Kiewit Sons’ Inc. which is engaged intelecommunications and computer outsourcing.
Letters from Annual Reports (1977 through 2003), quarterly reports, press releases and other informationabout Berkshire may be obtained on the Internet at berkshirehathaway.com. Berkshire’s 2004 quarterly reports arescheduled to be posted on the Internet on May 7, August 6 and November 5. Berkshire’s 2004 Annual Report isscheduled to be posted on the Internet on March 1, 2005.
A three volume set of compilations of letters (1977 through 2000) is available upon written requestaccompanied by a payment of $35.00 to cover production, postage and handling costs. Requests should besubmitted to the Company at 3555 Farnam St., Suite 1440, Omaha, NE 68131.