Embed Size (px)
Citation preview

*Correspondence to: Rohit Goyal, Principal Software Engineer, Axiowave Networks, 100 Nickerson Road,Marlborough, MA 01752, U.S.A.
sE-mail: [email protected] results in Section 3.3 have appeared in Reference [1]. Results in Section 4 have appeared in Reference [2]. Thispaper is a much enhanced and consolidated version and no results have been published in a journal.
Contract/grant sponsor: NASA Lewis Research Center; contract/grant number: NA53-97198
Copyright ( 2001 John Wiley & Sons, Ltd.
INTERNATIONAL JOURNAL OF SATELLITE COMMUNICATIONSInt. J. Satell. Commun. 2001; 19:111}139
Bu!er management and rate guarantees for TCP oversatellite-ATM networkst
Rohit Goyal1,*,s, Raj Jain2, Mukul Goyal3, Sonia Fahmy4, Bobby Vandalore5,Sastri Kota6, Norm Butts7 and Thomas vonDeak8
1Principal Software Engineer, Axiowave Networks, 100 Nickerson Road, Marlborough, MA 01752, U.S.A.2Nayna Networks Inc., 157 Topaz St., Milpitas, CA 95035, U.S.A.
3AT & T Labs-Research, 180 Park Ave, Florham Park, NJ 07932, U.S.A.4Purdue University, 1398 Computer Science Building, West Lafayette, IN 47907-1398, U.S.A.
5Department of Computer and Information Science, The Ohio State University, 395 Dreese Lab, 2015 Neil Avenue,Columbus, OH 43210-1277, U.S.A.
6Chief Network Architect, BMS, 3825 Fabian Way M/S: Z-59, Palo Alto, CA 94303, U.S.A.7Lockheed Martin Mission Systems, Sunnyvale, CA 94089, U.S.A.
8NASA Lewis Research Center, MS: 54-6, 21000 Brookpark Road, Cleveland, OH 44135, U.S.A.
SUMMARY
Future broadband satellite networks will support a variety of service types. Many such systems are beingdesign with ATM or ATM-like technology. A majority of Internet applications use TCP for data transfer.As a result, these systems must e$ciently transport TCP tra$c and provide service guarantees to suchtra$c. Several mechanisms have been presented in recent literature to improve TCP performance. Mostof these can be categorized as either TCP enhancements or network-based bu!er management techniques.Providing minimum rate guarantees to TCP tra$c has also been suggested as a way to improve itsperformance in the presence of higher priority tra$c sharing the link. However, the relative performanceof the TCP enhancements versus the bu!er management schemes has not been analyzed for long latencynetworks. In this paper, we address three issues. First, we present a performance analysis of TCP oversatellite-ATM links using a best e!ort service*the ATM unspeci"ed bit rate (UBR) service. This analysisshows that the relative impacts of bu!er management, TCP policies and rate guarantees on TCP perfor-mance, depend heavily on the latency of the network. Second, we show through simulations that thebu!er size required in the network for high TCP performance is proportional to the delay-bandwidthproduct of the network. Third, we propose a bu!er management scheme called di!erential fair bu!erallocation (DFBA) and show how it is used to implement a service that provides minimum rateguarantees to TCP tra$c. An example of such a service is the ATM guaranteed frame rate (GFR)service, which is being standardized by the ATM Forum and the ITU. Copyright ( 2001 John Wiley &Sons, Ltd.
KEY WORDS: bu!er management; rate guarantees; TCP; ATM
1. INTRODUCTION
The TCP over satellite [1] working group in the IETF has designed mechanisms for enhancingTCP performance over satellite networks. The group has focused its e!orts on modifying the TCPprotocol to improve its performance over long-delay satellite links [2]. The research on TCP hasprimarily considered a best e!ort service framework. Recent developments in broadband com-munications have promoted the design of multiservice network architectures that will provideminimum rate guarantees to TCP tra$c. The implementation of such architectures requiresnetwork-based tra$c management techniques such as bu!er management and scheduling tosupport QoS guarantees.
More than 50 per cent of the planned Ka-band satellite systems propose to use on-board ATMor ATM-like fast packet switching [3]. ATM based switching and processing provides a new setof techniques for tra$c management in satellite networks. In particular, several bu!er manage-ment schemes have been proposed to improve ¹CP performance over ATM networks [4}6]. Forbent pipe and regenerative satellite systems, ground stations can also bene"t from these bu!ermanagement techniques to improve end-to-end TCP performance.
In addition to providing best e!ort services such as the ATM unspeci"ed bit rate (UBR)service, satellite networks must also support services that provide minimum rate guaranteesto their subscribers' tra$c. The ATM guaranteed frame rate (GFR) service is one suchservice that is being standardized by the ATM Forum and the ITU. Bu!er management canbe used in the network to implement the GFR service and provide rate guarantees to TCPtra$c.
While bu!er management techniques provide clear performance improvements for TCP overterrestrial networks [4,7], it is not clear if their bene"ts are substantial over satellite networksthat have larger propagation delays. Also, bu!er management mechanisms increase the complex-ity and hence the cost of designing on-board and ground-based network elements. As a result, thesatellite network architect is faced with the complex decision of designing earth terminals andon-board switches for optimizing the cost-performance tradeo!.
In this paper, we study bu!er management techniques in satellite networks for TCP transport.We present simulations for the various TCP and ATM enhancements and discuss their relativee!ects. Based on the experimental results and analysis, we provide guidelines for designingsatellite-ATM network architectures that can e$ciently transport TCP data. We address thefollowing three problems in this paper:
Problem 1 (Performance analysis of TCP over satellite-UBR)The goal is to study the e!ect of delay on TCP performance. We study the relative e!ects of
three TCP policies, three bu!er management policies and rate guarantees on TCP performanceover the ATM UBR service.
The TCP policies are slow start and congestion avoidance (TCP Vanilla) [8], fast retransmitand recovery (TCP Reno) [9], and selective acknowledgments (TCP Sack) [10]. The bu!ermanagement policies are tail drop, early packet, discard (EPD) [6], and selective drop (SD) [4].We also discuss the e!ect of providing a minimum rate guarantee to the entire UBR servicecategory.
Problem 2 (Buwer requirements for TCP over satellite-UBR)We present simulation results to calculate the switch bu!er sizes that provide high TCP
performance over satellite.
112 R. GOYAL ET AL.
Copyright ( 2001 John Wiley & Sons, Ltd. Int. J. Satell. Commun. 2001; 19:111}139

Problem 3 (Buwer management for Guaranteed Frame Rate over satellite)We describe the GFR service category and propose the di!erential fair bu!er allocation
(DFBA) scheme. DFBA is designed for TCP tra$c and uses a FIFO bu!er to provide minimumrate guarantees to ATM VCs carrying TCP tra$c.
The paper does not propose any new TCP enhancements, but analyses the performance ofexisting and proposed TCP mechanisms including TCP Vanilla, TCP Reno and TCP SACK. InReference [11], we present a study on TCP New Reno. In this paper, we also propose a bu!ermanagement technique for high throughput, fairness and minimum rate guarantees to TCPtra$c over satellite-ATM networks. The simulation and analysis are performed for varioussatellite latencies covering LEO and GEO systems. The results show that the design consider-ations for satellite networks are di!erent than those for terrestrial networks, not only with respectto TCP, but also for the network. Several recent papers have analyzed various TCP policies oversatellite latencies. These have been listed in Reference [2]. The emphasis on network design issuesfor tra$c management and basic service guarantees for TCP over satellite-ATM is the uniquecontribution of this research.
2. DESIGN OPTIONS FOR TCP OVER SATELLITE-ATM
In this section we describe the design options for transporting TCP over satellite-ATM.There are three ATM service categories that are primarily designed for best e!ort data tra$c.
These are as follows.
f ;nspeci,ed bit rate (UBR): UBR is a best e!ort service category that provides no guaranteesto the user. Past results have shown that TCP performs poorly over UBR because packetsare lost due to congestion. Two reasons for the poor performance are the coarse-grainedTCP transmission timeout and TCP synchronization [12]. The performance of TCP overUBR can be enhanced in the following ways (UBR with one or more enhancements has beeninformally called UBR#):
* ;BR with frame based discard like EPD. Among frame-based discard policies, the earlypacket discard [6] policy is widely used [13]. EPD maintains a threshold R in the switchbu!er. When the bu!er occupancy exceeds R, all new incoming packets are dropped.Partially received packets are accepted if possible. In terrestrial networks, EPD improvesthe e$ciency of TCP over UBR but does not improve fairness [7]. The e!ect of EPD onsatellite latencies has not been exhaustively studied.
* ;BR with intelligent bu+er management. The selective drop (SD) [4] scheme is anexample of an intelligent bu!er management scheme. This scheme uses per-VC ac-counting to maintain the current bu!er utilization of each UBR VC. A fair allocation iscalculated for each VC and if the VC's bu!er occupancy exceeds its fair allocation, itssubsequent incoming packet is dropped. The scheme maintains a threshold R, asa fraction of the bu!er capacity K. When the total bu!er occupancy (X) exceeds R]K,new packets are dropped depending on the VC
i's bu!er occupancy (>
i). In SD, a VC's
entire packets is dropped if
(X'R]K) AND (>i]N
a/X'Z)
TCP OVER SATELLITE-ATM NETWORKS 113
Copyright ( 2001 John Wiley & Sons, Ltd. Int. J. Satell. Commun. 2001; 19:111}139
where Nais the number of active VCs (VCs with at least one cell in the bu!er) and Z is
a parameter (0(Z)1) used to scale the e!ective drop threshold. In terrestrial networks,SD has been shown to improve the fairness TCP connections running over UBR [4].
* ;BR with guaranteed rate allocation. A multiservice satellite network will transporthigher priority variable bit rate tra$c along with UBR tra$c. The e!ect of higher prioritytra$c on TCP over UBR has not been studied before. Preliminary simulations [14] haveshown that higher priority tra$c can degrade TCP performance in some cases. In thispaper, we show how rate guarantees to UBR can improve TCP performance in thepresence of higher priority tra$c.
f Guaranteed frame rate (GFR): GFR is a frame-based service that provides a minimum cellrate (MCR) guarantee to VCs. In addition to MCR, GFR also provides a fair share of anyunused network capacity. Several design options exist for GFR, including network policing,per-VC scheduling and intelligent bu!er management. Currently, very few implementationshave been proposed for GFR and none have been tested for satellite latencies. In this paperwe show how to implement the GFR service using a bu!er management algorithm calleddi!erential fair bu!er allocation (DFBA). We discuss the performance of DFBA for TCPover satellite-ATM networks.
f Available bit rate (ABR): The ABR service provides an MCR guarantee to the VCs and a fairshare of any unused capacity. ABR is di!erent from GFR in several ways, but the mostimportant is that ABR uses a rate-based closed-loop feedback control mechanism for conges-tion control. In this paper, we focus on TCP performance over UBR and GFR services.
In addition to the network-based options, there are four TCP congestion control techniquesthat are of interest in performance analysis over satellite links [2]:
f Slow start and congestion avoidance (TCP Vanilla).f Fast retransmit and recovery (TCP Reno).f TCP New Reno.f Selective acknowledgments (TCP SACK).
Vanilla and Reno TCP are standard mechanisms that are widely deployed in TCP stacks. TCPNew Reno and SACK have recently been proposed as performance enhancements to TCPcongestion control and are being incorporated in TCP implementations. Several studies havereported performance results of the above TCP options over satellite latencies [2]. However,these studies have focussed only on TCP mechanisms and have not considered intelligentnetwork-based tra$c management or guaranteed rate policies. Also, the studies have all beenperformed using a best e!ort service framework. Future broadband satellite networks mustsupport the multiservice framework being adopted for terrestrial networks. Satellite networksusing an ATM-like cell transport must use network-based techniques to provide the serviceguarantees required for a multiservice network.
3. PERFORMANCE ANALYSIS OF TCP OVER SATELLITE-UBR#
Since TCP congestion control is inherently limited by the round trip time, long-delay paths havesigni"cant e!ects on the performance of TCP over ATM. A large delay-bandwidth link must be
114 R. GOYAL ET AL.
Copyright ( 2001 John Wiley & Sons, Ltd. Int. J. Satell. Commun. 2001; 19:111}139
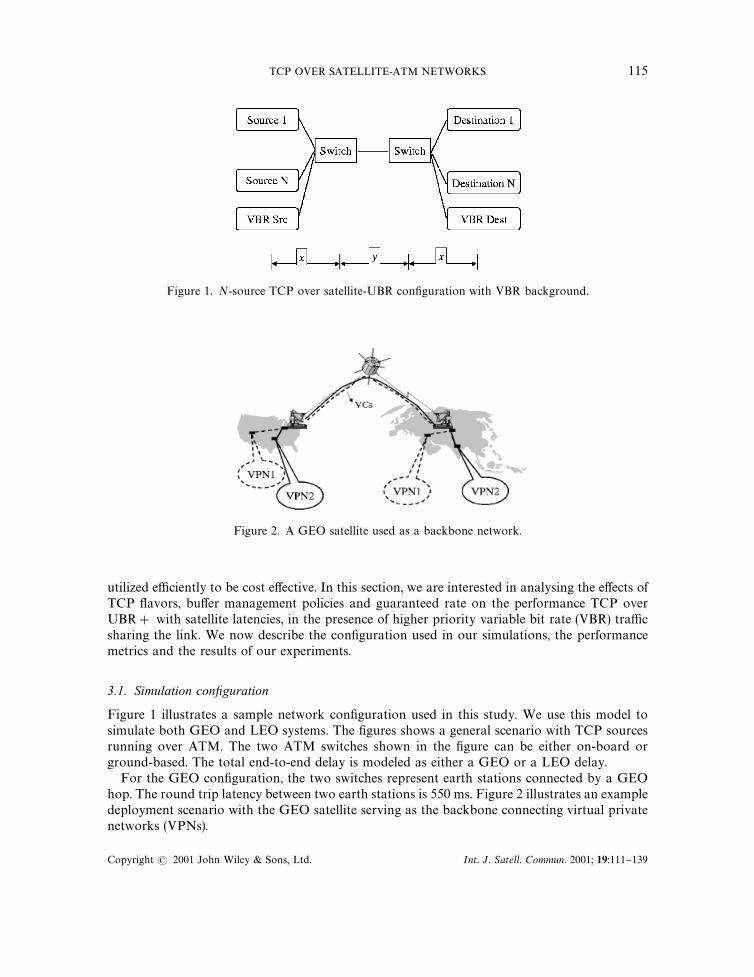
Figure 1. N-source TCP over satellite-UBR con"guration with VBR background.
Figure 2. A GEO satellite used as a backbone network.
utilized e$ciently to be cost e!ective. In this section, we are interested in analysing the e!ects ofTCP #avors, bu!er management policies and guaranteed rate on the performance TCP overUBR# with satellite latencies, in the presence of higher priority variable bit rate (VBR) tra$csharing the link. We now describe the con"guration used in our simulations, the performancemetrics and the results of our experiments.
3.1. Simulation conxguration
Figure 1 illustrates a sample network con"guration used in this study. We use this model tosimulate both GEO and LEO systems. The "gures shows a general scenario with TCP sourcesrunning over ATM. The two ATM switches shown in the "gure can be either on-board orground-based. The total end-to-end delay is modeled as either a GEO or a LEO delay.
For the GEO con"guration, the two switches represent earth stations connected by a GEOhop. The round trip latency between two earth stations is 550 ms. Figure 2 illustrates an exampledeployment scenario with the GEO satellite serving as the backbone connecting virtual privatenetworks (VPNs).
TCP OVER SATELLITE-ATM NETWORKS 115
Copyright ( 2001 John Wiley & Sons, Ltd. Int. J. Satell. Commun. 2001; 19:111}139
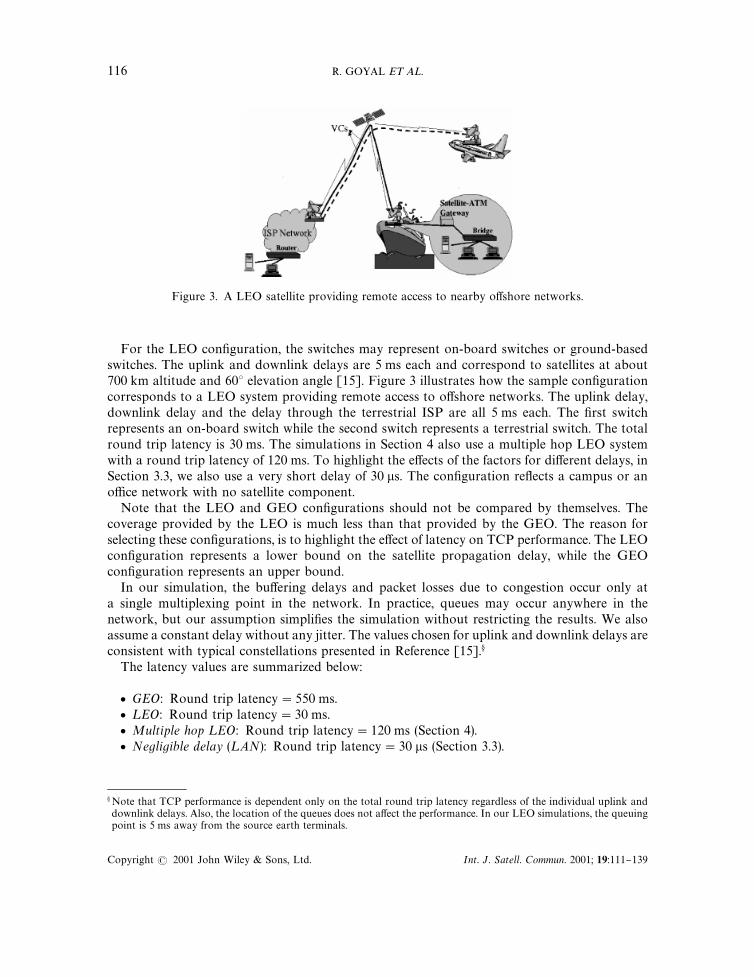
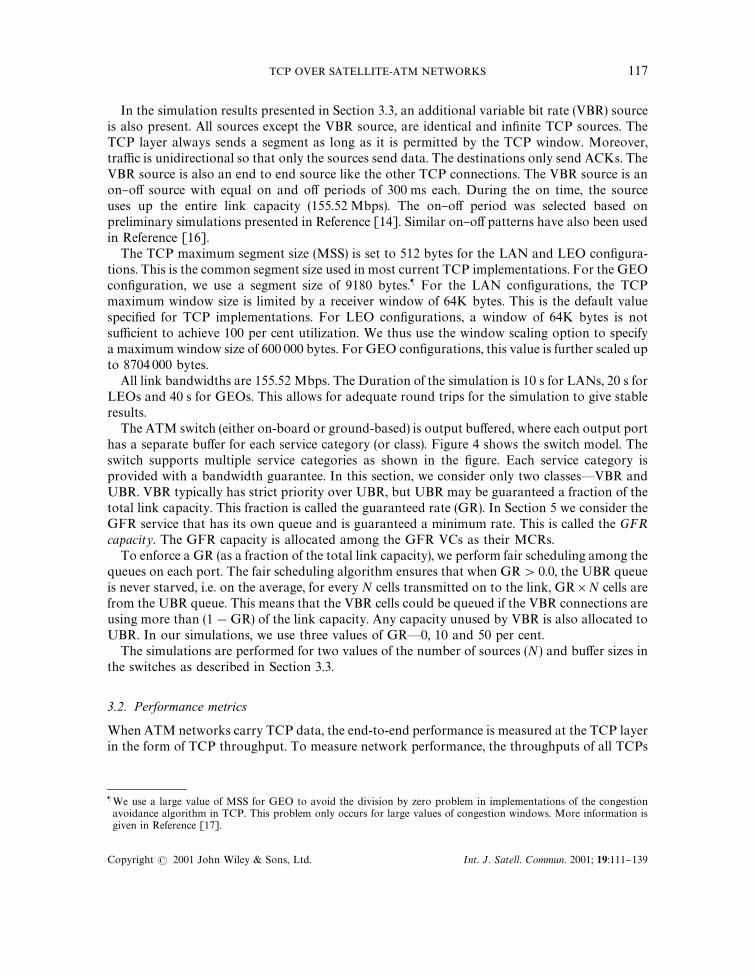
Figure 3. A LEO satellite providing remote access to nearby o!shore networks.
ANote that TCP performance is dependent only on the total round trip latency regardless of the individual uplink anddownlink delays. Also, the location of the queues does not a!ect the performance. In our LEO simulations, the queuingpoint is 5 ms away from the source earth terminals.
For the LEO con"guration, the switches may represent on-board switches or ground-basedswitches. The uplink and downlink delays are 5 ms each and correspond to satellites at about700 km altitude and 603 elevation angle [15]. Figure 3 illustrates how the sample con"gurationcorresponds to a LEO system providing remote access to o!shore networks. The uplink delay,downlink delay and the delay through the terrestrial ISP are all 5 ms each. The "rst switchrepresents an on-board switch while the second switch represents a terrestrial switch. The totalround trip latency is 30 ms. The simulations in Section 4 also use a multiple hop LEO systemwith a round trip latency of 120 ms. To highlight the e!ects of the factors for di!erent delays, inSection 3.3, we also use a very short delay of 30 ls. The con"guration re#ects a campus or ano$ce network with no satellite component.
Note that the LEO and GEO con"gurations should not be compared by themselves. Thecoverage provided by the LEO is much less than that provided by the GEO. The reason forselecting these con"gurations, is to highlight the e!ect of latency on TCP performance. The LEOcon"guration represents a lower bound on the satellite propagation delay, while the GEOcon"guration represents an upper bound.
In our simulation, the bu!ering delays and packet losses due to congestion occur only ata single multiplexing point in the network. In practice, queues may occur anywhere in thenetwork, but our assumption simpli"es the simulation without restricting the results. We alsoassume a constant delay without any jitter. The values chosen for uplink and downlink delays areconsistent with typical constellations presented in Reference [15].A
The latency values are summarized below:
f GEO: Round trip latency"550 ms.f ¸EO: Round trip latency"30 ms.f Multiple hop ¸EO: Round trip latency"120 ms (Section 4).f Negligible delay (¸AN): Round trip latency"30 ls (Section 3.3).
116 R. GOYAL ET AL.
Copyright ( 2001 John Wiley & Sons, Ltd. Int. J. Satell. Commun. 2001; 19:111}139
BWe use a large value of MSS for GEO to avoid the division by zero problem in implementations of the congestionavoidance algorithm in TCP. This problem only occurs for large values of congestion windows. More information isgiven in Reference [17].
In the simulation results presented in Section 3.3, an additional variable bit rate (VBR) sourceis also present. All sources except the VBR source, are identical and in"nite TCP sources. TheTCP layer always sends a segment as long as it is permitted by the TCP window. Moreover,tra$c is unidirectional so that only the sources send data. The destinations only send ACKs. TheVBR source is also an end to end source like the other TCP connections. The VBR source is anon}o! source with equal on and o! periods of 300 ms each. During the on time, the sourceuses up the entire link capacity (155.52 Mbps). The on}o! period was selected based onpreliminary simulations presented in Reference [14]. Similar on}o! patterns have also been usedin Reference [16].
The TCP maximum segment size (MSS) is set to 512 bytes for the LAN and LEO con"gura-tions. This is the common segment size used in most current TCP implementations. For the GEOcon"guration, we use a segment size of 9180 bytes.B For the LAN con"gurations, the TCPmaximum window size is limited by a receiver window of 64K bytes. This is the default valuespeci"ed for TCP implementations. For LEO con"gurations, a window of 64K bytes is notsu$cient to achieve 100 per cent utilization. We thus use the window scaling option to specifya maximum window size of 600 000 bytes. For GEO con"gurations, this value is further scaled upto 8704 000 bytes.
All link bandwidths are 155.52 Mbps. The Duration of the simulation is 10 s for LANs, 20 s forLEOs and 40 s for GEOs. This allows for adequate round trips for the simulation to give stableresults.
The ATM switch (either on-board or ground-based) is output bu!ered, where each output porthas a separate bu!er for each service category (or class). Figure 4 shows the switch model. Theswitch supports multiple service categories as shown in the "gure. Each service category isprovided with a bandwidth guarantee. In this section, we consider only two classes*VBR andUBR. VBR typically has strict priority over UBR, but UBR may be guaranteed a fraction of thetotal link capacity. This fraction is called the guaranteed rate (GR). In Section 5 we consider theGFR service that has its own queue and is guaranteed a minimum rate. This is called the GFRcapacity. The GFR capacity is allocated among the GFR VCs as their MCRs.
To enforce a GR (as a fraction of the total link capacity), we perform fair scheduling among thequeues on each port. The fair scheduling algorithm ensures that when GR'0.0, the UBR queueis never starved, i.e. on the average, for every N cells transmitted on to the link, GR]N cells arefrom the UBR queue. This means that the VBR cells could be queued if the VBR connections areusing more than (1!GR) of the link capacity. Any capacity unused by VBR is also allocated toUBR. In our simulations, we use three values of GR*0, 10 and 50 per cent.
The simulations are performed for two values of the number of sources (N) and bu!er sizes inthe switches as described in Section 3.3.
3.2. Performance metrics
When ATM networks carry TCP data, the end-to-end performance is measured at the TCP layerin the form of TCP throughput. To measure network performance, the throughputs of all TCPs
TCP OVER SATELLITE-ATM NETWORKS 117
Copyright ( 2001 John Wiley & Sons, Ltd. Int. J. Satell. Commun. 2001; 19:111}139
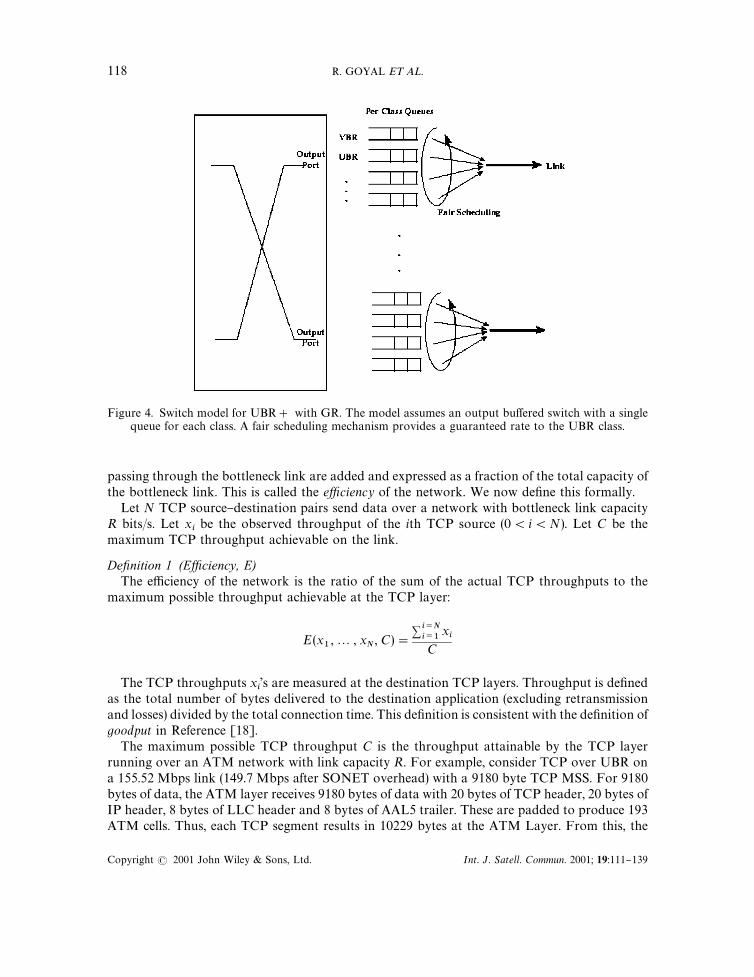
Figure 4. Switch model for UBR# with GR. The model assumes an output bu!ered switch with a singlequeue for each class. A fair scheduling mechanism provides a guaranteed rate to the UBR class.
passing through the bottleneck link are added and expressed as a fraction of the total capacity ofthe bottleneck link. This is called the e.ciency of the network. We now de"ne this formally.
Let N TCP source}destination pairs send data over a network with bottleneck link capacityR bits/s. Let x
ibe the observed throughput of the ith TCP source (0(i(N). Let C be the
maximum TCP throughput achievable on the link.
Dexnition 1 (Ezciency, E)The e$ciency of the network is the ratio of the sum of the actual TCP throughputs to the
maximum possible throughput achievable at the TCP layer:
E (x1,2 , x
N, C)"
+ i/Ni/1
xi
C
The TCP throughputs xi's are measured at the destination TCP layers. Throughput is de"ned
as the total number of bytes delivered to the destination application (excluding retransmissionand losses) divided by the total connection time. This de"nition is consistent with the de"nition ofgoodput in Reference [18].
The maximum possible TCP throughput C is the throughput attainable by the TCP layerrunning over an ATM network with link capacity R. For example, consider TCP over UBR ona 155.52 Mbps link (149.7 Mbps after SONET overhead) with a 9180 byte TCP MSS. For 9180bytes of data, the ATM layer receives 9180 bytes of data with 20 bytes of TCP header, 20 bytes ofIP header, 8 bytes of LLC header and 8 bytes of AAL5 trailer. These are padded to produce 193ATM cells. Thus, each TCP segment results in 10229 bytes at the ATM Layer. From this, the
118 R. GOYAL ET AL.
Copyright ( 2001 John Wiley & Sons, Ltd. Int. J. Satell. Commun. 2001; 19:111}139
maximum possible throughput+9180/10 229+89.7 per cent+135 Mbps. It should be notedthat ATM layer throughput does not necessarily correspond to TCP level throughput, becausesome bandwidth may be wasted during TCP retransmissions.
In addition to providing high overall throughput, the network must also allocate throughputfairly among competing connections. The de"nition of fairness is determined by the particularservice guarantees. For example, although UBR makes not service guarantees, fairness for TCPover UBR can be de"ned as the ability for UBR to provide equal throughput to all greedy TCPconnections. We measure fairness for TCP over a best e!ort service using the fairness index F.
Dexnition 2 (Fairness index, F)The fairness index is a function of the variability of the throughput across the TCP connections
de"ned as
F ((x1, e
1) ,2 , (x
n, e
N))"
(+ i/Ni/1
xi/e
i)2
N]+ i/Ni/1
(xi/e
i)2
where xiis the observed throughput of the ith TCP connection (0(i)N), and e
ithe expected
throughput or fair share for the ith TCP connection.
For a symmetrical con"guration using TCP over UBR, eican be de"ned as an equal share of
the bottleneck link capacity (ei"C/N). Thus, the fairness index metric applies well to N-source
symmetrical con"gurations. In this case, note that when x1"x
2"2"x
nthen fairness in-
dex"1. Also, low values of the fairness index represent poor fairness among the connections. Thedesired values of the fairness index must be close to 1. We consider a fairness index of 0.99 to benear perfect. A fairness index of 0.9 may or may not be acceptable depending on the applicationand the number of sources involved. Also note that the fairness index may not be a good metricfor a small number of connections. Details on the fairness metric can be found in Reference [19].This fairness index has been used in several studies including Reference [18]. In general, fora more complex con"guration, the value of e
ican be derived from a rigorous formulation of
a fairness de"nition that provides max}min fairness to the connections.Due to space constraints, in this paper, we do not present extensive fairness results, but provide
brief discussions of fairness when appropriate. In Reference [12], we provide more comprehensivefairness results and show that with su$cient bu!ers and a large number of TCP sources, goodfairness values are achieved over UBR.
3.3. Analysis technique
In this section, we describe our analysis technique of the e!ects of the following four factors onTCP performance over UBR#:
f Factor A. drop policy: Tail Drop, EPD and SD.f Factor B. ¹CP type: Vanilla, Reno and SACKf Factor C. Bu+er size: Thousand and 3000 cells for LANs, 12 000 and 36 000 cells for LEOs;
and 200 000 and 600 000 cells for GEOs.f Factor D. Guaranteed rate zero, 10 and 50 per cent of the link capacity.
The e!ect of the factors is analysed for three values of the round trip time*30 ls (LAN), 30 ms(LEO) and 550 ms (GEO).
TCP OVER SATELLITE-ATM NETWORKS 119
Copyright ( 2001 John Wiley & Sons, Ltd. Int. J. Satell. Commun. 2001; 19:111}139
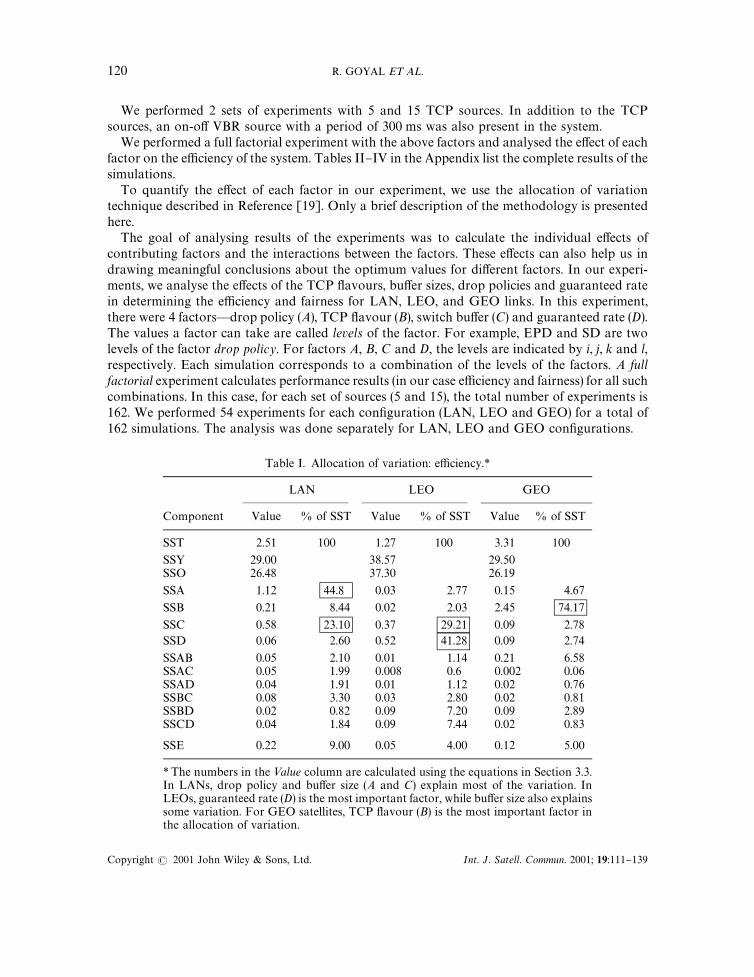
Table I. Allocation of variation: e$ciency.*
LAN LEO GEO
Component Value % of SST Value % of SST Value % of SST
SST 2.51 100 1.27 100 3.31 100
SSY 29.00 38.57 29.50SSO 26.48 37.30 26.19
SSA 1.12 44.8 0.03 2.77 0.15 4.67
SSB 0.21 8.44 0.02 2.03 2.45 74.17
SSC 0.58 23.10 0.37 29.21 0.09 2.78SSD 0.06 2.60 0.52 41.28 0.09 2.74
SSAB 0.05 2.10 0.01 1.14 0.21 6.58SSAC 0.05 1.99 0.008 0.6 0.002 0.06SSAD 0.04 1.91 0.01 1.12 0.02 0.76SSBC 0.08 3.30 0.03 2.80 0.02 0.81SSBD 0.02 0.82 0.09 7.20 0.09 2.89SSCD 0.04 1.84 0.09 7.44 0.02 0.83
SSE 0.22 9.00 0.05 4.00 0.12 5.00
*The numbers in the <alue column are calculated using the equations in Section 3.3.In LANs, drop policy and bu!er size (A and C) explain most of the variation. InLEOs, guaranteed rate (D) is the most important factor, while bu!er size also explainssome variation. For GEO satellites, TCP #avour (B) is the most important factor inthe allocation of variation.
We performed 2 sets of experiments with 5 and 15 TCP sources. In addition to the TCPsources, an on-o! VBR source with a period of 300 ms was also present in the system.
We performed a full factorial experiment with the above factors and analysed the e!ect of eachfactor on the e$ciency of the system. Tables II}IV in the Appendix list the complete results of thesimulations.
To quantify the e!ect of each factor in our experiment, we use the allocation of variationtechnique described in Reference [19]. Only a brief description of the methodology is presentedhere.
The goal of analysing results of the experiments was to calculate the individual e!ects ofcontributing factors and the interactions between the factors. These e!ects can also help us indrawing meaningful conclusions about the optimum values for di!erent factors. In our experi-ments, we analyse the e!ects of the TCP #avours, bu!er sizes, drop policies and guaranteed ratein determining the e$ciency and fairness for LAN, LEO, and GEO links. In this experiment,there were 4 factors*drop policy (A), TCP #avour (B), switch bu!er (C) and guaranteed rate (D).The values a factor can take are called levels of the factor. For example, EPD and SD are twolevels of the factor drop policy. For factors A, B, C and D, the levels are indicated by i, j, k and l,respectively. Each simulation corresponds to a combination of the levels of the factors. A fullfactorial experiment calculates performance results (in our case e$ciency and fairness) for all suchcombinations. In this case, for each set of sources (5 and 15), the total number of experiments is162. We performed 54 experiments for each con"guration (LAN, LEO and GEO) for a total of162 simulations. The analysis was done separately for LAN, LEO and GEO con"gurations.
120 R. GOYAL ET AL.
Copyright ( 2001 John Wiley & Sons, Ltd. Int. J. Satell. Commun. 2001; 19:111}139

We assume an additive model given by the following equation:
y"k#ai#b
j#f
k#d
l#c
ij#c
ik#c
il#c
jk#c
jl#c
kl#c
ijk#c
ikl#c
jkl#c
ijkl#e
ijkl
where i, j, k and l are the levels of factors A, B, C and D, respectively.The model (y) consists of the sum of the mean response (k), 4 main e!ects (a
i, b
j, f
kand d
l),
6 "rst-order interactions (cij, c
ik, c
il, c
jk, c
jland c
kl), 3 second-order interactions (c
ijk, c
ikl, c
jkland
cijkl
), 1 third-order interaction (cijkl
) and an experimental error term (eijkl
). We assume that only"rst-order interactions are signi"cant; second- and third-order interactions are ignored.
We calculate the following quantities (see Table I):
Observation or response (yijkl
): This is the e$ciency or fairness from an experiment with thelevels of individual factors as i, j, k and l, respectively.
Sum of squares of responses (SSY): This is the sum of squares of the individual results above.Sum of squares of the overall mean (SSO): This consists of the calculation of the overall mean, yN ,
of the results yijkl
and multiplying its square by the total number of experiments.¹otal variation (SST): This represents the variation in the result values (e$ciency or fairness)
around the overall mean
SST"SSY!SSO
Sum of squares of main e+ects (SSA SSB, SSC, SSD): The main e!ects (ai, b
j, f
kand d
l) are the
individual contributions of a level of each factor (A, B, C and D) to the overall result. A particularmain e!ect is associated with a level of a factor and indicates how much variation around theoverall mean is caused by the level:
ai"yN
.jkl!k
bj"yN
i.kl!k
fk"yN
ij.l!k
dl"yN
ijk.!k
SSA"bcd]+i
a2i
SSB"acd]+j
b2j
SSC"abd]+k
f2k
SSD"abc]+l
d2l
where a, b, c and d are the number of levels of factors A, B, C and D, respectively.
TCP OVER SATELLITE-ATM NETWORKS 121
Copyright ( 2001 John Wiley & Sons, Ltd. Int. J. Satell. Commun. 2001; 19:111}139
First-order interactions (SSAB, SSAC, etc.): These are the interactions between levels of twofactors. In the example, there are "rst order interactions between each TCP #avour and bu!ersize, between each drop policy and TCP #avour, between each bu!er size and drop policy, TCP#avour and guaranteed rate and so on. For example, the "rst-order interaction term betweendrop policy (A) and TCP #avour (B) is given by
cij"yN
ij..!yN
i...!yN
.j..!k
SSAB"cd]+i,j
(cij)2
Sum of squares of overall standard error (SSE): This represents the experimental error asso-ciated with each result value. The overall standard error is also used in the calculation of thecon"dence intervals for each e!ect:
SSE"SSY!SSO!SSA!SSB!SSC!SSD!SSAB!SSAC
!SSAD!SSBC!SSBD!SSCD
Allocation of variation: This is used to explain how much each e!ect contributes to the totalvariation (SST):
SST"SSA#SSB#SSC#SSD#SSAB#SSAC
#SSAD#SSBC#SSBD#SSCD#SSE
Each term on the right of the above equation contributes to the total variation. An e!ect (a factoror interaction), which explains a large fraction of the total variation, is said to be important.
Con,dence intervals for main e+ects: The 90 per cent con"dence intervals for each main e!ectare calculated. If a con"dence interval contains 0, then the corresponding level of the factor is notstatistically signi"cant. If con"dence intervals of two levels overlap, then the e!ects of both levelsare assumed to be similar.
3.4. Results and discussion
Table I shows the results of the allocation of variation for e$ciency. The results show that themodel is applicable to e$ciency because most of the variation is explained by the main e!ects andthe interactions.
For LAN, the most important factors are the drop policy that explains 44 per cent of thevariation and the bu!er size that explains 23 per cent of the variation. The results show that largebu!er sizes with selective drop produce the best e$ciency. For LEO, the most important factorsare the bu!er size (41 per cent of variation) and the TCP type (29 per cent of variation). Largebu!er and SACK produce the best performance. For GEO, TCP type is the most importantfactor (explains 74 per cent of the variation). SACK provides the best performance. Theinteractions between the factors are insigni"cant.
122 R. GOYAL ET AL.
Copyright ( 2001 John Wiley & Sons, Ltd. Int. J. Satell. Commun. 2001; 19:111}139

Figure 5. LEO: guaranteed rate versus TCP.
Figure 6. LEO: guaranteed rate versus bu!er size.
Figure 5 shows the relative e!ects of GR and TCP mechanisms on the e$ciency for 30 ms RTT.Each point in the "gure represents the e$ciency value averaged over all the other factors above(number of sources, bu!er size and switch drop policy). The "gure illustrates that in the presenceof high-priority tra$c, the e!ect of TCP for smaller round trip times is largely inconsequential.The key determinant is the amount of constant bandwidth allocated to the TCP tra$c. Even a10 per cent bandwidth reservation can increase the overall throughput by about 25 per cent.
Figure 6 shows the relative e!ects of GR and bu!er size on LEO e$ciency. Each point inthe "gure represents the e$ciency value averaged over all the other factors (number of sources,drop policy and TCP mechanism). A 10 per cent GR allocation increases the e$ciency by about20 per cent. A larger bu!er size (36K cells) along with 10 per cent GR can provide high e$ciency.
Figure 7 illustrates the corresponding result for GEO delays. The e!ect of GR is insigni"cantrelative to the e!ect of TCP. Reno performs very poorly, while SACK performs the best.
From the analysis, the following results can be summarized for TCP over UBR# with GR inthe presence of high priority background tra$c.
Result 1 (LAN (30 ks))For LANs, the dominating factors that a!ect the performance are the switch drop policy and
the bu!er size.
TCP OVER SATELLITE-ATM NETWORKS 123
Copyright ( 2001 John Wiley & Sons, Ltd. Int. J. Satell. Commun. 2001; 19:111}139
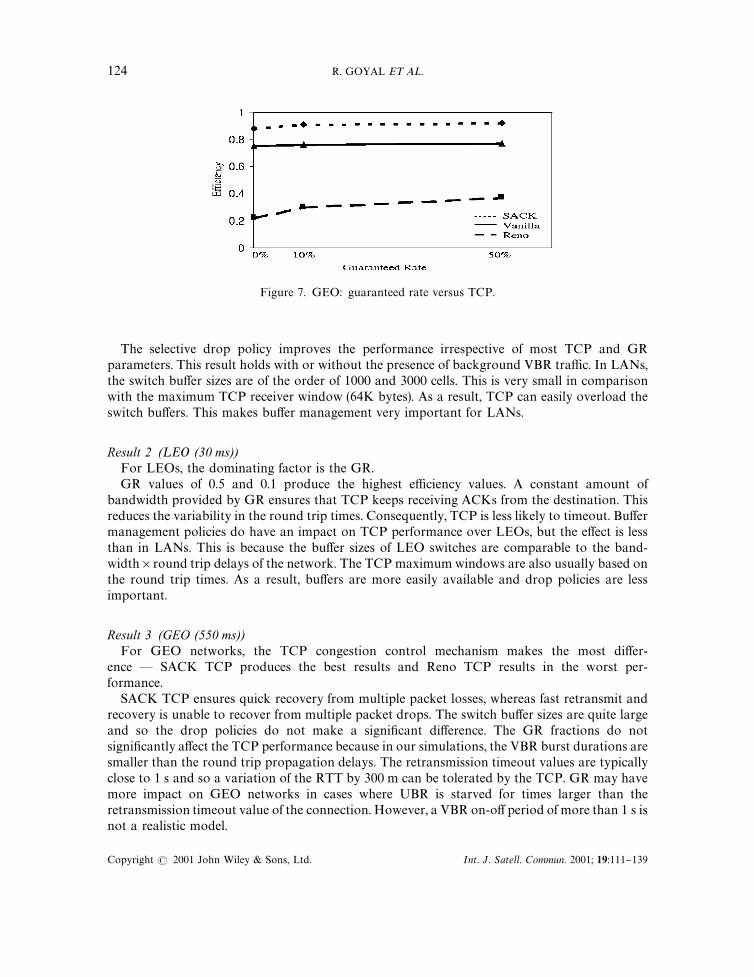
Figure 7. GEO: guaranteed rate versus TCP.
The selective drop policy improves the performance irrespective of most TCP and GRparameters. This result holds with or without the presence of background VBR tra$c. In LANs,the switch bu!er sizes are of the order of 1000 and 3000 cells. This is very small in comparisonwith the maximum TCP receiver window (64K bytes). As a result, TCP can easily overload theswitch bu!ers. This makes bu!er management very important for LANs.
Result 2 (¸EO (30 ms))For LEOs, the dominating factor is the GR.GR values of 0.5 and 0.1 produce the highest e$ciency values. A constant amount of
bandwidth provided by GR ensures that TCP keeps receiving ACKs from the destination. Thisreduces the variability in the round trip times. Consequently, TCP is less likely to timeout. Bu!ermanagement policies do have an impact on TCP performance over LEOs, but the e!ect is lessthan in LANs. This is because the bu!er sizes of LEO switches are comparable to the band-width]round trip delays of the network. The TCP maximum windows are also usually based onthe round trip times. As a result, bu!ers are more easily available and drop policies are lessimportant.
Result 3 (GEO (550 ms))For GEO networks, the TCP congestion control mechanism makes the most di!er-
ence * SACK TCP produces the best results and Reno TCP results in the worst per-formance.
SACK TCP ensures quick recovery from multiple packet losses, whereas fast retransmit andrecovery is unable to recover from multiple packet drops. The switch bu!er sizes are quite largeand so the drop policies do not make a signi"cant di!erence. The GR fractions do notsigni"cantly a!ect the TCP performance because in our simulations, the VBR burst durations aresmaller than the round trip propagation delays. The retransmission timeout values are typicallyclose to 1 s and so a variation of the RTT by 300 m can be tolerated by the TCP. GR may havemore impact on GEO networks in cases where UBR is starved for times larger than theretransmission timeout value of the connection. However, a VBR on-o! period of more than 1 s isnot a realistic model.
124 R. GOYAL ET AL.
Copyright ( 2001 John Wiley & Sons, Ltd. Int. J. Satell. Commun. 2001; 19:111}139

4. BUFFER REQUIREMENTS FOR TCP OVER SATELLITE-UBR#
Previous studies have shown that small switch bu!er sizes can result low TCP throughput overUBR [6]. It is also clear, that the bu!er requirements increase with increasing delay}bandwidthproduct of the connections (provided the TCP window can "ll up the pipe). However, the studieshave not quantitatively analysed the e!ect of bu!er sizes on performance. As a result, it is not clearhow the increase in bu+ers a+ects throughput and what bu+er sizes provide the best cost}perfor-mance bene,ts for ¹CP over;BR#. In this section, we present simulation experiments to assessthe bu!er requirements for three satellite delay}bandwidth products for TCP over UBR#.
4.1. Simulation parameters
In this experiment, we use the N-source con"guration without the VBR source. We study thee!ects of the following factors:
f Round trip latency: We use three round trip values: 550 ms (GEO), 120 ms (multiple hopLEO), and 30 ms (single LEO).
f Number of sources: To ensure that the results are scalable and general with respect to thenumber of connections, we will use con"gurations with 5, 15 and 50 TCP connections ona single bottleneck link. For the single-hop LEO con"guration, we use 15, 50 and 100sources.
f Bu+er size: This is the most important parameter of this study. The set of values chosen are2~k]round trip time (RTT), k"!1,2 , 6 (i.e. 2, 1, 0.5, 0.25, 0.125, 0.0625, 0.031 and 0.016multiples of the round trip delay}bandwidth product of the TCP connections).
The bu!er sizes (in cells) used in the switch are the following:
* ¸EO (30 ms): 375, 750, 1500, 6K, 12K ("1 RTT), 24K and 36K.* Multiple ¸EO (120 ms): 780, 1560, 3125, 6250, 12.5K, 50K ("1 RTT) and 100K.* GEO (550 ms): 3375, 6750, 12 500, 25K, 50K, 100K, 200K ("1 RTT) and 400K.
f Switch drop policy and ¹CP policy: To restrict the number of factors, we analyse the best casescenario by using selective drop and TCP SACK as the drop policy and the TCP policy,respectively.
All other parameters are the same as before. We plot the bu!er size against the achieved TCPthroughput for di!erent delay}bandwidth products and numbers of sources. The asymptoticnature of this graph provides information about the optimal bu!er size for the bestcost}performance ratio.
4.2. Results and discussion
Figures 8}10 show the resulting TCP e$ciencies for the 3 di!erent latencies. Each point in the"gure shows the e$ciency (total achieved TCP throughput divided by maximum possiblethroughput) against the bu!er size used. Each "gure plots a di!erent latency and each set ofpoints (connected by a line) in a "gure represents a particular value of N (the number of sources).
For very small bu!er sizes, (0.016]RTT, 0.031]RTT, 0.0625]RTT), the resulting TCPthroughput is very low. In fact, for a large number of sources (N"50), the throughput issometimes close to zero. For moderate bu!er sizes (less than 1 round trip delay}bandwidth), TCP
TCP OVER SATELLITE-ATM NETWORKS 125
Copyright ( 2001 John Wiley & Sons, Ltd. Int. J. Satell. Commun. 2001; 19:111}139
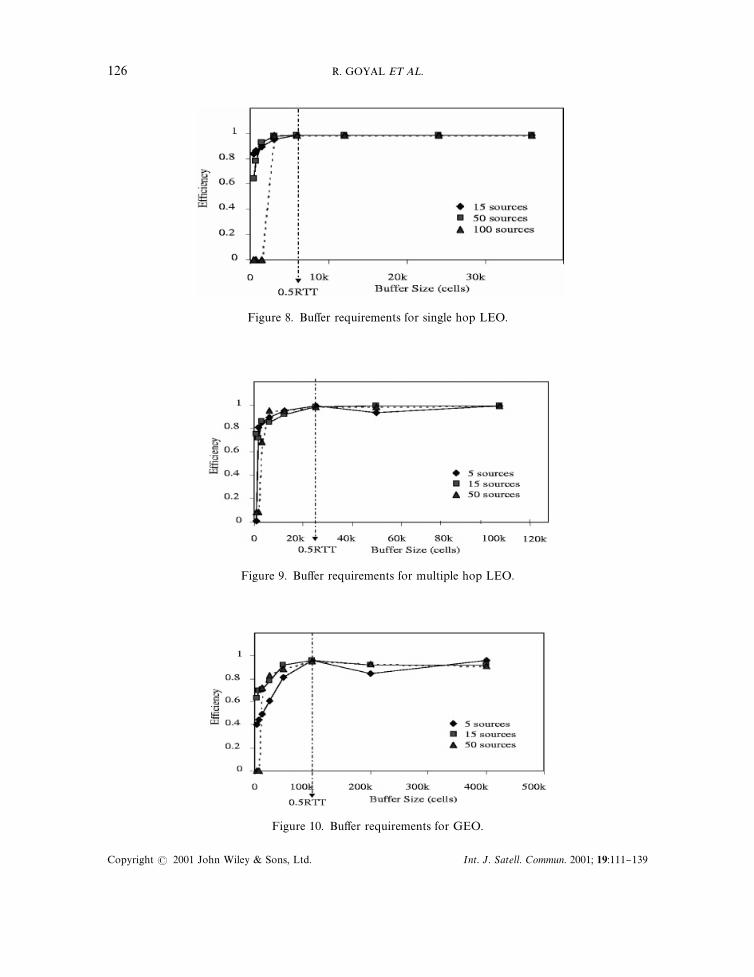
Figure 8. Bu!er requirements for single hop LEO.
Figure 9. Bu!er requirements for multiple hop LEO.
Figure 10. Bu!er requirements for GEO.
126 R. GOYAL ET AL.
Copyright ( 2001 John Wiley & Sons, Ltd. Int. J. Satell. Commun. 2001; 19:111}139

throughput increases with increasing bu!er sizes. TCP throughput asymptotically approachesthe maximal value with further increase in bu!er sizes. TCP performance over UBR forsu$ciently large bu!er sizes is scalable with respect to the number of TCP sources. Thethroughput is never 100 per cent, but for bu!ers greater than 0.5]RTT, the average TCPthroughput is over 98 per cent irrespective of the number of sources. Fairness (not shown here) ishigh for a large number of sources. This shows that TCP sources with a good per-VC bu!erallocation policy like selective drop, can e!ectively share the link bandwidth.
The knee of the bu!er versus throughput graph is more pronounced for larger number ofsources. For a large number of sources, TCP performance is very poor for small bu!ers, butjumps dramatically with su$cient bu!ering and then stays about the same. For smaller numberof sources, the increase in throughput with increasing bu!ers is more gradual.
The optimal bu!er size from the graphs is about one-half of the round trip delay}bandwidthproduct of the network. Intuitively, this result can be explained as follows. The network capacityis determined by the product of the bottleneck bandwidth and the round trip delay. Duringsteady state, all the TCPs share this bottleneck capacity by adjusting their window sizes, such thatthe sum of the TCP windows equals the round trip bandwidth}delay product of the network.Thus, at any given time, the total sequence number space of outstanding TCP segments is limitedby this number. If we assume a steady #ow of packets and ACKs, then at any given time, one-halfof the outstanding sequence space is in the form of packets travelling in the forward direction,while the other half is in the form of ACKs travelling in the opposite direction. If all the segmentsarrive at the bottleneck at about the same time, the queue at the bottleneck must be able to bu!erall these packets. Thus, 0.5RTT]bandwidth product worth of bu!er provides good TCPperformance. In the worst case, the TCP tra$c could be highly bursty and the ACKs could be outof phase with the segments. All sources would send the entire window of packets and wait for allthe ACKs to arrive before sending another window. In this case, the bu!er requirements would beequal to the sum of all the TCP maximum window sizes.
For large round trip delays and a small number of sources, a bu!er of 1 RTT or more can resultin a slightly reduced throughput (see Figures 9 and 10). In our simulations, we see more timeoutswith these bu!er sizes. This is because of the variability in the TCP retransmission timer value.When the round trip is of the order of the TCP timer granularity (100 ms in this experiment) andthe queuing delay is also of the order of the round trip time, the retransmission timeout valuesbecome very variable. This may result in false timeouts and retransmissions thus reducingthroughput. The e!ect is more pronounced for a small number a sources because after a timeout,their windows must reach a large value to achieve full network capacity. With more connections,smaller individual windows are enough to "ll the pipe. The extra time it takes for the windows toincrease to full capacity results in the loss of throughput.
Result 4 (Buwer requirements)The simulations show that a bu!er size of 0.5RTT at the bottleneck provides high e$ciency
and fairness to TCPs over UBR# for satellite networks.
5. BUFFER MANAGEMENT FOR GUARANTEED FRAME RATE OVER SATELLITE
The enhancements to TCP over UBR can provide high throughput to TCP connections oversatellite networks. However, UBR does not provide any guarantees to its VCs. The service
TCP OVER SATELLITE-ATM NETWORKS 127
Copyright ( 2001 John Wiley & Sons, Ltd. Int. J. Satell. Commun. 2001; 19:111}139
received by UBR connection is implementation-dependent. Service guarantees may be usefulfor a satellite-ATM network connecting multiple network clouds of Virtual Private Networks.It may be desirable to provide minimum rate guarantees to VCs of each VPN. Per-VCminimum rate guarantees can be implemented using either the guaranteed frame rate(GFR) service or the available bit rate (ABR) service. In this section we will describehow to implement per-VC minimum rate guarantees for the GFR service over satellitenetworks.
Guaranteed frame rate provides a minimum rate guarantee to VCs and allows for the fairusage of any extra network bandwidth. GFR is a frame-based service and uses AAL5 whichenables frame boundaries to be visible at the ATM layer. The service requires the speci"cationof a maximum frame size (MFS) of the VC. If the user sends packets (or frames) smaller thanthe maximum frame size, at a rate less than the minimum cell rate (MCR), then all the packetsare expected to be delivered by the network with minimum loss. If the user sends packets at arate higher than the MCR, it should still receive at least the minimum rate. A leaky bucket-like mechanism called Frame-GCRA is used to determine if a frame is eligible for MCRguarantees. Such frame are called QoS eligible. The minimum rate is guaranteed to the CLP"0frames of the connection. In addition, a connection sending in excess of the minimum rate shouldreceive a fair share of any unused network capacity. The exact speci"cation of the fair share hasbeen left unspeci"ed by the ATM Forum.
GFR requires minimum signaling and connection management functions and depends onthe network's ability to provide a minimum rate to each VC. GFR is likely to be used byapplications that can neither specify the tra$c parameters needed for a VBR VC, nor havecapability for ABR (for rate-based feedback control). Current internetworking applicationsfall into this category and are not designed to run over QoS-based networks. These applicationscould bene"t from a minimum rate guarantee by the network, along with an opportunity to fairlyuse any additional bandwidth left over from higher priority connections. The detailed GFRspeci"cation is provided in Reference [20], but the above discussion captures the essence ofthe service.
A desirable implementation of GFR is to use a single queue for all GFR VCs and provideminimum rate guarantees by means of intelligent bu!er management policies on the FIFO [20].Several proposals have been made [21,22] to provide rate guarantees to TCP sources with FIFOqueuing in the network. The bursty nature of TCP tra$c makes it di$cult to provide per-VC rateguarantees using FIFO queuing. In these proposals, per-VC queuing and scheduling wererecommended to provide rate guarantees to TCP connections. However, all these studies wereperformed at high-target network utilization, i.e. most of the network capacity was allocated tothe MCRs. The designers of the GFR service have intended to allocate MCRs conservatively.Moreover, these proposals are very aggressive in dropping TCP packets causing TCP to timeoutand lose throughput. All the above studies have examined TCP tra$c with a single TCP per VC.However, routers that use GFR VCs, will multiplex many TCP connections over a single VC. ForVCs with several aggregated TCPs, per-VC control is unaware of each TCP in the VC. Moreover,aggregate TCP tra$c characteristics and control requirements may be di!erent from those ofsingle TCP streams.
In the next subsection, we will brie#y describe a bu!er management policy called di!erentialfair bu!er allocation (DFBA) that provides per-VC minimum rate guarantees. We present theperformance of DFBA for LEO and GEO systems. A complete analysis of DFBA for terrestrialnetworks is presented in Reference [23].
128 R. GOYAL ET AL.
Copyright ( 2001 John Wiley & Sons, Ltd. Int. J. Satell. Commun. 2001; 19:111}139
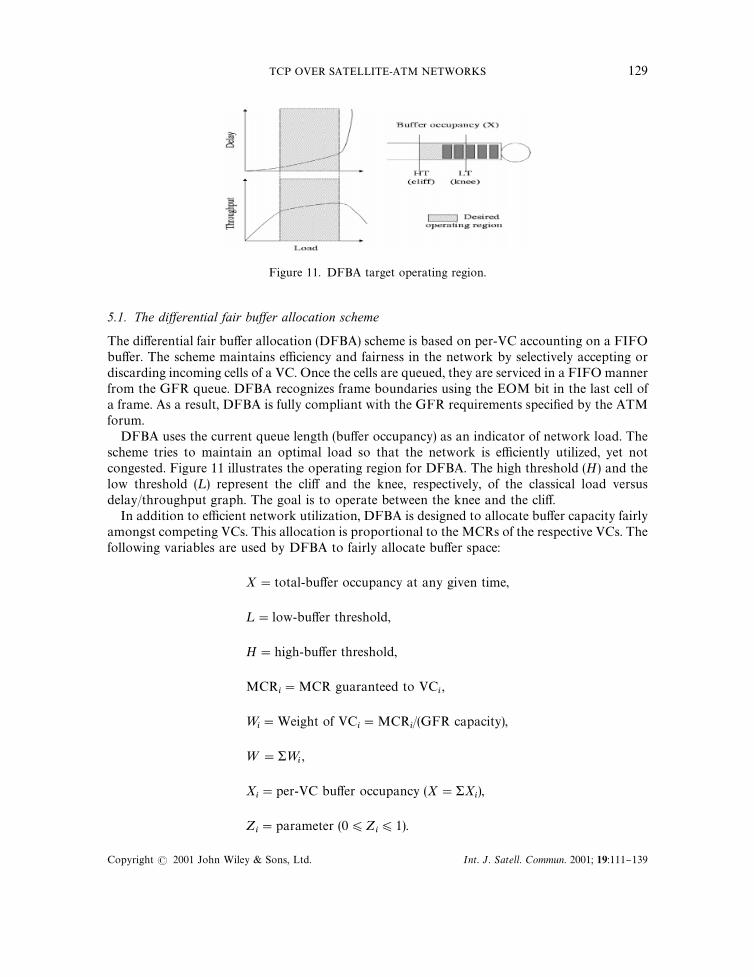
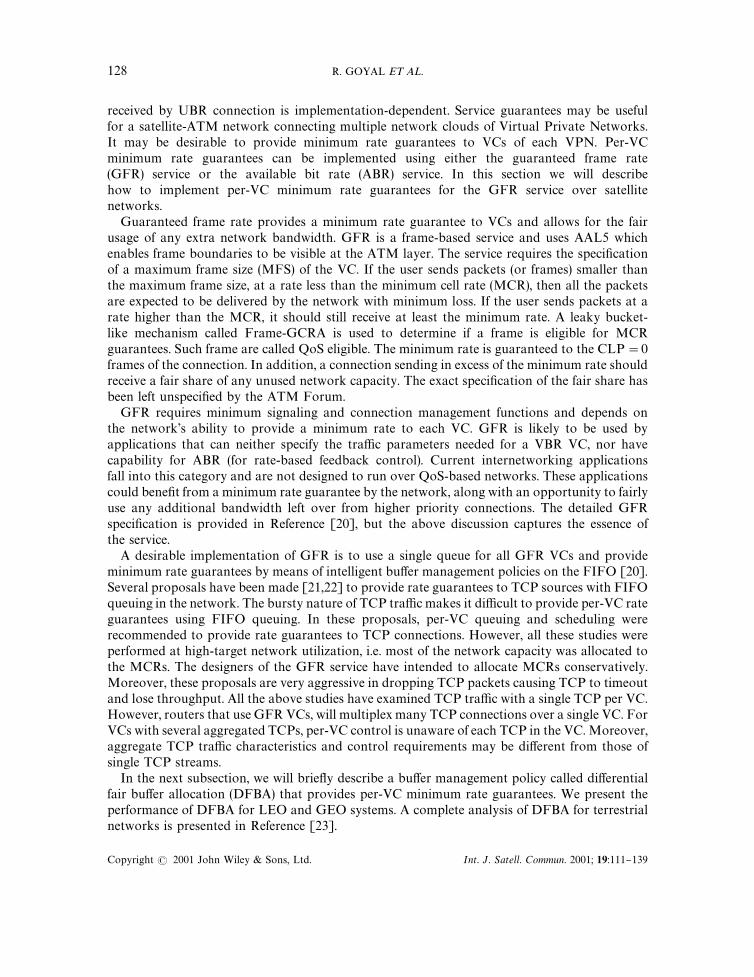
Figure 11. DFBA target operating region.
5.1. The diwerential fair buwer allocation scheme
The di!erential fair bu!er allocation (DFBA) scheme is based on per-VC accounting on a FIFObu!er. The scheme maintains e$ciency and fairness in the network by selectively accepting ordiscarding incoming cells of a VC. Once the cells are queued, they are serviced in a FIFO mannerfrom the GFR queue. DFBA recognizes frame boundaries using the EOM bit in the last cell ofa frame. As a result, DFBA is fully compliant with the GFR requirements speci"ed by the ATMforum.
DFBA uses the current queue length (bu!er occupancy) as an indicator of network load. Thescheme tries to maintain an optimal load so that the network is e$ciently utilized, yet notcongested. Figure 11 illustrates the operating region for DFBA. The high threshold (H) and thelow threshold (¸) represent the cli! and the knee, respectively, of the classical load versusdelay/throughput graph. The goal is to operate between the knee and the cli!.
In addition to e$cient network utilization, DFBA is designed to allocate bu!er capacity fairlyamongst competing VCs. This allocation is proportional to the MCRs of the respective VCs. Thefollowing variables are used by DFBA to fairly allocate bu!er space:
X"total-bu!er occupancy at any given time,
¸"low-bu!er threshold,
H"high-bu!er threshold,
MCRi"MCR guaranteed to VC
i,
=i"Weight of VC
i"MCR
i/(GFR capacity),
="&=i,
Xi"per-VC bu!er occupancy (X"&X
i),
Zi"parameter (0)Z
i)1).
TCP OVER SATELLITE-ATM NETWORKS 129
Copyright ( 2001 John Wiley & Sons, Ltd. Int. J. Satell. Commun. 2001; 19:111}139
Figure 12. DFBA drop regions.
DFBA maintains the total bu!er occupancy (X) between ¸ and H. When X falls below ¸, thescheme attempts to bring the system to e$cient utilization by accepting all incoming packets.When X rises above H, the scheme tries to control congestion by performing EPD. When X isbetween ¸ and H, DFBA attempts to allocate bu!er space in proportional to the MCRs, asdetermined by the =
ifor each VC. When X is between ¸ and H, the scheme also drops low
priority (CLP"1) packets so as to ensure that su$cient bu!er occupancy is available forCLP"0 packets.
Figure 12 illustrates the four operating regions of DFBA. The graph shows a plot of the currentbu!er occupancy X versus the normalized fair bu!er occupancy (XM
i) for VC
i. If VC
ihas a weight
=i, then its target bu!er occupancy (X
i) should be X]=
i/=. Thus, the normalized bu!er
occupancy of VCican be de"ned as XM
i"X
i]=/=
i. The goal is to keep XM
ias close to X as
possible, as indicated by the solid y"x line in the graph. Region 1 is the underload region, inwhich the current bu!er occupancy is less than the low threshold ¸. In this case, the scheme triesto improve e$ciency. Region 2 is the region with mild congestion because X is above ¸. Asa result, any incoming packets with CLP"1 are dropped. Region 2 also indicates that VC
ihas
a larger bu!er occupancy than its fair share (since Xi'X]=
i/=). As a result, in this region, the
scheme drops some incoming CLP"0 packets of VCi, as an indication to the VC that it is using
more than its fair share. In region 3, there is mild congestion, but VCi's bu!er occupancy is below
its fair share. As a result, only CLP"1 packets of a VC are dropped when the VC is in region 3.Finally, region 4 indicates severe congestion and EPD is performed here.
In region 2, the packets of VCiare dropped in a probabilistic manner. This drop behaviour is
controlled by the drop probability function PMdropN. This is further discussed below.The probability for dropping packets from a VC when it is in region 2 can be based on several
factors. Probabilistic drop is used by several schemes including RED [24] and FRED [25]. Thepurpose of probabilistic drop is to notify TCP of congestion so that TCP backs o! withouta timeout. An aggressive drop policy will result in a TCP timeout. Di!erent drop probabilityfunctions have di!erent e!ects on TCP behaviour. In general, a simple probability function canuse RED-like drop, while a more complex function can depend on all the variables de"nedabove. The drop probability used in our simulations is described in detail in Reference [23]and is given by
PMdropN"Zi]Aa]
Xi!X]=
i/=
X](1!=i/=)
#(1!a)X!¸
H!¸B
130 R. GOYAL ET AL.
Copyright ( 2001 John Wiley & Sons, Ltd. Int. J. Satell. Commun. 2001; 19:111}139
E The "gure only shows two pairs of local switches, but our simulations had 5.
For satellite latencies, an important parameter in this equation is Zi. It has been shown [26]
that for a given TCP connection, a higher packet loss rate results in a lower average TCP window.As a result, a higher drop probability also results in a lower TCP window. In fact, it has beenshown [26], that for random packet loss, the average TCP window size is inversely proportionalto the square root of the packet loss probability. As a result, the average TCP data rate D isgiven by
DJ
MSS
RTTJPMdropN
The date rate is, in fact, determined by the window size and the RTT of the connection. Tomaintain a high data rate, the desired window size should be large. As a result, the dropprobability should be small. Similarly when the RTT is large, a larger window is needed tosupport the same date rate (since the delay}bandwidth product increases). As a result, a smallerdrop rate should be used. DFBA can be tuned to choose a small Z
ifor large latency VCs, as in the
case of switches connected to satellite hops, or for VCs with high MCRs. The inherent limitationof any satellite management scheme that depends only on local state is seen here. In general, theswitch does not know the RTT of a VC. The switch must estimate a connection's RTT using localstate such as the propagation delay of its outgoing links. In case of satellite switches, thispropagation delay is likely to be the dominant delay in the VCs path. As a result, the local stateprovides a pretty good estimate of the total delay. Terrestrial switches are limited in this respect.This limitation is also discussed in Reference [18].
Another potential limitation of any such scheme is that the granularity of fairness is limited bythe granularity of #ows. The fairness is guaranteed between VCs but not within the TCPs of eachVC. This limitation is not only peculiar to ATM but also to IP. IP routers typically de"ne #owsaccording to IP address or network address source}destination pairs. TCP/UDP port levelgranularities are not a scalable solution for backbone networks. As as result, the TCP connec-tions within an IP #ow su!er the same kind of unfairness as TCP connections within ATM VCs.However, the probabilistic drop randomizes the packets dropped within a VC. Thus, the schemecan maintain RED like fairness among the TCPs within a VC. This can be accomplished by usinga RED-like drop probability.
5.2. Simulation results
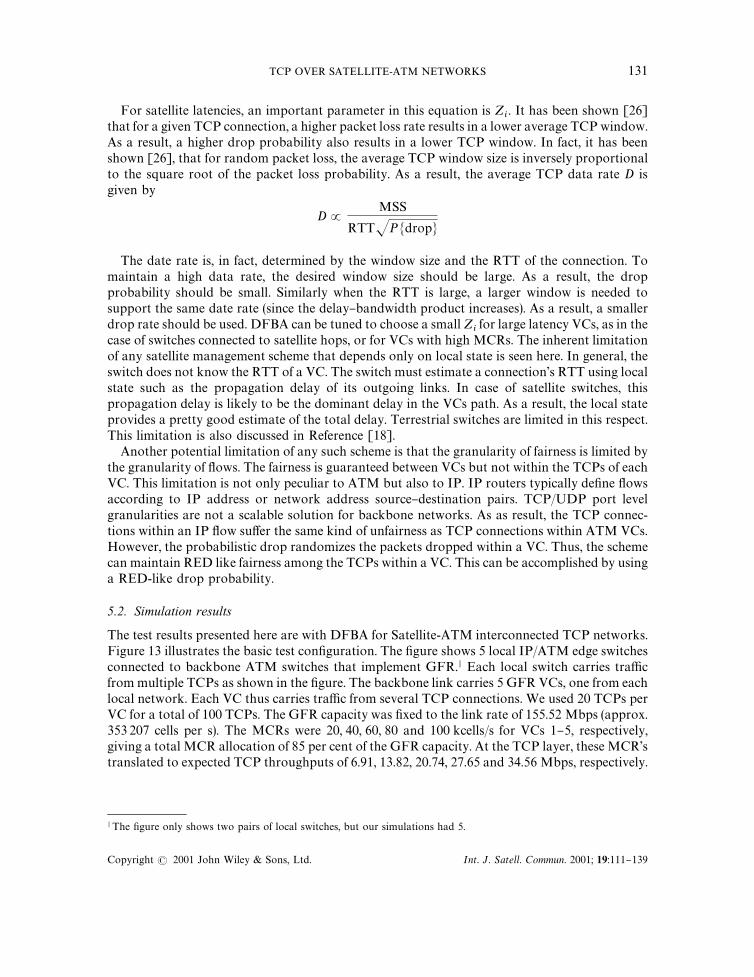
The test results presented here are with DFBA for Satellite-ATM interconnected TCP networks.Figure 13 illustrates the basic test con"guration. The "gure shows 5 local IP/ATM edge switchesconnected to backbone ATM switches that implement GFR.E Each local switch carries tra$cfrom multiple TCPs as shown in the "gure. The backbone link carries 5 GFR VCs, one from eachlocal network. Each VC thus carries tra$c from several TCP connections. We used 20 TCPs perVC for a total of 100 TCPs. The GFR capacity was "xed to the link rate of 155.52 Mbps (approx.353 207 cells per s). The MCRs were 20, 40, 60, 80 and 100 kcells/s for VCs 1}5, respectively,giving a total MCR allocation of 85 per cent of the GFR capacity. At the TCP layer, these MCR'stranslated to expected TCP throughputs of 6.91, 13.82, 20.74, 27.65 and 34.56 Mbps, respectively.
TCP OVER SATELLITE-ATM NETWORKS 131
Copyright ( 2001 John Wiley & Sons, Ltd. Int. J. Satell. Commun. 2001; 19:111}139
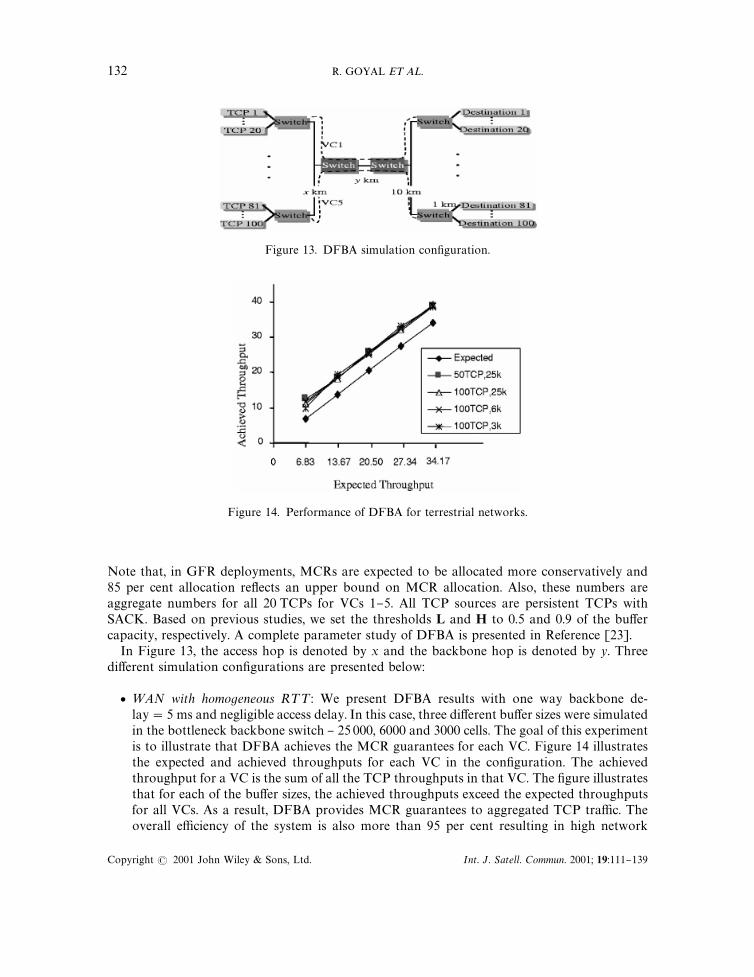
Figure 13. DFBA simulation con"guration.
Figure 14. Performance of DFBA for terrestrial networks.
Note that, in GFR deployments, MCRs are expected to be allocated more conservatively and85 per cent allocation re#ects an upper bound on MCR allocation. Also, these numbers areaggregate numbers for all 20 TCPs for VCs 1}5. All TCP sources are persistent TCPs withSACK. Based on previous studies, we set the thresholds L and H to 0.5 and 0.9 of the bu!ercapacity, respectively. A complete parameter study of DFBA is presented in Reference [23].
In Figure 13, the access hop is denoted by x and the backbone hop is denoted by y. Threedi!erent simulation con"gurations are presented below:
f =AN with homogeneous R¹¹: We present DFBA results with one way backbone de-lay"5 ms and negligible access delay. In this case, three di!erent bu!er sizes were simulatedin the bottleneck backbone switch } 25 000, 6000 and 3000 cells. The goal of this experimentis to illustrate that DFBA achieves the MCR guarantees for each VC. Figure 14 illustratesthe expected and achieved throughputs for each VC in the con"guration. The achievedthroughput for a VC is the sum of all the TCP throughputs in that VC. The "gure illustratesthat for each of the bu!er sizes, the achieved throughputs exceed the expected throughputsfor all VCs. As a result, DFBA provides MCR guarantees to aggregated TCP tra$c. Theoverall e$ciency of the system is also more than 95 per cent resulting in high network
132 R. GOYAL ET AL.
Copyright ( 2001 John Wiley & Sons, Ltd. Int. J. Satell. Commun. 2001; 19:111}139

Figure 15. Performance of DFBA for LEO access.
Figure 16. Performance of DFBA for GEO backbone.
utilization. In the simulations, the excess capacity (GFR capacity * MCR allocation) isalmost equally distributed among the "ve VCs.
f ¸EO Access with heterogenous R¹¹: In this con"guration, the access hop (x) for VC 3, isa LEO hop with a 25 ms one way delay. This results in a round trip delay of 60 ms for VC3.All other VCs still have negligible access delay and their backbone delays are also 5 ms oneway. The results of this simulation with bu!er size"6000 cells is shown in Figure 15. Thetable again shows that DFBA provides the allocated rates to VCs with di!erent MCRs.
f GEO backbone: Finally, we present the case where the backbone hop is a GEO link. Theround trip delay in this case is about 550 ms. The GEO hop is the most dominant hop withrespect to latency and the access hops had negligible latency. Figure 16 shows the achievedthroughputs for three di!erent bu!er sizes* 200 000, 150 000 and 100 000 cells: 100 000 cellscorresponds to 0.5RTT-bandwidth product worth of bu!ers. Again, the "gure shows thatDFBA provides MCR guarantees to VCs over long delay satellite networks.
TCP OVER SATELLITE-ATM NETWORKS 133
Copyright ( 2001 John Wiley & Sons, Ltd. Int. J. Satell. Commun. 2001; 19:111}139
The ideas and results from this section can be summarized as follows:
Results 5 (GFR service)The Guaranteed frame rate service is designed for frame-based best e!ort applications and
supports per-VC minimum cell rate guarantees.
Result 6 (GFR implementation options)GFR can be implemented using tagging, bu!er management and per-VC scheduling. A desir-
able implementation of GFR is by using a FIFO bu!er with intelligent bu!er management.
Result 7 (DFBA results)The di!erential fair bu!er allocation (DFBA) scheme is a FIFO scheme that provides per-VC
MCR guarantees to VCs carrying TCP tra$c. Simulations with DFBA show that DFBA canprovide such guarantees for terrestrial as well as satellite latencies.
Result 8 (Limitations)In general, bu!er management schemes for TCP are limited by the granularity of IP or ATM#ows.
6. SUMMARY OF RESULTS
This paper describes a set of techniques for improving the performance of TCP over asyn-chronous transfer mode (ATM)-based satellite networks. Among the service categories providedby ATM networks, the most commonly used category for data tra$c is the unspeci"ed bit rate(UBR) service. UBR allows sources to send data into the network without any networkguarantees or control.
Several issues arise in optimizing the performance of TCP when ATM-UBR service is usedover satellite links. In this paper, we studied several TCP mechanisms as well as ATM-UBRmechanisms to improve TCP performance over long-delay ATM networks. The UBR mecha-nisms addressed in this paper are:
f UBR with frame level discard policies,f UBR with intelligent bu!er management,f UBR with guaranteed rate.
The following TCP mechanisms were studied:
f Vanilla TCP with slow start and congestion avoidance,f TCP Reno with fast retransmit and recovery,f TCP with selective acknowledgments (SACK).
We also used the guaranteed frame rate (GFR) to provide minimum cell rate guarantees to VCscarrying TCP tra$c. We proposed the di!erential fair bu!er allocation (DFBA) algorithm forbu!er management of TCP over GFR.
We studied several combinations of these mechanisms using an extensive set of simulations andquanti"ed the e!ect of each of these mechanisms. The following summarizes the list of con-clusions drawn from our simulations:
1. In several cases, Vanilla TCP over the UBR service category achieves low throughput andlow fairness over satellite networks. This is because during packet loss, TCP losses signi"-cant amount of time waiting for retransmission timeout.
134 R. GOYAL ET AL.
Copyright ( 2001 John Wiley & Sons, Ltd. Int. J. Satell. Commun. 2001; 19:111}139
2. In the presence of bursty packet losses, fast retransmit and recovery (FRR) (withoutSACK) further hurts TCP performance over UBR for long delay-bandwidth productnetworks.
3. Frame level discard policies such as early packet discard (EPD) improve the throughputover cell-level discard policies. However, the fairness is not guaranteed unless intelligentbu!er management with per-VC accounting is used.
4. Throughput increases further with more aggressive SACK. SACK gives the best perfor-mance in terms of throughput. We found that for long-delay paths, the throughputimprovement due to SACK is more than that from discard policies and bu!er management.
5. Providing guaranteed rate to UBR helps in the presence of a high load of higher prioritytra$c. We found that reserving just a small fraction, say 10 per cent, of the bandwidth forUBR signi"cantly improves TCP performance. For GEO systems, the e!ect of TCP SACKwas more signi"cant than other factors.
6. A bu!er size equal to about half the round-trip delay-bandwidth product of the TCPconnections provides high e$ciency for TCP over satellite-UBR.
7. The GFR service category can provide per-VC MCR guarantees. The proposed di!erentialfair bu!er allocation (DFBA) scheme used per-VC accounting to provide MCR guaranteesto VCs carrying TCP tra$c.
The results described above have been based on simulations using persistent TCP tra$c. InReference [11], we have studied the performance of TCP over satellite-UBR# using a WWWmodel for TCP tra$c. The results obtained from the study are consistent with those presented inthis paper.
ACKNOWLEDGEMENTS
This work was partially sponsored by the NASA Lewis Research Center under contract number NAS3-97198.
APPENDIX
The complete results of simulations are given in Tables II}VI.
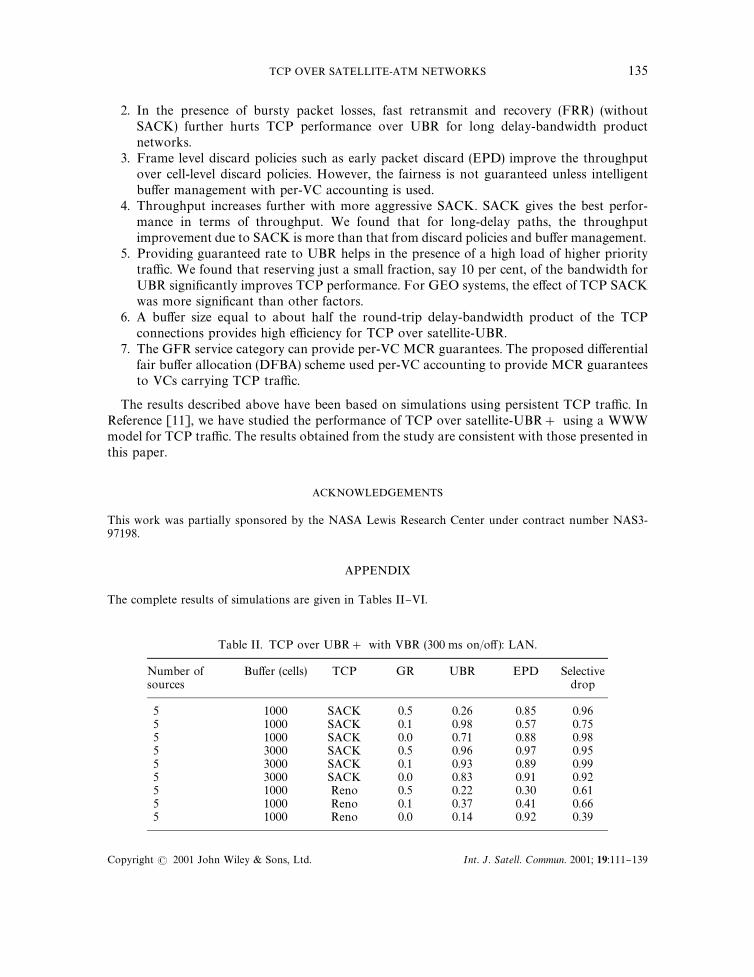
Table II. TCP over UBR# with VBR (300 ms on/o! ): LAN.
Number ofsources
Bu!er (cells) TCP GR UBR EPD Selectivedrop
5 1000 SACK 0.5 0.26 0.85 0.965 1000 SACK 0.1 0.98 0.57 0.755 1000 SACK 0.0 0.71 0.88 0.985 3000 SACK 0.5 0.96 0.97 0.955 3000 SACK 0.1 0.93 0.89 0.995 3000 SACK 0.0 0.83 0.91 0.925 1000 Reno 0.5 0.22 0.30 0.615 1000 Reno 0.1 0.37 0.41 0.665 1000 Reno 0.0 0.14 0.92 0.39
TCP OVER SATELLITE-ATM NETWORKS 135
Copyright ( 2001 John Wiley & Sons, Ltd. Int. J. Satell. Commun. 2001; 19:111}139

Table II. Continued.
Number ofsources
Bu!er (cells) TCP GR UBR EPD Selectivedrop
5 3000 Reno 0.5 0.60 0.69 0.765 3000 Reno 0.1 0.55 0.79 0.935 3000 Reno 0.0 0.59 0.72 0.925 1000 Vanilla 0.5 0.46 0.47 0.585 1000 Vanilla 0.1 0.40 0.58 0.705 1000 Vanilla 0.0 0.27 0.73 0.805 3000 Vanilla 0.5 0.88 0.72 0.875 3000 Vanilla 0.1 0.61 0.63 0.905 3000 Vanilla 0.0 0.61 0.88 0.85
15 1000 SACK 0.5 0.38 0.74 0.9215 1000 SACK 0.1 0.49 0.76 0.9115 1000 SACK 0.0 0.57 0.98 0.9015 3000 SACK 0.5 0.90 0.96 0.9215 3000 SACK 0.1 0.61 0.94 0.9615 3000 SACK 0.0 0.43 0.86 0.9515 1000 Reno 0.5 0.43 0.52 0.7015 1000 Reno 0.1 0.35 0.48 0.6815 1000 Reno 0.0 0.29 0.40 0.7015 3000 Reno 0.5 0.68 0.88 0.9515 3000 Reno 0.1 0.63 0.81 0.9715 3000 Reno 0.0 0.54 0.69 0.8915 1000 Vanilla 0.5 0.59 0.42 0.8015 1000 Vanilla 0.1 0.38 0.52 0.7015 1000 Vanilla 0.0 0.36 0.39 0.7515 3000 Vanilla 0.5 0.68 0.90 0.9715 3000 Vanilla 0.1 0.54 0.96 0.9815 3000 Vanilla 0.0 0.37 0.85 0.89
Table III. TCP over UBR# with VBR (300 ms on/o! ): LEO.
Number ofsources
Bu!er (cells) TCP GR UBR EPD Selectivedrop
5 12 000 SACK 0.5 0.95 0.93 0.945 12 000 SACK 0.1 0.87 0.66 0.695 12 000 SACK 0.0 0.42 0.43 0.615 36 000 SACK 0.5 0.97 0.99 0.995 36 000 SACK 0.1 0.96 0.98 0.965 36 000 SACK 0.0 0.55 0.52 0.965 12 000 Reno 0.5 0.93 0.96 0.945 12 000 Reno 0.1 0.61 0.79 0.715 12 000 Reno 0.0 0.34 0.45 0.335 36 000 Reno 0.5 0.97 0.97 0.935 36 000 Reno 0.1 0.90 0.96 0.755 36 000 Reno 0.0 0.33 0.92 0.335 12 000 Vanilla 0.5 0.94 0.97 0.965 12 000 Vanilla 0.1 0.82 0.70 0.69
136 R. GOYAL ET AL.
Copyright ( 2001 John Wiley & Sons, Ltd. Int. J. Satell. Commun. 2001; 19:111}139
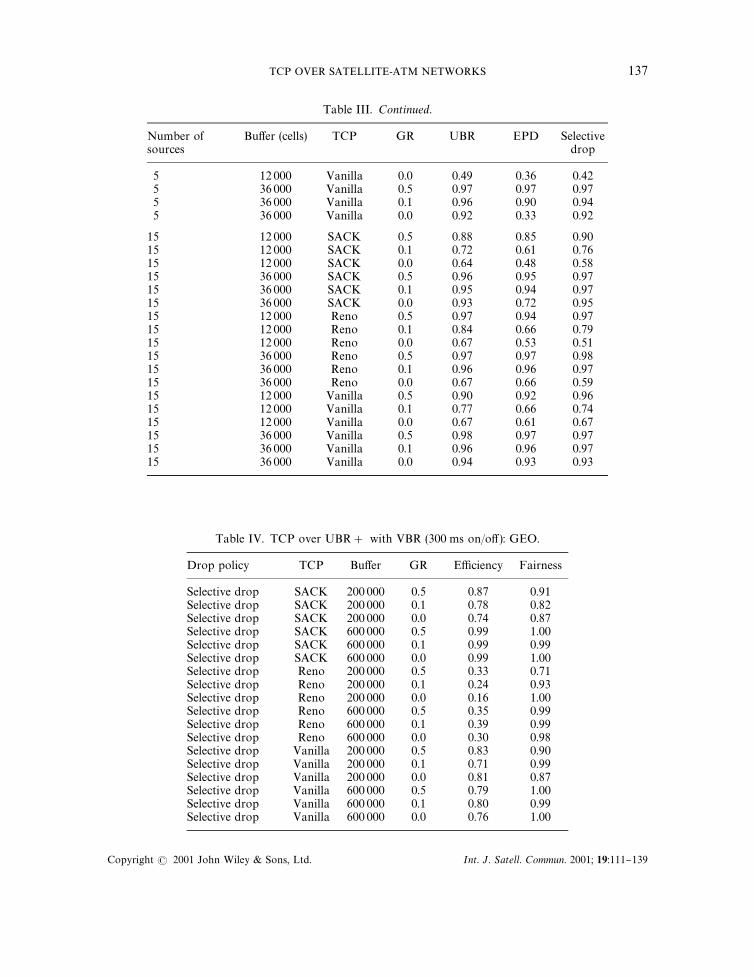
Table III. Continued.
Number ofsources
Bu!er (cells) TCP GR UBR EPD Selectivedrop
5 12 000 Vanilla 0.0 0.49 0.36 0.425 36 000 Vanilla 0.5 0.97 0.97 0.975 36 000 Vanilla 0.1 0.96 0.90 0.945 36 000 Vanilla 0.0 0.92 0.33 0.92
15 12 000 SACK 0.5 0.88 0.85 0.9015 12 000 SACK 0.1 0.72 0.61 0.7615 12 000 SACK 0.0 0.64 0.48 0.5815 36 000 SACK 0.5 0.96 0.95 0.9715 36 000 SACK 0.1 0.95 0.94 0.9715 36 000 SACK 0.0 0.93 0.72 0.9515 12 000 Reno 0.5 0.97 0.94 0.9715 12 000 Reno 0.1 0.84 0.66 0.7915 12 000 Reno 0.0 0.67 0.53 0.5115 36 000 Reno 0.5 0.97 0.97 0.9815 36 000 Reno 0.1 0.96 0.96 0.9715 36 000 Reno 0.0 0.67 0.66 0.5915 12 000 Vanilla 0.5 0.90 0.92 0.9615 12 000 Vanilla 0.1 0.77 0.66 0.7415 12 000 Vanilla 0.0 0.67 0.61 0.6715 36 000 Vanilla 0.5 0.98 0.97 0.9715 36 000 Vanilla 0.1 0.96 0.96 0.9715 36 000 Vanilla 0.0 0.94 0.93 0.93
Table IV. TCP over UBR# with VBR (300 ms on/o! ): GEO.
Drop policy TCP Bu!er GR E$ciency Fairness
Selective drop SACK 200 000 0.5 0.87 0.91Selective drop SACK 200 000 0.1 0.78 0.82Selective drop SACK 200 000 0.0 0.74 0.87Selective drop SACK 600 000 0.5 0.99 1.00Selective drop SACK 600 000 0.1 0.99 0.99Selective drop SACK 600 000 0.0 0.99 1.00Selective drop Reno 200 000 0.5 0.33 0.71Selective drop Reno 200 000 0.1 0.24 0.93Selective drop Reno 200 000 0.0 0.16 1.00Selective drop Reno 600 000 0.5 0.35 0.99Selective drop Reno 600 000 0.1 0.39 0.99Selective drop Reno 600 000 0.0 0.30 0.98Selective drop Vanilla 200 000 0.5 0.83 0.90Selective drop Vanilla 200 000 0.1 0.71 0.99Selective drop Vanilla 200 000 0.0 0.81 0.87Selective drop Vanilla 600 000 0.5 0.79 1.00Selective drop Vanilla 600 000 0.1 0.80 0.99Selective drop Vanilla 600 000 0.0 0.76 1.00
TCP OVER SATELLITE-ATM NETWORKS 137
Copyright ( 2001 John Wiley & Sons, Ltd. Int. J. Satell. Commun. 2001; 19:111}139
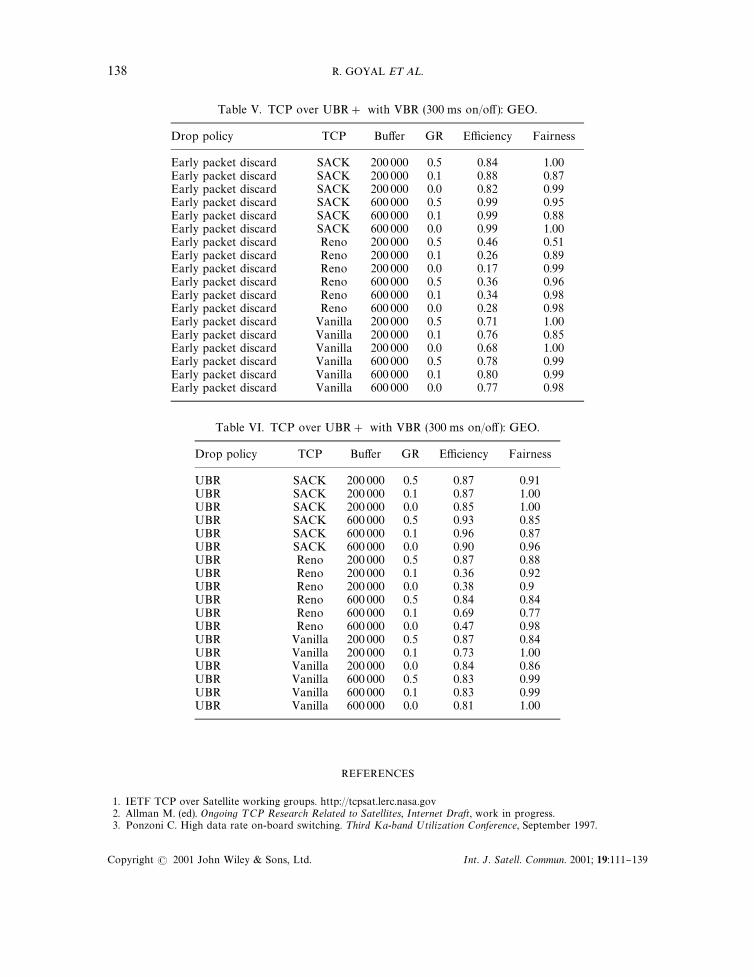
Table V. TCP over UBR# with VBR (300 ms on/o! ): GEO.
Drop policy TCP Bu!er GR E$ciency Fairness
Early packet discard SACK 200 000 0.5 0.84 1.00Early packet discard SACK 200 000 0.1 0.88 0.87Early packet discard SACK 200 000 0.0 0.82 0.99Early packet discard SACK 600 000 0.5 0.99 0.95Early packet discard SACK 600 000 0.1 0.99 0.88Early packet discard SACK 600 000 0.0 0.99 1.00Early packet discard Reno 200 000 0.5 0.46 0.51Early packet discard Reno 200 000 0.1 0.26 0.89Early packet discard Reno 200 000 0.0 0.17 0.99Early packet discard Reno 600 000 0.5 0.36 0.96Early packet discard Reno 600 000 0.1 0.34 0.98Early packet discard Reno 600 000 0.0 0.28 0.98Early packet discard Vanilla 200 000 0.5 0.71 1.00Early packet discard Vanilla 200 000 0.1 0.76 0.85Early packet discard Vanilla 200 000 0.0 0.68 1.00Early packet discard Vanilla 600 000 0.5 0.78 0.99Early packet discard Vanilla 600 000 0.1 0.80 0.99Early packet discard Vanilla 600 000 0.0 0.77 0.98
Table VI. TCP over UBR# with VBR (300 ms on/o! ): GEO.
Drop policy TCP Bu!er GR E$ciency Fairness
UBR SACK 200 000 0.5 0.87 0.91UBR SACK 200 000 0.1 0.87 1.00UBR SACK 200 000 0.0 0.85 1.00UBR SACK 600 000 0.5 0.93 0.85UBR SACK 600 000 0.1 0.96 0.87UBR SACK 600 000 0.0 0.90 0.96UBR Reno 200 000 0.5 0.87 0.88UBR Reno 200 000 0.1 0.36 0.92UBR Reno 200 000 0.0 0.38 0.9UBR Reno 600 000 0.5 0.84 0.84UBR Reno 600 000 0.1 0.69 0.77UBR Reno 600 000 0.0 0.47 0.98UBR Vanilla 200 000 0.5 0.87 0.84UBR Vanilla 200 000 0.1 0.73 1.00UBR Vanilla 200 000 0.0 0.84 0.86UBR Vanilla 600 000 0.5 0.83 0.99UBR Vanilla 600 000 0.1 0.83 0.99UBR Vanilla 600 000 0.0 0.81 1.00
REFERENCES
1. IETF TCP over Satellite working groups. http://tcpsat.lerc.nasa.gov2. Allman M. (ed). Ongoing ¹CP Research Related to Satellites, Internet Draft, work in progress.3. Ponzoni C. High data rate on-board switching. ¹hird Ka-band ;tilization Conference, September 1997.
138 R. GOYAL ET AL.
Copyright ( 2001 John Wiley & Sons, Ltd. Int. J. Satell. Commun. 2001; 19:111}139

4. Goyal R, Jain R, Kalyanaraman S, Fahmy S, Vandalore B. Improving the performance of TCP over the ATM-UBRservice. Computer Communications 1998; 21(10):898}911, http://www.cis.ohio-state.edu/jain/papers/cc.htm
5. Heinanen J. A fair bu!er allocation scheme. Unpublished manuscript.6. Romanov A, Floyd S. Dynamics of TCP tra$c over ATM networks. IEEE Journal of Selected Areas in ¹elecommuni-
cations, 1995.7. Li H, Siu KY, Tzeng HT, Ikeda C, Suzuki H. TCP over ABR and UBR services in ATM. Proceeding IPCCC+96,
March 1996.8. Jacobson V. Congestion avoidance and control. Proceedings of the SIGCOMM188 Symposium, August 1988,
314}332.9. Stevens W. TCP slow start, congestion avoidance, fast retransmit and fast recovery algorithms. Internet RFC 2001,
January 1997.10. Mathis M, Madhavi J, Floyd S, Romanow A. TCP selective acknowledgment options. Internet RFC 2018, October
1996.11. Goyal M, Goyal R, Jain R, Vandalore B, Fahmy S, VonDeak T, Bhasin K, Butts N, Kota S. Performance analysis of
TCP enhancements for WWW tra$c using UBR# with limited bu!ers over satellite links. A¹M Forum/98-0876R1,December 1998, http:/www.cis.ohio-state.edu/jain/atmf/a98-0876.htm.
12. Li H, Siu KY, Tzeng HT, Ikeda C, Suzuki H. TCP over ABR and UBR services in ATM. Proceedings IPCCC+96,March 1996.
13. Sally Floyd's homepage http://www-nrg.ee.lbl.gov/#oyd/epd.html14. Goyal R, Jain R, Kalyanaraman S, Fahmy S, Vandalore B, Cai X, Kim S-C, Kota S. Guaranteed rate for improving
TCP performance on UBR# over terrestrial and satellite networks. A¹M Forum/97-0424, April 1997, http://www.cis.ohio-state.edu/jain/atmf/a97-044.htm
15. Satellite altitudes taken from Lloyd's satellite constellation. http://www.ee.surrey.ac.uk/Personal/L.Wood/constella-tions/overview.html
16. Kalyanaraman S. Tra$c management for the available bit rate (ABR) service in asynchronous transfer mode (ATM)networks. Ph.D. Dissertation, The Ohio State University, 1997; xxiv#429.
17. Goyal R, Jain R, Kalyanaraman S, Fahmy, S, Vandalore B, Kota S. Selective acknowledgments and UBR#droppolicies to improve TCP/UBR performance over terrestrial and satellite networks. Proceedings IC3N+97, September1997, (All our papers and ATM Forum contributions are available from http://www.cis.ohio-state.edu/&jain).
18. Floyd S. Connections with multiple congested gateways in packet-switched networks Part 1: one-way tra$c.Computer Communication Review 1991; 21(5):30}47.
19. Jain R. ¹he Art of Computer Systems Performance Analysis: ¹echniques for Experimental Design, Simulation andModeling. Wiley-Interscience: New York, April 1991.
20. A¹M Forum. ATM Tra$c Management Speci"cation Version 4.1, December 1998.21. Basak D, Pappu S. GFR implementation alternatives with fair bu!er allocation schemes. A¹M Forum 97-0528.22. Bonaventure O. A simulation study of TCP with the proposed GFR service category. DAGS¹;H¸ Seminar 9725,
High Performance Networks for Multimedia Applications. Germany, June 1997.23. Goyal R, Jain R, Fahmy S, Vandalore B. Bu!er management for the GFR service. A¹M Forum/98-0405 July 1998,
http://www.cis.ohio-state.ed/jain/atmf/a98-0405.htm24. Floyd S, Jacobson V. Random early detection gateways for congestion avoidance. IEEE/ACM ¹ransactions on
Networking 1993.25. Lin D, Morris R. Dynamics of random early detection. Proceedings of SIGCOMM97, 1997.26. Mathis M, Se?mke J, Mahdavi J, Ott T. The macroscopic behavior of the TCP congestion avoidance algorithm.
Computer Communication Review 1997; 27(3):67}82.27. Kota S, Goyal, R, Jain R. Satellite ATM network architectural considerations and TCP/IP performance. Proceedings
of the ¹hird Ka Band ;tilization Conference, Italy, September 15}18, 1997; 481}488, http://www.cis.ohio-state.edu/jain/papers/kaband.htm
TCP OVER SATELLITE-ATM NETWORKS 139
Copyright ( 2001 John Wiley & Sons, Ltd. Int. J. Satell. Commun. 2001; 19:111}139