Embed Size (px)
Citation preview
Budgets and Capital Projects
Dukes Love, Provost
Fred Puddester, VP of Finance and Administration
November, 2017
WILLIAMS COLLEGE
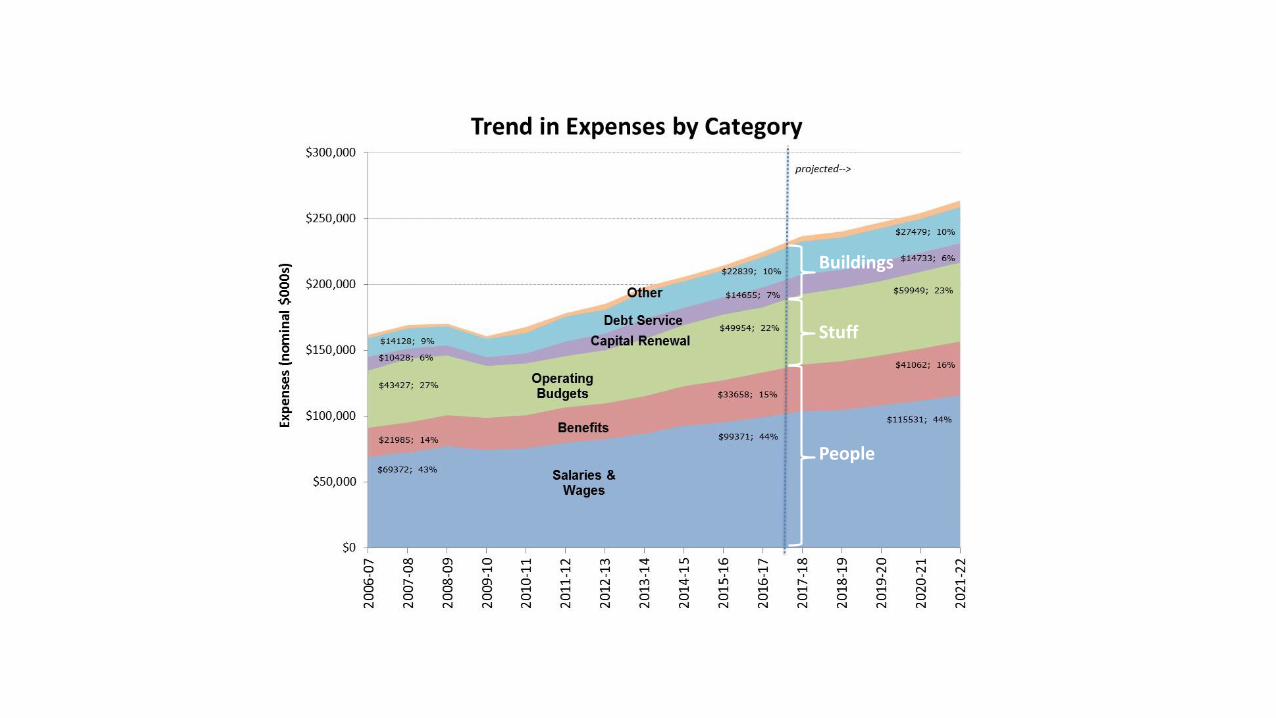
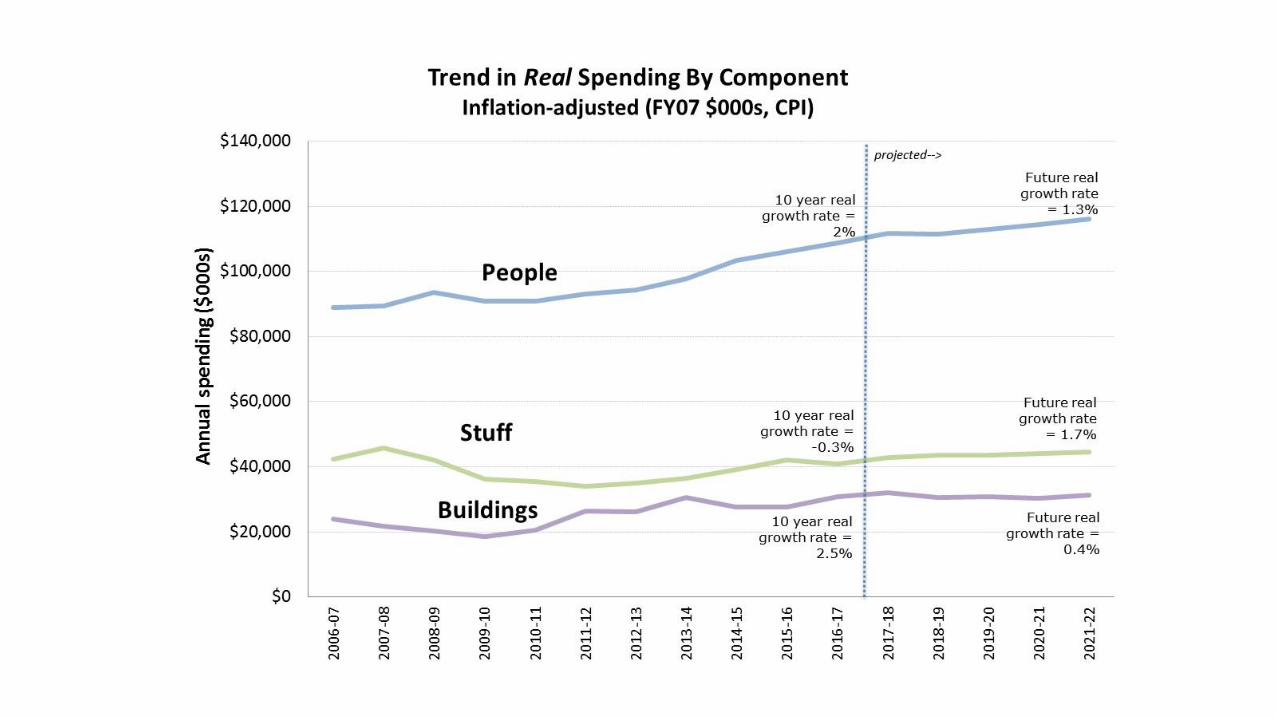
People
Buildings
Stuff
$0
$25,000
$50,000
$75,000
$100,000
$125,000
$150,000
20
06
-07
20
07
-08
20
08
-09
20
09
-10
20
10
-11
20
11
-12
20
12
-13
20
13
-14
20
14
-15
20
15
-16
20
16
-17
20
17
-18
20
18
-19
20
19
-20
20
20
-21
20
21
-22
No
min
al d
olla
rs
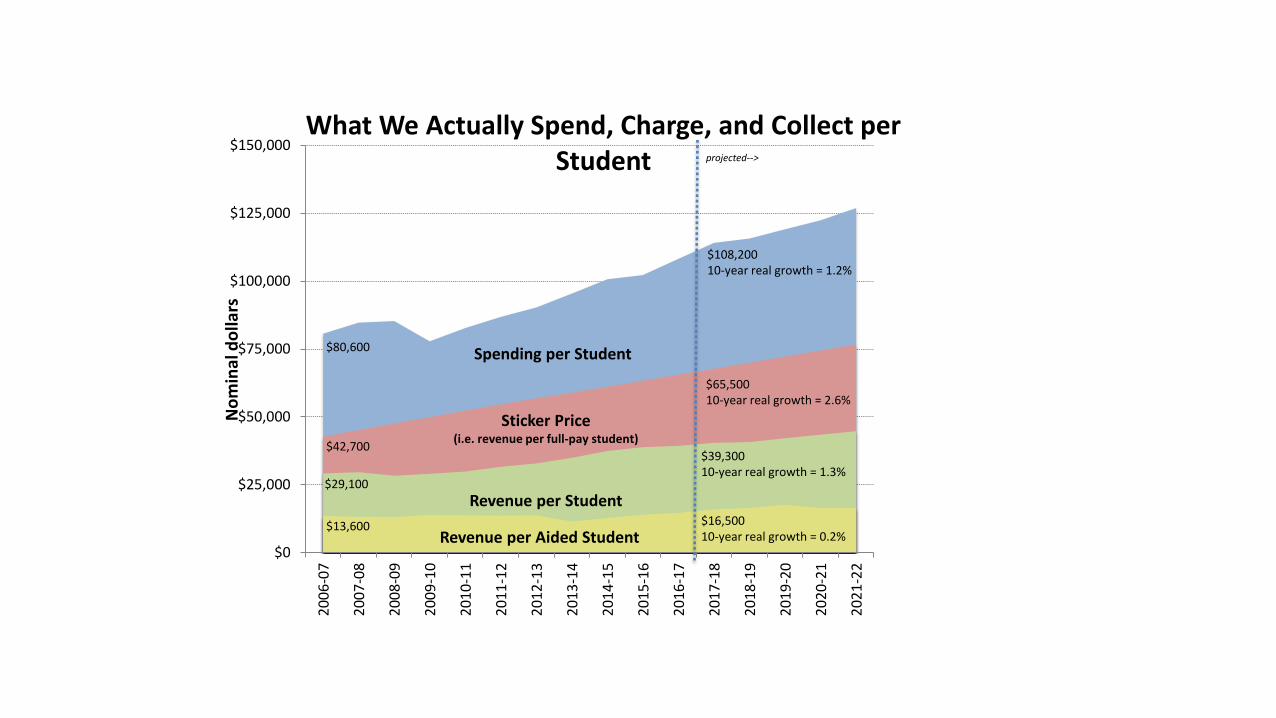
What We Actually Spend, Charge, and Collect per Student projected-->
Spending per Student$80,600
$108,20010-year real growth = 1.2%
Sticker Price(i.e. revenue per full-pay student)
$42,700
$65,50010-year real growth = 2.6%
Revenue per Student$29,100
$39,30010-year real growth = 1.3%
Revenue per Aided Student$13,600 $16,500
10-year real growth = 0.2%
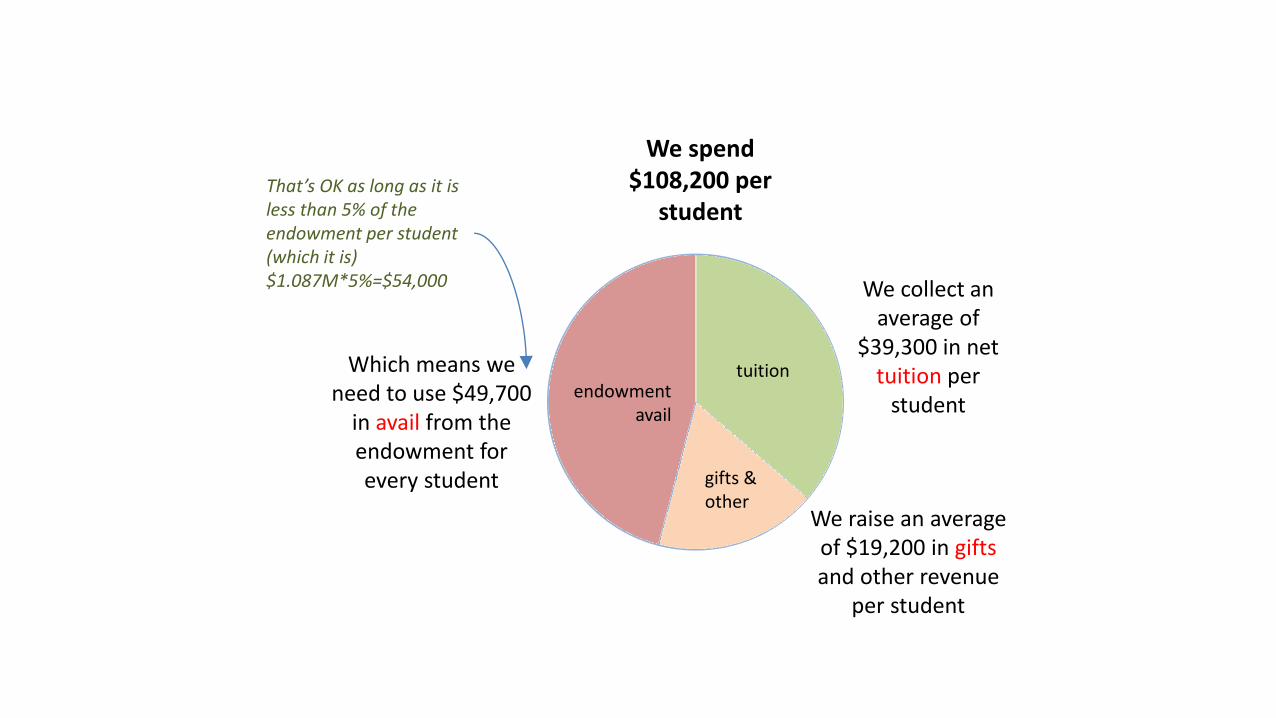
We spend $108,200 per
student
We collect an average of
$39,300 in net tuition per
student
We raise an average of $19,200 in giftsand other revenue
per student
Which means we need to use $49,700
in avail from the endowment for every student
tuition
gifts & other
endowment avail
That’s OK as long as it is less than 5% of the endowment per student (which it is)$1.087M*5%=$54,000

Dean of the Faculty
Dean of the College
ProvostVP Finance & Admin.
VP Campus Life
College Relations
Comm-unications
VP Inst. Div. & Equity
College (Top) Level
Senior Staff Level
People$137M
Stuff$48M
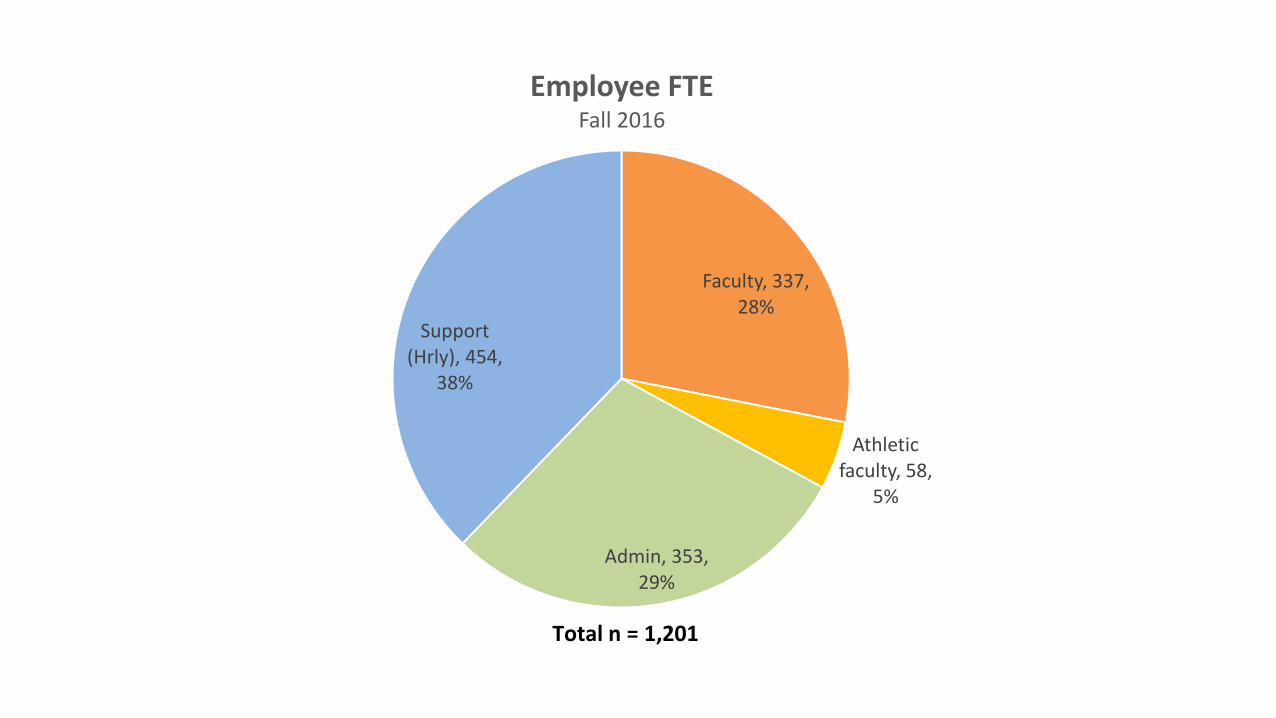
Faculty, 337, 28%
Athletic faculty, 58,
5%
Admin, 353, 29%
Support (Hrly), 454,
38%
Employee FTEFall 2016
Total n = 1,201
0
200
400
600
800
1000
1200
1400
2006 2007 2008 2009 2010 2011 2012 2013 2014 2015 2016
Support (Hourly) Admin Athletics faculty Faculty
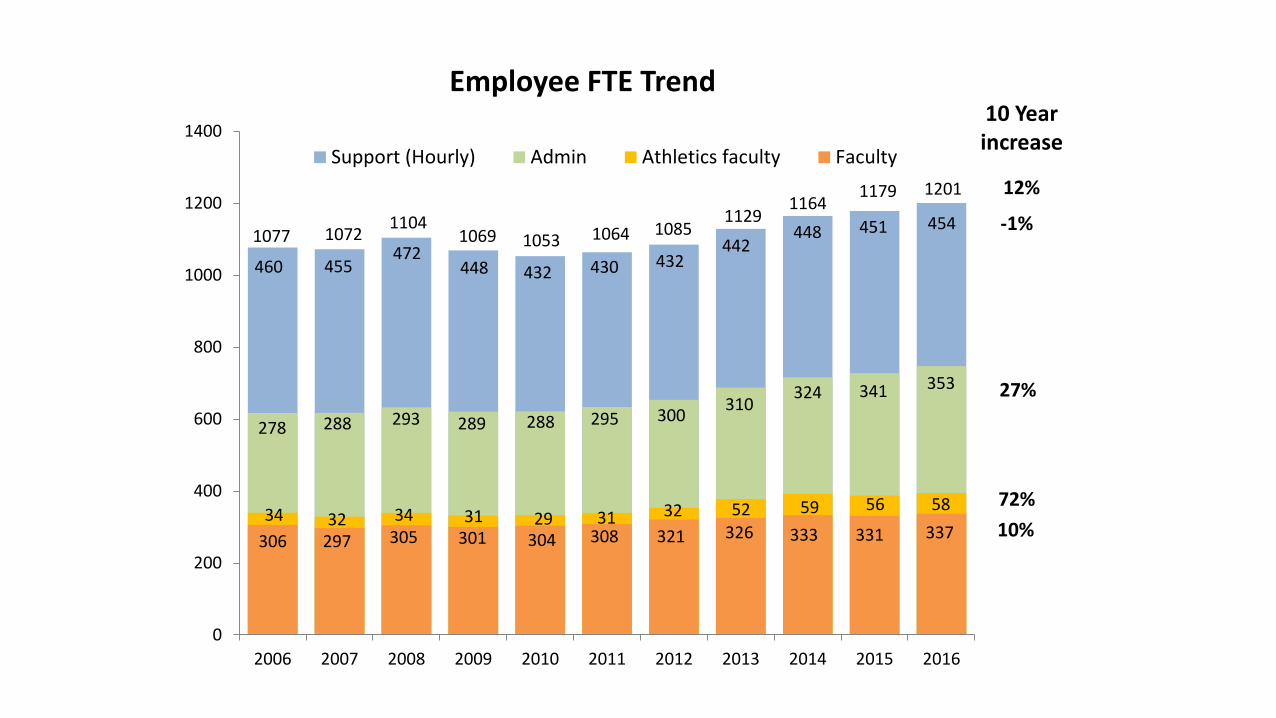
Employee FTE Trend
460 455472
448 432 430 432442
448 451 454
34 32 34 31 29 31 32 52 59 56 58
306 297 305 301 304 308 321 326 333 331 337
1077 10721104
1069 1053 1064 10851129
11641179 1201
278 288 293 289 288 295 300310
324 341 353 27%
72%
10%
12%
10 Year increase
-1%
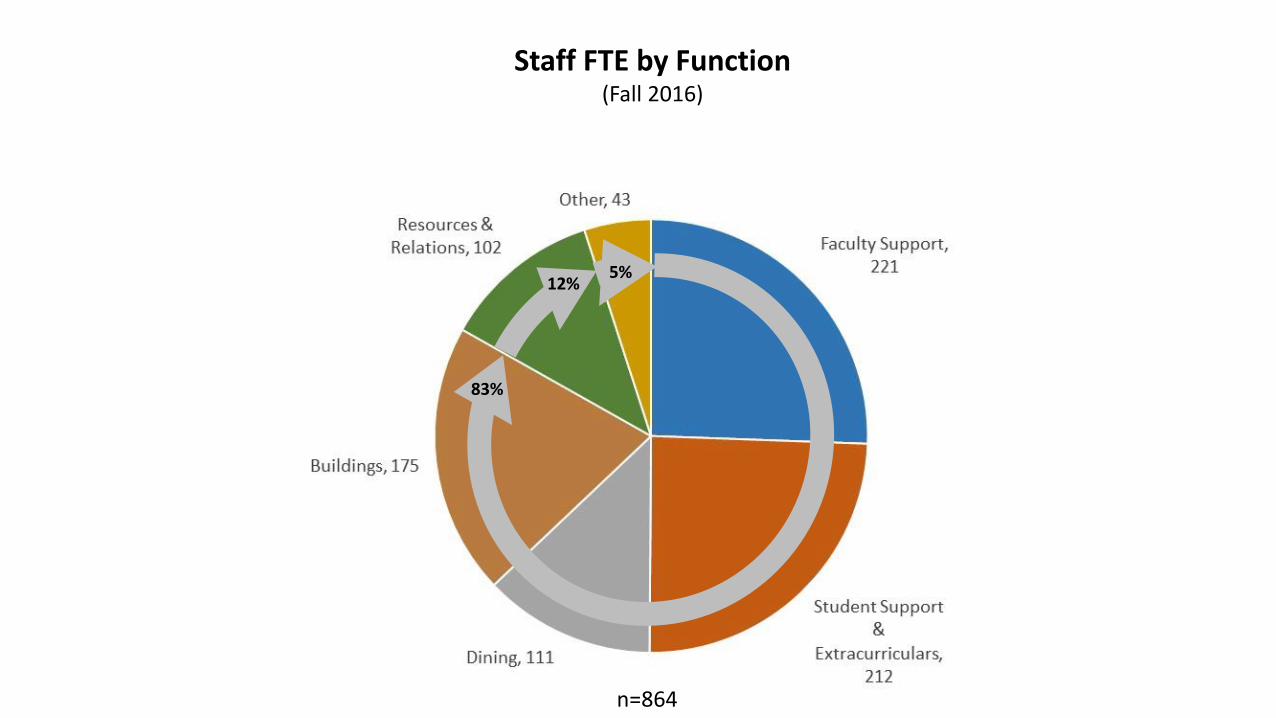
Staff FTE by Function(Fall 2016)
83%
12%5%
n=864
$0
$5
$10
$15
$20
$25
$30
$35
$40
2003 2004 2005 2006 2007 2008 2009 2010 2011 2012 2013 2014 2015 2016
CP
I-ad
just
ed 2
01
6 $
s
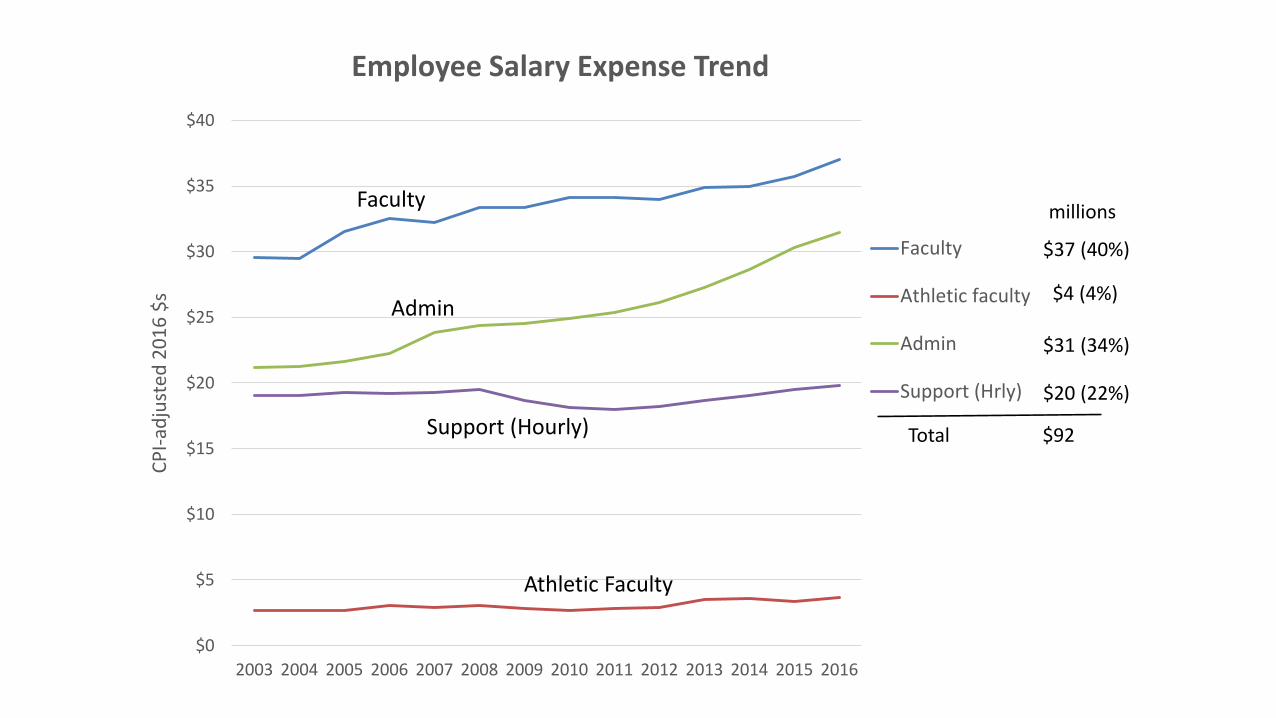
Employee Salary Expense Trend
Faculty
Athletic faculty
Admin
Support (Hrly)
$37 (40%)
$4 (4%)
$31 (34%)
$20 (22%)
Total $92
millionsFaculty
Admin
Support (Hourly)
Athletic Faculty
$-
$2
$4
$6
$8
$10
$12
$14
$16
2002Actual
2003Actual
2004Actual
2005Actual
2006Actual
2007Actual
2008Actual
2009Actual
2010Actual
2011Actual
2012Actual
2013Actual
2014Actual
2015Actual
2016Actual
2017Budget
Exp
en
dit
ure
s
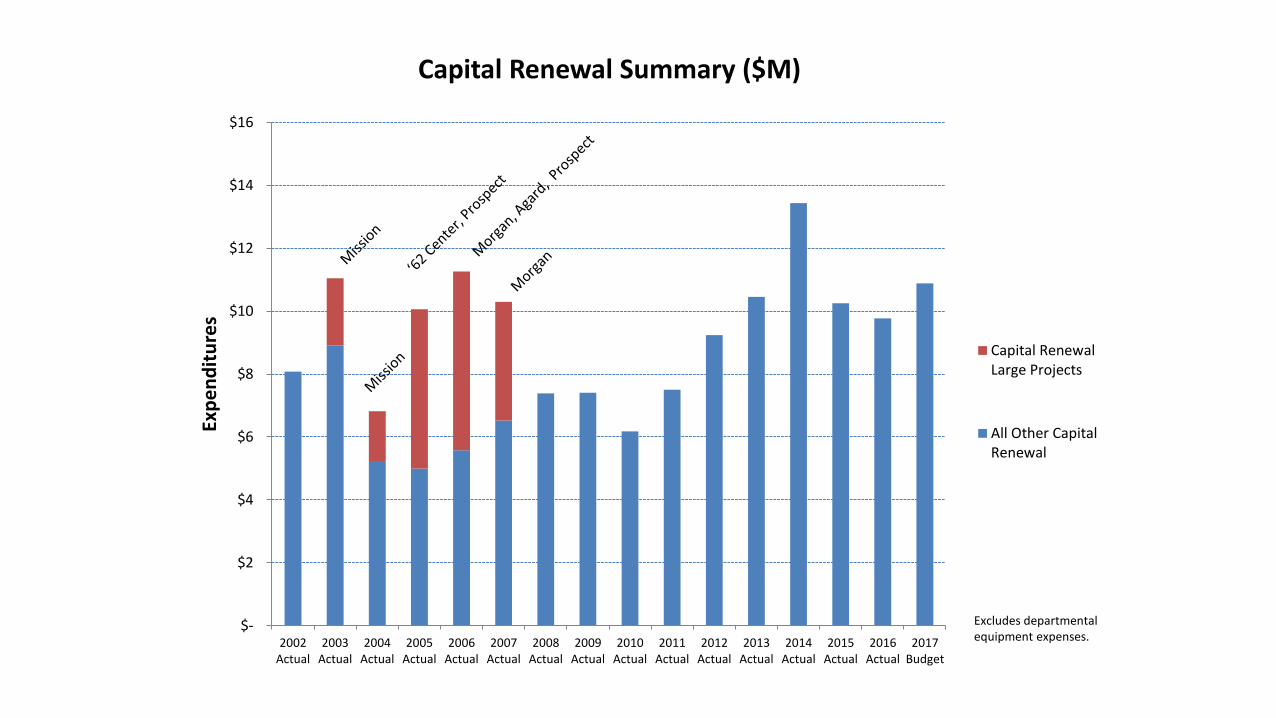
Capital Renewal Summary ($M)
Capital RenewalLarge Projects
All Other CapitalRenewal
Excludes departmental equipment expenses.

Note: Net of Premium
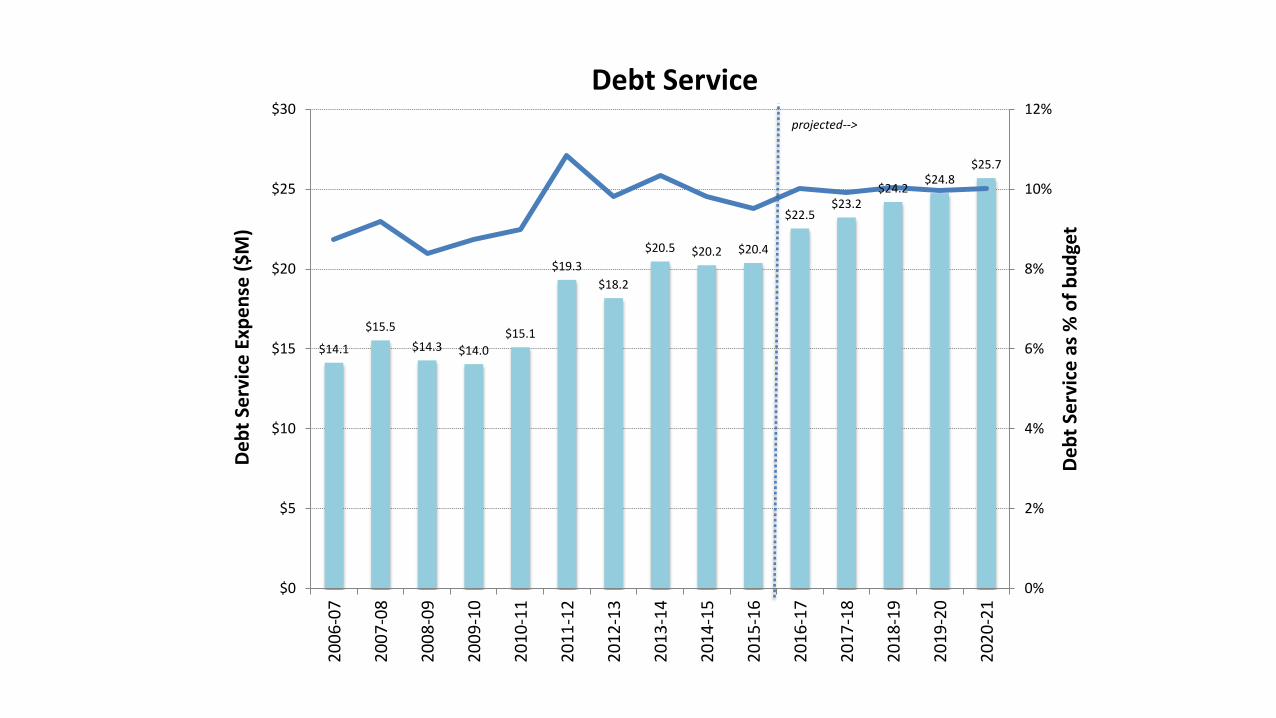
$14.1
$15.5
$14.3 $14.0
$15.1
$19.3
$18.2
$20.5 $20.2 $20.4
$22.5$23.2
$24.2$24.8
$25.7
0%
2%
4%
6%
8%
10%
12%
$0
$5
$10
$15
$20
$25
$30
20
06
-07
20
07
-08
20
08
-09
20
09
-10
20
10
-11
20
11
-12
20
12
-13
20
13
-14
20
14
-15
20
15
-16
20
16
-17
20
17
-18
20
18
-19
20
19
-20
20
20
-21
De
bt
Serv
ice
as
% o
f b
ud
get
De
bt
Serv
ice
Exp
en
se (
$M
)
Debt Service projected-->
Capital Planning Process
• Sector based Planning by geographic area or function
• Strategic planning around critical activities
• Manageable components
• Coordinated with other activities on campus
• Characteristics of planning process
• Multiple studies/analyses
• Broad community participation
• Sustainability goals
• Financial considerations
• Recent examples
• Residential Sector Plan
• Science Center
• Utility Infrastructure Plan
Regular Building Reviews
• Sightlines Analysis (Facilities Assessment)
• Annual review of entire campus
• Benchmarking against peers
• Building Information Systems – Mechanical systems and energy Use
• Over 7,000 control points on campus
• Work orders to Facilities Operations
• Over 23,000 work orders per year
• Reports by building and system within building
• Observations and historical knowledge of from facilities staff and building occupants
Studies and Analysis
• Facilities Condition Assessment
• Performed if data suggests a significant deficiency and includes
• Building systems and envelope• Energy utilization• Safety and code Issues
• Space Utilization Study
• Detailed analysis of space needs• Close collaboration with faculty and staff (and students)• Review includes:
• Amount and functionality of the space• Adjacencies• Future Needs
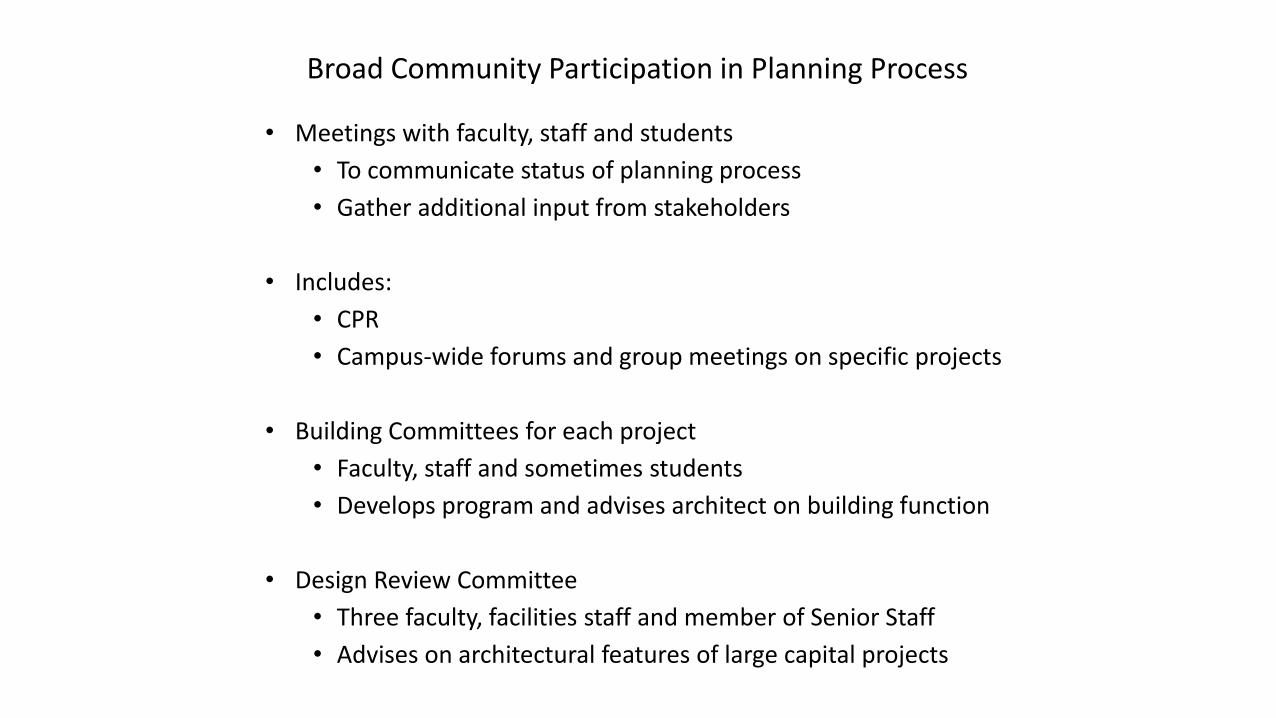
Broad Community Participation in Planning Process
• Meetings with faculty, staff and students
• To communicate status of planning process
• Gather additional input from stakeholders
• Includes:
• CPR
• Campus-wide forums and group meetings on specific projects
• Building Committees for each project
• Faculty, staff and sometimes students
• Develops program and advises architect on building function
• Design Review Committee
• Three faculty, facilities staff and member of Senior Staff
• Advises on architectural features of large capital projects
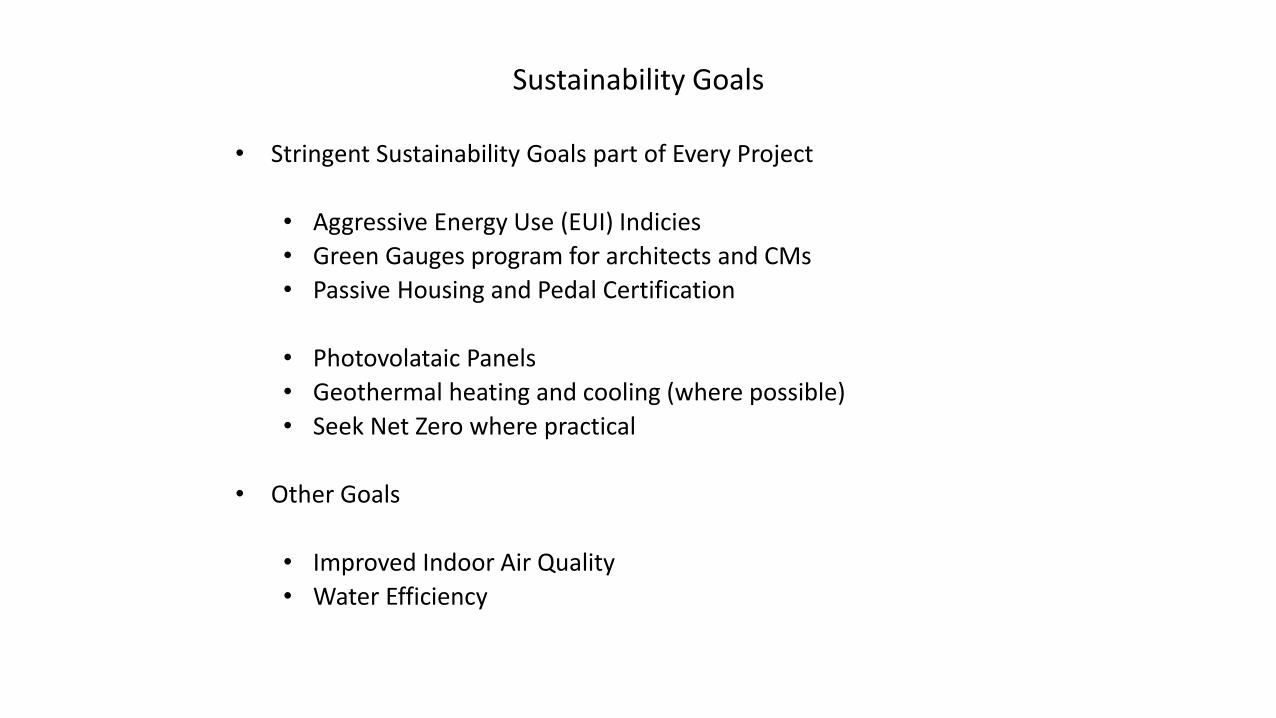
Sustainability Goals
• Stringent Sustainability Goals part of Every Project
• Aggressive Energy Use (EUI) Indicies
• Green Gauges program for architects and CMs
• Passive Housing and Pedal Certification
• Photovolataic Panels
• Geothermal heating and cooling (where possible)
• Seek Net Zero where practical
• Other Goals
• Improved Indoor Air Quality
• Water Efficiency
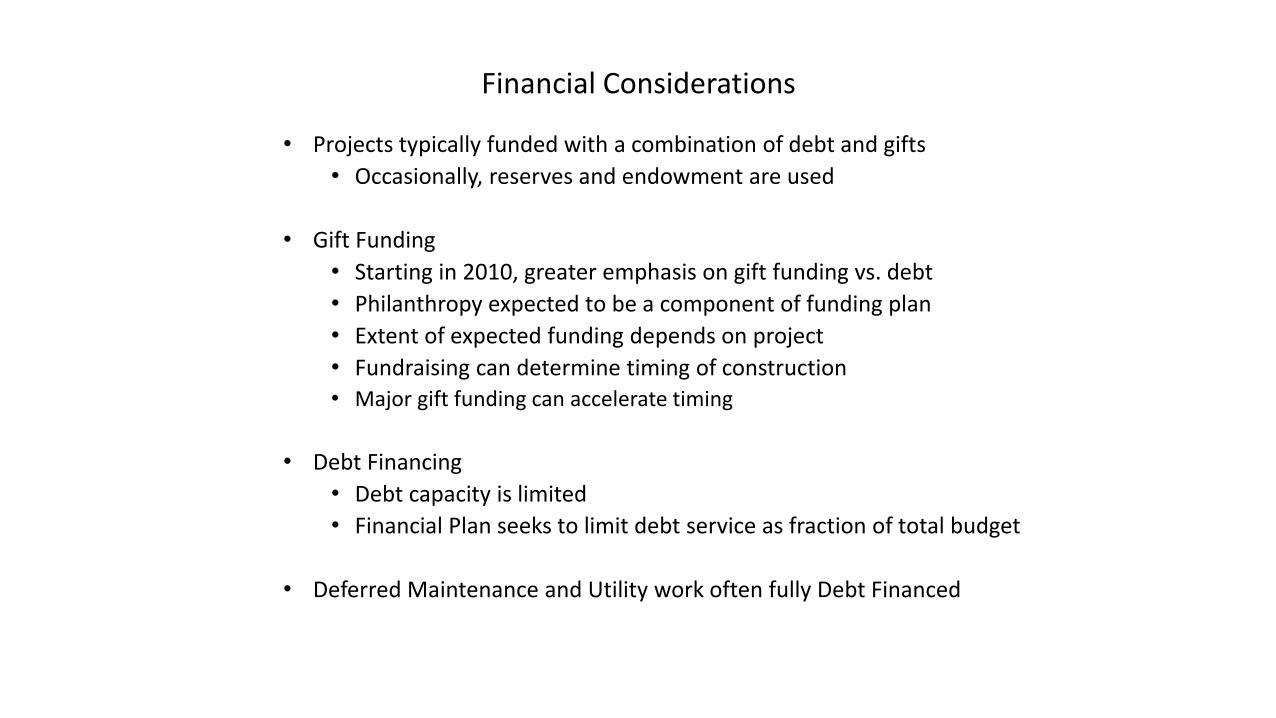
Financial Considerations
• Projects typically funded with a combination of debt and gifts
• Occasionally, reserves and endowment are used
• Gift Funding
• Starting in 2010, greater emphasis on gift funding vs. debt
• Philanthropy expected to be a component of funding plan
• Extent of expected funding depends on project
• Fundraising can determine timing of construction
• Major gift funding can accelerate timing
• Debt Financing
• Debt capacity is limited
• Financial Plan seeks to limit debt service as fraction of total budget
• Deferred Maintenance and Utility work often fully Debt Financed

WESTON FIELD
Replacement of athletic facilities for six teams and new support building
• Numerous code and athlete/fan safety issues
• Athletic department identified other programmatic needs
• Preliminary estimate of $23-25 million to meet needs
• College committed to $7 million for code/safety issues (debt)
• Set funding raising goal of $17 million for project
• Building committee co-chaired by Provost and Athletic Director
• Project includes PV panels on support building and comprehensive storm water management plan
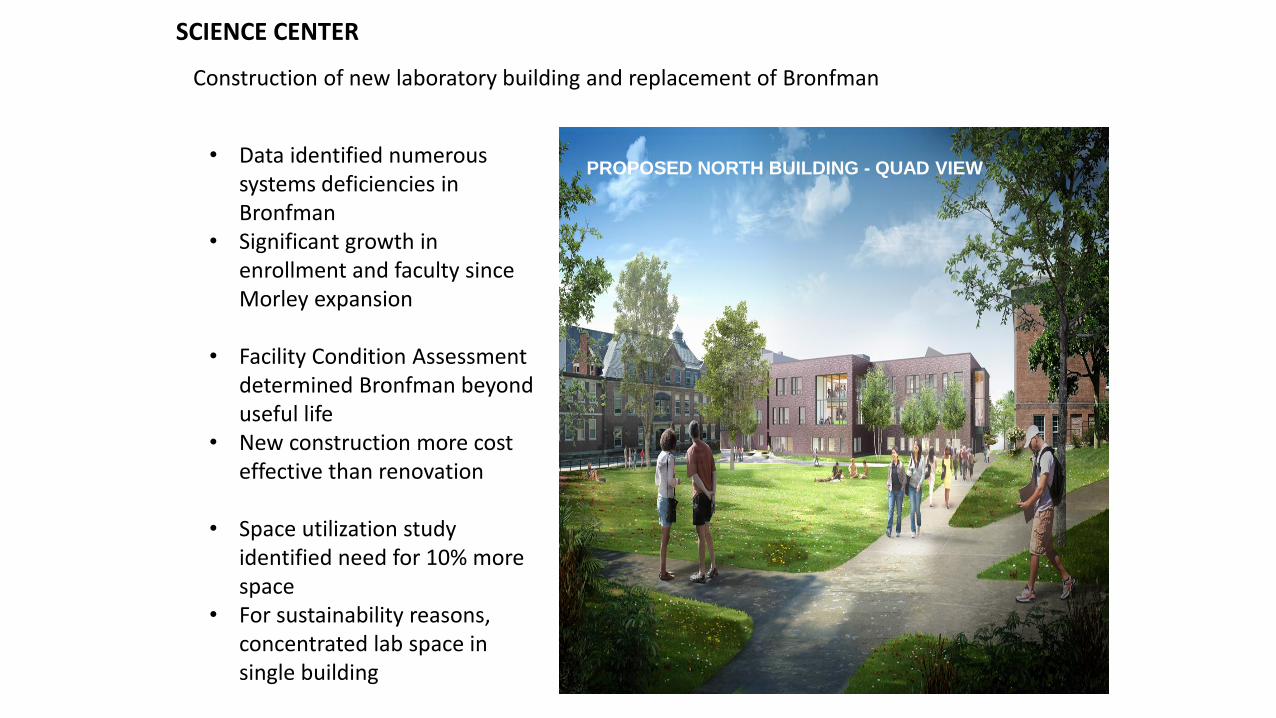
SCIENCE CENTER
PROPOSED NORTH BUILDING - QUAD VIEW
Construction of new laboratory building and replacement of Bronfman
• Data identified numerous systems deficiencies in Bronfman
• Significant growth in enrollment and faculty since Morley expansion
• Facility Condition Assessment determined Bronfman beyond useful life
• New construction more cost effective than renovation
• Space utilization study identified need for 10% more space
• For sustainability reasons, concentrated lab space in single building
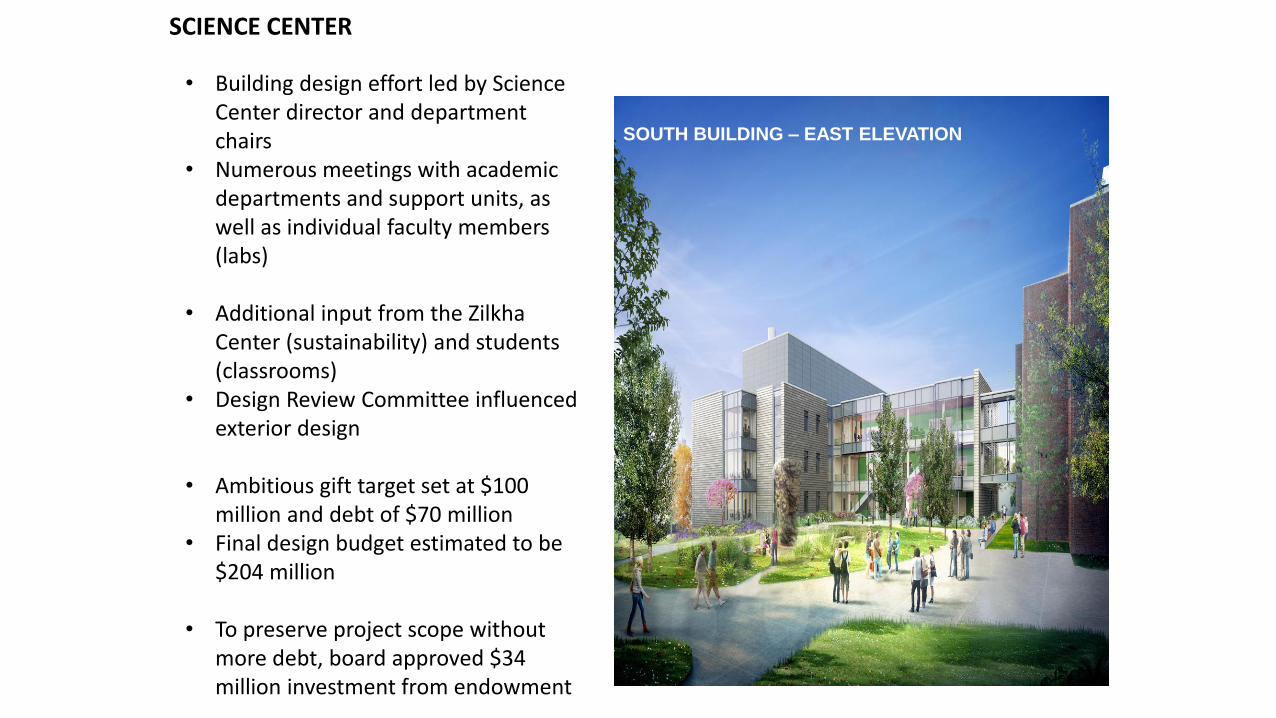
SOUTH BUILDING – EAST ELEVATION
SCIENCE CENTER
• Building design effort led by Science Center director and department chairs
• Numerous meetings with academic departments and support units, as well as individual faculty members (labs)
• Additional input from the Zilkha Center (sustainability) and students (classrooms)
• Design Review Committee influenced exterior design
• Ambitious gift target set at $100 million and debt of $70 million
• Final design budget estimated to be $204 million
• To preserve project scope without more debt, board approved $34 million investment from endowment

GARFIELD HOUSE
Replacement of Garfield Hall with new 42 bed residence hall
• Second project identified in the Residential Sector Plan
• Facility condition assessment and comprehensive historical analysis concluded demolition and replacement the best approach
• Building committee led by Student Life and included student input
• Design review Committee informed exterior design
• Life cycle energy use/emissions informed the replacement vs. renovation decision• Project with use Passive House design concepts in addition to being LEED Gold
• Gift opportunity in campaign, backstopped with debt financing to stay on schedule

Completed, Active, and Planned Capital Projects
Sawyer Library&Quad, $149.5
Weston Field, …
Kellogg, $5.6
Weston Hall, $12.5
The Log, $4.6
Horn Hall, $15.5
Chapin Ph.II, $6.5 Bookstore, $10.5 Science Center, $204.0
Stand By Power, $12.5
CDE, $29.0
Garfield, $12.5
South Campus Utilities, $26.5
Library Shelving Facility, $5.5
Hewat House, $2.5 Williams Inn, $48.0
Boathouse, $10.0 Indoor Tennis, $5.5

Completed, Active, and Planned Capital ProjectsSources of Funding
Sawyer Library&Quad, $99.6
Weston Field, $16.0
Kellogg, $5.6
The Log, $4.6
Horn Hall, $15.5
Chapin Ph.II, $6.5
Science Center, $100.0
CDE, $27.0
Boathouse, $10.0
Indoor Tennis, $5.5 Science Center, $34.0 CDE, $2.0
Williams Inn, $48.0
Sawyer Library&Quad, $49.9
Weston Field, $7.7
Weston Hall, $12.5
Bookstore, $10.5
Science Center, $70.0
Stand By Power, $12.5
Garfield, $12.5 South Campus Utilities, $26.5
Library Shelving Facility, $5.5
Hewat House, $2.5


![ENERGY - Watson Farley & Williams · [FRENCH ENERGY] PRACTICE GIVES ... conventional energy projects, energy infrastructure projects, clean technologies or implementing growth](https://img.dokumen.tips/doc/110x75/5aee1a407f8b9a4556908d35/energy-watson-farley-french-energy-practice-gives-conventional-energy-projects.jpg)


