Embed Size (px)
Citation preview

BUDGET PLANNING AND ECONOMIC
FORECASTING: A SMALL TOWN
PERSPECTIVE Presented at the 75th Annual Conference of MML
June 29, 2011
Ocean City, Maryland
Developed By
John Rogard Tabori, Mayor, Town of University Park
Dan Baden, Treasurer, Town of University Park
Michael Beall, Director of Public Works, Town of University Park
Michael Wynnyk, Chief of Police, Town of University Park
Copyright © June 2011
All Rights Reserved: Town of University Park, Maryland
Purpose:
To provide an Introduction to Comprehensive Budget
Planning from a small town perspective.
and
To provide an Introduction to relevant Economic
Forecasting Tools and Data Sources from a practical point
of view.
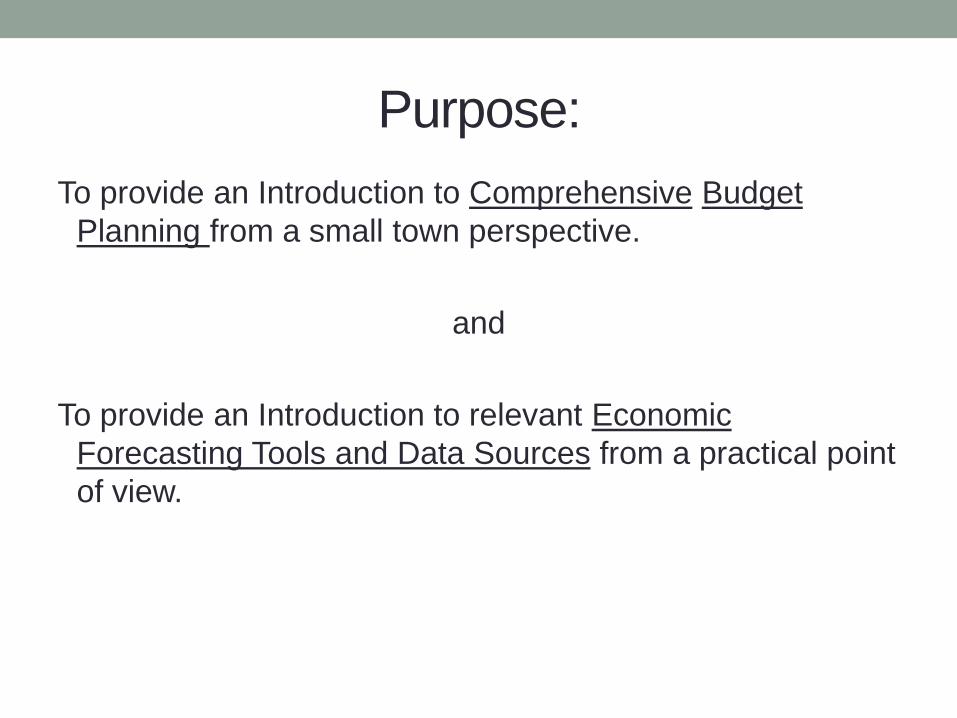
Why a Small Town Perspective I:
• 80% of US population lives in only 350 metro areas
…but
• Slightly more than one-half of the US population lives in
jurisdictions --- cities, towns, boroughs, villages and
townships --- of <25,000 people
• The average local jurisdiction population in the United
States is only 6,200 (Wendell Cox, New Geography, 9-2008)
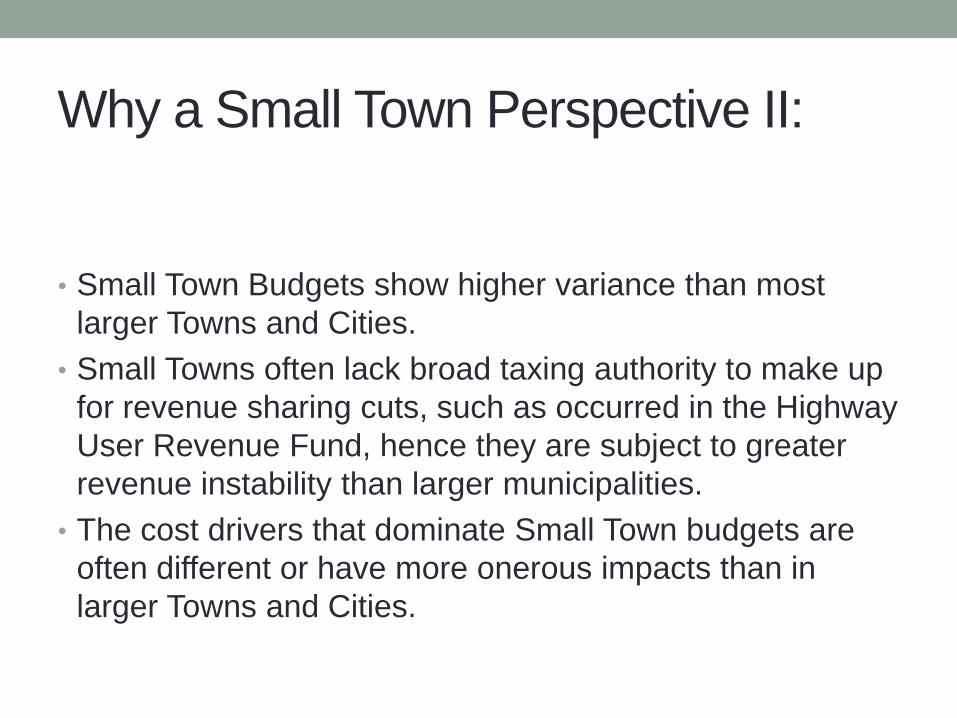
Why a Small Town Perspective II:
• Small Town Budgets show higher variance than most
larger Towns and Cities.
• Small Towns often lack broad taxing authority to make up
for revenue sharing cuts, such as occurred in the Highway
User Revenue Fund, hence they are subject to greater
revenue instability than larger municipalities.
• The cost drivers that dominate Small Town budgets are
often different or have more onerous impacts than in
larger Towns and Cities.

Rationale:
Why Plan? Why Do Economic Forecasting?
1. To fail to plan is to plan to fail.
2. To fail to plan is to assume there is no future.
3. Long-term budget planning makes for better
financial decision-making.
4. Understanding and using economic forecasting
tools makes for better long-term budget planning
and financial decision-making.
5. In the long run, good planning and solid forecasting
can improve efficiency and save the taxpayer
money.
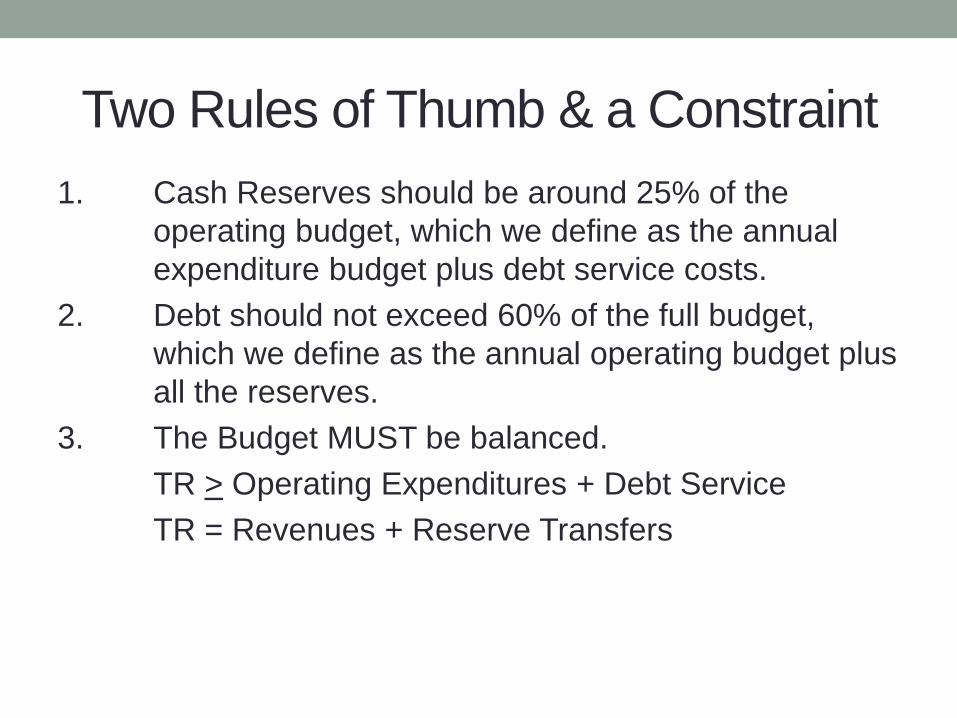
Two Rules of Thumb & a Constraint
1. Cash Reserves should be around 25% of the
operating budget, which we define as the annual
expenditure budget plus debt service costs.
2. Debt should not exceed 60% of the full budget,
which we define as the annual operating budget plus
all the reserves.
3. The Budget MUST be balanced.
TR > Operating Expenditures + Debt Service
TR = Revenues + Reserve Transfers
Building a five year operating budget
1. The Past as a Guide – The Importance of Knowing
where you came from and what has changed.
2. Sections of the Plan:
i. Revenue
ii. Expenditures
iii. Reserves
iv. Debt Service
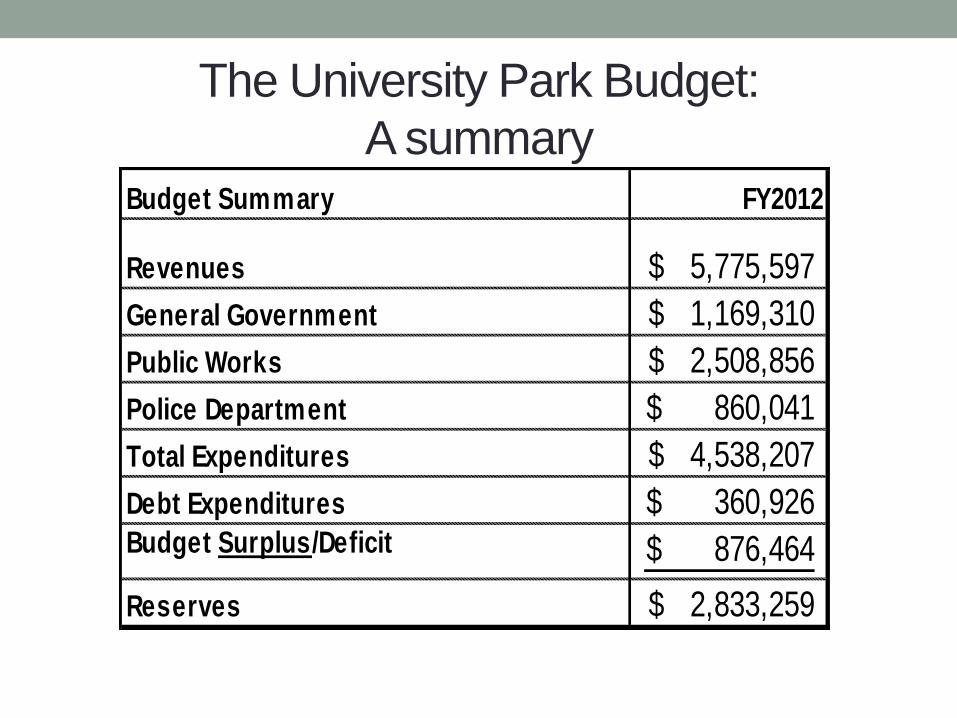
The University Park Budget:
A summary Budget Summary FY2012
Revenues 5,775,597$
General Government 1,169,310$
Public Works 2,508,856$
Police Department 860,041$
Total Expenditures 4,538,207$
Debt Expenditures 360,926$ Budget Surplus/Deficit 876,464$
Reserves 2,833,259$
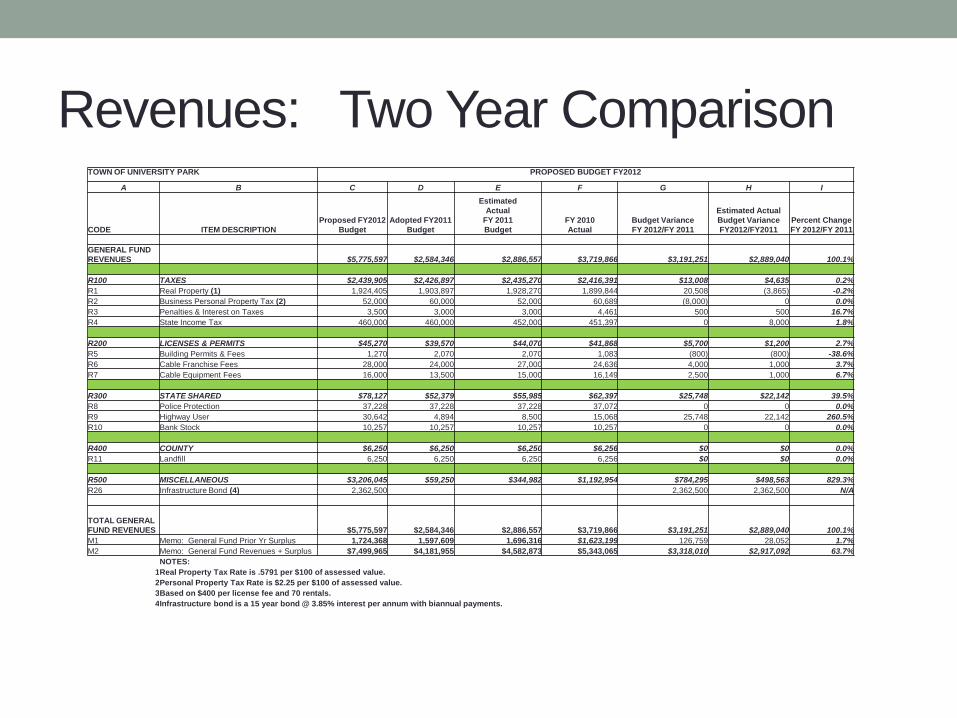
Revenues: Two Year Comparison TOWN OF UNIVERSITY PARK PROPOSED BUDGET FY2012
A B C D E F G H I
CODE ITEM DESCRIPTION
Proposed FY2012
Budget
Adopted FY2011
Budget
Estimated
Actual
FY 2011
Budget
FY 2010
Actual
Budget Variance
FY 2012/FY 2011
Estimated Actual
Budget Variance
FY2012/FY2011
Percent Change
FY 2012/FY 2011
GENERAL FUND
REVENUES $5,775,597 $2,584,346 $2,886,557 $3,719,866 $3,191,251 $2,889,040 100.1%
R100 TAXES $2,439,905 $2,426,897 $2,435,270 $2,416,391 $13,008 $4,635 0.2%
R1 Real Property (1) 1,924,405 1,903,897 1,928,270 1,899,844 20,508 (3,865) -0.2%
R2 Business Personal Property Tax (2) 52,000 60,000 52,000 60,689 (8,000) 0 0.0%
R3 Penalties & Interest on Taxes 3,500 3,000 3,000 4,461 500 500 16.7%
R4 State Income Tax 460,000 460,000 452,000 451,397 0 8,000 1.8%
R200 LICENSES & PERMITS $45,270 $39,570 $44,070 $41,868 $5,700 $1,200 2.7%
R5 Building Permits & Fees 1,270 2,070 2,070 1,083 (800) (800) -38.6%
R6 Cable Franchise Fees 28,000 24,000 27,000 24,636 4,000 1,000 3.7%
R7 Cable Equipment Fees 16,000 13,500 15,000 16,149 2,500 1,000 6.7%
R300 STATE SHARED $78,127 $52,379 $55,985 $62,397 $25,748 $22,142 39.5%
R8 Police Protection 37,228 37,228 37,228 37,072 0 0 0.0%
R9 Highway User 30,642 4,894 8,500 15,068 25,748 22,142 260.5%
R10 Bank Stock 10,257 10,257 10,257 10,257 0 0 0.0%
R400 COUNTY $6,250 $6,250 $6,250 $6,256 $0 $0 0.0%
R11 Landfill 6,250 6,250 6,250 6,256 $0 $0 0.0%
R500 MISCELLANEOUS $3,206,045 $59,250 $344,982 $1,192,954 $784,295 $498,563 829.3%
R26 Infrastructure Bond (4) 2,362,500 2,362,500 2,362,500 N/A
TOTAL GENERAL
FUND REVENUES $5,775,597 $2,584,346 $2,886,557 $3,719,866 $3,191,251 $2,889,040 100.1%
M1 Memo: General Fund Prior Yr Surplus 1,724,368 1,597,609 1,696,316 $1,623,199 126,759 28,052 1.7%
M2 Memo: General Fund Revenues + Surplus $7,499,965 $4,181,955 $4,582,873 $5,343,065 $3,318,010 $2,917,092 63.7%
NOTES:
1 Real Property Tax Rate is .5791 per $100 of assessed value.
2 Personal Property Tax Rate is $2.25 per $100 of assessed value.
3 Based on $400 per license fee and 70 rentals.
4 Infrastructure bond is a 15 year bond @ 3.85% interest per annum with biannual payments.
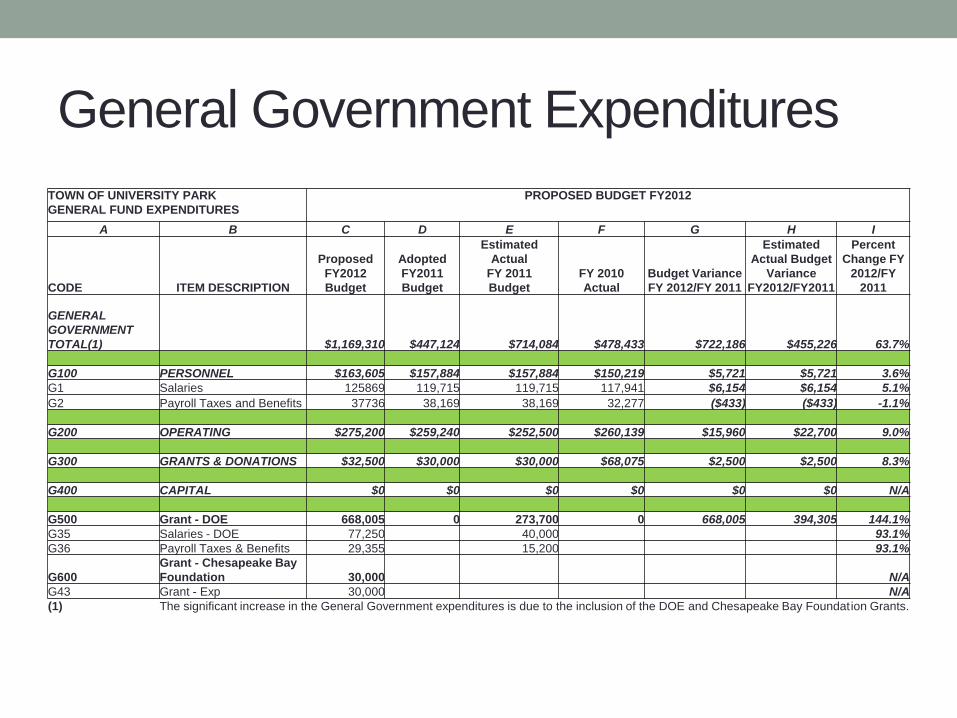
General Government Expenditures
TOWN OF UNIVERSITY PARK
GENERAL FUND EXPENDITURES
PROPOSED BUDGET FY2012
A B C D E F G H I
CODE ITEM DESCRIPTION
Proposed
FY2012
Budget
Adopted
FY2011
Budget
Estimated
Actual
FY 2011
Budget
FY 2010
Actual
Budget Variance
FY 2012/FY 2011
Estimated
Actual Budget
Variance
FY2012/FY2011
Percent
Change FY
2012/FY
2011
GENERAL
GOVERNMENT
TOTAL(1) $1,169,310 $447,124 $714,084 $478,433 $722,186 $455,226 63.7%
G100 PERSONNEL $163,605 $157,884 $157,884 $150,219 $5,721 $5,721 3.6%
G1 Salaries 125869 119,715 119,715 117,941 $6,154 $6,154 5.1%
G2 Payroll Taxes and Benefits 37736 38,169 38,169 32,277 ($433) ($433) -1.1%
G200 OPERATING $275,200 $259,240 $252,500 $260,139 $15,960 $22,700 9.0%
G300 GRANTS & DONATIONS $32,500 $30,000 $30,000 $68,075 $2,500 $2,500 8.3%
G400 CAPITAL $0 $0 $0 $0 $0 $0 N/A
G500 Grant - DOE 668,005 0 273,700 0 668,005 394,305 144.1%
G35 Salaries - DOE 77,250 40,000 93.1%
G36 Payroll Taxes & Benefits 29,355 15,200 93.1%
G600
Grant - Chesapeake Bay
Foundation 30,000 N/A
G43 Grant - Exp 30,000 N/A
(1) The significant increase in the General Government expenditures is due to the inclusion of the DOE and Chesapeake Bay Foundation Grants.
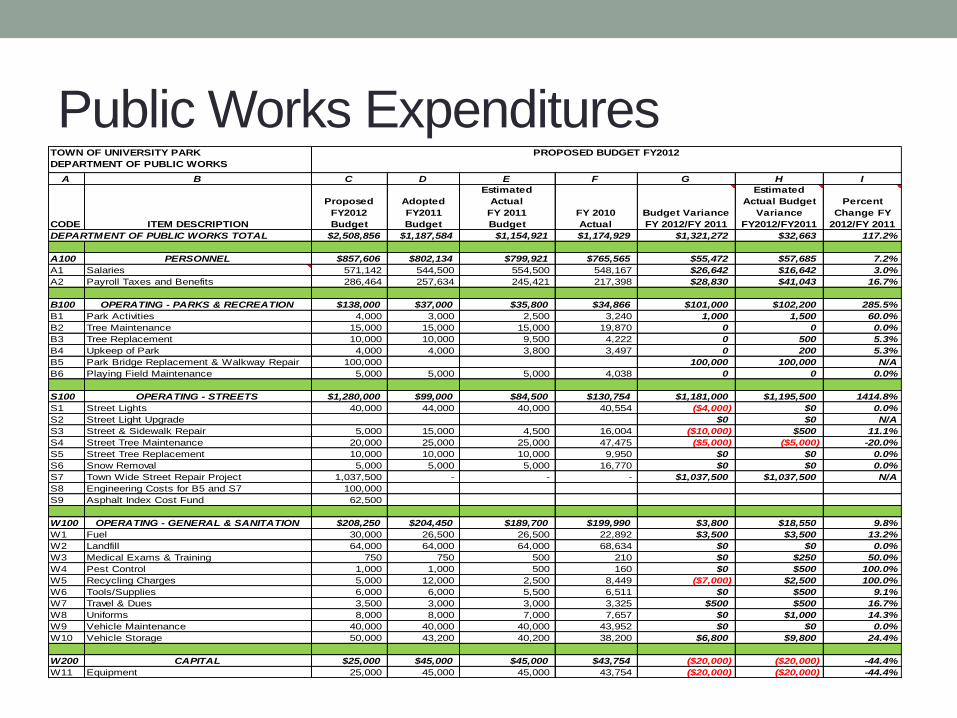
Public Works Expenditures A B C D E F G H I
CODE ITEM DESCRIPTION
Proposed
FY2012
Budget
Adopted
FY2011
Budget
Estimated
Actual
FY 2011
Budget
FY 2010
Actual
Budget Variance
FY 2012/FY 2011
Estimated
Actual Budget
Variance
FY2012/FY2011
Percent
Change FY
2012/FY 2011
DEPARTMENT OF PUBLIC WORKS TOTAL $2,508,856 $1,187,584 $1,154,921 $1,174,929 $1,321,272 $32,663 117.2%
A100 PERSONNEL $857,606 $802,134 $799,921 $765,565 $55,472 $57,685 7.2%
A1 Salaries 571,142 544,500 554,500 548,167 $26,642 $16,642 3.0%
A2 Payroll Taxes and Benefits 286,464 257,634 245,421 217,398 $28,830 $41,043 16.7%
B100 OPERATING - PARKS & RECREATION $138,000 $37,000 $35,800 $34,866 $101,000 $102,200 285.5%
B1 Park Activities 4,000 3,000 2,500 3,240 1,000 1,500 60.0%
B2 Tree Maintenance 15,000 15,000 15,000 19,870 0 0 0.0%
B3 Tree Replacement 10,000 10,000 9,500 4,222 0 500 5.3%
B4 Upkeep of Park 4,000 4,000 3,800 3,497 0 200 5.3%
B5 Park Bridge Replacement & Walkway Repair 100,000 100,000 100,000 N/A
B6 Playing Field Maintenance 5,000 5,000 5,000 4,038 0 0 0.0%
S100 OPERATING - STREETS $1,280,000 $99,000 $84,500 $130,754 $1,181,000 $1,195,500 1414.8%
S1 Street Lights 40,000 44,000 40,000 40,554 ($4,000) $0 0.0%
S2 Street Light Upgrade $0 $0 N/A
S3 Street & Sidewalk Repair 5,000 15,000 4,500 16,004 ($10,000) $500 11.1%
S4 Street Tree Maintenance 20,000 25,000 25,000 47,475 ($5,000) ($5,000) -20.0%
S5 Street Tree Replacement 10,000 10,000 10,000 9,950 $0 $0 0.0%
S6 Snow Removal 5,000 5,000 5,000 16,770 $0 $0 0.0%
S7 Town Wide Street Repair Project 1,037,500 - - - $1,037,500 $1,037,500 N/A
S8 Engineering Costs for B5 and S7 100,000
S9 Asphalt Index Cost Fund 62,500
W100 OPERATING - GENERAL & SANITATION $208,250 $204,450 $189,700 $199,990 $3,800 $18,550 9.8%
W1 Fuel 30,000 26,500 26,500 22,892 $3,500 $3,500 13.2%
W2 Landfill 64,000 64,000 64,000 68,634 $0 $0 0.0%
W3 Medical Exams & Training 750 750 500 210 $0 $250 50.0%
W4 Pest Control 1,000 1,000 500 160 $0 $500 100.0%
W5 Recycling Charges 5,000 12,000 2,500 8,449 ($7,000) $2,500 100.0%
W6 Tools/Supplies 6,000 6,000 5,500 6,511 $0 $500 9.1%
W7 Travel & Dues 3,500 3,000 3,000 3,325 $500 $500 16.7%
W8 Uniforms 8,000 8,000 7,000 7,657 $0 $1,000 14.3%
W9 Vehicle Maintenance 40,000 40,000 40,000 43,952 $0 $0 0.0%
W10 Vehicle Storage 50,000 43,200 40,200 38,200 $6,800 $9,800 24.4%
W200 CAPITAL $25,000 $45,000 $45,000 $43,754 ($20,000) ($20,000) -44.4%
W11 Equipment 25,000 45,000 45,000 43,754 ($20,000) ($20,000) -44.4%
TOWN OF UNIVERSITY PARK
DEPARTMENT OF PUBLIC WORKS
PROPOSED BUDGET FY2012

Police Department Expenditures
A B C D E F G H I
CODE ITEM DESCRIPTION
Proposed
FY2012
Budget
Adopted
FY2011
Budget
Estimated
Actual
FY 2011
Budget
FY 2010
Actual
Budget Variance
FY 2012/FY 2011
Estimated
Actual Budget
Variance
FY2012/FY2011
Percent
Change FY
2012/FY 2011
POLICE & PUBLIC SAFETY TOTAL $860,040 $792,800 $748,900 $715,141 $67,240 $111,140 14.8%
P100 PERSONNEL $707,840 $685,700 $640,000 $632,639 $22,140 $67,840 10.6%
P1 Salaries 492,031 491,800 475,000 484,450 $231 $17,031 3.6%
P2 Payroll Taxes and Benefits 215,810 193,900 165,000 148,189 $21,910 $50,810 30.8%
P200 OPERATING $81,200 $76,100 $77,900 $58,946 $5,100 $3,300 4.2%
P3 Training 3,000 3,000 3,000 1,453 $0 $0 0.0%
P4 Medical Exams 3,000 2,000 2,000 1,137 $1,000 $1,000 50.0%
P5 Accreditation 1,500 1,500 1,500 1,766 $0 $0 0.0%
P6 Bike Patrol 800 200 200 146 $600 $600 300.0%
P7 Citations 3,750 3,750 3,750 3,102 $0 $0 0.0%
P8 Computer 2,500 2,500 2,500 $0 $0 0.0%
P9 Equipment 7,500 7,500 7,500 1,135 $0 $0 0.0%
P10 Gasoline 26,000 22,000 22,000 21,319 $4,000 $4,000 18.2%
P11 MILES Computer 1,800 1,800 1,800 $0 $0 0.0%
P12 Mobile Data Terminals 6,000 6,000 6,000 4,340 $0 $0 0.0%
P13 Police Supplies & Manuals 4,950 4,750 6,550 4,544 $200 ($1,600) -24.4%
P14 Radio Maintenance 800 1,200 1,200 1,132 ($400) ($400) -33.3%
P15 Travel, Meetings, Professional Dues 3,200 3,200 3,200 1,847 $0 $0 0.0%
P16 Uniforms 7,900 8,200 8,200 5,651 ($300) ($300) -3.7%
P17 Vehicle Maintenance 8,500 8,500 8,500 11,374 $0 $0 0.0%
P300 CAPITAL $71,000 $31,000 $31,000 $23,556 $40,000 $40,000 129.0%
P18 Police Cruiser 31,000 31,000 31,000 23,556 $0 $0 0.0%
P19 Radios - New 32,000 0 0 $32,000 $32,000 N/A
P20 Townwide Security Study 8,000 $8,000 $8,000 N/A
TOTAL GENERAL FUND EXPENDITURES 4,538,206 2,427,508 2,617,905 2,368,503 $2,110,698 $1,920,301 73.4%
TOWN OF UNIVERSITY PARK
POLICE & PUBLIC SAFETY
PROPOSED BUDGET FY2012
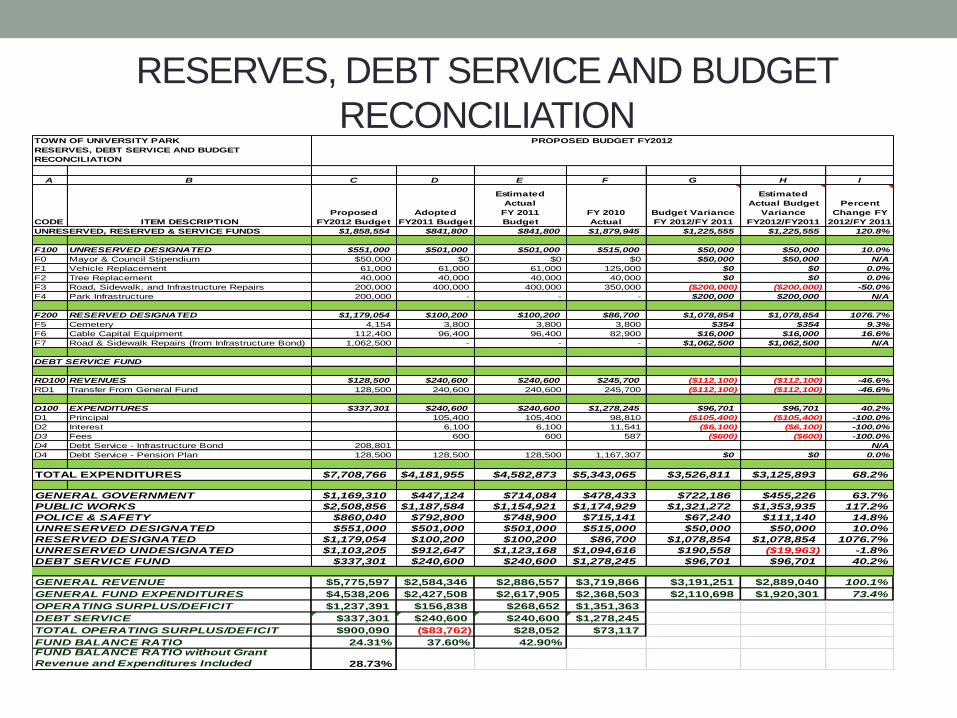
RESERVES, DEBT SERVICE AND BUDGET
RECONCILIATION
A B C D E F G H I
CODE ITEM DESCRIPTION
Proposed
FY2012 Budget
Adopted
FY2011 Budget
Estimated
Actual
FY 2011
Budget
FY 2010
Actual
Budget Variance
FY 2012/FY 2011
Estimated
Actual Budget
Variance
FY2012/FY2011
Percent
Change FY
2012/FY 2011
UNRESERVED, RESERVED & SERVICE FUNDS $1,858,554 $841,800 $841,800 $1,879,945 $1,225,555 $1,225,555 120.8%
F100 UNRESERVED DESIGNATED $551,000 $501,000 $501,000 $515,000 $50,000 $50,000 10.0%
F0 Mayor & Council Stipendium $50,000 $0 $0 $0 $50,000 $50,000 N/A
F1 Vehicle Replacement 61,000 61,000 61,000 125,000 $0 $0 0.0%
F2 Tree Replacement 40,000 40,000 40,000 40,000 $0 $0 0.0%
F3 Road, Sidewalk, and Infrastructure Repairs 200,000 400,000 400,000 350,000 ($200,000) ($200,000) -50.0%
F4 Park Infrastructure 200,000 - - - $200,000 $200,000 N/A
F200 RESERVED DESIGNATED $1,179,054 $100,200 $100,200 $86,700 $1,078,854 $1,078,854 1076.7%
F5 Cemetery 4,154 3,800 3,800 3,800 $354 $354 9.3%
F6 Cable Capital Equipment 112,400 96,400 96,400 82,900 $16,000 $16,000 16.6%
F7 Road & Sidewalk Repairs (from Infrastructure Bond) 1,062,500 - - - $1,062,500 $1,062,500 N/A
DEBT SERVICE FUND
RD100 REVENUES $128,500 $240,600 $240,600 $245,700 ($112,100) ($112,100) -46.6%
RD1 Transfer From General Fund 128,500 240,600 240,600 245,700 ($112,100) ($112,100) -46.6%
D100 EXPENDITURES $337,301 $240,600 $240,600 $1,278,245 $96,701 $96,701 40.2%
D1 Principal 105,400 105,400 98,810 ($105,400) ($105,400) -100.0%
D2 Interest 6,100 6,100 11,541 ($6,100) ($6,100) -100.0%
D3 Fees 600 600 587 ($600) ($600) -100.0%
D4 Debt Service - Infrastructure Bond 208,801 N/A
D4 Debt Service - Pension Plan 128,500 128,500 128,500 1,167,307 $0 $0 0.0%
TOTAL EXPENDITURES $7,708,766 $4,181,955 $4,582,873 $5,343,065 $3,526,811 $3,125,893 68.2%
GENERAL GOVERNMENT $1,169,310 $447,124 $714,084 $478,433 $722,186 $455,226 63.7%
PUBLIC WORKS $2,508,856 $1,187,584 $1,154,921 $1,174,929 $1,321,272 $1,353,935 117.2%
POLICE & SAFETY $860,040 $792,800 $748,900 $715,141 $67,240 $111,140 14.8%
UNRESERVED DESIGNATED $551,000 $501,000 $501,000 $515,000 $50,000 $50,000 10.0%
RESERVED DESIGNATED $1,179,054 $100,200 $100,200 $86,700 $1,078,854 $1,078,854 1076.7%
UNRESERVED UNDESIGNATED $1,103,205 $912,647 $1,123,168 $1,094,616 $190,558 ($19,963) -1.8%
DEBT SERVICE FUND $337,301 $240,600 $240,600 $1,278,245 $96,701 $96,701 40.2%
GENERAL REVENUE $5,775,597 $2,584,346 $2,886,557 $3,719,866 $3,191,251 $2,889,040 100.1%
GENERAL FUND EXPENDITURES $4,538,206 $2,427,508 $2,617,905 $2,368,503 $2,110,698 $1,920,301 73.4%
OPERATING SURPLUS/DEFICIT $1,237,391 $156,838 $268,652 $1,351,363
DEBT SERVICE $337,301 $240,600 $240,600 $1,278,245
TOTAL OPERATING SURPLUS/DEFICIT $900,090 ($83,762) $28,052 $73,117
FUND BALANCE RATIO 24.31% 37.60% 42.90%
28.73%
TOWN OF UNIVERSITY PARK
RESERVES, DEBT SERVICE AND BUDGET
RECONCILIATION
PROPOSED BUDGET FY2012
FUND BALANCE RATIO without Grant
Revenue and Expenditures Included
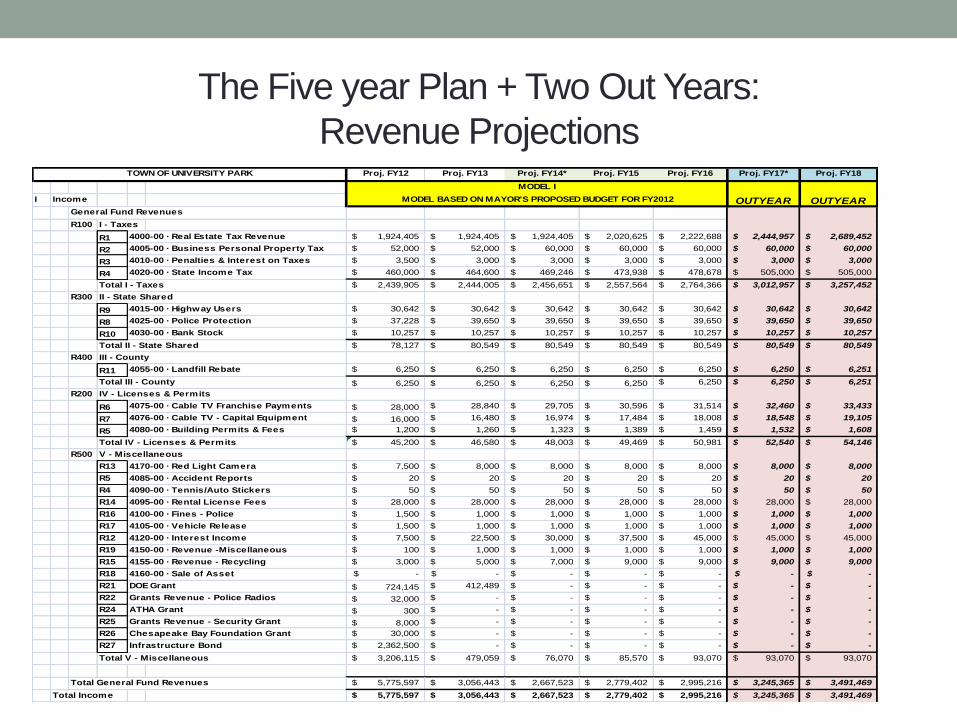
The Five year Plan + Two Out Years:
Revenue Projections Proj. FY12 Proj. FY13 Proj. FY14* Proj. FY15 Proj. FY16 Proj. FY17* Proj. FY18
I Income
General Fund Revenues
R100 I - Taxes
R1 4000-00 · Real Estate Tax Revenue 1,924,405$ 1,924,405$ 1,924,405$ 2,020,625$ 2,222,688$ 2,444,957$ 2,689,452$
R2 4005-00 · Business Personal Property Tax 52,000$ 52,000$ 60,000$ 60,000$ 60,000$ 60,000$ 60,000$
R3 4010-00 · Penalties & Interest on Taxes 3,500$ 3,000$ 3,000$ 3,000$ 3,000$ 3,000$ 3,000$
R4 4020-00 · State Income Tax 460,000$ 464,600$ 469,246$ 473,938$ 478,678$ 505,000$ 505,000$
Total I - Taxes 2,439,905$ 2,444,005$ 2,456,651$ 2,557,564$ 2,764,366$ 3,012,957$ 3,257,452$
R300 II - State Shared
R9 4015-00 · Highway Users 30,642$ 30,642$ 30,642$ 30,642$ 30,642$ 30,642$ 30,642$
R8 4025-00 · Police Protection 37,228$ 39,650$ 39,650$ 39,650$ 39,650$ 39,650$ 39,650$
R10 4030-00 · Bank Stock 10,257$ 10,257$ 10,257$ 10,257$ 10,257$ 10,257$ 10,257$
Total II - State Shared 78,127$ 80,549$ 80,549$ 80,549$ 80,549$ 80,549$ 80,549$
R400 III - County
R11 4055-00 · Landfill Rebate 6,250$ 6,250$ 6,250$ 6,250$ 6,250$ 6,250$ 6,251$
Total III - County 6,250$ 6,250$ 6,250$ 6,250$ 6,250$ 6,250$ 6,251$
R200 IV - Licenses & Permits
R6 4075-00 · Cable TV Franchise Payments 28,000$ 28,840$ 29,705$ 30,596$ 31,514$ 32,460$ 33,433$
R7 4076-00 · Cable TV - Capital Equipment 16,000$ 16,480$ 16,974$ 17,484$ 18,008$ 18,548$ 19,105$
R5 4080-00 · Building Permits & Fees 1,200$ 1,260$ 1,323$ 1,389$ 1,459$ 1,532$ 1,608$
Total IV - Licenses & Permits 45,200$ 46,580$ 48,003$ 49,469$ 50,981$ 52,540$ 54,146$
R500 V - Miscellaneous
R13 4170-00 · Red Light Camera 7,500$ 8,000$ 8,000$ 8,000$ 8,000$ 8,000$ 8,000$
R5 4085-00 · Accident Reports 20$ 20$ 20$ 20$ 20$ 20$ 20$
R4 4090-00 · Tennis/Auto Stickers 50$ 50$ 50$ 50$ 50$ 50$ 50$
R14 4095-00 · Rental License Fees 28,000$ 28,000$ 28,000$ 28,000$ 28,000$ 28,000$ 28,000$
R16 4100-00 · Fines - Police 1,500$ 1,000$ 1,000$ 1,000$ 1,000$ 1,000$ 1,000$
R17 4105-00 · Vehicle Release 1,500$ 1,000$ 1,000$ 1,000$ 1,000$ 1,000$ 1,000$
R12 4120-00 · Interest Income 7,500$ 22,500$ 30,000$ 37,500$ 45,000$ 45,000$ 45,000$
R19 4150-00 · Revenue -Miscellaneous 100$ 1,000$ 1,000$ 1,000$ 1,000$ 1,000$ 1,000$
R15 4155-00 · Revenue - Recycling 3,000$ 5,000$ 7,000$ 9,000$ 9,000$ 9,000$ 9,000$
R18 4160-00 · Sale of Asset -$ -$ -$ -$ -$ -$ -$
R21 DOE Grant 724,145$ 412,489$ -$ -$ -$ -$ -$
R22 Grants Revenue - Police Radios 32,000$ -$ -$ -$ -$ -$ -$
R24 ATHA Grant 300$ -$ -$ -$ -$ -$ -$
R25 Grants Revenue - Security Grant 8,000$ -$ -$ -$ -$ -$ -$
R26 Chesapeake Bay Foundation Grant 30,000$ -$ -$ -$ -$ -$ -$
R27 Infrastructure Bond 2,362,500$ -$ -$ -$ -$ -$ -$
Total V - Miscellaneous 3,206,115$ 479,059$ 76,070$ 85,570$ 93,070$ 93,070$ 93,070$
Total General Fund Revenues 5,775,597$ 3,056,443$ 2,667,523$ 2,779,402$ 2,995,216$ 3,245,365$ 3,491,469$
Total Income 5,775,597$ 3,056,443$ 2,667,523$ 2,779,402$ 2,995,216$ 3,245,365$ 3,491,469$
TOWN OF UNIVERSITY PARK
MODEL I
OUTYEAR MODEL BASED ON MAYOR'S PROPOSED BUDGET FOR FY2012
INCLUDES 3 YEAR STREET MAINTENANCE & REPAIR PLAN OUTYEAR
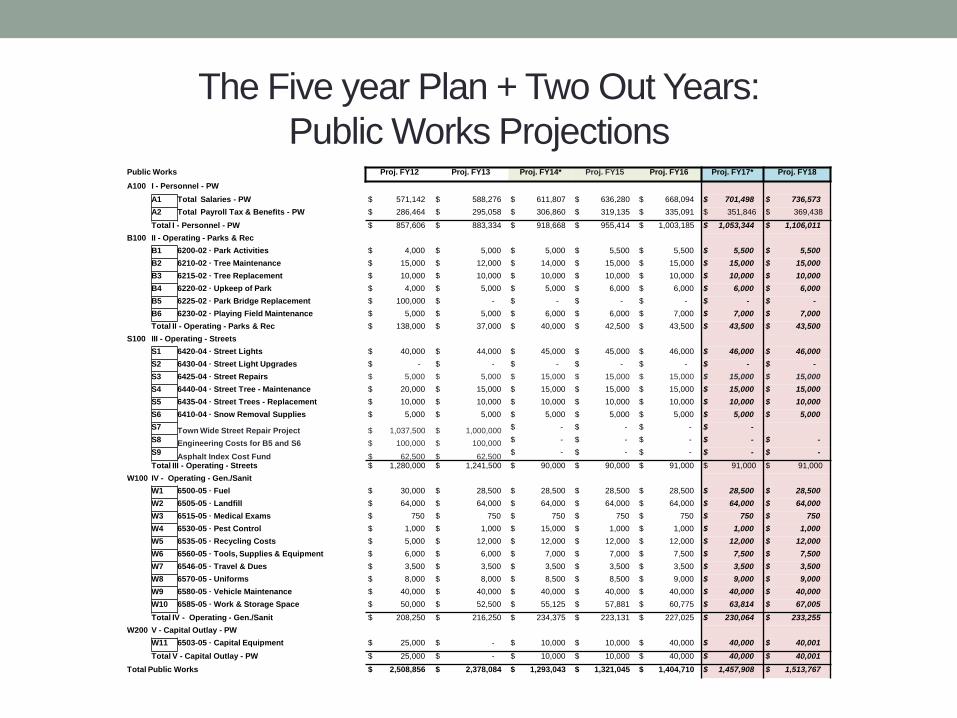
The Five year Plan + Two Out Years:
Public Works Projections Public Works Proj. FY12 Proj. FY13 Proj. FY14* Proj. FY15 Proj. FY16 Proj. FY17* Proj. FY18
A100 I - Personnel - PW
A1 Total Salaries - PW $ 571,142 $ 588,276 $ 611,807 $ 636,280 $ 668,094 $ 701,498 $ 736,573
A2 Total Payroll Tax & Benefits - PW $ 286,464 $ 295,058 $ 306,860 $ 319,135 $ 335,091 $ 351,846 $ 369,438
Total I - Personnel - PW $ 857,606 $ 883,334 $ 918,668 $ 955,414 $ 1,003,185 $ 1,053,344 $ 1,106,011
B100 II - Operating - Parks & Rec
B1 6200-02 · Park Activities $ 4,000 $ 5,000 $ 5,000 $ 5,500 $ 5,500 $ 5,500 $ 5,500
B2 6210-02 · Tree Maintenance $ 15,000 $ 12,000 $ 14,000 $ 15,000 $ 15,000 $ 15,000 $ 15,000
B3 6215-02 · Tree Replacement $ 10,000 $ 10,000 $ 10,000 $ 10,000 $ 10,000 $ 10,000 $ 10,000
B4 6220-02 · Upkeep of Park $ 4,000 $ 5,000 $ 5,000 $ 6,000 $ 6,000 $ 6,000 $ 6,000
B5 6225-02 · Park Bridge Replacement $ 100,000 $ - $ - $ - $ - $ - $ -
B6 6230-02 · Playing Field Maintenance $ 5,000 $ 5,000 $ 6,000 $ 6,000 $ 7,000 $ 7,000 $ 7,000
Total II - Operating - Parks & Rec $ 138,000 $ 37,000 $ 40,000 $ 42,500 $ 43,500 $ 43,500 $ 43,500
S100 III - Operating - Streets
S1 6420-04 · Street Lights $ 40,000 $ 44,000 $ 45,000 $ 45,000 $ 46,000 $ 46,000 $ 46,000
S2 6430-04 · Street Light Upgrades $ - $ - $ - $ - $ - $ - $ -
S3 6425-04 · Street Repairs $ 5,000 $ 5,000 $ 15,000 $ 15,000 $ 15,000 $ 15,000 $ 15,000
S4 6440-04 · Street Tree - Maintenance $ 20,000 $ 15,000 $ 15,000 $ 15,000 $ 15,000 $ 15,000 $ 15,000
S5 6435-04 · Street Trees - Replacement $ 10,000 $ 10,000 $ 10,000 $ 10,000 $ 10,000 $ 10,000 $ 10,000
S6 6410-04 · Snow Removal Supplies $ 5,000 $ 5,000 $ 5,000 $ 5,000 $ 5,000 $ 5,000 $ 5,000
S7 Town Wide Street Repair Project $ 1,037,500 $ 1,000,000 $ - $ - $ - $ -
S8 Engineering Costs for B5 and S6 $ 100,000 $ 100,000 $ - $ - $ - $ - $ -
S9 Asphalt Index Cost Fund $ 62,500 $ 62,500
$ - $ - $ - $ - $ -
Total III - Operating - Streets $ 1,280,000 $ 1,241,500 $ 90,000 $ 90,000 $ 91,000 $ 91,000 $ 91,000
W100 IV - Operating - Gen./Sanit
W1 6500-05 · Fuel $ 30,000 $ 28,500 $ 28,500 $ 28,500 $ 28,500 $ 28,500 $ 28,500
W2 6505-05 · Landfill $ 64,000 $ 64,000 $ 64,000 $ 64,000 $ 64,000 $ 64,000 $ 64,000
W3 6515-05 · Medical Exams $ 750 $ 750 $ 750 $ 750 $ 750 $ 750 $ 750
W4 6530-05 · Pest Control $ 1,000 $ 1,000 $ 15,000 $ 1,000 $ 1,000 $ 1,000 $ 1,000
W5 6535-05 · Recycling Costs $ 5,000 $ 12,000 $ 12,000 $ 12,000 $ 12,000 $ 12,000 $ 12,000
W6 6560-05 · Tools, Supplies & Equipment $ 6,000 $ 6,000 $ 7,000 $ 7,000 $ 7,500 $ 7,500 $ 7,500
W7 6546-05 · Travel & Dues $ 3,500 $ 3,500 $ 3,500 $ 3,500 $ 3,500 $ 3,500 $ 3,500
W8 6570-05 - Uniforms $ 8,000 $ 8,000 $ 8,500 $ 8,500 $ 9,000 $ 9,000 $ 9,000
W9 6580-05 · Vehicle Maintenance $ 40,000 $ 40,000 $ 40,000 $ 40,000 $ 40,000 $ 40,000 $ 40,000
W10 6585-05 · Work & Storage Space $ 50,000 $ 52,500 $ 55,125 $ 57,881 $ 60,775 $ 63,814 $ 67,005
Total IV - Operating - Gen./Sanit $ 208,250 $ 216,250 $ 234,375 $ 223,131 $ 227,025 $ 230,064 $ 233,255
W200 V - Capital Outlay - PW
W11 6503-05 · Capital Equipment $ 25,000 $ - $ 10,000 $ 10,000 $ 40,000 $ 40,000 $ 40,001
Total V - Capital Outlay - PW $ 25,000 $ - $ 10,000 $ 10,000 $ 40,000 $ 40,000 $ 40,001
Total Public Works $ 2,508,856 $ 2,378,084 $ 1,293,043 $ 1,321,045 $ 1,404,710 $ 1,457,908 $ 1,513,767

Summary of Five Year + Two Plan:
FY2012-FY2018
Budget Summary FY2012 FY2013 FY2014 FY2015 FY2016 FY2017 FY2018
Revenues $ 5,775,597 $ 3,056,443 $ 2,667,523 $ 2,779,402 $ 2,995,216 $ 3,245,365 $ 3,491,469
General Government $ 1,169,310 $ 913,011 $ 541,542 $ 553,531 $ 566,971 $ 574,573 $ 585,264
Public Works $ 2,508,856 $ 2,378,084 $ 1,293,043 $ 1,321,045 $ 1,404,710 $ 1,457,908 $ 1,513,767
Police Department $ 860,041 $ 827,474 $ 893,195 $ 936,514 $ 978,185 $ 1,037,254 $ 1,082,425
Total Expenditures $ 4,538,207 $ 4,118,569 $ 2,727,779 $ 2,811,091 $ 2,949,866 $ 3,069,735 $ 3,181,456
Debt Expenditures $ 329,343 $ 305,718 $ 305,718 $ 305,718 $ 305,718 $ 305,718 $ 305,718
Budget Surplus/Deficit $ 908,048 $ (1,367,844) $ (365,975) $ (337,407) $ (260,368) $ (130,088) $ 4,295
Total Reserves $ 2,833,259 $ 1,665,415 $ 1,499,440 $ 1,362,034 $ 1,301,666 $ 1,241,298 $ 1,245,593
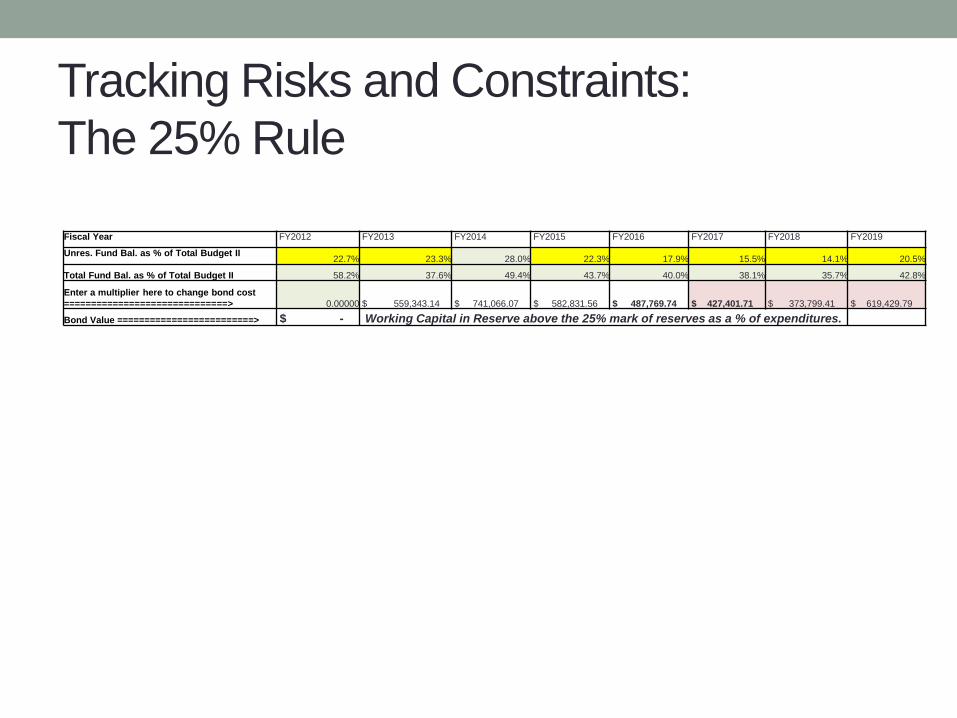
Tracking Risks and Constraints:
The 25% Rule
Fiscal Year FY2012 FY2013 FY2014 FY2015 FY2016 FY2017 FY2018 FY2019
Unres. Fund Bal. as % of Total Budget II 22.7% 23.3% 28.0% 22.3% 17.9% 15.5% 14.1% 20.5%
Total Fund Bal. as % of Total Budget II 58.2% 37.6% 49.4% 43.7% 40.0% 38.1% 35.7% 42.8%
Enter a multiplier here to change bond cost
==============================> 0.00000 $ 559,343.14 $ 741,066.07 $ 582,831.56 $ 487,769.74 $ 427,401.71 $ 373,799.41 $ 619,429.79
Bond Value =========================> $ - Working Capital in Reserve above the 25% mark of reserves as a % of expenditures.

Labor: The Primary Cost Driver
Labor FY2012 FY2013 FY2014 FY2015 FY2016 FY2017 FY2018
Salaries & Wages 1,303,092 1,351,771 1,331,392 1,390,576 1,458,805 1,530,413 1,604,919
Benefits 570,010 591,281 586,394 612,645 643,278 675,442 709,214
Labor Total 1,873,102 1,943,052 1,917,786 2,003,222 2,102,083 2,205,854 2,314,133
Percent 41.3% 47.2% 70.3% 71.3% 71.3% 71.9% 72.7%
Forecasting Wages & Benefits
The Problem of Wage Drift
1.Merit Increases
2.Promotions
3.Cost of Living Increases

The Wage Table 7/1/2012 STEP
GRADE 1 2 3 4 5 6 7 8 9 10 11 12
1 24,459.66 25,193.45 25,949.25 26,727.73 27,529.56 28,355.45 29,206.11 30,082.29 30,984.76 31,914.30 32,871.73 33,857.89
2 26,294.13 27,082.96 27,895.44 28,732.31 29,594.28 30,482.10 31,396.57 32,338.46 33,308.62 34,307.88 35,337.11 36,397.23
3 28,266.19 29,114.18 29,987.60 30,887.23 31,813.85 32,768.26 33,751.31 34,763.85 35,806.77 36,880.97 37,987.40 39,127.02
4 30,386.16 31,297.74 32,236.67 33,203.77 34,199.89 35,225.88 36,282.66 37,371.14 38,492.27 39,647.04 40,836.45 42,061.55
5 32,665.12 33,645.07 34,654.42 35,694.06 36,764.88 37,867.82 39,003.86 40,173.97 41,379.19 42,620.57 43,899.19 45,216.16
6 35,115.00 36,168.45 37,253.50 38,371.11 39,522.24 40,707.91 41,929.15 43,187.02 44,482.63 45,817.11 47,191.62 48,607.37
7 37,748.63 38,881.08 40,047.52 41,248.94 42,486.41 43,761.00 45,073.83 46,426.05 47,818.83 49,253.39 50,731.00 52,252.93
8 40,579.77 41,797.17 43,051.08 44,342.61 45,672.89 47,043.08 48,454.37 49,908.00 51,405.24 52,947.40 54,535.82 56,171.90
9 43,623.26 44,931.95 46,279.91 47,668.31 49,098.36 50,571.31 52,088.45 53,651.10 55,260.64 56,918.45 58,626.01 60,384.79
10 46,895.00 48,301.85 49,750.91 51,243.43 52,780.74 54,364.16 55,995.08 57,674.93 59,405.18 61,187.34 63,022.96 64,913.65
11 50,412.12 51,924.49 53,482.22 55,086.69 56,739.29 58,441.47 60,194.71 62,000.55 63,860.57 65,776.39 67,749.68 69,782.17
12 54,193.03 55,818.83 57,493.39 59,218.19 60,994.74 62,824.58 64,709.32 66,650.60 68,650.11 70,709.62 72,830.91 75,015.83
13 58,257.51 60,005.24 61,805.39 63,659.56 65,569.34 67,536.42 69,562.52 71,649.39 73,798.87 76,012.84 78,293.22 80,642.02
14 62,626.83 64,505.63 66,440.80 68,434.02 70,487.04 72,601.65 74,779.70 77,023.10 79,333.79 81,713.80 84,165.22 86,690.17
15 67,323.84 69,343.55 71,423.86 73,566.57 75,773.57 78,046.78 80,388.18 82,799.83 85,283.82 87,842.34 90,477.61 93,191.94
16 72,373.12 74,544.32 76,780.65 79,084.07 81,456.59 83,900.29 86,417.30 89,009.81 91,680.11 94,430.51 97,263.43 100,181.33
17 77,801.11 80,135.14 82,539.20 85,015.37 87,565.83 90,192.81 92,898.59 95,685.55 98,556.12 101,512.80 104,558.19 107,694.93
18 83,636.19 86,145.28 88,729.64 91,391.53 94,133.27 96,957.27 99,865.99 102,861.97 105,947.83 109,126.26 112,400.05 115,772.05
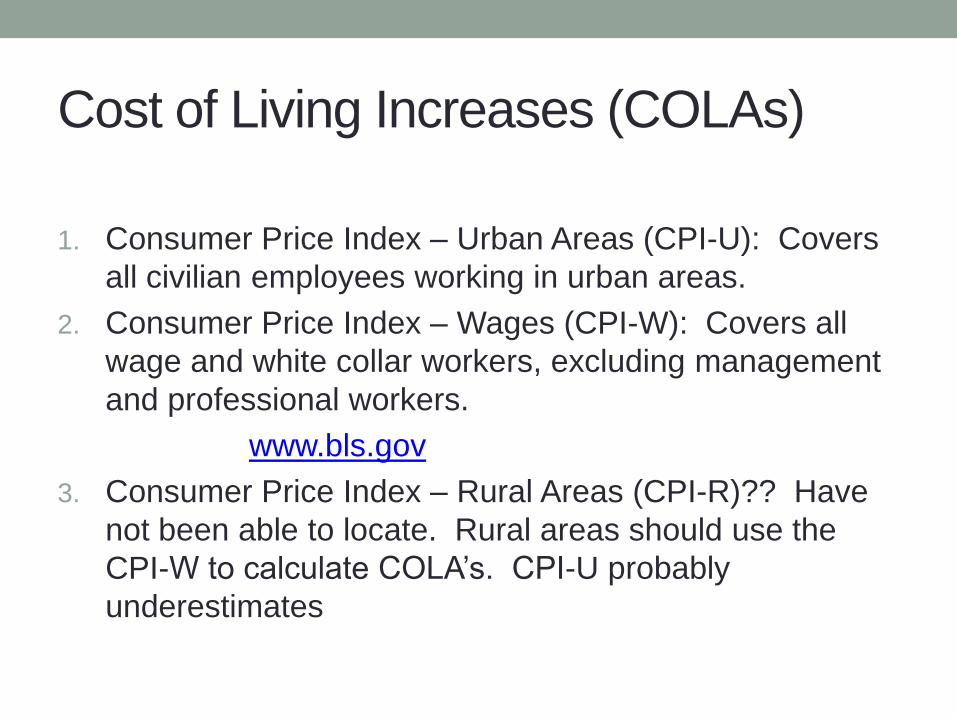
Cost of Living Increases (COLAs)
1. Consumer Price Index – Urban Areas (CPI-U): Covers
all civilian employees working in urban areas.
2. Consumer Price Index – Wages (CPI-W): Covers all
wage and white collar workers, excluding management
and professional workers.
www.bls.gov
3. Consumer Price Index – Rural Areas (CPI-R)?? Have
not been able to locate. Rural areas should use the
CPI-W to calculate COLA’s. CPI-U probably
underestimates
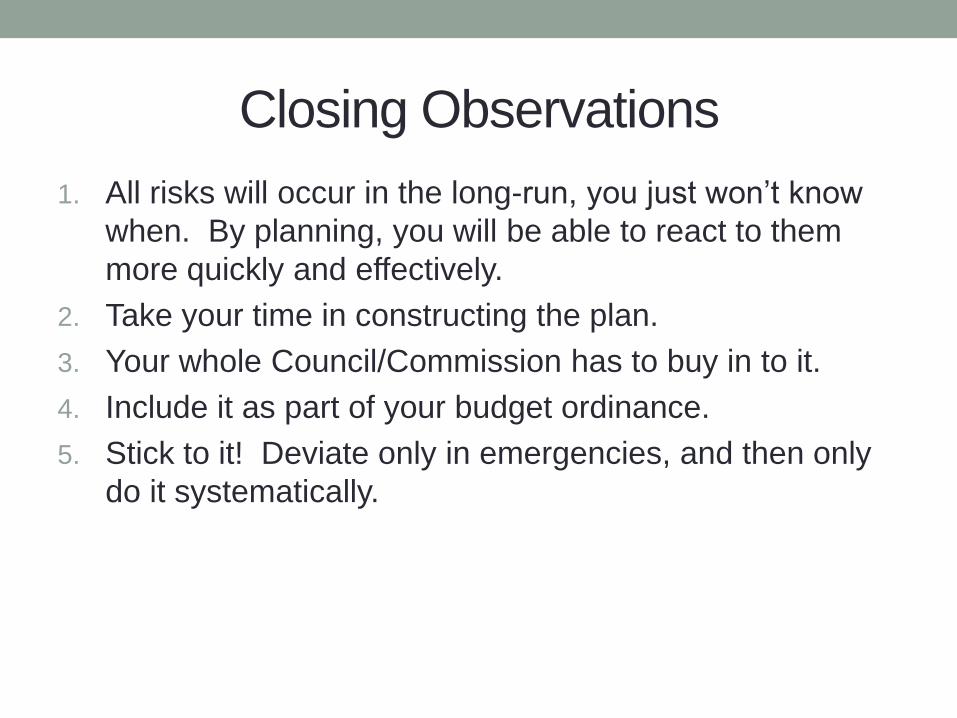
Closing Observations
1. All risks will occur in the long-run, you just won’t know
when. By planning, you will be able to react to them
more quickly and effectively.
2. Take your time in constructing the plan.
3. Your whole Council/Commission has to buy in to it.
4. Include it as part of your budget ordinance.
5. Stick to it! Deviate only in emergencies, and then only
do it systematically.