Embed Size (px)
Citation preview
1|
Budget Model Cost Pools and
SLA Update Meeting
Updated April 27, 2016
2|
Agenda
1. Budget Redesign Process
2. Tuition Allocation Methodology
3. F&A Faculty Reimbursement
4. Budget Model Cost Pools
5. Service Level Agreements
6. SLA Governance Committee
7. Strategic Investment Fund (SIF)
8. Cognos Project Update
3|
Budget Redesign Process
4|
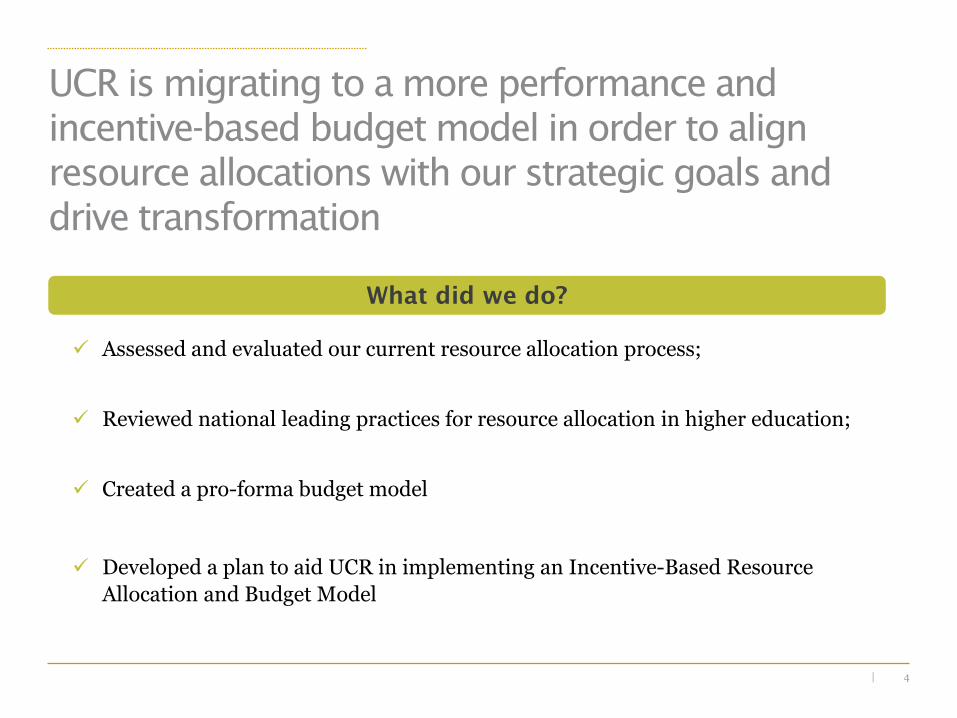
UCR is migrating to a more performance and
incentive-based budget model in order to align
resource allocations with our strategic goals and
drive transformation
Assessed and evaluated our current resource allocation process;
Reviewed national leading practices for resource allocation in higher education;
Created a pro-forma budget model
Developed a plan to aid UCR in implementing an Incentive-Based Resource
Allocation and Budget Model
What did we do?
5|
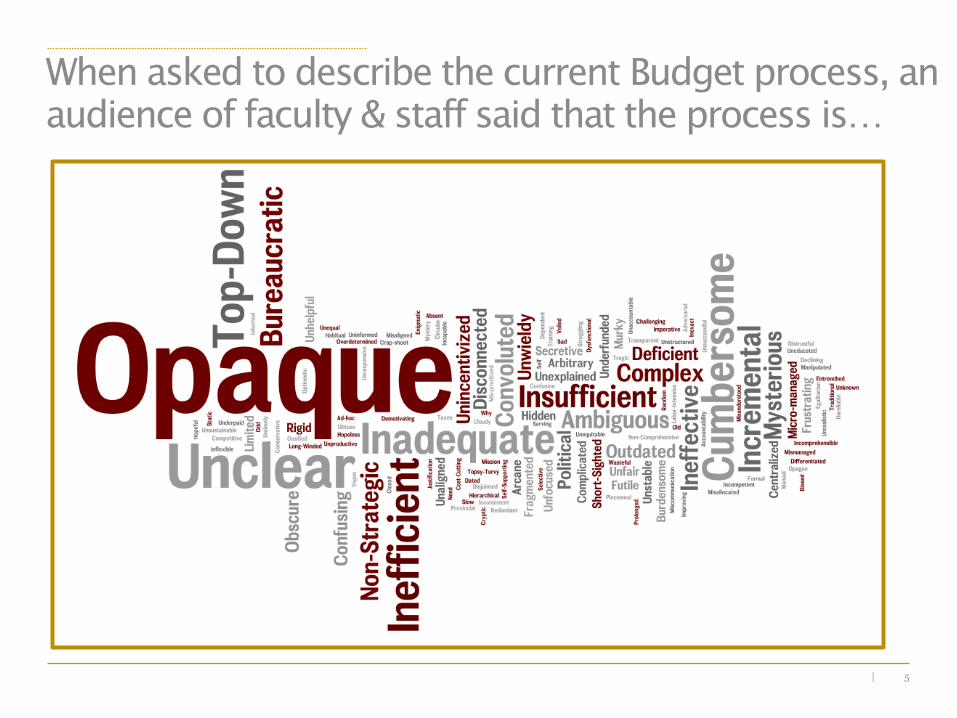
When asked to describe the current Budget process, an
audience of faculty & staff said that the process is…
6|
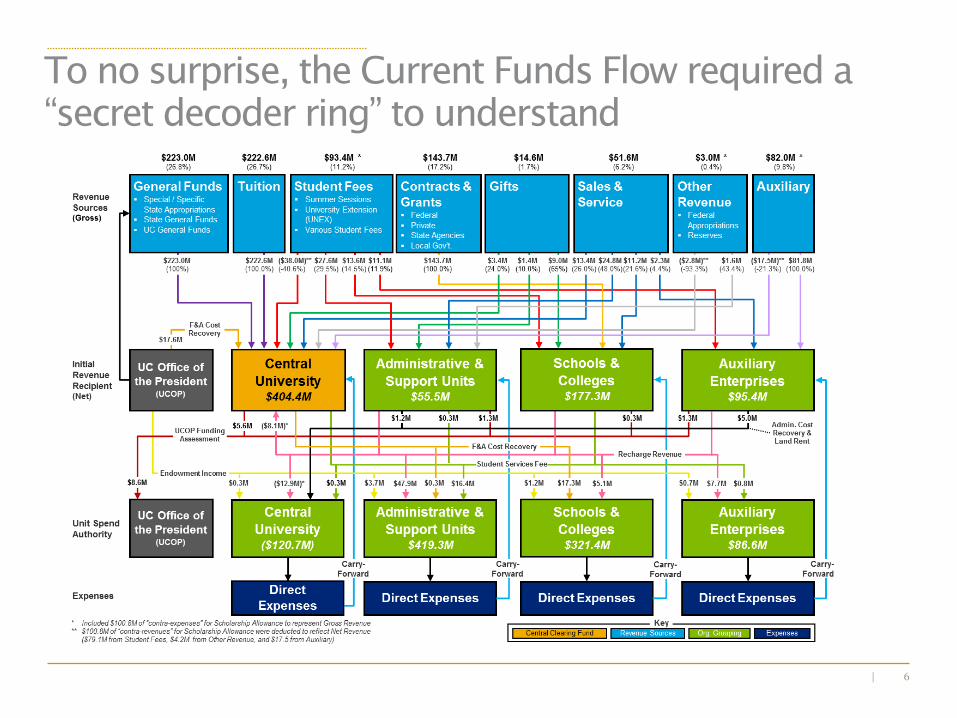
To no surprise, the Current Funds Flow required a
“secret decoder ring” to understand
7|
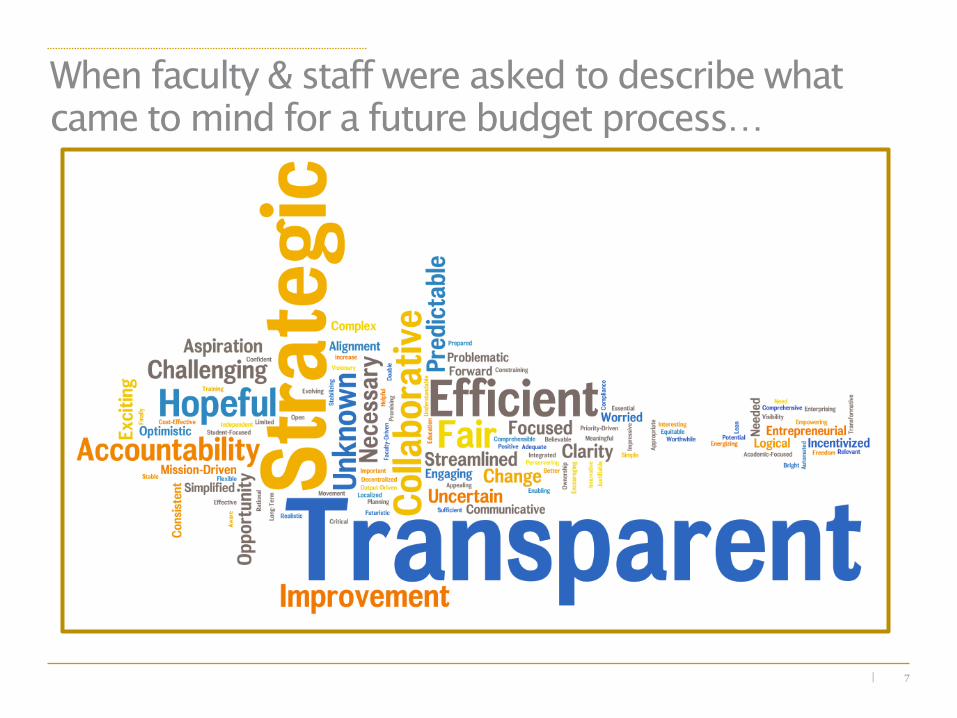
When faculty & staff were asked to describe what
came to mind for a future budget process…
8|
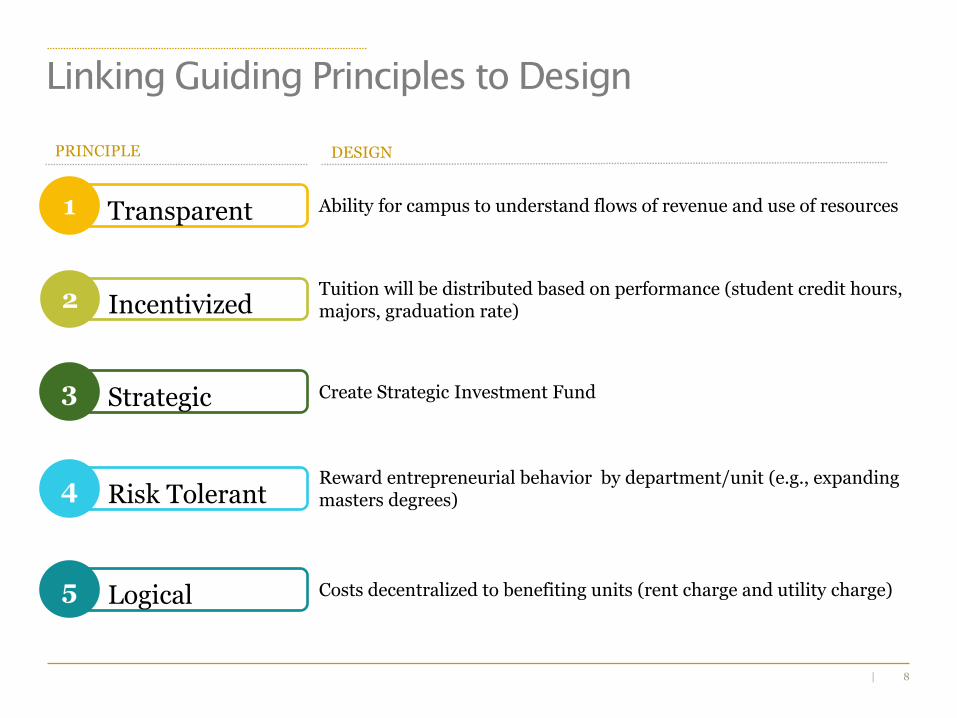
1 Transparent
2 Incentivized
3 Strategic
4 Risk Tolerant
5 Logical
Linking Guiding Principles to Design
Ability for campus to understand flows of revenue and use of resources
Tuition will be distributed based on performance (student credit hours, majors, graduation rate)
Create Strategic Investment Fund
Reward entrepreneurial behavior by department/unit (e.g., expanding masters degrees)
Costs decentralized to benefiting units (rent charge and utility charge)
PRINCIPLE DESIGN
9|
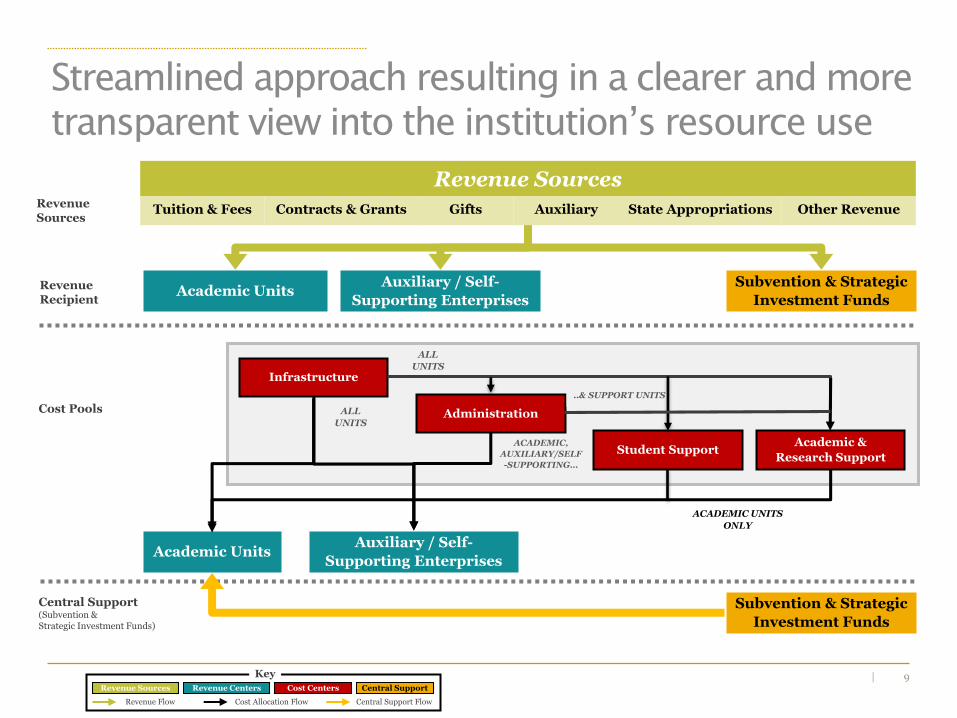
RevenueRecipient
Revenue Sources
Auxiliary / Self-
Supporting EnterprisesAcademic Units
Subvention & Strategic
Investment Funds
Central SupportRevenue Sources Revenue Centers
Key
Cost Centers
Revenue Flow Cost Allocation Flow Central Support Flow
Infrastructure
Administration
Student SupportAcademic &
Research Support
Auxiliary / Self-
Supporting EnterprisesAcademic Units
Cost Pools
Subvention & Strategic
Investment Funds
Central Support(Subvention & Strategic Investment Funds)
Revenue Sources
Tuition & Fees Contracts & Grants Gifts Auxiliary State Appropriations Other Revenue
ACADEMIC,
AUXILIARY/SELF
-SUPPORTING…
ALL
UNITS
ACADEMIC UNITS
ONLY
..& SUPPORT UNITS
ALL
UNITS
Streamlined approach resulting in a clearer and more
transparent view into the institution’s resource use
10|
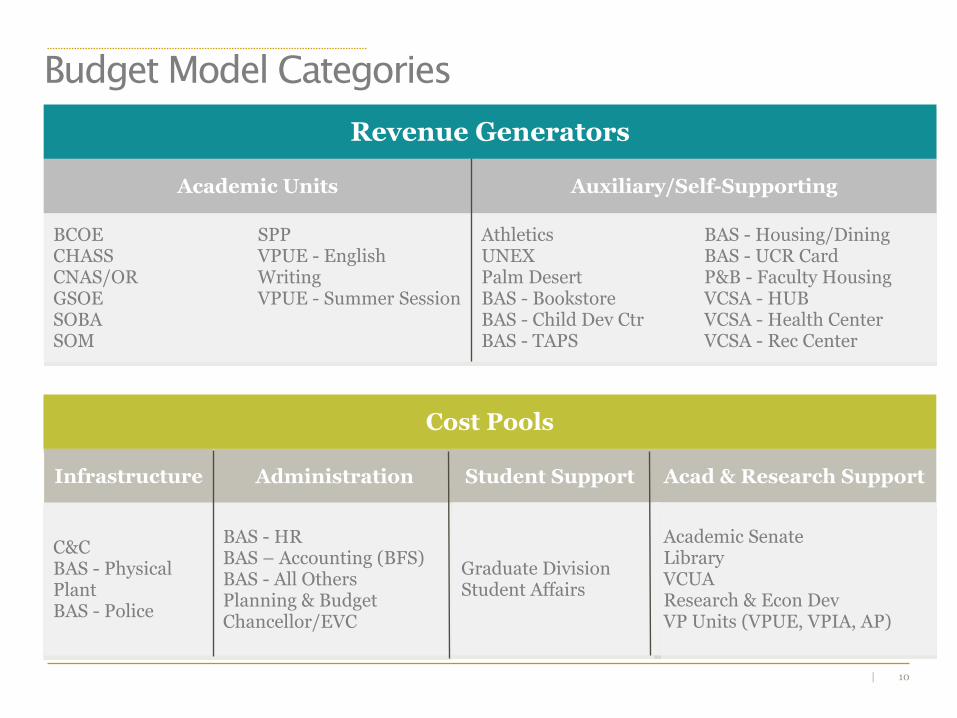
Budget Model Categories
Revenue Generators
Academic Units Auxiliary/Self-Supporting
BCOECHASSCNAS/ORGSOESOBASOM
SPPVPUE - English WritingVPUE - Summer Session
AthleticsUNEXPalm DesertBAS - BookstoreBAS - Child Dev CtrBAS - TAPS
BAS - Housing/DiningBAS - UCR Card P&B - Faculty HousingVCSA - HUBVCSA - Health CenterVCSA - Rec Center
Cost Pools
Infrastructure Administration Student Support Acad & Research Support
Academic SenateLibraryVCUAResearch & Econ DevVP Units (VPUE, VPIA, AP)
Graduate DivisionStudent Affairs
BAS - HRBAS – Accounting (BFS)BAS - All OthersPlanning & BudgetChancellor/EVC
C&CBAS - Physical PlantBAS - Police
11|
Campus Budget Model:
Tuition Allocation Methodology
12|
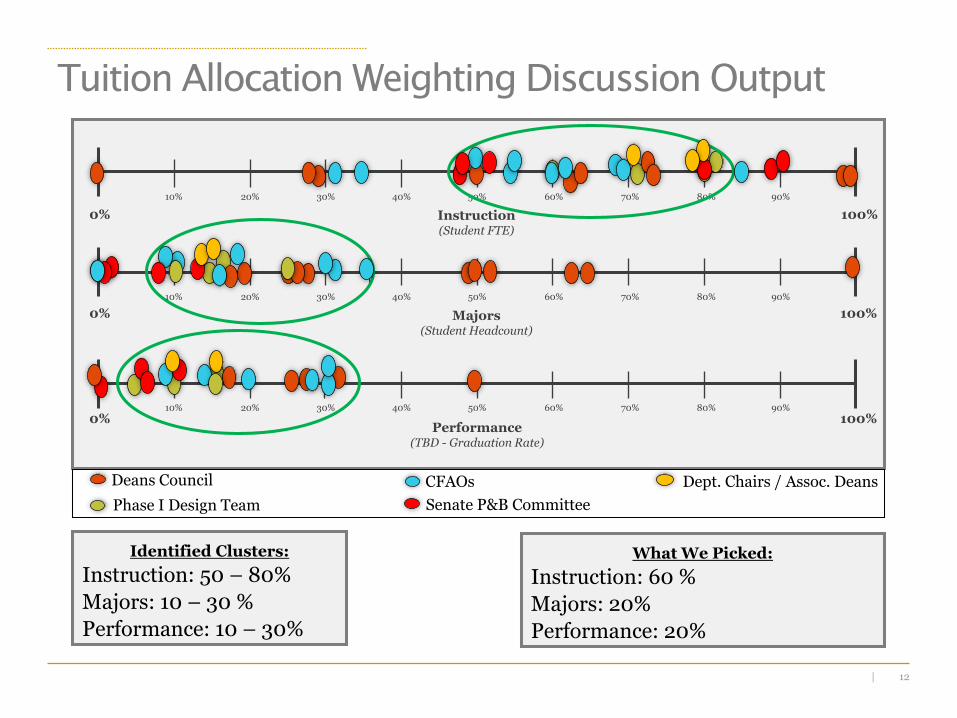
Instruction(Student FTE)
0% 100%
10%20%30%40%50%60%70%80%90%
Majors(Student Headcount)
0% 100%
10%20%30%40%50%60%70%80%90%
Performance(TBD - Graduation Rate)
0% 100%10%20%30%40%50%60%70%80%90%
Tuition Allocation Weighting Discussion Output
Senate P&B Committee
Deans Council
Phase I Design Team
CFAOs Dept. Chairs / Assoc. Deans
Identified Clusters:
Instruction: 50 – 80%
Majors: 10 – 30 %
Performance: 10 – 30%
What We Picked:
Instruction: 60 %
Majors: 20%
Performance: 20%
13|
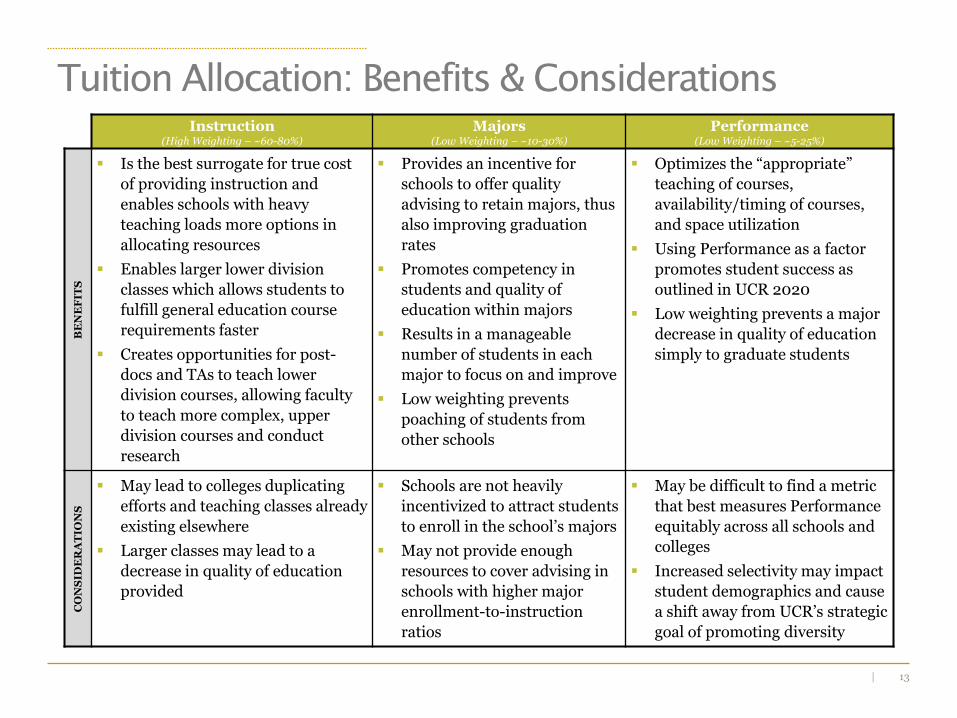
Tuition Allocation: Benefits & Considerations
Instruction (High Weighting – ~60-80%)
Majors (Low Weighting – ~10-30%)
Performance(Low Weighting – ~5-25%)
BE
NE
FIT
S
Is the best surrogate for true cost
of providing instruction and
enables schools with heavy
teaching loads more options in
allocating resources
Enables larger lower division
classes which allows students to
fulfill general education course
requirements faster
Creates opportunities for post-
docs and TAs to teach lower
division courses, allowing faculty
to teach more complex, upper
division courses and conduct
research
Provides an incentive for
schools to offer quality
advising to retain majors, thus
also improving graduation
rates
Promotes competency in
students and quality of
education within majors
Results in a manageable
number of students in each
major to focus on and improve
Low weighting prevents
poaching of students from
other schools
Optimizes the “appropriate”
teaching of courses,
availability/timing of courses,
and space utilization
Using Performance as a factor
promotes student success as
outlined in UCR 2020
Low weighting prevents a major
decrease in quality of education
simply to graduate students
CO
NS
IDE
RA
TIO
NS
May lead to colleges duplicating
efforts and teaching classes already
existing elsewhere
Larger classes may lead to a
decrease in quality of education
provided
Schools are not heavily
incentivized to attract students
to enroll in the school’s majors
May not provide enough
resources to cover advising in
schools with higher major
enrollment-to-instruction
ratios
May be difficult to find a metric
that best measures Performance
equitably across all schools and
colleges
Increased selectivity may impact
student demographics and cause
a shift away from UCR’s strategic
goal of promoting diversity
14|
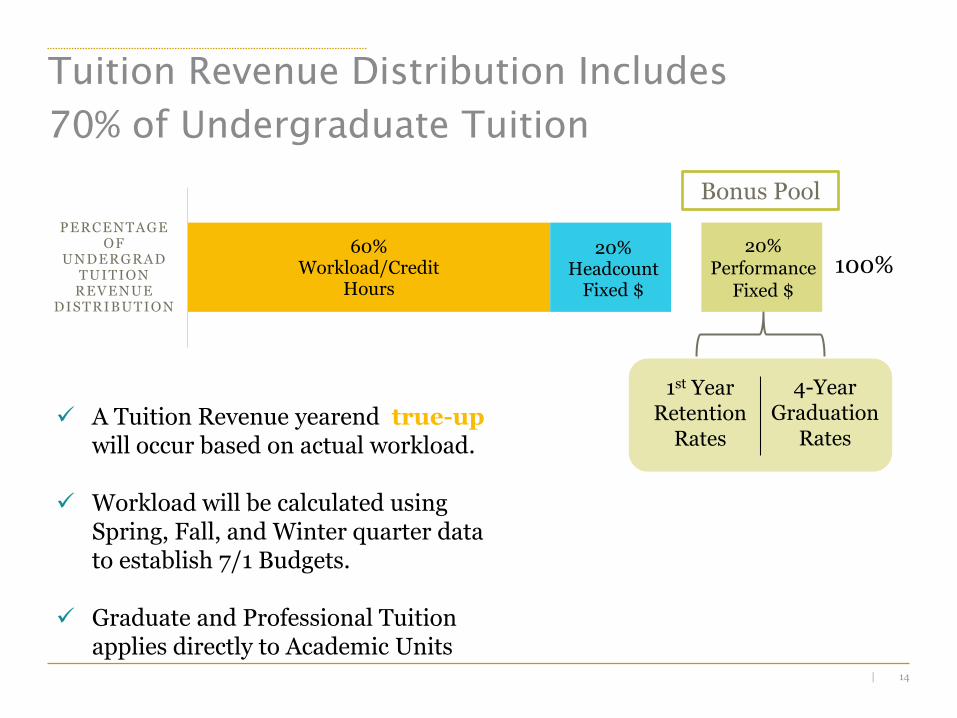
Tuition Revenue Distribution Includes
70% of Undergraduate Tuition
A Tuition Revenue yearend true-upwill occur based on actual workload.
Workload will be calculated using Spring, Fall, and Winter quarter data to establish 7/1 Budgets.
Graduate and Professional Tuition applies directly to Academic Units
100%60%
Workload/Credit Hours
20%Headcount
Fixed $
PERCENTAGE OF
UNDERGRAD TUITION
REVENUE DISTRIBUTION
20%Performance
Fixed $
1st Year Retention
Rates
4-Year Graduation
Rates
Bonus Pool
15|
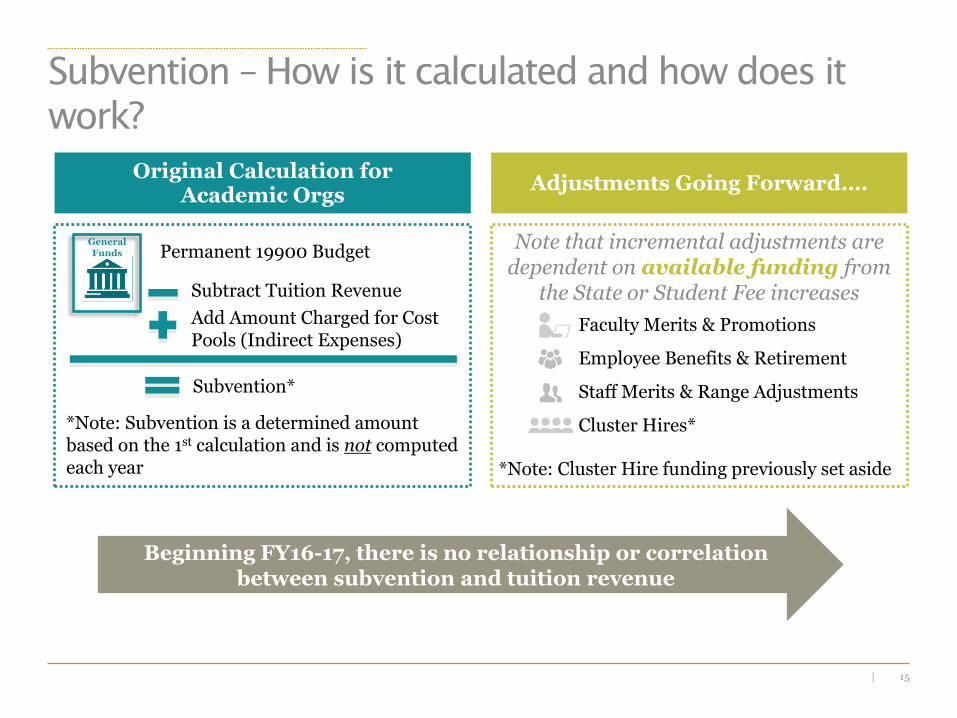
Subvention – How is it calculated and how does it
work?
Original Calculation for Academic Orgs
Permanent 19900 BudgetGeneral Funds
Subtract Tuition Revenue
Add Amount Charged for Cost Pools (Indirect Expenses)
Subvention*
Adjustments Going Forward….
Note that incremental adjustments are dependent on available funding from
the State or Student Fee increases
• Faculty Merits & Promotions
• Employee Benefits & Retirement
• Staff Merits & Range Adjustments
• Cluster Hires*
Beginning FY16-17, there is no relationship or correlation between subvention and tuition revenue
*Note: Subvention is a determined amount based on the 1st calculation and is not computed each year *Note: Cluster Hire funding previously set aside
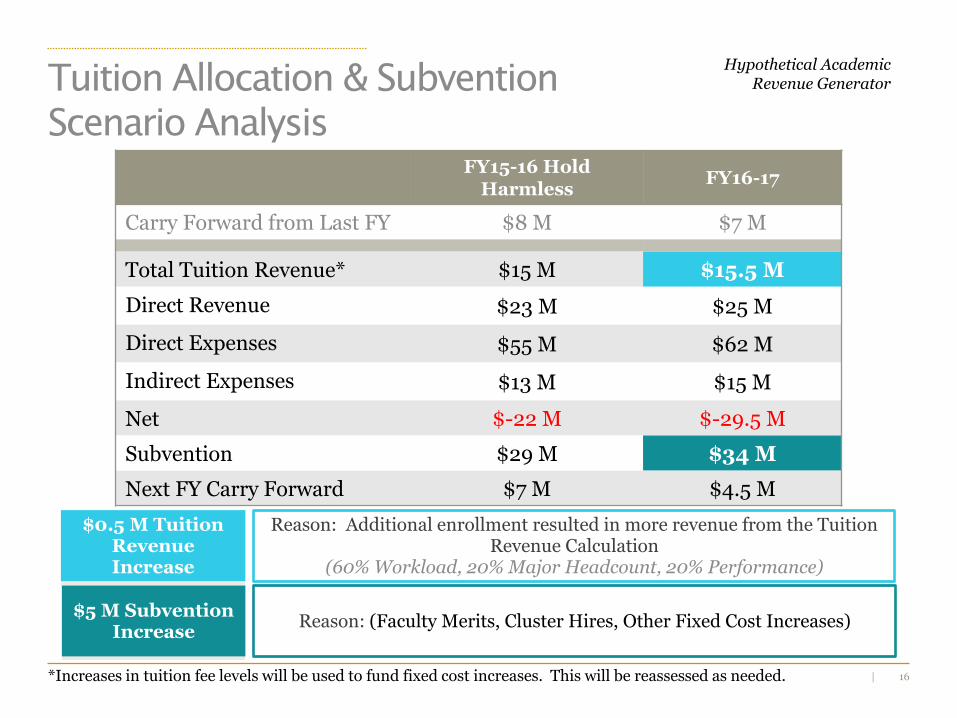
16|
Hypothetical AcademicRevenue Generator
FY15-16 Hold Harmless
FY16-17
Carry Forward from Last FY $8 M $7 Msfdgsd
Total Tuition Revenue* $15 M $15.5 M
Direct Revenue $23 M $25 M
Direct Expenses $55 M $62 M
Indirect Expenses $13 M $15 M
Net $-22 M $-29.5 M
Subvention $29 M $34 M
Next FY Carry Forward $7 M $4.5 M
Tuition Allocation & Subvention
Scenario Analysis
$0.5 M Tuition Revenue Increase
Reason: Additional enrollment resulted in more revenue from the Tuition Revenue Calculation
(60% Workload, 20% Major Headcount, 20% Performance)
$5 M Subvention Increase
Reason: (Faculty Merits, Cluster Hires, Other Fixed Cost Increases)
*Increases in tuition fee levels will be used to fund fixed cost increases. This will be reassessed as needed.
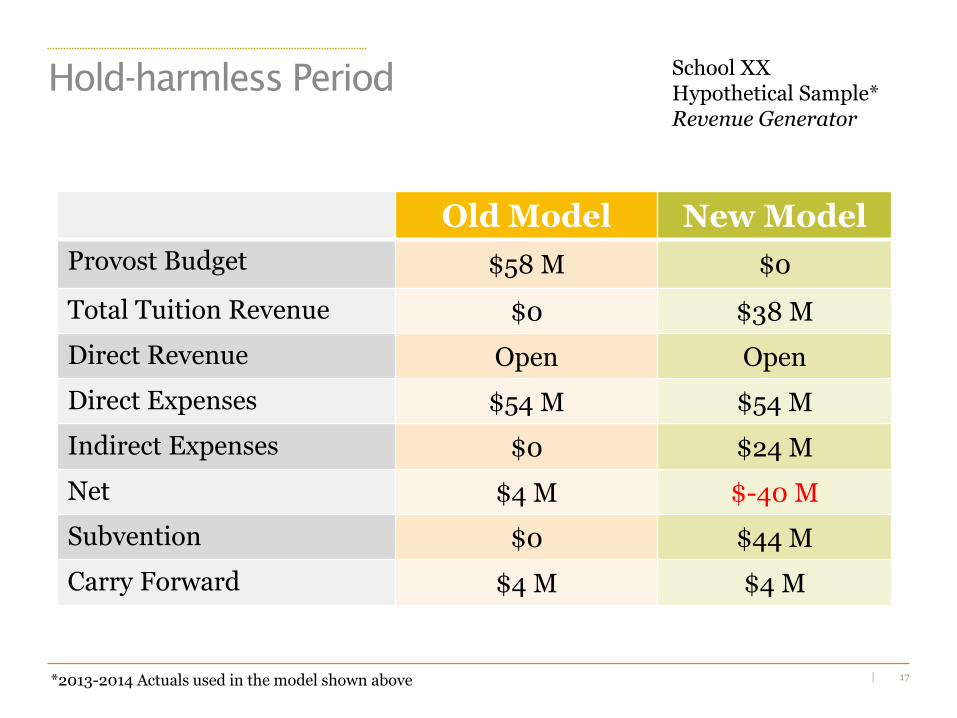
17|
Hold-harmless PeriodSchool XXHypothetical Sample*Revenue Generator
Old Model New Model
Provost Budget $58 M $0
Total Tuition Revenue $0 $38 M
Direct Revenue Open Open
Direct Expenses $54 M $54 M
Indirect Expenses $0 $24 M
Net $4 M $-40 M
Subvention $0 $44 M
Carry Forward $4 M $4 M
*2013-2014 Actuals used in the model shown above
18|
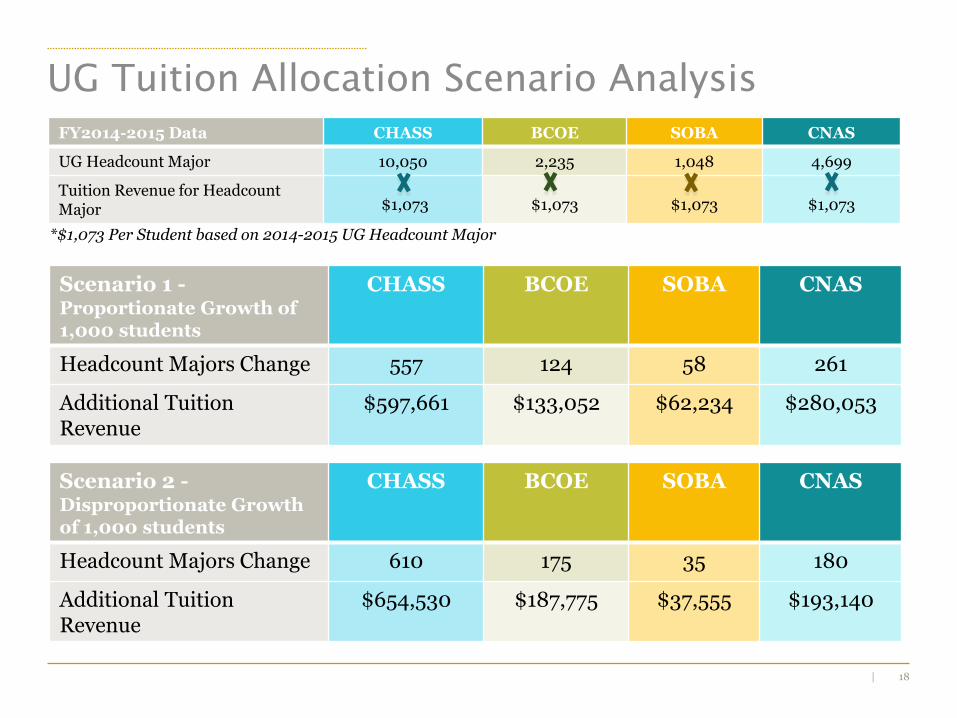
UG Tuition Allocation Scenario Analysis
*$1,073 Per Student based on 2014-2015 UG Headcount Major
FY2014-2015 Data CHASS BCOE SOBA CNAS
UG Headcount Major 10,050 2,235 1,048 4,699
Tuition Revenue for Headcount Major $1,073 $1,073 $1,073 $1,073
Scenario 1 -Proportionate Growth of 1,000 students
CHASS BCOE SOBA CNAS
Headcount Majors Change 557 124 58 261
Additional Tuition Revenue
$597,661 $133,052 $62,234 $280,053
Scenario 2 -Disproportionate Growth of 1,000 students
CHASS BCOE SOBA CNAS
Headcount Majors Change 610 175 35 180
Additional Tuition Revenue
$654,530 $187,775 $37,555 $193,140
19|
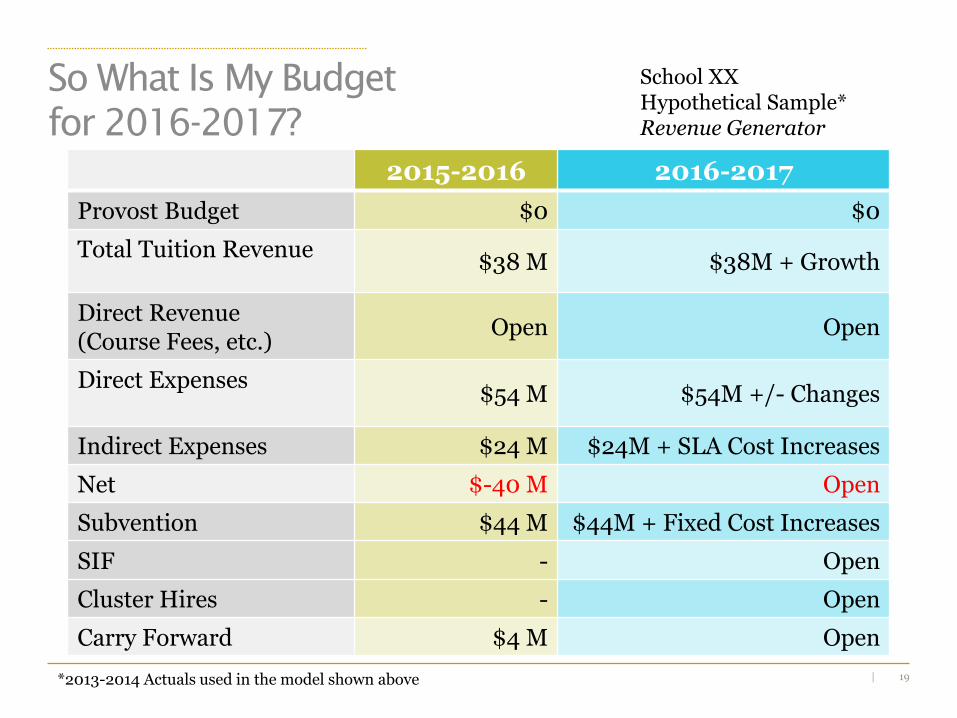
School XXHypothetical Sample*Revenue Generator
2015-2016 2016-2017
Provost Budget $0 $0
Total Tuition Revenue$38 M $38M + Growth
Direct Revenue (Course Fees, etc.)
Open Open
Direct Expenses$54 M $54M +/- Changes
Indirect Expenses $24 M $24M + SLA Cost Increases
Net $-40 M Open
Subvention $44 M $44M + Fixed Cost Increases
SIF - Open
Cluster Hires - Open
Carry Forward $4 M Open
*2013-2014 Actuals used in the model shown above
So What Is My Budget
for 2016-2017?
20|
Graduate Student
Fellowships
Graduate
Division
Ph.D. Student
Tuition
Revenue
Strategic
Investment
Fund (SIF)
Academic
Masters
Student Tuition
Revenue
Professional
Masters
Student Tuition
Revenue
Academic Units
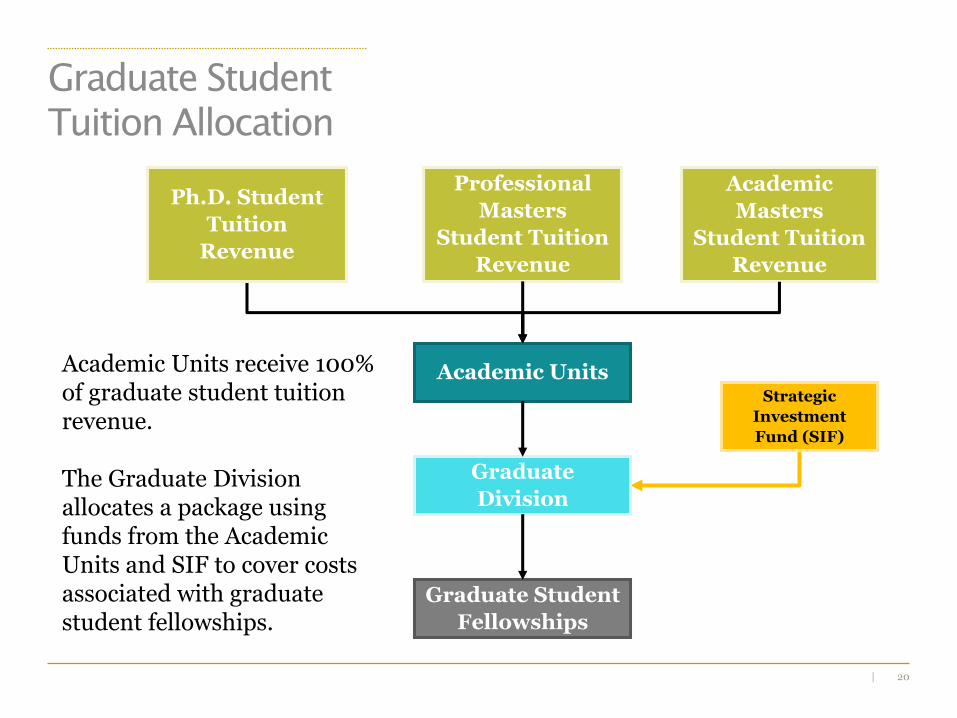
Graduate Student
Tuition Allocation
Academic Units receive 100% of graduate student tuition revenue.
The Graduate Division allocates a package using funds from the Academic Units and SIF to cover costs associated with graduate student fellowships.
21|
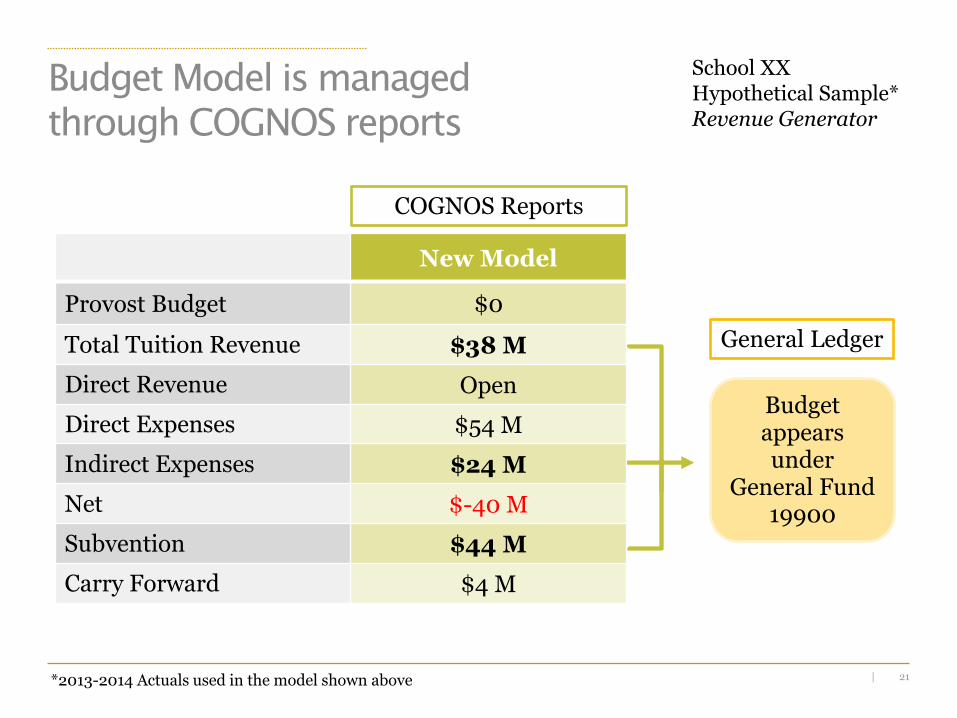
School XXHypothetical Sample*Revenue Generator
New Model
Provost Budget $0
Total Tuition Revenue $38 M
Direct Revenue Open
Direct Expenses $54 M
Indirect Expenses $24 M
Net $-40 M
Subvention $44 M
Carry Forward $4 M
*2013-2014 Actuals used in the model shown above
Budget Model is managed
through COGNOS reports
Budget appears under
General Fund 19900
COGNOS Reports
General Ledger
22|
F&A Faculty Reimbursement
23|
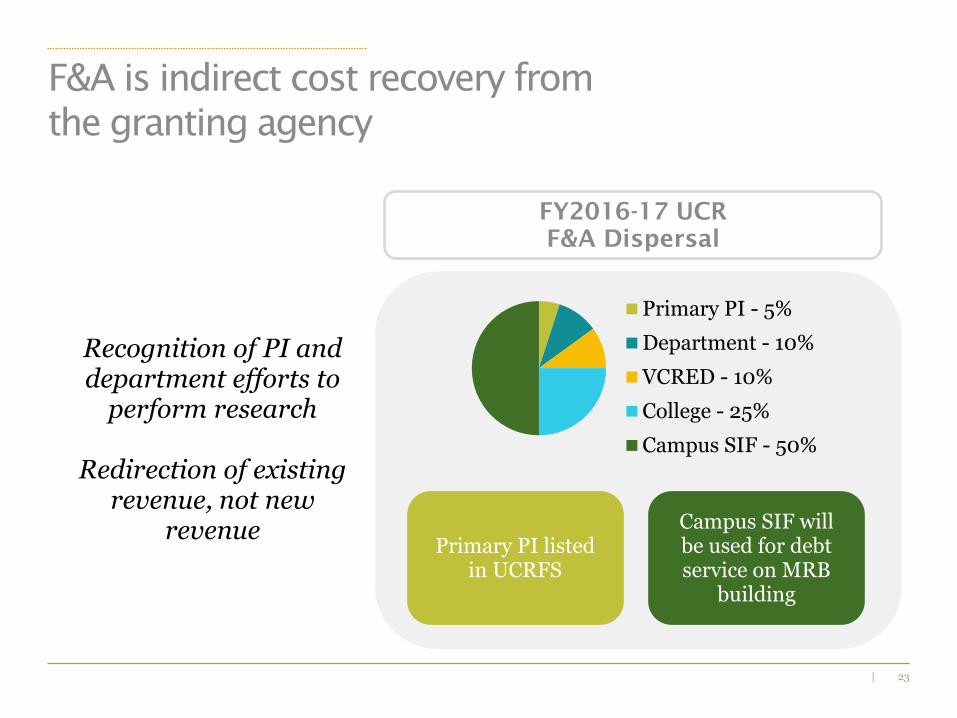
F&A is indirect cost recovery from
the granting agency
Recognition of PI and department efforts to
perform research
Redirection of existing revenue, not new
revenue
Primary PI - 5%
Department - 10%
VCRED - 10%
College - 25%
Campus SIF - 50%
FY2016-17 UCR
F&A Dispersal
Primary PI listed in UCRFS
Campus SIF will be used for debt service on MRB
building
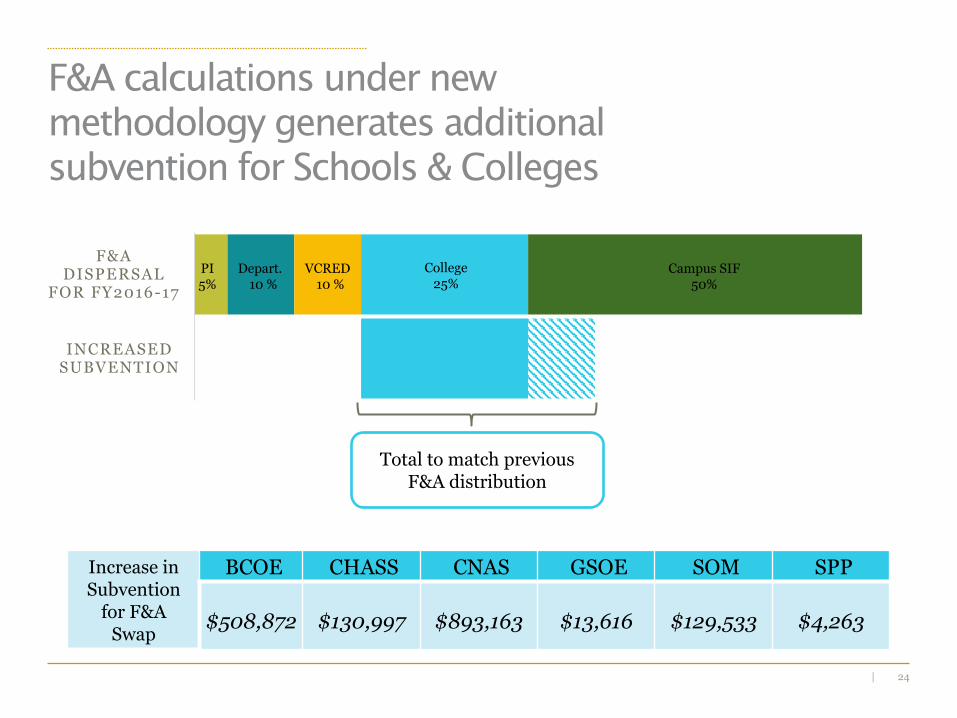
24|
F&A calculations under new
methodology generates additional
subvention for Schools & Colleges
INCREASED SUBVENTION
F&A DISPERSAL
FOR FY2016-17
College25%
Total to match previous F&A distribution
Increase in Subvention
for F&A Swap
BCOE CHASS CNAS GSOE SOM SPP
$508,872 $130,997 $893,163 $13,616 $129,533 $4,263
VCRED10 %
PI5%
Depart.10 %
Campus SIF50%

25|
Cost Pools

26|
RevenueRecipient
Revenue Sources
Auxiliary / Self-
Supporting EnterprisesAcademic Units
Subvention & Strategic
Investment Funds
Central SupportRevenue Sources Revenue Centers
Key
Cost Centers
Revenue Flow Cost Allocation Flow Central Support Flow
Infrastructure
Administration
Student SupportAcademic &
Research Support
Auxiliary / Self-
Supporting EnterprisesAcademic Units
Cost Pools
Subvention & Strategic
Investment Funds
Central Support(Subvention & Strategic Investment Funds)
Revenue Sources
Tuition & Fees Contracts & Grants Gifts Auxiliary StateAppropriations
Other Revenue
ACADEMIC,
AUXILIARY/SELF
-SUPPORTING…
ALL
UNITS
ACADEMIC UNITS
ONLY
New Campus Budget Model
..& SUPPORT UNITS
ALL
UNITS
27|
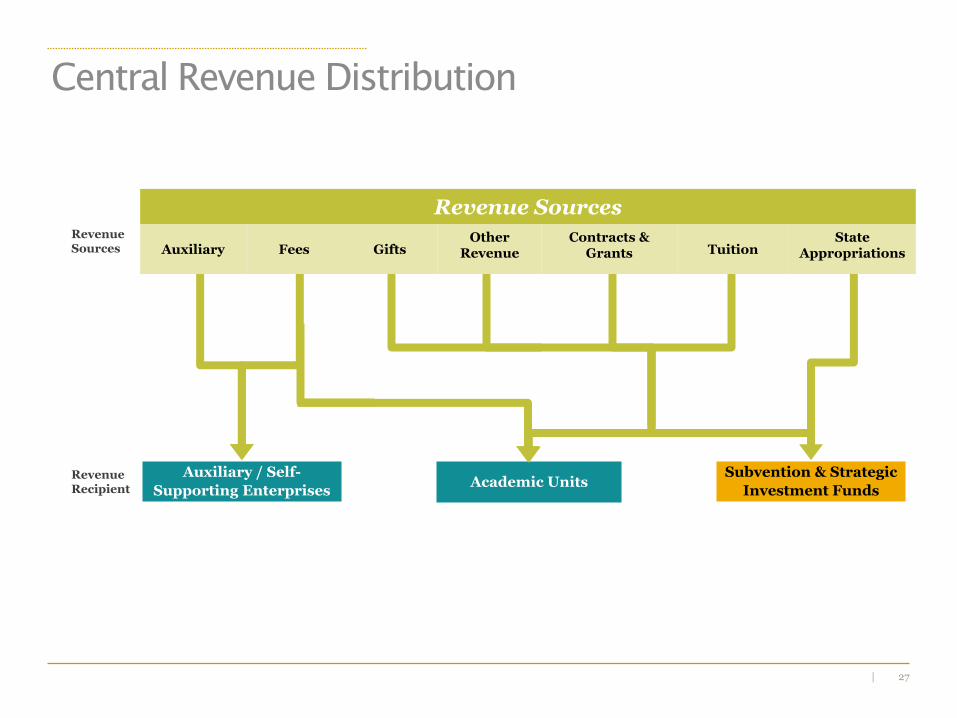
RevenueRecipient
Revenue Sources
Auxiliary / Self-
Supporting Enterprises
Central Revenue Distribution
Subvention & Strategic
Investment FundsAcademic Units
Revenue Sources
Auxiliary Fees GiftsOther
RevenueContracts &
Grants TuitionState
Appropriations
28|
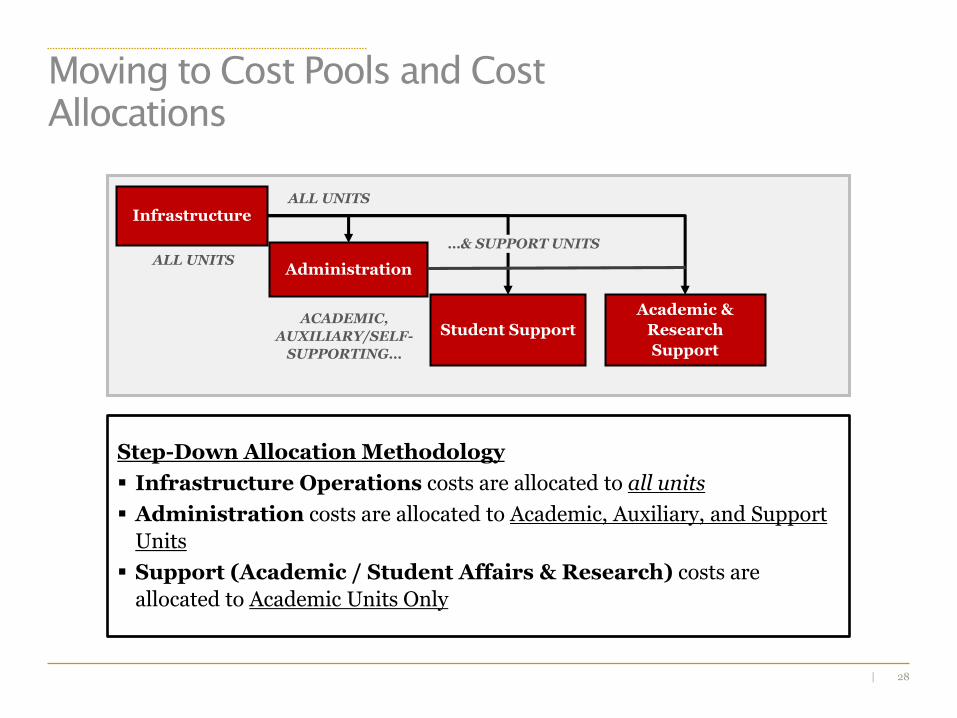
Moving to Cost Pools and Cost
Allocations
Step-Down Allocation Methodology
Infrastructure Operations costs are allocated to all units
Administration costs are allocated to Academic, Auxiliary, and Support
Units
Support (Academic / Student Affairs & Research) costs are
allocated to Academic Units Only
Infrastructure
Administration
Student Support
Academic &
Research
Support
ALL UNITS
ACADEMIC,
AUXILIARY/SELF-
SUPPORTING…
ALL UNITS
…& SUPPORT UNITS
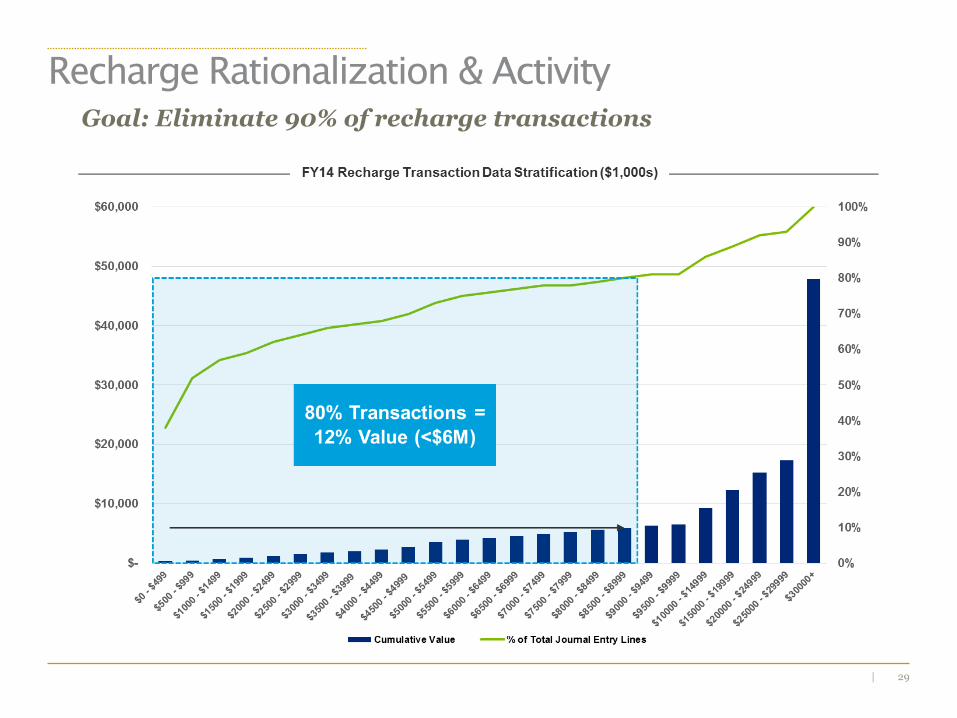
29|
Recharge Rationalization & Activity
Goal: Eliminate 90% of recharge transactions
30|
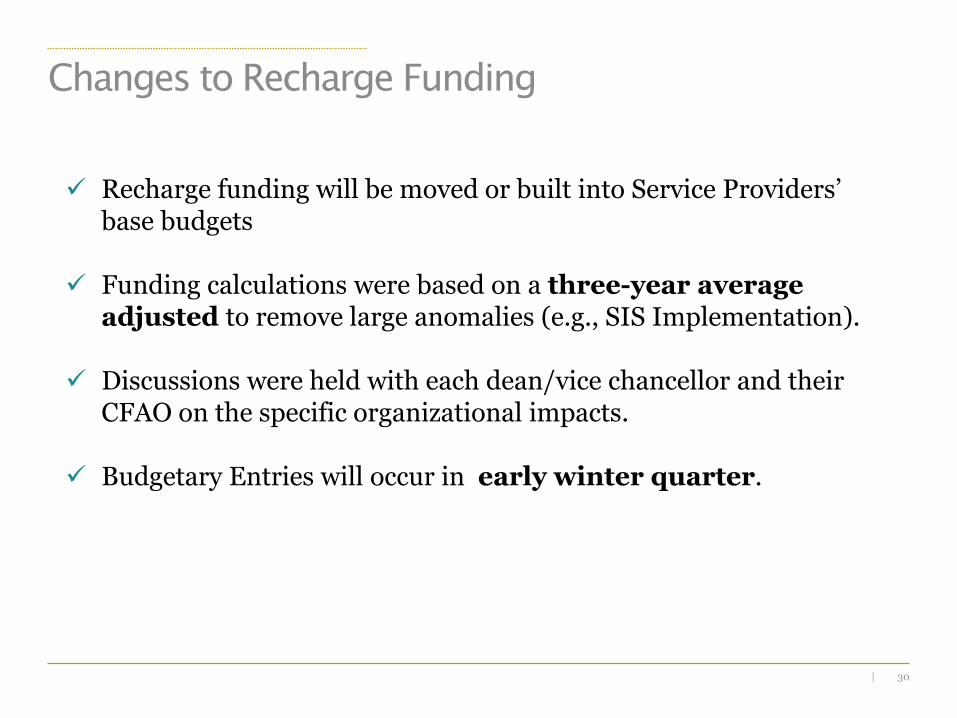
Changes to Recharge Funding
Recharge funding will be moved or built into Service Providers’ base budgets
Funding calculations were based on a three-year average adjusted to remove large anomalies (e.g., SIS Implementation).
Discussions were held with each dean/vice chancellor and their CFAO on the specific organizational impacts.
Budgetary Entries will occur in early winter quarter.
31|
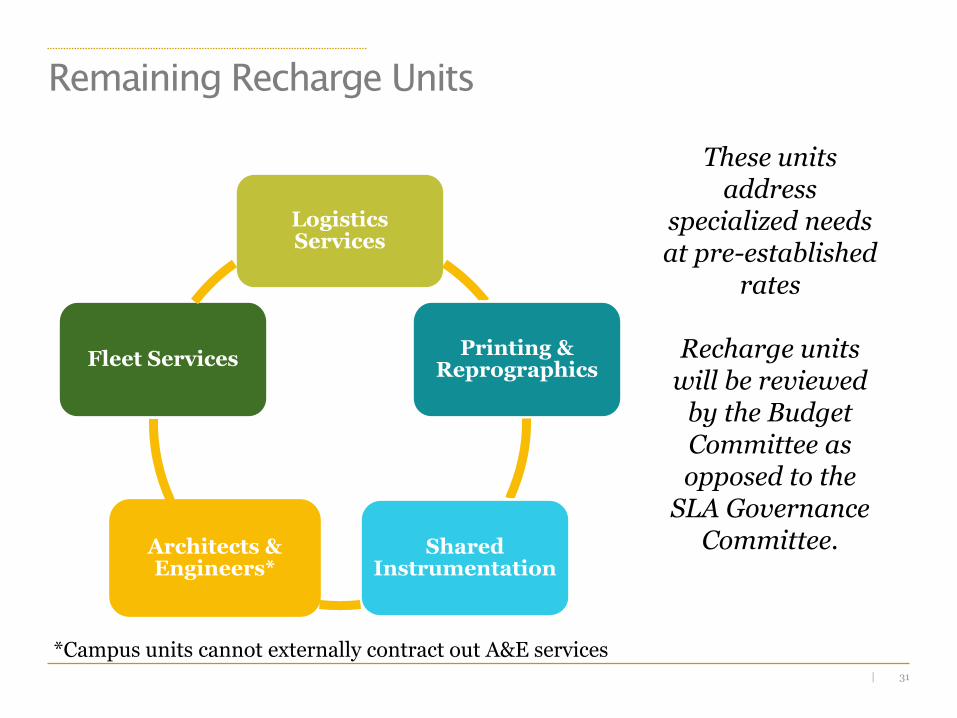
Remaining Recharge Units
Logistics Services
Printing & Reprographics
Shared Instrumentation
Architects & Engineers*
Fleet Services
These units address
specialized needs at pre-established
rates
Recharge units will be reviewed
by the Budget Committee as opposed to the
SLA Governance Committee.
*Campus units cannot externally contract out A&E services
32|
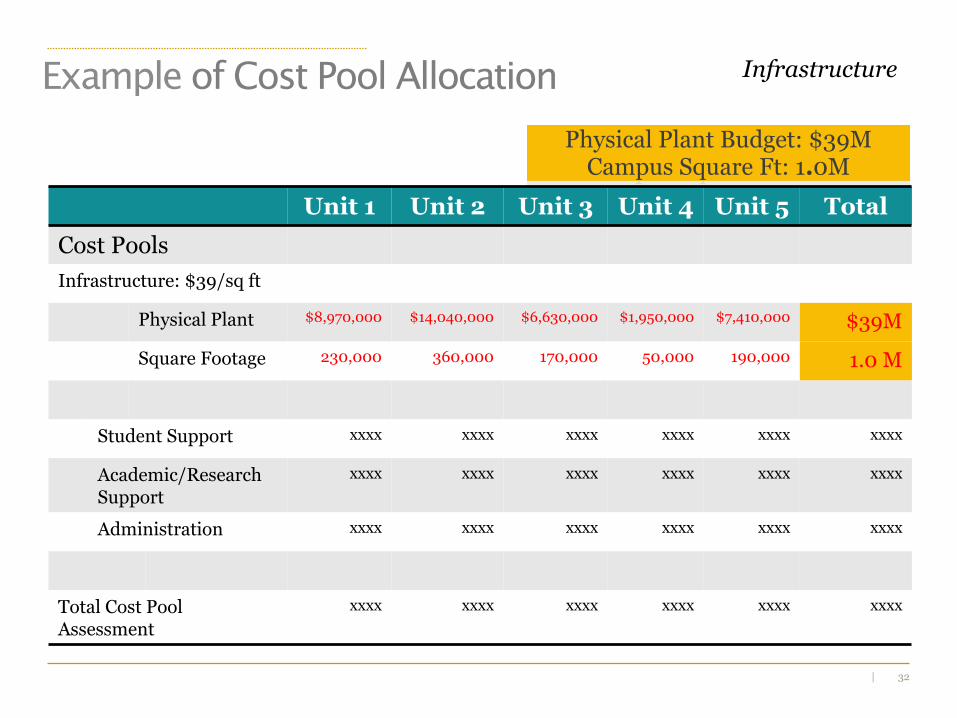
InfrastructureExample of Cost Pool Allocation
Physical Plant Budget: $39MCampus Square Ft: 1.0M
Unit 1 Unit 2 Unit 3 Unit 4 Unit 5 Total
Cost Pools
Infrastructure: $39/sq ft
Physical Plant $8,970,000 $14,040,000 $6,630,000 $1,950,000 $7,410,000 $39M
Square Footage 230,000 360,000 170,000 50,000 190,000 1.0 M
Student Support xxxx xxxx xxxx xxxx xxxx xxxx
Academic/Research Support
xxxx xxxx xxxx xxxx xxxx xxxx
Administration xxxx xxxx xxxx xxxx xxxx xxxx
Total Cost Pool Assessment
xxxx xxxx xxxx xxxx xxxx xxxx

33|
Service Level Agreements
34|
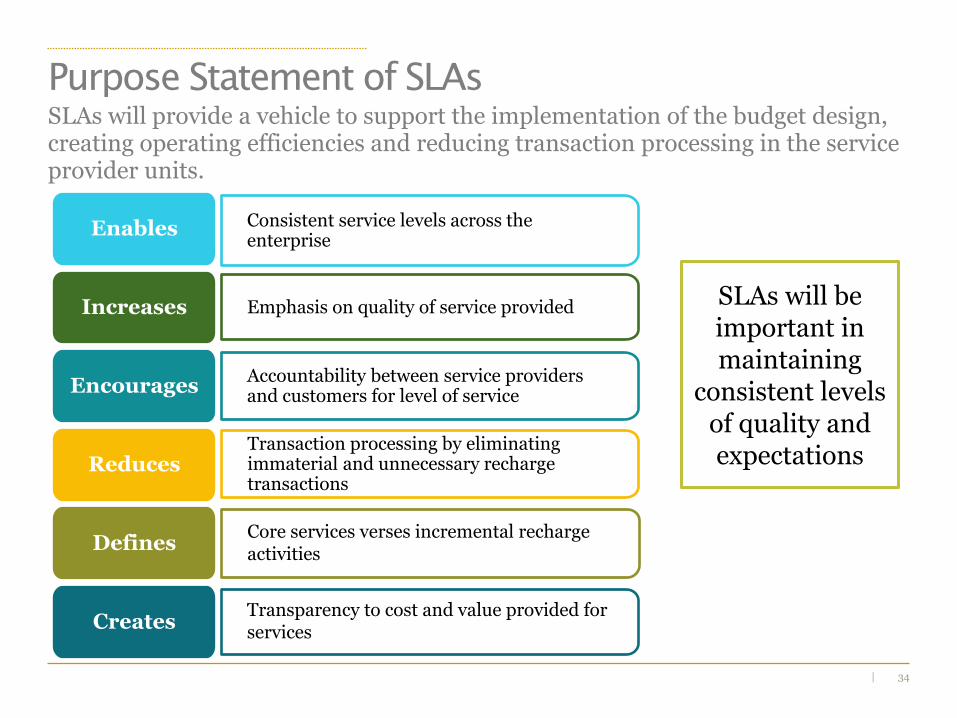
Purpose Statement of SLAs
Emphasis on quality of service provided
Consistent service levels across the enterprise
Enables
Increases
Accountability between service providers and customers for level of service
Encourages
Transaction processing by eliminating immaterial and unnecessary recharge transactions
Reduces
Core services verses incremental recharge activities
Defines
CreatesTransparency to cost and value provided for services
SLAs will provide a vehicle to support the implementation of the budget design, creating operating efficiencies and reducing transaction processing in the service provider units.
SLAs will be important in maintaining
consistent levels of quality and expectations
35|
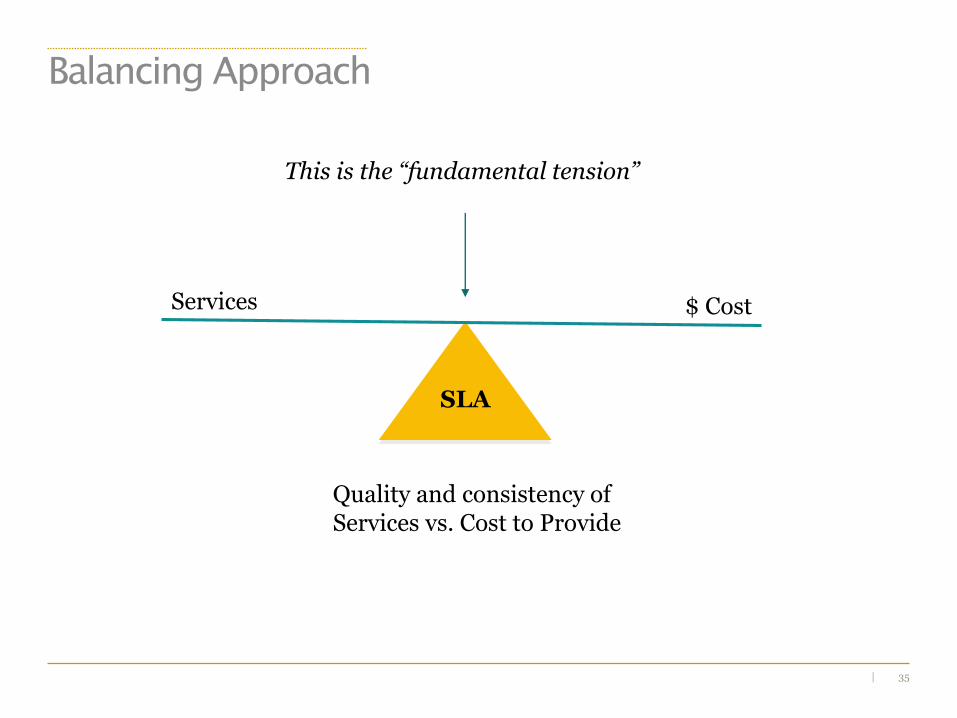
Balancing Approach
Services $ Cost
SLA
This is the “fundamental tension”
Quality and consistency of Services vs. Cost to Provide
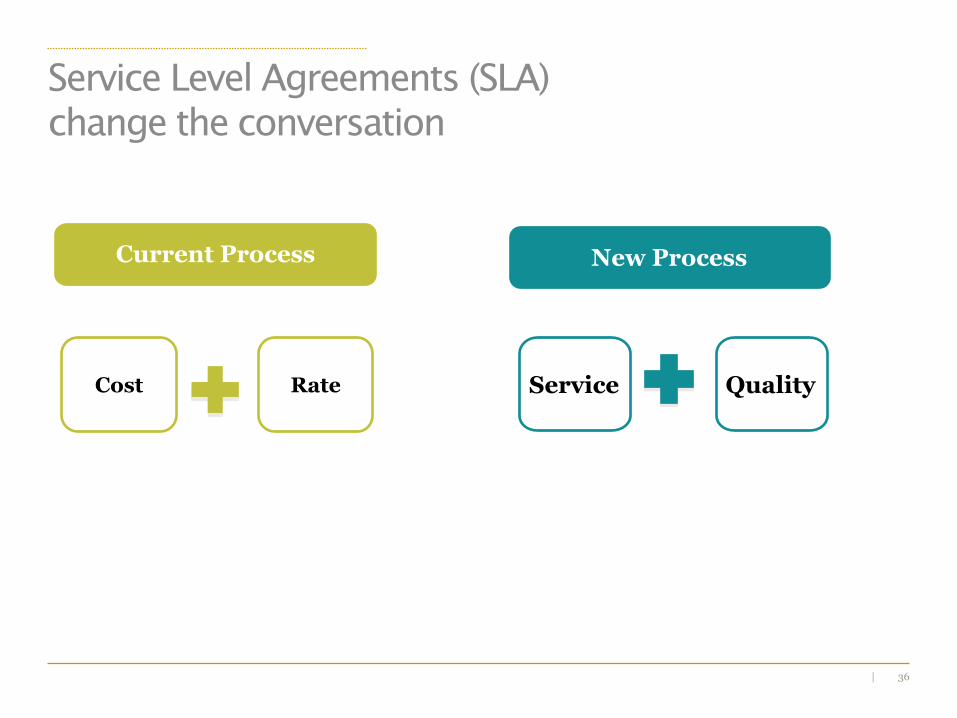
36|
Service Level Agreements (SLA)
change the conversation
Cost
Current Process
Service Quality
New Process
Rate
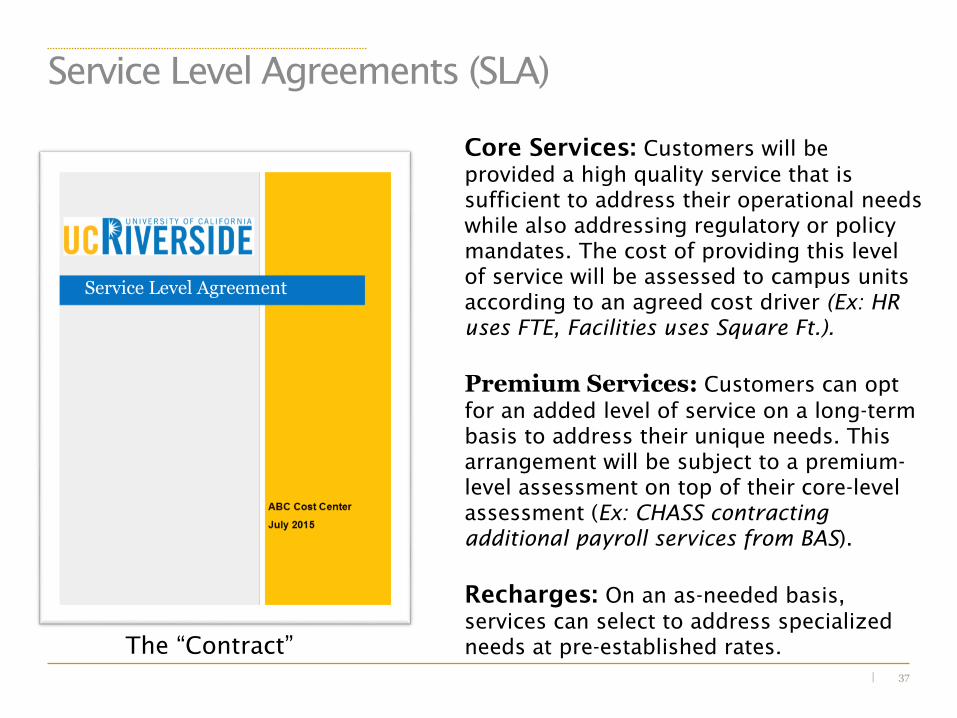
37|
Service Level Agreements (SLA)
The “Contract”
Core Services: Customers will be
provided a high quality service that is
sufficient to address their operational needs
while also addressing regulatory or policy
mandates. The cost of providing this level
of service will be assessed to campus units
according to an agreed cost driver (Ex: HR
uses FTE, Facilities uses Square Ft.).
Premium Services: Customers can opt
for an added level of service on a long-term
basis to address their unique needs. This
arrangement will be subject to a premium-
level assessment on top of their core-level
assessment (Ex: CHASS contracting
additional payroll services from BAS).
Recharges: On an as-needed basis,
services can select to address specialized
needs at pre-established rates.
Service Level Agreement
38|
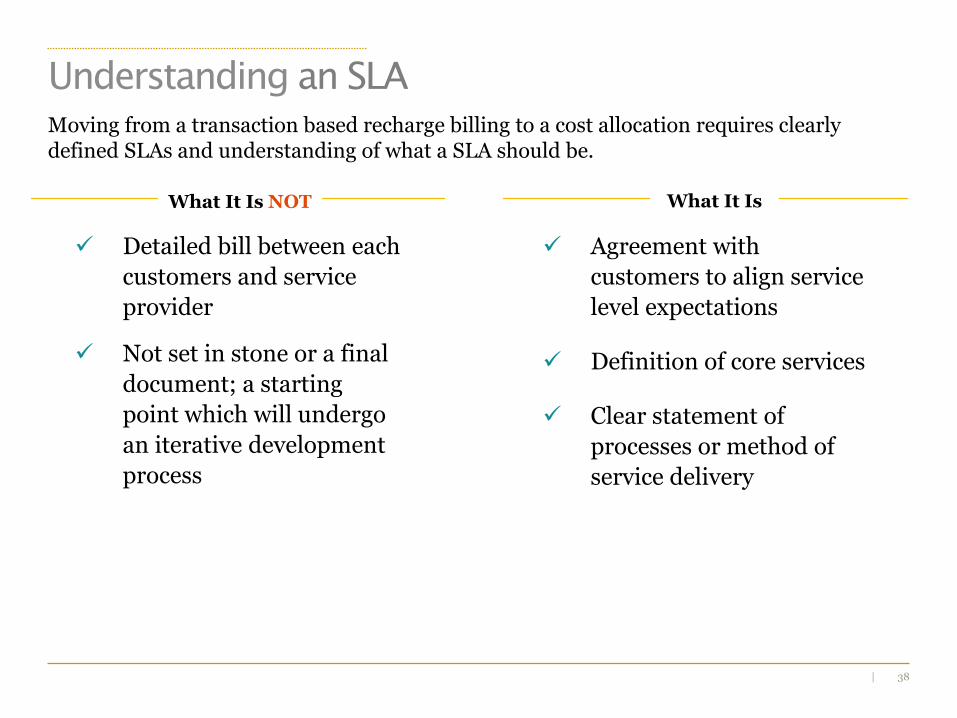
Agreement with
customers to align service
level expectations
Definition of core services
Clear statement of
processes or method of
service delivery
What It IsWhat It Is NOT
Detailed bill between each
customers and service
provider
Not set in stone or a final
document; a starting
point which will undergo
an iterative development
process
Moving from a transaction based recharge billing to a cost allocation requires clearly defined SLAs and understanding of what a SLA should be.
Understanding an SLA
39|
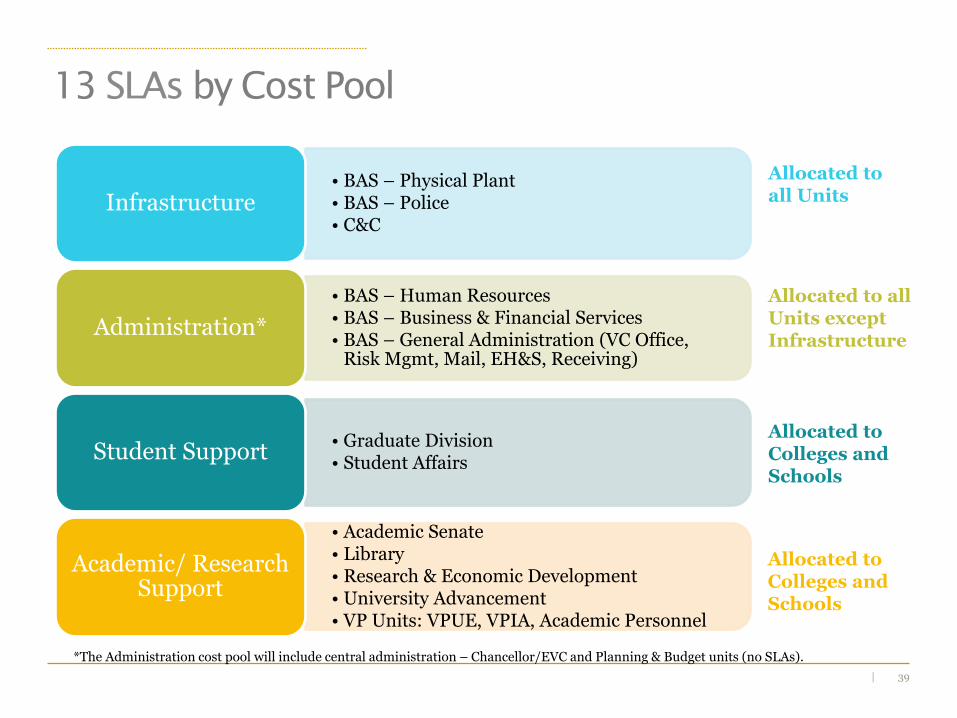
13 SLAs by Cost Pool
• BAS – Physical Plant• BAS – Police• C&C
Infrastructure
• BAS – Human Resources• BAS – Business & Financial Services• BAS – General Administration (VC Office,
Risk Mgmt, Mail, EH&S, Receiving)
Administration*
• Graduate Division• Student Affairs
Student Support
• Academic Senate• Library• Research & Economic Development• University Advancement• VP Units: VPUE, VPIA, Academic Personnel
Academic/ Research Support
Allocated to all Units
Allocated to all Units except Infrastructure
Allocated to Colleges andSchools
Allocated to Colleges andSchools
*The Administration cost pool will include central administration – Chancellor/EVC and Planning & Budget units (no SLAs).
40|
SLA Governance Committee
41|
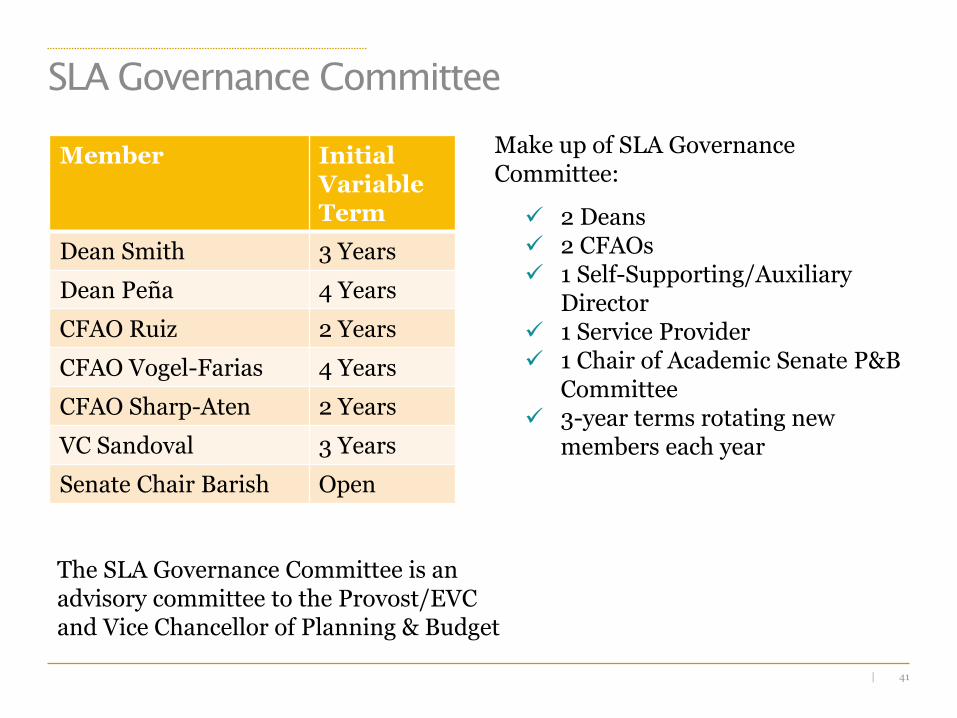
SLA Governance Committee
Make up of SLA Governance Committee:
2 Deans 2 CFAOs 1 Self-Supporting/Auxiliary
Director 1 Service Provider 1 Chair of Academic Senate P&B
Committee 3-year terms rotating new
members each year
Member Initial Variable Term
Dean Smith 3 Years
Dean Peña 4 Years
CFAO Ruiz 2 Years
CFAO Vogel-Farias 4 Years
CFAO Sharp-Aten 2 Years
VC Sandoval 3 Years
Senate Chair Barish Open
The SLA Governance Committee is an advisory committee to the Provost/EVC and Vice Chancellor of Planning & Budget
42|
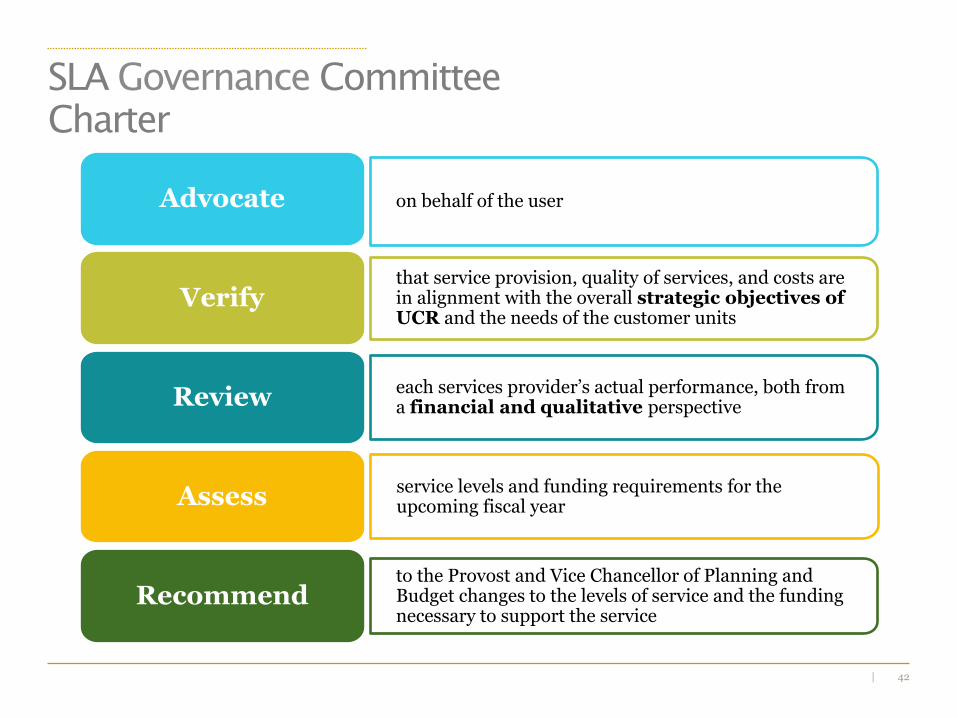
SLA Governance Committee
Charter
on behalf of the userAdvocate
that service provision, quality of services, and costs are in alignment with the overall strategic objectives of UCR and the needs of the customer units
Verify
each services provider’s actual performance, both from a financial and qualitative perspectiveReview
service levels and funding requirements for the upcoming fiscal yearAssess
to the Provost and Vice Chancellor of Planning and Budget changes to the levels of service and the funding necessary to support the service
Recommend
43|
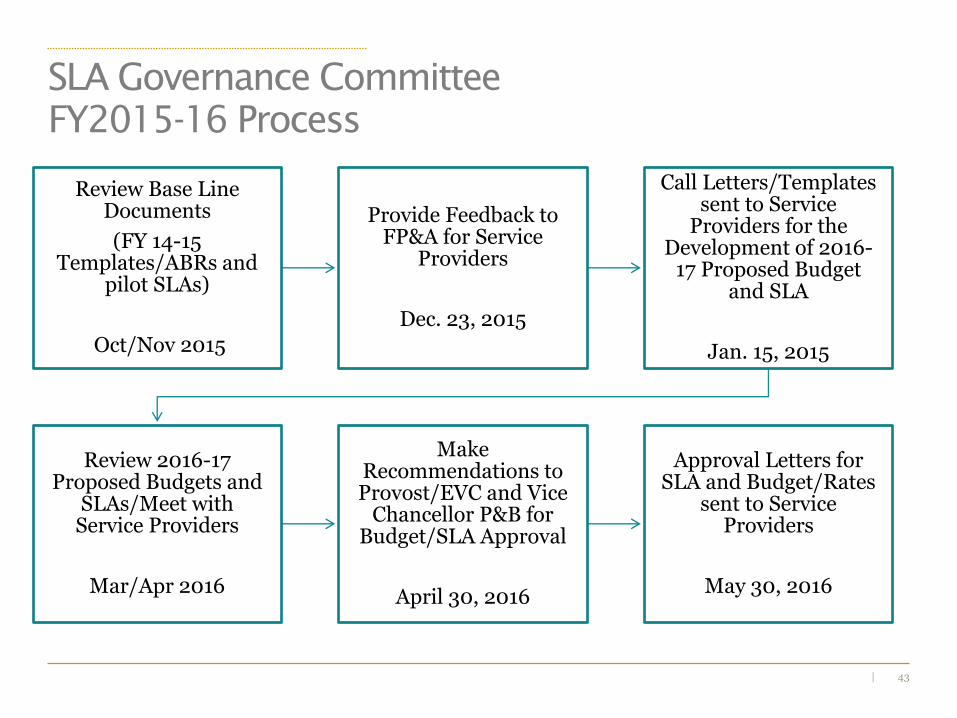
SLA Governance Committee
FY2015-16 Process
Review Base Line Documents
(FY 14-15 Templates/ABRs and
pilot SLAs)
Oct/Nov 2015
Provide Feedback to FP&A for Service
Providers
Dec. 23, 2015
Call Letters/Templates sent to Service
Providers for the Development of 2016-
17 Proposed Budget and SLA
Jan. 15, 2015
Review 2016-17 Proposed Budgets and
SLAs/Meet with Service Providers
Mar/Apr 2016
Make Recommendations to Provost/EVC and Vice
Chancellor P&B for Budget/SLA Approval
April 30, 2016
Approval Letters for SLA and Budget/Rates
sent to Service Providers
May 30, 2016
44|
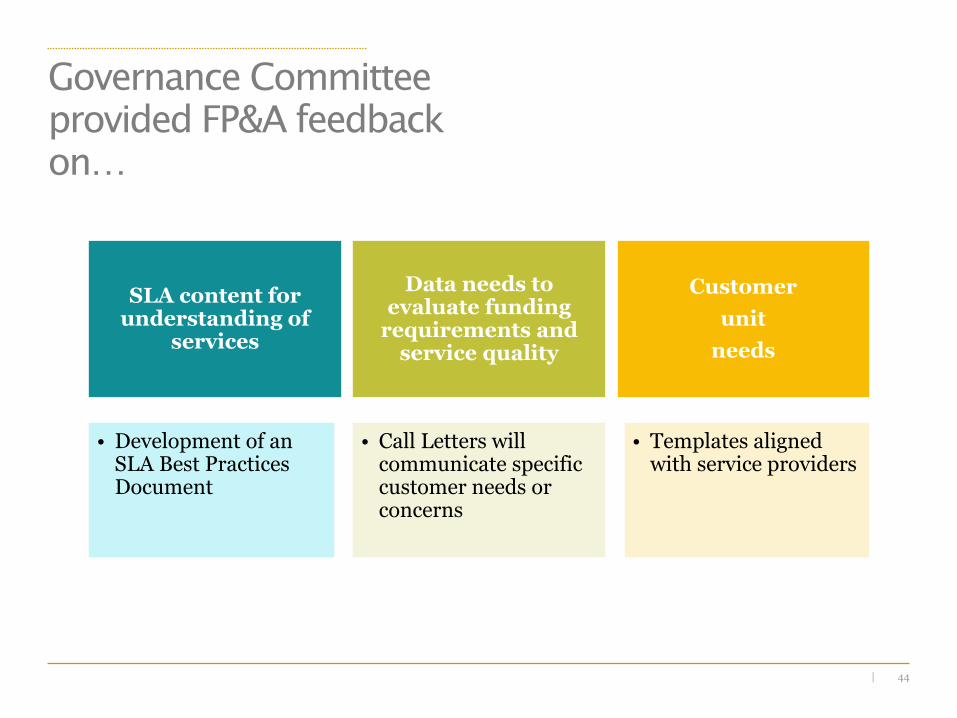
Governance Committee
provided FP&A feedback
on…
SLA content for understanding of
services
• Development of an SLA Best Practices Document
Data needs to evaluate funding
requirements and service quality
• Call Letters will communicate specific customer needs or concerns
Customer
unit
needs
• Templates aligned with service providers

45|
Strategic Investment Fund
46|
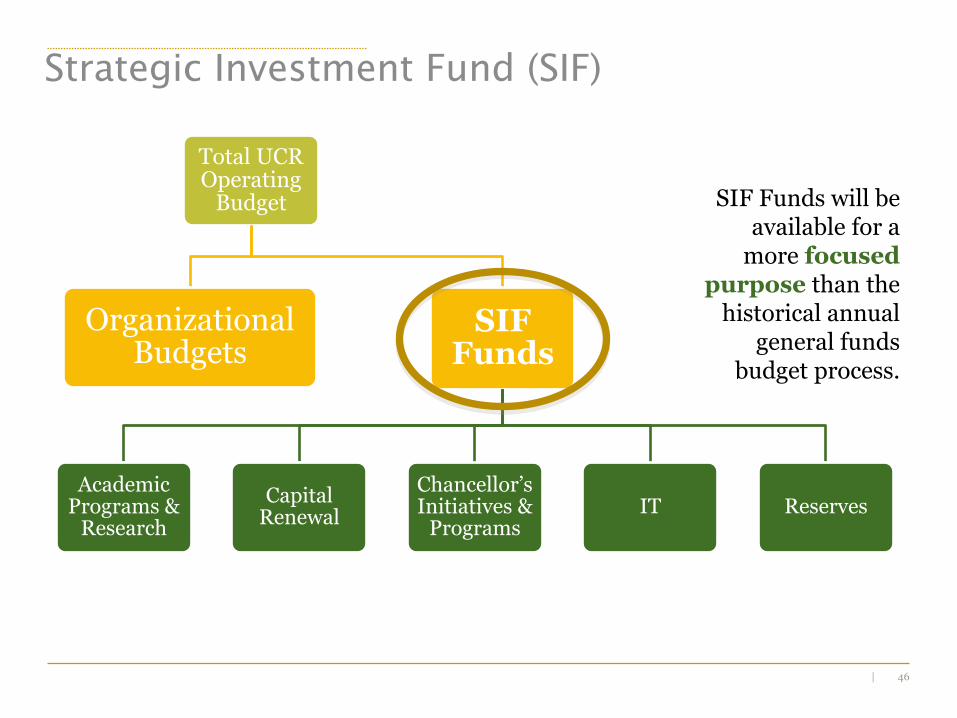
Total UCR Operating
Budget
Organizational Budgets
SIF Funds
Academic Programs &
Research
Capital Renewal
Chancellor’s Initiatives &
ProgramsIT Reserves
Strategic Investment Fund (SIF)
SIF Funds will be available for a
more focused purpose than the
historical annual general funds
budget process.
47|
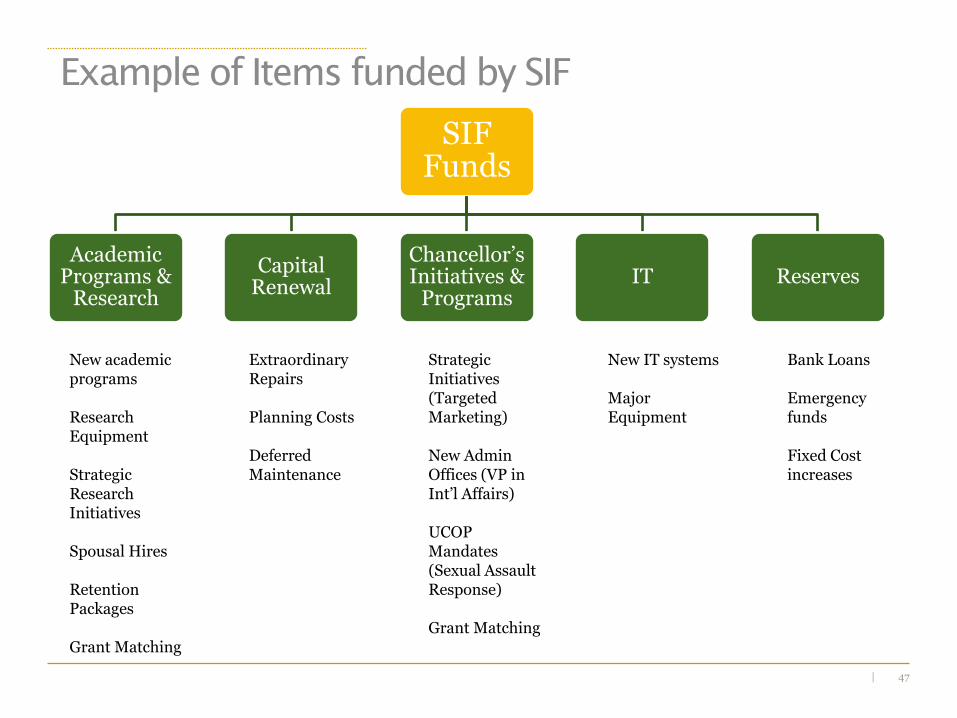
Example of Items funded by SIF
SIF Funds
Academic Programs &
Research
Capital Renewal
Chancellor’s Initiatives &
ProgramsIT Reserves
New academic programs
Research Equipment
Strategic Research Initiatives
Spousal Hires
Retention Packages
Grant Matching
Extraordinary Repairs
Planning Costs
Deferred Maintenance
Strategic Initiatives (Targeted Marketing)
New Admin Offices (VP in Int’l Affairs)
UCOP Mandates (Sexual Assault Response)
Grant Matching
New IT systems
Major Equipment
Bank Loans
Emergency funds
Fixed Cost increases
48|
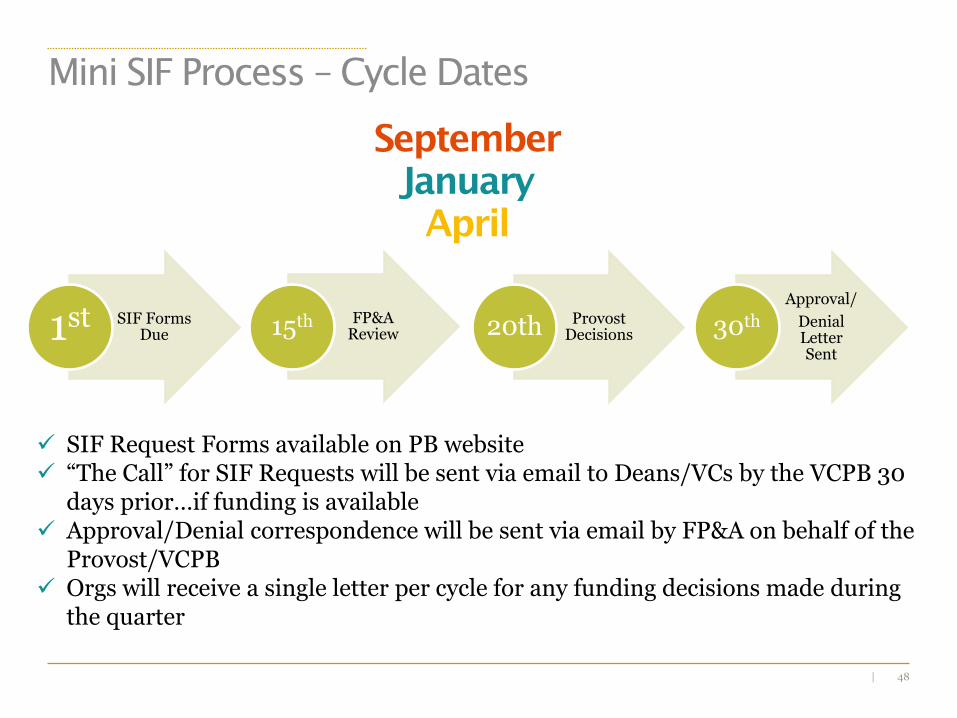
September
January
April
SIF Forms Due1st FP&A
Review15th Provost Decisions20th
Approval/
Denial Letter Sent
30th
Mini SIF Process – Cycle Dates
SIF Request Forms available on PB website “The Call” for SIF Requests will be sent via email to Deans/VCs by the VCPB 30
days prior…if funding is available Approval/Denial correspondence will be sent via email by FP&A on behalf of the
Provost/VCPB Orgs will receive a single letter per cycle for any funding decisions made during
the quarter
49|
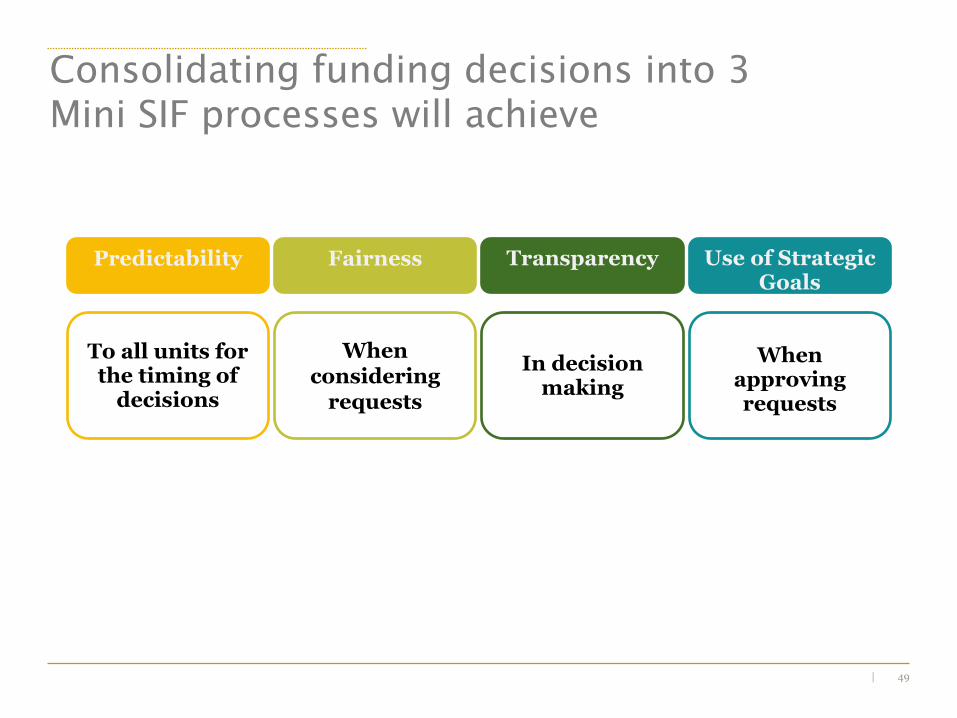
To all units for the timing of
decisions
When considering
requests
In decision making
Predictability Fairness Transparency Use of Strategic Goals
When approving requests
Consolidating funding decisions into 3
Mini SIF processes will achieve
50|
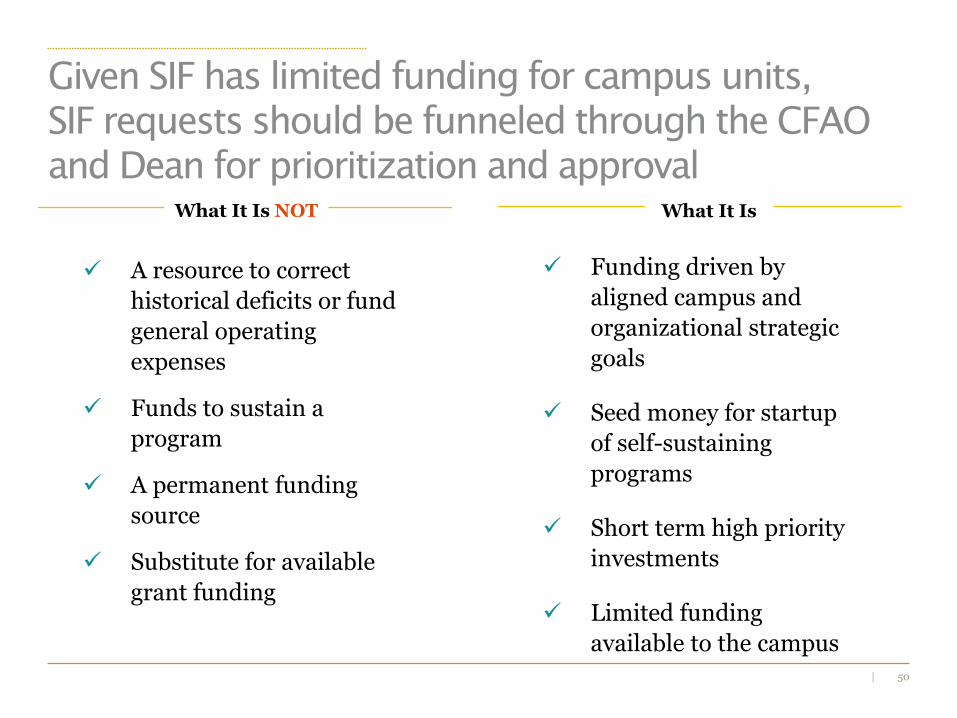
Funding driven by
aligned campus and
organizational strategic
goals
Seed money for startup
of self-sustaining
programs
Short term high priority
investments
Limited funding
available to the campus
What It IsWhat It Is NOT
A resource to correct
historical deficits or fund
general operating
expenses
Funds to sustain a
program
A permanent funding
source
Substitute for available
grant funding
Given SIF has limited funding for campus units,
SIF requests should be funneled through the CFAO
and Dean for prioritization and approval
51|
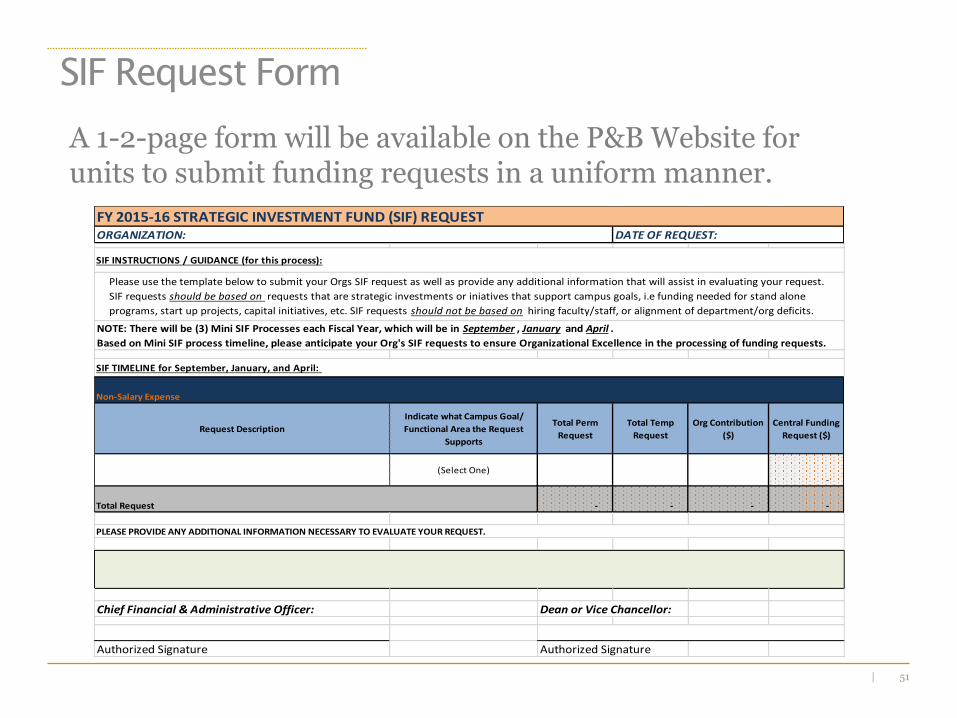
SIF Request Form
A 1-2-page form will be available on the P&B Website for units to submit funding requests in a uniform manner.
FY 2015-16 STRATEGIC INVESTMENT FUND (SIF) REQUEST
Non-Salary Expense
Request Description
Indicate what Campus Goal/
Functional Area the Request
Supports
Total Perm
Request
Total Temp
Request
Org Contribution
($)
Central Funding
Request ($)
(Select One)-
Total Request - - - -
Chief Financial & Administrative Officer: Dean or Vice Chancellor:
Authorized Signature Authorized Signature
ORGANIZATION: DATE OF REQUEST:
SIF INSTRUCTIONS / GUIDANCE (for this process):
Please use the template below to submit your Orgs SIF request as well as provide any additional information that will assist in evaluating your request.
SIF requests should be based on requests that are strategic investments or iniatives that support campus goals, i.e funding needed for stand alone
programs, start up projects, capital initiatives, etc. SIF requests should not be based on hiring faculty/staff, or alignment of department/org deficits.
SIF TIMELINE for September, January, and April:
NOTE: There will be (3) Mini SIF Processes each Fiscal Year, which will be in September , January and April .
Based on Mini SIF process timeline, please anticipate your Org's SIF requests to ensure Organizational Excellence in the processing of funding requests.
PLEASE PROVIDE ANY ADDITIONAL INFORMATION NECESSARY TO EVALUATE YOUR REQUEST.
52|
Cognos Project Update
53|
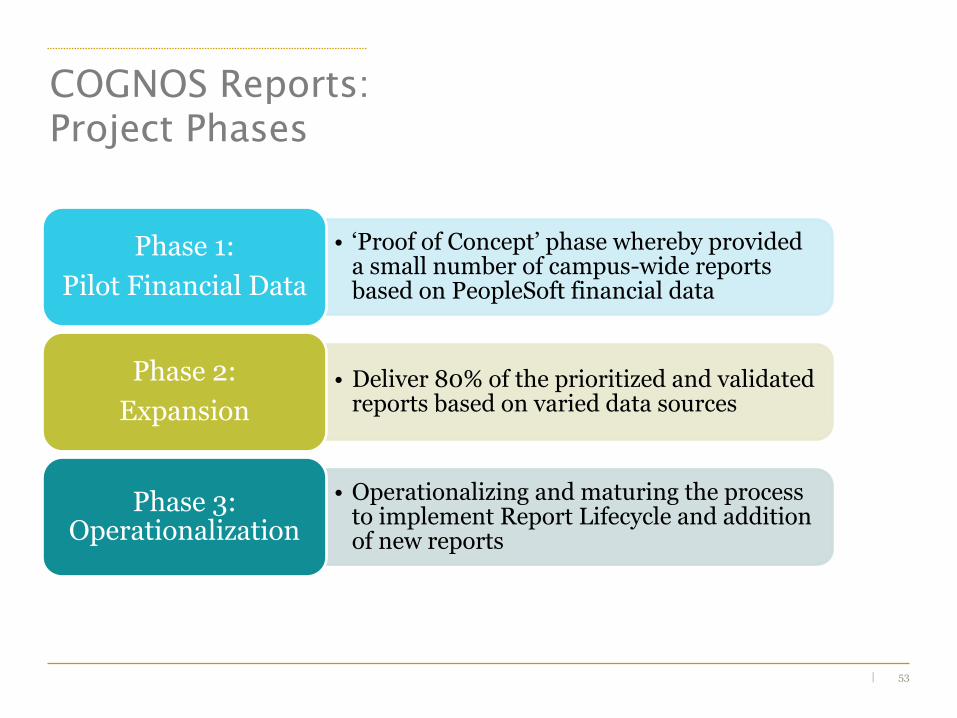
COGNOS Reports:
Project Phases
• ‘Proof of Concept’ phase whereby provided a small number of campus-wide reports based on PeopleSoft financial data
Phase 1:
Pilot Financial Data
• Deliver 80% of the prioritized and validated reports based on varied data sources
Phase 2:
Expansion
• Operationalizing and maturing the process to implement Report Lifecycle and addition of new reports
Phase 3: Operationalization
54|
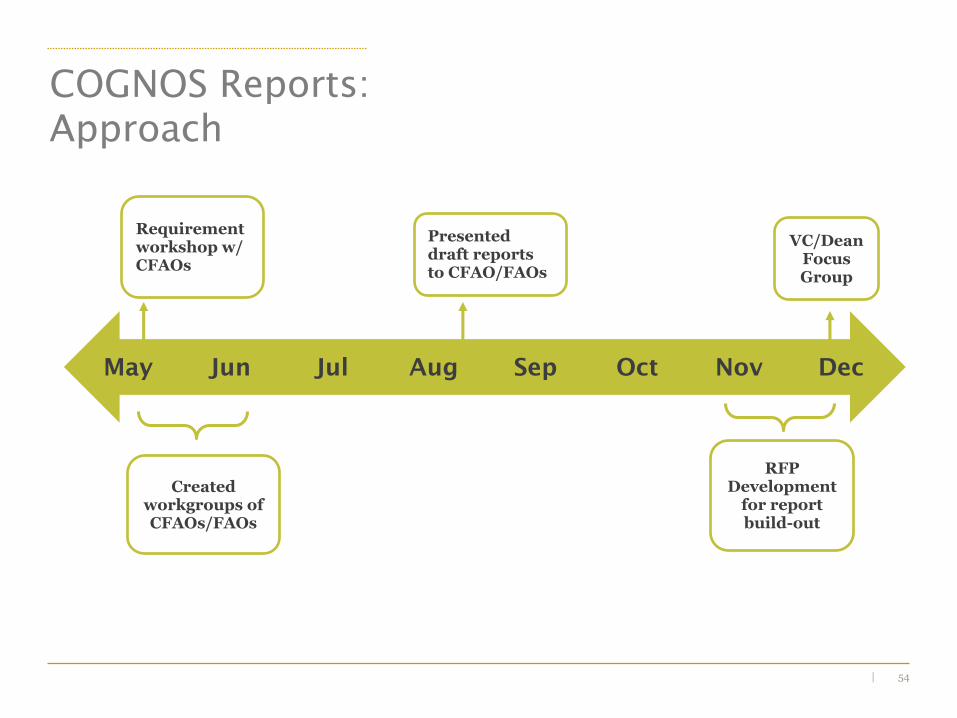
COGNOS Reports:
Approach
May Jun Jul Aug Sep Oct Nov Dec
Requirement workshop w/ CFAOs
Created workgroups of CFAOs/FAOs
Presented draft reports to CFAO/FAOs
RFP Development
for report build-out
VC/Dean Focus Group
55|
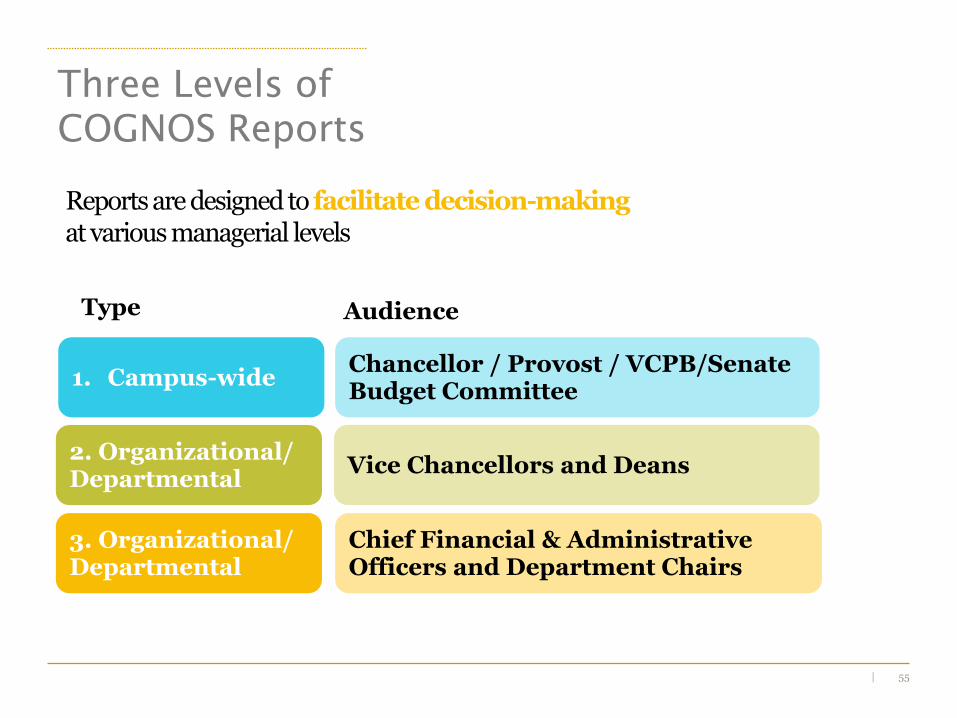
Three Levels of
COGNOS Reports
Reports are designed to facilitate decision-making at various managerial levels
Chancellor / Provost / VCPB/Senate Budget Committee
Vice Chancellors and Deans
Chief Financial & Administrative Officers and Department Chairs
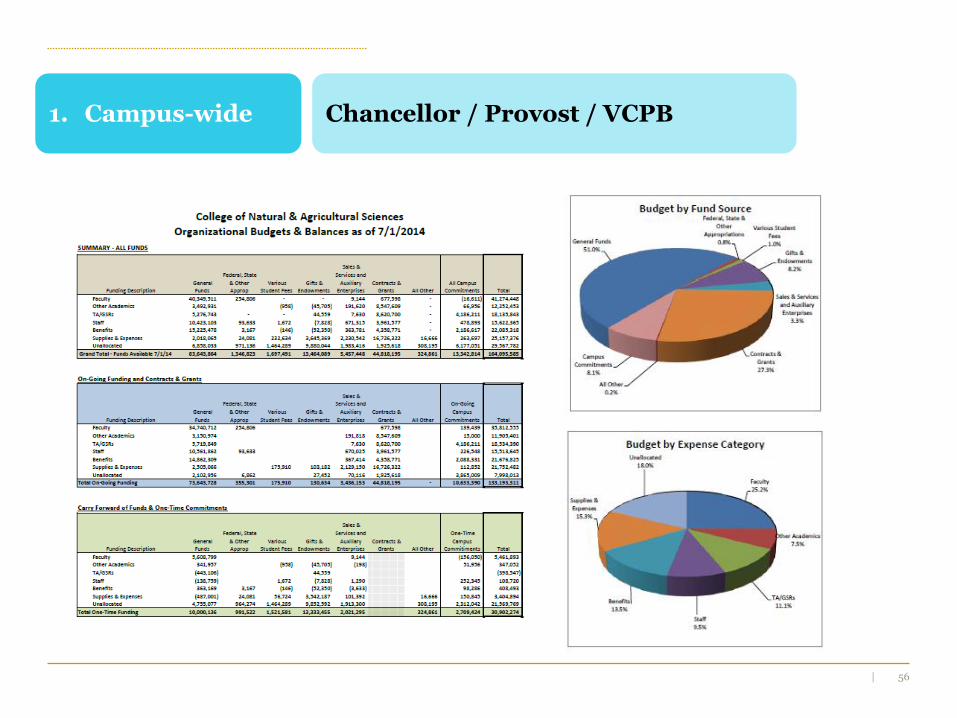
1. Campus-wide
2. Organizational/ Departmental
3. Organizational/ Departmental
AudienceType
56|
Chancellor / Provost / VCPB1. Campus-wide
57|
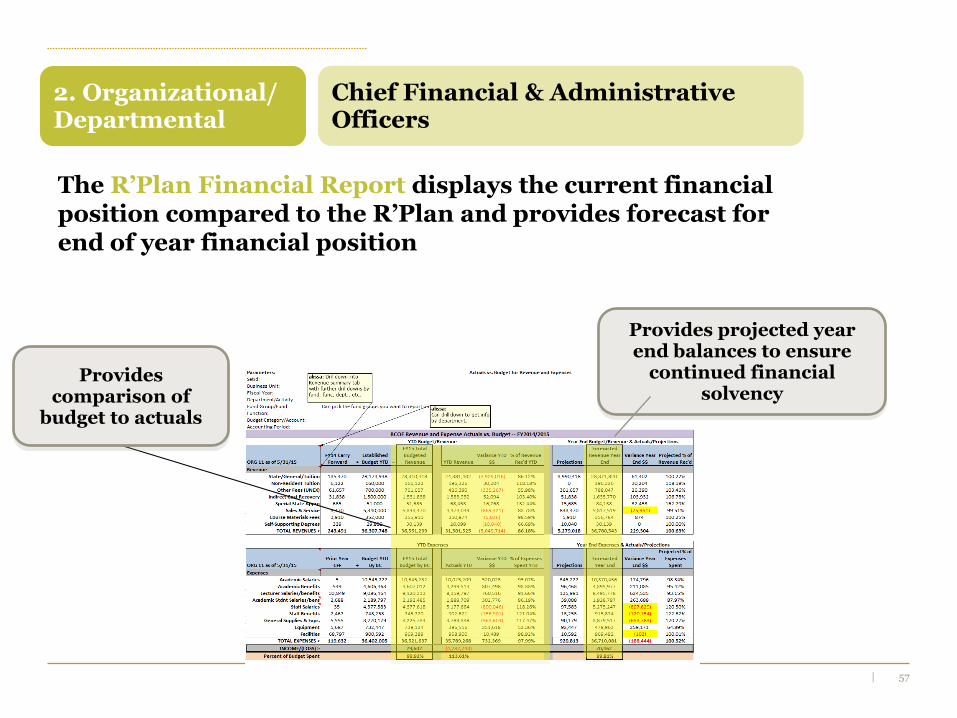
The R’Plan Financial Report displays the current financial position compared to the R’Plan and provides forecast for end of year financial position
Provides projected year end balances to ensure
continued financial solvency
Provides comparison of
budget to actuals
Chief Financial & Administrative Officers
2. Organizational/ Departmental
58|
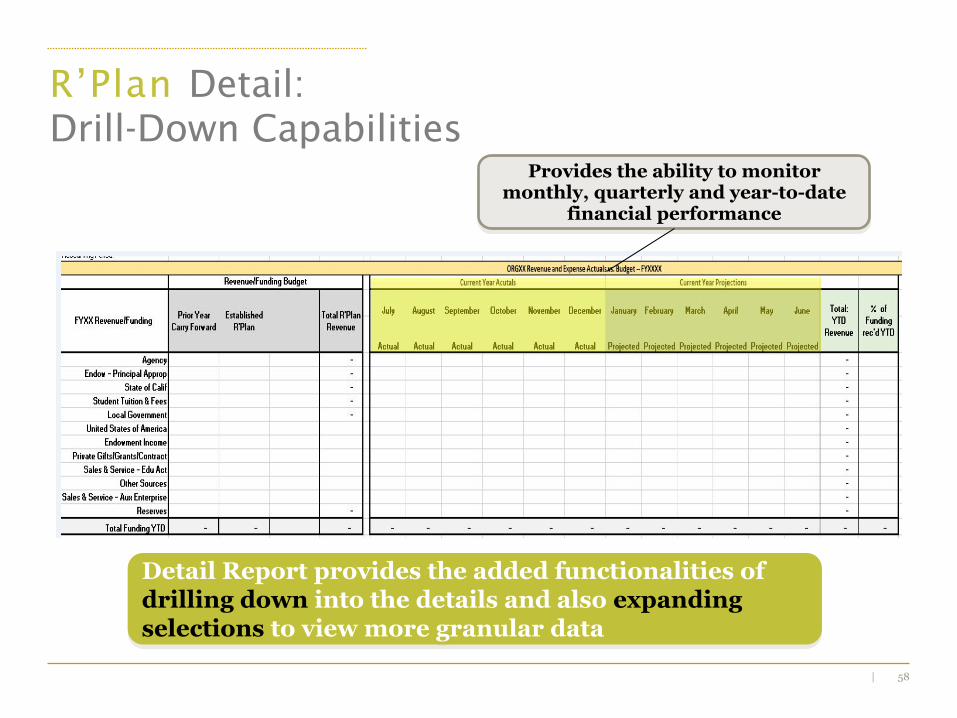
R’Plan Detail:
Drill-Down Capabilities
Detail Report provides the added functionalities of drilling down into the details and also expanding selections to view more granular data
Provides the ability to monitor monthly, quarterly and year-to-date
financial performance
59|
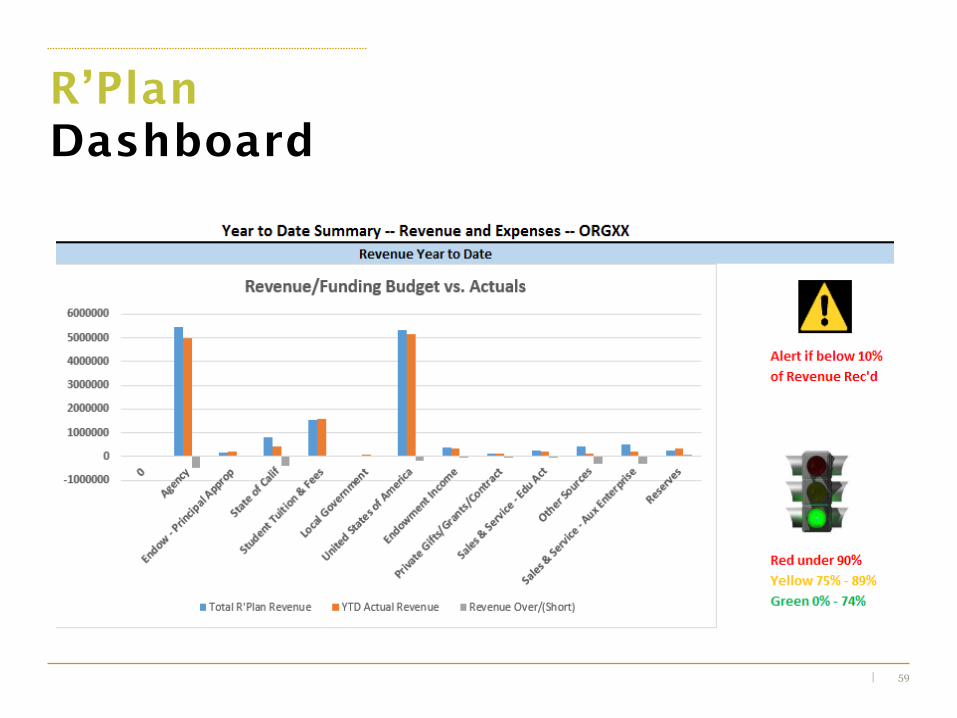
R’Plan
Dashboard
60|
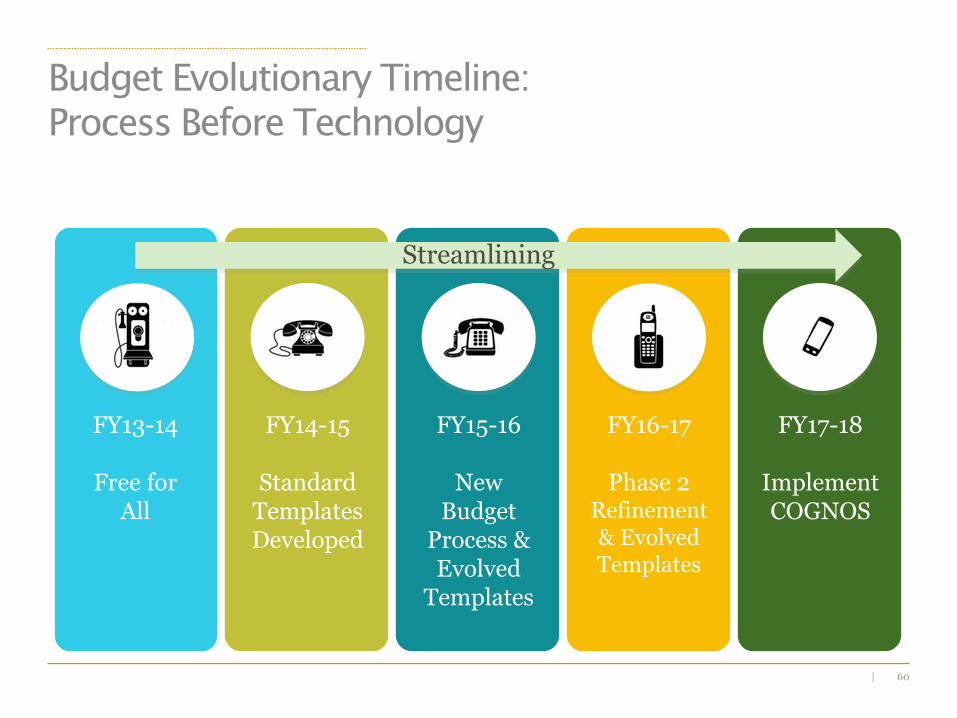
Budget Evolutionary Timeline:
Process Before Technology
FY13-14
Free for All
FY14-15
Standard Templates Developed
FY15-16
New Budget Process
FY16-17
Phase 2Refinement
FY17-18
ImplementCognos
FY13-14
Free for All
FY14-15
Standard Templates Developed
FY15-16
New Budget
Process & Evolved
Templates
FY16-17
Phase 2 Refinement& Evolved Templates
FY17-18
Implement COGNOS
Streamlining