Embed Size (px)
Citation preview

MID-SESSION REVIEWB U D G E T O F T H E U . S . G O V E R N M E N T
F I S C A L Y E A R 2 0 0 8
o f f i c e o f m a n a g e m e n t a n d b u d g e t

EXECUTIVE OFFICE OF THE PRESIDENT
OFFICE OF MANAGEMENT AND BUDGET WASHINGTON, D.C. 20503
The Director
July 11, 2007
The Honorable Nancy Pelosi Speaker of the House of Representatives Washington, DC 20515 Dear Madam Speaker:
Section 1106 of Title 31, United States Code, calls for the President to transmit to the Congress a supplemental update of the Budget that was transmitted to the Congress earlier in the year. This supplemental update of the Budget, commonly known as the Mid-Session Review, contains revised estimates of the budget deficit, receipts, outlays, and budget authority for fiscal years 2007 through 2012.
Sincerely,
Rob Portman
Enclosure
Identical Letter Sent to The President of the Senate


i
Table of ConTenTs
Page
Transmittal Letter
List of Charts and Tables ............................................................................................... iii
Summary .......................................................................................................................... 1
Economic Assumptions .................................................................................................... 9
Receipts ............................................................................................................................ 13
Spending ........................................................................................................................... 15
Summary Tables .............................................................................................................. 17
Glossary ............................................................................................................................ 41


iii
lisT of CharTs
Chart 1. Balancing the Budget ................................................................................ 1
Chart 2. Solid Economy = Growing Receipts .......................................................... 2
Chart 3. Receipts as a Percent of GDP .................................................................... 3
Chart 4. Federal Outlays in 2007 ............................................................................ 4
Chart 5. Declining Federal Debt .............................................................................. 5
Chart 6. Unsustainable Growth in Entitlements ................................................... 6
lisT of Tables
Table 1. Changes from the February Budget ........................................................ 7
Table 2. Economic assumptions............................................................................. 10
Table 3. Comparison of Economic Assumptions ................................................... 11
Table 4. Change in Receipts .................................................................................. 13
Table 5. Change in Outlays ................................................................................... 16
Table S–1. Budget Totals ........................................................................................... 19
Table S–2. Discretionary Funding by Category ........................................................ 20
Table S–3. Discretionary Funding by Major Agency ................................................ 21
Table S–4. Homeland Security Funding by Agency ................................................. 22
Table S–5. Mandatory Proposals ............................................................................... 23
Table S–6. Receipts Proposals ................................................................................... 28
Table S–7. Budget Summary by Category ................................................................ 32
Table S–8. Receipts by Source ................................................................................... 33
Table S–9. Outlays by Agency ................................................................................... 34
Table S–10. Outlays by Function ................................................................................ 35
Table S–11. Baseline Category Totals ......................................................................... 36
Table S–12. Outlays for Mandatory Programs Under Current Law ......................... 37
Table S–13. Federal Government Financing and Debt .............................................. 38


summary
1
The Mid-Session Review is an annual up-date of estimates for Federal receipts and outlays that reflects economic, legislative, and other changes that have occurred since the President’s Budget was released in February. The Federal budget deficit is now estimated to fall to $205 billion in 2007, a reduction of $43 billion or 18 percent from last year. This pro-jected deficit is 1.5 percent of gross domestic product (GDP), well below the 40-year average of 2.4 percent. This estimate is also $39 billion lower than the estimate in the February Bud-get, primarily due to higher-than-expected tax receipts. The revised projections continue to show the budget achieving balance in 2012.
mainTaininG a sTronG eConomy
The President is committed to maintaining the strength of the economy and increasing prosperity for all Americans. He has success-fully pursued pro-growth policies, including the implementation of significant tax relief beginning in 2001.
The President’s pro-growth policies have worked. Over the past five and one-half years, the Nation’s economy has had sustained growth, with real, inflation-adjusted, GDP growing at an average annual rate of 2.9 per-cent since 2001. In calendar year 2006, GDP was more than $13 trillion, 3.3 percent great-er than 2005 on an inflation-adjusted basis. Real GDP growth early in 2007 has been more moderate than in recent years, but stronger growth is expected to resume for the remain-der of the year and to continue throughout the budget horizon.
This sustained economic growth has led to the creation of 8.2 million new jobs since Au-gust 2003, with more than two million new jobs over the past year alone. Jobs have grown for 46 consecutive months, and the unemploy-ment rate continues to be historically low. At 4.5 percent, the Nation’s unemployment rate is below the averages for each of the decades of the 1970s, 1980s, and 1990s.
1.5%1.8%
1.4%
0.8%0.5%
-0.2%
3.6%
2.6%
1.9%
2004 2005 2006 2007 2008 2009 2010 2011 2012-1.0%
0.0%
1.0%
2.0%
3.0%
4.0%Deficit as a percent of GDP
Chart 1. Balancing the Budget
Actuals
Projections
40-YearAverage 2.4%
Chart 1. balancing the budget

2 MID–SESSION REVIEW
The continuing strength of the Nation’s economy is also evident in labor productivity improvements, reflecting increases in the effi-ciency of the labor force. Despite some recent slower productivity gains, the current decade has witnessed the highest sustained growth in labor productivity since the 1960s. Nota-bly, non-farm productivity growth has aver-aged 2.8 percent annually since the begin-ning of 2001. Productivity growth ultimately serves as the basis for continued gains in the Nation’s standard of living.
The President’s policies have led to sus-tained real growth, more jobs, and higher in-comes for Americans. Since the President took office, real after-tax income has increased by 9.9 percent or approximately $3,000 per per-son.
PromoTinG eConomiC GrowTh ThrouGh Tax relief
The President has consistently sought to promote economic growth in a way that re-wards hard work and entrepreneurship. Working with the Congress, the President has put tax policies in place that reduced mar-ginal tax rates, the marriage penalty, capi-tal gains and dividend tax rates; doubled the child tax credit; encouraged retirement and education savings; eliminated the death tax;
and increased incentives for small business investment.
The four major pieces of tax legislation that the President has signed into law continue to provide tax relief to millions of Americans. This year alone five million individuals and families will see their income tax liabilities completely eliminated, and 113 million tax-payers will see their taxes cut by an average of $2,216. Fifteen million seniors will see their tax bills decline by an average of $2,934, and 27 million small business owners will see reductions averaging $4,712. Also, 45 million families with children will receive an average tax cut of $2,864.
Tax relief has been good for American tax-payers and the American economy, and the stronger economy has been good for the Na-tion’s treasury. Even with tax relief fully im-plemented, tax receipts grew at double-digit rates in 2005 and 2006 . This is the highest two-year receipt growth since 1981, when re-ceipt growth was instead driven by high infla-tion. 2007 is on track to be another year of solid growth in tax receipts.
The Nation’s economic growth, and the re-sulting benefits of more jobs, higher wages, and increased Federal revenues, will be in jeopardy if Congress allows the tax relief to
1982 1986 1990 1994 1998 2002 2006 2010-10
-5
0
5
10
15
20Percent change in receipts
Projections
Chart 2. Solid Economy = Growing Receipts
Note: Shaded areas indicate recessions.
Chart 2. solid economy = Growing receipts

SUMMARY 3
expire in 2010. For this reason, the President has proposed a permanent extension of his entire tax relief program.
The President has proposed additional ini-tiatives that would foster sustained growth, including programs to fund basic research and development, innovation and accountability in education, and the opening of new global markets for American farmers, workers, and service providers. In addition, the President supports efforts to reduce burdensome Gov-ernment paperwork and regulations, and friv-olous litigation.
mainTaininG fisCal DisCiPline
The overall improvement in the fiscal out-look, with a surplus projected for 2012, re-flects the President’s approach of pro-growth economic policies coupled with fiscal restraint. In February, the President submitted his pro-posed Budget to the Congress that would per-manently extend tax relief and balance the budget by 2012. It would restrain spending by holding growth in non-security discretionary spending to a reasonable and responsible level for each year of the five-year budget horizon, while adequately addressing key national pri-orities, including education, health care, and energy. In addition, the President proposed to reduce or eliminate 141 programs, which would save $12 billion in 2008. The President also proposed sensible changes to important
entitlement programs, such as Medicare and Medicaid, which would save $92 billion over five years and $301 billion over ten years. More importantly, the President’s mandatory spending proposals would begin to address the long-term problem of entitlements by re-ducing Medicare’s unfunded obligation by 25 percent.
The emergency war supplemental legisla-tion enacted in May 2007, P.L. 110–28, pro-vided much-needed funding for the Nation’s troops fighting on the frontlines of the Global War on Terror in Iraq and Afghanistan, and appropriated such funds without the restric-tions of the original legislation sent to the president. However, Congress also included unnecessary and unrequested spending that impedes deficit reduction efforts.
The Congressional Budget Resolution ad-opted earlier this year would increase both spending and taxes, while failing to address the greatest fiscal challenge facing the Na-tion—the unsustainable growth in entitle-ment spending. The budget resolution allows most of the President’s tax relief to expire in 2010 and contains procedures that would re-sult in the largest tax increase in American history, nearly $400 billion over five years. It contains 32 reserve funds that allow at least $88.5 billion more in mandatory spending over five years that would likely be offset with even more tax increases.
Chart 3. receipts as a Percent of GDP
1980 1984 1988 1992 1996 2000 2004 2008 201210
15
20
25Percent of GDP
40-Year Historical Average 18.3%
Chart 3. Receipts as a Percent of GDP
MSR Forecast

4 MID–SESSION REVIEW
The Congressional Budget Resolution pro-poses to increase discretionary spending by 9.3 percent in 2008, more than three times the rate of inflation, including a 7.1 percent increase for non-defense, domestic spending. It adds $22 billion to the President’s request for discretionary spending in 2008, and adds $205 billion over the five-year budget horizon. To maintain fiscal discipline, the Administra-tion has already indicated that the President will veto appropriations bills if the Congress does not demonstrate a commitment to keep-ing discretionary spending within the overall levels provided in the President’s Budget. Fi-nally, the budget resolution does nothing to address the trillions in unfunded obligations in Medicare, Medicaid, or Social Security.
miD–session uPDaTe
Rising tax receipts
Tax receipts for the first eight months of 2007 have been strong, up by 8.0 percent, compared with tax receipts for the first eight months of last fiscal year. For the full fiscal year, overall receipts are projected to grow by 6.9 percent, which is faster than the rate of growth in GDP, and are expected to total $2.574 trillion, $34 billion higher than esti-mated in February. Individual income taxes are on track to grow at a double-digit rate for the year, and corporate income taxes are also estimated to show significant gains. Over-all receipt growth is expected to be reduced
slightly this year by the refunds of Federal ex-cise taxes on long-distance telephone service.
While revenue for 2007 is expected to be higher than projected in February, tax receipts for the five-year budget horizon are similar to the February projections. Overall growth in receipts is expected to average approximately 5 percent per year, roughly the same as the projected growth in GDP. At approximately 18.5 percent of GDP over the next five years, receipts are projected to remain above the 40-year historical average of 18.3 percent.
Changes in Outlays
Spending in 2008 and beyond is a growing problem that must be addressed in order to keep deficit reduction on track and achieve a balanced budget in 2012. In the short term, outlays for 2007 are projected to be $2.779 trillion, $6 billion less than projected in Febru-ary. This relatively small decrease in outlays results primarily from slower-than-expected defense spending, which is offset partially by additional domestic spending in the 2007 war supplemental legislation and higher Medicaid outlays.1 1 The Mid-Session Review reflects, as did the February
Budget, the enactment of two of the annual appropria-tions bills for 2007. In addition, the Mid-Session Re-view updates the estimates for the enacted full-year continuing resolution incorporating the remaining ap-propriations bills for 2007. The Mid-Session also re-flects the effects of the war supplemental legislation, including the additional $17 billion for unrequested and non-emergency spending.
DefenseDiscretionary
20.1%
Nondefense Discretionary
18.5%
Social Security20.9%
Medicare/Medicaid20.4%
Other11.7%
Interest8.5%
Chart 4. Federal Outlays in 2007Chart 4. federal outlays in 2007

SUMMARY 5
Outlays are projected to be $16 billion higher for 2008 than projected in February, for a total of $2.918 trillion, and $20 to $30 billion high-er than previously projected for each of the remaining years in the budget horizon. The higher projections for spending result primar-ily from increases in Medicare and Medicaid and from unrequested spending added to the 2007 war supplemental. The revised Medi-care projections reflect, among other things, higher hospital utilization rates and changes in the Medicare cost indexes.
In the February Budget, the Administration proposed the Federal Aid Highways obliga-tion limitation assumed in P.L. 109–59, but did not include an increase for the 2008 Rev-enue Aligned Budget Authority (RABA).2 The Mid-Session Review estimates that Highway Trust Fund finances have deteriorated since February, with spending exceeding income in 2007 and 2008 and the Highway Account go-ing insolvent by approximately $4 billion in 2009.
Declining Deficits
The deficit outlook remains on a trajectory to achieve the President’s goal of a balanced
2 The Department of the Treasury has reallocated 2006 revenues between the Highway Trust Fund and the Airport and Airways Trust Fund. The revised RABA adjustment for 2008 would be $703 million, up from $631 million in February.
budget by 2012, with a $33 billion surplus projected for the final year of the budget ho-rizon. In 2007, the deficit is estimated to be $205 billion, 16 percent lower than the $244 billion projected in February and 18 percent lower than the 2006 deficit of $248 billion. The improvement in the 2007 deficit outlook results primarily from higher-than-expected receipts.
The size of the deficit relative to the overall economy—expressed as a percent of GDP—is the most meaningful indicator of the eco-nomic significance of the deficit. In the 2005 Budget, the President set a goal of cutting the deficit in half by 2009 from its projected 2004 peak of 4.5 percent, or $521 billion. That goal was achieved in 2006, three years ahead of schedule, when the deficit fell to 1.9 percent of GDP, or $248 billion. As shown in Chart 1, the 2007 deficit is projected to be 1.5 percent of GDP, lower than the 1.8 percent projected in February. For 2008, the deficit is projected to increase slightly to 1.8 percent of GDP, still well below its 40-year average of 2.4 percent of GDP. Beginning in 2009, the deficit is pro-jected to resume a steady path of reduction until it is eliminated in 2012.
As the deficit as a percent of GDP has fallen, so too has debt held by the public as a percent of GDP. At a projected 37 percent of GDP for the end of 2007, the Nation’s debt is significantly lower than the average of the
Chart 5. Declining federal DebtChart 5. Declining Federal Debt
1940 1950 1960 1970 1980 1990 2000 201010
20
30
40
50
60
70
80
90
100
110
120Debt held by the public as a percent of GDP

6 MID–SESSION REVIEW
other G–7 countries, which represent the sev-en largest industrial market economies. U.S. debt is projected to fall to 33 percent of GDP by the end of 2012, below the 40-year histori-cal average of 35.5 percent.
aDDressinG fuTure fisCal ChallenGes
The President’s pro-growth economic poli-cies and continued spending restraint togeth-er reduce the deficit and lead to a projected balanced budget in the next five years. This is positive short-term news, but in the longer term, unsustainable entitlement spending clouds the Nation’s budget outlook.
Next year, the first of the baby boomers will turn 62 and become eligible for early retire-ment benefits under Social Security. Between now and 2050, the percentage of the popula-tion age 65 and over is projected to increase from 12.4 percent to 20.8 percent. The aging of the baby boomers and increasing longevity pose a serious fiscal challenge for the Federal Government. Future retirees can expect to spend a greater portion of their lives in retire-ment than prior generations, but at a signifi-cant cost to future generations if current poli-cies remain unchanged.
Under current policies, the increase in the senior population coupled with rising health care costs will put an unsustainable burden on Medicare, Medicaid, and Social Security in the coming decades. Currently, spending for Medicare, Medicaid, and Social Security is approximately 8 percent of GDP. By 2050, spending on these three programs is projected to be 16 percent of GDP, more than twice as large as spending on all other Government programs. Without reforms in the near-term, the dramatic increases in spending for these programs will ultimately require substantial tax increases, major benefit reductions, or massive and unsustainable amounts of bor-rowing.
The President’s Budget proposes reforms that, if enacted, would make a substantial down payment on the Government’s long-term fiscal imbalance. Specifically, proposed changes to Medicare will reduce the aver-age annual rate of growth in Medicare by 0.6 percentage points over the next 10 years and reduce the program’s unfunded obligation by $8 trillion over the next 75 years. This pro-posal shows that even relatively small near-term savings can yield substantial fiscal im-provements over time. The deficit for 2050 is projected to be 8.6 percent of GDP, but if the President’s mandatory savings proposals are
Chart 6. unsustainable Growth inentitlements Chart 6. Unsustainable Growth in Entitlements
1970 1980 1990 2000 2010 2020 2030 2040 2050 2060 2070 20800
10
20
30
40EntitlementsNet Interest
Discretionary SpendingTotal Revenues
Percent of GDP

SUMMARY 7
adopted, the deficit for 2050 is projected to be significantly lower, at 5.7 percent.
As noted earlier, the Administration is disappointed that this year’s Congressional Budget Resolution does not address the un-sustainable growth of entitlement programs. Nevertheless, the President urges Congress to
Table 1. ChanGes from The february buDGeT(Dollar amounts in billions)
2007 2008 2009 2010 2011 2012 2008–2012
2008 February Budget deficit ................................ –244 –239 –187 –94 –54 61 –514Percent of GDP ................................................. –1.8% –1.6% –1.2% –0.6% –0.3% 0.3%
Economic and technical reestimates:Receipts ...................................................... 34 –3 5 * –8 –12 –18Medicare ..................................................... –2 –6 –9 –9 –11 –5 –40Medicaid ..................................................... –5 –6 –5 –5 –6 –6 –27Discretionary .............................................. 12 8 –9 –10 –4 –3 –17Other 1 ......................................................... 5 –2 –3 –2 –4 –6 –18
Subtotal, economic and technical reestimates 44 –9 –21 –26 –33 –32 –120
Policy changes:Enacted 2007 supplemental ...................... –5 –7 –4 –3 –2 4 –11Other legislation and policy changes 2 ...... 1 –3 * * –1 –1 –6
Subtotal, policy changes ................................... –4 –10 –5 –3 –3 3 –17
Total, changes ........................................................ 39 –19 –25 –29 –36 –28 –137
Mid-Session Review deficit .................................... –205 –258 –213 –123 –89 33 –651Percent of GDP ................................................ –1.5% –1.8% –1.4% –0.8% –0.5% 0.2%
* $500 million or less.1 Includes debt service on all reestimates.2 Includes debt service on all policy changes.
consider the reforms he proposed in his 2008 Budget in February, which make a modest but meaningful step toward fiscal sustainability. In addition, the Administration looks forward to working with Congress on developing addi-tional reforms to solve the Nation’s long-term fiscal problem.


9
eConomiC assumPTionsAt mid-year 2007, the U.S. economy is in
its sixth year of economic expansion.1 Unem-ployment is low, payroll jobs are increasing, real wages are rising, and homeownership is at a high level. Consumer spending contin-ues to increase robustly. The economy has weathered a decline in housing investment and continues to advance, and a return to stronger growth is expected. This healthy economic performance is a testament to the resilience of the U.S. economy, Federal Reserve monetary policy actions, and the Administration’s successful pro-growth policies—including tax relief and ongoing efforts to promote investment in innovative technologies and to pursue liberalized inter-national trade.
The Administration like most private fore-casters expects the expansion to continue for the foreseeable future—with sustained non-inflationary real growth providing a firm foundation for the Federal budget out-look. In recent years, the strong economy has helped generate dramatic increases in Federal receipts, and incoming data show large receipts gains again in 2007, although not as strong as the double-digit rates of in-crease in 2005 and 2006. These gains have helped lower the Federal budget deficit, but keeping the budget deficit under control and on a sustainable path toward balance will require continued fiscal discipline. In addition, the long-run budget outlook con-tinues to present challenges from expected demographic changes and rising health care costs.
eConomiC ProjeCTions
The Administration’s economic projec-tions are based on information available as of early June 2007. They are summarized in Table 2. The projections are close to those of the Blue Chip Consensus (an average of about 50 private-sector forecasts). A com-parison with Blue Chip is shown in Table 3.
1 Economic performance is discussed in terms of calen-dar years. Budget figures are in terms of fiscal years.
Real Gross Domestic Product (GDP) and the Unemployment Rate: Because of somewhat slower growth over the last four quarters, real GDP is expected to increase 2.1 percent this year, but it is projected to resume a stronger 3.0 percent growth rate by 2008. Real GDP growth moderates gradually, reaching a 2.9 percent rate by 2012 as labor force growth slows with the aging of the work force. The unemployment rate is projected to rise slight-ly from 4.5 percent in 2007 to 4.8 percent by 2009.
Inflation: With growth at or near poten-tial and unemployment near the sustainable long-run average, inflation is expected to be moderate as well. Inflation increased in 2006 in large part because of surging energy prices, and further increases in these prices pushed up inflation in the first half of 2007. With an expected stabilizing of energy prices, inflation is projected to be lower in coming years. On a year-over-year basis, the consumer price in-dex (CPI) is projected to increase 2.6 percent this year and decline gradually to 2.3 percent by 2010. Growth in the GDP price index is projected to be 2.7 percent in 2007, and then decline to 2.0 percent by 2010. This projec-tion is consistent with recent CPI core infla-tion—excluding food and energy items—of 2.2 percent over the 12 months through May, as well as ongoing modest inflation expectations, intense global competition, and the Federal Reserve’s policy actions.
Interest Rates: The 3-month Treasury bill rate is expected to average 4.8 percent in 2007 and then to decline gradually to 4.1 percent by 2011. The decline in short-term rates is con-sistent with an expected decline in the rate of inflation. The yield on the 10-year Treasury note is projected to average 4.8 percent in 2007 and then to rise to 5.3 percent by 2011, restoring the typical positive spread between long rates and short rates. At that point, pro-jected real interest rates would be close to their historical averages given the projected rate of inflation.

10 MID–SESSION REVIEW
Incomes and Income Shares: Labor compen-sation—consisting of wages and salaries and benefits such as employer-provided insurance and pensions—is projected to rise relative to the size of the economy, while the share of corporate profits declines. Profits have been
unusually high in recent years, and the share of compensation has been below its long-run average. During the projection period, labor compensation is expected to catch up with the rising productivity trend and return to its historical average relative to GDP. The wage
Table 2. eConomiC assumPTions(Calendar years; dollar amounts in billions)
2006Actual
Projections
2007 2008 2009 2010 2011 2012
Gross Domestic Product (GDP):Levels, dollar amounts in billions:
Current dollars ........................................................ 13,247 13,898 14,644 15,416 16,202 17,015 17,861Real, chained (2000) dollars .................................... 11,415 11,656 12,007 12,378 12,751 13,127 13,509Chained price index (2000 = 100), annual average 116.1 119.3 122.0 124.6 127.1 129.6 132.2
Percent change, fourth quarter over fourth quarter:Current dollars ........................................................ 5.7 5.2 5.4 5.2 5.1 5.0 5.0Real, chained (2000) dollars .................................... 3.1 2.3 3.1 3.1 3.0 2.9 2.9Chained price index (2000 = 100) ........................... 2.5 2.8 2.2 2.1 2.0 2.0 2.0
Percent change, year over year:Current dollars ........................................................ 6.3 4.9 5.4 5.3 5.1 5.0 5.0Real, chained (2000) dollars .................................... 3.3 2.1 3.0 3.1 3.0 3.0 2.9Chained price index (2000 = 100) ........................... 2.9 2.7 2.3 2.1 2.0 2.0 2.0
incomes, billions of current dollars:Corporate profits before tax .................................... 1,811 1,803 1,862 1,935 1,941 1,943 1,947Wages and salaries .................................................. 6,031 6,391 6,738 7,120 7,509 7,921 8,338Other taxable income 2 ............................................ 2,749 2,942 3,157 3,308 3,475 3,642 3,814
Consumer Price index (all urban): 3
Level (1982–84 = 100), annual average .................. 201.6 206.8 211.8 217.0 222.0 227.1 232.4Percent change, fourth quarter over fourth
quarter ................................................................. 1.9 3.2 2.5 2.4 2.3 2.3 2.3Percent change, year over year ............................... 3.2 2.6 2.4 2.4 2.3 2.3 2.3
unemployment rate, civilian, percent:Fourth quarter level ................................................ 4.5 4.6 4.8 4.8 4.8 4.8 4.8Annual average ....................................................... 4.6 4.5 4.7 4.8 4.8 4.8 4.8
Federal pay raises, January, percent:Military 4 .................................................................. 3.1 2.7 3.0 NA NA NA NACivilian 5 ................................................................... 3.1 2.2 3.0 NA NA NA NA
interest rates, percent:91-day Treasury bills 6 ............................................. 4.7 4.8 4.6 4.4 4.2 4.1 4.110-year Treasury notes ........................................... 4.8 4.8 5.0 5.1 5.2 5.3 5.3
NA = Not Available.1 Based on information available as of early June 2007.2 Rent, interest, dividend, and proprietors’ income components of personal income.3 Seasonally adjusted CPI for all urban consumers.4 Percentages apply to basic pay only; percentages to be proposed for years after 2008 have not yet been determined. 5 Overall average increase, including locality pay adjustments. Percentages to be proposed for years after 2008 have
not yet been determined.6 Average rate, secondary market (bank discount basis).
1

ECONOMIC ASSUMPTIONS 11
share in GDP is also expected to rise from its recent low level, but less than for total com-pensation because the benefit share in total compensation is expected to increase further, holding down the expected rise in wages and salaries.
foreCasT ComParisons
Table 3 compares the Mid-Session Review (MSR) economic assumptions with those from the 2008 Budget and from the recent Blue Chip Consensus. While the Administration
forecast generally assumes that the Presi-dent’s Budget proposals will be enacted as proposed, private forecasters use their own assumptions about fiscal policy. Despite these differences, the Administration and Blue Chip economic projections are very close.
The Administration economic forecast for the MSR is generally similar to the forecast in the 2008 Budget published in February. The most significant difference is that real GDP growth for 2007 is now expected to be 2.1 percent on a year-over-year basis compared to 2.7 percent in
Table 3. ComParison of eConomiC assumPTions(Calendar Years)
Projections
2007 2008 2009 2010 2011 2012
nominal GDP: MSR ..................................................................................... 13,898 14,644 15,416 16,202 17,015 17,861 2008 Budget ......................................................................... 13,946 14,711 15,507 16,316 17,148 18,003 Blue Chip Consensus ........................................................... 13,894 14,613 15,368 16,152 16,979 17,856
real GDP: 1
MSR ...................................................................................... 2.1 3.0 3.1 3.0 3.0 2.9 2008 Budget ......................................................................... 2.7 3.0 3.1 3.0 3.0 2.9 Blue Chip Consensus ........................................................... 2.1 2.9 3.0 2.9 3.0 3.0
Consumer Price index: 1
MSR ..................................................................................... 2.6 2.4 2.4 2.3 2.3 2.3 2008 Budget ......................................................................... 2.1 2.6 2.5 2.4 2.3 2.3 Blue Chip Consensus ........................................................... 2.7 2.5 2.3 2.3 2.3 2.3
unemployment rate: 2
MSR … .................................................................................. 4.5 4.7 4.8 4.8 4.8 4.8 2008 Budget .......................................................................... 4.6 4.8 4.8 4.8 4.8 4.8 Blue Chip Consensus ........................................................... 4.6 4.7 4.8 4.8 4.8 4.8
interest rates: 2
91-Day Treasury bills: MSR .................................................................................. 4.8 4.6 4.4 4.2 4.1 4.1 2008 Budget ...................................................................... 4.7 4.6 4.4 4.2 4.1 4.1 Blue Chip Consensus ........................................................ 4.9 4.9 4.7 4.6 4.6 4.7
10-year Treasury notes: MSR ................................................................................... 4.8 5.0 5.1 5.2 5.3 5.3 2008 Budget ...................................................................... 5.0 5.1 5.2 5.3 5.3 5.3 Blue Chip Consensus ........................................................ 4.9 5.2 5.2 5.1 5.2 5.2
MSR = Mid-Session Review.
Sources: Chapter 12, “Economic Assumptions” of Analytical Perspectives, 2008 Budget; July 2007 Blue Chip Economic Indicators, Aspen Publishers, Inc. for 2007 and 2008; March 2007 Blue Chip Economic Indicators for 2009–2012.
1 Year-over-year percent change.2 Annual averages, percent.

12 MID–SESSION REVIEW
the Budget. In 2008 and beyond, the projected real growth rates are similar to those of the Bud-get. Inflation is expected to be higher for 2007, but the long-run projections are the same. The unemployment rate in 2007 and 2008 is lower by 0.1 percentage point in the current projec-tions compared with the Budget. The interest rate projections are similar to those in the Bud-get with only slight changes in 2007–2010.
summary
The economic news since the Budget was issued has been mixed. Economic growth
slowed early in the year largely because of the decline in housing, but payroll jobs have con-tinued to expand and the unemployment rate has held steady. Even though inflation has been boosted by higher energy prices, the long-run inflation outlook remains favorable. The Mid-Session Review economic forecast proj-ects a resumption of trend economic growth, a return of low and stable inflation, continued moderate interest rates, and healthy job cre-ation and wage growth—in short, a favorable and reasonable economic outlook that serves as the basis for the Administration’s Federal budget projections.

13
The current estimate of receipts for 2007 exceeds the February Budget estimate by $34 billion. The current estimate for 2008 is be-low the February Budget estimate by $3 bil-lion, the current estimate for 2009 is above the February Budget estimate, and the cur-rent estimates for 2010 through 2012 are be-low the February Budget estimates, resulting in receipts that are $15 billion lower than the February Budget estimates over the five-year period, 2008 through 2012. These changes are the net effect of revised economic assump-tions, technical reestimates, enacted legisla-tion, and revisions in the Administration’s proposals.
Revised economic assumptions and techni-cal reestimates account for most of the revi-
sions in receipts since February, increasing receipts by $25 billion in 2007 and $9 billion in 2008, but reducing receipts by $7 billion over the five-year period, 2008 through 2012. Higher-than-expected collections of corpora-tion income taxes and excise taxes account for most of the increase in receipts for 2007. These increases are in large part attributable to higher-than-expected corporation income tax liability in tax years 2006 and 2007, as reflected in collection experience since Feb-ruary, and lower-than-expected refunds of the Federal telephone tax. The revisions in subsequent years primarily reflect increases in corporation income taxes and reductions in individual income taxes and payroll taxes. The increases in corporation income taxes are attributable in large part to upward revisions
reCeiPTs
Table 4. ChanGe in reCeiPTs(In billions of dollars)
2007 2008 2009 2010 2011 2012 2008–2012
February estimate ................................................ 2,540.1 2,662.5 2,798.3 2,954.7 3,103.6 3,307.3Changes due to:Economic assumptions and technical
reestimates:Individual income taxes ................................ –9.1 –7.9 –14.2 –11.4 –11.6 –15.3 –60.3Corporation income taxes ............................. 29.9 28.3 24.6 19.3 16.0 14.6 102.8Social Security and Medicare payroll taxes –2.3 –7.6 –7.8 –6.6 –5.5 –5.4 –32.9Excise taxes ................................................... 7.4 –2.1 –2.1 –1.7 –1.8 –2.0 –9.7Other sources of receipts .............................. –1.1 –1.5 –0.7 –0.7 –2.2 –2.2 –7.3
Subtotal, economic assumptions and technical reestimates .......................... 24.8 9.1 –0.2 –1.1 –5.2 –10.1 –7.4
Enacted legislation ............................................. –0.4 –0.5 –0.6 –3.8 –1.4 6.1 –0.2Revisions in proposals:
Portion of proposals enacted or partly enacted ...................................................... ............ 0.4 0.4 3.4 0.8 –1.7 3.3
Economic assumptions and technical reestimates ................................................ 9.4 –12.1 5.1 1.2 –3.2 –1.6 –10.6
Subtotal, revisions in proposals .............. 9.4 –11.8 5.5 4.6 –2.3 –3.3 –7.3
Total change ....................................... 33.8 –3.1 4.7 –0.2 –8.9 –7.4 –14.9
Mid-Session estimate .......................................... 2,573.9 2,659.4 2,803.0 2,954.5 3,094.7 3,299.9

14 MID–SESSION REVIEW
in taxable profits and new tax and collections data used in the estimating models that were not available at the time the budget estimates were made. The reductions in individual in-come taxes and payroll taxes primarily reflect downward revisions in wages and salaries, which are partially offset by revisions in es-timating models to reflect current collection experience.
Legislated tax changes since February de-crease receipts by a small amount over the five-year period, 2008 through 2012. These changes reflect enactment of the emergency war supplemental spending act, which the
President signed on May 25, 2007. The small business tax relief provided in this act was in large part offset by other tax changes. Revi-sions in the estimates of the Administration’s proposals since February increase receipts by $9 billion in 2007, reduce receipts by $12 bil-lion in 2008, and reduce receipts by $7 billion over the five-year period, 2008 through 2012. The changes in 2007 and 2008 are in large part attributable to delay in enactment of the Administration’s proposal to prevent the number of Alternative Minimum Tax (AMT) taxpayers for tax year 2007 from increasing, which reduces the receipt loss in 2007 and in-creases the loss in 2008.

sPenDinG
15
Total outlays for 2007 are now estimated to be $2,779 billion, down $6 billion from the February estimate. A small increase due to enacted legislation is more than offset by de-creases due to estimating changes. For 2008, the estimate of total outlays has increased by $16 billion relative to February, to $2,918 billion. This increase is largely the result of additional funding for the emergency war supplemental spending bill enacted in May, as well as the delayed enactment of final 2007 appropriations.
enaCTeD leGislaTion
In total, policy changes increase outlays by $3.8 billion in 2007 and $10.1 billion in 2008. Over the five-year period 2008 through 2012, policy changes increase outlays by $20.3 bil-lion. Since the transmittal of the Budget, the Congress has enacted P. L. 110–5, the Revised Continuing Appropriations Act for 2007, and P. L. 110–28, the emergency war supplemen-tal spending bill. The Revised Continuing Ap-propriations Act provided a slightly different full-year, continuing resolution calculation than what was assumed in the February Bud-get.
esTimaTinG ChanGes
Changes in estimates arise from non-policy related factors including changes in economic assumptions, discussed earlier in this Review, and changes in technical factors. For 2007 and 2008, estimated outlays are $9.5 billion lower and $5.8 billion higher, respectively, than in February for non-policy related rea-sons. Over the period 2008 through 2012, out-lays are $101.9 billion higher than in Febru-ary for non-policy related reasons.
Discretionary appropriations.—Outlays for discretionary appropriations decrease by $11.8 billion in 2007 and $8.4 billion in 2008 relative to the February Budget as a result of estimating changes. These changes reflect slower spending of discretionary funds, large-ly for defense programs.
Medicare.—Estimates of Medicare outlays are $2.0 billion and $6.3 billion higher for 2007 and 2008, respectively, than estimated in February. Over the period 2008 through 2012, outlays are above the February projec-tions by $39.8 billion. The increases in 2007 and 2008 are largely driven by increased pro-jections of fee-for-service spending and revised assumptions about projected hospital spend-ing. Increases in later years largely reflect increases due to these factors, partially offset by lower estimates for the prescription drug benefit resulting from updated assumptions about participation in the low-income subsidy and Medicare Advantage/Prescription Drug plans.
Medicaid.—As a result of estimating chang-es, Medicaid outlays are projected to increase by $5.0 billion in 2007, $5.9 billion in 2008, and $27.1 billion over the period 2008 through 2012. The increase in 2007 largely results from higher year-to-date outlays than previ-ously expected. The increases in 2008 and beyond largely result from higher actuarial estimates for Medical Assistance Payments based on recent expenditure trends.
Earned income and child tax credits.—During the 2007 filing season, claims for the earned income and child tax credits were higher than previously anticipated. As a re-sult, the Mid-Session Review has $12.8 bil-lion higher outlays for these refundable tax credits over five years than estimated in Feb-ruary.
Social Security.—Estimating changes re-duce outlays for Social Security by $1.0 bil-lion in 2007, but increase outlays over 2008 through 2012 by $12.2 billion. The decrease in 2007 is largely due to lower disability bene-fits resulting from recent program experience. Increases over the five-year period largely re-flect higher old age and survivors benefits re-sulting from higher cost-of-living adjustments and revised beneficiary projections, partially offset by lower disability benefits.

16 MID–SESSION REVIEW
Table 5. ChanGe in ouTlays(In billions of dollars)
2007 2008 2009 2010 2011 2012 2008–2012
February estimate ................................................ 2,784.3 2,901.9 2,985.5 3,049.1 3,157.3 3,246.3Changes due to enacted legislation:
Supplemental ................................................ 4.5 6.7 4.0 2.3 1.1 –* 14.1Continuing Resolution .................................. –0.7 2.9 –0.3 –0.7 * 0.1 2.1Related debt service ...................................... 0.1 0.4 0.8 0.9 1.0 1.0 4.1
Subtotal, policy ................................................... 3.8 10.1 4.4 2.5 2.2 1.1 20.3Changes due to reestimates:
Discretionary appropriations ....................... –11.8 –8.4 9.1 10.0 3.7 3.1 17.4Medicare ........................................................ 2.0 6.3 8.8 8.6 11.3 4.8 39.8Medicaid ........................................................ 5.0 5.9 4.8 4.9 5.5 6.1 27.1EITC and child credit ................................... 2.9 2.8 3.0 2.9 2.1 2.0 12.8Social Security ............................................... –1.0 1.7 2.3 2.5 3.0 2.7 12.2Veterans’ compensation and pensions ......... –0.7 0.2 0.9 0.7 0.8 1.2 3.9Student loans ................................................ 0.9 –0.6 –0.6 –0.6 –0.7 –0.8 –3.3Postal Service ................................................ 3.1 3.1 ............ ............ ............ ............ 3.1Unemployment Insurance ............................ –* –0.9 –0.6 –0.8 –0.3 –0.3 –3.0Other programs ............................................. –6.0 1.5 1.4 –0.3 –1.5 –2.6 –1.5Net interest ................................................... –3.9 –5.7 –3.3 –2.0 0.8 3.6 –6.6
Subtotal, reestimates ......................................... –9.5 5.8 25.8 25.9 24.6 19.8 101.9
Total, changes ....................................................... –5.6 15.9 30.2 28.4 26.8 20.9 122.2
Mid-Session estimate .......................................... 2,778.6 2,917.7 3,015.7 3,077.5 3,184.1 3,267.3
* $50 million or less.
Veterans’ compensation and pensions.—As a result of estimating changes, veterans’ com-pensation and pension outlays are projected to increase by $3.9 billion over the five-year pe-riod. This increase largely results from higher cost-of-living adjustments as well as revised technical assumptions including the Hartness court decision.
Student loans.—Outlays for student loan programs are projected to decrease by $3.3 bil-lion over the five-year period. This decrease is largely driven by reduced subsidy costs result-ing from lower “death, disability, and bank-ruptcy” and default claims, and lower estimat-ed costs associated with students postponing their student loan repayment as allowed by statute. This decrease is also driven by revised earlier estimates of when borrowers graduate from school and begin repaying their student loans.
Postal Service.—Estimating changes in-crease Postal Service outlays by $3.1 billion
per year in 2007 and 2008. These increases largely reflect capital outlays, which were in-advertently excluded from the February Bud-get when the Postal Service converted its es-timates from an accrual to a cash accounting basis. The increases also reflect higher-than-expected net operating costs.
Unemployment insurance.—Outlays for un-employment benefits are estimated to decrease by $3.0 billion over five years. This decrease largely results from lower-than-expected rates of unemployment and wage growth as well as revised estimates of average wages, aver-age weekly benefit amounts, and the ratio of weeks paid to weeks claimed.
Net interest.—Excluding the debt service as-sociated with policy changes, outlays for net in-terest are projected to decrease by $7.0 billion over five years. This reduction largely reflects lower debt service costs related to estimating changes in receipts and outlays.

summary Tables
17


SUMMARY TABLES 19
Table s–1. buDGeT ToTals(Dollar amounts in billions)
2006 2007 2008 2009 2010 2011 2012
budget Totals:Receipts ..................................................................... 2,407 2,574 2,659 2,803 2,954 3,095 3,300Outlays ...................................................................... 2,655 2,779 2,918 3,016 3,078 3,184 3,267
Deficit(–)/surplus ............................................. –248 –205 –258 –213 –123 –89 33
Gross Domestic Product (GDP) ...................................... 13,065 13,722 14,453 15,222 16,004 16,809 17,646
budget Totals as a Percent of GDP:Receipts ..................................................................... 18.4% 18.8% 18.4% 18.4% 18.5% 18.4% 18.7%Outlays ...................................................................... 20.3% 20.2% 20.2% 19.8% 19.2% 18.9% 18.5%
Deficit(–)/surplus ............................................. –1.9% –1.5% –1.8% –1.4% –0.8% –0.5% 0.2%

20 MID–SESSION REVIEW
Table s–2. DisCreTionary funDinG by CaTeGory(Net budget authority; dollar amounts in billions)
2006Actual
2007Enacted1
2008Request
Change
Amount Percent
base Discretionary:Security Funding 2 ............................................................ 474.2 498.1 553.9 +55.8 +11.2%Non-Security Funding ...................................................... 369.2 375.1 376.0 +0.9 +0.2%
Total, Discretionary ............................................................ 843.4 873.2 929.9 +56.7 +6.5%
enacted supplemental and emergency funding:Global War on Terror ........................................................ 120.4 173.6Hurricane Response ......................................................... 24.7 7.7Pandemic Flu Preparedness ............................................ 6.1 0.2 Border Security ................................................................ 1.9 1.8Other Emergency Funding .............................................. 0.3 9.1
Total, enacted ...................................................................... 153.3 192.3
requested emergency funding for 2008:Global war on Terror ................................................... 145.2
DisCreTionary ouTyears(Net budget authority in billions of dollars)
2009 2010 2011 2012
base Discretionary: Security Funding 3 .............................................. 585.0 597.0 604.6 615.0 Non-Security Funding 4 ...................................... 379.8 383.5 387.4 391.3
Total, Discretionary ............................................ 964.9 980.5 991.9 1,006.3
emergency funding:Global war on Terror .................................... 50.0
1 Funding levels are equal to the amounts enacted in the Department of Defense and Homeland Security Appropria-tions Acts and full-year funding levels enacted in P.L. 110–5, the 2007 Continuing Appropriations Act. This level is adjusted to include savings enacted in the Continuing Appropriations Act from changes to mandatory programs.
2 This category is composed of funding for the Department of Defense, homeland security activities Government-wide (see Table S–4), and funding for International Affairs (Function 150).
3 Department of Defense levels are consistent with the Future Years Defense Plan, and the homeland security levels are consistent with the Future Years Homeland Security Plan.
4 These amounts exclude the budgetary effects of the Administration’s reauthorization proposal of the Federal Avia-tion Administration (FAA). That proposal would transform the current tax-financing system for FAA to a cost-based user-fee system. For more information, see the Transportation chapter and other related sections in the Budget, Appendix, and Analytical Perspectives volumes of the 2008 Budget. If this proposal were enacted, the Administration would adjust its discretionary cap proposal downward in these years to reflect the offsetting collections that would result from this user-b ased fee system.

SUMMARY TABLES 21
Table s–3. DisCreTionary funDinG by major aGenCy(Net budget authority; dollar amounts in billions)
Agency 2006Actual
2007Enacted1
2008Request
Change: 2007–2008
Dollar Percent
Agriculture .............................................................. 21.1 20.4 20.2 –0.2 –0.9%Commerce ................................................................ 6.4 6.4 6.6 +0.1 +1.9%Defense .................................................................... 410.7 432.0 481.4 +49.4 +11.4%Education ................................................................ 56.5 57.5 56.0 –1.5 –2.6%Energy ..................................................................... 23.6 23.6 24.3 +0.7 +2.8%Health and Human Services .................................. 69.1 70.6 69.3 –1.3 –1.8%Homeland Security ................................................. 30.7 32.0 34.3 +2.3 +7.2%Housing and Urban Development ......................... 34.1 36.0 35.3 –0.7 –2.0%Interior .................................................................... 10.8 10.9 10.6 –0.3 –2.5%Justice ..................................................................... 21.1 20.9 20.2 –0.8 –3.7%Labor ....................................................................... 11.3 11.7 10.6 –1.1 –9.5%State and Other International Programs .............. 30.2 31.4 35.0 +3.6 +11.4%Transportation ........................................................ 14.6 11.3 12.1 +0.8 +7.2%Treasury .................................................................. 11.4 11.6 12.1 +0.5 +4.4%Veterans Affairs ...................................................... 32.9 36.5 39.4 +2.9 +8.1%Corps of Engineers ................................................. 5.3 5.3 4.9 –0.5 –8.8%Environmental Protection Agency ......................... 7.6 7.7 7.2 –0.5 –6.8%Executive Office of the President ........................... 0.3 0.3 0.3 +* +1.5%Judicial Branch ....................................................... 5.3 5.6 6.1 +0.5 +9.1%Legislative Branch .................................................. 3.8 3.9 4.4 +0.6 +14.7%National Aeronautics and Space Administration ...... 16.3 16.3 17.3 +1.0 +6.4%National Science Foundation ................................. 5.6 5.9 6.4 +0.5 +8.7%Small Business Administration ............................. 0.5 0.6 0.5 –0.1 –19.2%Social Security Administration .............................. 7.4 7.7 7.9 +0.2 +3.0%Other Agencies ........................................................ 6.7 7.1 7.5 +0.4 +5.9%
Total, Discretionary funding ........................... 843.4 873.2 929.9 +56.7 +6.5%
* $500,000 or less.
Note: Supplementals and emergencies, enacted and requested, are excluded. 1 Funding levels are equal to the amounts enacted in the Department of Defense and Homeland Security Appropria-
tions Acts and P. L. 110–5, the 2007 Continuing Appropriations Act. These levels include savings from changes to mandatory programs.

22 MID–SESSION REVIEW
Table s–4. homelanD seCuriTy funDinG by aGenCy(Budget authority in millions of dollars)
2006 2007 2008
Agency 1 ActualSupple-mental/
EmergencyEnacted 2
Supple-mental/
Emergency 3Request
Supple-mental/
Emergency 3
Agriculture .......................................... 598 ............ 537 ............ 710 ............Commerce ............................................ 181 ............ 1,204 ............ 219 ............Defense (DOD) .................................... 16,477 1,031 16,538 ............ 17,465 ............Energy ................................................. 1,701 ............ 1,683 ............ 1,833 ............Health and Human Services .............. 4,352 ............ 4,379 ............ 4,424 ............Homeland Security ............................. 25,156 1,416 26,920 2,506 29,668 223Justice ................................................. 2,996 30 3,308 196 3,331 85State .................................................... 1,107 ............ 1,239 ............ 1,406 ............Treasury .............................................. 114 1 128 ............ 117 ............Transportation .................................... 182 ............ 186 ............ 200 ............Veterans Affairs .................................. 299 ............ 254 ............ 270 ............Environmental Protection Agency ..... 129 ............ 168 ............ 153 ............General Services Administration ....... 99 ............ 71 ............ 42 ............Intelligence Community
Management Account ..................... 56 ............ 56 ............ 58 ............National Aeronautics and Space
Administration ................................ 213 ............ 199 ............ 194 ............National Science Foundation ............. 344 ............ 386 ............ 375 ............Nuclear Regulatory Commission ....... 79 ............ 72 ............ 69 ............Smithsonian Institution ..................... 83 ............ 80 ............ 93 ............Social Security Administration .......... 176 ............ 194 ............ 217 ............Other Agencies .................................... 296 ............ 270 ............ 256 ............
Total, homeland security funding ......................................... 54,638 2,478 57,872 2,702 61,100 308Less, Defense-Military (DOD) ..... –16,477 –1,031 –16,538 ............ –17,465 ............Less, Mandatory Homeland
Security Funding 4 .................... –2,257 ............ –3,512 ............ –2,290 ............Less, Discretionary Fee-Funded
Activities ................................... –3,514 ............ –4,367 ............ –4,986 ............
net non-DoD Discretionary homeland security .................... 32,390 1,447 33,455 2,702 36,359 308
1 For more detail on Homeland Security funding, consult the Homeland Security Funding Analysis Chapter in the Analytical Perspectives volume of the 2008 Budget. Dollar amounts in this table are rounded to the nearest million at the account level, which may account for any discrepancies with the Analytical Perspectives chapter that are not due to enactment of P. L. 110–5, the 2007 Continuing Appropriations Act.
2 Funding levels are equal to the amounts enacted in the Department of Defense and Homeland Security Appropria-tions Acts with other levels equal to the estimated full-year funding levels provided by P. L. 110–5, the 2007 Continu-ing Appropriations Act.
3 Includes $1.6 billion in funding enacted in the 2007 Homeland Security and Defense Appropriations Acts and $1.1 billion enacted in P. L. 110–28, the 2007 Emergency Supplemental Act. 2008 also includes an additional $0.3 billion in the Administration’s pending supplemental request for the Global War on Terror.
4 Mandatory homeland security programs include $1 billion from anticipated spectrum auction receipts appropriated in the Deficit Reduction Act of 2005 for the Department of Commerce to make grants to public safety agencies for communications interoperability purposes.

SUMMARY TABLES 23
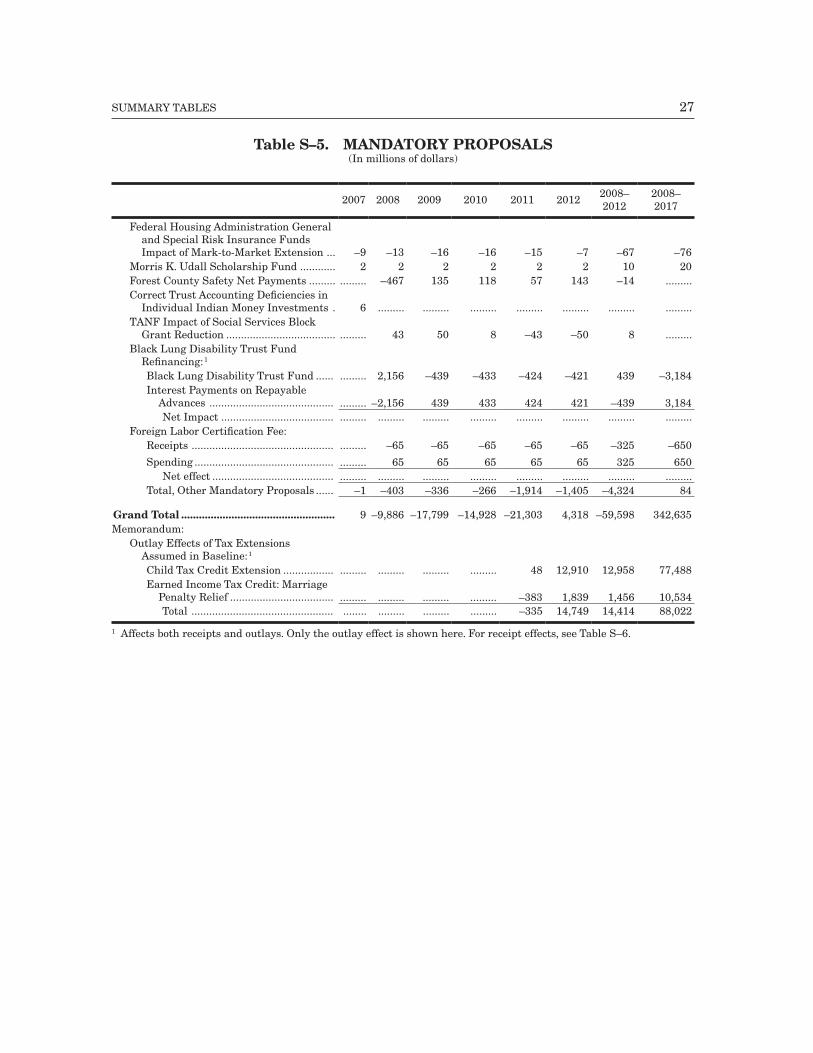
Table s–5. manDaTory ProPosals(In millions of dollars)
2007 2008 2009 2010 2011 2012 2008–2012
2008–2017
mandatory Proposals, including savings and augmentations:
Agriculture:Reauthorize Farm Bill ......................... ...... 233 –180 488 601 652 1,794 2,464Food Safety and Inspection Service
User Fees .......................................... ...... –96 –98 –100 –102 –104 –500 –1,053Grain Inspection, Packers and
Stockyards Administration User Fees .......................................... ...... –22 –22 –23 –23 –24 –115 –242
Crop Insurance User Fee ..................... ...... ...... –15 –15 –15 –15 –60 –135Animal Welfare Fee .............................. ...... –9 –13 –13 –14 –14 –63 –142
Total, Agriculture ........................... ...... 106 –328 337 447 495 1,056 892
Defense:Increase National Defense Strategic
Materials Stockpile Sales ................ ...... –69 –145 –198 –145 –25 –582 –583
Education:Reform the Federal Student Aid
Programs: Increase the Pell Grant Maximum
Award to $5400 over Five Years ...... 532 2,375 3,256 4,133 5,039 15,335 43,058Increase Academic Competitveness
Grant awards by 50% ................. ...... 72 308 373 317 8 1,078 1,078Increase Aggregate Loan Limits and
Annual Limits for Undergraduate Third-Year and Beyond Students ...... 68 151 187 205 259 870 2,550
Reduce Lender Subsidy Payments by 50 basis points ....................... ...... –688 –2,165 –2,558 –2,792 –2,986 –11,189 –29,494
Increase Lender Risk Sharing and Improve Program Efficiency ..... ...... –776 –160 –175 –189 –202 –1,502 –2,715
Increase Lender Consolidation Fee .. ...... –56 –159 –186 –210 –234 –845 –2,309Recall Federal Perkins Loan
Revolving Funds ......................... ...... –419 –498 –713 –814 –779 –3,223 –6,358Adjust Guaranty Agency Default
Retention Rates .......................... ...... –1,370 –173 –188 –205 –217 –2,153 –3,454Adopt Unit Cost Basis for
Guaranty Agency Fees ............... ...... –1,018 –37 –53 –58 –56 –1,222 –1,572Other Student Loan Reforms ........ ...... 2 3 –12 –22 –64 –93 –913
Net impact ................................. ...... –3,653 –355 –68 364 768 –2,944 –128
Energy:Repeal Oil and Gas Research and
Development Program ..................... ...... –20 –40 –50 –50 –50 –210 –460
Health and Human Services (HHS):Adopt Medicare Reforms ..................... ...... –3,778 –8,167 –12,245 –16,643 –20,693 –61,526 –240,965Medicaid/State Children’s Health
Insurance Program (SCHIP):Adopt Medicaid Reforms ................ ...... –1,970 –2,215 –2,435 –2,730 –2,890 –12,240 –29,455Augment Medicaid ......................... 35 885 205 ...... ...... ...... 1,090 1,090Reauthorize SCHIP ........................ ...... 710 1,095 620 890 845 4,160 9,680
Net impact ................................. 35 –375 –915 –1,815 –1,840 –2,045 –6,990 –18,685Reduce Social Services Block Grant ... ...... ...... –425 –495 –500 –500 –1,920 –4,420

24 MID–SESSION REVIEW
Table s–5. manDaTory ProPosals(In millions of dollars)
2007 2008 2009 2010 2011 2012 2008–2012
2008–2017
Temporary Assistance for Needy Families (TANF) .............................. ...... ...... 240 296 309 326 1,171 2,768
Title V Abstinence Education Program . 5 25 44 49 50 50 218 468Food and Drug Administration Re-
Inspection and Export Certification Fees ................................................... ...... –27 –28 –28 –29 –30 –142 –302
Foster Care District of Columbia Federal Medical Assistance Percentage (FMAP) Rate ................. ...... 5 5 6 5 6 27 62
Foster Care Child Welfare Program Option ............................................... ...... 8 5 –4 44 –47 6 –1
Child Support Enforcement ................ ...... 5 8 6 1 –1 19 4Total, HHS ...................................... 40 –4,137 –9,233 –14,230 –18,603 –22,934 –69,137 –261,071
Housing and Urban Development (HUD):Ginnie Mae Premium Increase ........... ...... –46 –46 –46 –46 –46 –230 –460Government-Sponsored Enterprises
Oversight Fee ................................... ...... –6 –6 –6 –6 –6 –30 –60Total, HUD ...................................... ...... –52 –52 –52 –52 –52 –260 –520
Interior:Arctic National Wildlife Refuge Lease
Bonuses:State of Alaska’s Share:
Receipts ..................................... ...... ...... –3,502 –2 –503 –3 –4,010 –4,025Expenditures ............................. ...... ...... 3,502 2 503 3 4,010 4,025
Federal Share:Receipts ..................................... ...... ...... –3,502 –2 –503 –3 –4,010 –4,025
Net Impact ........................... ...... ...... –3,502 –2 –503 –3 –4,010 –4,025Match National Park Centennial
Challenge Fund Gift Receipts ......... ...... 20 55 80 100 100 355 855Return to Net Receipts Sharing .......... ...... –44 –51 –51 –49 –54 –249 –494Amend Bureau of Land Management
(BLM) Federal Land Sale Authority ...... –5 –28 –40 –70 –44 –186 –334Repeal Energy Policy Act Fee Prohibition
and Mandatory Permit Funds ........... ...... –36 –37 –38 –36 –37 –184 –309Recover Pick-Sloan Project Cost ......... ...... –23 –23 –23 –23 –23 –115 –230Implement Friant Settlement ............. ...... 14 17 17 17 17 82 167Eliminate BLM Range Improvement
Fund ................................................. ...... –7 –10 –10 –10 –10 –47 –97Require Upfront Payment of Coal
Bonus Bids ....................................... ...... –2 –121 –115 –54 –134 –426 4Total, Interior .................................. ...... –83 –3,700 –182 –628 –188 –4,780 –4,463
Labor:Reform Pension Benefit Guaranty
Corporation Premiums .................... ...... ...... –1,390 –1,387 –1,400 –1,295 –5,472 –10,569Unemployment Insurance Integrity
Proposal 1 ........................................... ...... ...... –484 –494 –351 –355 –1,684 –3,619Reform Federal Employees’
Compensation Act ............................ ...... –9 –23 –29 –33 –43 –137 –493Reauthorize Trade Adjustment
Assistance ......................................... ...... ...... 6 18 24 25 73 123Total, Labor ..................................... ...... –9 –1,891 –1,892 –1,760 –1,668 –7,220 –14,558

SUMMARY TABLES 25
Table s–5. manDaTory ProPosals(In millions of dollars)
2007 2008 2009 2010 2011 2012 2008–2012
2008–2017
Treasury:Payment Transaction Integrity ........... ...... –273 –281 –290 –298 –306 –1,448 –3,105Extend the Rum Carryover for Puerto
Rico ................................................... ......... 76 26 ......... ......... ......... 102 102Debt Collection: Eliminate the 10-year
Statute of Limitations on Non-tax Debt owed to Federal Agencies ....... ......... –11 –6 –6 –6 –6 –35 –65Total, Treasury ............................... ......... –208 –261 –296 –304 –312 –1,381 –3,068
Veterans Affairs:Pharmacy Co-Payments ...................... ......... –311 –304 –306 –307 –342 –1,570 –3,352Income-Based Medical Care
Enrollment Fee ................................ ......... ......... –138 –134 –129 –125 –526 –1,094Third-Party Insurance Co-Payment
Offset ................................................ ......... –44 –44 –44 –43 –43 –218 –421Total, Veterans Affairs .................... ......... –355 –486 –484 –479 –510 –2,314 –4,867
Army Corps of Engineers:Additional Recreation User Fees,
Lease Receipts, and Contributions:Receipts ..................................... ......... –7 –10 –13 –16 –19 –65 –192Spending .................................... ......... ......... 7 10 13 16 46 164
Net effect .............................. ......... –7 –3 –3 –3 –3 –19 –28
Commodity Futures Trading Commission:User Fees .............................................. ......... –86 –89 –92 –95 –99 –461 –1,009
Environmental Protection Agency:Pesticide and Pre-Manufacturing
Notification fees ............................... ......... –70 –65 –68 –74 –65 –342 –682
Federal Communications Commission (FCC):Spectrum License Fee Authority ......... ......... –50 –150 –300 –300 –400 –1,200 –3,628Auction Prospective Ancillary
Terrestrial Component Spectrum .. ......... –150 –150 –150 –150 –150 –750 –1,500Extend Spectrum Auction Authority .. ......... ......... ......... ......... ......... –200 –200 –1,200Auction Domestic Satellite Spectrum . –30 –252 –105 –100 –100 –75 –632 –690Eliminate Telecommunications
Development Fund .......................... ......... –5 –6 –7 –7 –7 –32 –67Total, FCC ....................................... –30 –457 –411 –557 –557 –832 –2,814 –7,085
Office of Personnel Management (OPM):Federal Employees Health Benefits
Program Proposals ............................ ......... –38 –139 –238 –315 –377 –1,107 –3,531Improve Equity and Administration of
the Federal Retirement System ...... ......... 3 8 11 14 17 53 162Replace Non-Foreign Cost of Living
Adjustment with Locality Pay ......... ......... –1 –1 –1 1 4 2 109Total, OPM ...................................... ......... –36 –132 –228 –300 –356 –1,052 –3,260
Social Security Administration:Temporarily Extend Length of Time-
Limited Supplemental Security Income Eligibility for Refugees ....... ......... 56 55 55 ......... ......... 166 166

26 MID–SESSION REVIEW
Table s–5. manDaTory ProPosals(In millions of dollars)
2007 2008 2009 2010 2011 2012 2008–2012
2008–2017
Total, mandatory Proposals, including savings and augmentations .............................. 10 –9,079 –17,136 –18,009 –22,240 –25,830 –92,294 –300,724
social security Personal accounts (off-budget) ........................................................ ......... ......... ......... ......... ......... 29,348 29,348 637,441
outlay effects of Tax Proposals: 1
Improve the Health Coverage Tax Credit . ......... 3 9 11 13 14 50 129Child tax credit:
Clarify uniform definition of a child ... ......... –55 –59 –75 –71 –72 –332 –785Reduce computational complexity of
refundable child tax credit .............. ......... ......... –375 –388 –400 –417 –1,580 –3,773Earned Income Tax Credit (EITC):
Clarify uniform definition of a child ... ......... –127 –137 –174 –165 –169 –772 –1,824Simplify EITC eligibility requirement
regarding filing status, presence of children, and work and immigration status .......................... ......... –224 38 22 20 18 –126 –87
Provide a flat $15,000 deduction for family coverage ($7,500 for individual coverage) for those with and who purchase health insurance ......... ......... 199 3,950 3,449 2,828 10,426 12,165Total, Outlay Effects of Tax Proposals .. ......... –403 –325 3,346 2,846 2,202 7,666 5,825
other mandatory Proposals and indirect effects:Transfer of Royalty Oil to the Strategic
Petroleum Reserve ................................. ......... ......... ......... 947 ......... ......... 947 11,501Disability Insurance Impact of Increased
Program Integrity Efforts ...................... ......... –17 –124 –360 –586 –634 –1,721 –4,536Supplemental Security Income Impact of
Increased Program Integrity Efforts ..... ......... –14 –385 –856 –1,061 –355 –2,671 –3,352Enforce Windfall Elimination Provision/
Government Pension Offset (off-budget) . ......... ......... ......... ......... –142 –311 –453 –2,531Require Full-time Attendance for Child’s
Social Security Benefits at Age 16 (off-budget)..................................................... ......... –11 –87 –157 –163 –169 –587 –1,551
Replace Disability Insurance/Worker’s Comp Offset with Uniform Offset (off-budget) .................................................... ......... –4 –32 –77 –139 –218 –470 –1,085
Amend Federal Employee Health Benefits Program Statute ...................... ......... 27 88 145 192 225 677 2,098
Unemployment Insurance Integrity Proposal 1 ................................................. ......... ......... –58 –122 –126 –130 –436 –1,184
National Park Centennial Challenge Fund (spending of gift receipts) 1 ........... ......... 20 55 80 100 100 355 855
Food Stamp Impact of Commodity Supplemental Food Program Elimination ............................................. ......... 43 54 47 43 40 227 386
Impact of Replacing Non-Foreign Cost of Living Adjustment with Locality Pay on Civil Service Retirement and Disability Fund ...................................... ......... –2 –8 –15 –23 –31 –79 –361
Cash Investment Practices Modernization ... ......... –10 –10 –10 –10 –10 –50 –100
SUMMARY TABLES 27
Table s–5. manDaTory ProPosals(In millions of dollars)
2007 2008 2009 2010 2011 2012 2008–2012
2008–2017
Federal Housing Administration General and Special Risk Insurance Funds Impact of Mark-to-Market Extension ... –9 –13 –16 –16 –15 –7 –67 –76
Morris K. Udall Scholarship Fund ............ 2 2 2 2 2 2 10 20Forest County Safety Net Payments ......... ......... –467 135 118 57 143 –14 .........Correct Trust Accounting Deficiencies in
Individual Indian Money Investments . 6 ......... ......... ......... ......... ......... ......... .........TANF Impact of Social Services Block
Grant Reduction ..................................... ......... 43 50 8 –43 –50 8 .........Black Lung Disability Trust Fund
Refinancing: 1
Black Lung Disability Trust Fund ...... ......... 2,156 –439 –433 –424 –421 439 –3,184Interest Payments on Repayable
Advances .......................................... ......... –2,156 439 433 424 421 –439 3,184Net Impact ...................................... ......... ......... ......... ......... ......... ......... ......... .........
Foreign Labor Certification Fee:Receipts ................................................ ......... –65 –65 –65 –65 –65 –325 –650
Spending ............................................... ......... 65 65 65 65 65 325 650Net effect ......................................... ......... ......... ......... ......... ......... ......... ......... .........
Total, Other Mandatory Proposals ...... –1 –403 –336 –266 –1,914 –1,405 –4,324 84
Grand Total .................................................... 9 –9,886 –17,799 –14,928 –21,303 4,318 –59,598 342,635Memorandum:
Outlay Effects of Tax Extensions Assumed in Baseline: 1
Child Tax Credit Extension ................. ......... ......... ......... ......... 48 12,910 12,958 77,488Earned Income Tax Credit: Marriage
Penalty Relief ................................... ......... ......... ......... ......... –383 1,839 1,456 10,534Total ................................................ ........ ......... ......... ......... –335 14,749 14,414 88,022
1 Affects both receipts and outlays. Only the outlay effect is shown here. For receipt effects, see Table S–6.

28 MID–SESSION REVIEW
Table s–6. reCeiPTs ProPosals(In millions of dollars)
2007 2008 2009 2010 2011 2012 2008–2012
2008–2017
make Permanent Certain Tax relief enacted in 2001 and 2003 (assumed in the baseline):
Dividends tax rate structure ........ ....... 741 755 –4,182 –16,327 1,645 –17,368 –96,888Capital gains tax rate structure .. ....... ....... ....... –3,675 –18,668 –7,487 –29,830 –82,997Expensing for small business ....... ....... ....... ....... ....... –3,782 –5,119 –8,901 –21,573Marginal individual income tax
rate reductions .......................... ....... ....... ....... ....... –72,565 –116,507 –189,072 –842,013Child tax credit 1 ............................ ....... ....... ....... ....... –5,156 –20,741 –25,897 –135,530Marriage penalty relief 1 ............... ....... ....... ....... ....... –5,147 –7,731 –12,878 –42,048Education incentives .................... ....... ....... ....... ....... –738 –1,335 –2,073 –9,668Repeal of estate and generation-
skipping transfer taxes, and modification of gift taxes .......... ....... –1,871 –2,540 –3,307 –26,160 –56,912 –90,790 –433,734
Other incentives for families and children ...................................... ....... ....... ....... 6 –182 –874 –1,050 –5,413Total, make permanent certain
tax relief enacted in 2001 and 2003 ........................................... ....... –1,130 –1,785 –11,158 –148,725 –215,061 –377,859 –1,669,864
Tax incentives: simplify and encourage saving:
Expand tax-free savings opportunities ........................ ....... 1,527 3,545 3,023 1,075 –1,314 7,856 –592
Consolidate employer-based savings accounts .................. ....... –80 –120 –132 –141 –150 –623 –1,484Total, simplify and
encourage saving ............ ....... 1,447 3,425 2,891 934 –1,464 7,233 –2,076encourage entrepreneurship
and investment:Increase expensing for small
business ............................................ ....... –1,105 –1,507 –1,088 –1,261 –1,235 –6,196 –9,947invest in health care:
Provide a flat $15,000 deduction for family coverage ($7,500 for individual coverage) for those with and who purchase health insurance 1 ................................. ....... ....... –26,030 –37,093 –30,439 –18,974 –112,536 29,759
Expand and make health savings accounts (HSAs) more flexible .... ....... –318 –593 –784 –937 –1,037 –3,669 –10,366
Improve the Health Coverage Tax Credit 1 ....................................... ....... ....... –2 –3 –4 –4 –13 –39
Allow the orphan drug tax credit for certain pre-designation expenses .................................... ....... ....... ....... ....... ....... ....... ....... .......Total, invest in health care ..... ....... –318 –26,625 –37,880 –31,380 –20,015 –116,218 19,354
Provide incentives for charitable giving:
Extend permanently tax-free withdrawals from IRAs for charitable contributions ........... ....... –120 –255 –235 –171 –147 –928 –1,867

SUMMARY TABLES 29
Table s–6. reCeiPTs ProPosals(In millions of dollars)
2007 2008 2009 2010 2011 2012 2008–2012
2008–2017
Extend permanently the enhanced charitable deduction for contributions of food inventory ................................... ....... –44 –96 –106 –116 –127 –489 –1,345
Extend permanently the deduction for corporate donations of computer technology ................................. ....... –50 –118 –147 –154 –162 –631 –1,570
Permanently increase limits on contributions of property interests made for conservation purposes .................................... ....... –48 –35 –22 –18 –21 –144 –265
Extend permanently basis adjust-ment to stock of S corporations contributing appreciated property .................................... ....... –3 –15 –21 –25 –28 –92 –301
Reform excise tax based on investment income of private foundations ................................ ....... –61 –91 –97 –103 –110 –462 –1,163
Repeal the $150 million limitation on qualified 501(c)(3) bonds .......................................... ....... –2 –3 –9 –13 –14 –41 –104
Repeal certain restrictions on the use of qualified 501(c)(3) bonds for residential rental property . ....... –2 –5 –10 –17 –24 –58 –286Total, provide incentives for
charitable giving .................. ....... –330 –618 –647 –617 –633 –2,845 –6,901strengthen education:
Extend permanently the above-the-line deduction for qualified out-of-pocket classroom expenses .................................... ....... –18 –180 –183 –185 –188 –754 –1,739
Allow the saver’s credit for contributions to qualified tuition programs ....................... ....... –63 –163 –176 –189 –200 –791 –1,966Total, strengthen education .... ....... –81 –343 –359 –374 –388 –1,545 –3,705
Protect the environment: Extend permanently expensing of
brownfields remediation costs ..... ....... –283 –401 –357 –344 –328 –1,713 –2,874Eliminate the volume cap for
private activity bonds for water infrastructure ............................ ....... –1 –3 –5 –9 –13 –31 –184Total, protect the environment .... ....... –284 –404 –362 –353 –341 –1,744 –3,058
restructure assistance to new york City for continued recovery from the attacks of september 11th:Provide tax incentives for
transportation infrastructure ..... ....... –200 –200 –200 –200 –200 –1,000 –2,000Total, tax incentives ................ ....... –871 –26,272 –37,645 –33,251 –24,276 –122,315 –8,333
simplify the Tax laws for families:Clarify uniform definition of a child 1 ... ....... 64 48 31 40 15 198 350

30 MID–SESSION REVIEW
Table s–6. reCeiPTs ProPosals(In millions of dollars)
2007 2008 2009 2010 2011 2012 2008–2012
2008–2017
Simplify EITC eligibility requirement regarding filing status, presence of children, and work and immigration status1 ....... ....... 33 –27 –24 –24 –22 –64 –172
Reduce computational complexity of refundable child tax credit 1 ........... ....... ....... ....... ....... ....... ....... ....... .......Total, simplify the tax laws for
families ...................................... ....... 97 21 7 16 –7 134 178
improve Tax Compliance: 2
Expand information reporting ........... ....... 232 1,075 1,848 2,488 2,903 8,546 28,849Improve compliance by businesses .... ....... 3 5 5 5 6 24 57Strengthen tax administration .......... ....... ....... ....... 1 1 1 3 17
Total, improve tax compliance ...... ....... 235 1,080 1,854 2,494 2,910 8,573 28,923
improve Tax administration and other miscellaneous Proposals:Implement IRS administrative
reforms and extend IRS authority to fund undercover operations 3 ..... ....... ....... ....... ....... ....... ....... ....... .......
Eliminate the special exclusion from unrelated business taxable income for gain or loss on the sale or exchange of certain brownfields .... ....... 2 14 28 28 23 95 126
Limit related party interest deductions ....................................... ....... 93 160 168 177 185 783 1,858
Repeal excise tax on local telephone service 4 ............................................ ....... –279 –251 –174 –121 –87 –912 –1,299
Modify financing of the Airport and Airway trust fund 4 ......................... ....... ....... –6,362 –6,677 –6,989 –7,329 –27,357 –69,786
Anticipated receipt of donations to the National Park Service through the National Park Centennial Challenge Fund .............................. ....... 100 100 100 100 100 500 1,000
Transition from the non-foreign COLA to locality pay for employees in non-foreign areas ..... ....... 1 2 3 4 5 15 50Total, improve tax administration
and other miscellaneous proposals 4 .................................. ....... –83 –6,337 –6,552 –6,801 –7,103 –26,876 –68,051
improve unemployment insurance:Strengthen the financial integrity
of the unemployment insurance system by reducing improper benefit payments and tax avoidance 4 ....................................... ....... ....... 29 27 –167 –121 –232 –2,079
Extend unemployment insurance surtax 4 ........................................... ....... 1,065 1,558 1,596 1,635 1,549 7,403 1,409Total, improve unemployment
insurance 4 ................................. ....... 1,065 1,587 1,623 1,468 1,428 7,171 –670
modify energy Provisions:Repeal reduced recovery period for
natural gas distribution lines ........ ....... 49 82 99 110 99 439 842

SUMMARY TABLES 31
Table s–6. reCeiPTs ProPosals(In millions of dollars)
2007 2008 2009 2010 2011 2012 2008–2012
2008–2017
Modify amortization for certain geological and geophysical expenditures ................................... ....... 15 55 81 67 56 274 582
Indirect effect of energy proposals 5 ... ....... –55 –89 –182 –93 –85 –504 –934Total, modify energy provisions ... ....... 9 48 –2 84 70 209 490
Promote Trade:Implement free trade agreements and
modify other trade-related provisions 4 ....... –236 –694 –1,045 –1,254 –1,429 –4,658 –14,043
extend expiring Provisions:AMT relief for individuals ................. ....... –59,688 11,161 ....... ....... ....... –48,527 –48,527Research & Experimentation (R&E)
tax credit ......................................... ....... –3,221 –7,071 –9,145 –10,601 –11,799 –41,837 –117,309First-time homebuyer credit for DC .. ....... –1 –19 ....... ....... ....... –20 –20Authority to issue Qualified Zone
Academy Bonds .............................. ....... –3 –8 –13 –18 –20 –62 –162Deferral of gains from sales of
electric transmission property ....... ....... –111 –52 –65 –39 5 –262 –22 Disclosure of tax return information
related to terrorist activity 3 .......... ....... ....... ....... ....... ....... ....... ....... .......Excise tax on coal4 .............................. ....... ....... ....... ....... ....... ....... ....... 1,074 Exception for retirement plan
distributions provided individuals called to active duty for at least 179 days .......................................... –* –* –* –* –* –* –* –*Total, extend expiring provisions 4 ....... –63,024 4,011 –9,223 –10,658 –11,814 –90,708 –164,966
Total budget proposals, including proposals assumed in the baseline 4 ..... ....... –63,938 –28,341 –62,141 –196,627 –255,282 –606,329 –1,896,336
Total budget proposals, excluding proposals assumed in the baseline 4 .... ....... –62,808 –26,556 –50,983 –47,902 –40,221 –228,470 –226,472
* $500,000 or less.1 Affects both receipts and outlays. Only the receipt effect is shown here. For the outlay effect, see Table S–5.2 “Tax gap”-related proposals.3 No net budgetary impact.4 Net of income offsets.5 Indirect effect on receipts of proposed alternative fuels and fuel efficiency standards.

32 MID–SESSION REVIEW
Table s–7. buDGeT summary by CaTeGory(In billions of dollars)
2006 2007 2008 2009 2010 2011 2012
Outlays:Discretionary:
Security:DOD military ...................... 499 537 575 582 548 536 527Homeland security ............. 31 35 37 41 39 40 41International affairs ........... 36 40 39 39 37 37 37
Non-Security ............................ 451 460 464 450 443 436 437Total, Discretionary ............ 1,017 1,072 1,115 1,111 1,068 1,050 1,042
Mandatory: Social Security:
Current program ................ 544 581 609 642 680 720 763Personal accounts ............... .......... .......... .......... .......... .......... .......... 29
Medicare ................................... 325 369 393 418 443 487 486Medicaid and SCHIP ............... 186 203 215 228 244 263 283Other ......................................... 357 318 330 345 363 380 374
Total, Mandatory ................ 1,412 1,471 1,547 1,633 1,730 1,849 1,936Net Interest ................................... 227 235 256 272 280 286 290
Total Outlays ....................................... 2,655 2,779 2,918 3,016 3,078 3,184 3,267Receipts ................................................ 2,407 2,574 2,659 2,803 2,954 3,095 3,300
Deficit(–)/surplus ........................... –248 –205 –258 –213 –123 –89 33On-budget deficit ........................... –434 –385 –460 –429 –358 –344 –207Off-budget surplus ........................ 186 180 202 217 235 254 239

SUMMARY TABLES 33
Table s–8. reCeiPTs by sourCe (In billions of dollars)
2006 Actual
Estimate
2007 2008 2009 2010 2011 2012
february estimates:Individual income taxes ............... 1,043.9 1,168.8 1,246.6 1,331.1 1,428.3 1,517.3 1,636.6Corporation income taxes ............. 353.9 342.1 314.9 319.8 325.5 340.6 366.6Social insurance and retirement
receipts .................................. 837.8 873.4 927.2 974.2 1,029.3 1,085.7 1,138.8Excise taxes ................................... 74.0 57.1 68.1 63.1 63.6 68.6 71.3Estate and gift taxes ..................... 27.9 25.3 25.7 27.4 21.7 1.7 0.5Customs duties ............................. 24.8 26.8 29.2 30.7 32.7 34.3 35.7Miscellaneous receipts .................. 45.0 46.7 50.7 52.0 53.6 55.5 57.8
Total ........................................ 2,407.3 2,540.1 2,662.5 2,798.3 2,954.7 3,103.6 3,307.3
mid-session estimates:Individual income taxes ............… 1,043.9 1,168.3 1,226.6 1,329.5 1,427.7 1,508.6 1,620.7Corporation income taxes ............. 353.9 371.7 343.0 344.3 344.7 356.0 385.5Social insurance and retirement
receipts .................................. 837.8 869.7 918.5 959.1 1,012.9 1,073.0 1,131.2Excise taxes ................................... 74.0 65.2 66.2 60.9 61.8 66.7 69.4Estate and gift taxes ..................... 27.9 25.8 26.4 28.2 22.3 1.6 0.4Customs duties ............................. 24.8 26.5 29.1 30.1 32.1 33.8 35.5Miscellaneous receipts .................. 45.0 46.8 49.6 50.9 52.9 54.9 57.2
Total ........................................ 2,407.3 2,573.9 2,659.4 2,803.0 2,954.5 3,094.7 3,299.9
Difference:Individual income taxes ............... ......... –0.5 –20.0 –1.6 –0.6 –8.7 –15.9Corporation income taxes ............. ......... 29.6 28.1 24.5 19.2 15.5 18.9Social insurance and retirement
receipts .................................. ......... –3.7 –8.7 –15.1 –16.4 –12.7 –7.6Excise taxes ................................... ......... 8.2 –1.9 –2.2 –1.8 –1.9 –2.0Estate and gift taxes ..................... ......... 0.5 0.7 0.8 0.6 –0.1 –0.1Customs duties ............................. ......... –0.3 –0.2 –0.5 –0.5 –0.4 –0.2Miscellaneous receipts .................. ......... 0.1 –1.1 –1.1 –0.7 –0.5 –0.6
Total ........................................ ......... 33.8 –3.1 4.7 –0.2 –8.9 –7.4

34 MID–SESSION REVIEW
Table s–9. ouTlays by aGenCy(In billions of dollars)
2006 Actual
February estimates Mid–Session estimates
2007 2008 2007 2008
Legislative Branch ..................................... 4.1 4.3 4.7 4.4 4.8Judicial Branch .......................................... 5.8 5.8 6.7 6.1 6.7Agriculture ................................................. 93.5 88.8 89.0 88.9 91.9Commerce ................................................... 6.4 6.2 7.1 6.6 7.3Defense—Military ...................................... 499.4 548.9 583.3 538.8 577.1Education .................................................. 93.4 68.0 58.6 67.9 60.2Energy ........................................................ 19.6 22.0 21.9 21.5 22.2Health and Human Services .................... 614.3 671.3 699.2 679.2 712.5Homeland Security .................................... 69.1 50.4 43.2 46.3 39.8Housing and Urban Development ........... 42.4 42.8 44.4 45.6 45.3Interior ...................................................... 9.1 10.9 10.5 10.5 10.1Justice ........................................................ 23.3 23.0 24.0 24.2 24.7Labor ......................................................... 43.1 47.4 52.3 47.5 50.6State ........................................................... 13.0 16.3 16.8 16.7 17.3Transportation .......................................... 60.1 63.8 67.0 64.1 68.7Treasury .................................................... 464.7 490.5 525.0 488.6 518.2Veterans Affairs ......................................... 69.8 72.3 83.3 74.8 84.8Corps of Engineers .................................... 6.9 7.6 6.5 6.7 7.7Other Defense Civil Programs ................. 44.4 47.6 49.1 47.7 49.3Environmental Protection Agency ........... 8.3 8.0 7.8 7.9 7.8Executive Office of the President ............. 5.4 2.7 1.4 2.9 1.3General Services Administration .............. * 0.5 0.8 0.3 0.8International Assistance Programs ......... 13.9 17.1 18.0 16.8 18.5National Aeronautics and Space
Administration ....................................... 15.1 16.1 17.2 16.2 17.3National Science Foundation .................... 5.5 5.9 6.0 5.9 6.1Office of Personnel Management .............. 62.4 58.8 64.2 59.4 64.7Small Business Administration ................ 0.9 0.7 0.7 1.3 0.8Social Security Administration ................ 585.7 622.9 654.5 621.8 656.1Other Independent Agencies ..................... 12.9 18.7 15.1 20.1 19.0Allowances ................................................ ........... 8.0 2.3 ........... –0.3Undistributed Offsetting Receipts ........... –237.5 –263.1 –278.7 –260.0 –273.7
Total ................................................ 2,655.4 2,784.3 2,901.9 2,778.6 2,917.7
* $50 million or less.

SUMMARY TABLES 35
Table s–10. ouTlays by funCTion(In billions of dollars)
2006 Actual
February estimates Mid–Session estimates
2007 2008 2007 2008
National defense ......................................... 521.8 571.9 606.5 561.6 600.7
International affairs ................................... 29.5 35.1 36.1 34.4 36.4
General science, space, and technology ..... 23.6 24.9 26.6 25.1 26.9
Energy ........................................................ 0.8 1.8 1.4 0.8 1.8
Natural resources and environment 33.1 35.2 32.9 34.6 33.7
Agriculture .................................................. 26.0 20.1 19.9 21.3 22.3
Commerce and housing credit ................... 6.2 0.2 –2.0 2.5 2.0
Transportation ........................................... 70.2 74.6 79.3 75.2 81.0
Community and regional development .... 54.5 32.6 24.7 32.8 22.2Education, training, employment, and
social services ..................................... 118.6 94.0 82.7 93.8 84.4
Health ......................................................... 252.8 268.5 280.6 275.2 287.6
Medicare ...................................................... 329.9 372.3 391.6 374.4 397.9
Income security .......................................... 352.5 365.4 380.8 367.4 382.5
Social Security ............................................ 548.5 586.5 612.5 585.6 614.2
Veterans benefits and services .................. 69.8 72.4 83.4 74.9 84.8
Administration of justice ............................ 41.0 45.3 47.0 46.2 47.3
General government .................................. 18.2 18.8 20.7 19.3 21.5
Net interest ................................................. 226.6 239.2 261.3 235.3 256.1
Allowances .................................................. ........... 7.4 2.1 ........... –0.3
Undistributed offsetting receipts ............... –68.2 –81.8 –86.3 –82.0 –85.3Total ................................................ 2,655.4 2,784.3 2,901.9 2,778.6 2,917.7

36 MID–SESSION REVIEW
Table s–11. baseline CaTeGory ToTals(In billions of dollars)
2006 2007 2008 2009 2010 2011 2012
Outlays:Discretionary:
Security:DOD military ........................... 499 537 485 471 477 482 491Homeland security .................. 31 35 35 38 37 38 39International affairs ................ 36 40 38 37 36 36 37
Non-Security ................................. 451 460 469 475 478 483 491Total, Discretionary ................. 1,017 1,072 1,028 1,020 1,028 1,039 1,057
Mandatory:Social Security .............................. 544 581 609 642 681 721 765Medicare ........................................ 325 369 396 426 455 503 507Medicaid and SCHIP .................... 186 203 216 229 246 264 285Other .............................................. 357 318 335 353 364 382 376
Total, Mandatory ..................... 1,412 1,471 1,556 1,651 1,745 1,871 1,932Net Interest ......................................... 227 235 253 262 266 269 271
Total Outlays ............................................ 2,655 2,779 2,837 2,934 3,039 3,179 3,259Receipts ..................................................... 2,407 2,574 2,722 2,830 3,005 3,143 3,340
Deficit(–)/surplus ................................. –248 –205 –115 –104 –34 –36 81On-budget deficit ................................. –434 –385 –316 –322 –270 –291 –188Off-budget surplus .............................. 186 180 202 218 236 255 268

SUMMARY TABLES 37
Table s–12. ouTlays for manDaTory ProGrams unDer CurrenT law
(In billions of dollars)
2006Actual
Estimate
2007 2008 2009 2010 2011 2012
Human resources programs:Education, training, employment and social
services ...................................................... 38 13 9 10 11 11 10Health ............................................................ 201 221 234 249 267 287 309Medicare ........................................................ 325 369 396 426 455 503 507Income security ............................................. 298 312 327 337 347 362 362Social security ............................................... 544 581 609 642 681 721 765Veterans’ benefits and services ..................... 37 38 45 49 52 59 55
Subtotal, human resources programs .... 1,444 1,534 1,621 1,713 1,812 1,943 2,007
Other mandatory programs:National defense ............................................ 2 3 4 3 3 3 3International affairs ...................................... –7 –6 –3 –3 –3 –3 –3Energy ............................................................ –2 –3 –2 –2 –3 –2 –2Agriculture ..................................................... 20 14 15 14 14 14 15Commerce and housing credit ...................... 4 * –1 –2 –3 –3 –2Transportation .............................................. 1 2 2 3 2 2 3Community and regional development ........ 16 3 * –* –* –* –*Justice ............................................................ 1 2 2 1 * –* –*General government ...................................... 2 3 3 3 3 3 4Undistributed offsetting receipts ................. –68 –82 –85 –80 –83 –88 –92Other functions .............................................. –1 1 1 1 1 1 1
Subtotal, other mandatory programs .... –31 –62 –64 –62 –67 –72 –75Total, outlays for mandatory
programs under current law ......... 1,412 1,471 1,556 1,651 1,745 1,871 1,932
* $500 million or less. 1 This table meets the requirements of Section 221(b) of the Legislative Reorganization Act of 1970.
1

38 MID–SESSION REVIEW
Table s–13. feDeral GoVernmenT finanCinG anD DebT (Dollar amounts in billions)
2006 Actual
Estimate
2007 2008 2009 2010 2011 2012
financing:
Unified budget deficit (–)/surplus (+) ..................... –248 –205 –258 –213 –123 –89 33Financing other than borrowing from the public:
Net purchases of non-Federal securities by the National Railroad Retirement Investment Trust (–) .................................. –2 –3 –* * * 1 *
Changes in: 1
Treasury operating cash balance (–) ........... –16 –8 15 ....... ....... ....... .......Checks outstanding, etc. 2 ............................. 13 ....... ....... ....... ....... ....... .......
Seigniorage on coins .......................................... 1 1 1 1 1 1 1Credit net financing disbursements (–):
Direct loan financing accounts ..................... –5 –9 –15 –13 –16 –18 –19Guaranteed loan financing accounts ........... 21 –4 –7 –7 –6 –5 –4
Total, financing other than borrowing from the public .................................... 11 –24 –6 –19 –21 –21 –22
Total, requirement to borrow from the public ................................................... –237 –228 –264 –231 –144 –111 11
Change in debt held by the public .......................... 237 228 264 231 144 111 –11
Changes in Debt subject to statutory limitation:
Change in debt held by the public .................... 237 228 264 231 144 111 –11Change in debt held by Government
accounts ...................................................... 309 284 300 327 351 371 385Less: change in debt not subject to limit
and other adjustments ............................... 3 * 1 3 2 3 2Total, change in debt subject to
statutory limitation .............................. 549 513 565 561 498 484 377
Debt subject to statutory limitation, end of year:Debt issued by Treasury .......................................... 8,426 8,938 9,504 10,062 10,558 11,041 11,416Adjustment for discount, premium, and
coverage 3 ........................................................... –5 –5 –5 –3 –2 * 2 Total, debt subject to statutory
limitation 4 ................................................... 8,420 8,933 9,498 10,059 10,557 11,041 11,418
Debt outstanding, end of year:Gross Federal debt: 5
Debt issued by Treasury ................................... 8,426 8,938 9,504 10,062 10,558 11,041 11,416 Debt issued by other agencies .......................... 26 26 25 24 24 23 22
Total, gross Federal debt ............................. 8,451 8,964 9,529 10,087 10,582 11,064 11,438Held by:
Debt held by Government accounts .................. 3,622 3,907 4,207 4,534 4,885 5,256 5,641 Debt held by the public ..................................... 4,829 5,057 5,322 5,553 5,697 5,808 5,797
As a percent of GDP ..................................... 37.0% 36.9% 36.8% 36.5% 35.6% 34.5% 32.9%
* $500 million or less.
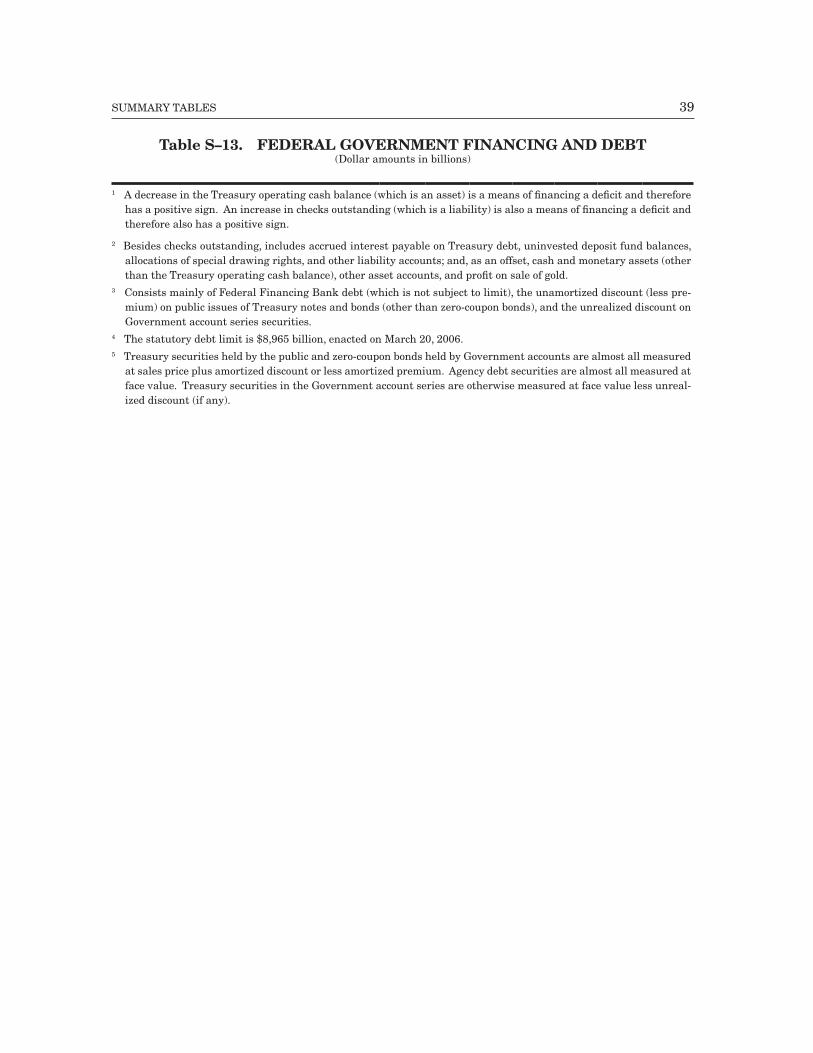
SUMMARY TABLES 39
Table s–13. feDeral GoVernmenT finanCinG anD DebT (Dollar amounts in billions)
1 A decrease in the Treasury operating cash balance (which is an asset) is a means of financing a deficit and therefore has a positive sign. An increase in checks outstanding (which is a liability) is also a means of financing a deficit and therefore also has a positive sign.
2 Besides checks outstanding, includes accrued interest payable on Treasury debt, uninvested deposit fund balances, allocations of special drawing rights, and other liability accounts; and, as an offset, cash and monetary assets (other than the Treasury operating cash balance), other asset accounts, and profit on sale of gold.
3 Consists mainly of Federal Financing Bank debt (which is not subject to limit), the unamortized discount (less pre-mium) on public issues of Treasury notes and bonds (other than zero-coupon bonds), and the unrealized discount on Government account series securities.
4 The statutory debt limit is $8,965 billion, enacted on March 20, 2006.5 Treasury securities held by the public and zero-coupon bonds held by Government accounts are almost all measured
at sales price plus amortized discount or less amortized premium. Agency debt securities are almost all measured at face value. Treasury securities in the Government account series are otherwise measured at face value less unreal-ized discount (if any).


Glossary
41
Appropriation.—An appropriation provides legal authority for Federal agencies to incur obligations and to make payments out of the Treasury for specified purposes. Appropriations bills, such as the Department of Homeland Se-curity or the Departments of Labor, Health and Human Services, and Education bills, are con-sidered every year by the Congress and supple-mental appropriations bills are considered from time to time.
Authorization.—An authorization is an act of the Congress that establishes or continues a Federal program or agency and sets forth the guidelines to which it must adhere.
Budget Authority.—Budget authority is the authority provided by law to incur financial ob-ligations that will result in outlays.
Budget Resolution.—The budget resolution is the Congress’ annual framework that sets targets for total budget authority, total outlays, total revenues, and the deficit (on-budget), as well as discretionary and mandatory alloca-tions within the spending targets. These targets guide the committees’ deliberations. A budget resolution does not become law and is not bind-ing on the Executive Branch.
Cap.—A ‘‘cap’’ is a legal limit on annual discre-tionary spending.
Deficit.—A deficit is the amount by which out-lays exceed receipts in a fiscal year.
Discretionary Spending.—Discretionary spending is spending that the President and the Congress control through annual appropri-ations bills. Examples include spending for such activities as the FBI, the Coast Guard, educa-tion, space exploration, highway construction, defense, and foreign aid.
Entitlement.—An entitlement program is one in which the Federal Government is legally ob-ligated to make payments or provide aid to any person who meets the legal criteria for eligibil-ity. Examples include Social Security, Medicare, Medicaid, and Food Stamps.
Fiscal Year.—The fiscal year is the Federal Government’s accounting period. It begins on
October 1st and ends on September 30th. For example, fiscal year 2008 begins on October 1, 2007, and ends on September 30, 2008.
Gross Domestic Product (GDP).—GDP is a measure of the market value of goods and ser-vices produced within the United States. It is the standard measure of the size of the economy.
Mandatory Spending.—Mandatory spend-ing is controlled by permanent law rather than annual appropriations. Examples are Social Security and the Student Loan Program. The President and the Congress can change the law with respect to the eligibility criteria or the payment formula, and thus change the level of spending on mandatory programs, but annual action is not necessary to ensure the continua-tion of spending. In addition, budget authority provided in annual appropriations acts for cer-tain programs is treated as mandatory because the authorizing legislation entitles beneficiaries to receive payment or otherwise obligates the Government to make payment.
Obligations.—Obligations are binding agree-ments that result in outlays, immediately or in the future.
Outlays.—Outlays are the primary measure of Government spending. Outlays are payments to liquidate obligations, largely measured on a cash basis. Total Federal outlays are a net figure, con-sisting of gross payments minus the amount of business-like collections and intragovernmental transactions, in a given fiscal year.
Receipts.—Governmental receipts (sometimes called receipts or revenues) are the collections of money that primarily result from taxes and similar Government powers to compel payment. Examples of governmental receipts include in-come taxes, payroll taxes, excise taxes, and customs duties. They do not include offsetting receipts or collections from the Federal Govern-ment’s business-like activities, such as the en-trance fees at national parks, or collections by one Government account from another.
Surplus.—A surplus is the amount by which receipts exceed outlays in a fiscal year.


EXECUTIVE OFFICE OF THE PRESIDENTOFFICE OF MANAGEMENT AND BUDGET
WASHINGTON, D. C. 20503