Embed Size (px)
Citation preview
^`nrfpfqflk=obpb^o`e=moldo^j=do^ar^qb=p`elli=lc=_rpfkbpp=C=mr_if`=mlif`v=k^s^i=mlpqdo^ar^qb=p`elli=
Approved for public release; distribution unlimited.
Prepared for the Naval Postgraduate School, Monterey, California 93943
Disclaimer: The views represented in this report are those of the authors and do not reflect the official policy position of the Navy, the Department of Defense, or the Federal Government.
bu`bomq=colj=qeb==
mêçÅÉÉÇáåÖë=çÑ=íÜÉ=
bfdeqe=^kkr^i=^`nrfpfqflk==
obpb^o`e=pvjmlpfrj==
qeropa^v=pbppflkp==
slirjb ff
Determining the Appropriate Size of the Contracting Workforce: Yes We Can!
Tim Reed, NPS
Published: 30 April 2011
NPS-AM-11-C8P17R01-060

Report Documentation Page Form ApprovedOMB No. 0704-0188
Public reporting burden for the collection of information is estimated to average 1 hour per response, including the time for reviewing instructions, searching existing data sources, gathering andmaintaining the data needed, and completing and reviewing the collection of information. Send comments regarding this burden estimate or any other aspect of this collection of information,including suggestions for reducing this burden, to Washington Headquarters Services, Directorate for Information Operations and Reports, 1215 Jefferson Davis Highway, Suite 1204, ArlingtonVA 22202-4302. Respondents should be aware that notwithstanding any other provision of law, no person shall be subject to a penalty for failing to comply with a collection of information if itdoes not display a currently valid OMB control number.
1. REPORT DATE APR 2011 2. REPORT TYPE
3. DATES COVERED 00-00-2011 to 00-00-2011
4. TITLE AND SUBTITLE Determining the Appropriate Size of the Contracting Workforce: Yes We Can!
5a. CONTRACT NUMBER
5b. GRANT NUMBER
5c. PROGRAM ELEMENT NUMBER
6. AUTHOR(S) 5d. PROJECT NUMBER
5e. TASK NUMBER
5f. WORK UNIT NUMBER
7. PERFORMING ORGANIZATION NAME(S) AND ADDRESS(ES) Naval Postgraduate School,Monterey,CA,93943
8. PERFORMING ORGANIZATIONREPORT NUMBER
9. SPONSORING/MONITORING AGENCY NAME(S) AND ADDRESS(ES) 10. SPONSOR/MONITOR’S ACRONYM(S)
11. SPONSOR/MONITOR’S REPORT NUMBER(S)
12. DISTRIBUTION/AVAILABILITY STATEMENT Approved for public release; distribution unlimited
13. SUPPLEMENTARY NOTES Presented at the Naval Postgraduate School?s 8th Annual Acquisition Research Symposium, 10-12 May2011, Seaside, CA.
14. ABSTRACT The increasing pace of change in the federal acquisition environment, an emphasis on increasing contractmanagement accessions, and intense pressure to cut operating budgets has increased the interest in themodels available for use by the DoD to (1) measure contracting organization workload and (2) assignadequate resources to effectively manage the workload with an acceptable level of risk. An essentialrequirement for organizational success is to ensure that the correct number of resources, with the correctcompetencies, is available at the point of need at the correct time to accomplish the mission. In order tocorrectly train and assign resources, one must first understand the nature and amount of work to beaccomplished. This paper finds that contracting workload assessment is not conducted in a consistentmanner within DoD nor among the various individual Service components. In fact, in many organizations,it is not conducted at all. Seven steps that contracting organizations can take to identify contractingworkload and manage it accordingly are presented.
15. SUBJECT TERMS
16. SECURITY CLASSIFICATION OF: 17. LIMITATION OF ABSTRACT Same as
Report (SAR)
18. NUMBEROF PAGES
46
19a. NAME OFRESPONSIBLE PERSON
a. REPORT unclassified
b. ABSTRACT unclassified
c. THIS PAGE unclassified
Standard Form 298 (Rev. 8-98) Prescribed by ANSI Std Z39-18

^`nrfpfqflk=obpb^o`e=moldo^j=do^ar^qb=p`elli=lc=_rpfkbpp=C=mr_if`=mlif`v=k^s^i=mlpqdo^ar^qb=p`elli=
The research presented at the symposium was supported by the Acquisition Chair of the Graduate School of Business & Public Policy at the Naval Postgraduate School. To request Defense Acquisition Research or to become a research sponsor, please contact: NPS Acquisition Research Program Attn: James B. Greene, RADM, USN, (Ret.) Acquisition Chair Graduate School of Business and Public Policy Naval Postgraduate School 555 Dyer Road, Room 332 Monterey, CA 93943-5103 Tel: (831) 656-2092 Fax: (831) 656-2253 E-mail: [email protected] Copies of the Acquisition Sponsored Research Reports may be printed from our website www.acquisitionresearch.net

===================^Åèìáëáíáçå=oÉëÉ~êÅÜW=`ob^qfkd=pvkbodv=clo=fkclojba=`e^kdb=====- i -
=
Preface & Acknowledgements
During his internship with the Graduate School of Business & Public Policy in June 2010, U.S. Air Force Academy Cadet Chase Lane surveyed the activities of the Naval Postgraduate School’s Acquisition Research Program in its first seven years. The sheer volume of research products—almost 600 published papers (e.g., technical reports, journal articles, theses)—indicates the extent to which the depth and breadth of acquisition research has increased during these years. Over 300 authors contributed to these works, which means that the pool of those who have had significant intellectual engagement with acquisition issues has increased substantially. The broad range of research topics includes acquisition reform, defense industry, fielding, contracting, interoperability, organizational behavior, risk management, cost estimating, and many others. Approaches range from conceptual and exploratory studies to develop propositions about various aspects of acquisition, to applied and statistical analyses to test specific hypotheses. Methodologies include case studies, modeling, surveys, and experiments. On the whole, such findings make us both grateful for the ARP’s progress to date, and hopeful that this progress in research will lead to substantive improvements in the DoD’s acquisition outcomes.
As pragmatists, we of course recognize that such change can only occur to the extent that the potential knowledge wrapped up in these products is put to use and tested to determine its value. We take seriously the pernicious effects of the so-called “theory–practice” gap, which would separate the acquisition scholar from the acquisition practitioner, and relegate the scholar’s work to mere academic “shelfware.” Some design features of our program that we believe help avoid these effects include the following: connecting researchers with practitioners on specific projects; requiring researchers to brief sponsors on project findings as a condition of funding award; “pushing” potentially high-impact research reports (e.g., via overnight shipping) to selected practitioners and policy-makers; and most notably, sponsoring this symposium, which we craft intentionally as an opportunity for fruitful, lasting connections between scholars and practitioners.
A former Defense Acquisition Executive, responding to a comment that academic research was not generally useful in acquisition practice, opined, “That’s not their [the academics’] problem—it’s ours [the practitioners’]. They can only perform research; it’s up to us to use it.” While we certainly agree with this sentiment, we also recognize that any research, however theoretical, must point to some termination in action; academics have a responsibility to make their work intelligible to practitioners. Thus we continue to seek projects that both comport with solid standards of scholarship, and address relevant acquisition issues. These years of experience have shown us the difficulty in attempting to balance these two objectives, but we are convinced that the attempt is absolutely essential if any real improvement is to be realized.
We gratefully acknowledge the ongoing support and leadership of our sponsors, whose foresight and vision have assured the continuing success of the Acquisition Research Program:
• Office of the Under Secretary of Defense (Acquisition, Technology & Logistics)
• Program Executive Officer SHIPS
• Commander, Naval Sea Systems Command
• Army Contracting Command, U.S. Army Materiel Command
• Program Manager, Airborne, Maritime and Fixed Station Joint Tactical Radio System

===================^Åèìáëáíáçå=oÉëÉ~êÅÜW=`ob^qfkd=pvkbodv=clo=fkclojba=`e^kdb=====- ii -
=
• Program Executive Officer Integrated Warfare Systems
• Office of the Assistant Secretary of the Air Force (Acquisition)
• Office of the Assistant Secretary of the Army (Acquisition, Logistics, & Technology)
• Deputy Assistant Secretary of the Navy (Acquisition & Logistics Management)
• Director, Strategic Systems Programs Office
• Deputy Director, Acquisition Career Management, US Army
• Defense Business Systems Acquisition Executive, Business Transformation Agency
• Office of Procurement and Assistance Management Headquarters, Department of Energy
We also thank the Naval Postgraduate School Foundation and acknowledge its generous contributions in support of this Symposium.
James B. Greene, Jr. Keith F. Snider, PhD Rear Admiral, U.S. Navy (Ret.) Associate Professor

====================^Åèìáëáíáçå=oÉëÉ~êÅÜW=`ob^qfkd=pvkbodv=clo=fkclojba=`e^kdb==== - 93 - =
=
Panel 17 – The People Problem: Research in Acquisition Human Capital
Thursday, May 12, 2011
11:15 a.m. – 12:45 p.m.
Chair: Jeffrey P. Parsons, Executive Director, Army Contracting Command, U.S. Army Material Command
Determining the Appropriate Size of the Contracting Workforce: Yes We Can!
Tim Reed, NPS
How Can Civilian Retention in the Army Contracting Command Contracting Professional Community Be Affected?
Charles Farrior, DAU
Outsourcing the Procurement/Acquisition Function of an Operation: Is It a Good Thing or Not?
Debbie Nicholson, J. M. Waller Associates, Inc.
Jeffrey P. Parsons—Executive Director of the U.S. Army Contracting Command (a new major subordinate command of the U.S. Army Materiel Command, AMC). The Army Contracting Command provides global contracting support to the operational Army across the full spectrum of military operations and in garrison. Mr. Parsons commands over 5,500 military and civilian personnel worldwide, who award and manage over 270,000 contractual actions valued at more than $80 billion per fiscal year. He exercises command and procurement authority over two subordinate commands, the Installation Contracting Command and the Expeditionary Contracting Command, and also leads the AMC Acquisition Centers, which support AMC’s other major subordinate commands and Life Cycle Management Commands. Mr. Parsons was appointed to the Senior Executive Service on December 15, 2003.
Prior to assuming his current position, Mr. Parsons served as the Director of Contracting, Office of Command Contracting, Headquarters, AMC, Fort Belvoir, VA. Responsibilities from the Office of Command Contracting transitioned into the Army Contracting Command. Mr. Parsons continues to serve as the Principal Advisor to the Commanding General of AMC and his staff on all contracting matters and as the AMC Career Program Manager for the Contracting and Acquisition Career Program, with responsibility for the recruitment, training, education, and professional development of the civilian and military contracting professionals who are part of the acquisition workforce.
Prior to his appointment to the Senior Executive Service, Mr. Parsons was the Director of Contracting, Headquarters, U.S. Air Force Materiel Command, Wright-Patterson Air Force Base, OH, where he retired from active duty as an Air Force Colonel after 26 years of service. He was responsible for developing and implementing contracting policies and processes to annually acquire $34 billion in research and development, production, test, and logistics support for Air Force weapon systems. He was directly responsible for the training, organizing, and equipping of more than 3,000 contracting professionals.
Mr. Parsons’ contracting career began in 1977 as a base procurement officer supporting the 90th Strategic Missile Wing at F. E. Warren Air Force Base, WY. He held a variety of positions as a contracting officer with a wide range of experience touching on all aspects of systems, logistics, and operational contracting. He was the Director of Contracting for a multi-billion dollar classified satellite program operated by the National Reconnaissance Office and served twice as a plant commander in the Defense Contract Management Agency. Mr. Parsons also held several key staff positions at

====================^Åèìáëáíáçå=oÉëÉ~êÅÜW=`ob^qfkd=pvkbodv=clo=fkclojba=`e^kdb==== - 94 - =
=
Headquarters, U.S. Air Force, the Air Force Secretariat, and with the Office of the Secretary of Defense, in which he was responsible for the development, implementation, and management of integrated, coordinated, and uniform policies and programs to govern DoD procurement worldwide.
Mr. Parsons received his bachelor’s degree in psychology from St. Joseph’s University, Philadelphia, PA, and holds two master’s degrees—one in administration with a concentration in procurement and contracting from George Washington University, Washington, DC, and the other in national resource strategy from the National Defense University. He is a graduate of the Industrial College of the Armed Forces and the Defense Systems Management College Executive Program Management Course. Mr. Parsons holds the Acquisition Professional Development Program’s highest certifications in contracting and program management. He also is a Certified Professional Contracts Manager, National Contract Management Association.

====================^Åèìáëáíáçå=oÉëÉ~êÅÜW=`ob^qfkd=pvkbodv=clo=fkclojba=`e^kdb==== - 95 - =
=
Determining the Appropriate Size of the Contracting Workforce: Yes We Can! Tim Reed—Associate Professor, Naval Postgraduate School. Dr. Reed teaches master's courses in acquisition management. He also taught at the Air Force Institute of Technology (AFIT), where he created the Strategic Purchasing Graduate Degree Program, the University of Dayton, American University (Washington, DC), and the University of Maryland (University College). He has also taught visiting seminars at American University in Cairo and Instituto de Empresas in Madrid. His Air Force contracting experience includes F-22 Fighter, C-17 Cargo Transport, and serving as director of Joint Contracting Command-North, Kirkuk, Iraq. At the Pentagon, Dr. Reed was responsible for implementing strategic sourcing and commodity councils for the DoD and the Air Force. He earned a PhD in Strategic Management and Entrepreneurship from the University of Colorado and is a certified purchasing manager (C.P.M.) with the Institute of Supply Management. [[email protected]]
Abstract The increasing pace of change in the federal acquisition environment, an emphasis on increasing contract management accessions, and intense pressure to cut operating budgets has increased the interest in the models available for use by the DoD to (1) measure contracting organization workload and (2) assign adequate resources to effectively manage the workload with an acceptable level of risk. An essential requirement for organizational success is to ensure that the correct number of resources, with the correct competencies, is available at the point of need at the correct time to accomplish the mission. In order to correctly train and assign resources, one must first understand the nature and amount of work to be accomplished. This paper finds that contracting workload assessment is not conducted in a consistent manner within DoD nor among the various individual Service components. In fact, in many organizations, it is not conducted at all. Seven steps that contracting organizations can take to identify contracting workload and manage it accordingly are presented.
Introduction This study focuses on identifying methods used to assess the workload of
government contracting personnel. In its most basic form, this research seeks to move the field toward answering the question, “What size should my contracting organization be?” The increasing pace of change in the federal acquisition environment, an emphasis on increasing contract management accessions, and intense pressure to cut operating budgets has increased the interest in the models available for use by the DoD to (1) measure contracting organization workload and (2) assign adequate resources to effectively manage the workload with an acceptable level of risk.
An essential requirement for organizational success is to ensure that the correct number of resources, with the correct competencies, is available at the point of need at the correct time to accomplish the mission. In order to correctly train and assign resources, one must first understand the nature and amount of work to be accomplished. Simply stated, a leader is unable to effectively deploy resources (which should be step 2) without first understanding the work to be done (step 1). This maxim holds true for leaders, whether leading in fast-food restaurants or leading in forward deployed military units. It also holds true for acquisition and contracting organizations.
Through a review of existing literature and models currently in use by government and industry contracting (also sometimes referred to as purchasing/procurement)

====================^Åèìáëáíáçå=oÉëÉ~êÅÜW=`ob^qfkd=pvkbodv=clo=fkclojba=`e^kdb==== - 96 - =
=
organizations, I identify a gap between the models and processes available to identify workload levels and the models and processes currently used in DoD organizations.
What is the right size for the organization? I acknowledge at the outset that the answer to this quantitative question is not in itself sufficient for organizational success. It is not simply the number of workers but also the competencies of those workers that is essential in meeting mission requirements. However, competency assessment is not the subject of this research. Attempts to measure contracting organization competencies have been conducted in the past and are the focus areas of several recent human capital planning initiatives. The primary focus of this paper is on the partner of organization competency: identifying methods to assess workload in the DoD, Federal Civilian, and other commercial contracting organizations, and using that information to staff organizations accordingly.
Literature Review A review of the literature revealed that it is conventional wisdom that growth in the
DoD acquisition workforce is thought to be a necessity (e.g., Acquisition Advisory Panel, 2007; DoD, 2010; Gansler, 2007). However, while subjective rationale is provided in the workforce planning literature, no quantitative basis for specific growth figures was identified. The Defense Business Board (2010) provides the broad logic for the growth target:
Between 2010 and 2015, DoD will grow its DAW [Defense Acquisition Workforce] by 20K (from 127K to 147K), more than 15 percent. Ten thousand (10K) of the total will be from contractor conversions (insourcing) and 10K will be new hires (new billets). This increase will restore the DAW to late 1990s levels and is intended to restore core capabilities. (Defense Business Board, 2010, p. 5)
The rationale conveyed appears to be based on a perception that contracting organizations were generally adequately staffed in the mid-1990s. This perception is the fundamental basis for establishing the goal to increase the DAW by 20,000. I was unable to identify a workload analysis that supported the notion that the staffing levels in the 1990s were adequate. Nor was I able to locate a quantitative analysis for the proposed 20,000 increase in the DAW. The lack of an analytical foundation for the increase in the DAW begs the following questions: If there is no answer to why 20,000 more positions is the correct number for the increase, then how do we know to which Service or buying office the newly created positions should be assigned? How do we know which offices are currently adequately staffed and which offices are critically understaffed? What will be the most effective method to allocate these new positions to the offices with the greatest need?
In order to answer these questions, the DoD requires a workload assessment model and a resource allocation model based on the projected workload of a buying office. While it may not be practical to implement a DoD-wide solution, a robust model for each Service, major command, or agency should be attainable. The following sections cover the extant literature from government and academic sources.
Government Accountability Office (GAO)
GAO investigations continue to serve as a reminder of both the distance traveled on workforce strategy development, and the miles yet to go. In September 2010, the GAO released a report entitled Human Capital: Further Actions Needed to Enhance DoD’s Civilian Strategic Workforce Plan. The audit report found that key requirements such as identifying funding for training civilian employees, analyzing workforce skill gaps, and assessing progress and results have not been fully addressed. The report also indicated

====================^Åèìáëáíáçå=oÉëÉ~êÅÜW=`ob^qfkd=pvkbodv=clo=fkclojba=`e^kdb==== - 97 - =
=
that the current DoD plan does not specify the appropriate acquisition workforce makeup and has not developed guidance to help program offices meet workforce planning objectives (GAO, 2010). The report cites the 2010 Quadrennial Defense Review (QDR) as seeking “an appropriately sized cadre of acquisition personnel who have the skills and training necessary to successfully perform their jobs” (GAO, 2010, p. 2). However, there is no guidance as to what size an appropriately sized cadre should be, nor how to determine the appropriate size.
Office of Federal Procurement Policy (OFPP)
The Office of Federal Procurement Policy (OFPP) in the Office of Management and Budget was established by Congress in 1974 to provide overall direction for government-wide procurement policies. OFPP received a significant report on the acquisition workforce in 2007. The Acquisition Advisory Panel was authorized by Section 1423 of the Services Acquisition Reform Act of 2003. The panel was charged to review and recommend any necessary changes to acquisition laws and regulations as well as government-wide acquisition policies. In the Acquisition Advisory Panel’s resulting report to the OFPP in 2007, they found that “without a workforce that is qualitatively and quantitatively adequate and adapted to its mission, the procurement reforms of the last decade cannot achieve their potential, and successful federal procurement cannot be achieved” (Acquisition Advisory Panel, 2007, p. 330).
Other findings of the panel included that the complexity of the federal acquisition system as a whole has markedly increased since the 1980s; that few agencies have systematically assessed their acquisition workforce; that procurement obligations grew by 60% in the past five years; that the qualitative nature of the procurement activity has also changed, placing greater demands on the acquisition workforce for capability, training, time, and sophistication; and that a significant shift from the acquisition of goods to the acquisition of services has occurred, placing additional demands on the acquisition workforce in requirements definition, contract formation process, and in contract management (Acquisition Advisory Panel, 2007).
The panel also identified the changing nature of contracting processes as having a significant impact on the acquisition workforce. For example, the use of interagency awards and schedules to meet requirements has often allowed for the timely issuance of agreements, which allows a strained workforce to meet customer needs. However, the use of these schedules has contributed to other problems occurring from the failure of agencies to fully develop requirements, the failure to secure competition in using these vehicles, or the failure to manage contract performance under these vehicles (Acquisition Advisory Panel, 2007).
Other findings included the increased complexity involved with utilizing best value awards as opposed to lowest price awards and the additional burden of past performance assessment prior to award. In addition, the panel also identified that both government-wide and agency-specific efforts to respond to the new challenges of today’s acquisition system have focused on the nature of the skills required for success in today’s contracting environment. They have not ascertained the number of personnel possessing those skills that are required given the level of present or future agency acquisition activity (Acquisition Advisory Panel, 2007, p. 366).

====================^Åèìáëáíáçå=oÉëÉ~êÅÜW=`ob^qfkd=pvkbodv=clo=fkclojba=`e^kdb==== - 98 - =
=
Department of Defense (DoD)
The DoD recently published the DoD Strategic Human Capital Plan Update—The Defense Acquisition Workforce (DoD, 2010). This document is prepared to meet the statutory reporting requirements established in multiple National Defense Authorization Acts. As such, it provides a tremendous amount of information on workforce demographics and strategies. This report provides rationale for increasing the size of the acquisition workforce, which is in sync with the perception that the DAW needs to return to mid-90s staffing numbers. Specifically, it states, “The increase of approximately 20,000 [employees] will rebalance the organic acquisition workforce to better address inherently governmental and other critical functions. This will help mitigate the imbalance created by significant outsourcing of acquisition functions since the end of the Cold War” (DoD, 2010, p. 2–10). The report references several factors supporting an increase in the workforce, including the following:
1. the dramatic increase in annual spend levels since 2001;
2. the tesults of the Dayton Aerospace SACOM reviews of major program offices in the Air Force and Navy and a subsequent Air Force assessment of their workforce assigned to major programs;
3. the DoD competency assessment and bottoms-up review conducted by the OSD and component contracting leaders;
4. the internal DoD analysis of a variety of RAND studies on the acquisition workforce;
5. the numerous external studies, including GAO reports, that recommended the DoD increase the size of the acquisition workforce; and
6. the Defense Acquisition Workforce Structures and Capability review (Section 814, NDAA FY06).
These arguments generally convey the contracting leadership message to “send us more help” and serve as the basis that an increase in the size of the acquisition workforce will contribute to an increase in the effectiveness of mission performance. However, while a review of the open-source literature listed above found arguments for increasing the size of the acquisition workforce in general, no objective basis for the precise increase of 20,000 acquisition workforce employees was found.
RAND
The RAND Corporation (which is a Federally Funded Research and Development Center, FFRDC, for the DoD) is one of the primary organizations that has contributed to the literature relevant to acquisition workforce management. A notable RAND study within its National Defense Research Institute is a report titled Civilian Workforce Planning in the Department of Defense, published in 2006. The study sought to describe the existing workforce planning process at individual military installations in order to identify challenges to workforce planning at these bases and to consider options for DoD-wide workforce planning and OSD support for installation-level planning. The four basic steps of the model developed by the study effort are the following:
1. forecast workforce requirements (staffing levels and competencies demanded in the future),
2. project workforce supply,

====================^Åèìáëáíáçå=oÉëÉ~êÅÜW=`ob^qfkd=pvkbodv=clo=fkclojba=`e^kdb==== - 99 - =
=
3. identify gaps between supply and demand, and
4. develop strategies that address key gaps. (Gates, Eibner, & Keating, 2006, pp. xiv-xv)
Gates et al. (2006) discovered that unlike some non-governmental agencies with fewer manpower restrictions, customer demand is not the only factor that managers must consider in assessing DoD workforce demand.
In the DoD, local managers face constraints on the total number of civilian work years they are allowed, as well as the total wage bill for civilian personnel. These additional constraints complicate gaps analysis, because local managers must be conscious of at least two gaps: that between the required (the estimated workforce needed or required to accomplish the organization’s goals) workforce and the workforce supply, and that between the budgeted (the workforce that can be supported with resources that have been budgeted for civilian personnel in that organization) workforce and the workforce supply. (Gates et al., 2006, p. 47)
A follow-on report (Gates, 2009) found that demand analysis involves two important types of data: projections of customer demand and data that allow that demand to be translated into workforce requirements. In other words, there must be a set of ratios, workload factors, or process times that allow the researcher to interpolate the raw demand information into workforce requirements. The researchers found that a lack of data, both on the skills and competencies of the workforce and on customer demand, limits workforce planning throughout the DoD. The RAND investigation found that given the lack of available information on workforce requirements, size, quality, and mix, it was not possible to assess whether more workers, more highly skilled workers, or a different mix of workers would improve acquisition outcomes (Gates, 2009).
Federal Acquisition Institute (FAI)
The FAI is assisting with the initial efforts to assess contracting workload in federal civilian agencies and has taken a noteworthy leadership position on broad-based competency assessment of the DAW.
In 2007, the FAI issued a report presenting the results of its 2007 Contracting Workforce Competencies Survey. The survey targeted the GS-1102 series in the civilian agencies, including military personnel working outside the DoD performing contract specialist duties. In 2008 the FAI conducted a follow-up competency survey, 2008 Acquisition Workforce Competencies Survey Results Report and Survey Content, which revealed that the average response improved for each of the contracting competency areas (as well as for the contracting officer technical representative and for the program manager; FAI, 2009).
The report stated that overall, contracting workforce technical competencies are at expected levels. “Of the 17 technical competencies surveyed, gaps requiring attention were identified in project management, defining requirements, and financial management. General business competency gaps were identified in influencing/negotiating and oral communications” (FAI, 2007, p. 2). Personnel working in DoD organizations were not surveyed, thus generalizability to the DoD may exist, but is uncertain.
An objective critique of the FAI competency assessment offers that any time self-reported competency assessments are conducted, there is the risk of self-report bias and assessment inflation. Conducting objective interview- or scenario-based assessments with a sample of the population and comparing them to self-assessment scores would provide

====================^Åèìáëáíáçå=oÉëÉ~êÅÜW=`ob^qfkd=pvkbodv=clo=fkclojba=`e^kdb==== - 100 - =
=
useful validation baselines regarding the accuracy of the self-reported competency assessments.
In 2009, the Office of Federal Procurement Policy addressed the need for workload models in the Acquisition Workforce Development Strategic Plan for Civilian Agencies—FY 2010–2014 (OFPP, 2009). To assist civilian agencies with preparing workforce plans, the OFPP provided project model assistance along with the FAI:
Because agency missions and acquisition activities differ considerably, there is no simple formula that can relate the size and composition of an agency’s acquisition activity to its ideal workforce size. In developing a target acquisition workforce profile, agencies should examine their current acquisition management practices and determine where performance is hindered by insufficient resources. In particular, agencies should plan to increase the size of their acquisition workforce so long as the cost-savings and performance improvement benefits to taxpayers from better acquisition management exceed the cost of the additional acquisition employees. Additionally, FAI will develop and maintain an online toolkit for use by the agencies that will include various projection methodologies that agencies can use as part of their workforce analysis. (OFPP, 2009, p. 9)
FAI has since established an online community that shares workload projection tools. In keeping with the OFPP’s assessment that the most appropriate model may vary by agency, seven different model types have been made available. The models available include project-based, program-based, multi-dimensional, regression, volume-based, transaction, and conceptual-combination models. The specific characteristics of these models will be discussed further in the model analysis section of this article.
Purchasing Workload Ratios and Measures
The academic literature offers several studies on purchasing and contracting organization workload measures. In attempting to determine the best overall workload measurement method, Monczka and Carter (1978) urged caution when selecting a methodology. They found that aggregate standards (e.g., actions or spend per buyer) were preferable to time standards (average time required to complete specific contracting actions) because “detailed time standards do not appear to yield results that are sufficiently superior in most purchasing departments to justify their development” (Monczka & Carter, 1978, p. 39). However, a critique of the actions or spend per buyer methods identifies a significant shortcoming: the failure to assess the complexity of the work or the quality of the output.
In a study of 17 government procurement agencies at the county level, McCampell and Slaich (1995) found that two benchmarks provided insight into buying organization performance. The first measure is the average dollar volume obligated annually per professional staff member (buyer). The second measure is the mean cost per dollar obligated (CPDO; McCampbell & Slaich, 1995). The dollars-per-buyer measure was found to be superior to orders- or action-per– buyer measures due to an absence of how an order or action was defined from organization to organization. The variability in these definitions substantiates the argument that the weights applied to variables should be made at lower organizational levels, since agency-wide weights and definitions would not be appropriate or reasonable for all contracting organizations within an agency. Furthermore, this measure could be manipulated by pursuing inefficient methods (issuing multiple orders rather than pursuing a more efficient, consolidated order process). Auditors may conclude that such a reduction in orders may provide a logical basis for staff reductions (McCampbell & Slaich,

====================^Åèìáëáíáçå=oÉëÉ~êÅÜW=`ob^qfkd=pvkbodv=clo=fkclojba=`e^kdb==== - 101 - =
=
1995). The study found that the average dollar volume obligated annually was $10.7 million, which is in the range found in the CAPS benchmarks ($3.4 million in aerospace to $47.9 million for food service; McCampbell & Slaich, 1995, 34).
The CPDO benchmark was found to be particularly useful to the government sector. It is based on available information, and it is easy to understand. The authors of this study also found that dollar-based calculations would be less likely to cause government auditors to mistake increased efficiency (fewer orders) as a cause for staff reductions (McCampbell & Slaich, 1995). CPDO would also be of interest to organizations pursuing consolidated buying strategies, since larger organizations using centralized or strategic sourcing processes are likely to achieve efficiencies in procurement. The limiting factor of applying CPDO in such an environment is that strategic sourcing efforts often take a great deal of upfront work, and then these efforts actually serve to reduce total dollars obligated, which has a negative impact on the measure. Another caveat would be to ensure that the measure is used in a competitive environment (to ensure award prices are not kept high to improve the metric) and in an aggregated fashion, rather than applying the measure to individual buyers (aggregation should ensure there is no skewing by individuals attempting to pursue “bad buying” practices; McCampbell & Slaich, 1995). The study found that the mean CPDO was $0.0104, which is in the range found in the CAPS benchmarks, $0.002 to $0.05 (McCampbell & Slaich, 1995, p. 34).
Also in 1995, Black (1995) developed the Workload Index Model. Black’s model is an analytical attempt to compute a workload index that accounts for differences in the types of work and in the complexity of the work being performed (Black, 1995). Earlier models discussed used dollars obligated or orders processed as the common basis for measurement. Black posited that non-weighted measures such as the average number of actions per employee, average dollars obligated per employee, and average days to process an action must be avoided (Black, 1995). His rationale is that these measures fail to account for the relative (weighted) differences in work tasks and staffing across offices examined. A small average number of procurements (or dollars) processed per staff member does not necessarily indicate poor performance; nor does a large average number of procurements (or dollars) processed per staff member necessarily indicate exceptional performance (Black, 1995, p. 45). To address this, Black’s model added weighting to the output of each worker by their pay level (e.g., GS-11, GS-12, GS-14, etc.). The higher level workers are expected to produce higher volume than lower level workers. Black’s model improved on other models by addressing the likelihood that the experience composition of one group of individuals may be vastly different from a more experienced organization of the same size differences. However, just as one group of twenty contracting professionals is not necessarily as equally capable as another group of twenty contracting professionals, one GS-14 is not necessarily as capable as another GS-14. Thus, controlling for wage grade alone still provides for a great deal of variability in the model.
In 2004, a study of procurement benchmarks, combined with the performance of organizations at various levels above and below benchmark means, provided interesting results (IOMA, 2004). The study ranked firms procurement organizations in two categories: efficiency and effectiveness. The firms were identified as “world class” if they were either (1) in the top quartile of both efficiency and effectiveness benchmarks or (2) in the top 10% of either of the two benchmarks (IOMA, 2004, p. 7). The study then identified the firms’ cost-per-dollar-obligated ratios. Procurement cost as a percentage of spend was 0.72% at world-class firms in efficiency and effectiveness, compared to the 1.02% overall benchmark. Further, this study shed light on the impact of high quantity and quality output by finding that the cost-to-spend ratio is 0.92% for firms in the top 10% of effectiveness and 0.32% for

====================^Åèìáëáíáçå=oÉëÉ~êÅÜW=`ob^qfkd=pvkbodv=clo=fkclojba=`e^kdb==== - 102 - =
=
those in the top 10% of efficiency (IOMA, 2004, p. 7). Therefore, although it may seem that higher quality would require higher cost, it does not appear to be the case, because the average world-class firms executed at a lower cost-to-spend (0.92% and 0.32% versus the 1.02% average). Other findings from this study include that world-class companies use relatively fewer people (54 FTEs per billion dollars spent versus the mean of 104 FTEs per billion dollars spent) and that they invest more heavily in technology ($24,308 per FTE as compared to the mean of $7,717 per FTE). Finally, world-class organizations shift investments and resources to higher value activities (16% of costs spent on order processing versus the 22% mean, and 11% of costs to supplier management and development versus the 2% mean; IOMA, 2004, p. 7).
Performance Unit Costing (PUC)
The review of the literature so far illustrates several methods to measure work and performance. It also identifies a significant absence of quality measures in most models and benchmarks. A series of publications (Sorber & Straight, 1989, 1991, 1995; Straight, 1999, 2000) have made the case for procurement organization evaluation via Performance Unit Costing (PUC). This method considers the cost of operations relative to performance units. Performance units are completed actions adjusted for the level of the quality of the output. Examples of quality factors include timely award, timely delivery, fair and reasonable prices, and customer satisfaction (Sorber & Straight, 1995).
PUC is calculated by multiplying the number of output units (e.g., contract actions) by an achieved quality index (from 0.00 to 1) composed of some of the factors above. The result is the quantity of performance units. The number of performance units is then divided into the operating cost of the procurement organization to determine the cost per performance unit (Sorber & Straight, 1995). For example, 900 units of output at an achieved quality index of 0.65 yields 585 performance units. If the procurement organization costs incurred were 10,000, then the cost per performance unit would be $17.09. Obtaining higher output levels while maintaining quality and cost would decrease the performance unit cost. Higher quality achieved at the same cost and output would also decrease PUC. Managers are provided with the insight that increasing quality factors may increase cost, but they may also identify some components of the quality index that can be affected without increasing cost, and other quality factors that can be improved to reduce the cost per performance unit. The PUC methodology allows managers to move away from single-factor workload indicators such as procurement lead time, action quantity, or dollars obligated. It combines the resource perspective of the cost to run the organization with the quantity and quality of the work performed. The model also has the flexibility to involve customers in determining quality measures and their relative weights or importance (Sorber & Straight, 1995).
The PUC model seems to improve upon the Workload Index Model discussed previously by considering the total cost of the operation as the basis for analysis rather than the GS levels of the workforce, which are subject to step level gradation variability (all GS-14s are not the same, nor are they compensated the same). In addition, it allows for weighted workload credit depending on variable types of work output, and most important, it recognizes that all output is not the same (some work is of better quality than other work; Sorber & Straight, 1995).
The Center for Advanced Purchasing Studies (CAPS)
CAPS is sponsored by the Institute of Supply Management and works with industry supply management executives and academics to develop and share knowledge and best

====================^Åèìáëáíáçå=oÉëÉ~êÅÜW=`ob^qfkd=pvkbodv=clo=fkclojba=`e^kdb==== - 103 - =
=
practices. It conducts recurring surveys and publishes regular reports on key areas of procurement and supply management. These publications allow commercial purchasing organizations to compare themselves with other organizations at a macro level as well as with organizations within their industry sector. Based on surveys of procurement organizations, the CAPS provides a snapshot overview of 20 different key performance indicators (Wade, 2010). Among the 20 industry variables that the CAPS tracks related to procurement, there are 11 that apply to both the public and private sectors:
1. The total dollars spent by a procurement organization as a percent of total firm budget (how much of an organization’s needs are acquired via contract, and what is procurement’s relative impact/importance to the total organization);
2. Supply management operating expense as a percent of total spend (how much does it cost to spend each dollar of supplies or services that the organization procures);
3. Total spend per supply management employee (contract dollars awarded by the average procurement specialist);
4. Supply management operating expense per supply management employee (the total cost—pay, training, benefits, etc.—of the average member of the workforce);
5. Annual spend on professional training per supply management employee;
6. Professional training hours completed per supply management employee;
7. Supply management group retention rate;
8. Cost reduction savings as a percent of total spend;
9. Cost avoidance savings as a percent of total spend;
10. Average order/action processing cost; and
11. Average cycle-time (in days) from requirement approval to issuance of order/contract. (Institute of Supply Management, 2010)
This list of benchmarks presents an immediate opportunity for contracting leaders to identify those benchmarks that measure key performance areas linked to their organization goals. Assessing organization performance in the identified areas and comparing the performance results to the benchmarks will allow leaders to identify the current level of performance, the trends in performance over time, and the establishment of organization performance goals.
While the applicability and usefulness of these benchmarks will vary among organizations, the first three benchmarks should be of particular interest to all DoD contracting organizations. Item 1 allows leaders to convey contracting’s contribution to the Service’s mission; Item 2 allows a comparison to other organizations on the efficiency of the unit; and Item 3 identifies the size of the portfolio that the average buyer can execute. These ratios can provide insight into workload execution and actionable information for contracting leaders.
Some of the interesting benchmarks in the 2006 CAPS report showed that the supply management operating expense per employee was $107,803. It is important to note that operating expenses per employee are calculated in different ways depending on the firm, but the measure always includes employee salary at a minimum (IOMA, 2006, p. 18). Given

====================^Åèìáëáíáçå=oÉëÉ~êÅÜW=`ob^qfkd=pvkbodv=clo=fkclojba=`e^kdb==== - 104 - =
=
the difficulty in collecting operating expense data in some DoD organizations, establishing salary as the employee expense metric may allow for the creation of a simplified and consistent measure between organizations.
The successful application of CAPS benchmarks in a federal agency contracting organization is illustrated in the workload assessment conducted in 2004 at the Department of Homeland Security (DHS; Sorber & Bodnar, 2004). The high-level DHS staffing analysis of procurement resources was conducted to facilitate the largest government reorganization in U.S. history. The analysis consisted of a cost-to-spend ratio analysis using FY 2002 total obligations and salary expense. The study also calculated spend-per-employee using total obligations and number of employees. It compared the findings to benchmarks published by the CAPS. The study found that the DHS buying offices’ cost-to-spend ratios ranged from 0.20% to 2.28% with a mean of 1.06%. The study used cost-to-spend ratios available from other federal buying offices for comparison. The comparison ratios ranged from 0.71% at NASA–Goddard and 0.86% at the Department of Housing and Urban Development (HUD) to 2.31% at the Environmental Protection Agency (EPA). The mean of comparison agency cost-to-spend was 1.35%. The CAPS benchmark for mean cost-to-spend in the aerospace industry is 2.21%. The DHS compared favorably in both range and mean relative to the benchmark and comparison agency cost-to-spend ratios (Sorber & Bodnar, 2004).
When looking at spend-per-employee, DHS organizations ranged from $2.8 million to $44 million with a $12.4 million mean. Comparison agencies ranged from $3 million to $8.9 million and had a mean spend-per-employee of $6 million. The DHS had a higher average and a much wider range of spend-per-employee than the comparison agencies. By comparison, the CAPS benchmark mean for aerospace industry procurement was $5.3 million. The researchers then considered the upcoming planned FY 2004 obligations to calculate FTEs required. By dividing the planned obligations by the $5.3 million and the $6 million agency and industry benchmarks, the researchers identified a range of imputed FTEs appropriate for meeting the projected contracting office workload.
However, since the researchers calculated average spend-per-employee as $12.4 million, it seems that $12.4 million would have served as a reasonable estimate, rather than the $5.3–$6 million estimate that was used in the study. The larger number could have at least been used to illustrate an alternative position with a slightly higher risk associated with it, should the DHS have wished to accept that risk. Given that the factor is double the benchmarks used, the argument for accepting some risk beyond $6 million spend-per-employee would be warranted. Using the lower risk benchmarks, the authors identified a requirement for 220 FTEs. When factored with the average DHS procurement salary of $150,650 (the planning average salary provided by the DHS), the result was a FTE budget of $32.9 million. Given that this is the lowest risk profile, $32.9 million should be considered the maximum possible FTE budget.
An interesting further finding of the study was the identification of the fees charged by agencies (such as GWACs, GSA, GovWorks, etc.) for performing contracting work for the DHS. The fees ranged from 0.75% to 8%. The researchers calculated an average fee of 2.5% and used it to illustrate the cost that would be incurred if requirements were sent to outside agencies for obligation. The researchers found that applying a 2.5% average fee to the projected obligation total for FY 2004 would result in $43.5 million in fees. When compared to the worst-case FTE budget of $32.9 million, it is clear that use of outside agencies should be minimized in this example. However, for organizations with cost-to-spend ratios above 2.5%, a compelling argument for seeking outside support could be made. While the DHS study provides a great deal of insight into procurement workforce evaluation, it should also provide motivation for procurement leaders to ask, “What is my

====================^Åèìáëáíáçå=oÉëÉ~êÅÜW=`ob^qfkd=pvkbodv=clo=fkclojba=`e^kdb==== - 105 - =
=
cost-to-spend ratio?”, if for no other reason than to better understand the implications of using outside procurement organizations.
Contracting Organization Workload Models Given the significant number of new workers expected to be hired by DoD
contracting organizations in the next several years, leaders are now presented with a tremendous opportunity to determine the optimum method of apportioning resources and measuring performance. A review of workload and performance measures used by various contracting organizations is presented in the following section.
Army Workload Models
The Army has primarily relied on a decentralized workload assessment process. This process allows the various commands to develop workload models for application within their organizations.
Perhaps the best developed workload model has been developed by the U.S. Army Material Systems Analysis Agency (AMSAA). The AMSAA has been tasked with preparing manpower models for Army acquisition organizations since 1987. In 1999, the Army Material Command directed the AMSAA to baseline all functional areas in the acquisition process, including program management, staff/policy support, and contract administration. The model developed as a result of this baseline was finalized in 2002. Two clusters developed based on the types of work accomplished: weapon system acquisition and installation/camp support. Different process action times (PATs) or task completion times were used in each of the two sectors (J. Henderson, personal communication, May 4, 2010). An example of the AMSAA model is depicted in Figure 1.
Figure 1

====================^Åèìáëáíáçå=oÉëÉ~êÅÜW=`ob^qfkd=pvkbodv=clo=fkclojba=`e^kdb==== - 106 - =
=
The primary workload factors used in the AMSAA model are (1) contract actions, (2) solicitations, (3) the ratio of competitive to non-competitive actions, and (4) the number of acquisition systems managed. An interesting aspect of this model is the weighting applied to completive actions. Based on a regression analysis of actions processed, the AMSAA has assigned a 4.5 multiplier to non-competitive (e.g., sole source) contract actions. In other words, a non-competitive action is credited for 4.5 times the process action time allowed for completion when compared with a competitive action (J. Henderson, personal communication, May 4, 2010). The last complete model run was in 2006; however, high-level assessments for the ACC as a whole have been accomplished since then.
Air Force Workload Models
In 2001, the Air Force published a manpower standard (AFMS) for operational contracting (AFMIA, 2001). Operational contracting focuses on meeting the needs of airmen at the base or installation level, as opposed to systems contracting, which focuses on developing and acquiring major weapons systems such as aircraft. The AFMS recognizes key workload indicators such as dollars obligated and total actions completed. It also recognizes that large-dollar actions are more complex than small-dollar actions, and as such, rewards more process time credit for actions above $100,000 than for those below $100,000. The model recognizes the impact of expeditionary deployments on an organization and has a mechanism for awarding manpower for such activity. It also recognizes the importance of the support roles of the contracting organization, and it awards manpower for Government Purchase Card (GPC) oversight, small business program administration, commander’s support staff, and IT support. The process time standards were developed by recognizing over 150 individual types of activity in the procurement process and at least 50 types of activity in the contingency contracting environment (AFMIA, 2001). As such, it is one of the most thorough contracting manpower models produced. The manpower standard workload formulas can be inserted into standard spreadsheet software applications for ease of computation. However, the parsing of data required to translate existing data into a useable format (e.g., the elimination of non-qualifying contract activity) can be burdensome.
Because the Air Force model is more robust in many ways when compared to other agency models, it has been favored as the model of choice by many in non-Air Force DoD agencies and has become the default model used in joint basing workload transfer negotiations. Despite the praise this model has received from many users, criticism for the standard has grown in recent years. Of particular note is that the manpower formula is outdated because it is based on the mean (or average) time for executing activities in 1998. As identified in the literature review, actions have become more complex and time-consuming to execute in the past 12 years, and the number of complex contract actions has increased while less complex actions have decreased, and have often shifted to GPCs. An example of the Air Force Operational Contracting Model is depicted in Figure 2.

====================^Åèìáëáíáçå=oÉëÉ~êÅÜW=`ob^qfkd=pvkbodv=clo=fkclojba=`e^kdb==== - 107 - =
=
Figure 2 Furthermore, critics assert that the manpower formula does not reflect the
complexities of today’s business processes such as the Management and Oversight of Acquisition of Services Process (MOASP), the Performance-Based Service Contracts, the Standard Procurement System, the competitive sourcing for multiple installation support, the increased post-award contract administration burden of service contracts on installation contracting offices, the strategic sourcing efforts which require much more pre-award activity in order to develop commodity strategies, and the increased contingency deployments. In addition, the types of work that receive no credit in the Air Force model are a concern for many. For example, there is no credit given for dollars obligated or actions processed that are modifications to contracts, nor for processing orders off of centralized contracts, nor for awarding or processing utility contracts. The work associated with these efforts can be substantial, yet it is not credited in the Air Force model. The rationale for withholding credit is that post-award and order processing was “built in” to the original time standards. In other words, in the manpower standard, when you are given credit for awarding a contract, you also earn all the necessary manpower to administer the contract. Given the changes in complexity and number of these types of actions since 1998, and the tremendous growth in multi-year contracts (which were much more rare in 1998), it calls into question whether the original built-in process times are still an accurate reflection of the actual time required to complete the activities today. A final critique of the Air Force model is that it is perceived to be similar to the time and motion studies conducted in the mid-twentieth century. Time and

====================^Åèìáëáíáçå=oÉëÉ~êÅÜW=`ob^qfkd=pvkbodv=clo=fkclojba=`e^kdb==== - 108 - =
=
motion studies focus on increasing the efficiency in a process and measuring the time required to complete tasks. Although the models measure the time required to accomplish process tasks, they do not take into account the quality of the outputs that result from the process.
Separate and distinct from the Air Force operational manpower standard is the Air Force Workload Assessment Model (WAM) for weapon systems contracting developed by the Aeronautical System Center (ASC) at Wright Patterson AFB, Ohio. This model relies on stakeholder assessments of the number of hours required for tasks at differing dollar thresholds. For example, an organization may earn 245 hours to complete a sole source contract from $1 million to $5 million but earn 575 hours to complete a contract from $25 million to $50 million. Similar threshold-based earned hours are awarded in service contract, competitive contract, and delivery order categories as well. In all, there are 49 differing actions that organizations can earn credit for. There are 16 modification types (supplemental agreements, funding actions, etc.), 10 undefinitized contract types (letter contracts, terminations, option exercises, etc.), 15 definitization actions (task order, delivery order, undefinitized contract action [UCA] definititization, etc.), and eight miscellaneous actions (Freedom of Information Act [FOIA] requests, congressional inquiries, etc.). Stakeholder groups meet to assign process times for each of these types of work (D. Baker, personal communication, March 22, 2010).
Figure 3 Workload is determined through an annual data call exercise in which each buyer
(with workload) on the installation (approximately 700) completes a spreadsheet by simply identifying the contract or program they are working on and then identifying, via dropdown boxes, each of the actions they (1) accomplished in the past three months and (2) are scheduled to complete in the coming three months (see the WAM model example in Figure

====================^Åèìáëáíáçå=oÉëÉ~êÅÜW=`ob^qfkd=pvkbodv=clo=fkclojba=`e^kdb==== - 109 - =
=
3). The assigned hours “earned” are not displayed to the buyers, and all workload assessment computations are calculated after submission. The data are aggregated through contracting offices and reviewed by contracting leaders so that they can concur with the input (D. Baker, personal communication, March 22, 2010). The data are further refined by assigning earned credit based on where the action is within the acquisition cycle. In other words, buyers earn partial credit for completing any of the 12 different portions of larger tasks of work in progress (e.g., 25% of related task hours for reaching RFP issued, or 70% for negotiations complete). Further refinements occur based on the complexity factor assigned to the program office. Through stakeholder discussions, factors such as congressional visibility, program maturity, higher headquarters or PEO review thresholds, technical complexity, personnel mix and history, etc., are considered, and an indirect multiplier factor from 0.1 to 0.4 can be added to the workload input to compensate for additional workload due to program complexity (D. Baker, personal communication, March 22, 2010).
A weakness of WAM is that it requires a manual data call once a year and a periodic validation by stakeholders of the earned hours attributed to workload types. It also relies on individual procurement specialists to accurately input their workload, determine the appropriate complexity level for the work, and determine the degree of completion of the total effort. In addition, it does not account for types or grades of workforce personnel. Forty hours earned through an action covers one FTE for a week, whether it is a GS-9 with two years of experience or a GS-13 with twenty years of experience. To account for this, if a contracting office has a significant departure from the normal distribution of grade levels, the indirect complexity factor is designed to compensate for that shortfall.
Navy Workload Models
Naval Supply Systems Command (NAVSUP) uses the Time to Produce (TTP) workload model to measure work accomplished. The model was originally developed by the Fleet Industrial Supply Center (FISC) Norfolk at their Philadelphia location. The model uses PATs developed by two subject matter expert groups (representing simplified acquisitions and large acquisitions). The TTP model relies on data collected each month on completed actions. The data set includes product and service definitions of the action. The data are placed into simplified or large acquisition buckets. The headcount for the actions is tracked at the FISC level.
A separate productivity model measures the actual productivity of the contracting specialists via a tally of simplified and large contract actions completed. Complexity is accounted for in this model by placing more complex actions in the “large acquisition” bucket, irrespective of the dollar level (S. Pierce, personal communication, May 7, 2010). Both the TTP model and the productivity model can be used to assess activity at the FISC-wide level, at the aggregate FISC level, or at the individual operating location. Due to the wide variability in average productivity per year and the wide variability in the nature of work performed, the models are best used to compare year over year performance trends at individual locations rather than to assess each location’s capability relative to other locations (S. Pierce, personal communication, May 7, 2010). An example of the TTP model is depicted in Figure 4.

====================^Åèìáëáíáçå=oÉëÉ~êÅÜW=`ob^qfkd=pvkbodv=clo=fkclojba=`e^kdb==== - 110 - =
=
Figure 4
Defense Contract Management Agency (DCMA) Model
Today the DCMA uses the Performance Labor Accounting System, or PLAS, to capture work performed. The PLAS requires DCMA personnel to track their hours on a daily basis and attribute them to a program or contract. Much like a timecard system, the PLAS allows the DCMA to track the hours and processes performed in support of specific contracts and aggregates information into multiple reports, including types of contracts supported, agencies supported, processes performed, etc.
The PLAS can also be used to calculate relative efficiency level comparisons between operating locations. (D. Peterson, personal communication, April 20, 2010). The PLAS also allows calculations for earned value management in different functional areas. The PLAS feeds information into the DCMA’s Enterprise Planning system, which allows the agency to calculate the projected workload, as well as the type of support environment (e.g., pre-contract activity, post-award activity, contingency activity, etc.) and, as a result, the workforce required (R. Sawlsville, personal communication, March 30, 2010).
The PLAS is a rich source of information for DCMA leaders. Its ability to capture actual touch times required to administer contracts is useful. The DCMA has assisted other organizations in baselining their workload by providing PLAS data on process times. However, some say that navigating through its 100 process codes and hundreds of contract numbers is not particularly user-friendly. The difficult interface is suspected of reducing the accuracy of information collected because the system relies on buyers to seek out contract types and process codes on a daily basis. If buyers perceive the interface to be too complicated and utilize the system option to reproduce yesterday’s entry as today’s input, then this eventuality serves as a threat to data accuracy.

====================^Åèìáëáíáçå=oÉëÉ~êÅÜW=`ob^qfkd=pvkbodv=clo=fkclojba=`e^kdb==== - 111 - =
=
Federal Civilian Agency (FAI) Models
As discussed in the literature review, the Federal Acquisition Institute has been tasked with developing a community of practice and sharing workload models utilized by federal civilian agency contracting offices. The FAI has made seven different models available for agencies to use to develop workload assessments.
1. Project-Based Combined Model developed by the Department of Energy. This model identifies staffing needs based on project-level characteristics. These characteristics include the annual value of project work to be executed, the type of project, the project complexity, the manner of execution, the project phase, the level of regulatory involvement, and the degree of external influence.
2. Multidimensional Model being developed by the Department of Veterans Affairs. The model focuses on tasks in acquisition planning and pre-award and post-award activities.
3. Program-Based Model from the Department of Transportation–Federal Aviation Administration. The model uses historical program data to derive recommended staffing levels for major acquisition programs.
4. Regression model that provides two options to the user. Option one is to baseline agency spend to FY 2000. The model indicates that one contract specialist is required for each $5 million in spend. In option two, the regression model indicates that for each 45 contracts awarded, one additional GS-1102 FTE is required. This model is very limited in application and does not consider complexity factors.
5. Volume-Based Surge Tool developed for use as a result of the American Recovery and Reinvestment Act. The model allows the use of agency work volume growth from a baseline spend year and can be refined through human capital planning and analysis.
6. Transaction Model based on agency procurement spend and contract manager staff counts from 2000–2008. The model requires input of actual spend and workforce for each year. An average productivity per contract manager over the eight-year period is computed and divided into current FY projected spend.
7. Conceptual Combination Model developed by the FAI. This model appears to be the most thoroughly developed of the seven options. It is agency-specific and requires agencies to identify complexity, risk, workforce productivity, and other elements. Agencies can adjust weights ratios and factors to better represent the agency operating environment. The model uses a baseline workforce factor of $15.8 million for the average productivity of contract managers. Of note is that the model uses a factor calculated for the years 1993–1996 as a time period in which contracting offices were considered optimally staffed for contracting professionals.
All Federal Civilian Agencies have a contracting representative member of the FAI modeling working group that can provide access to the various models. The DoD does not have a similar working group to facilitate the sharing of model information.

====================^Åèìáëáíáçå=oÉëÉ~êÅÜW=`ob^qfkd=pvkbodv=clo=fkclojba=`e^kdb==== - 112 - =
=
Conclusions and Steps for Contracting Leaders This study finds that procurement workforce performance measurement and
workload assessment have been areas of study for at least 70 years. There is a wide variety of benchmarks and models available to serve as the basis for government models. However, the review of the government organization literature indicates that the question of workload assessment has been given significantly less attention than output measurement, and that output measurement has been conducted primarily with overly broad measures such as dollars obligated and actions completed. Further, the preponderance of the workforce modeling activity is now focusing on (1) measuring the size of the organization (impacts of retirement, accessions, etc.), (2) measuring the descriptive statistics or demographics of the workforce, and, to a lesser degree, (3) attempting to measure the capabilities of the organization vis-à-vis competency assessments (Lamm & Reed, 2009). While these assessments present leaders with important pieces of information, they are incapable of answering the critical question: How much work will we need to do? Understanding the competencies and capabilities of an organization assists managers in developing a “mixed” human capital strategy; however, the literature indicates that leaders cannot determine the mix of capabilities required without also determining the number of workers needed. The two variables affect each other with such great significance that to consider one in the absence of the other is an endeavor destined for failure.
This study and extant literature (e.g., Reed, 2010) have found that workload measurement in DoD contracting organizations is either performed inconsistently or not at all. Contracting leaders can take immediate steps to begin measuring workload and assigning staffing appropriately based on workload. Multiple models, ratios, and processes have been presented in this article, and one or more may present opportunities for your organization. However, based on my evaluation of the literature and current processes, the following seven steps can be taken at the lowest implementation cost to provide leaders with immediate assessment of their workload and staffing.
1. Define your strategic intent and identify quality measures that reflect your intent (timely award, timely delivery, fair and reasonable prices, customer satisfaction, corrective actions, etc.).
2. Conduct a cost-per-dollar-obligated (CPDO) analysis for the previous fiscal year for your organization. If you do not have access to all operating expenses (many leaders do not), use the salary cost of the workforce as your operating cost. If salary cost is not available, contact your personnel office to determine the average “burdened” compensation and support cost for your organization, or for the various grade levels of personnel in your organization, and compute a rolled-up salary cost. The more exact that you can be when determining cost, the better; however, the consistency of your agency’s approach from organization to organization and year to year is the most critical concern.
3. Conduct a similar CPDO analysis for the past three years to determine the trend for your organization and to establish an average CPDO.
4. Measure the quality of your outputs (consistent with your strategic intent) now and over time to determine trends and averages.
5. Compare your organization to industry benchmarks, and to similar organizations in your Service or Department. Address the differences between your CPDO and the benchmarks. What are the potential

====================^Åèìáëáíáçå=oÉëÉ~êÅÜW=`ob^qfkd=pvkbodv=clo=fkclojba=`e^kdb==== - 113 - =
=
explanations for the differences? What can you do to address the differences? If your CPDO is significantly lower than benchmarks and comparable organizations, determine the explanatory factors. A relatively low CPDO may indicate your organization is extremely efficient, or perhaps indicate that opportunities to enhance quality may exist if more resources were added to your team.
6. Set CPDO and quality goals for your organization.
7. Identify the estimate of your future work. This remains one of the most difficult tasks. Budget proposals, Future Years Defense Program (FYDP), Program Objective Memorandum (POM), and appropriations legislation may provide information upon which to construct rough order estimates on either the total amount or departure trend from previous year obligations that your organization may experience. Develop complexity and risk assessment weights based on the type of monetary obligations, and product/service mix that your organization is projected to procure.
Taking these seven steps will not only provide contracting leaders with valuable insight into the amount and nature of the work their organization is to perform, but also information regarding the actual performance of the work. Further, it will allow for the development of quality measures linked to the leader’s strategic intent and allow for the establishment of quality performance goals for the organization, rather than the volume performance measures currently in use.
References Acquisition Advisory Panel. (2007). Report of the Acquisition Advisory Panel to the Office of
Federal Procurement Policy and the United States Congress. Washington, DC: Office of Federal Procurement Policy.
Air Force Manpower and Innovation Agency (AFMIA). (2001). Operational contracting manpower standard (AFMS 12A0). Randolph Air Force Base, TX: Author.
Black, D. (1995). Measuring relative productivity and staffing levels in a federal procurement office. Journal of Supply Chain Management, 31(3), 44.
Defense Business Board. (2010, January). Acquisition workforce growth and recommendations for insourcing (Report FY10-04). Washington, DC: Author.
DoD. (2010, April). DoD strategic human capital plan update the defense acquisition workforce. Washington, DC: Author.
Federal Acquisition Institute (FAI). (2007, October). 2007 contracting workforce competencies survey for the federal contracting workforce: Survey results report. Washington, DC: Author.
Federal Acquisition Institute (FAI). (2009). 2008 acquisition workforce competencies survey results report and survey content. Retrieved from http://www.fai.gov
Gansler, J. (2007, October 31). Urgent reform required: Army expeditionary contracting—Report of the Commission on Army Acquisition and Program Management in Expeditionary Operations. Retrieved from http://www.army.mil/docs/Gansler_Commission_Report_Final_071031.pdf
Gates, S., Eibner, C., & Keating, E. G. (2006). Civilian workforce planning in the Department of Defense. Santa Monica, CA: RAND.

====================^Åèìáëáíáçå=oÉëÉ~êÅÜW=`ob^qfkd=pvkbodv=clo=fkclojba=`e^kdb==== - 114 - =
=
Gates, S. M. (2009). Shining a spotlight on the defense acquisition workforce—Again. Santa Monica, CA: RAND.
GAO. (2010, September 27). Human capital: Further actions needed to enhance DoD’s civilian strategic workforce plan (GAO-10-814R). Washington, DC: Author.
Institute of Management and Administration (IOMA). (2004, October). Procurement benchmarks. The Controller’s Report, Issue 2004-7, 7–8.
Institute of Management and Administration (IOMA). (2006, March). 53 benchmarks to analyze purchasing in new CAPS survey. The Controller’s Report, Issue 2006-3, 16–18.
Institute of Supply Management (ISM). (2010, May). CAPS research cross-industry report of standard benchmarks. Tempe, AZ: Author.
Lamm, D., & Reed, T. (2009, September 25). Demographics of the contracting workforce within the Army Contracting Command (NPS-CM-09-140). Monterey, CA: Naval Postgraduate School.
McCampell, A., & Slaich, L. (1995). Purchasing efficiency and staffing benchmarks: A county government study. Journal of Supply Chain Management, 31(1), 29–36.
Monczka, R., & Carter, P. (1978). Measuring purchasing performance. Management Review, 67(6), 27–42.
Office of Personnel Management (OPM). (2009, August). Federal human capital survey 2008. Washington, DC: Author.
Reed, T. (2010, October 4). Army Contracting Command workforce model analysis. (NPS-CM-10-179). Monterey, CA: Naval Postgraduate School.
Sorber, K., & Bodnar. (2004). Department of Homeland Security: Procurement staffing analysis. Washington, DC: Acquisition Solutions.
Sorber, K., & Straight, R. (1989). Competitive contracting offices: An alternative to a separate acquisition corps. In Proceedings of the DSMC and NCMA 1989 Acquisition Research Symposium (pp. 287–294). Washington, DC.
Sorber, K., & Straight, R. (1991). Competitive contracting offices: Implementation issues. In Proceedings of the DSMC and NCMA 1991 Acquisition Research Symposium (pp. 171–181). Washington, DC.
Sorber, K. & Straight, R. (1995). Measuring operational contracting cost, output, and quality together. In Proceedings of the Undersecretary of Defense for Acquisition Reform and National Contract Management Association 1995 Acquisition Research Symposium, (pp. 405–418). Washington, DC.
Straight, R. (1999). Measuring contractor’s performance. Journal of Supply Management, 35(2), 18–28.
Wade, S. (2010, September). Cross-industry benchmarking. Inside Supply Management, 34–35.

Determining the Appropriate Size of the Contracting Workforce: Yes We Can!
Timothy Reed, Ph. D.Naval Postgraduate School
1

Research OverviewResearch Overview
• Army Contracting Command sponsored• Army Contracting Command sponsored research to investigate workload assessment and staffing g
• Goal: identify methods used to assess workload and staffing in Army contracting g y gorganizations, as well as DoD, Federal Civilian, and other commercial contracting
i tiorganizations – Identify opportunities to adopt share most effective
methodsmethods

How Much Work do We Need to ?Accomplish?
• Most industry organizations have a process to y g pdetermine workload and staff appropriately for the work anticipated– Fast-food restaurants– Consulting– Education– Manufacturing plants
Ai li– Airlines• Some use less exact estimates than others
– Snow removalUtiliti– Utilities
– Contracting

Techniques Used to Manage ffDifficult-to-Predict Work
• Multi-skill workforce for surge (landscapers drive• Multi-skill workforce for surge (landscapers drive snowplows)
• Prioritize types of work (emergency routes, bus yp ( g y ,lines first, residences last)
• Regional/Cooperative resource sharing (electric storm damage repair)
• Prepare organic core capability and surge with contractor/labor surplus/temporary supportcontractor/labor surplus/temporary support
• Find a better prediction model

What’s the Problem?What s the Problem?
• Contracting organizations are staffed to• Contracting organizations are staffed to authorizations, rather than workload
• Leader’s need method(s) toLeader s need method(s) to – Determine workload– Staff according to workload g
• Case in point: if DoD proceeds with plans to hire 10K additional AW personnel…how do we know where to place them if workload assessments are not conducted?

Puzzle Pieces
• “What size should my contracting organization be?” is just a part of the full question…j p q
• Appropriate size and competency are required to meet mission requirements with an acceptable level of risk
• BOTH measures are necessary but not in themselves sufficient
• A great deal of other research is related toA great deal of other research is related to competency assessments, not the focus of this study
• Keep in mind the two most overlooked variables in workload assessments: – the complexity of the work and– the quality of the outputsthe quality of the outputs

MethodologyMethodology
• Literature review• Literature review – Workforce planning – Workload assessmentWorkload assessment – Manpower modeling – Included defense acquisition workload
measurement reports, workforce studies, Federal Government workforce studies and reports, and human capital research and reportshuman capital research and reports

Methodology (continued)Methodology (continued)
• Then a review of the models currently in use and• Then, a review of the models currently in use and used in the past by – DoD organizations, – Civilian contracting agencies, and – Industry best practices
Assessed the strengths and weaknesses of existing– Assessed the strengths and weaknesses of existing models, and the options for implementation
– Findings apply to organizations that conduct contracting activities in the operational, systems acquisition, and contingency environments

WORKLOAD MODEL EXAMPLES

Army – AMSAA Model
• Army• Army

Air Force Operational Model 12AO Manpower Standard
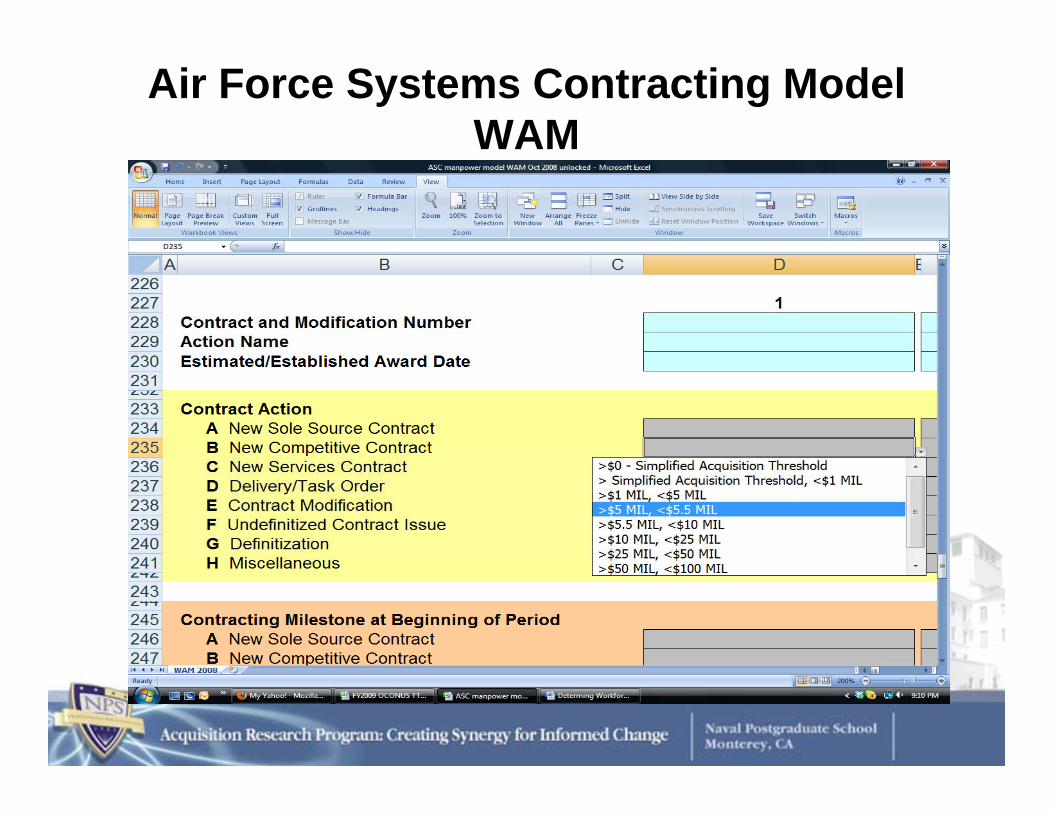
Air Force Systems Contracting ModelWAM
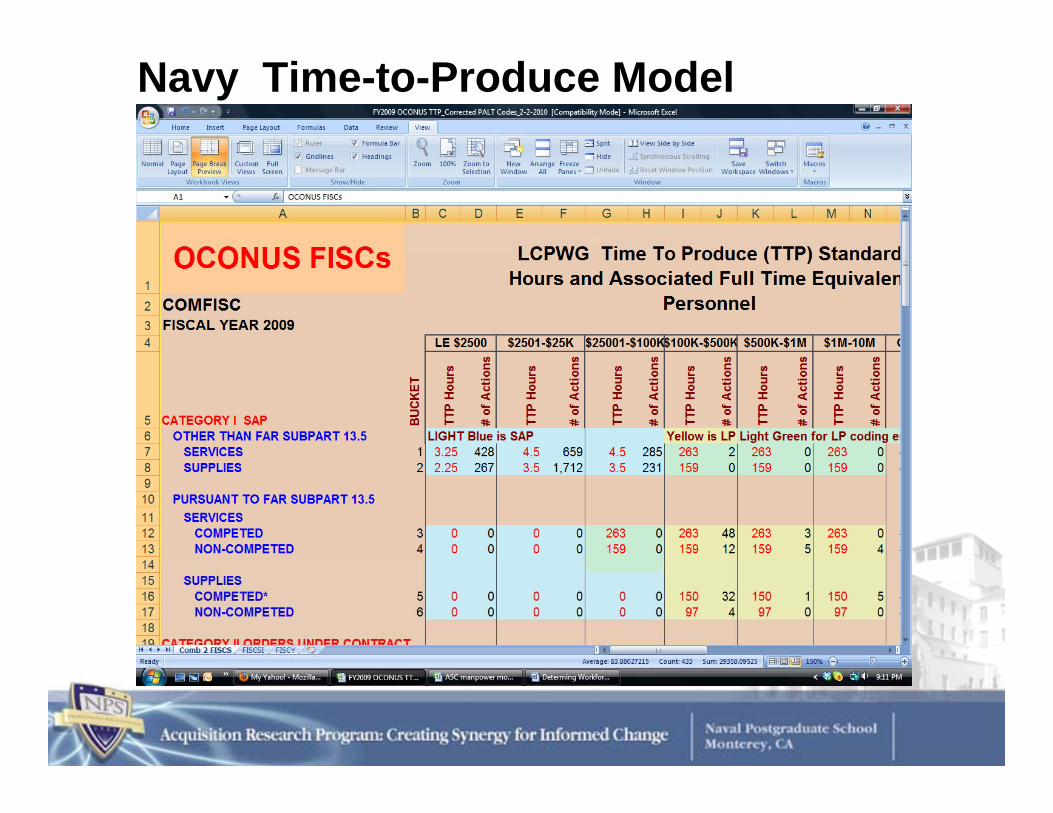
Navy Time-to-Produce Model

Civilian Agency Models - FAICivilian Agency Models FAI• Project-based Combined Model - Department of Energy
– Uses annual value of project work to be executed, the type of project, the project complexity, the manner of execution, the project phase, the level of regulatory involvement, and the degree of external influencep j p g y g
• Multidimensional Model - Department of Veterans Affairs– Focuses on tasks in acquisition planning; pre-award and post-award activities.
• Program-based Model - Department of Transportation–Federal Aviation Administration. – Uses historical program data to derive recommended staffing levels for major acquisition programs.
• Regression Model that provides two options to the user. g p p– Option one is to baseline agency spend to FY 2000. The model indicates that one contract specialist is
required for each $5 million in spend.– Option two, the regression model indicates that for each 45 contracts awarded, one additional GS-
1102 FTE is required. • Volume-based Surge Tool developed for use as a result of the American Recovery and
R i t t A t Th d l ll th f k l th f b liReinvestment Act. The model allows the use of agency work volume growth from a baseline spend year
• Transaction Model based on agency procurement spend and contract manager staff counts from 2000–2008.
– Requires input of actual spend and workforce for each year. An average productivity per contract manager over the eight-year period is computed and divided into current FY projected spendover the eight year period is computed and divided into current FY projected spend
• Conceptual Combination Model developed by the FAI. – Requires agencies to identify complexity, risk, workforce productivity, and other elements. Agencies can
adjust weights ratios and factors to better represent the agency operating environment. The model uses a baseline workforce factor of $15.8 million for the average productivity of contract managers.

Center for Advanced Purchasing Studies (C S)(CAPS) Measures and Baselines• Eleven of 20 CAPS measures apply to both industry and government sectors
The total dollars spent by a procurement organization as a percent of total firm budget (how h f i ti ’ d i d i t t d h t i t’much of an organization’s needs are acquired via contract and what is procurement’s
relative impact/importance to the total organization); Supply management operating expense as a percent of total spend (how much does it cost to spend each dollar of supplies or services that the organization procures); aka CPDOSupply management operating expense per supply management employee (the total costSupply management operating expense per supply management employee (the total cost—pay, training, benefits, etc.—of the average member of the workforce);Total spend per supply management employee (contract dollars awarded by the average procurement specialist);
• Annual spend on professional training per supply management employee;Annual spend on professional training per supply management employee;• Professional training hours completed per supply management employee;• Supply management group retention rate;• Cost reduction savings as a percent of total spend;• Cost avoidance savings as a percent of total spend;• Cost avoidance savings as a percent of total spend;• Average order/action processing cost; and• Average cycle-time (in days) from requirement approval to issuance of order/contract.
(Institute of Supply Management, 2010)

Procurement Unit Cost CalculationProcurement Unit Cost CalculationWhat about complexity?
• Cost to procure should be as complete as possible
Procurement Cost
Calculation Example$100,000 cost complete as possible
N b f t ti
,100 units x .86 Q
=$1162 PUC
• Number of contracting units completed
• Index of weighted Output Units
x Quality Measure Examples
•Internal: competition/ i i l tig
internal/external quality measures
Quality Indexsocioeconomic goals; corrective actions required; FPDS-NG accuracy•External: timely award y/delivery; fair/reasonable cost

CPDO: Cost per Dollar Obligated… C Sor Cost to Spend What about Quality?
Complexity?
• Cost to procure should be consistently calculated (ideally total cost, salary, infrastructure, IT, training)
• NOTE: total cost calculation may not
Procurement Cost • NOTE: total cost calculation may not
always be possible, salary may be useful proxy)
Cost
• Total spend should include all actions, not just net spend
• Consistent application
Total Spend Executed by Calculation Example
$8 000 000 costConsistent application for all organizations is essential
Executed by Organization
$8,000,000 cost $900,000,000 spend
=.88%
(less than $.01 CPDO)

Seven First Steps for Your OrganizationSeven First Steps for Your Organization1. Define your strategic intent, identify quality measures that reflect your intent
(timely award, timely delivery, fair and reasonable prices, customer satisfaction corrective actions etc )satisfaction, corrective actions, etc.)
2. Conduct a cost-per-dollar-obligated (CPDO) analysis3. Conduct a similar CPDO analysis for the past three years to determine the trend
for your organization, and to establish an average CPDO4 M th lit f t t ( i t t ith t t i i t t)4. Measure the quality of your outputs (consistent with your strategic intent) now
and over time to determine trends and averages. 5. Compare your organization to industry benchmarks, and to similar organizations
in your Service or Department6 S t CPDO d lit l f i ti6. Set CPDO and quality goals for your organization7. Estimate your future work
– Budget proposals, Future Years Defense Program (FYDP), Program Objective Memorandum (POM), etc for rough order estimates on either the total amount or departure trend from previous year obligations that your organization may experiencedeparture trend from previous year obligations that your organization may experience.
– Develop complexity and risk assessment weights based on the type of monetary obligations, and product/service mix that your organization is projected to procure.

Want More?Want More?
• “Determining the Appropriate Size of the• Determining the Appropriate Size of the Contracting Workforce: Yes We Can!”
– 2011 available in the proceedings2011 available in the proceedings• Full report: “Army Contracting Command
Workforce Model Analysis” y– NPS-CM-10-179 , 4 October 2010, available on
the ARP site

QUESTIONS?QUESTIONS?


![mêçÅÉÉÇáåÖë= - DTIC · Russia Council. Research interests include disruptive innovations in defense acquisition and the study of design skills. [gene.warner@me.com] or [eugene.e.warner4.civ@mail.mil]](https://img.dokumen.tips/doc/110x75/5e69345924b94a2a8218a944/m-dtic-russia-council-research-interests-include-disruptive.jpg)