Embed Size (px)
Citation preview

BTG plc Annual Report and Accounts2017
See more.Reach further.Treat smarter.
BT
G plc
Annual R
eport and Accounts 2017

What we do
At BTG, we are focused on bringing to market innovative products in specialist areas of medicine to better serve doctors and patients.Our growing portfolio of image-guided minimally invasive Interventional Medicine products is designed to advance the treatment of cancer, severe blood clots, varicose veins and severe emphysema.
We also provide Specialty Pharmaceuticals that counteract certain snake venoms and toxicities associated with some heart and cancer medications.
Front cover story: At BTG, everything starts with the customer. We work in partnership with physicians to deliver products that will make a meaningful difference to the treatment of their patients.
OverviewIFC What we do
Strategic Report06 Chairman’s introduction08 CEO’s Strategic report10 Industry overview12 Our business model14 Our strategic priorities16 Performance30 Group financial review
Contents
Governance40 Corporate Governance report 40 Letter from the Chairman 42 Board of Directors 45 Leadership 54 Effectiveness 57 Accountability
(including Audit Committee report and risk)
71 Relations with shareholders72 Remuneration98 Directors’ report102 Statement of directors’
responsibilities in respect of the Annual Report 2017 and the financial statements
Financials104 Independent auditor’s report to
the members of BTG plc only110 Consolidated income statement111 Consolidated statement
of comprehensive income112 Consolidated statement
of financial position113 Consolidated statement
of cash flows114 Consolidated statement
of changes in equity115 Notes to the consolidated
financial statements152 Company financial statements
Statement of financial position153 Statement of cash flows153 Statement of changes in equity154 Notes to the Company
financial statements157 Five-year financial record159 Shareholder information

Understanding our investment case 1
How do we meet society’s demands for improved healthcare in an affordable way?
The context
US health expenditure1 (as a percentage of GDP)
5% 17%1960 2014
1. Source: www.cms.gov
BTG plc Annual Report and Accounts 2017
01Overview
Overview
Strategic R
eportG
overnanceFinancials

2Provide minimally invasive image guided therapies that can improve patient outcomes and have the potential to ease cost pressures on healthcare systems
Our solution
Efficiency savings which result from interventional treatments relate to decreased in-hospital stays,
reduced occupancy of operating theatres, avoidance of general anaesthesia and a shift to more day-case
procedures. In turn, these offer significant reductions in morbidity and mortality in comparison to
conventional surgery
(Royal College of Radiologists)
BTG plc Annual Report and Accounts 2017 BTG plc Annual Report and Accounts 2017
02Overview

3A fast-growing global business with an expanding Interventional Medicine (IM) portfolio targeting cancer, vascular disease and emphysema
BTG today
50%IM product sales CAGR 2012-2017
6innovative IM product families
8IM sales forces
BTG plc Annual Report and Accounts 2017
03Overview
Overview

4BTG is well positioned to be a global leader in providing innovative IM therapies, enabling us to deliver sustained value for all our stakeholders
Our vision
BTG plc Annual Report and Accounts 2017BTG plc Annual Report and Accounts 2017
04Overview
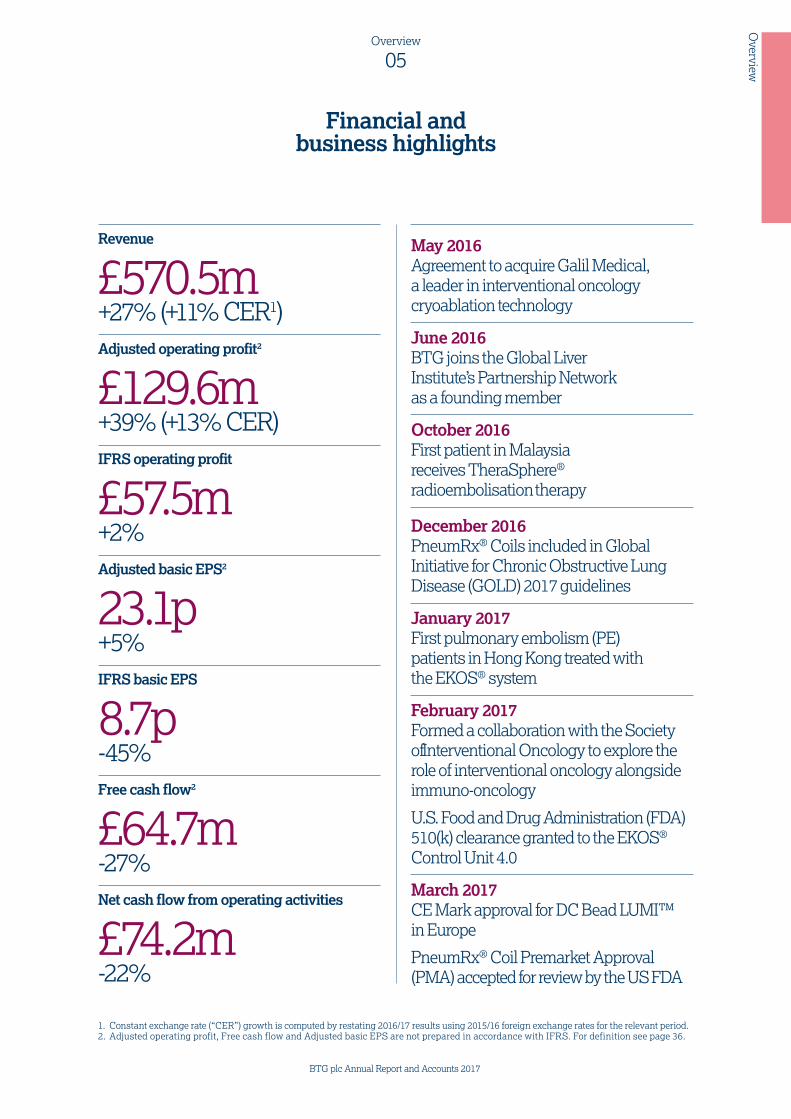
Revenue
£570.5m+27% (+11% CER1)Adjusted operating profit2
£129.6m+39% (+13% CER)IFRS operating profit
£57.5m+2%Adjusted basic EPS2
23.1p+5%IFRS basic EPS
8.7p-45%Free cash flow2
£64.7m-27%Net cash flow from operating activities
£74.2m-22%
May 2016Agreement to acquire Galil Medical, a leader in interventional oncology cryoablation technology
June 2016BTG joins the Global Liver Institute’s Partnership Network as a founding member
October 2016First patient in Malaysia receives TheraSphere® radioembolisation therapy
December 2016PneumRx® Coils included in Global Initiative for Chronic Obstructive Lung Disease (GOLD) 2017 guidelines
January 2017First pulmonary embolism (PE) patients in Hong Kong treated with the EKOS® system
February 2017Formed a collaboration with the Society of Interventional Oncology to explore the role of interventional oncology alongside immuno-oncology
U.S. Food and Drug Administration (FDA) 510(k) clearance granted to the EKOS® Control Unit 4.0
March 2017CE Mark approval for DC Bead LUMI™ in Europe
PneumRx® Coil Premarket Approval (PMA) accepted for review by the US FDA
1. Constant exchange rate (“CER”) growth is computed by restating 2016/17 results using 2015/16 foreign exchange rates for the relevant period.2. Adjusted operating profit, Free cash flow and Adjusted basic EPS are not prepared in accordance with IFRS. For definition see page 36.
BTG plc Annual Report and Accounts 2017
05Overview
Overview
Financial and business highlights

Where is BTG going?BTG is building leading positions in the fast-growing area of Interventional Medicine therapies. We have the strategy, resources and capabilities to achieve our vision.
I am pleased to introduce this year’s Annual Report, in what has been a year of significant strategic progress for our business. BTG is now recognised as a leading provider of innovative, image-guided minimally invasive technologies by specialist physicians who are striving to improve patient outcomes.
A strategy for successDemand for cost-effective treatments, supported by advances in imaging and device technology, continues to fuel the development and application of minimally invasive procedures. BTG is well positioned to take advantage of these macro trends in healthcare. We specialise in areas of therapy where physicians and their patients are poorly served by existing treatments, and where we can develop market-leading positions by delivering differentiated products that demonstrate clinical and commercial value.
People and cultureBTG is a dynamic business, composed of talented individuals who are dedicated to delivering important products that make a real difference to our customers and their patients. I would like to thank our employees for their professionalism and hard work. We will continue to invest in enhancing our capabilities and systems to meet the needs of our stakeholders in a sustainable and responsible way.
OutlookBTG has an exciting future ahead of it. I am optimistic about the opportunities in Interventional Medicine and confident that our strategy will enable us to become leaders in the field. As a financially strong business, we have the ability to invest in multiple growth drivers that will create long-term, sustained value for all our stakeholders.
Garry WattsChairman
Chairman’s introduction
BTG has achieved a number of significant milestones this year and I am confident that our
strategy will continue to deliver success
Garry WattsChairman
BTG plc Annual Report and Accounts 2017 BTG plc Annual Report and Accounts 2017
06Strategic Report

Good governance is an essential part of our strategyStrategyWhile we continue to develop and embed a strong governance framework in the culture of our organisation, we also take a proportionate approach to ensure that our processes are efficient and support our growth strategy.
Pages 8 to 15, to read more
Business performanceRegular board meetings monitor our operating performance and, through an annual strategy review, we concentrate on forward planning to support long-term sustainable growth.
Pages 16 to 25, to read more
Leadership & peopleWe invest in the development of our people to ensure we have the capabilities to succeed. Our business standards and ways of working are guided by our Code of Conduct and embodied in the day-to-day behaviours that we call the BTG “DNA”.
Pages 26 to 29, to read more
Internal control & riskThe Group’s risk management framework is based on the UK Corporate Governance Code. Our internal processes and controls provide us with a clear understanding of the principal risks inherent in our business operations and strategy, and give us confidence in the appropriateness of our mitigating actions.
Page 66, to read more
Stakeholder engagementEnsuring good communication with our shareholders and employees is important to us. We meet with shareholders throughout the year, and we engage with and seek input from our employees.
Page 71, to read more
PurposeBring to market innovative products in specialist areas of healthcare to better serve doctors and their patients.
VisionBe a global leader in providing interventional medicine therapies.
AimDeliver sustained value creation for all our stakeholders.
BTG plc Annual Report and Accounts 2017
07Strategic Report
Strategic R
eport

A year of strong progressBTG has executed its strategy effectively this year, achieved significant milestones and delivered another strong financial performance.
The healthcare environment continues to evolve, as society seeks to balance demands for access to medical innovation against the increasing costs of delivering better care. BTG is well placed to respond to this challenge. Over the past six years we have built a portfolio of image-guided minimally invasive therapies that have the potential to improve patient outcomes and experiences while reducing overall healthcare expenditure.
How this links to our strategyThere are few companies operating in the world of interventional medicine like BTG. We focus on providing novel technologies that can transform the way certain diseases are treated. Since entering this space in 2011, we have built the capabilities and the entrepreneurial culture that we believe will enable us to succeed in the innovation-led markets where we operate.
Our products are often administered in a dedicated procedure by specialist physician customers who we serve through small, highly skilled sales and medical teams. With the cash we generate, we invest in product innovation and clinical trials, enabling us to maintain technology leadership and to demonstrate patient benefits and cost effectiveness. This ensures we can achieve regulatory approvals, market adoption, payer coverage and the appropriate value for our products. We are also expanding our geographic reach and optimising our commercial activities in all territories.
These investments are designed to deliver sustainable double-digit product sales growth and increasing operating margins over time. We also have the financial flexibility to accelerate and de-risk our growth strategy by continuing to explore opportunities to expand our portfolio and pipeline through acquisition and in-licensing activities.
CEO’s Strategic report
Dame Louise MakinChief Executive Officer
BTG plc Annual Report and Accounts 2017 BTG plc Annual Report and Accounts 2017
08Strategic Report

By focusing on the needs of our customers and their patients and delivering innovative
solutions to their complex medical problems, we will become a global leader in the field of Interventional
Medicine therapies
By focusing on the needs of our customers and their patients, and delivering innovative solutions to their complex medical problems, we will achieve our vision and become a global leader in the field of interventional medicine therapies.
Building positive momentum We have made strong progress during the year in implementing our growth strategy, achieving key objectives in geographic expansion, product innovation, clinical studies and portfolio growth.
We continued to enhance our presence in selected markets in Asia, where we see significant long-term growth opportunities, with the launch of TheraSphere® in South Korea and Malaysia. We gained EU and Canadian approval for the first visible chemoembolising bead for liver cancer. In the US and EU our new EKOS control unit received regulatory clearance.
Our Interventional Oncology portfolio expanded through the acquisition of Galil Medical, a leader in cryoablation technology. This deal was completed in June 2016 and growth through acquisition remains a key part of our strategy, as we continue to monitor opportunities of potential interest.
The earlier stage Interventional Medicine businesses achieved important milestones. A Premarket Approval application was submitted in the US for our PneumRx® Coils, which are for treating severe emphysema. In the EU, positive assessments in Germany and France are expected to support national coverage in both countries.
Varithena®, the treatment for varicose veins, made progress towards receiving dedicated reimbursement codes in the US, which we anticipate will be implemented in January 2018.
The cash we generate in our Specialty Pharmaceuticals and Licensing businesses enables us to make investments and build leadership positions in Interventional Medicine. Licensing is no longer an active part of our strategy, whereas Specialty Pharmaceuticals, through which we provide potentially life-saving antidote treatments, remains a core part of BTG’s business. We remain open to expanding this portfolio through acquisition or in-licensing.
Dame Louise MakinChief Executive Officer
BTG plc Annual Report and Accounts 2017
09Strategic Report
Strategic R
eport

Industry overview
The context for our businessGlobal healthcare markets are expected to grow over the coming years, fuelled by population growth, increasing longevity, technological advances, consumer empowerment and economic expansion. To benefit from these trends, BTG’s strategy is to invest in innovation and development and demonstrate value for money to physicians, patients and payers.
RegulationThe healthcare industry is highly regulated by governments, with strict rules overseeing research, clinical development, manufacturing and commercial activity. At BTG we have developed extensive quality, pharmacovigilance and compliance systems and procedures. We also recruit highly skilled and experienced employees and provide regular training to ensure that we comply with all relevant regulatory standards. We pay close attention to the future regulatory landscape and the potential impact of healthcare reforms. This is of particular importance when reviewing product development or acquisition opportunities.
Pricing and reimbursementAs the healthcare industry faces increased pricing pressures, we look to mitigate this by investing in innovative, differentiated products that advance the treatment of patient populations that are currently underserved. Demonstrating the value of our products helps us to gain market acceptance and appropriate reimbursement coverage and pricing.
Markets and competitionCompanies compete to attract and retain technical and commercial talent, to develop and acquire products, and to gain share in their chosen markets and geographies. We focus on medical areas where we can develop market-leading positions through our capability and resources to undertake product innovation, clinical development and commercial expansion.
A detailed description of the market opportunity and competition is provided in the performance reviews on pages 16 to 38.
BTG plc Annual Report and Accounts 2017 BTG plc Annual Report and Accounts 2017
10Strategic Report
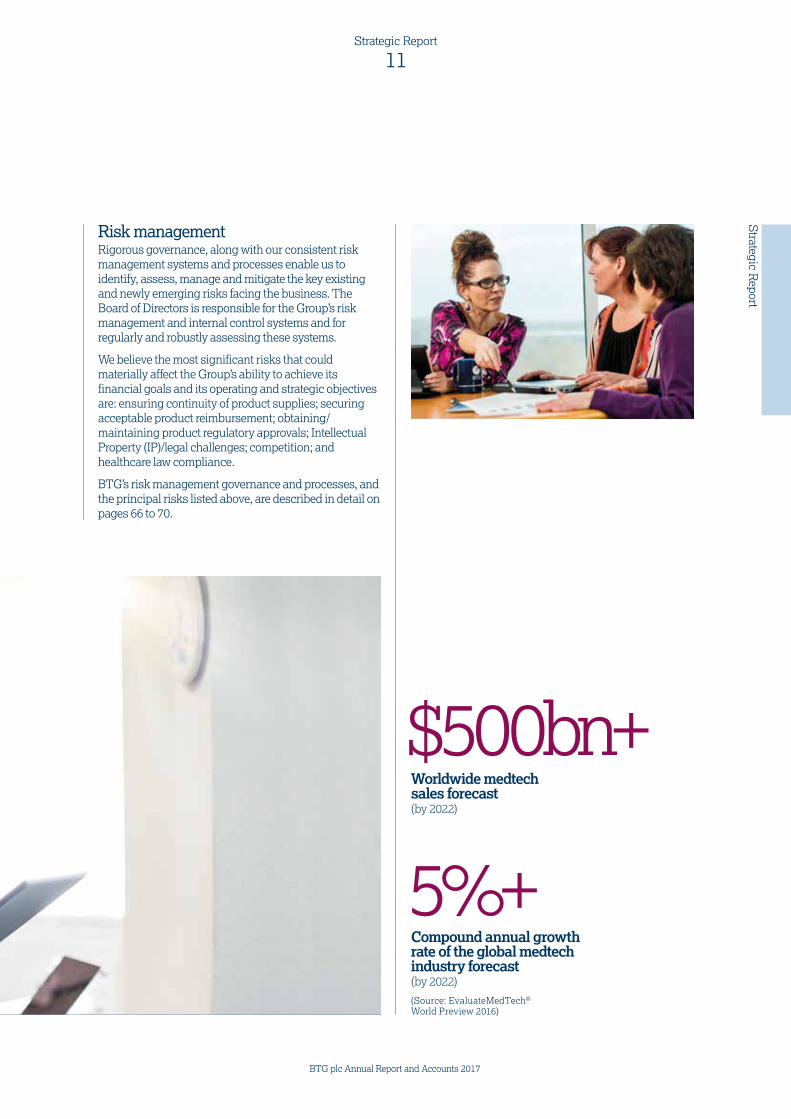
$500bn+Worldwide medtech sales forecast(by 2022)
Risk managementRigorous governance, along with our consistent risk management systems and processes enable us to identify, assess, manage and mitigate the key existing and newly emerging risks facing the business. The Board of Directors is responsible for the Group’s risk management and internal control systems and for regularly and robustly assessing these systems.
We believe the most significant risks that could materially affect the Group’s ability to achieve its financial goals and its operating and strategic objectives are: ensuring continuity of product supplies; securing acceptable product reimbursement; obtaining/maintaining product regulatory approvals; Intellectual Property (IP)/legal challenges; competition; and healthcare law compliance.
BTG’s risk management governance and processes, and the principal risks listed above, are described in detail on pages 66 to 70.
Compound annual growth rate of the global medtech industry forecast(by 2022)
(Source: EvaluateMedTech® World Preview 2016)
5%+
BTG plc Annual Report and Accounts 2017
11Strategic Report
Strategic R
eport
Our business model
How BTG creates value
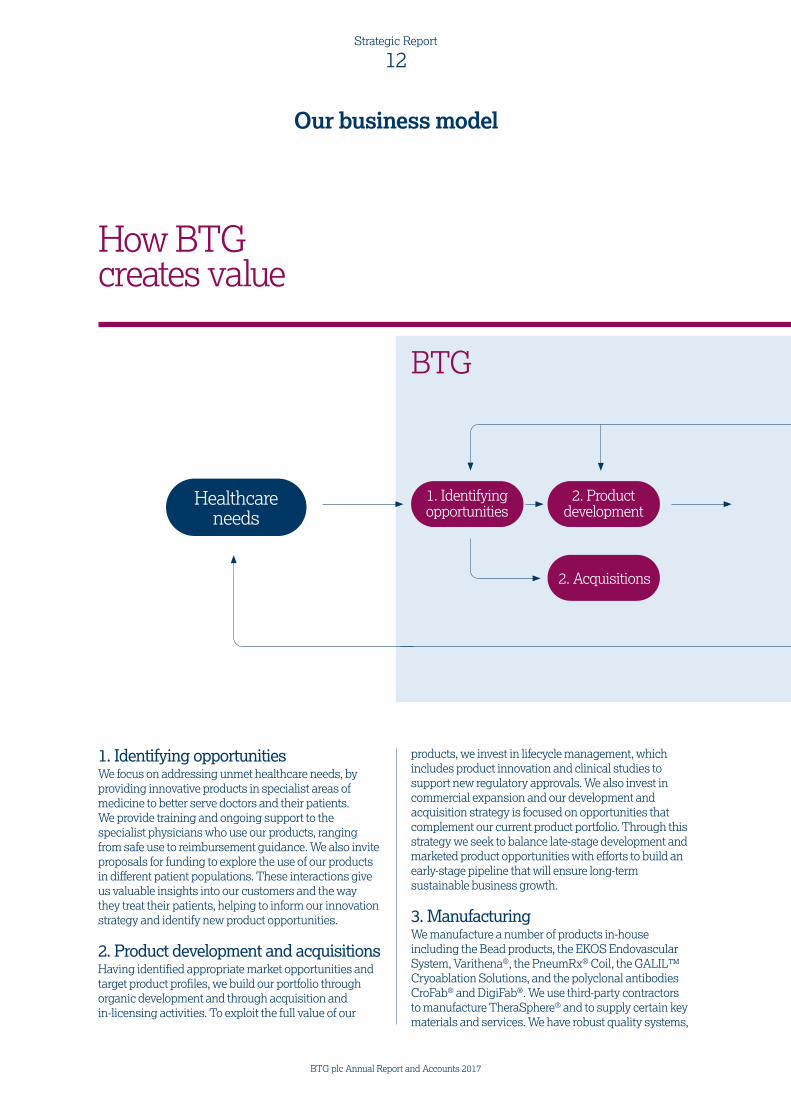
products, we invest in lifecycle management, which includes product innovation and clinical studies to support new regulatory approvals. We also invest in commercial expansion and our development and acquisition strategy is focused on opportunities that complement our current product portfolio. Through this strategy we seek to balance late-stage development and marketed product opportunities with efforts to build an early-stage pipeline that will ensure long-term sustainable business growth.
3. ManufacturingWe manufacture a number of products in-house including the Bead products, the EKOS Endovascular System, Varithena®, the PneumRx® Coil, the GALIL™ Cryoablation Solutions, and the polyclonal antibodies CroFab® and DigiFab®. We use third-party contractors to manufacture TheraSphere® and to supply certain key materials and services. We have robust quality systems,
BTG
1. Identifying opportunities We focus on addressing unmet healthcare needs, by providing innovative products in specialist areas of medicine to better serve doctors and their patients. We provide training and ongoing support to the specialist physicians who use our products, ranging from safe use to reimbursement guidance. We also invite proposals for funding to explore the use of our products in different patient populations. These interactions give us valuable insights into our customers and the way they treat their patients, helping to inform our innovation strategy and identify new product opportunities.
2. Product development and acquisitionsHaving identified appropriate market opportunities and target product profiles, we build our portfolio through organic development and through acquisition and in-licensing activities. To exploit the full value of our
Healthcare needs
1. Identifying opportunities
2. Product development
2. Acquisitions
BTG plc Annual Report and Accounts 2017 BTG plc Annual Report and Accounts 2017
12Strategic Report
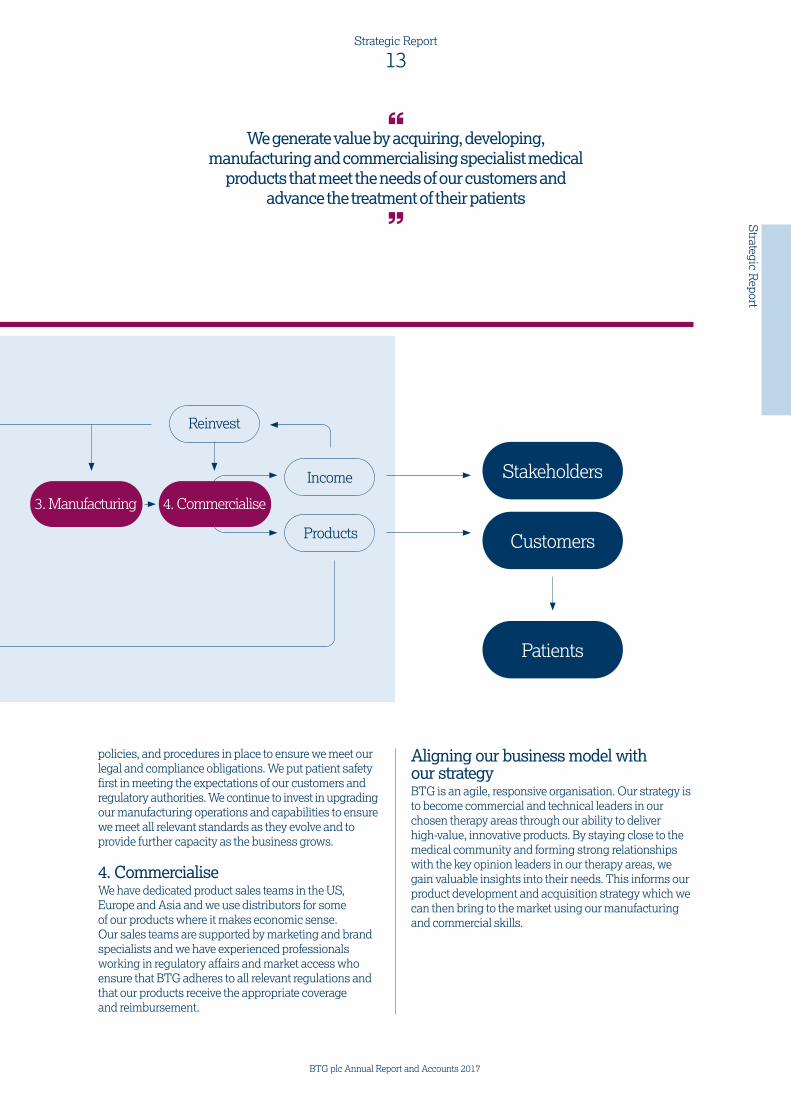
We generate value by acquiring, developing, manufacturing and commercialising specialist medical
products that meet the needs of our customers and advance the treatment of their patients
policies, and procedures in place to ensure we meet our legal and compliance obligations. We put patient safety first in meeting the expectations of our customers and regulatory authorities. We continue to invest in upgrading our manufacturing operations and capabilities to ensure we meet all relevant standards as they evolve and to provide further capacity as the business grows.
4. CommercialiseWe have dedicated product sales teams in the US, Europe and Asia and we use distributors for some of our products where it makes economic sense. Our sales teams are supported by marketing and brand specialists and we have experienced professionals working in regulatory affairs and market access who ensure that BTG adheres to all relevant regulations and that our products receive the appropriate coverage and reimbursement.
Aligning our business model with our strategyBTG is an agile, responsive organisation. Our strategy is to become commercial and technical leaders in our chosen therapy areas through our ability to deliver high-value, innovative products. By staying close to the medical community and forming strong relationships with the key opinion leaders in our therapy areas, we gain valuable insights into their needs. This informs our product development and acquisition strategy which we can then bring to the market using our manufacturing and commercial skills.
3. Manufacturing
Income
Reinvest
Products
Stakeholders
Customers
Patients
4. Commercialise
BTG plc Annual Report and Accounts 2017
13Strategic Report
Strategic R
eport

Objective Progress against objectives set for 2016/17 Priorities for 2017/18 Strategy risk summary
Delivering products for our customers and their patients
Our specialist physician customers and their patients are at the heart of everything we do. We deliver innovative, differentiated products that provide these physicians with new treatment options that address unmet patient needs. We make our products as widely available as we can, through regulatory and commercial activities that support geographic expansion, market adoption and appropriate reimbursement
Interventional Oncology: LC Bead LUMI™ launched in the US; DC Bead LUMI™ approved in Canada and CE Mark certification received in the EU; TheraSphere® introduced in several new geographies and Simplicit90Y™ dosimetry software launched in Europe
Not achieved: decision taken not to progress current biodegradable bead; vandetanib bead study delayed
Interventional Vascular: New EKOS control unit received 510(k) clearance in the US
Varithena® US reimbursement coverage expanded; progress made towards establishing dedicated CPT reimbursement codes in the US; launched in Canada
Not achieved: development of alternative indications for Varithena® stopped
Interventional Pulmonology: PneumRx® Coils included in new GOLD global clinical guidelines; progress made towards national reimbursement in Germany and France; PMA submitted in the US
Specialty Pharmaceuticals: CroFab® Copperhead bite study successfully concluded; Vistogard® granted New Technology Add-on Payment status
Interventional Oncology: Execute regional business plans to deliver mid-teens product sales growth; expand into new geographies; optimise distribution channels; launch DC Bead LUMI™ in the EU
Interventional Vascular: Execute regional business plans to deliver 20%+ product sales growth; build US PE/DVT business; launch new control unit; continue to execute RoW expansion plans
Continue Varithena® US market access programme and execute activities to take advantage of new CPT codes anticipated in 2018
Interventional Pulmonology: Secure national coverage/reimbursement in Germany and France and implement commercialisation plans; establish further European studies/registries; progress PMA application in the US and prepare for commercial launch
Specialty Pharmaceuticals: Continue to implement CroFab® leadership strategy; optimise oncology sales force to build Vistogard® and Voraxaze® awareness/sales
The following could adversely impact product adoption and revenue growth
— Failure or significant delay in gaining regulatory approvals to market products
— Failure to secure timely or adequate levels of reimbursement for products
— Increased competition
Investing for growthWe are investing in expanding our product portfolio and building our pipeline to generate long-term value for our stakeholders
Galil Medical acquired and integrated
Expanded Investigator Initiated Studies (IIS) programme, taking total IIS funded to over 40
Collaboration with Society of Interventional Oncologists established to explore combining interventional and immuno-oncology treatments
Continued recruitment into TheraSphere® Phase III trials
Recruitment completed into OPTALYSE and ACCESS PTS studies
Acquisition of majority stake in OncoVerse, a digital healthcare platform
Successful Copperhead study, evaluating the use of CroFab® to treat Copperhead snake envenomation
Innovation and Development: Deliver existing clinical trial milestones including TheraSphere® Phase III trials, completion of EKOS OPTALYSE and ACCESS PTS studies and completion of GALIL™ lung and bone metastases studies
Deliver lifecycle management projects; identify early-stage pipeline opportunities
Identify and execute Business Development opportunities in Interventional Medicine and Specialty Pharmaceuticals
Failure to deliver pipeline programmes or to expand the portfolio, whether by R&D or M&A, would limit BTG’s long-term growth potential
People and practicesAs a fast-growing business, we strive to ensure that our organisational structure, capabilities and systems are scalable and can support our growth strategy
Pages 26 to 29, for more details
New R&D structure designed to support and accelerate delivery of projects
Learning & Development programme expanded to support the business objectives throughout the year. Agenda attendance was on target and further progress made in our Management Development and Critical Thinking programmes.
Evolve Learning & Development agenda to increase focus on talent development to build capabilities for now and the future
Ensure our organisational structure, systems and processes are efficient and fit for purpose for now and the future
Lead capability and capacity needs across business units; deliver against succession and hiring plans
Provide opportunities for stretch, development and career progression
Without the right capabilities and capacity, BTG’s growth plans may not be achieved
Without appropriate but efficient systems BTG would fail to meet regulatory obligations or not be nimble enough to respond to, and capture, market opportunities
Financial managementWe report on four KPIs that demonstrate progress towards our long-term goals
Pages 30 to 38, for more details see the Financial Review
We expect to deliver further growth in 2017/18, specifically:
— Interventional Medicine, mid-to-high teens % growth
— Specialty Pharmaceuticals, low-to-mid single digit % growth
— Licensing, high teens % decline
A number of risks relate to numerous objectives. These include: failure to execute business plans, increased competition, supply chain disruption, legal or intellectual property disputes; failing to meet the Group’s legal, regulation and compliance obligations, failure to secure adequate levels of reimbursement or regulatory approvals, or failure to attract, retain and develop staff with the requisite skills and expertise to deliver the strategy or higher than expected cost of sales or overheads, could materially adversely impact revenue growth
1. For information on our adjusted earnings policy, and those items excluded from our adjusted financial metrics, see pages 36 to 38. 2. For a full disclosure of risks, see pages 66 to 70.
Our strategicpriorities
1
2
3
4Revenue(£million)
£570.5m(2015/16: £447.5m)
Adjusted operating profit1
(£million)
£129.6m(2015/16: £93.0m)
Adjusted EPS1
(pence)
23.1p(2015/16: 21.9p)
Free cash flow(£million)
£64.7m(2015/16: £88.1m)
BTG plc Annual Report and Accounts 2017 BTG plc Annual Report and Accounts 2017
14Strategic Report
Objective Progress against objectives set for 2016/17 Priorities for 2017/18 Strategy risk summary
Delivering products for our customers and their patients
Our specialist physician customers and their patients are at the heart of everything we do. We deliver innovative, differentiated products that provide these physicians with new treatment options that address unmet patient needs. We make our products as widely available as we can, through regulatory and commercial activities that support geographic expansion, market adoption and appropriate reimbursement
Interventional Oncology: LC Bead LUMI™ launched in the US; DC Bead LUMI™ approved in Canada and CE Mark certification received in the EU; TheraSphere® introduced in several new geographies and Simplicit90Y™ dosimetry software launched in Europe
Not achieved: decision taken not to progress current biodegradable bead; vandetanib bead study delayed
Interventional Vascular: New EKOS control unit received 510(k) clearance in the US
Varithena® US reimbursement coverage expanded; progress made towards establishing dedicated CPT reimbursement codes in the US; launched in Canada
Not achieved: development of alternative indications for Varithena® stopped
Interventional Pulmonology: PneumRx® Coils included in new GOLD global clinical guidelines; progress made towards national reimbursement in Germany and France; PMA submitted in the US
Specialty Pharmaceuticals: CroFab® Copperhead bite study successfully concluded; Vistogard® granted New Technology Add-on Payment status
Interventional Oncology: Execute regional business plans to deliver mid-teens product sales growth; expand into new geographies; optimise distribution channels; launch DC Bead LUMI™ in the EU
Interventional Vascular: Execute regional business plans to deliver 20%+ product sales growth; build US PE/DVT business; launch new control unit; continue to execute RoW expansion plans
Continue Varithena® US market access programme and execute activities to take advantage of new CPT codes anticipated in 2018
Interventional Pulmonology: Secure national coverage/reimbursement in Germany and France and implement commercialisation plans; establish further European studies/registries; progress PMA application in the US and prepare for commercial launch
Specialty Pharmaceuticals: Continue to implement CroFab® leadership strategy; optimise oncology sales force to build Vistogard® and Voraxaze® awareness/sales
The following could adversely impact product adoption and revenue growth
— Failure or significant delay in gaining regulatory approvals to market products
— Failure to secure timely or adequate levels of reimbursement for products
— Increased competition
Investing for growthWe are investing in expanding our product portfolio and building our pipeline to generate long-term value for our stakeholders
Galil Medical acquired and integrated
Expanded Investigator Initiated Studies (IIS) programme, taking total IIS funded to over 40
Collaboration with Society of Interventional Oncologists established to explore combining interventional and immuno-oncology treatments
Continued recruitment into TheraSphere® Phase III trials
Recruitment completed into OPTALYSE and ACCESS PTS studies
Acquisition of majority stake in OncoVerse, a digital healthcare platform
Successful Copperhead study, evaluating the use of CroFab® to treat Copperhead snake envenomation
Innovation and Development: Deliver existing clinical trial milestones including TheraSphere® Phase III trials, completion of EKOS OPTALYSE and ACCESS PTS studies and completion of GALIL™ lung and bone metastases studies
Deliver lifecycle management projects; identify early-stage pipeline opportunities
Identify and execute Business Development opportunities in Interventional Medicine and Specialty Pharmaceuticals
Failure to deliver pipeline programmes or to expand the portfolio, whether by R&D or M&A, would limit BTG’s long-term growth potential
People and practicesAs a fast-growing business, we strive to ensure that our organisational structure, capabilities and systems are scalable and can support our growth strategy
Pages 26 to 29, for more details
New R&D structure designed to support and accelerate delivery of projects
Learning & Development programme expanded to support the business objectives throughout the year. Agenda attendance was on target and further progress made in our Management Development and Critical Thinking programmes.
Evolve Learning & Development agenda to increase focus on talent development to build capabilities for now and the future
Ensure our organisational structure, systems and processes are efficient and fit for purpose for now and the future
Lead capability and capacity needs across business units; deliver against succession and hiring plans
Provide opportunities for stretch, development and career progression
Without the right capabilities and capacity, BTG’s growth plans may not be achieved
Without appropriate but efficient systems BTG would fail to meet regulatory obligations or not be nimble enough to respond to, and capture, market opportunities
Financial managementWe report on four KPIs that demonstrate progress towards our long-term goals
Pages 30 to 38, for more details see the Financial Review
We expect to deliver further growth in 2017/18, specifically:
— Interventional Medicine, mid-to-high teens % growth
— Specialty Pharmaceuticals, low-to-mid single digit % growth
— Licensing, high teens % decline
A number of risks relate to numerous objectives. These include: failure to execute business plans, increased competition, supply chain disruption, legal or intellectual property disputes; failing to meet the Group’s legal, regulation and compliance obligations, failure to secure adequate levels of reimbursement or regulatory approvals, or failure to attract, retain and develop staff with the requisite skills and expertise to deliver the strategy or higher than expected cost of sales or overheads, could materially adversely impact revenue growth
1. For information on our adjusted earnings policy, and those items excluded from our adjusted financial metrics, see pages 36 to 38. 2. For a full disclosure of risks, see pages 66 to 70.
We monitor our performance against four strategic priorities: delivering products that meet the needs of our customers and their patients; investing for growth; ensuring our people have the right capabilities and our practices are fit for purpose and scalable; and financial key performance indicators (KPIs). These objectives may span several years
BTG plc Annual Report and Accounts 2017
15Strategic Report
Strategic R
eport

Performance
BTG has continued to perform well during the year – delivering strongly against our financial and strategic objectives
Our four key objectivesDelivering products for our customers and their patientsWe deliver innovative, differentiated products that provide specialist physicians with new treatment options to address unmet patient needs.
Investing for growthWe invest to expand our product portfolio and pipeline to generate long-term value. People and practicesWe strive to ensure that our organisational structure, capabilities and systems are scalable and fit for purpose.
Financial managementWe report on four financial KPIs that demonstrate progress towards our long-term goals.
Business segments
Interventional Medicine
Products
Oncology
Page 17, to read more
Vascular
Page 20, to read more
Pulmonology
Page 22, to read more
Specialty Pharmaceuticals
Page 24, to read more
Licensing
Page 25, to read more
Beads TheraSphere® GALIL™
EKOS® Varithena®
PneumRx® Coils
CroFab® DigiFab® Voraxaze® Vistogard®
Various royalties
1
2
3
4
BTG plc Annual Report and Accounts 2017 BTG plc Annual Report and Accounts 2017
16Strategic Report

About liver cancerPrimary liver cancer, including the most common form hepatocellular carcinoma (HCC), occurs when tumours grow in the liver. Secondary liver cancer occurs when tumours from other organs spread to the liver. Common causes of HCC include high levels of alcohol consumption or chronic infections of hepatitis B or C, which damage the liver and can lead to cirrhosis. It is estimated that 50%-60% of patients with colorectal cancer will develop metastases during the course of their disease, one of the most common being metastatic colorectal cancer (mCRC) in the liver.
When diagnosed early, liver tumours can be removed and some patients are suitable for a transplant. However, if diagnosed when symptomatic, surgical resection is usually no longer an option. For unresectable tumours, locoregional treatments including embolisation, chemoembolisation, internal radiation therapy and ablation may be used to shrink the tumours and delay the progression of the disease.
Market opportunity in liver cancerWe estimate that globally the combined annual incidence of HCC and mCRC is approximately 1.2 million people, of whom around 147,000 patients annually would be amenable to locoregional treatments
OncologyOur Interventional Oncology franchise comprises the liver cancer treatments TheraSphere®, glass microspheres that deliver internal radiation therapy, and LC Bead® and DC Bead®, our embolisation and chemoembolisation polymer beads. During the year we acquired Galil Medical, a leader in interventional oncology cryoablation technology.
Delivering products and investing for growth
1&2
Beads andTheraSphere®
DC Bead LUMI™
BTG plc Annual Report and Accounts 2017
17Strategic Report
Strategic R
eport
Performancecontinued
based on their disease progression and taking into account access to treatment and affordability in different countries. This represents a global opportunity of approximately $1.3 billion.
We are exploring ways to expand the use of our products in treating cancer and in non-hepatic indications which, if successful, could increase the market opportunity for our product. Our target is to deliver sustainable mid-teens annual product sales growth.
CompetitionEmbolisation and transarterial chemoembolisation (TACE) have become established treatments for unresectable, intermediate-stage HCC around the world. Conventional TACE (cTACE) involves the administration of a compounded oil and drug solution emulsion followed by an embolising material. LC Bead® competes with a small number of commercially available beads while DC Bead® competes with cTACE and a small number of other beads that are capable of being loaded with chemotherapeutic drugs. BTG has a leading position in the US and the EU, and we are building our presence in Asia. TheraSphere® is one of only two commercially available selective internal radiation Y90 products used to treat liver tumours.
Growth strategy and progressTo sustain our mid-teens average annual product sales growth target we are investing in commercial and geographic expansion, focusing on product innovation and generating clinical data to support new indications and expanded use of our products.
TheraSphere® was approved during the year in Mexico, South Korea, Malaysia and a number of other territories in Asia, and we made progress with plans to seek regulatory approval in China. We received CE Mark certification in the EU and approval in Canada for Simplicit90Y™ dosimetry software, designed to optimise the planning of TheraSphere® and facilitate personalised treatment for patients with liver cancer. The novel visible bead DC Bead LUMI™, received a CE mark in the EU and was approved in Canada.
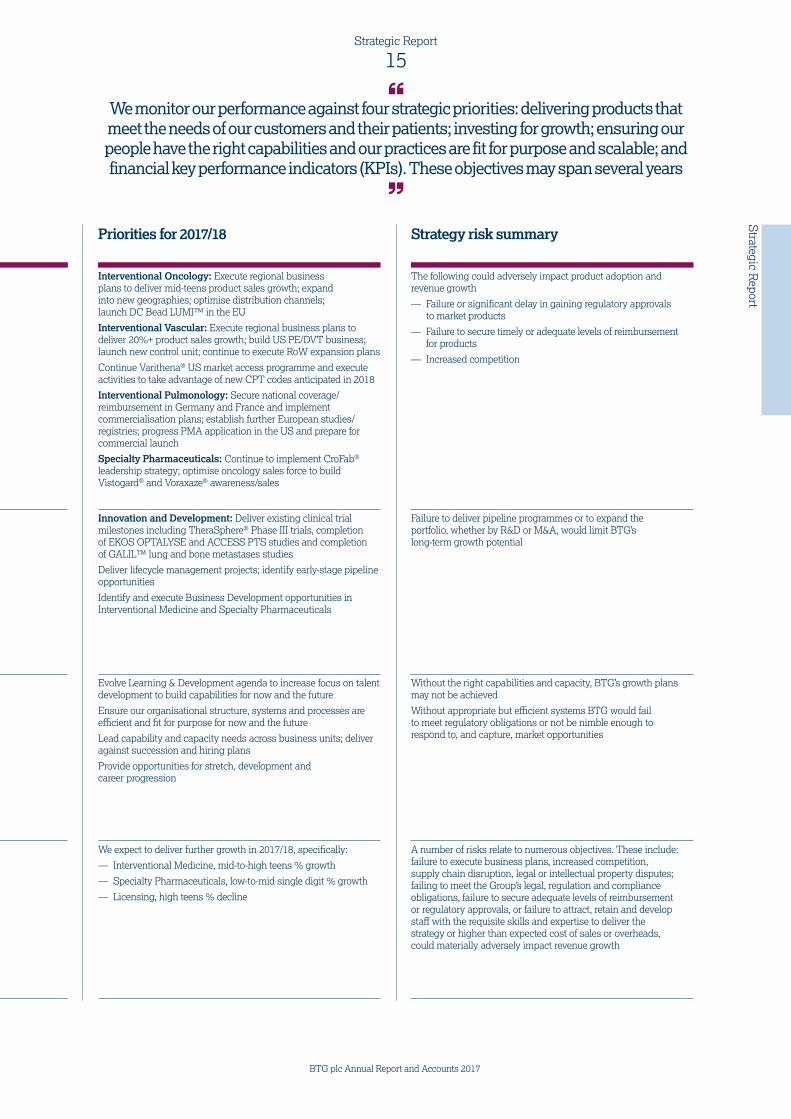
Beads andTheraSphere®
continued1. DC Bead® containing negatively charged sites are bound with a positively charged cancer drug. Water is displaced as the cancer drug is absorbed throughout the beads.
2. The drug loaded embolic beads are inserted into an artery through a catheter which is then advanced into a tumour feeding vessel.
3. The beads are guided to the tumour site and there they block the blood flow within the vessels, depriving the tumour of oxygen.
4. DC Bead® start a controlled release of a chemotherapeutic drug over time which results in ishchemia and tumour cell death.
BTG plc Annual Report and Accounts 2017 BTG plc Annual Report and Accounts 2017
18Strategic Report

Recruitment into the STOP-HCC and EPOCH trials of TheraSphere® in primary liver cancer and mCRC has accelerated as planned.
We formed a collaboration with the Society of Interventional Oncologists to explore the role of localised treatments alongside immuno-oncology and have provided funding for several new investigator initiated studies to explore potential new uses of the Beads and TheraSphere®.
GALIL CryoablationGalil Medical provides cryoablation technology for use in oncology and other indications. It has a leading market position in the cryoablation of kidney cancer, where there is one other provider of cryoablation technology.
Globally, kidney cancer is the twelfth most common cancer with an annual incidence of approximately 340,0001 new cases. Causes include smoking, though there are other risk factors including being overweight, hypertension and having polycystic kidney disease. Treatment choices depend upon the stage of the cancer when diagnosed and include surgery, ablation, radiation therapy and biologic and chemotherapies. Cryoablation is generally used on early-stage kidney tumours that are less than 4cm across, and Galil Medical’s cryoablation technology is growing strongly.
Galil’s growth strategy is to expand its use in US hospitals and to continue to expand its global presence. During the period the first patients were treated in Argentina. Two studies progressed well which, if successful, would support adoption in treating metastatic lung and bone tumours.
1. To freeze the cancer, special ultra-thin probes called cryoablation needles are inserted through the skin into the tumour.
2. The needles are inserted under guidance of CT, ultrasound imaging or MRI.
3. Argon gas is delivered under pressure into a small chamber inside the tip of the needle where it expands and cools, reaching a temperature well below -100°C.
4. This produces an iceball of predictable size and shape around the needles. The iceball is visible under imaging, allowing the physician to ensure the iceball fully engulfs the tumour, killing the cancerous cells.
5. The body temperature gradually melts the iceball, resulting in ablated tissue.
TheraSphere®
1. Source: www.cancerresearch.co.uk
BTG plc Annual Report and Accounts 2017
19Strategic Report
Strategic R
eport

Performancecontinued
Vascular
We have two products within our Interventional Vascular portfolio. The EKOS® System is an ultrasonic catheter drug delivery device used in the treatment of blood clots. Varithena® is a proprietary engineered microfoam used in the treatment of varicose veins.
EKOS®
About blood clotsEvery year, thousands of people die as a result of some form of blood clot. The collective term is venous thromboembolism (VTE) and this includes deep vein thrombosis (DVT), which is a blood clot in one of the deep veins in the body, and pulmonary embolism (PE), a blood clot in the vessel that carries blood from the heart to the lungs.
A growing market opportunityThe incidence of VTE has increased markedly, driven in part by an aging population and rising levels of obesity. Each year in the US, approximately 1 million people suffer a severe clot and, of those, we estimate about 70% are amenable to interventional treatment. The annual number of interventional procedures in the US has grown from about 95,000 in 2013 to over 150,000 today.
We expect the growth in this market to continue as healthcare professionals recognise the increasing importance of treating severe VTEs early.
Strategic progress We continue to expand hospital penetration in the US where we have been working closely with hospital staff to establish new patient referral programmes and treatment protocols. During the year a new control unit that is optimised for treating PEs received 510(k) approval in the US. We also made good progress in our commercial expansion plans outside of the US with our first treatments carried out in Taiwan and Hong Kong.
1&2
1. When blood clots form in the body they can cause chronic pain and swelling. The clot might also break free and travel through your blood stream to major organs, such as your lungs resulting in a life-threatening pulmonary embolism (PE).
2. An infusion catheter is inserted within the blood vessel through the clot.
5. Blood flow is then restored within the vessel.
3. A unique ultrasonic core, containing numerous ultrasound transducers, is then inserted inside the infusion catheter.
4. The ultrasonic core then delivers acoustic pulses that loosen the fibrin strands that enmesh the blood clot. This acoustic action combined with the direct placement of a thrombolytic drug results in faster and more complete clot dissolution.
BTG plc Annual Report and Accounts 2017 BTG plc Annual Report and Accounts 2017
20Strategic Report

Varithena®
Transforming the treatment of varicose veinsVarithena® is a uniform, low-nitrogen, engineered microfoam, that is dispensed from a proprietary canister device. Treatment is a non-surgical procedure and usually takes less than one hour after which patients may resume light activities.
Market opportunityIt is estimated that there are approximately 30 million Americans with varicose veins, of whom about 2.5 million develop symptoms each year that qualify them to receive reimbursed treatment by their healthcare provider. Varicose veins are a progressive disease and, if left untreated, can result in more serious and painful leg ulcers.
Competition in the US reimbursed sectorApproximately 70% of reimbursed procedures are conducted in private vein clinics, with the remainder primarily conducted in hospitals. Since 2005, most symptomatic varicose vein treatments involve a combination of heat ablation of the great saphenous vein (GSV), stab phlebectomy of the visible varicosities and sclerotherapy of the visible veins.
Growth strategy and progressVarithena® has broad application across the spectrum of varicose veins. We continue to expand insurance policy coverage and, during the year, we made progress towards establishing new reimbursement codes that will specifically cover the use of Varithena®. These are expected to be implemented in January 2018.
Drivers of future growthAdding to the clinical data already generated by EKOS will enable us to build on our leadership position in the treatment of VTE. Patient enrolment into the OPTALYSE and ACCESS PTS studies is now complete, and the results from both are expected during 2017. We are strengthening our presence in Europe and making good progress on our plans to take the EKOS® System into other geographies.
1. Tiny valves help the leg veins work against gravity to push the blood back to the heart. Varicose veins are formed when the valves weaken and blood leaks backwards where it pools, resulting in swelling, pain, throbbing and itching of the veins.
2. The doctor administers a small amount of Varithena® through a catheter or by direct injection into the malfunctioning vein with the help of ultrasound imaging.
3. The uniform density, size and stability of the microfoam allows it to fill the vein lumen and displace stagnant blood.
4. The diseased vein collapses and the microfoam is deactivated. When the malfunctioning vein collapses, blood flow shifts to healthier veins nearby.
BTG plc Annual Report and Accounts 2017
21Strategic Report
Strategic R
eport

Pulmonology
In January 2015, Interventional Pulmonology became a new focus area for BTG with the acquisition of PneumRx, which makes implantable coils that are used in the treatment of severe emphysema.
Emphysema is a debilitating lung disease, most commonly caused by cigarette smoking, which affects millions of people globally. It is characterised by damage to the elasticity and function of the lung tissue, leading to shortness of breath and significant disability.Treatments to alleviate symptoms include pharmacotherapy, pulmonary rehabilitation and oxygen therapy as needed. A very small number of patients may qualify for lung transplants or lung volume reduction surgery. Interventional treatments including implantable coils and valves, which are currently cleared for use only in Europe and select other countries, are relatively new, minimally invasive treatment options.
The PneumRx® Coils are made of a shape-memory material called nitinol, pre-programmed in a double-loop shape. After being straightened for insertion into the lung via a bronchoscope, they gather up and compress the diseased lung tissue surrounding them, re-tensioning the airway network, as they recover their original shape. The coils are designed to improve lung function by enabling more efficient contraction during the breathing cycle, and by tethering open small airways, preventing airway collapse during exhalation.
Emphysema and the PneumRx® Coil
1&2
1. The coils are small, shape-memory nitinol implants, designed to gather and compress diseased tissue, re-tension the diseased airway network and mechanically increase the elastic recoil in the emphysematous lung.
2. Coils are inserted into the diseased part of the lung during a bronchoscopy procedure.
3. When in place, the coils are designed to gently regain their shape, gathering and compressing damaged lung tissue and holding open surrounding airways.
4. Several coils are placed in a single lung to tighten the entire airway network. The procedure typically takes 35-45 minutes.
BTG plc Annual Report and Accounts 2017 BTG plc Annual Report and Accounts 2017
22Strategic Report
Performancecontinued

Market opportunityThe PneumRx® Coil, which received CE mark clearance in Europe in 2010, has been shown in clinical studies to improve lung function, exercise capacity and quality of life in a broad range of patients with severe emphysema. This includes patients in stages III and IV as defined in the GOLD (Global initiative for chronic Obstructive Lung Disease) classification system. It is estimated that there are over 5 million people in the US and Europe with GOLD stage III and IV emphysema.
Growth strategy and progressInterventional Pulmonology is an emerging medical field and the PneumRx® Coil is at an early stage in its commercial development. Our growth strategy comprises medical development and expanding commercial activities. We intend to build on the clinical data available from the three randomised studies that have been conducted to date to refine the criteria that will enable physicians to select patients that are most likely to respond to treatment, and to support development of clinical practice guidelines and referral pathways for appropriate patients to receive treatment.
In Europe, we are focused on ensuring growth resumes in Germany, our largest market. We expect that national payment coverage will be confirmed by the German government during the current financial year. We expect to secure national reimbursement and coverage in France, where there is also a government process under way, and we will continue to build momentum in other European territories.
Our Premarket Approval application has been accepted for review in the US. As we interact with the US FDA we will in parallel develop our launch and reimbursement strategy for the US market.
PneumRx® Coil
BTG plc Annual Report and Accounts 2017
23Strategic Report
Strategic R
eport
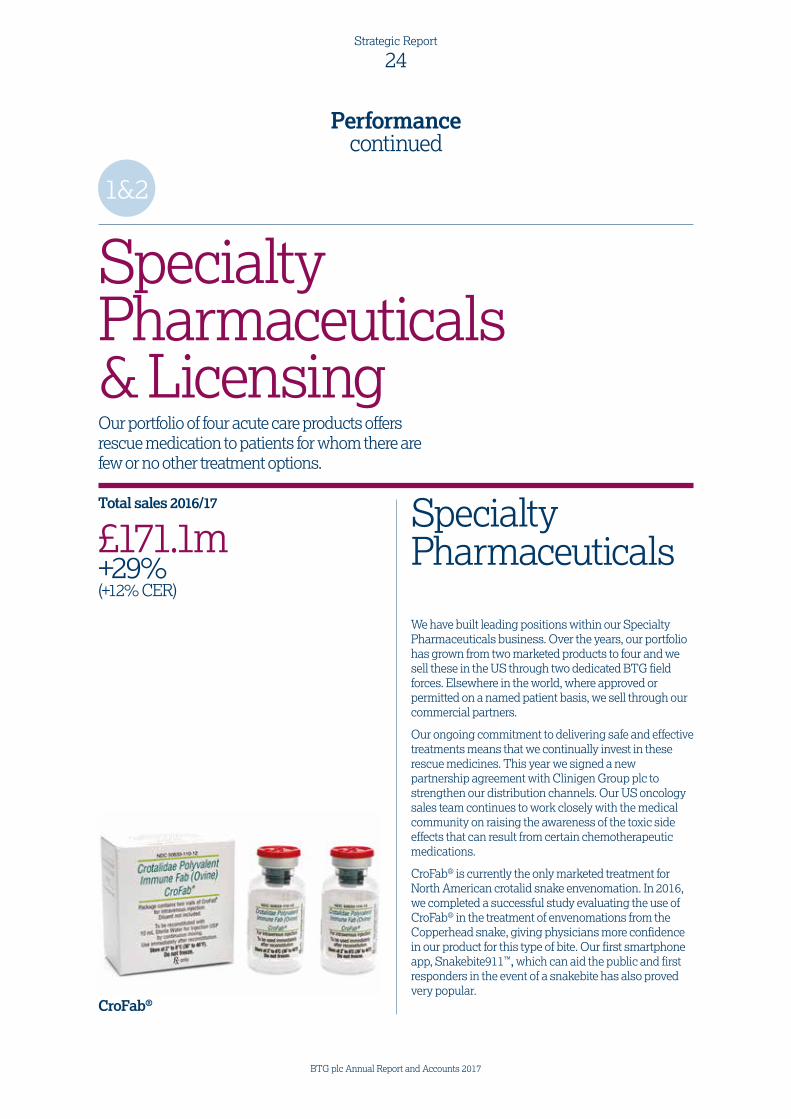
Specialty Pharmaceuticals& LicensingOur portfolio of four acute care products offers rescue medication to patients for whom there are few or no other treatment options.
We have built leading positions within our Specialty Pharmaceuticals business. Over the years, our portfolio has grown from two marketed products to four and we sell these in the US through two dedicated BTG field forces. Elsewhere in the world, where approved or permitted on a named patient basis, we sell through our commercial partners.
Our ongoing commitment to delivering safe and effective treatments means that we continually invest in these rescue medicines. This year we signed a new partnership agreement with Clinigen Group plc to strengthen our distribution channels. Our US oncology sales team continues to work closely with the medical community on raising the awareness of the toxic side effects that can result from certain chemotherapeutic medications.
CroFab® is currently the only marketed treatment for North American crotalid snake envenomation. In 2016, we completed a successful study evaluating the use of CroFab® in the treatment of envenomations from the Copperhead snake, giving physicians more confidence in our product for this type of bite. Our first smartphone app, Snakebite911™, which can aid the public and first responders in the event of a snakebite has also proved very popular.
SpecialtyPharmaceuticals
1&2
Total sales 2016/17
£171.1m+29% (+12% CER)
CroFab®
BTG plc Annual Report and Accounts 2017 BTG plc Annual Report and Accounts 2017
24Strategic Report
Performancecontinued

Vistogard®, the first and only treatment for early-onset of severe 5-fluorouracil (5-FU) toxicity, has made a promising start in its first full year of launch. During the year the Centers for Medicare and Medicaid Services approved a New Technology Add-on Payment meaning that Medicare will pay up to 50% reimbursement of the cost of Vistogard® within the hospital setting. This is expected to stay in place for two years.
Licensing
BTG continues to receive royalties relating to the sales of products that are subject to intellectual property licence agreements between us and various partners. These royalties vary but usually amount to a single digit percentage of our licensee’s sales. Within this segment, royalties from sales of Johnson & Johnson’s prostate cancer drug Zytiga® are the largest contributor.
Our Licensing business has been a source of strong cash flow from which we have been able to invest in the higher growth, higher margin opportunities in our Interventional Medicine portfolio.
Establishing new license arrangements is not a strategic priority. Overall royalties are expected to decline over time as patents on existing out-licensed products expire. Lemtrada™ royalties will expire in 2017/18 and Zytiga® royalties may be impacted by generic competition as early as the 2018/19 financial year.
£123.2m+4%
Zytiga® royalties2015/16: £118.9m
£39.0m+97%
LemtradaTM
royalties2015/16: £19.8m
Our ongoing commitment to delivering safe and effective treatments means that we continually invest in these
rescue medicines
BTG plc Annual Report and Accounts 2017
25Strategic Report
Strategic R
eport

People and practices
3
PeopleHow does our culture drive value?BTG employs more than 1,500 people across 17 locations around the world. We benefit from the diverse mix of perspectives that their variety of backgrounds and experiences bring. Each of our employees contributes to and shares in BTG’s success.
Our cultureWe believe that our unique culture, which we call our DNA, enables us to better serve our customers and their patients, and to differentiate our business in the marketplace. Our culture is defined by the behaviours we aspire to, based on our shared values, and these guide how we interact with our customers and each other. By allowing us to be agile, ensuring clear accountabilities, and encouraging openness and communication, these behaviours translate to business advantages and help us meet our ambitious goals.
Championing behavioursAs we grow, both organically and through acquisition, maintaining our culture continues to be a priority. A group of influential employees we call “Champions” have been chosen from all parts of the business. They are empowered to maintain and propagate our culture through role-modelling, sharing experiences, and other peer-to-peer interactions.
At BTG, it’s not important where you are in the org chart or who
you work for, we’re far more interested in who you’re working with and what
you’re working on
BTG plc Annual Report and Accounts 2017 BTG plc Annual Report and Accounts 2017
26Strategic Report
Performancecontinued

Learning & Development
Listening to our peopleWe regularly seek employee feedback to help understand and respond to their needs and concerns, and to ensure we remain an attractive employer. The results of our 2016 employee engagement survey, conducted by the Great Place to Work® institute, showed that our overall “Trust Index©” score was 73% compared with 75% in our 2014 survey, and our other scores were also broadly consistent:
We are focusing on the outcomes of the survey to deliver programmes that will drive improvements.
Continuous learningWe invest in our people through a robust agenda of Learning & Development offerings and we provide a range of development opportunities intended to build the capabilities we need to meet our near-term goals and lay the foundation for long term growth. This year 36 people were enrolled in our in-house Management Development Programme, a bespoke course designed and delivered by BTG to develop promising new talent and reinforce our culture. We’ve bolstered our leadership development by working with innovative learning partners such as getAbstract and Challenge24. Our mentoring programme has also paired 37 employees with senior leaders to further develop their leadership, management and executive presence skills. We continue to place a strong focus on succession planning and have improved successor readiness across the organisation. Following the successful piloting of our apprentice and graduate trainee programmes in 2016/17, the Company is looking for more people across a range of business areas to continue our focus on the next generation of talent.
Health and well-beingEnsuring the physical well-being of our employees is also critical to our success. This year’s lost time accident rate is half the prior year’s rate, largely driven by the diligence of our managers in our higher risk facilities. We are particularly proud of our employees at our production site in Australia, who celebrated a 365-day period without a lost time accident. This was achieved through fostering a culture of safety and encouraging reporting and root cause assessments of near misses.
Month/year
Accidents per 100,000 hours
worked1
End March 2017 0.17End March 2016 0.34
1. This figure includes accidents where people have returned to work and were given alternative duties as they were not able to fulfil their normal roles.
92%of employees rate Learning & Development offerings between good and excellent quality
76% feel BTG is a great place to work (78% in 2014)
98%feel the course met their development needs
86% feel a sense of pride in what we accomplish (89% in 2014)
87% say they used their learning outcomes within one month of completing a course
82% feel they make a difference (81% from 2014)
BTG plc Annual Report and Accounts 2017
27Strategic Report
Strategic R
eport
People and practicescontinued
3
PracticesOur codeWe do not compromise with truth, ethics, or integrity. Every employee in every region and function is trained annually in our Code of Conduct, and regularly reminded of its importance. Contractors and other third parties we work with are expected to adhere to the same standards. The principles, policies and procedures described in the Code ensure that our business operates in accordance with the requirements of our highly regulated industry.
We have a culture of open and honest communication and encourage employee incident reporting through internal channels or via an externally managed anonymous hotline. Our code prohibits retaliation of any kind against anyone who reports a concern. The latest version of our full Code of Conduct is available on the Responsibility section of our website.
We have a culture of open and honest communication
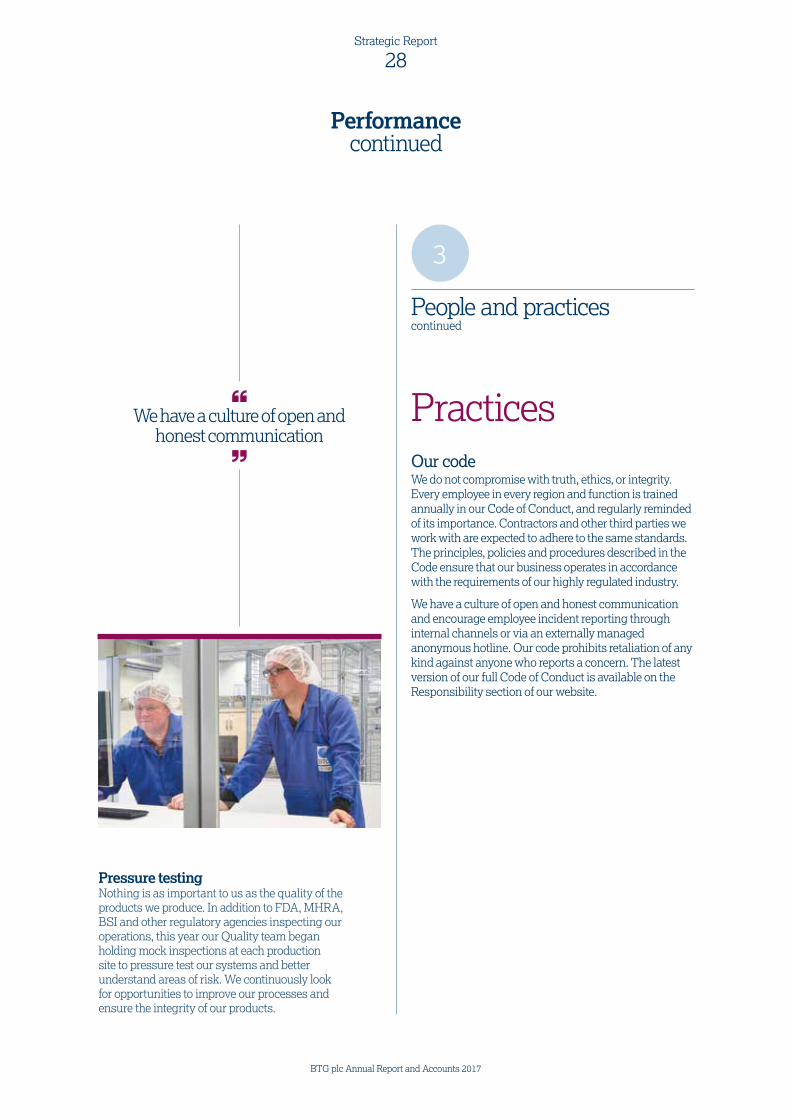
Pressure testingNothing is as important to us as the quality of the products we produce. In addition to FDA, MHRA, BSI and other regulatory agencies inspecting our operations, this year our Quality team began holding mock inspections at each production site to pressure test our systems and better understand areas of risk. We continuously look for opportunities to improve our processes and ensure the integrity of our products.
BTG plc Annual Report and Accounts 2017 BTG plc Annual Report and Accounts 2017
28Strategic Report
Performancecontinued

Anti-bribery and corruption
Ethicallypriced
Environmentalresponsibility
www.btgplc.com/responsibility
Transparency
Respecting internationalstandards
Donations
Doing the right thing
Our anti-bribery and corruption (ABAC) policy prohibits BTG employees, and those acting on their behalf, from offering anything of value as a bribe or inducement to others to make decisions that favour BTG’s interests. These policies are designed to promote compliance with the UK Bribery Act, the US Foreign Corrupt Practices Act (FCPA), and other local law equivalents.
Each of our products is priced in accordance with its value from the points of view of healthcare professionals, patients and payers, and to allow our continued investment in R&D. For some products we offer Patient Assistance and access programmes to ensure life-saving treatments are available to patients who need them.
We are committed to environmental responsibility and sustainable business practices, and each year we are finding new ways to reduce our environmental impact. We continue to monitor and report our annual CO2, water and electricity use, as well as waste production (See Environmental Data on page 99).
The Responsibility section of our website summarises our policies and positions on a range of social, environmental and governance topics we consider relevant to our business.
To ensure the transparency of our relationship with healthcare providers, BTG collects, tracks, and reports payments to healthcare professionals and organisations in accordance with the US Physician Payment Sunshine Act.
BTG has publicly committed to respecting international standards such as the United Nations Universal Declaration of Human Rights. The Board approved a Human Rights Statement, available on our website and satisfies the UK Modern Slavery Act and the US California Transparency in Supply Chains Act.
During this fiscal year we donated £44,000 (2015/16: £27,000) to charitable causes chosen by our employees. The list of charities we supported is available on our website.
BTG plc Annual Report and Accounts 2017
29Strategic Report
Strategic R
eport

CFO’s Financial review
Rolf SoderstromChief Financial Officer
BTG has delivered a strong financial performance in 2016/17, reflecting the Group’s increasing financial maturity and progress on its strategic objective to achieve sustained profitable growth.
This review includes financial metrics on both an IFRS and adjusted basis. Information on the Group’s adjusted financial information is set out on pages 36 to 38.
Financial Highlights
Revenues — Revenues were £570.5m (2015/16: £447.5m), up 11% on a Constant Exchange Rate (“CER”) basis. At actual exchange rates revenues were up 27%, as a result of significant foreign exchange tailwinds from weaker sterling in 2016/17.
— Product sales delivered 14% organic growth at CER (19% CER growth including Galil Medical). Interventional Medicine delivered a strong performance, with 15% organic growth at CER (25% CER growth including Galil Medical). Specialty Pharmaceuticals also delivered good growth, up 12% at CER. At actual exchange rates product sales were up 37%.
Operating Profit — Adjusted operating profit was £129.6m (2015/16: £93.0m), up 13% at CER, driven by higher revenues coupled with continued effective cost management and targeted commercial investment in Interventional Medicine. Adjusted operating profit was up 39% at actual exchange rates.
— Adjusted operating margin increased by 2 percentage points to 23% (2015/16: 21%).
— On an IFRS basis, operating profit was £57.5m (2015/16: £56.5m), up 2% at actual exchange rates, as IFRS operating profit was impacted by the one-time charge of £28.0m on settlement of the US government investigation into the marketing of LC Bead®.
BTG plc Annual Report and Accounts 2017 BTG plc Annual Report and Accounts 2017
30Strategic Report
Group financial review

Earnings per Share (“EPS”) — Adjusted basic EPS was 23.1p (2015/16: 21.9p), up 5% at actual exchange rates, from higher operating profit offset by foreign exchange losses on forward contracts.
— On an IFRS basis, basic EPS was 8.7p (2015/16: 15.8p), down 45% at actual exchange rates, due to lower IFRS profit before tax.
Free cash flow — Free cash flow was £64.7m (2015/16: £88.1m). Free cash flow was down 27% due to the payment in 2016/17 of £28.0m to settle the US government investigation into the marketing of LC Bead®. Excluding the effect of this settlement, free cash flow was up 5% as the business continues to be highly cash generative.
— On an IFRS basis, cash flow from operating activities was £74.2m (2015/16: £95.6m), down 22%.
Financial Summary
Revenues2016/17
£m2015/16
£mGrowth
%Growth at
CER1
Interventional Oncology TheraSphere®/Beads 121.8 91.4 33 16GALIL™ 17.2 – n/a n/aTotal Interventional Oncology 139.0 91.4 52 32
Interventional Vascular EKOS® 64.0 45.4 41 22Varithena® 4.1 1.0 310 270Total Interventional Vascular 68.1 46.4 47 27
Interventional Pulmonology PneumRx® Coil 9.1 12.4 (27) (36)Total Interventional Medicine 216.2 150.2 44 25CroFab® 82.4 67.9 21 6DigiFab® 64.1 47.0 36 17Voraxaze® 21.1 16.6 27 15Vistogard®/other 3.5 1.6 119 94Total Specialty Pharmaceuticals 171.1 133.1 29 12
Total Product Sales 387.3 283.3 37 19Zytiga® 123.2 118.9 4 (10)Lemtrada™ 39.0 19.8 97 67Other 21.0 25.5 (18) (24)Total Licensing 183.2 164.2 12 (3)
Total revenue 570.5 447.5 27 11
1. For the methodology applied to calculate CER growth, refer to page 36.
BTG plc Annual Report and Accounts 2017
31Strategic Report
Strategic R
eport

RevenueRevenues were £570.5m (2015/16: £447.5m), up 11% on a CER basis. At actual exchange rates revenue were up 27%, as a result of significant foreign exchange tailwinds from weaker sterling in 2016/17.
Product sales delivered 14% organic growth at CER (19% CER growth including Galil Medical). At actual exchange rates product sales were up 37%.
Interventional MedicineInterventional Medicine revenues increased to £216.2m (2015/16: £150.2m), delivering 15% organic growth at CER (up 25% at CER including Galil Medical). Interventional Medicine now represents the Group’s largest and fastest-growing business unit.
Interventional Oncology revenues were £139.0m (2015/16: £91.4m), up 32% at CER, including sales from Galil Medical which was acquired in June 2016. The TheraSphere®/Beads portfolio of products grew 16% at CER, driven by continued expansion of TheraSphere® in the US and EU. Galil Medical revenues delivered 20% year on year growth on a pro forma basis, including sales for the period prior to BTG’s ownership.
Interventional Vascular revenues were £68.1m (2015/16: £46.4m), up 27% at CER.
Sales of the EKOS® blood clot treatment device were up 22% at CER. Strong growth has been delivered through increased penetration into US hospitals and use in the treatment of pulmonary embolism.
Sales of the varicose veins treatment Varithena® were £4.1m (2015/16: £1.0m), the growth reflecting targeted marketing and market access initiatives.
Interventional Pulmonology revenues were £9.1m (2015/16: £12.4m), down 36% at CER. Lower sales of the PneumRx® Coil treatment for severe emphysema were due to a lower number of procedures in Germany, the largest market. Resumption of growth is anticipated when appropriate patient selection criteria are established and as reimbursement coverage expands.
Specialty PharmaceuticalsSpecialty Pharmaceuticals revenues were £171.1m (2015/16: £133.1m) up 12% at CER. Growth was principally driven by single-digit price increases for the established products, strong re-orders of DigiFab®, and volume growth for the newer oncology products.
Sales of CroFab®, the snakebite antivenin, were up 6% at CER and the digoxin toxicity treatment DigiFab® was up 17% at CER.
Voraxaze®, for treating high-dose methotrexate toxicity, delivered 15% CER growth. Revenues from Vistogard® grew to £3.2m during its first full year of sales following US launch in 2015/16.
LicensingLicensing revenues were £183.2m (2015/16: £164.2m), down 3% at CER.
Royalties from Zytiga® were £123.2m (2015/16: £118.9m). Royalties from Lemtrada™ grew strongly to £39.0m (2015/16: £19.8m). The 2016/17 financial year represented the last full year of significant Lemtrada™ royalties, as the European patent expired in March 2017 and the US patent expires in September 2017.
Gross profitAdjusted gross profit was £391.6m (2015/16: £308.2m), at an adjusted gross margin of 69% (2015/16: 69%).
On an IFRS basis, gross profit was £390.6m (2015/16: £306.7m), at a gross margin of 68% (2015/16: 69%).
Interventional Medicine gross margin remained constant at 71% (2015/16: 71%). Interventional Medicine gross margin reflects the fixed manufacturing cost base for the early stage Varithena® and PneumRx® products, and is expected to increase over time as revenues from these products grow. Specialty Pharmaceuticals gross margin was 90% (2015/16: 89%). Licensing gross margin was 45% (2015/16: 50%) reflecting increased revenues from lower margin royalty streams in 2016/17.
SG&AAdjusted SG&A was £178.6m (2015/16: £141.4m), up 26% at actual exchange rates, the increase in part due to weaker sterling in 2016/17. On a CER basis adjusted SG&A was up 14%. The increase in adjusted SG&A reflects the inclusion of Galil Medical’s operating costs for the first time, representing five percentage points of the year on year increase, and continued targeted investment in Interventional Medicine commercial capabilities while continuing to effectively manage the cost base.
On an IFRS basis SG&A was £206.6m (2015/16: £141.4m). SG&A in 2016/17 included a one-time charge of £28.0m ($36m) relating to the settlement with the US government in relation to the investigation into the historic marketing of LC Bead®.
BTG plc Annual Report and Accounts 2017 BTG plc Annual Report and Accounts 2017
32Strategic Report
Group financial reviewcontinued
Research and developmentResearch and development was £87.8m (2015/16: £77.2m), up 14% at actual exchange rates, and in line with prior year on a CER basis.
2016/17 has seen good pipeline progress, including acceptance of the PMA submission for PneumRx® Coils in the US, and completion of enrolment for the OPTALYSE PE and ACCESS PTS studies. R&D investment was focused on the Interventional Medicine business, including the recently acquired Galil Medical programmes for lung and bone metastases and increased patient enrolment for the EPOCH and STOP-HCC TheraSphere® Phase III trials designed to support PMA applications in the US.
Operating profitAdjusted operating profit was £129.6m (2015/16: £93.0m), up 39% at actual exchange rates. On a CER basis, adjusted operating profit was up 13% driven by higher revenues coupled with continued effective cost management and targeted commercial investment in Interventional Medicine.
Adjusted operating margin increased by 2 percentage points to 23% (2015/16: 21%).
IFRS Operating Profit was £57.5m (2015/16: £56.5m), up 2% at actual exchange rates. This reflects higher acquired intangible asset amortisation of £42.0m (2015/16: £35.0m), principally due to intangible assets acquired with Galil Medical and the previously announced legal settlement that resulted in a one-time charge of £28.0m.
IFRS operating margin was 10% (2015/16: 13%).
Financial expense/incomeAdjusted net financial expense/income was an expense of £26.6m (2015/16: expense of £0.4m). Following the significant weakening of sterling in 2016/17 hedging losses of £25.2m (2015/16: gain of £1.2m) relating to foreign exchange forward contracts were recognised. These losses have offset the foreign exchange translation benefits realised at the operating profit level.
IFRS net financial expense was an expense of £25.9m (2015/16: net financial income of £1.0m). IFRS net financial expense includes a net credit of £0.7m relating to the change in fair value of contingent consideration liabilities (2015/16: net credit of £1.4m).
TaxationAdjusted effective tax rate was 14% (2015/16:10%). The adjusted effective rate is lower than the standard rate of UK corporate tax due to the patent box deduction on royalty income, the benefit of US R&D credits and the recognition of deferred tax assets for historic US losses and timing differences.
On an IFRS basis, there is a tax credit of £2.0m (2015/16: credit of £3.0m). The tax credit arises from deferred tax credits on the amortisation of acquired intangible assets at rates above the UK tax rate and the effect of the Department of Justice settlement which was only partially tax deductible.
Earnings per shareAdjusted basic EPS was 23.1p (2015/16: 21.9p), up 5% due to higher adjusted profit after tax of £88.7m (2015/16: £83.6m). Adjusted profit after tax was higher in 2016/17 due to growth in adjusted operating profit, partly offset by hedging losses on foreign exchange forward contracts.
IFRS basic EPS was 8.7p (2015/16: 15.8p), down 45% due to lower IFRS profit before tax. IFRS profit before tax was lower as the effect of hedging losses on forward contracts more than offset slightly higher IFRS operating profits.
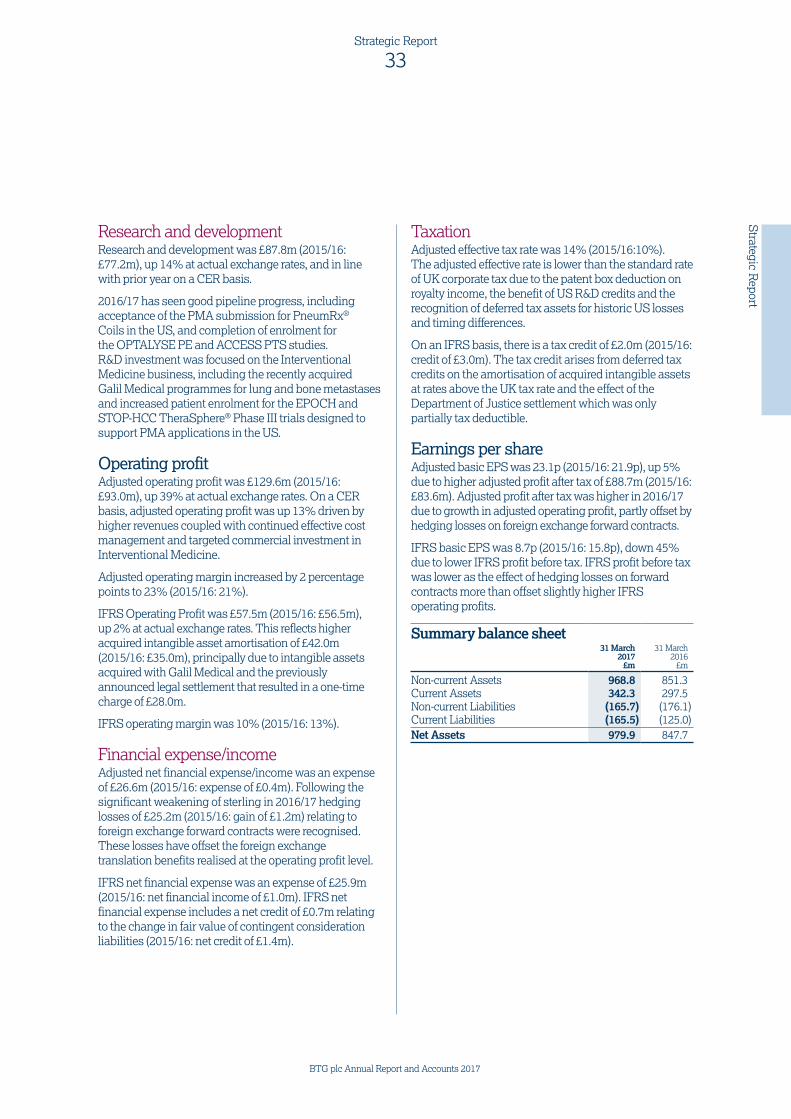
Summary balance sheet31 March
2017£m
31 March 2016
£m
Non-current Assets 968.8 851.3Current Assets 342.3 297.5Non-current Liabilities (165.7) (176.1)Current Liabilities (165.5) (125.0)Net Assets 979.9 847.7
BTG plc Annual Report and Accounts 2017
33Strategic Report
Strategic R
eport

Non-current assetsNon-current assets increased to £968.8m (31 March 2016: £851.3m), due to higher intangible assets of £678.9m (31 March 2016: £599.2m) and goodwill of £225.6m (31 March 2016: £187.9m). Intangible assets increased by £79.7m due to assets acquired with Galil Medical and foreign exchange translation, offset by intangible asset amortisation charges.
The Group’s defined benefit pension scheme net asset decreased slightly to £17.2m (31 March 2016: net asset of £19.3m), principally due to a reduction in the discount rate used to value the defined benefit obligation offset by actual returns on fund assets.
Current assetsCurrent assets increased to £342.3m (31 March 2016: £297.5m). Cash and cash equivalents were slightly higher at £155.5m (31 March 2016: £140.4m).
Inventory increased to £58.4m (31 March 2016: £46.5m) and receivables increased to £125.7m (31 March 2016: £106.5m) as a result of underlying business growth.
Non-current liabilitiesNon-current liabilities decreased to £165.7m (31 March 2016: £176.1m). Non-current liabilities were lower at 31 March 2017 due to the reclassification of contingent consideration liabilities relating to the PneumRx acquisition from non-current to current liabilities in the year. This decrease was partially offset by higher deferred tax liabilities following the acquisition of Galil Medical and the effects of foreign exchange translation.
Current liabilitiesCurrent liabilities increased to £165.5m (31 March 2016: £125.0m). Derivative financial instrument liabilities increased to £7.9m (31 March 2016: £3.0m) due to unrealised losses on forward foreign exchange contracts. Trade and other payables increased to £152.5m (31 March 2016: £116.2m) reflecting the underlying growth of the business and the classification of PneumRx, Inc. contingent consideration liabilities to current liabilities from non-current liabilities.
Included within current liabilities is a contingent consideration liability of £28.2m (31 March 2016: non-current liability of £27.2m) relating to a $60m milestone which may be payable to the former shareholders of PneumRx, Inc. if FDA approval for the PneumRx® Coils is received by 31 December 2017. This milestone is reflected at its current fair value, which reflects the probability of receiving FDA approval and the anticipated timing of any such approval.
While the Group remains confident of FDA approval, the event which would require payment of the milestone, receipt of FDA approval by 31 December 2017, will only be resolved in the 2017/18 year. If FDA approval is received by 31 December 2017, the Group will record a fair value charge of £19.8m to record the liability at its full value of $60m. Alternatively, if FDA approval is not received by 31 December 2017 the Group will credit the income statement with £28.2m to release in full this liability. Any such charge or credit will be reflected in IFRS earnings but not adjusted earnings, in line with the Group’s adjusted earnings policy.
Contingent liabilitiesBTG is in a current dispute with Wellstat over the commercialisation of Vistogard®. Wellstat are seeking damages and to terminate the commercialisation agreement under which BTG obtained rights to sell Vistogard® in the US. A trial has been heard in the Court of Chancery of the State of Delaware but no judgment has yet been issued. The Group estimate the likelihood of material financial loss or loss of rights to the asset to be possible, not probable, and therefore no liability has been recognised. It is currently not possible to make a reliable estimate of any amount that may be required to be paid in respect of the dispute.
BTG plc Annual Report and Accounts 2017 BTG plc Annual Report and Accounts 2017
34Strategic Report
Group financial reviewcontinued
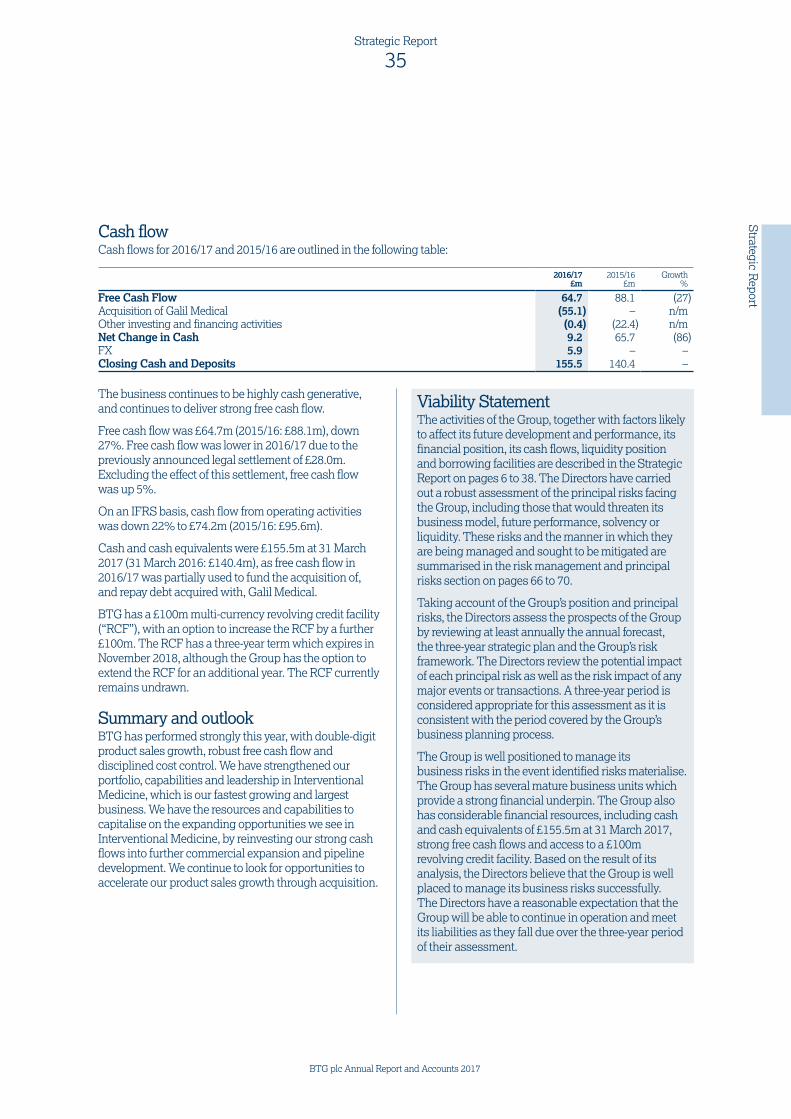
Viability StatementThe activities of the Group, together with factors likely to affect its future development and performance, its financial position, its cash flows, liquidity position and borrowing facilities are described in the Strategic Report on pages 6 to 38. The Directors have carried out a robust assessment of the principal risks facing the Group, including those that would threaten its business model, future performance, solvency or liquidity. These risks and the manner in which they are being managed and sought to be mitigated are summarised in the risk management and principal risks section on pages 66 to 70.
Taking account of the Group’s position and principal risks, the Directors assess the prospects of the Group by reviewing at least annually the annual forecast, the three-year strategic plan and the Group’s risk framework. The Directors review the potential impact of each principal risk as well as the risk impact of any major events or transactions. A three-year period is considered appropriate for this assessment as it is consistent with the period covered by the Group’s business planning process.
The Group is well positioned to manage its business risks in the event identified risks materialise. The Group has several mature business units which provide a strong financial underpin. The Group also has considerable financial resources, including cash and cash equivalents of £155.5m at 31 March 2017, strong free cash flows and access to a £100m revolving credit facility. Based on the result of its analysis, the Directors believe that the Group is well placed to manage its business risks successfully. The Directors have a reasonable expectation that the Group will be able to continue in operation and meet its liabilities as they fall due over the three-year period of their assessment.
Cash flow Cash flows for 2016/17 and 2015/16 are outlined in the following table:
2016/17£m
2015/16£m
Growth%
Free Cash Flow 64.7 88.1 (27)Acquisition of Galil Medical (55.1) – n/mOther investing and financing activities (0.4) (22.4) n/mNet Change in Cash 9.2 65.7 (86)FX 5.9 – –Closing Cash and Deposits 155.5 140.4 –
The business continues to be highly cash generative, and continues to deliver strong free cash flow.
Free cash flow was £64.7m (2015/16: £88.1m), down 27%. Free cash flow was lower in 2016/17 due to the previously announced legal settlement of £28.0m. Excluding the effect of this settlement, free cash flow was up 5%.
On an IFRS basis, cash flow from operating activities was down 22% to £74.2m (2015/16: £95.6m).
Cash and cash equivalents were £155.5m at 31 March 2017 (31 March 2016: £140.4m), as free cash flow in 2016/17 was partially used to fund the acquisition of, and repay debt acquired with, Galil Medical.
BTG has a £100m multi-currency revolving credit facility (“RCF”), with an option to increase the RCF by a further £100m. The RCF has a three-year term which expires in November 2018, although the Group has the option to extend the RCF for an additional year. The RCF currently remains undrawn.
Summary and outlookBTG has performed strongly this year, with double-digit product sales growth, robust free cash flow and disciplined cost control. We have strengthened our portfolio, capabilities and leadership in Interventional Medicine, which is our fastest growing and largest business. We have the resources and capabilities to capitalise on the expanding opportunities we see in Interventional Medicine, by reinvesting our strong cash flows into further commercial expansion and pipeline development. We continue to look for opportunities to accelerate our product sales growth through acquisition.
BTG plc Annual Report and Accounts 2017
35Strategic Report
Strategic R
eport
Information on adjusted financial informationThe financial review includes financial information prepared in accordance with International Financial Reporting Standards and the Group’s accounting policies, as well as financial information presented on an adjusted basis.
Financial information on an adjusted basis excludes certain cash and non-cash items which management believe are not reflective of the underlying financial performance of the business and is consistent with how management reviews the business for the purpose of making operating decisions.
Metrics presented on an adjusted basis includes Constant Exchange Rate (CER) growth, Adjusted Gross Profit, Adjusted SG&A, Contribution, Adjusted Operating Profit, Adjusted Net Financial Income/Expense, Adjusted Effective Tax Rate, Adjusted Basic EPS and Free cash flow. A reconciliation between IFRS and adjusted financial information is included on page 37 and 38 of this report.
These metrics are further discussed below;
— CER growth: CER growth is calculated by restating 2016/17 performance using 2015/16 exchange rates for the relevant period. CER growth allows management to focus on underlying performance without the impact of foreign exchange, which it cannot control.
— Adjusted Operating Profit: Adjusted operating profit reflects the IFRS operating profit of the Group excluding the impact of certain adjustments, which have been separately outlined below. Adjusted operating profit allows management to assess operational performance without the impact of certain items which are not reflective of underlying financial performance.
— Adjusted Basic EPS: Adjusted Basic EPS reflects Basic EPS excluding the after tax impact of certain adjustments, which have been outlined below. Adjusted Basic EPS allows management to assess EPS without the impact of certain items which are not reflective of underlying financial performance.
— Free Cash Flow: Reflects the cash generated from operating activities after recurring capital expenditure, being a measure of cash flow available for discretionary investing or financing activities. The reconciliation of free cash flow to net cash flows from operating activities is show on page 38.
— Contribution: Contribution is defined as gross profit less SG&A, which broadly reflects the cash generated by the Group’s reportable segments before investment in R&D or other investing or financing activities. Management use this metric to assess performance for each of its reportable segments and reviews the metric both including and excluding the impact of certain adjustments outlined below.
Adjusted gross profit, Adjusted SG&A, Adjusted Finance Income/Expense and Adjusted effective tax rate are stated after excluding the effect of those items outlined below.
Management apply a consistent policy in determining its adjusted financial measures. In determining this policy, outlined below, management assess the nature and materiality of individual or groups of items, and have deemed it appropriate to adjust for those items including their tax effect, which (i) occur outside the normal course of business and (ii) relate to corporate acquisitions. These adjustments allow better comparability with historic performance and identify year on year trends in the underlying performance of the business.
Items excluded from adjusted financial measures in 2015/16, 2016/17 and from our guidance for 2017/18 are:
(a) Acquisition related adjustments
— The release of the fair value uplift of acquired inventory or PP&E.
— Amortisation and impairment charges relating to acquired intangible assets or goodwill.
— Fair value adjustments relating to contingent consideration liabilities.
— Transaction costs incurred in relation to corporate acquisitions.
— Reorganisation costs, including acquisition related redundancy programmes, property costs, and asset impairments.
(b) Net costs relating to the settlement of litigation, disputes and government investigations.
BTG plc Annual Report and Accounts 2017 BTG plc Annual Report and Accounts 2017
36Strategic Report
Group financial reviewcontinued

Reconciliation between IFRS and Adjusted financial information – Consolidated Income Statement
For the year ended 31 March 2017
IFRSTotal
£m
Release of the fair
value uplifton acquired
inventory and PPE1
£m
Amortisationof acquiredintangible
assets2
£m
Acquisition andreorganisation
costs3
£m
Fair valueadjustments
to contingent consideration
liabilities4
£m
Litigation and other5
£m
AdjustedTotal
£m
Revenue 570.5 570.5Cost of sales (179.9) 1.0 – – – – (178.9)Gross profit 390.6 1.0 – – – – 391.6Selling, general and administrative expenses (206.6) – – – – 28.0 (178.6)Research and development (87.8) – – – – – (87.8)Other operating income 4.4 – – – – – 4.4Amortisation of acquired intangible assets (42.0) – 42.0 – – – –Acquisition and reorganisation costs (1.1) – – 1.1 – – –Operating profit 57.5 1.0 42.0 1.1 – 28.0 129.6Financial income 3.3 – – – (3.0) – 0.3Financial expense (29.2) – – – 2.3 – (26.9)Profit before tax 31.6 1.0 42.0 1.1 (0.7) 28.0 103.0Tax credit/(charge) 2.0 (0.3) (13.1) – – (2.9) (14.3)Profit after tax 33.6 0.7 28.9 1.1 (0.7) 25.1 88.7
Weighted average number of shares – basic 384.4 384.4Weighted average number of shares – diluted 390.0 390.0
Basic earnings per share 8.7p 0.2p 7.6p 0.3p (0.2p) 6.5p 23.1pDiluted earnings per share 8.6p 0.2p 7.4p 0.3p (0.2p) 6.4p 22.7p
1. The release of the fair value uplift relating to inventory and property, plant and equipment (PPE) acquired with Galil Medical in June 2016 of £1.0m.
2. Amortisation charges relating to intangible assets acquired through corporate acquisitions of £42.0m. 3. Acquisition and reorganisation costs are directly attributable costs related to the acquisition of Galil Medical in June 2016, including
costs incurred with professional advisers in relation to the corporate acquisition of £1.1m.4. Fair value adjustments to contingent consideration liabilities relating to the PneumRx acquisition (credit of £3.0m) and the Galil Medical
acquisition (charge of £2.3m).5. Settlement with the US government in relation to the Department of Justice’s investigation of the historic marketing of LC Beads of £28.0m.
BTG plc Annual Report and Accounts 2017
37Strategic Report
Strategic R
eport

For the year ended 31 March 2016
IFRSTotal
£m
Release of the fair
value uplifton acquired
inventory1 £m
Amortisationof acquiredintangible
assets2
£m
Fair valueadjustments
to contingentliabilities
consideration3
£m
AdjustedTotal
£m
Revenue 447.5 – – – 447.5Cost of sales (140.8) 1.5 – – (139.3)Gross profit 306.7 1.5 – – 308.2Selling, general and administrative expenses (141.4) – – – (141.4)Research and development (77.2) – – – (77.2)Other operating income 3.4 – – – 3.4Amortisation of acquired intangible assets (35.0) – 35.0 – –Operating profit 56.5 1.5 35.0 – 93.0Financial income 4.4 – – (3.0) 1.4Financial expense (3.4) – – 1.6 (1.8)Profit before tax 57.5 1.5 35.0 (1.4) 92.6Tax credit/(charge) 3.0 (0.6) (11.4) – (9.0)Profit after tax 60.5 0.9 23.6 (1.4) 83.6
Weighted average number of shares – basic 382.6 382.6Weighted average number of shares – diluted 388.3 388.3
Basic earnings per share 15.8p 0.2p 6.3p (0.4p) 21.9pDiluted earnings per share 15.6p 0.2p 6.1p (0.4p) 21.5p
1. The release of the fair value uplift relating to inventory acquired with PneumRx in January 2015 of £1.5m. 2. Amortisation charges relating to intangible assets acquired through corporate acquisitions of £35.0m. 3. Fair value adjustments to contingent consideration; includes the change in fair value of contingent consideration liabilities relating
to the PneumRx acquisition (net credit of £3.0m), and EKOS acquisition (charge of £1.6m).
Reconciliation between IFRS and Adjusted financial information – Free Cash FlowFor the year ended 31 March 2017
Net cash inflow from operating activities£m
Purchase of intangible assets£m
Purchase of property, plant and equipment£m
Free cash Flow£m
74.2 (0.6) (8.9) 64.7
For the year ended 31 March 2016
Net cash inflow from operating activities£m
Purchase of intangible assets1 £m
Purchase of property, plant and equipment£m
Free cash Flow£m
95.6 (1.3) (6.2) 88.1
1. Purchase of intangible assets for the period ended 31 March 2016 excludes the purchase of the residual financial interest of the originator of Varithena® foam sclerotherapy technology for a one-off cash payment of £23.0m, as this does not represent recurring capital expenditure for the Group.
BTG plc Annual Report and Accounts 2017 BTG plc Annual Report and Accounts 2017
38Strategic Report
Group financial reviewcontinued

Governance
Contents40 Corporate Governance report 40 Letter from the Chairman 42 Board of Directors 45 Leadership 54 Effectiveness 57 Accountability
(including Audit Committee report and risk)
71 Relations with shareholders72 Remuneration98 Directors’ report102 Statement of directors’
responsibilities in respect of the Annual Report 2017 and the financial statements
BTG plc Annual Report and Accounts 2017
39Governance
Governance
Governance

Garry WattsChairman
The Company’s strategy is underpinned by a strong
corporate governance framework, which together
with ethical leadership, establishes the foundation
for how we operate and is strongly embedded
within the culture of the business at all levels.
Dear shareholderThe Board is ultimately accountable for ensuring that high standards of governance are maintained in all we do. We are committed to that objective, taking pride in the way that we conduct our business and deliver our strategy. Our governance structure is fundamental to this and enables us to manage business risks while developing the Group and delivering value for all our stakeholders.
The Company’s strategy is underpinned by a strong corporate governance framework, which together with ethical leadership, establishes the foundation for how we operate and is strongly embedded within the culture of the business at all levels. The high standards of behaviour and ways of working required by ourselves and our employees are guided by our Code of Conduct, which is underpinned by the BTG “DNA”, simply put, this is about doing what is in the best interests of the Group at all times and striving to live up to our values in everything that we do.
Governance in 2016/17During the year we strengthened governance by conducting a comprehensive review of the specific matters required to be considered by the Board and its primary committees, as well as the major policies underpinning business operations. There has been continuing work to evolve and further enhance our risk management framework and embed it in both the operational and strategic activity of the business. A specific example of that has been the focus on our response to cyber security threats. As a result of this continuing improvement, I believe we enter the new financial year with an even stronger governance framework overall.
BTG plc Annual Report and Accounts 2017 BTG plc Annual Report and Accounts 2017
40Governance
Corporate Governance reportLetter from the Chairman

As Chairman, I am responsible for ensuring the Board operates effectively. I am supported by all the directors but particularly by Giles Kerr, the Senior Independent Director, who meets independently with the other directors and is available to meet with the Company’s major shareholders if required.
Board changes and succession planningAs reported last year, the Board undertook a process to appoint a successor to Giles Kerr in the role of Audit Committee Chair. As a result I was pleased to welcome Graham Hetherington who joined as non-executive director and Audit Committee Chair on 1 August 2016 and was subsequently appointed to the Remuneration Committee. Further description of the process to appoint Graham can be found on page 51.
As we wish to continually assess the appropriate composition of the Board, an external review was carried out during the year to consider whether the Board contained the right balance of skills and diversity of experience required to meet the future strategic requirements of the business. Details of the review can be found in the Nomination Committee’s report on pages 51 to 53. This will remain an area of focus for the Board for the coming year.
Reflecting on our recent internal performance evaluation, it is pleasing to note that the Board and its principal committees have, individually and collectively, worked effectively to discharge their responsibilities and support the ongoing development of the Group. More information on the Board evaluation can be found on pages 54 and 55.
Governance FrameworkThe Corporate Governance Report, the Directors’ Remuneration Report and the Directors’ Report have been prepared to provide shareholders with a comprehensive understanding of how the Board and its committees operate and how we meet the requirements of the UK Corporate Governance Code (the Code) and other guidance.
Our Corporate Governance Report can be found on pages 40 to 71 and includes our statement of compliance with the Code and its principles on page 44. The Directors’ Remuneration Report can be found on pages 72 to 97.
With the Board, I look forward to discussing BTG’s progress with you at our forthcoming AGM on 13 July 2017.
Garry WattsChairman
BTG plc Annual Report and Accounts 2017
41Governance
Governance
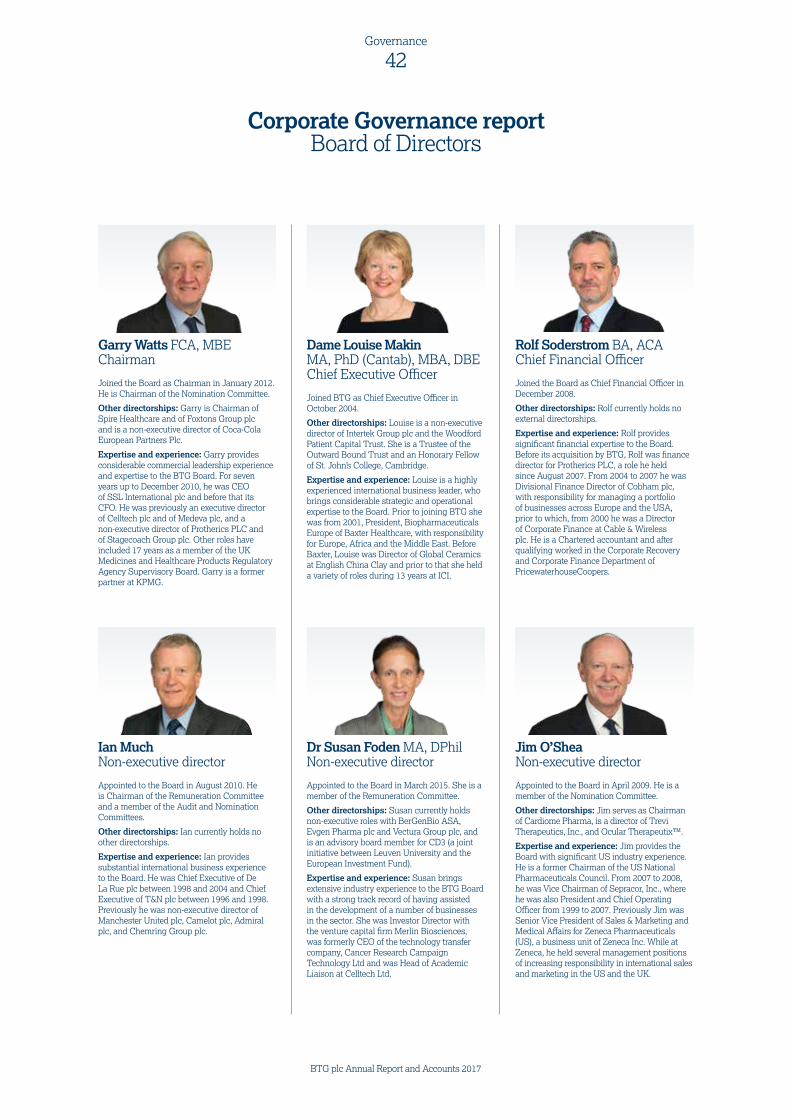
Garry Watts FCA, MBEChairman
Joined the Board as Chairman in January 2012. He is Chairman of the Nomination Committee.
Other directorships: Garry is Chairman of Spire Healthcare and of Foxtons Group plc and is a non-executive director of Coca-Cola European Partners Plc.
Expertise and experience: Garry provides considerable commercial leadership experience and expertise to the BTG Board. For seven years up to December 2010, he was CEO of SSL International plc and before that its CFO. He was previously an executive director of Celltech plc and of Medeva plc, and a non-executive director of Protherics PLC and of Stagecoach Group plc. Other roles have included 17 years as a member of the UK Medicines and Healthcare Products Regulatory Agency Supervisory Board. Garry is a former partner at KPMG.
Ian Much Non-executive director
Appointed to the Board in August 2010. He is Chairman of the Remuneration Committee and a member of the Audit and Nomination Committees.
Other directorships: Ian currently holds no other directorships.
Expertise and experience: Ian provides substantial international business experience to the Board. He was Chief Executive of De La Rue plc between 1998 and 2004 and Chief Executive of T&N plc between 1996 and 1998. Previously he was non-executive director of Manchester United plc, Camelot plc, Admiral plc, and Chemring Group plc.
Dame Louise Makin MA, PhD (Cantab), MBA, DBEChief Executive Officer
Joined BTG as Chief Executive Officer in October 2004.
Other directorships: Louise is a non-executive director of Intertek Group plc and the Woodford Patient Capital Trust. She is a Trustee of the Outward Bound Trust and an Honorary Fellow of St. John’s College, Cambridge.
Expertise and experience: Louise is a highly experienced international business leader, who brings considerable strategic and operational expertise to the Board. Prior to joining BTG she was from 2001, President, Biopharmaceuticals Europe of Baxter Healthcare, with responsibility for Europe, Africa and the Middle East. Before Baxter, Louise was Director of Global Ceramics at English China Clay and prior to that she held a variety of roles during 13 years at ICI.
Dr Susan Foden MA, DPhilNon-executive director
Appointed to the Board in March 2015. She is a member of the Remuneration Committee.
Other directorships: Susan currently holds non-executive roles with BerGenBio ASA, Evgen Pharma plc and Vectura Group plc, and is an advisory board member for CD3 (a joint initiative between Leuven University and the European Investment Fund).
Expertise and experience: Susan brings extensive industry experience to the BTG Board with a strong track record of having assisted in the development of a number of businesses in the sector. She was Investor Director with the venture capital firm Merlin Biosciences, was formerly CEO of the technology transfer company, Cancer Research Campaign Technology Ltd and was Head of Academic Liaison at Celltech Ltd.
Rolf Soderstrom BA, ACAChief Financial Officer
Joined the Board as Chief Financial Officer in December 2008.
Other directorships: Rolf currently holds no external directorships.
Expertise and experience: Rolf provides significant financial expertise to the Board. Before its acquisition by BTG, Rolf was finance director for Protherics PLC, a role he held since August 2007. From 2004 to 2007 he was Divisional Finance Director of Cobham plc, with responsibility for managing a portfolio of businesses across Europe and the USA, prior to which, from 2000 he was a Director of Corporate Finance at Cable & Wireless plc. He is a Chartered accountant and after qualifying worked in the Corporate Recovery and Corporate Finance Department of PricewaterhouseCoopers.
Jim O’SheaNon-executive director
Appointed to the Board in April 2009. He is a member of the Nomination Committee.
Other directorships: Jim serves as Chairman of Cardiome Pharma, is a director of Trevi Therapeutics, Inc., and Ocular Therapeutix™.
Expertise and experience: Jim provides the Board with significant US industry experience. He is a former Chairman of the US National Pharmaceuticals Council. From 2007 to 2008, he was Vice Chairman of Sepracor, Inc., where he was also President and Chief Operating Officer from 1999 to 2007. Previously Jim was Senior Vice President of Sales & Marketing and Medical Affairs for Zeneca Pharmaceuticals (US), a business unit of Zeneca Inc. While at Zeneca, he held several management positions of increasing responsibility in international sales and marketing in the US and the UK.
BTG plc Annual Report and Accounts 2017BTG plc Annual Report and Accounts 2017 BTG plc Annual Report and Accounts 2017
42Governance
Corporate Governance reportBoard of Directors

Gender Diversity(%)
a
b
a Male 78% b Female 22%
Balance of directors
a
bc
a Chairman 1 b Executive directors 2c Non-executives 6
Tenure of non-executive directors and Chairman(as at 31 March 2017)
a
b
c
d
a More than 6 years 3 b 4-6 years 2c 2-4 years 1d 0-2 years 1
Giles Kerr FCANon-executive director
Appointed to the Board in October 2007. He is the Company’s Senior Independent Director and a member of the Audit, Nomination and Remuneration Committees.
Other directorships: Giles is Director of Finance with the University of Oxford, UK. He is also a director of Oxford University Innovation Ltd, Senior plc, PayPoint plc, and Adaptimmune Therapeutics plc.
Expertise and experience: Giles provides important relevant industry and financial experience to the BTG Board. He was previously the Group Finance Director and Chief Financial Officer of Amersham plc, acquired by GE Healthcare in 2004, and previously served as director of Victrex plc. Prior to his role at Amersham, he was a partner with Arthur Andersen in the UK. He was Chairman of the Company’s Audit Committee until the appointment of Graham Hetherington.
Richard WohankaNon-executive director
Appointed to the Board in January 2013. He is a member of the Audit Committee.
Other directorships: Richard is a board member of Lloyds Banking Group Insurance (Scottish Widows), Julius Baer International Limited and Chairman of the Nuclear Liabilities Fund and of Old Mutual Global Investors.
Expertise and experience: Richard provides substantial expertise to the BTG Board in the field of business and finance, with more than 20 years’ experience in building asset management businesses. He was CEO of Union Bancaire Privée Asset Management between October 2009 and June 2012, and from 2001 to 2009 he was CEO of Fortis Investment Management.
Graham Hetherington FCMA Non-executive director
Appointed to the Board in August 2016. He is Chairman of the Audit Committee and a member of the Remuneration Committee.
Other directorships: Graham currently holds no other directorships.
Expertise and experience: Graham brings substantial financial and industry experience to the Board. Prior to joining BTG he was Chief Financial Officer of Shire plc, a role he held from June 2008 to February 2014. Previously he held the same positions at Bacardi in 2007 and at Allied Domecq PLC from 1999 to 2005. Graham has a broad knowledge of international finance management and planning, including M&A, audit and risk management and is a Fellow of the Chartered Institute of Management Accountants.
Company Secretary
Dr Paul MussendenGeneral Counsel, Head of Strategic Affairs & Company Secretary
Appointed as Company Secretary in March 2010.
Other directorships: Paul is a non-executive director and trustee of Medical Research Council Technologies Ltd.
Expertise and experience: Paul supports the Board with more than 20 years of advisory experience in the healthcare industry. As a member of BTG’s Leadership Team he is accountable for management of the Legal, Regulatory, Intellectual Property, Global Market Access, Healthcare Compliance and Risk Management functions. Paul is a solicitor and has a BSc(Hons) in Biotechnology and a PhD in molecular biology and microbial physiology.
BTG plc Annual Report and Accounts 2017BTG plc Annual Report and Accounts 2017
43Governance
Governance
Compliance with the UK Corporate Governance Code (the Code)BTG’s governance structure is based on the principles of the Code published by the Financial Reporting Council (FRC) and available from www.frc.org.uk.
The Code contains broad principles and specific provisions that set out standards of good practice. Our Corporate Governance Report, which includes reports from the Nomination and Audit Committees and the Directors’ Remuneration Report, is structured to report against these key areas and sets out how we have applied the Code’s main principles and complied with its provisions.
Statement of Compliance with the provisions of the CodeThe Board considers that the Group has complied fully with the Code throughout the year ended 31 March 2017. With regard to provision C.3.7, the Group has begun a process for the tender of audit services and further details are provided on page 62 of the Audit Committee Report. After careful consideration of the applicable regulations regarding audit firm rotation and the performance and independence of the current auditor KPMG LLP, the Board recommends their reappointment.
The Group has also sought to adopt the new provisions of the April 2016 edition of the Code (applicable to the Company’s 2017/18 financial year onwards) where practicable. We have also been mindful to consider how we comply with not only the principles of the Code but also the spirit.
KPMG is required to review certain elements of the corporate governance statement and to report if those disclosures do not reflect the Company’s compliance (and the Company has not instead explained why it has not complied) with the provisions of the Code specified for the auditor’s review by the Listing Rules of the Financial Conduct Authority (FCA).
Corporate Governance Report
BTG plc Annual Report and Accounts 2017 BTG plc Annual Report and Accounts 2017
44Governance

Internal Audit — Testing of the effectiveness of the
internal control systems. — Supporting the risk management
and compliance functions with appropriate audits.
The Leadership Team — Chaired by the CEO. — Members include the CFO
and senior management from different areas of the business and functions.
— Responsible for the day-to-day running of Group operations and making recommendations to the Board on strategy and subsequent implementation.
— Ensures the capabilities are in place to deliver on strategy and annual objectives.
— Ensures the internal controls in place to assess and manage risk are fully complied with. This includes responsibility for maintaining a system to ensure that the Group is compliant with all applicable healthcare laws and regulations.
Disclosure Committee — Responsible for ensuring the
Company’s compliance with applicable transparency and disclosure obligations under the Market Abuse Regulation (MAR) including those related to the management of price sensitive information.
Remuneration Committee — Determines executive director
remuneration and oversees that for senior management.
— Ensures the Remuneration policy supports the strategy by attracting, developing, motivating and retaining people of the appropriate calibre.
Page 72, to read more
Audit Committee — Assists the Board on oversight of
financial results, internal control and management of risk and compliance and maintaining an appropriate relationship with the external auditor and internal audit function.
Page 57, to read more
Nomination Committee — Considers the structure, size and
composition of the Board and its committees to ensure inclusion of appropriate experience, diversity and expertise.
— Oversees talent management and succession planning for senior roles.
Page 51, to read more
The role of the Board and its committees
Treasury Committee — Primary responsibility is to monitor the
Group’s treasury activities, including cash management, foreign exchange management and financing. The Committee also ensures compliance with the Group’s treasury policy.
Risk Committee — Responsible for monitoring risks
throughout the organisation and assessing the risk control and mitigation measures implemented by the Group.
— Conducting work to support the assessment of the Viability Statement by the Board.
— Ensuring operations are undertaken within the risk appetite defined by the Board.
— Assisting with the evaluation of external macro risks that may impact the Group.
— Assisting with the integration of risk management and strategy development.
The Board — Responsible for the overall leadership
of the business, its culture, values and standards.
— Has a schedule of matters reserved specifically for its decision or approval.
— Determines governance, strategy and risk appetite.
— Responsible for ensuring adequate organisational capabilities and capacity.
Portfolio Review Board and R&D Leadership Team — Ensures BTG is investing in its assets efficiently and in relation to opportunities with well-
targeted business cases where the value to the customer and to BTG is clearly understood. — Oversees the definition of activities and priorities of the R&D Leadership Team.
The R&D Leadership Team provides strategic and operational leadership of R&D activities, harnessing our combined knowledge and resources, to deliver a balanced pipeline of innovative therapies aligned with BTG business priorities.
Operational Leadership Team — Responsible for ensuring that the manufacturing and supply chain are tightly controlled and their
operations are optimised, as far as practicable, meeting all applicable regulatory requirements.
Performance Management Review — Monthly meeting of the Leadership Team and senior staff to review progress against business
plans and targets, both financial and operational (includes business unit risk assessments).
Global Quality Leadership Team — Reviews progress with overall Quality Strategy and objectives, this includes inspection
readiness, Quality Management System effectiveness and enhancements, product delivery on time and to required quality, safety and efficacy.
— Ensures continued regulatory compliance.
Business Unit Leadership Teams — Each business segment has an established leadership team comprising commercial and
functional capabilities. They are responsible for managing the day-to-day operations of each specific business.
Corporate Responsibility Committee — Provides guidance and leadership in regards to social, environmental and governance issues of most relevance to BTG to ensure the Group maintains appropriate standards in this area .
BTG plc Annual Report and Accounts 2017
45Governance
Governance
Corporate Governance reportLeadership

Matters reserved for the Board and delegated authoritiesThere is clear division of responsibilities between the running of the Board and the running of the Company’s business and the Board has certain reserved matters for its approval. Other matters and authorities have been delegated to its primary committees and other management committees detailed on page 45. A thorough review of the Board’s reserved matters and those authorities delegated below primary committee level was conducted during the year and amendments were made, as appropriate, to ensure they remain relevant, are in line with best practice and scalable going forward as the Group grows. An example of this being that the Treasury Committee has introduced graded credit limits for banking counterparties to better reflect counterparty credit and the increasing of these limits.
The matters reserved for the Board and the terms of reference for each of the Board’s primary committees, which are reviewed annually, can be found on the Group’s website at www.btgplc.com.
The Board of DirectorsThere are standing annual agenda schedules setting out core activities for the Board and its primary committees. A thorough review of these schedules has been conducted that help structure the meeting agendas for the coming year. Additional meetings are held as required to respond to important issues as they arise.
While, as a unitary Board, the executive and non-executive directors are collectively responsible for the success of the Group and have fiduciary duties to shareholders, their roles are strictly delineated. The roles of the Chairman and Chief Executive are separate and distinct and the division of their responsibilities is clear. The executive directors have direct responsibility for the business operations of the Group, while the non-executive directors are responsible for bringing independent and objective judgement to Board decisions.
BTG plc Annual Report and Accounts 2017 BTG plc Annual Report and Accounts 2017
46Governance
Corporate Governance reportLeadership continued

ChairmanGarry WattsChairman since joining the Board on 1 January 2012Responsible for leading the Board, creating conditions for overall Board and individual director effectiveness, promoting constructive debate and for ensuring:
— A robust decision-making process is in place based on all appropriate information being provided to the Board in a timely manner. Ensure clear decisions are made, communicated and effected.
— The Board gives adequate time to the right issues, such as its role in shaping strategy and ensuring adequate organisational capabilities and capacity.
— The Board environment is productive and the Board and its committees have appropriate composition and diversity, experience and expertise with regard to the Company’s evolving needs.
— Board committees are properly structured.
— The Board discharges its responsibilities with respect to risk management and governance generally.
— Necessary relationships of mutual respect and open communication are fostered between executive directors and non-executive directors. Providing support and advice while respecting the executive responsibility.
— Effective communication with shareholders and other stakeholders.
— Appropriate oversight of business performance.
Executive DirectorsLouise Makin (CEO)Rolf Soderstrom (CFO)Louise Makin is primarily responsible for the running of the Group and for executing strategy in line with the risk appetite defined by the Board and Company values. Louise maintains a close working relationship with the Chairman.
Rolf Soderstrom is responsible for all financial reporting, tax and financial control aspects of the Group, providing support to Louise and the wider activities of the Group as required.
In addition they are both responsible for:
— Communicating to the Board their views on business issues to improve the standard of Board discussion and, prior to final decision on an issue, explaining in a balanced way, any divergence of views in the executive team.
— Driving the strategy formulation process to enable an effective and evidence-based approach and to ensure that the Board is well informed about all aspects of the business and its operation which bear on its strategy.
— Delivering high-quality information to the Board to enable it to monitor the performance of the whole business including the management of risk, and to make critical decisions.
The Senior Independent Director (SID)Giles KerrIn the role since July 2008Principally to support the Chairman in his role and to work with him and other directors to resolve any significant issues that may arise. Other responsibilities are:
— Supporting the Chairman’s delivery of objectives, and leading his evaluation.
— Leading the non-executive directors in the oversight of the Chairman and ensuring there is a clear division of responsibility between the Chairman and CEO.
— Being available to shareholders to express concerns that the normal channels have failed to resolve or that would be inappropriate.
Independent Non-executive directorsBring an external perspective and wide-ranging skills and experience for the Board to draw on. They provide independent judgement, support and constructively challenge matters such as Company performance, strategy and risk management.
General Counsel and Company SecretaryPaul MussendenProvides advice and assistance to the Board, particularly in relation to corporate governance practices and development. Ensures that Board procedures are complied with, applicable rules are followed and good information flow exists to the Board and its committees. He also facilitates the induction and ongoing training of directors.
Paul provides guidance to the Board to ensure the Group meets its legal and regulatory obligations and that risk management discussions are underpinned by robust process.
Effective division of Board responsibilities
BTG plc Annual Report and Accounts 2017
47Governance
Governance

Governance and shareholders — Discussed the outcome of the Board
and committees’ evaluations and set objectives for the coming year.
— Regularly reviewed feedback from institutional investors.
— Updated the terms of reference for the Nomination, Audit and Remuneration Committees and Matters Reserved for Board approval.
— Annual General Meeting. — Discussed the Market Abuse Regulation
(MAR) that came into force in 2016 and approved amended Disclosure Committee Terms of Reference and procedures in light of MAR.
Board Activity during the year:
Internal control and risk — Regular review of the risk management
system; deep dives into specific areas, including cyber risk and third-party distributors. Review of principal risks, potential impact and support for the Viability Statement. Participation of representative Board members in the Risk Committee meetings.
— Review of reports from the Audit Committee (including summary of Internal Audit and Compliance reports).
The Board
Leadership and people — Discussed the composition of the Board
and its committees, including succession planning. Undertaking of internal Board and committee evaluations and an external evaluation of Board skills and expertise.
— Approved the appointment of Graham Hetherington to the Board and as Chair of the Audit Committee.
— Regular review of the capabilities deemed necessary for the delivery of the future strategy.
Strategy — Annual strategy awayday including
presentations from each of the business units.
— Ongoing assessment of M&A opportunities including the acquisition of Galil Medical.
— Ongoing assessment of R&D portfolio. — Consideration of geopolitical
developments, including Brexit and US healthcare impact.
Business performance — Oversight of the financial and operational
performance of the business. — Approved the 2017/18 budget and
three-year plan. — Reviewed the half-year and annual
results, announcements and analyst presentations.
— Approved the Annual Report and Accounts.
— Approved resolution of material litigation including settlement of the investigation by the US Department of Justice with respect to LC Bead®.
BTG plc Annual Report and Accounts 2017 BTG plc Annual Report and Accounts 2017
48Governance
Corporate Governance reportLeadership continued

Attendance by individual directors at Board and Committee meetings during 2016/17Board & committee composition & attendance
Committee memberships Independent
Board meetings
NominationCommittee
Audit Committee
Remuneration Committee
Total number of meetings held 7 3 4 6Number of meetings attendedExecutive DirectorsLouise Makin (CEO) None No 7/7 – – –Rolf Soderstrom (CFO) None No 6/7 – – –Non-Executive DirectorsGarry Watts Nom2 N/A1 7/7 3/3 – –Susan Foden Rem Yes 7/7 – – 5/6Graham Hetherington3 Aud2, Rem Yes 5/5 – 3/3 4/4Giles Kerr4 Aud2, Rem, Nom Yes 6/7 1/3 3/4 5/6Ian Much Aud, Rem2, Nom Yes 7/7 2/3 4/4 6/6Jim O’Shea Nom Yes 7/7 3/3 – –Richard Wohanka Aud Yes 6/7 – 3/4 –
1. Garry Watts is excluded from the determination of independence by virtue of his role as Chairman of the Group.2. Committee Chairman.3. Graham Hetherington joined the Board on 1 August 2016 and became Audit Chairman from that date. He became a member of the
Remuneration Committee with effect from 29 September 2016.4. Giles Kerr stood down as Chairman of the Audit Committee with effect from 1 August 2016.
Notes Rolf Soderstrom was unable to attend the December Board meeting due to illness. Susan Foden was unable to attend the November Remuneration Committee meeting due to travel issues. Giles Kerr was unable to attend the March meetings due to illness.Richard Wohanka was unable to attend the Audit Committee meeting in May 2016 and the Board meeting in March 2017 due to unavoidable pre-arranged engagements. Directors did not attend Nomination Committee meetings where consideration of their appointments were the sole agenda item.
The external auditor attends the Audit Committee meetings and the remuneration advisers usually attend the Remuneration Committee meetings.
Additional specific Board sub-committee telephone meetings were held as appropriate to approve specific business activities. There was a Board update call when there was a larger break between scheduled meetings.
Board strategy days – Wales, UK siteIn September 2016, as part of the Board’s rolling programme to visit its global offices and manufacturing sites, the Board visited the Specialty Pharmaceutical business in Wales for its annual two-day strategy meeting. During their visit, the Board took the opportunity to meet employees and engaged with and received presentations from representatives of the various functions present at the facility.
During the strategy days, the Board received presentations from the business units on their strategies including potential M&A activity and the Group’s digital strategy. The Board also considered the overall strategic options of the Group. The deliberations and challenges from the strategy day were integral to the articulation of the three-year plan approved in the year.
Board composition, membership and election of directorsThe Board currently comprises seven non-executive directors, including the Chairman, and two executive directors.
The names and brief biographical details of all the current directors are set out on pages 42 and 43.
The Group is committed to diversity, including gender diversity at all levels, and recognises the Board’s primary goal to continue to provide strong leadership by appointing the strongest candidates to the Board. Following Graham Hetherington’s appointment in August 2016, the percentage of women on the Board reduced from 25% to 22% so gender diversity will be a matter of continuing focus for the Board. The Nomination Committee reviews Board composition on a regular basis to ensure that,
as the business evolves, the Board continues to have the necessary skills and experience to support its strategy now and in the future.
Details of gender diversity in the Group below Board level can be found in the Directors’ Report on page 101.
Following the formal internal evaluation process, the Chairman is satisfied that each of the directors continues to perform effectively and demonstrates commitment to their role, including time for Board and committee meetings and their other duties, and can dedicate sufficient time to deliver what is expected of them.
BTG plc Annual Report and Accounts 2017
49Governance
Governance

IndependenceThe Board applies a rigorous process to satisfy itself that its non-executive directors remain independent. The Board reviews this question every year, using its own judgement when applying the criteria in the Code. Having undertaken this review, the Board confirms that all the non-executive directors are considered to be independent in character and judgement. Giles Kerr has been a member of the Board for more than nine years and following his review, the Board is satisfied that he continues to demonstrate the attributes of an independent non-executive director, with no evidence that his length of tenure has impacted this. In line with the recommendations of the Code, at least half the Board, excluding the Chairman, are independent non-executive directors. Garry Watts was considered to be independent at the time of his appointment although, in accordance with the Code, he is excluded from the determination of whether at least half the Board are independent non-executive directors thereafter.
Non-executive Board appointments are for three-year terms, subject to re-election at each year’s AGM. When a non-executive has served on the Board for more than six years, their term of reappointment reduces to one-year, in line with best practice. Giles Kerr, Jim O’Shea and Ian Much have each served on the Board for more than six years.
Structure and reportingThe Group has a well-defined management structure with clear lines of responsibility and accountability. The Board is responsible for setting the overall strategy and reviewing the performance of the Group.
The Leadership Team generally meets weekly and more formally on a monthly basis to review business performance measured against annual budgets, longer-term plans, an agreed set of objectives and performance criteria for each business segment. In addition, it will assess and respond to issues arising across the Group. Forecasts are monitored monthly on the basis of detailed reviews of progress and prospects. Reporting to the Board is based on the information provided to and reviewed by the Leadership Team as well as their assessment and recommendations regarding how to deliver the Group’s objectives. The reports include non-financial as well as financial information and a review of progress within the development portfolio.
Compliance and the review of risk and risk management are embedded throughout the Group. The Audit Committee has reviewed the detailed reports on Risk, Internal Audit and Compliance and reported its findings to the Board (see the Audit Committee report on pages 57 to 65 for more detail). The Board has reviewed the risk management process and confirms that ongoing processes and systems ensure that the Group continues to be compliant with the guidance on internal control issued by the Code.
Delegated authority structures ensure that decisions are taken at an appropriate level, with an appropriate level of input by internal and external expert advisers. The delegated authority structure prescribes financial limits of approval at each level and requires decisions with significant financial, risk or reputational impact for the Group to be approved by the Board.
Market abuse regulationDuring the year, the Group operated a Disclosure Committee, as required by the Market Abuse Regulation (MAR). The Committee comprises the CEO, CFO, Vice President of Corporate and Investor Relations and the General Counsel and Company Secretary. The Committee reviews all significant items of business within the Group regularly, and on an ad hoc basis if required, and maintains lists recording both those employed within the Group and externally who may have access to price sensitive information on the Group. Whenever individuals are placed on or removed from those lists they are notified accordingly and advised of their responsibilities. Systems and procedures for maintaining compliance with MAR were updated last July to meet the requirements of the new regulation.
BTG plc Annual Report and Accounts 2017 BTG plc Annual Report and Accounts 2017
50Governance
Corporate Governance reportLeadership continued

Nomination Committee report
Garry WattsNomination Committee Chairman
Dear ShareholderI am pleased to present the report of the Nomination Committee of the Board for the year ended 31 March 2017. In my letter to shareholders on page 40, I noted that succession planning for the current and future needs of the Group has been a key area of focus this year and this Committee has spent much of its time discussing the experience and skills required for specific roles at Board level and below, taking into account changes in the Group’s business, strategy and operating environment.
As reported last year, it was agreed that the Board would seek a replacement for Giles Kerr as Audit Chair. To this end, the Committee engaged JCA Group Limited to assist in the search for a suitable candidate. Criteria of the necessary skills and experience required for the role was developed which included, in particular, recent CFO and healthcare industry experience together with experience of operating in a rapidly growing and large group (FTSE 100 or similar). JCA, who have no other connection to the Group, proposed a long list of 14 candidates with a range of experience and which was diverse in other respects (including gender). Following meetings with a short list of the candidates, the Committee’s clear preference was Graham Hetherington, who brings with him substantial recent relevant industry experience as well as other relevant facets.
Following Graham’s appointment, we considered the composition of each of the Board’s primary committees, which resulted in Graham also being appointed to the Remuneration Committee on 29 September 2016.
The ongoing need to ensure the composition of the Board and its capabilities match the longer-term strategic plans of the Group was highlighted in the Committee’s evaluation last year. In response, the Committee has conducted a review of contingency and succession plans for key people and instigated an external assessment of those skills and competencies the Board will need in support of its strategic objectives. Calibro were engaged to make that assessment, conducting interviews with current Board members and senior management and developing a profile of future Board members and their requisite expertise. The results of this assessment is being used as the basis to continue to evolve the composition of the Board.
The Committee will continue its work into 2017/18 to ensure the Company retains and attracts the necessary talent at all levels to support the delivery of its strategy.
Garry WattsNomination Committee Chairman
BTG plc Annual Report and Accounts 2017
51Governance
Governance
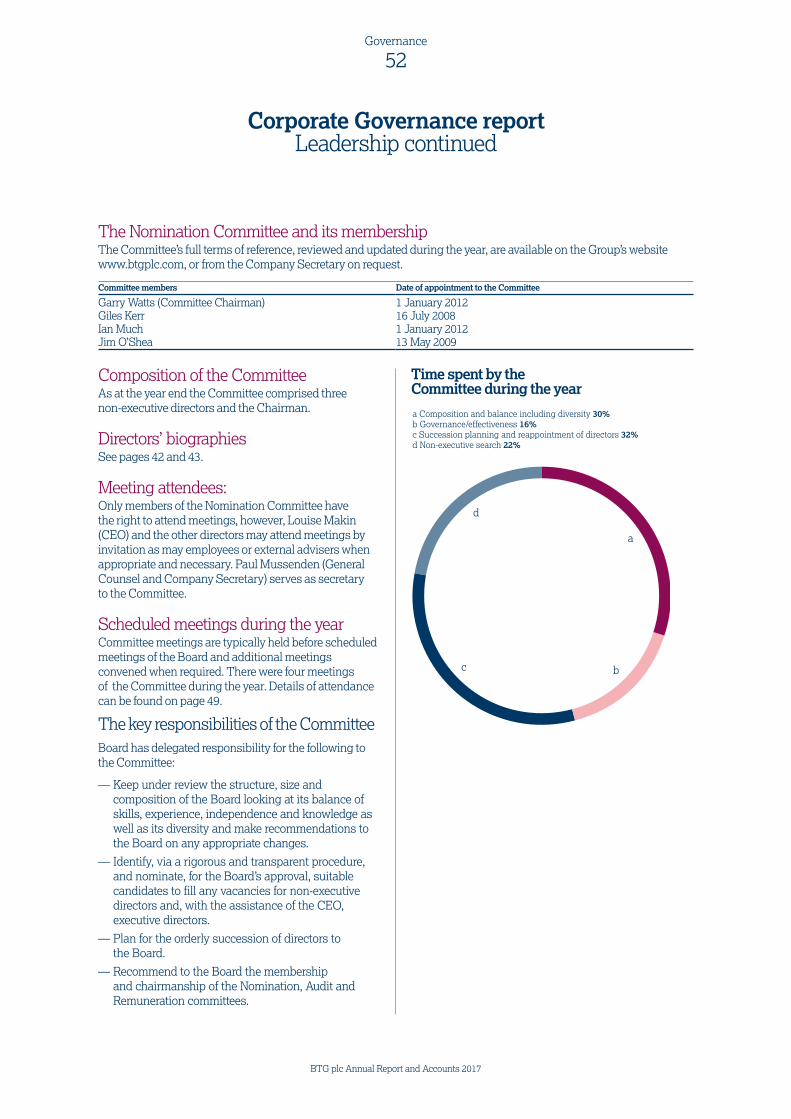
The Nomination Committee and its membershipThe Committee’s full terms of reference, reviewed and updated during the year, are available on the Group’s website www.btgplc.com, or from the Company Secretary on request.
Committee members Date of appointment to the Committee
Garry Watts (Committee Chairman) 1 January 2012Giles Kerr 16 July 2008Ian Much 1 January 2012Jim O’Shea 13 May 2009
Composition of the CommitteeAs at the year end the Committee comprised three non-executive directors and the Chairman.
Directors’ biographiesSee pages 42 and 43.
Meeting attendees:Only members of the Nomination Committee have the right to attend meetings, however, Louise Makin (CEO) and the other directors may attend meetings by invitation as may employees or external advisers when appropriate and necessary. Paul Mussenden (General Counsel and Company Secretary) serves as secretary to the Committee.
Scheduled meetings during the yearCommittee meetings are typically held before scheduled meetings of the Board and additional meetings convened when required. There were four meetings of the Committee during the year. Details of attendance can be found on page 49.
The key responsibilities of the Committee Board has delegated responsibility for the following to the Committee:
— Keep under review the structure, size and composition of the Board looking at its balance of skills, experience, independence and knowledge as well as its diversity and make recommendations to the Board on any appropriate changes.
— Identify, via a rigorous and transparent procedure, and nominate, for the Board’s approval, suitable candidates to fill any vacancies for non-executive directors and, with the assistance of the CEO, executive directors.
— Plan for the orderly succession of directors to the Board.
— Recommend to the Board the membership and chairmanship of the Nomination, Audit and Remuneration committees.
Time spent by the Committee during the year
a
bc
d
a Composition and balance including diversity 30% b Governance/effectiveness 16%c Succession planning and reappointment of directors 32%d Non-executive search 22%
BTG plc Annual Report and Accounts 2017 BTG plc Annual Report and Accounts 2017
52Governance
Corporate Governance reportLeadership continued

Activities The principal activities during the year related to:
— The process to find and appoint a new non-executive director and Chairman of the Audit Committee.
— The reappointment of non-executive directors Giles Kerr, Ian Much and Jim O’Shea, each for a further 12 months, subject to being re-elected at the Annual General Meeting.
— An externally facilitated review into the Board capability, composition and balance for now and in the future in the context of Group strategy.
— Discussing succession planning for the Group’s Leadership Team, including the CEO and CFO and the Group’s senior managers in key positions.
— Considering the expertise, capabilities and capacity of the Group’s management team with regard to the Group’s strategy and future requirements. Progress to address perceived capability gaps is regularly reviewed and this remains an area of focus and is considered in the context of both organic and acquisition growth.
Appointment processBoard appointments are made on merit and in line with current and future needs, reflecting the UK listing and international activities of the Group. The Committee considers what areas of expertise the Board would most benefit from and draws up a full description of the role accordingly.
The Committee carry out the interview and selection process on behalf of the Board and shortlisted candidates are also interviewed by the other non-executive directors and the CEO. Taking into account their views and the Board’s requirements, the Committee will make a recommendation to the Board. Appointments to the Board receive a thorough induction process, details of which can be found on page 54.
Development of Capabilities and Succession PlanningThe development of talent below Board level is extremely important and an area of focus for the Board. BTG continues to build an internal leadership pipeline for senior roles, and the Head of HR updates the Board regularly on progress. In addition to traditional Management Development Programmes, the Group has expanded the Learning and Development opportunities available to prospective leaders. By focusing on creating a pool of talent we are increasing the probability of retaining them through meaningful development and career opportunity and building the internal capability needed to support the Company’s growth.
DiversityThe benefits of diversity in its broadest form, including gender diversity, are recognised and play an important part in the Board’s decision-making regarding appointments. The Board is supportive of best practice recommendations to improve gender balance on Boards. The Board currently comprises seven men (78%) and two women (22%). The Board recognises the value of a Board with diverse skills, experience and background and those values are reflected in the recruitment policies in effect throughout the Group.
Further details can be found in the Directors’ report on pages 98 to 101.
Committee evaluationThe Committee’s performance was reviewed as part of the internal annual Board evaluation process. The assessment found that it continued to function effectively and highlighted the need to actively ensure the Board was the correct size with the correct skills necessary. An internal Board skills matrix will be developed over the course of the year to ensure the size and experience mix remains optimal for the future.
Garry WattsNomination Committee Chairman
BTG plc Annual Report and Accounts 2017
53Governance
Governance
Induction and trainingAll new non-executive directors receive a personalised and comprehensive induction that is tailored to their experience, background and particular area of focus. The programme has evolved, taking into account feedback from directors. The process includes written information on areas such as directors’ duties and corporate governance guidelines and best practice. It also includes meetings with other directors and a cross section of senior management at a Group and business unit level, and site visits are encouraged. New members also receive a full briefing on the financial and operating history of the Group and details of its strategy, risk management and compliance processes, operating plans, budgets and forecasts for future years.
All directors, including those newly appointed, are given the opportunity to attend external courses and refresh their knowledge regularly through publications and conferences and through information provided by the Group and its advisers. Specific training during the year has included training in connection with the new Market Abuse Regulation and the changes to the rules governing the disclosure and control of inside information. At their request, a number of directors have received internal training on the US global market access and reimbursement process to assist in their understanding of this area.
SupportThere are robust processes in place to ensure that the Board receives management information and reports on strategic and operational matters for discussion on a timely basis via a secure Board portal. The Board calendar includes annual strategy days, and senior management regularly attend meetings to enhance the non-executive directors’ understanding of the business and to present deep dive analysis of their areas of the business. Board meetings are occasionally held at other Group locations outside of the UK, affording non-executive directors an additional opportunity to meet employees and enhance their understanding of Group businesses.
There is an agreed procedure for directors to take independent professional advice, if necessary, at the Group’s expense. They also have direct access to the advice and services of the Company Secretary, who is responsible for ensuring that Board procedures are followed and providing advice on corporate governance. The Group provides appropriate directors’ and officers’ liability insurance. Further information on Directors’ indemnities is given in the Directors’ report on page 98.
Performance evaluation The Board recognises that a rigorous evaluation of its performance is important to optimise our continued effectiveness and development.
The CEO appraises the performance of the CFO. The Chairman and non-executive directors review the performance of the CEO. The non-executive directors, led by the Senior Independent Director, with input from the executive directors, evaluate the performance of the Chairman each year. The committees also review their own performance and report the results to the Chairman and the Board. During the year, the non-executive directors held a meeting without the executive directors in order to discuss the performance of the executive directors and their management of the Group’s affairs.
A formal evaluation is carried out annually and is externally facilitated every three years. This year the Board and its committees carried out an internal review of progress against the objectives set following last year’s internal evaluation as well as its overall performance during the year through a series of comprehensive web-based questionnaires that encourage comment and observation.
Progress on the output from the 2016 evaluation and objectives following the 2017 evaluation are set out on the next page.
BTG plc Annual Report and Accounts 2017 BTG plc Annual Report and Accounts 2017
54Governance
Corporate Governance reportEffectiveness

Board evaluation
Key 2016 objectives Progress Key 2017 objectives
Continue to focus on the identification of key strategic options and risks and further integration of the risk management process into the process for formation and review of strategy.
Progress on strategic focus has continued and good progress has been made in assessing the risks of the business. Further clarity on longer-term drivers of value is being developed.
In response to the results of this year’s evaluation the following Board objectives have been set for 2017:
The risk management process is to be further integrated into strategic planning.
The Board will receive further strategic updates throughout the year as part of an iterative discussion.
Continue the improvement of the risk management process and specifically the top down risk review as well as further definition of risk appetite; a continued focus on the impact of structural changes in the healthcare industry generally and how ex-US markets such as EU and Asia operate.
Risk identification and risk reporting has significantly improved. Further articulation of key strategic risks in relation to the longer-term strategy and articulation of the Board’s risk appetite is being developed.
Continue to evolve the “top down” macro risk assessment of those external developments that may adversely impact the business.
Definition of key risks inherent in the strategy and discussion of appropriate risk appetite in key areas.
Further review of the R&D strategy of the Group.
R&D strategy review completed and activities to sustain longer-term growth through innovation and early-stage investments are being developed.
Monitor the execution of the R&D strategy and evaluation of the pipeline of earlier stage development opportunities.
Greater focus on contingency plans for people and having succession plans in place for senior staff.
Capability assessments have been introduced. Succession plans for the cadre of management below Leadership Team (LT) are being developed. Enhanced leadership development programmes have been put in place.
Continue the varied leadership development programmes. Continue the consideration of capability needs at Board level.
BTG plc Annual Report and Accounts 2017
55Governance
Governance

Related parties and conflicts of interestThe Group maintains robust procedures to ensure that related party transactions and potential conflicts of interest are identified, disclosed and managed. To address the effect of Section 175 of the Companies Act 2006, the Group’s Articles of Association enable the Board to authorise situations that might give rise to directors’ conflicts of interest. Directors declare interests in other businesses on appointment to the Board, as they arise and also complete an annual self-certification.
Board members are regularly reminded to disclose any conflicts should they arise and any such notifications are kept in a conflicts register maintained by the Company Secretary. Any director who considers they may have a potential conflict of interest is required to report this to the Chairman in the first instance, who may consult the Nomination Committee and report its findings to the Board.
Where it is identified that a related party relationship exists, the Board agrees specific additional procedures to ensure the effective management of potential conflicts of interest.
At the March 2017 Board meeting all directors were asked to review and make any necessary amendments to their existing declarations. The Company Secretary has reviewed the latest declarations and has confirmed that no conflicts are believed to have arisen.
Giles Kerr, a non-executive director of the Board, is also Director of Finance for Oxford University and a director of Oxford University Innovations Limited, a subsidiary of Oxford University. Wholly owned subsidiaries of the Group entered into technology commercialisation and revenue sharing agreements with these organisations prior to Giles Kerr joining the Board. The Group has licensed the intellectual property rights covered by these agreements to independent third-party companies that are developing and/or selling the licensed products. Under these licence agreements, the Group is entitled to receive milestone payments and/or royalties on sales of the products sold by the third-party licensees.
BTG plc Annual Report and Accounts 2017 BTG plc Annual Report and Accounts 2017
56Governance
Under the various revenue sharing agreements, the Group pays a share of any income it receives to Oxford University or Oxford University Innovations, depending on the specific technology that generated the income. As the revenue sharing agreements do not permit these organisations to have any input over the commercialisation of the licensed products or the amount payable under the relevant revenue sharing agreement, Giles Kerr is not able to influence the amounts received in his position outside the Group. As Giles has no influence over any aspect of these agreements in his role outside the Group, the Company considers that his independence in relation to the Group is not compromised.
To avoid any possible conflict of interest, it has been agreed that Giles Kerr will not participate in any discussions or decisions concerning the relevant agreements either within the Board or in any other discussions or meetings with the executives of its subsidiaries.
The Board has considered, and is satisfied with, the separation of duties and safeguards.
Corporate Governance reportEffectiveness continued

BTG plc Annual Report and Accounts 2017
57Governance
Governance
Audit Committee Report
Graham HetheringtonAudit Committee Chairman
As in previous years the Committee has considered the integrity of BTG’s internal controls, its financial reporting and the way risks are identified, evaluated, mitigated and reported. A significant amount of the Committee’s time and attention was devoted to these matters in 2016/17. It is essential that compliance processes remain fit for purpose, particularly in light of the growth in size, complexity and international reach of the Group in recent years. Consequently, the Committee also sought to enhance processes and controls around distributor due diligence, selection, compliance, training, monitoring and audit programmes, particularly those relating to anti-bribery and anti-corruption.
Following on from a review conducted last year, we have focused on strengthening the financial processes and capabilities required to meet the ever-increasing needs of a growing business. To this end, 2016/17 has seen a revised finance organisation put in place, together with external hires to bolster finance capabilities. As part of this continued evolution, the Group has focused on financial process, controls and system optimisation to meet the Group’s needs now and in the future.
The Committee has additionally directed a review of the Company’s general governance framework during the year and a number of policies, including Matters Reserved for the Board (approval), Delegation of Authorities and Treasury Policy, have been revised to ensure that they best serve the business.
There have been several other important changes to BTG’s financial reporting during the year, including changes to the format of the income statement, the focus of the KPIs and adoption of new guidelines in respect of the reporting of Alternative Performance Measures (“APMs”).
Dear ShareholderAs Chairman of the Audit Committee, I am pleased to present our report for the year ended 31 March 2017. This is my first report since joining the Board and taking the role as Chair of the Committee last August. I would like to thank my predecessor, Giles Kerr, for his hard work as Chair over the past nine years, and I am grateful for his continuing support as a member of the Audit Committee.
This report sets out the activities of the Committee over the past year and how it has discharged its responsibilities to provide effective governance over the Group’s financial and other activities. In submitting the report we have considered the Financial Reporting Council (FRC) Guidance on Audit Committees published during 2016.
The report also provides an overview of the Committee’s focus areas, including oversight in relation to financial reporting, internal controls, compliance and risk management, as well as the relationship with the external and internal auditors. Throughout the year the Committee has also monitored the broader risks and challenges relevant to the Group, as well as growing threats such as cyber security.
Corporate Governance reportAccountability

During the year the Company settled the investigation with the US Department of Justice (DOJ) in relation to the historic marketing of LC Bead®. The resolution was facilitated by the Company’s existing extensive compliance programme, which we continue to keep under review and evolve as appropriate. As a result, the settlement did not involve the imposition by the DOJ of a Corporate Integrity Agreement containing additional compliance requirements over and above our existing compliance programme.
In addition to the work ensuring that the processes and procedures of the Group are suitable for the next stage of its journey, the Committee has continued its ongoing focus on the approach to risk management, driving the process further into the operations of the business units and consideration of risks external to BTG, in the general healthcare industry and at a more macro-economic level. Further detail of this work by the Committee can be found on page 66 of this report.
The Company’s second Viability Statement can be found on page 35 of this report. The Committee once again scrutinised in detail the elements of the statement as well as reflecting on the impact of the previous 12 months on the statement. The Committee considered the FRC guidance and concluded that the approach and the internal work undertaken to support the viability statement is robust and the three year period covered by the statement was appropriate.
This report provides the Committee’s opinion as to whether the Annual Report taken as a whole, is fair, balanced and understandable. The Board, after taking advice from the Committee, has confirmed that to be the case and that it provides the information necessary for shareholders to assess the Group’s position and performance, business model and strategy.
Turning to external audit, KPMG LLP has served as the Company’s external auditor since 1995, with the current audit partner having served since his appointment in 2013. In accordance with EU and national regulations and the UK corporate Governance Code, and having considered the transitional arrangements necessary to effect an external audit rotation, it is the Committee’s intention to put the external audit out to tender during 2017 with a view to the appointment of a new external auditor for the financial year ended March 2019. Until such time and following the review of KPMG’s continued performance and independence, the Committee have recommended to the Board the reappointment of KPMG as external auditor for the 2017/18 financial year.
Graham HetheringtonAudit Committee Chairman
BTG plc Annual Report and Accounts 2017 BTG plc Annual Report and Accounts 2017
58Governance
Corporate Governance reportAccountability continued
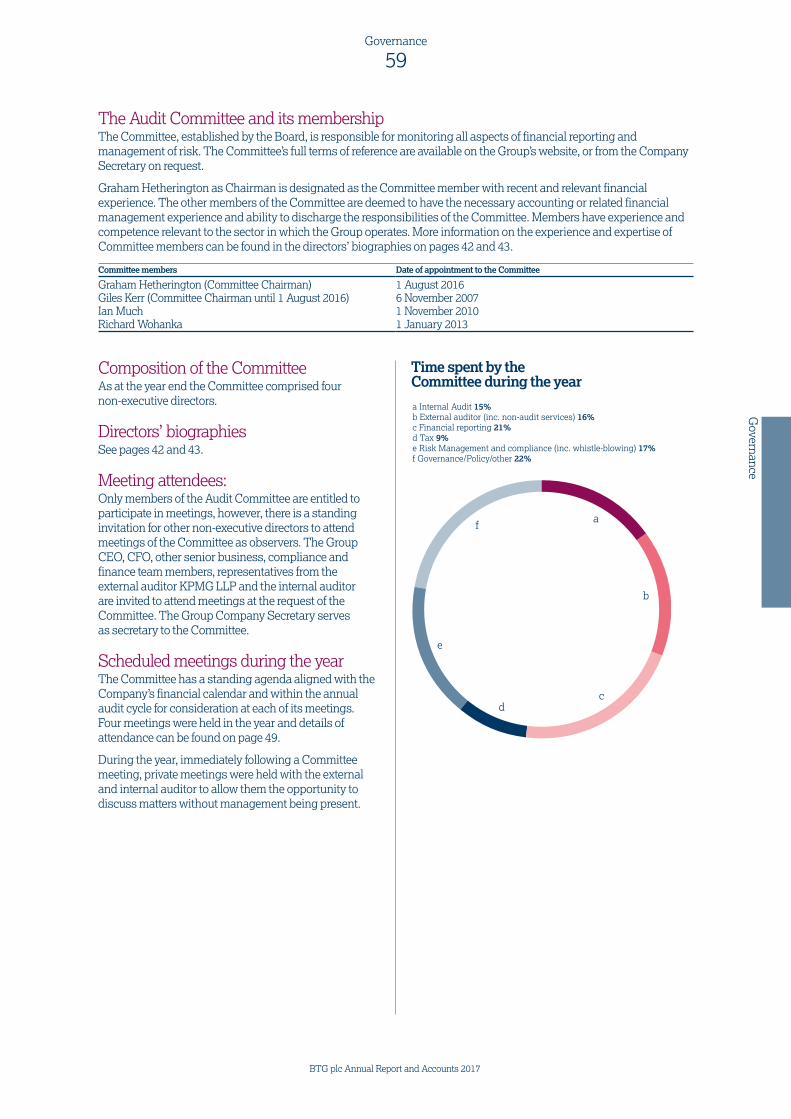
The Audit Committee and its membershipThe Committee, established by the Board, is responsible for monitoring all aspects of financial reporting and management of risk. The Committee’s full terms of reference are available on the Group’s website, or from the Company Secretary on request.
Graham Hetherington as Chairman is designated as the Committee member with recent and relevant financial experience. The other members of the Committee are deemed to have the necessary accounting or related financial management experience and ability to discharge the responsibilities of the Committee. Members have experience and competence relevant to the sector in which the Group operates. More information on the experience and expertise of Committee members can be found in the directors’ biographies on pages 42 and 43.
Committee members Date of appointment to the Committee
Graham Hetherington (Committee Chairman) 1 August 2016Giles Kerr (Committee Chairman until 1 August 2016) 6 November 2007Ian Much 1 November 2010Richard Wohanka 1 January 2013
Composition of the CommitteeAs at the year end the Committee comprised four non-executive directors.
Directors’ biographiesSee pages 42 and 43.
Meeting attendees:Only members of the Audit Committee are entitled to participate in meetings, however, there is a standing invitation for other non-executive directors to attend meetings of the Committee as observers. The Group CEO, CFO, other senior business, compliance and finance team members, representatives from the external auditor KPMG LLP and the internal auditor are invited to attend meetings at the request of the Committee. The Group Company Secretary serves as secretary to the Committee.
Scheduled meetings during the yearThe Committee has a standing agenda aligned with the Company’s financial calendar and within the annual audit cycle for consideration at each of its meetings. Four meetings were held in the year and details of attendance can be found on page 49.
During the year, immediately following a Committee meeting, private meetings were held with the external and internal auditor to allow them the opportunity to discuss matters without management being present.
Time spent by the Committee during the year
a Internal Audit 15% b External auditor (inc. non-audit services) 16%c Financial reporting 21%d Tax 9% e Risk Management and compliance (inc. whistle-blowing) 17% f Governance/Policy/other 22%
a
b
cd
e
f
BTG plc Annual Report and Accounts 2017
59Governance
Governance

ActivitiesDuring the year, in discharging its responsibilities, the Committee received and considered reports across a number of areas as summarised below:
Area of review Activities undertaken
Financial reporting — Review of the Group’s half-year and full-year results. — Consideration of whether the Annual Report and Accounts is fair, balanced and understandable.
— Review of external auditor reports on the half-year and full-year results. — Consideration of significant accounting issues as detailed on the following table. — Review of prospective changes in accounting standards and their potential impact. — Review of trading updates issued by the Group. — Assessment of the going concern basis of preparation for the financial statements and considering whether there were any material uncertainties to the Group’s ability to continue to adopt this basis over a period of at least 12 months from the date of approval of the financial statements.
— Review of, and advise the Board on, the Viability Statement. — Review of the adoption of new guidelines in respect of reporting APMs.
External auditor — Review of the performance and objectivity of the external auditor, including the independence of the external auditor.
— Review of the strategy, scope and results of the half-year review and full-year audit. — Review and approval of external auditor remuneration. — Review of use of the external auditor for non-audit work. — Review of the Audit Quality Review findings for their review of the 2015/16 external audit.
Risk management and internal control
— Review of risk management systems, internal controls and fraud, anti-bribery and anti-corruption procedures.
— Review of compliance systems and policies. — Review by internal and external auditors of internal controls and processes. — Review of the Group’s whistle-blowing policy and any allegations arising from it. — Review of the results of internal compliance monitoring and auditing. — Review of the Group’s tax affairs.
Tax — Review of tax strategy.
Internal audit — Review of the internal auditor’s work plan. — Review of internal audit reports produced throughout the year. — Review of the performance of PwC who lead the internal audit function.
Committee governance
— Review of Committee terms of reference. — Completion of effectiveness review. — Review of revised Non-Audit Services Policy. — Review of revised Delegation of Authorities and Treasury Policy.
BTG plc Annual Report and Accounts 2017 BTG plc Annual Report and Accounts 2017
60Governance
Corporate Governance reportAccountability continued

Significant accounting matters The Committee considered the following key accounting issues, significant judgements, areas of estimation and disclosures during the course of the year:
Significant issues considered How the issue was addressed
Carrying value of Goodwill and Intangibles Assets
The Committee critically reviewed a report from management setting out the Company’s risk-based approach to reviewing the recoverability of Goodwill and Intangible Assets in accordance with IAS 36.The Committee also critically reviewed the Company’s assessment of the recoverability of goodwill and certain intangible assets, including developed technology and In-process R&D assets. This review particularly focused on the forecast assumptions and valuation methodology which underpinned the valuation of these assets, as further disclosed in Note 11. Key assumptions reviewed included discount rates, assumed growth rates, peak sales and sensitivity analysis for the relevant assets.
Recognition of Deferred Tax Assets and Liabilities
The Committee reviewed the appropriateness of deferred tax assets recognised and unrecognised and the movements on deferred tax assets and liabilities during the year. The Committee also reviewed the recognition of deferred tax assets and liabilities in respect of the Group’s acquisition of Galil Medical.
Investigation and contingent liabilities
The Committee received and critically assessed the progress of, including the probability of any outflow, from the ongoing Wellstat litigation and the DOJ investigation that was settled during the year.
Contingent consideration liabilities
The Committee reviewed the key assumptions, including the probability of technical success and likelihood of FDA approval of the PMA for the PneumRx® Coils by 31 December 2017, relating to the Company’s determination of fair value of the contingent consideration liability for the $60m milestone, which may be payable to former shareholders of PneumRx, Inc. as part of the deferred acquisition cost.
Presentation format of Consolidated Income Statement
The Committee considered and approved a change to the format of the Consolidated Income Statement to a single column format and the removal of certain immaterial line items from the face of the income statement.
Alternative Performance Measures
The Committee considered the Company’s selection, presentation and appropriateness of the disclosure of APMs in its financial reports, in accordance with regulations which became applicable for the Company during the year.
Other matters During the course of the year, the Committee received updates from management on the presentation currency of the consolidated financial statements, foreign exchange hedging, the presentation of derivative gains and losses, tax strategy and the adoption of new accounting standards.
BTG plc Annual Report and Accounts 2017
61Governance
Governance

Audit scope — For the year under review, the external auditor presented their proposed audit plan to the Committee for consideration and approval. The Committee
agreed the approach and scope of the audit plan which had been discussed with management to align with business focus. The Committee agreed the terms of engagement and fees for the audit work to be undertaken. Details of the amounts paid to the external auditor for the audit services are provided in Note 5 to the accounts.
Non-audit work — The Committee has a formal policy for approving the use of the auditor for non-audit work, detailing areas where the auditors may not be used, areas
where they may be used subject to the agreement of the Committee and areas where prior approval is not required. A review of the non-audit services policy was conducted during the year, and this revised policy was approved by the Committee. The external auditor is precluded from engaging in non-audit services that would compromise their independence or violate any laws or regulations affecting their appointment as external auditor. During the year, no approval was granted for any non-audit services not in full accordance with these standards.
— The Committee receives a written annual report from management summarising the fees paid to the auditors for non-audit work and whether such services were pre-approved or specifically approved by the Committee. Details of the amounts paid to the external auditor for non-audit services are set out below.
Audit Committee approval TaskFees
£’000
Pre-approval required: Taxation compliance services 424Other compliance related services 60
Evaluation — Each year the Committee reviews the performance of and considers the independence of the external auditor. During the year the Committee and senior
members of the finance team evaluated the external auditor performance reviewing the strength of the audit team, its expertise and experience, the completion of the approved audit plan, communication, interaction with Internal Audit and reporting. In considering the independence of the external auditor, the committee received a statement of independence, a report describing their arrangements for identifying and managing conflicts of interest and confirmation that the provision of non-audit services would not impair its independence or objectivity. After the annual review, the performance of the external auditor was deemed satisfactory.
Appointment — The Committee reviews and makes recommendations to the Board with regard to the reappointment of the external auditor, taking into account its
overall performance, independence and audit partner rotation. At its AGM in July 2016, KPMG was reappointed as auditor of the Company.
Reappointment — The Audit Committee has recommended to the Board that KPMG be proposed for reappointment by shareholders as its external auditor at the July 2017
AGM and the Board has authorised the Audit Committee to determine the auditor’s remuneration.
Audit tender — The Committee reviews annually whether it is an appropriate time to put the external audit to tender, taking into account the complexity of the business,
the services offered by incumbent auditor and their independence. As detailed in my opening letter, during the year the Committee determined it appropriate to now put the external audit out to tender.
— A tender for external audit services has been scheduled to coincide with the rotation of KPMG’s audit partner at the end of the 2017/18 financial year. An evaluation of potential audit firms to be invited to tender was conducted with consideration given to experience in the Group’s sector, audit quality findings from FRC audit quality reviews, and a review of non-audit services currently being provided to the Group. The shortlisted firms will be invited to engage in the tender process later in the 2017 calendar year with a successful candidate being identified ahead of the 2017/18 year end.
— A plan for the transition of audit services will be agreed, including inviting the chosen firm to shadow KPMG during their audit of the 2017/18 year end. The appointment of the new audit firm would be put to shareholders for their approval at the Company’s AGM in July 2018.
External auditor
BTG plc Annual Report and Accounts 2017 BTG plc Annual Report and Accounts 2017
62Governance
Corporate Governance reportAccountability continued

Risk management and internal control committee considerationsApproach to risk management
— Ensuring the effectiveness of the Group’s risk management and internal control systems is the responsibility of the Board. Additional details of our approach to risk management and the specific principal risks that may affect the business are given on page 15 in the Strategic Report and on pages 68 to 70 following this report.
Audit Committee interaction with Group Risk Management process
— The Committee oversees, on behalf of the Board, the risk management process and the effectiveness of internal controls and reports to the Board on its findings biannually and also via more specific “deep dive” reviews in selected areas. The goal is to ensure the Company is able to identify, assess and effectively manage or mitigate existing and newly emerging risks.
— The overall risk assessment structure is designed to manage appropriately rather than eliminate the risk of failure to achieve business objectives, and can only provide reasonable and not absolute assurance against material misstatement or loss.
— The Group operates a Risk Committee that is chaired by the CFO, Rolf Soderstrom and comprises senior members of staff representing relevant parts of the business and key functions. The output from the Risk Committee is formally reported, biannually, to the Leadership Team and Audit Committee. This Group Risk report is also shared and discussed with the Board and individual risks may be considered by the Board as they arise throughout the year. Leading indicators of material changes in principal risks are monitored six monthly by the Board via the Audit Committee.
— The criteria applied by the directors in judging the effectiveness of these controls, are that they allow the maximisation of shareholder value by exploiting business opportunities while ensuring that risks are properly identified and managed and the Group’s legal, regulatory and other obligations are met.
— To strengthen the control framework of the business, the Group has an Internal Audit group supported externally by PwC.
Areas of focus — The Committee discharges these duties using a combination of reports from management, Internal Audit and the external auditor reviews. A risk management reporting structure has been in place throughout the year and up to the date of approval of the financial statements and is regularly reviewed by the directors in accordance with the Code.
— The Committee’s review focuses on a wide range of areas including financial, operational, anti-bribery, regulatory and healthcare law compliance risks and controls, for the year under review and up to the date of this Report. This year the Committee also specifically considered the key risks that could impact the business model and strategy over the longer term, such as the changing healthcare landscape in the US.
Use of Internal Audit — The Company has engaged PwC to perform the role of the Company’s Internal Audit function that operates under the direction of the Audit Committee. The Committee monitored and reviewed the work of internal audit throughout the year. During the year, internal audit reviews of the risk management programme, cyber security, HR processes, local site finance processes, EU healthcare law compliance and R&D programme management were undertaken, as well as third- party distributor audits (focusing primarily on the robustness of their programmes to prevent bribery and corruption). The work carried out by internal audit did not identify any material weaknesses in internal controls but included proposals to enhance control procedures. The Committee monitors management’s responses to ensure that control improvements are instigated on a timely basis.
— During the year the Committee evaluated the performance of the internal auditor using the same methodology applied to the external auditor. In general, performance of the Internal Audit group was deemed satisfactory.
BTG plc Annual Report and Accounts 2017
63Governance
Governance
Assessment of fair, balanced and understandable
— Communications with shareholders, such as results announcements, interim reports, annual reports and AGM and trading updates, are reviewed carefully and approved by the Board, or a sub-committee of the Board, to ensure they are accurate, transparent, balanced and understandable in the view they give of the Group’s progress and prospects.
— A key role of the Committee includes a review of the significant financial reporting judgements contained in the Annual Report with the aim of ensuring that they present a fair and balanced view of the Group and comply fully with the relevant statutes and accounting standards. Where requested by the Board, the Committee will advise on whether, taken as a whole, the Annual Report and Accounts is fair, balanced and understandable. As part of this review it discusses the audit findings and Auditor’s Report with management and the external auditor and considers significant judgements and issues contained within those reports. Following this discussion the Chairman of the Committee reports the results of its review to the full Board. The Committee has assessed and recommended to the Board that, taken as a whole, the Company’s 2017 Annual Report is fair, balanced and understandable.
— The statement of directors’ responsibilities in relation to the preparation of the financial statements is set out on page 102 and the auditor’s statement on the respective responsibilities of directors and the auditor is included within its report set out on pages 104 to 109.
Corporate policies, values and compliance
— The Company places great emphasis on the embedded behaviours and values that define the BTG DNA, which we believe have been integral in building the organisation to date and we believe them to be key for continuing success. These are underpinned by the Code of Conduct, which covers all aspects of ethics, business practices and compliance, including a whistle-blowing policy, an anti-bribery and anti-corruption policy and policies related to the ethical conduct of research and development and interactions with doctors and other healthcare professionals.
— A Companywide meeting is held each month where all sites join via video conference. The CEO updates employees on different aspects of the business and presentations are given by employees from all areas of the business.
Whistle-blowing — An “open door” policy is used across the Group and in line with best practice, the Group supports an independent and confidential whistle-blowing procedure. The Leadership Team is responsible for ensuring that arrangements under which employees may raise concerns about possible improprieties in matters of financial performance or other matters, are operating effectively and that appropriate follow-up action takes place. Included within the Employee Code of Conduct and various employee trainings are details of the Group’s whistle-blowing and non-retaliation policy.
BTG plc Annual Report and Accounts 2017 BTG plc Annual Report and Accounts 2017
64Governance
Corporate Governance reportAccountability continued

Anti-bribery and anti-corruption policy
— The Group has continued to operate its anti-bribery and anti-corruption (ABAC) Policy introduced in 2010. The ABAC programme reflects the Group’s commitment to ethical business practices and is in response to various country and international laws, including the UK Bribery Act 2010. This has included the conduct of due diligence on existing and new key business partners who may act on behalf of the Group in higher risk areas of business.
— Further enhancements were completed during the year to develop a “tool kit” of simple policies and procedures for third parties with whom the Company contracts. We will provide training on the tool kit with the aim of ensuring third parties are able to operate in accordance with our policies in practice, including those relating to bribery and corruption.
Committee evaluation and action plan for 2017/18The review of the Committee and its effectiveness was considered as part of the overall Board evaluation. At its meeting in March 2017, the Committee considered the contents of the internally facilitated review, and the results and recommendations for development were reported to the Board. The review found that the Committee continued to function efficiently and effectively, providing a healthy balance between in-depth assessment and analysis and a clear practical approach. As part of the evaluation, it was agreed that in 2017 the Committee would, as well as monitoring changes in EU and UK regulation, continue to focus on improving the content and strategic focus of Board information, the composition and succession planning for Committee members and contributors, developing a high-level risk map integrated with strategy, developing the role and impact of the Internal Audit function in the context of a growing group and providing guidance and oversight on financial systems strategy and capabilities. These items have been incorporated into the Committee’s planned activities for the coming financial year.
Graham HetheringtonAudit Committee Chairman
BTG plc Annual Report and Accounts 2017
65Governance
Governance

Risk Management and Principal Risks
Accountability for oversight of riskThe goal of the Board is to ensure the Company is able to identify, assess and effectively manage or mitigate existing and newly emerging risks. That includes oversight of the progress of agreed risk mitigation strategies and any changes to the materiality of key risks. The Board also assess the likelihood and potential impact of plausible concurrent risks and seeks to ensure that the overall risk profile of the Group is appropriate in light of its strategy.
With direct support from the Audit Committee, the Board believes it has taken all reasonable steps to satisfy itself that the risk management process is effective and fit for purpose. Nevertheless, as with all risk management processes, there remains a degree of uncertainty and planned mitigations may not be effective and unpredicted risks may arise. As a consequence there cannot be any guarantee that all risks to the business will be successfully identified, controlled or mitigated. Risk is inherent in a number of aspects of the Company’s growth strategy, such as investments in product development, M&A and geographic expansion.
The specific risks considered by senior management and the Board are those that are believed could cause the Group’s future results, financial condition and prospects to differ materially from current expectations, including the ability to meet the objectives outlined in the Strategic Report. The Board believes it has taken all material and plausible risks into account and, based on that analysis, have confirmed the viability of the Company over the next three years as set out in the Viability Statement required by the UK Corporate Governance Code (see page 35, the Viability Statement).
Risk review processBTG has a three-year financial plan that is updated annually. Performance against that plan is monitored on a monthly basis.
The corporate goals have been built into the risk management process and, as such, form one of the bases on which business risks are measured. Individuals in the business managing discrete risks on a day-to-day basis produce and update their business unit specific risk registers monthly. These registers are consolidated into a Group Risk Register which is reviewed at least twice-yearly by the Risk Committee before being reported to the Audit Committee and Board.
Further detail of the work of the Group Risk Committee can be found on page 45.
BTG plc Annual Report and Accounts 2017 BTG plc Annual Report and Accounts 2017
66Governance
Where appropriate the Audit Committee will undertake a deep dive assessment of a key risk to better understand its nature and to consider available mitigation options that could be deployed to better manage that risk, together with the costs, timelines and likelihood of success of those options. In 2016, the Audit Committee commissioned PwC to undertake an analysis of the BTG risk management process. This exercise recommended a number of enhancements, which the Board and Leadership Team are evaluating for implementation in 2017.
The Board utilises information from the risk management process to define the appropriate risk appetite for the Viability Statement. The Board also considers new material risks in a timely fashion as they arise.
Governance and risk management systemsAn integral part of the risk management framework is the operation of a number of compliance and governance systems, each of which comprises a framework of policies, processes and procedures used to ensure that BTG fulfils all tasks required to achieve the desired corporate governance objectives. Examples include the corporate functions such as Internal Audit, Compliance, Finance, Legal, Regulatory, Research & Development, Pharma/Device vigilance, Quality, Environmental, Health & Safety and other assurance groups. These are integrated to ensure an overall robust risk management and assurance framework.
A number of these systems are required by legislation or by authorities governing our industry e.g. in the pharmaceutical industry, product quality is governed by the principles of Good Manufacturing Practice (GMP), enforced by the Food and Drug Administration (FDA) in the US and Medicines and Healthcare Products Regulatory Agency (MHRA) in the UK and other equivalent agencies in other territories.
These BTG governance systems each have a series of Key Performance Indicators (KPIs), reviewed by the Leadership Team at set intervals and fed into the business unit and Group Risk Registers. Non-conformances are investigated and corrective actions defined and tracked to completion. These systems aim to ensure that risks arising from internal activities or those conducted via third parties with whom we work do not become material. The principal systems are outlined in the following table.
Corporate Governance reportAccountability continued

Outline of BTG Governance & Risk Management Systems
Functional Area Summary of KPIs Measured
Product quality control and assurance:
Ensuring all products:
— meet applicable specifications, GMP and other regulatory requirements. — deliver expected efficacy and safety. — are supported by necessary manufacturing and marketing licences in
relevant markets.
— Ensuring all products placed on a market meet applicable release criteria for the market for which they are intended.
— Assessment against internal operating standards and procedures. — Testing the effectiveness of training. — FDA/MHRA/Internal Audit findings and delivery on remediation plans. — Monitoring customer complaints, for example, product failures or adverse
events (via a comprehensive device/pharmacovigilance system). — Monitoring completion of corrective actions for all measures reported.
Healthcare law compliance:
Ensuring:
— compliance by BTG Group and its principal commercial partners with applicable laws and regulations relating to the conduct of business including, for example, the UK Bribery Act, US False Claims Act, US Anti-Kickback Statute and the US Foreign Corrupt Practices Act and other applicable regulations to prevent improper conduct, inaccurate regulatory submissions, misleading or off-label marketing of products, or the submission of false claims for reimbursement of products.
— Collection of internal monitoring data and assessment against operational targets.
— Internal audit findings, auditing of commercial partners and delivery on remediation plans.
— Monitoring of complaints/queries/allegations. Conduct of investigations where required.
— Testing the effectiveness of training of BTG employees and commercial partners.
Finance:
Ensuring:
— the ongoing viability of BTG’s business and adequate financial resources to meet our operational and strategic objectives.
— all BTG employees abide by internal and external transaction and reporting standards.
— BTG is not subject to serious fraud or misappropriation of Company assets.
— Internal and external audit findings at BTG businesses and commercial partners.
— Adherence to budget, delegated authorities and other internal financial controls and assurance procedures.
— Monitoring of financial transactions. — Monitoring completion of corrective actions for all measures reported.
Supply chain:
Ensuring:
— products are delivered on time and orders completed. — continuity of supply. — maintenance and management of supply chains such that all internal and
regulatory standards are met.
— Collection of internal monitoring data and assessment against operational targets.
— Maintaining adequate inventories (based on risk assessments) of raw materials, intermediates and finished goods.
— Implementation of process and facility improvement plans. — Rigorous monitoring of third-party suppliers; dual sourcing implemented
or being investigated where practicable.
Environment, Health & Safety (EHS):
Ensuring:
— BTG operations are safe for employees, visitors and the public who interact with our business.
— we appropriately manage our impact on the environment. — compliance with internal and external regulatory standards.
— Investigation of lost time accidents (minimum one day lost) and all first aid incidents.
— Waste produced. — Carbon footprint. — Water consumption. — Internal audits and site assessments monitoring training and completion
of corrective actions for all measures reported.
Research & Development (R&D):
Ensuring:
— we protect the safety and data privacy of patients participating in our clinical studies and meet all applicable laws and regulations with respect to conduct of R&D (for example, the requirements of Good Clinical Practice and Good Laboratory Practice).
— we generate adequate data to support regulatory submissions and product approvals for intended uses.
— we define appropriate development plans to meet our strategic goals. — we meet project specific and portfolio budgets and timelines.
— Assessment against internal operating standards and procedures and ongoing review of the scope and content of the policy framework and procedures.
— Testing of the effectiveness of training. — FDA/MHRA/Internal Audit findings and delivery on remediation plans.
Active monitoring of clinical studies and other activities. — Detailed review of project progress against agreed stage gate milestones
for further funding. — Ongoing review of the portfolio as a whole against wider strategic needs.
Skills and capabilities:
Ensuring:
— the business attracts, retains and develops talented individuals of the calibre and with the capabilities needed to deliver on the Group’s operations and strategy.
— Assessment processes to define the future capability or development needs of the Group in light of strategy.
— Reviewing the competitiveness of Company reward programmes and employee benefits.
— Ensuring key individuals have adequate ongoing development as well as succession plans in place.
— Enhancing overall leadership development programmes.
BTG plc Annual Report and Accounts 2017
67Governance
Governance

Risk General mitigation strategy
Change in 2016/17
Market Access: Securing adequate reimbursement for BTG’s products
BTG may not be able to sell its products profitably if reimbursement by third-party payers, including government and private health insurers, is limited or unavailable. The Group may be subject to price limits on reimbursement of products that are outside of its control, reducing sales volume or prices, negatively impacting Group revenues. This is particularly the case in the US where a significant proportion of the Group’s revenues are derived, and in light of the potential US healthcare reforms, which may reduce the number of insured patients and require increased rebates or discounts to be provided. Third-party payers are increasingly attempting to contain healthcare costs through measures that are likely to impact the products that BTG is developing.
Ensuring effective advocacy with payers based on accurate data and analysis to inform reimbursement decisions. Ensuring accurate and complete submissions. BTG is seeking to utilise its expanding expertise across the portfolio, both within and outside the US. R&D plans increasingly seek to create the data likely to be required to secure the desired level of reimbursement for the applicable products after commercial launch.
The Company continues to strengthen its global market access (reimbursement) capabilities. While adequate levels of reimbursement for Varithena® can be secured, inadequate coverage and/or slow payment has slowed adoption and adversely impacted revenue growth. Progress continues with the expectation CPT Codes for Varithena® will be secured from January 2018. A residual risk is the uncertainty regarding the value that will be set for these codes which will be determined during 2017/18 financial year.
Acceptable progress continues to secure appropriate reimbursement for other products across the portfolio.
A future focus will be on supporting appropriate reimbursement levels for the PneumRx® Coil both in EU and in US following approval.
Notwithstanding progress to date, in light of the ongoing specific challenges relating to Varithena® and the generally challenging external environment in the industry, the overall risk is assessed to have remained the same as last year.
Principal risksAlthough not exhaustive, we describe in the following table what we believe to be the most significant risks that could materially affect the Group’s ability to achieve its financial goals, operating and strategic objectives. While other risks are deemed less material at this time, given the nature of the Company’s business, risks continually change. Notably the macroeconomic risks in both the US and UK changed markedly in 2016, with the new administration in the US seeking to undertake healthcare reform, and the UK decision to exit the EU. Both of these events introduce significant uncertainty. BTG are monitoring all possibilities and will produce mitigation and control strategies as the situation becomes clearer. At this point apart from the effect of the devaluation of Sterling, there are no immediate effects on the BTG trading position.
As a general risk, the existing and future products launched by the Company may not be a commercial success depending on a number of complex and inter-related factors including: the receipt, maintenance and the scope of the applicable required marketing approvals and clearances (and the time and investment required to obtain approvals); product acceptance by
physicians and patients; commercially viable levels of product reimbursement being established; safety and efficacy continuing to be demonstrated; maintaining continuity of supply; the impact of competition and the successful enforcement of the Group’s intellectual property or defence against third-party intellectual property rights.
The pharmaceutical and medical device industries are highly competitive and require substantial ongoing product investment, innovation and development to sustain a continuing competitive advantage. The Group’s success will continue to depend on its ability to in-license, acquire or develop new products and businesses and to realise the expected benefit from such activities by the application of resources and effectively integrating acquired opportunities into the Group. As BTG operates in such a highly specialised industry, in order to deliver against our strategic objectives we require highly skilled and experienced employees who are highly sought after by our competitors. Challenges in attracting, retaining and motivating such employees may impact our ability to maintain performance levels and to deliver against our strategic growth objectives.
Key
Increased risk
Unchanged risk
Decreased risk
BTG plc Annual Report and Accounts 2017 BTG plc Annual Report and Accounts 2017
68Governance
Corporate Governance reportAccountability continued
Risk General mitigation strategy
Change in 2016/17
Obtaining/Maintaining product regulatory approvals
The pharmaceutical and device industries are highly regulated in relation to the development, approval, manufacturing and sale of products. The development of healthcare products has a high level of inherent risk and a high failure rate. An inability to meet existing or new regulations or regulatory guidance may result in delays or failures in bringing products to market, additional material costs of development or the imposition of restrictions on approval or the sale of a product or its manufacture or distribution, including the possible withdrawal of a product from the market.
Such events may adversely impact the Group’s revenues and prospects.
The Company has expert internal teams dedicated to ensuring compliance in each of these areas, defining regulatory strategies and supporting product approvals and maintenance of existing product licences.
The process is supported by the governance systems defined above and monthly monitoring of performance against goals and of changes in the regulatory landscape.
In 2016 DC Bead® was successfully reclassified in the EU. A similar application has been made for DC Bead LUMI™, the outcome of which is awaited. This follows the successful launch of the sister product LC Bead LUMI™ in the US last year.
The PMA submission to seek US approval of the PneumRx® Coil, was made in February 2017.
The overall level of risk is deemed to have modestly reduced during the year. The regulatory affairs and clinical development teams were reorganised and strengthened during the year. The R&D team continues to be developed. The use of external resources such as contract clinical research organisations (CROs) are now also being more effectively leveraged.
IP/Legal challenges
BTG may be subject to challenges relating to the validity of contracts or its patents or alleging infringement by BTG of intellectual property (IP) rights of others, which might result in cessation of BTG product sales, litigation and/or settlement costs and/or loss of earnings. BTG might elect to sue third parties for their infringement of BTG’s IP in order to protect current or future product revenue streams. Litigation involves significant costs and uncertainties.
BTG may not be able to secure or maintain the necessary IP in relation to products sold, acquired or in development, limiting the potential to generate value from these products and investments. Patent expiries can adversely impact the Group’s revenues due to a resultant increase in competition and price erosion.
Maintenance of the IP and legal functions as core capabilities of the Group, supplemented by external expertise, which monitors third-party patent portfolios and patent applications and IP rights. Monitoring of BTG’s satisfaction of its obligations under key contracts. Development and implementation of BTG patent filing, defence and enforcement strategies, pursuing litigation or settlement strategies where appropriate. Robust processes are in place to automate patent renewals; internal controls established to avoid disclosure of patentable material prior to filing patent applications and to protect valuable know-how.
Zytiga® produces significant licensed revenues for BTG, and is subject to multiple challenges by manufacturers of generic versions in the US. The position has not changed since last year’s Annual Report. Generic competition may enter the market as early as the 2018/19 financial year in the US and 2020/21 financial year in the EU when the ten-year post-approval data exclusivity period ends. In each case generic competition would substantially reduce the value of Zytiga® and the level of royalties received by BTG.
BTG is in a current dispute with Wellstat over the commercialisation of Vistogard®. Wellstat are seeking damages and to terminate the commercialisation agreement under which BTG obtained rights to sell Vistogard in the US. A trial has been heard in the Court of Chancery of the State of Delaware but no judgement has yet been issued. The Group estimate the likelihood of material outflow of funds or loss of rights to the asset to be possible, not probable, and therefore no liability has been recognised. It is currently not possible to make a reliable estimate of any amount that may be required to be paid in respect of the dispute.
The overall risk is assessed as unchanged compared with last year.
Competition
BTG’s products may face competition from products that have superior attributes, including better efficacy or side effect profiles, cost less to produce or be offered at a lower price than BTG’s products.
There are currently no competitive products to CroFab®, DigiFab®, Voraxaze® or Vistogard® but Instituto Bioclon may launch a competitor product to CroFab® around October 2018.
TheraSphere® competes with a product from Sirtex Medical Limited and LC Bead© and DC Bead® compete with products from Boston Scientific Corporation, Terumo and Merit Medical. Varithena® competes with other treatment modalities including heat ablation, vein stripping and physician-compounded sclerosing foam.
EKOS competes with other interventional clot treatment products from US companies like Boston Scientific.
There is a competitor to PneumRx in the form of the Pulmonx, Inc. valve. In Licensing, Zytiga® competes with a number of other treatments for prostate cancer including Xtandi® (enzalutamide) and is at risk of generic competition.
BTG focuses on select opportunities addressing specialist segments where there are relatively high barriers to entry, for example, relating to the development and manufacturing processes, or the need to generate significant supportive clinical data to gain approval and commercial acceptance. We seek adequate reimbursement to differentiate our products by demonstrating, in clinical trials, safety and efficacy benefits, cost effectiveness or greater patient acceptance.
The competitive environment remains a challenge particularly within the Interventional Oncology business but overall the level of risk is unchanged from last year. A key strategic goal for Interventional Oncology is to offer a wider range of products within the portfolio. The Galil Medical acquisition and launch of LUMI™ beads are key pillars of this strategy, which it is hoped will maintain BTG’s lead position in the Interventional Oncology space. Zytiga® is at risk of further competition as noted.
It should be noted that Brexit and evolving healthcare policies in the US may have an effect on competition in the future, however, at this stage it is too early to predict any effects with any meaningful accuracy.
Overall, the risk is assessed as unchanged compared with last year.
BTG plc Annual Report and Accounts 2017
69Governance
Governance
Risk General mitigation strategy
Change in 2016/17
Healthcare law compliance
Extensive laws and regulations relate to how BTG markets its products and interacts with its customers and payers. Failure to meet applicable requirements may result in criminal or civil proceedings against the Group, exclusion of sale of products in certain territories and material financial penalties or other sanctions against the Group (or their commercial partners, or their respective employees or directors).
Defending actual or alleged violations may require significant management time and financial commitment, even if not proven.
A comprehensive compliance programme is in place as referred to above. Ongoing monitoring and auditing is undertaken to seek to ensure any material failures are identified where possible and remediated. The programme is continually reviewed and improved to reflect ongoing learnings and changes to the external environment.
The BTG compliance programme is a Company standard which is introduced to all acquisitions. The programme has been fully implemented by the latest additions to the BTG Group, PneumRx and Galil Medical.
During 2016 BTG reached agreement with the US Department of Justice (DOJ) regarding actions by Biocompatibles and their associated distributors prior to acquisition dating back to 2003. The successful resolution of this action without the imposition by the DOJ of additional compliance controls is seen as evidence of the appropriateness of the BTG compliance programme. As a result the risk in this area has decreased somewhat.
Compliance however remains a key area of vigilance for BTG and complacency is not tolerated. Monitoring continues and all issues are thoroughly investigated and corrective actions tracked through to completion.
There can be no guarantee however that other investigations will not be instigated by the DOJ or other agencies in future. It is expected that legislative burdens in this area will increase in most jurisdictions and therefore programmes will need to be continually improved.
Supply chain/continuity of supply
There are inherent risks to the BTG supply chain as the Company’s products are typically high value, low volume manufacture. Diversifying the supply chain of such products (for example by establishing dual sources of supply) is not cost effective. BTG therefore relies on the following single sources of supply.
Wales for supply of manufactured antibodies and a single site in Farnham, UK, for the manufacture of the Beads and Varithena®. Consequently there is the possibility of disruption to, or loss of supplies resulting from, technical issues, contamination or regulatory actions. BTG polyclonal antibody products rely on serum produced from our sheep flocks in Australia, which could be subject to disease outbreaks or fire.
BTG manufactures its EKOS products at a single site in Seattle, Washington, USA and the PneumRx® Coil at a single site in Santa Clara, California, USA, with the consequent possibilities from disruption to or loss of supply.
Galil Medical consumable items are manufactured at a site in Israel, with the control units manufactured at a site located in Arden Hills, Minnesota, USA.
For other products, namely Voraxaze® and TheraSphere®, we continue to rely on third-party contractors for the supply of many key materials and services. These processes inherently carry risks of failure and loss of product are risks over which the Company has a lower degree of control.
BTG has extensive quality, risk and business continuity management systems to ensure resilience of the supply chain. These management systems are applied equally to both the internal and external elements of supply chain.
Each supply chain is thoroughly assessed and stocks of raw materials, in process materials and finished products are maintained as a result of that risk assessment. Risk assessments are reviewed annually or when business predictions change. Adherence to the agreed stock levels are reviewed monthly through regular business review meetings.
The final mitigation is business interruption insurance, which is maintained at a level for each business to cover at least two years loss of business as result of catastrophic loss of supply.
BTG sites and supply chain partners underwent seventeen inspections by external bodies such as FDA, MHRA and BSI within the 2017 financial year. No major or critical findings were received and corrective actions for all observations were completed or are on track to the timetables agreed with the authorities.
BTG changed its business interruption insurance provider in October 2016, as a result all key sites received an audit from the new provider. All corrective actions have been mutually agreed with the insurance provider, and are being implemented.
As a result of the acquisition of the Galil Medical business in June 2016, BTG purchased additional war and terrorism business interruption insurance specifically for the Israel site.
Standard business interruption insurance remains at two years for most key sites and business but has been maintained at three years for the Wales and Farnham sites.
Overall, the supply chain risk is considered to remain unchanged in comparison with last year.
BTG plc Annual Report and Accounts 2017 BTG plc Annual Report and Accounts 2017
70Governance
Corporate Governance reportAccountability continued

The Board recognises its responsibility to deliver a programme of engagement with shareholders and communication with investors is given a high priority. The Group is committed to regular and open dialogue with all current and potential shareholders and analysts, led by the CEO, the CFO and the Group’s Investor Relations (IR) department. Meetings with investors are principally to communicate the Group’s strategy, performance and policies and their views are regularly shared with the Board.
The Board believes that appropriate steps have been taken during the year to ensure that all members of the Board develop an understanding of the views of the major shareholders. The Investor Relations department acts as the day-to-day contact point for investors and analysts and provide a report at each Board meeting, giving information on material changes in shareholdings and any feedback from the Group’s brokers and investors enabling the Board to further develop an understanding of any issues and concerns of major shareholders. There is a period of concentrated activity following the announcement of the half-year and full-year results, when the CEO and CFO present these results to the Group’s institutional shareholders, analysts and the media.
The Group also participates in UK and overseas investor roadshows and conferences throughout the year. In addition, the Chairman is available to meet institutional investors and the Senior Independent Director and other non-executive directors are available to meet with major shareholders on request. No such meetings were requested during the year.
Extensive information, including annual and interim reports and all press releases, is published in the Investor Relations area on the Group’s website (www.btgplc.com/investors) and individuals can also register to receive electronic copies of all announcements on the day they are issued.
Investor contact by management type(%)
a CEO 27% b CFO 21%c IR 52%
a
b
c
Annual General Meeting (AGM)At the AGM, shareholders will hear directly about the Group’s performance and strategy with a presentation by the CEO, and the Board will have the opportunity to communicate with, and answer questions from, private and institutional shareholders. The forthcoming AGM will be held on 13 July 2017 and the Chairs of the Audit, Nomination and Remuneration Committees will be available to answer questions.
All resolutions are voted on by way of a poll and results of voting will be published in a market announcement and on BTG’s website following the meeting.
Further details of the 2017 AGM can be found on page 101.
BTG plc Annual Report and Accounts 2017
71Governance
Governance
Corporate Governance report Relations with shareholders

Remuneration
Ian MuchAnnual Statement from the Remuneration Committee Chairman
Following significant engagement with our stakeholders and an extensive review of the Policy last year, we were delighted to receive strong levels of shareholder support at the 2016 AGM, with 99% of shareholders voting in favour. The Policy introduced a number of key changes as follows:
— Simplification of the long-term incentive arrangements, with the previous three-year Core award and five-year Multiplier award structure replaced with a simpler less geared three-year PSP award structure.
— Enhanced bonus deferral arrangements under which any bonus in excess of 75% of salary is deferred in shares for three years.
— Introduction of a number of additional best practice features including a two-year post-vesting holding period on PSP awards granted from 2016 and enhanced share ownership guidelines and recovery and withholding provisions.
The Policy has been applied during the year and has elements that link to both the short-term delivery and longer-term value creation goals of the Group. We are confident that it remains appropriate for the business and is aligned with shareholders’ interests. Our KPIs and how they link to our strategy and to remuneration are set on pages 14 and 15 in the Strategic Report. The Committee believes that the alignment of the Policy with our strategic objectives continues to incentivise and drive sustainable value creation for our shareholders. The focus is on rewarding performance and to that end the majority of executive remuneration (approximately 75% at maximum) is variable and only payable if demanding performance targets are met. We will continue to review our approach to remuneration to ensure this remains the case. During the year the Company focused the financial metrics used to communicate its performance on Revenues, Adjusted Operating Profit, Adjusted EPS and free cash flow. The Committee is confident that these metrics were no less demanding than those previously applied to the annual bonus awards and would offer stakeholders a greater degree of clarity when equating performance targets with the financial results.
Dear ShareholderI am pleased to present the Directors’ Remuneration Report for the year ended 31 March 2017. I am grateful for the continued support and engagement of our shareholders and their representative bodies, especially during the Directors’ Remuneration Policy (the Policy) consultation process, which I outlined in last year’s statement.
To help shareholders understand our remuneration structure and its link to the Company’s strategy and performance we have set out our “remuneration at a glance” on page 76. This is followed by the Annual Report on Remuneration on pages 77 to 89 and by an outline of the Policy that was approved last year on pages 90 to 97.
Highlights from 2016/17As described in detail in the Strategic Report, the Group has delivered a strong set of overall results. The strategic focus on Interventional Medicine therapies is driving growth and is aligned with developing macro healthcare trends, which include strong physician interest in less invasive therapy options. Interventional Medicine is now our largest business segment by revenue and growing at a double-digit pace. Together with the licensing income and growing revenue from the Specialty Pharmaceuticals business, it provides capacity for material investments in further R&D and M&A to support sustainable growth over the longer term.
72Governance
BTG plc Annual Report and Accounts 2017 BTG plc Annual Report and Accounts 2017

The targets for 2017/18 bonus awards will be set using these new metrics. In the case of Revenues, given the increasing dependency on the sale of our own products to drive future growth, this will comprise BTG product Revenues (excluding Licensing income, which will however, continue to be included in the other metrics). Further detail on the metrics can be found on page 87. The metrics used to set LTI awards remain unchanged.
In August 2016, Graham Hetherington joined the Board as non-executive director and Chair of the Audit Committee, joining the Remuneration Committee in September 2016.
Review of 2016/17 outcomes Following on from the one-off realignment of the CEO’s salary that took place in 2016, the CEO’s salary was increased by 3% from £650,000 to £669,500. The CFO’s salary was also increased by 3%. Both of these increases are in line with the average increase for BTG employees of 3%.
The Group has continued its strategy of both organic and acquisitive growth and achieved a number of significant milestones during the year, as outlined in the Strategic Report on page 5.
The overall review of the year supported the assessment that the Group and executive directors each met a substantial part of their financial and operational bonus criteria (70% of which related to corporate financial performance and 30% of which related to individual non-financial objectives), which will result in a 82.4% bonus payout for the executive directors of which an amount equivalent to 75% of salary will be paid in cash, with the remainder of the bonus deferred in shares for three years.
However, despite good performance by the Group’s Interventional Oncology, Specialty Pharmaceuticals and EKOS businesses, and the strong overall financial position of the Company, the Company’s share price has not increased to an equivalent extent, adversely impacting the Total Shareholder Return (“TSR”) element of the Core and Multiplier awards vesting this year as explained below.
2012 PSP awardsAwards under the old PSP consisted of Core awards vesting over three years which could be put at risk by the executive directors (i.e. deferred for a further two years) in exchange for an additional equivalent Multiplier award. In that case both the deferred Core award and potential Multiplier award would vest at five years based on the Company’s relative TSR performance over that period.
This year’s single figure for remuneration includes the 2012 PSP awards that will vest later in 2017 based on performance over five years to 31 March 2017. These comprise the Core award granted in 2012 and a matching Multiplier award. Over the five-year performance period, BTG’s TSR is below that of the FTSE 250. As a result, the number of rolled-over Core awards that will vest has been reduced in comparison with the number that would have vested in 2015 if the executive directors had not decided to roll them over and put them at risk. In addition none of the Multiplier awards will vest.
The table below summarises the impact that the decision to roll-over of the Core awards in return for the Multiplier award has had on the value of the awards vesting:
Core award value at 31 March 2015 Core and Multiplier award value at 31 March 2017
% of Coreaward
eligible to vest1
Number ofCore award
shares eligible to vest
Averagethree-
month share
price to 31 March
2015Market
value
% of Coreaward
vesting2
% of Multiplier
awardvesting2
Number ofCore award
shares vesting
Averagethree-
month share
price to 31 March
2017Market
value
Impact of rollover on
value of awards
Louise Makin 100% 124,042 782.84p £971,050 86.87% 0% 107,755 573p £617,436 £(353,614)Rolf Soderstrom 91,974 £720,009 79,897 £457,810 £(262,199)
Notes1. Three year cumulative normalised trading profit period of £198.1m vs Stretch of £177.4m and TSR of 130.4% vs upper
quartile of 110.5%.2. TSR of 68.67% (equivalent to median minus 8.76%).
73Governance
Governance
BTG plc Annual Report and Accounts 2017

Remunerationcontinued
This outcome highlights the very challenging nature of the Core and Multiplier mechanism, which requires sustained above-market TSR performance over a period of five years, aligning the interests of the executive directors with the creation of long-term value for shareholders. As the outstanding performance over the original three-year performance period has not been maintained, the awards to the executive directors
have been scaled back, both in terms of the number of shares vesting but also in terms of total value, which has reduced in proportion to the reduction in share price. Going forward, the two-year post-vesting holding period that applies to awards made from 2016 under the new PSP will create similar alignment retaining sensitivity to changes in share price after the end of the performance period.
2013 PSP awardsThis year’s remuneration single figure will also include the value of the 2013 Core awards that vested in July 2016 (i.e. not rolled over). The table below summarises the value of these awards.
Core award value at 17 July 2016
% of Core award
eligible to vest1
Number of Core award
shares eligible to vest
Percentage Rolled over
Shares vesting
Closing share price on
17 July 2016
Market value of shares
vesting
Louise Makin 100% 208,807 50% 104,404 671p £700,551Rolf Soderstrom 136,864 0% 136,864 £918,357
Note1. Three-year growth in adjusted EPS of 101% and TSR of 82.1% (i.e. above the upper quartile) over three years.
The CEO elected to roll-over 50% of the shares that would otherwise have vested in 2016 in order to receive an equivalent Multiplier award, putting 50% of her Core award at risk for a further two years. Vesting of those 2013 Core, rolled over and the associated Multiplier awards, will be assessed in 2018 based on relative TSR performance over the full five-year period from grant of the original Core award. Having already rolled over the 2012 awards, the CFO did not elect to roll-over any part of his 2013 Core award which vested in full in July 2016. His 2013 Core award and the 50% of the CEO’s Core award that was not rolled over will be included in this year’s single figure calculation.
2014 PSP awardsAs a result of BTG’s financial performance and sustained growth over the past three years, this year 46% of the 2014 Core awards will be capable of vesting, subject to the decision to be made by each executive director whether or not to roll-over 50% or 100% of those awards, in order to receive an equivalent Multiplier award. If no such election is made, vesting will occur in June 2017. Vesting will occur in June 2019 in relation to any part of the award for which an election is made.
2016 PSP awardsIn July 2016, awards were granted under the new PSP established as part of the new Policy. These will be capable of vesting in July 2019 subject to adjusted EPS and TSR performance conditions measured over three financial years. The Multiplier award concept no longer applies but on vesting, these awards will then be subject to a two-year holding period during which the shares may not be sold other than to settle any tax or NICs due.
Pay for Performance (P4P) AssessmentIn considering the bonus payment for the current year and PSP awards vesting in 2017, the Committee is satisfied that these show an appropriate alignment between the reward and performance. The Committee is aware, however, that if a formulaic assessment of the relationship between pay and performance is applied to our 2016/17 Single Figure, based solely on TSR over a three year period, such as that used in ISS’s P4P methodology, it could produce misleading results. This is a consequence of the way in which performance for the Core and Multiplier awards is measured and the fact that both the 2012 and 2013 awards will be reported in the same year’s single figure.
74Governance
BTG plc Annual Report and Accounts 2017 BTG plc Annual Report and Accounts 2017
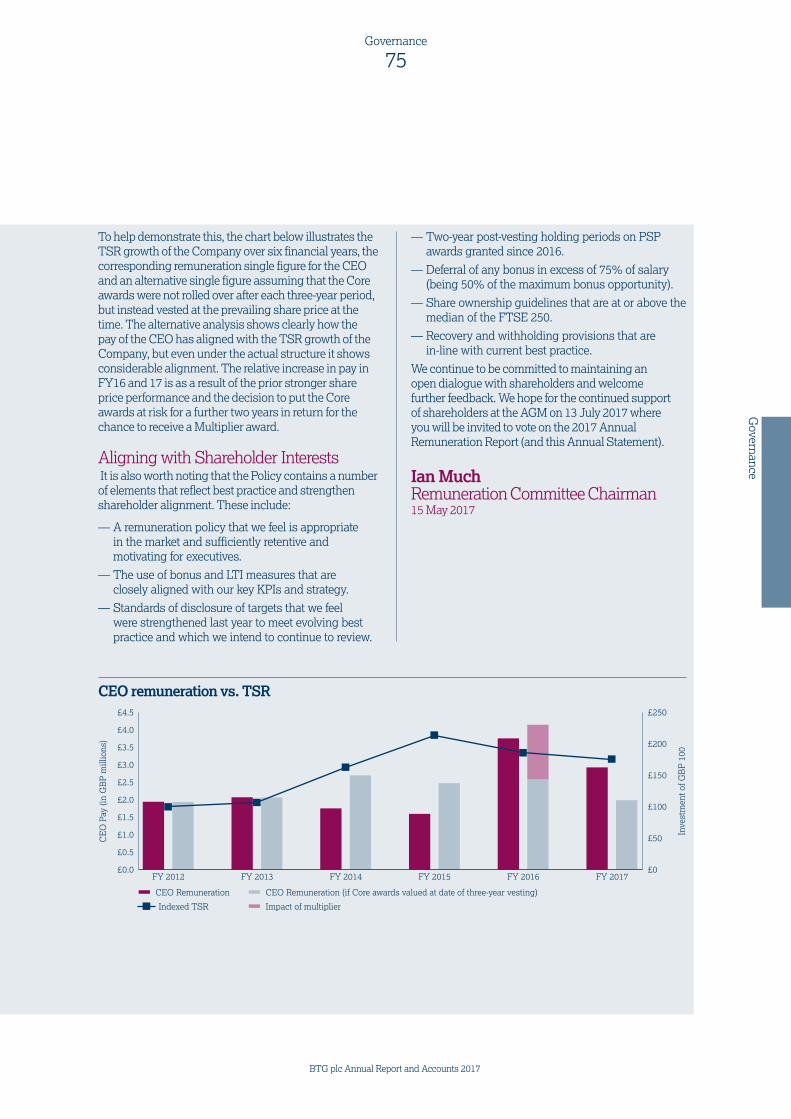
To help demonstrate this, the chart below illustrates the TSR growth of the Company over six financial years, the corresponding remuneration single figure for the CEO and an alternative single figure assuming that the Core awards were not rolled over after each three-year period, but instead vested at the prevailing share price at the time. The alternative analysis shows clearly how the pay of the CEO has aligned with the TSR growth of the Company, but even under the actual structure it shows considerable alignment. The relative increase in pay in FY16 and 17 is as a result of the prior stronger share price performance and the decision to put the Core awards at risk for a further two years in return for the chance to receive a Multiplier award.
Aligning with Shareholder Interests It is also worth noting that the Policy contains a number of elements that reflect best practice and strengthen shareholder alignment. These include:
— A remuneration policy that we feel is appropriate in the market and sufficiently retentive and motivating for executives.
— The use of bonus and LTI measures that are closely aligned with our key KPIs and strategy.
— Standards of disclosure of targets that we feel were strengthened last year to meet evolving best practice and which we intend to continue to review.
— Two-year post-vesting holding periods on PSP awards granted since 2016.
— Deferral of any bonus in excess of 75% of salary (being 50% of the maximum bonus opportunity).
— Share ownership guidelines that are at or above the median of the FTSE 250.
— Recovery and withholding provisions that are in-line with current best practice.
We continue to be committed to maintaining an open dialogue with shareholders and welcome further feedback. We hope for the continued support of shareholders at the AGM on 13 July 2017 where you will be invited to vote on the 2017 Annual Remuneration Report (and this Annual Statement).
Ian MuchRemuneration Committee Chairman 15 May 2017
£0.0
£0.5
£1.0
£1.5
£2.0
£2.5
£3.0
£3.5
£4.5
£4.0
£0
£50
£100
£150
£200
£250
FY 2017FY 2016FY 2015FY 2014FY 2013FY 2012
CEO Remuneration
CE
O P
ay (i
n G
BP
mill
ions
)
Inve
stm
ent o
f GB
P 1
00
Impact of multiplierIndexed TSR
CEO Remuneration (if Core awards valued at date of three-year vesting)
CEO remuneration vs. TSR
75Governance
Governance
BTG plc Annual Report and Accounts 2017
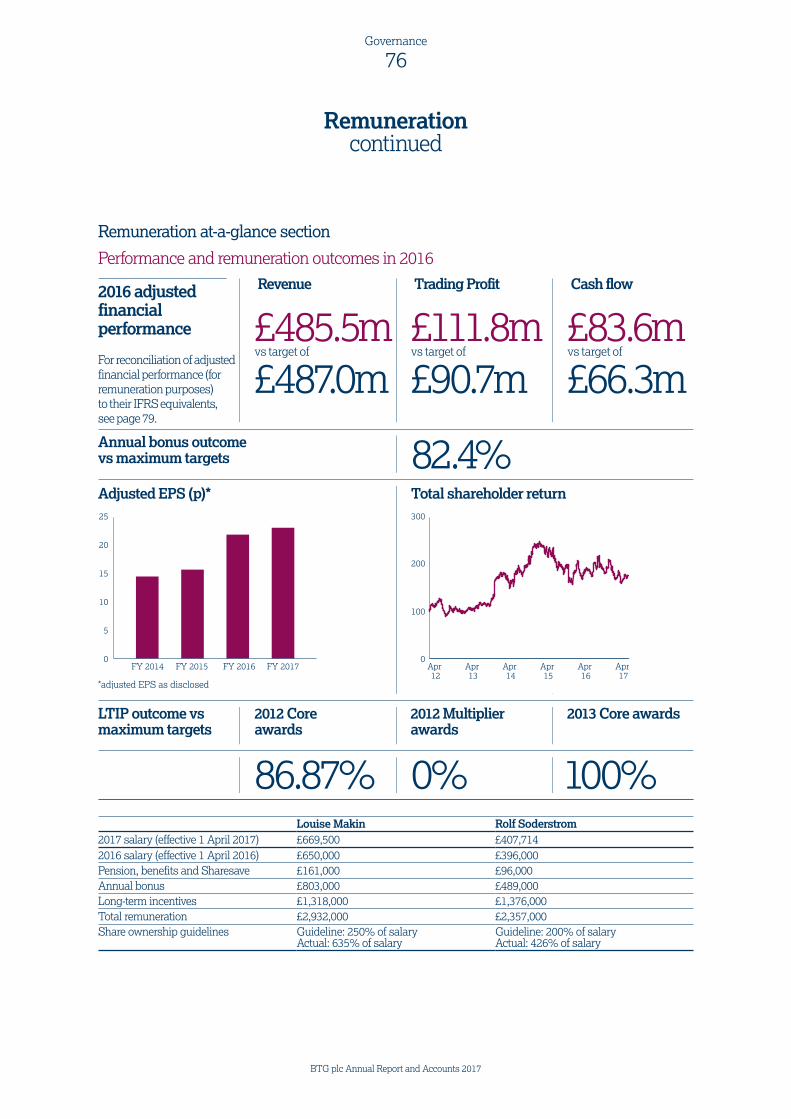
Remunerationcontinued
Remuneration at-a-glance section
Performance and remuneration outcomes in 2016
Louise Makin Rolf Soderstrom2017 salary (effective 1 April 2017) £669,500 £407,7142016 salary (effective 1 April 2016) £650,000 £396,000Pension, benefits and Sharesave £161,000 £96,000Annual bonus £803,000 £489,000Long-term incentives £1,318,000 £1,376,000Total remuneration £2,932,000 £2,357,000Share ownership guidelines Guideline: 250% of salary
Actual: 635% of salaryGuideline: 200% of salary Actual: 426% of salary
2016 adjusted financial performance
Annual bonus outcome vs maximum targets
LTIP outcome vs maximum targets
2012 Multiplier awards
2013 Core awards
Adjusted EPS (p)* Total shareholder return
£111.8mvs target of
£90.7m
82.4%
0% 100%
Trading Profit
£83.6mvs target of
£66.3m
Cash flow
£485.5mvs target of
£487.0m
Revenue
For reconciliation of adjusted financial performance (for remuneration purposes) to their IFRS equivalents, see page 79.
86.87%
2012 Core awards
FY 2016 FY 2017FY 2015FY 20140
5
10
15
20
25
*adjusted EPS as disclosed
Apr 14
Apr 15
Apr 16
Apr 17
Apr 13
Apr 12
0
100
200
300
76Governance
BTG plc Annual Report and Accounts 2017 BTG plc Annual Report and Accounts 2017
Structure of the reportThe report is divided into three parts: (i) the “Annual Statement” summarising the business context in which the Committee has operated; (ii) the “Annual Report on Remuneration” which provides shareholders with details of the major decisions made by the Committee and the remuneration actually delivered to the Group’s directors during the 2016/17 financial year; and (iii) the “Directors’ Remuneration Policy Report”.
Annual report on remunerationThis part of the report has been prepared in accordance with Part 3 of Schedule 8 to the Large and Medium-sized Companies and Groups (Accounts and Reports) Regulations 2008 (as amended). The Annual Remuneration Report will be put to an advisory shareholder vote at the 2017 AGM. The information on pages 72 to 85 has been audited.
About the Remuneration Committee and its advisersThe Remuneration Committee has been established by the Board and is responsible for executive remuneration.
During the year the Committee reviewed and updated its terms of reference, which are available in full on the Group’s website or from the Company Secretary on request.
Members Committee member Date of appointment to the CommitteeIan Much (Chairman) 28 September 2010Giles Kerr 3 November 2009Susan Foden 1 March 2015Graham Hetherington 29 September 2016
Details of attendance at meetings are shown in the table on page 49.
Other attendeesat Remuneration Committee meetings
The Chairman (Garry Watts), CEO (Louise Makin), CFO (Rolf Soderstrom), Head of HR and Director HR Shared Services and Reward may attend meetings by invitation, other than when their own remuneration is being considered.
The Company Secretary (Paul Mussenden) serves as secretary to the Committee.
Committee evaluation
During the year the Committee carried out a review of its effectiveness and the results, along with recommendations for improvement, were reported to the Board. The Committee was found to be operating effectively, with good oversight, engagement and debate of issues. The emphasis will remain on ensuring a strong link between remuneration and performance and strategy, and alignment with shareholder interests.
Committee advisers
The Committee appoints its own advisers as it sees fit and has appointed NBS (part of Aon plc) to act as advisers to the Committee, and a representative usually attends the meetings. NBS is a signatory to the Remuneration Consultant Group’s Code of Conduct which sets out guidelines to ensure that its advice is independent and free from undue influence. NBS advises the Committee on all remuneration issues including the vesting of long-term incentive arrangements. The Committee reviews the performance and independence of NBS on an annual basis, and is satisfied that it remains independent.
The Group continues to use NBS to advise on other matters including remuneration matters in general. NBS also assists with the total shareholder return (TSR) performance measurement and the implementation of employee share schemes and, through Aon plc’s Radford brand, provides the Group with advice on matters specific to the US employment market. The Group also uses Willis Towers Watson and PwC to advise on remuneration issues.
The fees paid to the Committee’s advisers (NBS) in 2016/17 were: £103,078 (2015/16: £172,816). NBS fees were charged predominately on the basis of an hourly rate.
77Governance
Governance
BTG plc Annual Report and Accounts 2017
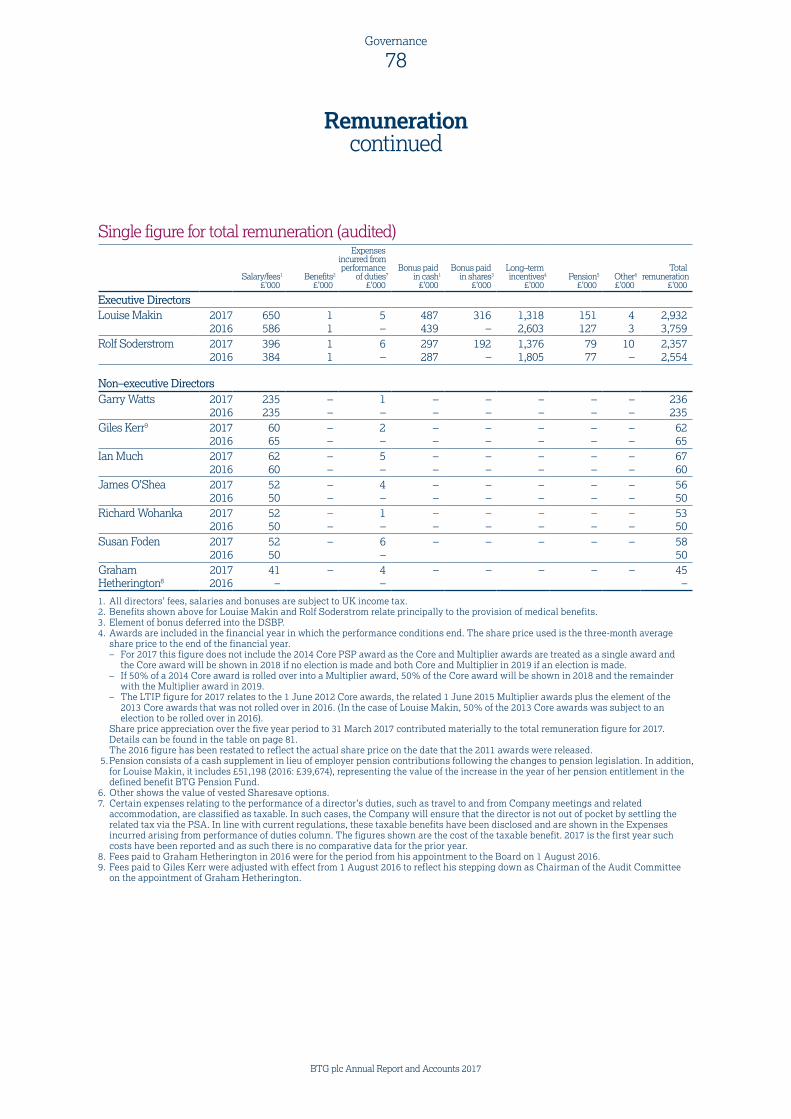
Remunerationcontinued
Single figure for total remuneration (audited)
Salary/fees1
£’000Benefits2
£’000
Expenses incurred from performance
of duties7
£’000
Bonus paid in cash1
£’000
Bonus paid in shares3
£’000
Long–term incentives4
£’000Pension5
£’000Other6
£’000
Total remuneration
£’000
Executive DirectorsLouise Makin 2017 650 1 5 487 316 1,318 151 4 2,932
2016 586 1 – 439 – 2,603 127 3 3,759Rolf Soderstrom 2017 396 1 6 297 192 1,376 79 10 2,357
2016 384 1 – 287 – 1,805 77 – 2,554 Non–executive DirectorsGarry Watts 2017 235 – 1 – – – – – 236
2016 235 – – – – – – – 235Giles Kerr9 2017 60 – 2 – – – – – 62
2016 65 – – – – – – – 65Ian Much 2017 62 – 5 – – – – – 67
2016 60 – – – – – – – 60James O’Shea 2017 52 – 4 – – – – – 56
2016 50 – – – – – – – 50Richard Wohanka 2017 52 – 1 – – – – – 53
2016 50 – – – – – – – 50Susan Foden 2017 52 – 6 – – – – – 58
2016 50 – 50Graham 2017 41 – 4 – – – – – 45Hetherington8 2016 – – –
1. All directors’ fees, salaries and bonuses are subject to UK income tax.2. Benefits shown above for Louise Makin and Rolf Soderstrom relate principally to the provision of medical benefits. 3. Element of bonus deferred into the DSBP. 4. Awards are included in the financial year in which the performance conditions end. The share price used is the three-month average
share price to the end of the financial year. – For 2017 this figure does not include the 2014 Core PSP award as the Core and Multiplier awards are treated as a single award and
the Core award will be shown in 2018 if no election is made and both Core and Multiplier in 2019 if an election is made. – If 50% of a 2014 Core award is rolled over into a Multiplier award, 50% of the Core award will be shown in 2018 and the remainder
with the Multiplier award in 2019. – The LTIP figure for 2017 relates to the 1 June 2012 Core awards, the related 1 June 2015 Multiplier awards plus the element of the
2013 Core awards that was not rolled over in 2016. (In the case of Louise Makin, 50% of the 2013 Core awards was subject to an election to be rolled over in 2016).
Share price appreciation over the five year period to 31 March 2017 contributed materially to the total remuneration figure for 2017. Details can be found in the table on page 81.
The 2016 figure has been restated to reflect the actual share price on the date that the 2011 awards were released. 5. Pension consists of a cash supplement in lieu of employer pension contributions following the changes to pension legislation. In addition,
for Louise Makin, it includes £51,198 (2016: £39,674), representing the value of the increase in the year of her pension entitlement in the defined benefit BTG Pension Fund.
6. Other shows the value of vested Sharesave options.7. Certain expenses relating to the performance of a director’s duties, such as travel to and from Company meetings and related
accommodation, are classified as taxable. In such cases, the Company will ensure that the director is not out of pocket by settling the related tax via the PSA. In line with current regulations, these taxable benefits have been disclosed and are shown in the Expenses incurred arising from performance of duties column. The figures shown are the cost of the taxable benefit. 2017 is the first year such costs have been reported and as such there is no comparative data for the prior year.
8. Fees paid to Graham Hetherington in 2016 were for the period from his appointment to the Board on 1 August 2016.9. Fees paid to Giles Kerr were adjusted with effect from 1 August 2016 to reflect his stepping down as Chairman of the Audit Committee
on the appointment of Graham Hetherington.
78Governance
BTG plc Annual Report and Accounts 2017 BTG plc Annual Report and Accounts 2017

Annual bonus for the year to 31 March 2017 (audited)For the year ended 31 March 2017, bonuses were subject to a maximum of 150% of base salary for executive directors and up to 75% for other senior staff.
Bonus targets were set at the start of the financial year for both Louise Makin and Rolf Soderstrom based on the achievement of targets for revenue growth, trading profit, cash generation and individual KPIs intended to drive future growth in the business. The Committee set threshold and stretch as well as intermediate targets. The bonus is calculated on base salary, with a percentage pay out (against the maximum of 150%) of between 25% at threshold, 50% at on-target and 100% of the maximum at stretch.
The trading profit measure is a normalised measure relating to earnings before amortisation of intangibles, restructuring and acquisition costs, Group foreign exchange movements and movements in the fair value of derivatives. The cash flow measure adjusts for restructuring and acquisition related costs only. The Committee may adjust the final outcome upwards or downwards in the event that an exceptional event occurs, which, in the Committee’s opinion, materially and unreasonably affected the bonus out-turn.
During 2016/17, the Committee assessed that adjustments should be made for each of the following:
(i) exclusion of the impact of the Galil Medical acquisition that occurred during the year, as its performance was not included in the original bonus targets.
(ii) exclusion of the positive impact from foreign exchange translation as a result of the weakening GBP against USD;
(iii) exclusion of realised losses on derivative forward foreign exchange contracts, consistent to the principle of excluding the positive impact from foreign exchange translation that these contracts hedge;
(iv) exclusion of the charge of £28m in relation to the settlement of the US Department of Justice investigation into the historic marketing of LC Bead®; and
(v) exclusion of the above budget performance from the Group’s licensing income.
For the financial year to 31 March 2017 revenue, trading profit and cash flow are calculated as follows:
Revenue£m
Trading profit£m
Free Cash Flow£m
Revenue/profit before tax/net cash flow 570.5 31.6 9.2Adjustments:Fair value of derivatives and Group foreign exchange movement – 13.7 –Amortisation of acquired intangible assets – 42.0 –Fair value changes of contingent consideration liabilities – (0.7) –Fair value changes for acquired Galil Medical inventory – 1.0 –Acquisition and re-organisation costs – 1.1 –Acquisition of Galil Medical – – 55.0
570.5 88.7 64.2Remuneration Committee adjustments:Exclude Galil Medical, not included in original targets (17.2) 0.6 –Translational foreign exchange impacts (53.7) (17.6) –Realised losses on derivatives – 17.1 –Settlement of US government investigation into LC Bead® – 28.0 24.4Royalties above budget (14.1) (5.0) (5.0)
485.5 111.8 83.6
The performance achieved against the bonus targets are summarised as follows:
Measure
As a percentage
of maximum bonus
opportunity
Performance required
Actual(£m)
Louise Makin Rolf Soderstrom
Threshold (£m)
Target(£m)
Stretch(£m)
% of maximum
% of maximum
Corporate Financial TargetsRevenue 23 1/3% 475.0 487.0 503.0 485.5 10.8 10.8Trading profit 23 1/3% 86.1 90.7 95.1 111.8 23.3 23.3Operating cash flow 23 1/3% 61.8 66.3 70.8 83.6 23.3 23.3Individual Corporate Objectives 30% See narrative on the following page 25 25Total 100% 82.4 82.4
79Governance
Governance
BTG plc Annual Report and Accounts 2017
Remunerationcontinued
Key achievements against the objectives included:
— Board approval for an updated Varithena® business plan through January 2019.
— Board approval of the PneumRx® business plan. Progress made with near term execution and development of mid to long-term strategy. PMA submitted and accepted by FDA. Progress with French and German reimbursement.
— R&D organisation realigned with the BU’s to support short-term deliverables. Appropriate R&D investments identified to support 2021/22 revenue goals and develop an earlier stage pipeline to deliver longer-term growth.
— Progress with the external communication of the importance and growth of Interventional Oncology.
— Continued leadership development (with the Leadership Team and senior management group) and putting in place robust succession plans. Specific focus on enhancing commercial capability across BTG.
— Effective transition between Audit Committee Chairs. Continued improvement in the control environment and broader Finance function.
— Cost control activities implemented across R&D, Manufacturing, Quality and G&A Functions.
The table below summarises the targets applicable to each executive director.
Louise Makin Rolf Soderstrom
Varithena® ✓ ✓
PneumRx® ✓ ✓
R&D strategy ✓ ✓
Interventional oncology ✓ ✓
Organisational capability ✓
CFO objectives ✓
Proportion of maximum achieved 25% 25%
Under the remuneration policy approved at the 2016 AGM, the first 75% of salary of any bonus will be paid in cash, with any bonus paid in excess of 75% of salary compulsorily deferred into shares for three years. This is irrespective of whether an applicable shareholding guideline has been met.
Vesting of LTIP Awards (Audited)Core awards granted on 1 June 2012 together with the associated Multiplier awards granted on 1 June 2015 and Core awards granted on 9 June 2014 under the Performance Share Plan will vest in June 2017 based on performance to the year ended 31 March 2017 (subject to a decision by the executive directors to roll over 50% or 100% of the 2014 Core awards).
The performance conditions and estimated vesting outcomes for these awards are as follows:
2012 LTIP – Core and Multiplier (included in the single figure for total remuneration)The Core awards granted in June 2012 were subject to 50% cumulative trading profit and 50% TSR targets over the three years to 31 March 2015. At that time, full vesting was achieved on both elements due to performance of £198.1m trading profit compared to a stretch target of £177.4m, and TSR performance of 130.4% compared to an upper quartile target of 110.5%. Vesting of all Core awards were deferred by each executive director and put at risk in 2015 and in return each director was eligible to receive Multiplier awards, with both elements capable of vesting in June 2017, subject to TSR performance over the five years to 31 March 2017, as detailed in the tables below:
Metric ConditionThreshold Target
0% vesting
Target 100% vesting – Core
0% vesting – Multiplier
Stretch Target100% vesting –
Core and Multiplier Median Actual BTG % Vesting
TSR – 2012 Core and Multiplier
Five-yearcomparisonwith index
Median minus66.66% Median
Median plus100% 77.43% 68.67%
86.87% Core0% Multiplier
80Governance
BTG plc Annual Report and Accounts 2017 BTG plc Annual Report and Accounts 2017
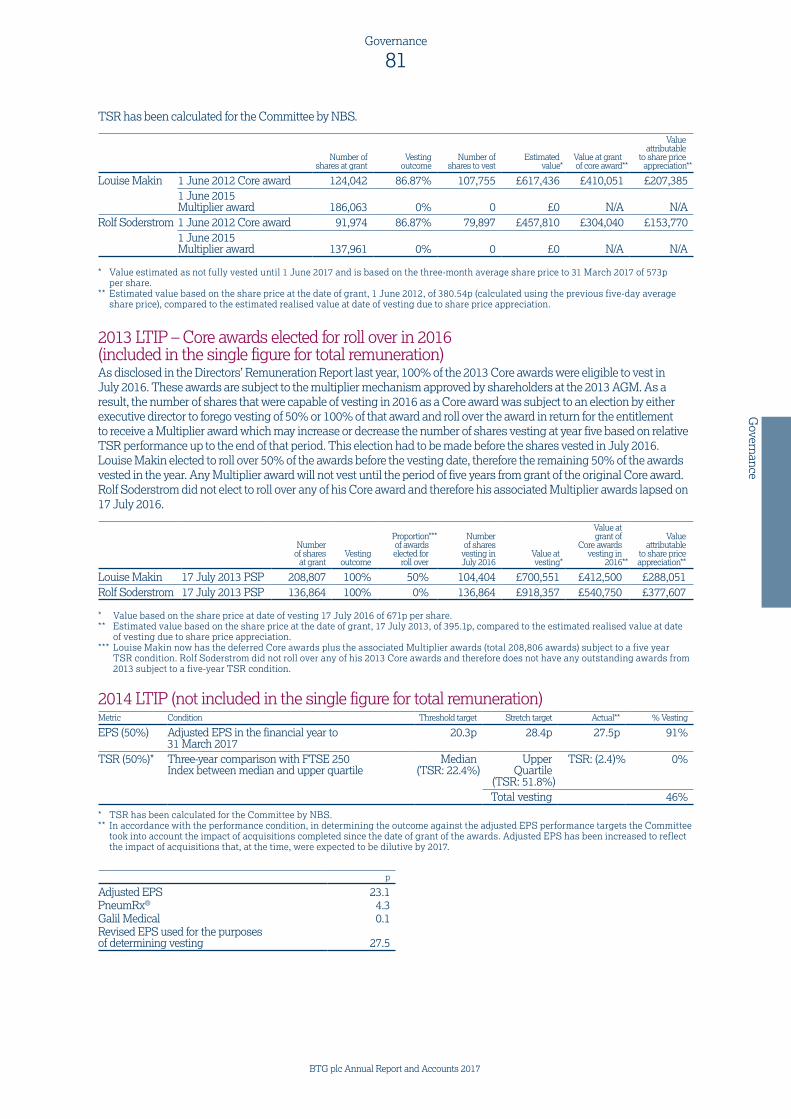
TSR has been calculated for the Committee by NBS.
Number of shares at grant
Vesting outcome
Number of shares to vest
Estimated value*
Value at grant of core award**
Value attributable
to share price appreciation**
Louise Makin 1 June 2012 Core award 124,042 86.87% 107,755 £617,436 £410,051 £207,3851 June 2015 Multiplier award 186,063 0% 0 £0 N/A N/A
Rolf Soderstrom 1 June 2012 Core award 91,974 86.87% 79,897 £457,810 £304,040 £153,7701 June 2015 Multiplier award 137,961 0% 0 £0 N/A N/A
* Value estimated as not fully vested until 1 June 2017 and is based on the three-month average share price to 31 March 2017 of 573p per share.
** Estimated value based on the share price at the date of grant, 1 June 2012, of 380.54p (calculated using the previous five-day average share price), compared to the estimated realised value at date of vesting due to share price appreciation.
2013 LTIP – Core awards elected for roll over in 2016 (included in the single figure for total remuneration)As disclosed in the Directors’ Remuneration Report last year, 100% of the 2013 Core awards were eligible to vest in July 2016. These awards are subject to the multiplier mechanism approved by shareholders at the 2013 AGM. As a result, the number of shares that were capable of vesting in 2016 as a Core award was subject to an election by either executive director to forego vesting of 50% or 100% of that award and roll over the award in return for the entitlement to receive a Multiplier award which may increase or decrease the number of shares vesting at year five based on relative TSR performance up to the end of that period. This election had to be made before the shares vested in July 2016. Louise Makin elected to roll over 50% of the awards before the vesting date, therefore the remaining 50% of the awards vested in the year. Any Multiplier award will not vest until the period of five years from grant of the original Core award. Rolf Soderstrom did not elect to roll over any of his Core award and therefore his associated Multiplier awards lapsed on 17 July 2016.
Number of shares
at grantVesting
outcome
Proportion*** of awards elected for
roll over
Numberof shares
vesting in July 2016
Value at vesting*
Value at grant of
Core awards vesting in
2016**
Value attributable
to share price appreciation**
Louise Makin 17 July 2013 PSP 208,807 100% 50% 104,404 £700,551 £412,500 £288,051Rolf Soderstrom 17 July 2013 PSP 136,864 100% 0% 136,864 £918,357 £540,750 £377,607
* Value based on the share price at date of vesting 17 July 2016 of 671p per share.** Estimated value based on the share price at the date of grant, 17 July 2013, of 395.1p, compared to the estimated realised value at date
of vesting due to share price appreciation.*** Louise Makin now has the deferred Core awards plus the associated Multiplier awards (total 208,806 awards) subject to a five year
TSR condition. Rolf Soderstrom did not roll over any of his 2013 Core awards and therefore does not have any outstanding awards from 2013 subject to a five-year TSR condition.
2014 LTIP (not included in the single figure for total remuneration)Metric Condition Threshold target Stretch target Actual** % Vesting
EPS (50%) Adjusted EPS in the financial year to 31 March 2017
20.3p 28.4p 27.5p 91%
TSR (50%)* Three-year comparison with FTSE 250 Index between median and upper quartile
Median(TSR: 22.4%)
UpperQuartile
(TSR: 51.8%)
TSR: (2.4)% 0%
Total vesting 46%
* TSR has been calculated for the Committee by NBS.** In accordance with the performance condition, in determining the outcome against the adjusted EPS performance targets the Committee
took into account the impact of acquisitions completed since the date of grant of the awards. Adjusted EPS has been increased to reflect the impact of acquisitions that, at the time, were expected to be dilutive by 2017.
p
Adjusted EPS 23.1PneumRx® 4.3Galil Medical 0.1Revised EPS used for the purposes of determining vesting 27.5
81Governance
Governance
BTG plc Annual Report and Accounts 2017

Remunerationcontinued
Number of shares
at grantVesting
outcome
Numberof shares
vesting***Estimated
value*
Value at grant of
Core awards**
Value attributable
to share price appreciation**
Louise Makin 9 June 2014 PSP 141,370 46% 65,030 £372,622 £392,781 £(20,159) Rolf Soderstrom 9 June 2014 PSP 92,661 46% 42,624 £244,236 £257,449 £(13,213)
* Value estimated as not fully vested until 9 June 2017 and is based on the three-month average share price to 31 March 2017 of 573p per share.
** Estimated value based on the share price at the date of grant, 9 June 2014, of 604p (calculated using the previous five-day average share price), compared to the estimated realised value at date of vesting due to share price appreciation.
*** If Core awards are deferred in June 2017, each director will have the Core awards plus the associated Multiplier awards (Louise Makin 130,060 awards and Rolf Soderstrom 85,248 awards) subject to a five-year TSR condition.
The number of shares that are capable of vesting under the 2014 PSP this year as a Core award are subject to an election by either executive director to forego vesting of 50% or 100% of that award and roll over the award in return for the entitlement to receive a Multiplier award which may increase or decrease the number of shares vesting at year five based on relative TSR performance up to the end of that period. This election must be made before the shares vest in June 2017. The Core awards will not vest until the expiry of the period within which directors are able to elect to roll over their awards without a valid election having been made. Any Multiplier award will not vest until the period of five years from grant of the original Core award.
LTIP awards made during the year (audited)On 15 July 2016, the following PSP awards were granted to executive directors.
Type of awardBasis of
award granted Share price at
date of grant
Number of shares over
which award was granted*
Face value of award
Performance period Vesting date
Louise Makin 2016 PSP 225% of salary 704.7p 207,535 £1,462,499 1 April 2016 – 31 March 2019 15 July 2019
Rolf Soderstrom 2016 PSP 225% of salary 704.7p 126,385 £890,635
* The number of shares awarded under the PSP were calculated by reference to the average share price for the five days prior to the date of grant on 15 July 2016 of 704.7p per share.
The number of awards under the 2016 PSP that will vest will be determined according to the satisfaction of the following performance conditions (each performance condition applies to 50% of an award).
Percentage of vesting of that portion of an award*
Adjusted EPS in the financial year to 31 March 2019
Relative TSR ranking against the constituents of the FTSE 250 Index (as at 1 April 2016)
for the period from 1 April 2016 to 31 March 2019
0% < 25.2p (below threshold) Below median25% 25.2p (threshold) Median100% 32.8p (stretch) Upper quartile
* Vesting on a straight line basis in between threshold and stretch (EPS) or median and upper quartile (TSR)
Executive directors will be required to hold vested shares, net of tax, for an additional two-year holding period to 15 July 2021.
82Governance
BTG plc Annual Report and Accounts 2017 BTG plc Annual Report and Accounts 2017
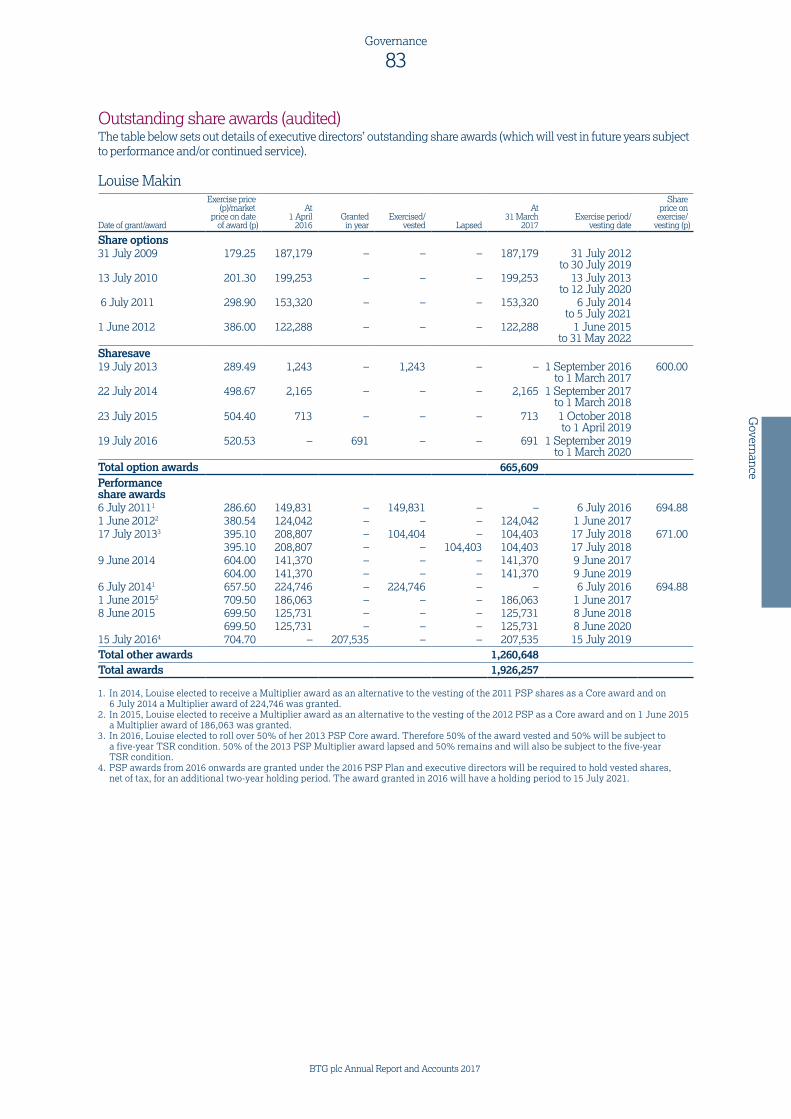
Outstanding share awards (audited)The table below sets out details of executive directors’ outstanding share awards (which will vest in future years subject to performance and/or continued service).
Louise Makin
Date of grant/award
Exercise price (p)/market
price on date of award (p)
At 1 April
2016Granted
in yearExercised/
vested Lapsed
At 31 March
2017Exercise period/
vesting date
Share price on
exercise/vesting (p)
Share options31 July 2009 179.25 187,179 – – – 187,179 31 July 2012
to 30 July 201913 July 2010 201.30 199,253 – – – 199,253 13 July 2013
to 12 July 2020 6 July 2011 298.90 153,320 – – – 153,320 6 July 2014
to 5 July 20211 June 2012 386.00 122,288 – – – 122,288 1 June 2015
to 31 May 2022Sharesave19 July 2013 289.49 1,243 – 1,243 – – 1 September 2016
to 1 March 2017600.00
22 July 2014 498.67 2,165 – – – 2,165 1 September 2017 to 1 March 2018
23 July 2015 504.40 713 – – – 713 1 October 2018to 1 April 2019
19 July 2016 520.53 – 691 – – 691 1 September 2019to 1 March 2020
Total option awards 665,609Performance share awards6 July 20111 286.60 149,831 – 149,831 – – 6 July 2016 694.881 June 20122 380.54 124,042 – – – 124,042 1 June 201717 July 20133 395.10 208,807 – 104,404 – 104,403 17 July 2018 671.00
395.10 208,807 – – 104,403 104,403 17 July 20189 June 2014 604.00 141,370 – – – 141,370 9 June 2017
604.00 141,370 – – – 141,370 9 June 20196 July 20141 657.50 224,746 – 224,746 – – 6 July 2016 694.881 June 20152 709.50 186,063 – – – 186,063 1 June 20178 June 2015 699.50 125,731 – – – 125,731 8 June 2018
699.50 125,731 – – – 125,731 8 June 202015 July 20164 704.70 – 207,535 – – 207,535 15 July 2019Total other awards 1,260,648Total awards 1,926,257
1. In 2014, Louise elected to receive a Multiplier award as an alternative to the vesting of the 2011 PSP shares as a Core award and on 6 July 2014 a Multiplier award of 224,746 was granted.
2. In 2015, Louise elected to receive a Multiplier award as an alternative to the vesting of the 2012 PSP as a Core award and on 1 June 2015 a Multiplier award of 186,063 was granted.
3. In 2016, Louise elected to roll over 50% of her 2013 PSP Core award. Therefore 50% of the award vested and 50% will be subject to a five-year TSR condition. 50% of the 2013 PSP Multiplier award lapsed and 50% remains and will also be subject to the five-year TSR condition.
4. PSP awards from 2016 onwards are granted under the 2016 PSP Plan and executive directors will be required to hold vested shares, net of tax, for an additional two-year holding period. The award granted in 2016 will have a holding period to 15 July 2021.
83Governance
Governance
BTG plc Annual Report and Accounts 2017

Remunerationcontinued
Rolf Soderstrom
Date of grant/award
Exercise price (p)/market
price on date of award (p)
At 1 April
2016Granted
in yearExercised/
vested Lapsed
At 31 March
2017Exercise period/
vesting date
Share price on
exercise/vesting (p)
Share options31 July 2009 179.25 102,649 – – – 102,649 31 July 2012
to 30 July 201913 July 2010 201.30 129,514 – – – 129,514 13 July 2013
to 12 July 2020 6 July 2011 298.90 99,658 – – – 99,658 6 July 2014
to 5 July 20211 June 2012 386.00 90,673 – – – 90,673 1 June 2015
to 31 May 2022Sharesave19 July 2013 289.49 3,108 – 3,108 – – 1 September 2016
to 1 March 2017600.00
23 July 2015 504.40 1,784 – – – 1,784 1 October 2018to 1 April 2019
19 July 2016 520.53 – 1,729 – – 1,729 1 September 2019to 1 March 2020
Total option awards 426,007Performance share awards6 July 20111 286.60 103,913 – 103,913 – – 6 July 2016 694.881 June 20122 380.54 91,974 – – – 91,974 1 June 201517 July 20133 395.10 136,864 – 136,864 – – 17 July 2016 671.00
395.10 136,864 – – 136,864 – 17 July 20189 June 2014 604.00 92,661 – – – 92,661 9 June 2017
604.00 92,661 – – – 92,661 9 June 20196 July 20141 657.50 155,869 – 155,869 – – 6 July 2016 694.881 June 20152 709.50 137,961 – – – 137,961 1 June 20178 June 2015 699.50 82,411 – – – 82,411 8 June 2018
699.50 82,411 – – – 82,411 8 June 202015 July 20164 704.70 – 126,385 – – 126,385 15 July 2019Total other awards 706,464Total awards 1,132,471
1. In 2014, Rolf elected to receive a Multiplier award as an alternative to the vesting of the 2011 PSP shares as a Core award and on 6 July 2014 a Multiplier award of 155,869 was granted.
2. In 2015, Rolf elected to receive a Multiplier award as an alternative to the vesting of the 2012 PSP as a Core award and on 1 June 2015 a Multiplier award of 137,961 was granted.
3. In 2016, Rolf did not elect to roll over any of his 2013 PSP Core award. Therefore all of his 2013 PSP Multiplier award lapsed and none of his 2013 PSP awards will be subject to the five-year TSR condition.
4. PSP awards from 2016 onwards are granted under the 2016 PSP Plan and executive directors will be required to hold vested shares, net of tax, for an additional two-year holding period. The award granted in 2016 will have a holding period to 15 July 2021.
84Governance
BTG plc Annual Report and Accounts 2017 BTG plc Annual Report and Accounts 2017

Share options and performance shares were granted for nil consideration. The price used for calculating the number of shares awarded under the PSP was based on the average of the closing share prices over the five days immediately prior to the award date. Share options are awarded using the closing mid-market price on the date before grant. Sharesave options were granted on the condition that participants agreed to enter into a monthly savings contract.
Awards are normally satisfied using new issue shares. The Group’s share plans comply with recommended guidelines on dilution limits and the Group has always operated within these limits. Assuming none of the extant options lapse and will be exercised and, having included all exercised options, the Group has utilised 3.7% of the 10% in ten years and 3.2% of the 5% in ten years in accordance with the Association of British Insurers (ABI) guidance on dilution limits.
Directors’ pensions (audited) Louise Makin is a member of the BTG Pension Fund. The Fund is a contracted-out defined benefit arrangement which provides a pension based on an accrual rate of either one sixtieth or one eightieth of basic salary (up to the HMRC Earnings Cap), depending on the level of contributions paid by members of 7% or 5% respectively. Members are able to retire at any time from age 60 without any actuarial reduction to the pension payable (for Louise Makin this is 2020). Under current legislation, if members continue to work beyond age 60, they may continue to pay contributions and enhance their pension entitlement, subject to a maximum of 40 years pensionable service. Pension payments post retirement are increased annually by inflation for pensionable service earned up to 5 April, 2006 and inflation subject to a ceiling of 2.5% for pensionable service earned after that date. Members may take early retirement, once they have reached 55 years of age, although any pension paid will be subject to an actuarial reduction. Ill-health retirements may be permitted from an earlier age subject to meeting certain medical conditions. In the event of the death of a member, the Fund provides for a spouse’s (or at the discretion of the pension fund trustees and subject to certain conditions being met, a partner who is not a spouse) pension to be payable equal to two-thirds of the deceased member’s pension (including any pension exchanged for a retirement lump sum). For current active members, a lump sum death benefit equal to four times basic salary (up to the earnings cap) plus refund of the member’s contributions is also payable.
During the year Louise Makin contributed £10,542 (2016: £10,458) to the Fund, representing 7% of her salary up to the earnings cap and the Group contributed £59,111 (2016: £52,141).
Louise Makin receives a cash payment in lieu of pension to the value of 20% of base salary over the earnings cap. Rolf Soderstrom receives a cash payment in lieu of pension contributions to the aggregate value of 20% of base salary. These pension allowances are not subject to bonus or other benefits and are paid less such deductions as are required by law.
Directors’ shareholding and share interests (audited)Executive Directors are required to build and maintain a holding of Group shares worth at least 250% of salary in the case of the CEO and 200% of salary in the case of the CFO. As at the date of this report they have already met such requirements.
DirectorsBeneficially owned at 31 March 2017
and at the date of this report
Vested unexercised market value options
Subject to performance conditions
Guideline met? Options PSP Options
Louise Makin 704,127 Yes 662,040422,494
1,260,648 – Rolf Soderstrom 287,336 Yes 706,464 – Garry Watts 10,000Giles Kerr – Ian Much –James O’Shea –Richard Wohanka 26,500Susan Foden –Graham Hetherington –
Vested unexercised nil cost options count towards the guidelines on the basis of their net of tax value. Market value options do not count until such time as they have been exercised.
The Directors are not permitted to hold their shares in hedging arrangements or as collateral for loans without the express permission of the Board. None of the directors currently holds or has held their shares in such an arrangement.
85Governance
Governance
BTG plc Annual Report and Accounts 2017

Remunerationcontinued
Percentage increase in the remuneration of the Chief Executive Officer CEO
% change from 2016 to 2017
– Salary 10.9– Benefits (6.2)– Bonus 82.9Average per UK employee1
– Salary 4.6– Benefits (5.8)– Bonus2 1.1
1. We have an international workforce, however, as Louise Makin is a UK employee, the Committee considers UK employees to be the most relevant comparator group.
2. UK employee bonus based on estimated average payout for 31 March 2017.
Total shareholder return The performance of the Group’s ordinary shares compared with the FTSE 250 (the Index) for the eight-year period ended on 31 March 2017 is shown in the graph below.
31 March 2009
31 March 2010
31 March 2011
31 March 2012
31 March 2013
31 March 2014
31 March 2015
31 March 2016
31 March 2017
Val
ue (£
) (re
base
d)
BTG FTSE 250
This graph shows the value, by 31 March 2017, of £100 invested in BTG on 31 March 2009, compared with the value of £100 invested in the FSE 250 Index on the same date.
The other points plotted are the values at intervening financial year-ends.
700
600
500
400
300
200
100
Source: Datastream (Thomson Reuters)
The Group has chosen the Index as a comparator as it believes that it gives shareholders a reasonable comparison with the TSR of other equity investments in companies of a broadly similar size across all sectors. The TSR performance has been measured by NBS.
The middle market price of an ordinary share on 31 March 2017 was 615.5p. During the year the share price ranged from a low of 534.5p to a high of 728.0p.
Total remuneration for the Chief Executive Officer over time2010 2011 2012 2013 2014 2015 2016 2017
Total Remuneration (£,000) 1,351 1,489 1,944 2,073 1,757 1,606 3,759 2,932Bonus Outturn (%) 79% 70% 95% 100% 82% 89% 75% 82%LTIP Vesting (%) 100% 89% 80% 92% 100% 100% 100% 51%
The chart above shows the total remuneration for the Chief Executive Officer during each of the financial years. The total remuneration figure includes the annual bonus and LTIP awards that vested based on performance in those years. The annual bonus and LTIP percentages show the payout for each year as a percentage of the maximum. 2017 reflects the vesting of the 2012 Core awards, the related 2015 Multiplier awards and the 2013 Core awards that were not rolled forward in 2016.
86Governance
BTG plc Annual Report and Accounts 2017 BTG plc Annual Report and Accounts 2017

Relative importance of spend on pay The table below illustrates the change in expenditure by the Group on remuneration paid to all the employees of the Group and distributions to shareholders from the financial year ended 31 March 2016 to the financial year ended 31 March 2017.
2017£m
2016£m
PercentageChange
Overall expenditure on pay 164.0 116.2 41%Dividend plus share buyback nil nil n/a
These matters were selected to be shown as they represent key distributions by the Group to its stakeholders. The increase in expenditure on pay is largely linked to the increase in headcount of the Group in the year through both organic growth and the impact of the acquisition of Galil Medical.
How the 2016 policy will be applied in 2017 onwards2017 salary reviewAverage increases for BTG’s UK employees for 2017 were 3%. The executive directors’ salaries were reviewed in March 2017 and the following increases took effect from 1 April 2017:
Salary as at 1 April 2017
Salary as at 1 April 2016 Increase %
Louise Makin £669,500 £650,000 3%Rolf Soderstrom £407,714 £395,839 3%
Performance targets for the 2017 annual bonus The bonus opportunity for 2017 will be 150% of salary for both directors and will continue to be based on corporate financial (70% of the total bonus) and individual non-financial metrics (30% of the total bonus) as detailed in the policy report on page 90.
The Committee has chosen not to disclose, in advance, the performance targets for the forthcoming year as these include items which the Committee considers commercially sensitive. However, the targets will be based on three financial metrics, being BTG product revenues (1/3 weighting), adjusted operating profit (1/3 weighting) and free cash flow (1/3 weighting). Full retrospective disclosure of the financial targets and performance against them will be seen in next year’s Annual Remuneration Report. The individual and corporate metrics will also be disclosed to the extent possible given their ongoing commercial sensitivity.
The first 75% of salary of any bonus will be paid in cash, with any bonus paid in excess of 75% of salary compulsorily deferred into shares for three years.
Performance targets for the 2017 PSP awardsThe Committee’s policy is to grant executive directors annual PSP awards. The Committee intends to grant awards in June 2017 at the level of 225% of salary to each executive director.
Targets for the PSP awards made during 2017/18 will be measured in the final year of the three year period (the 2019/20 financial year) and are as follows:
Adjusted EPS in the year ending 31 March 2020
TSR relative to the constituents of the FTSE 250 over three financial years ending 31 March 2020
Percentage of each element that vests
Below threshold Less than 29p Less than median 0%Threshold 29p Median 25%Between Threshold and stretch
29p to 39.5p Between median and upper quartile
25% to 100%
Stretch 39.5p or higher Upper quartile or higher 100%Payouts for performance between Threshold and Stretch calculated on a straight-line basis
The Committee considered these to be appropriately stretching targets having regard to the anticipated expiry of royalty licences, ongoing investment in R&D and an increase in the Group’s medium-term effective tax rate. Targets have been set assuming constant currency.
Executive Directors will be required to hold vested shares, net of tax, for a further two-year holding period.
87Governance
Governance
BTG plc Annual Report and Accounts 2017
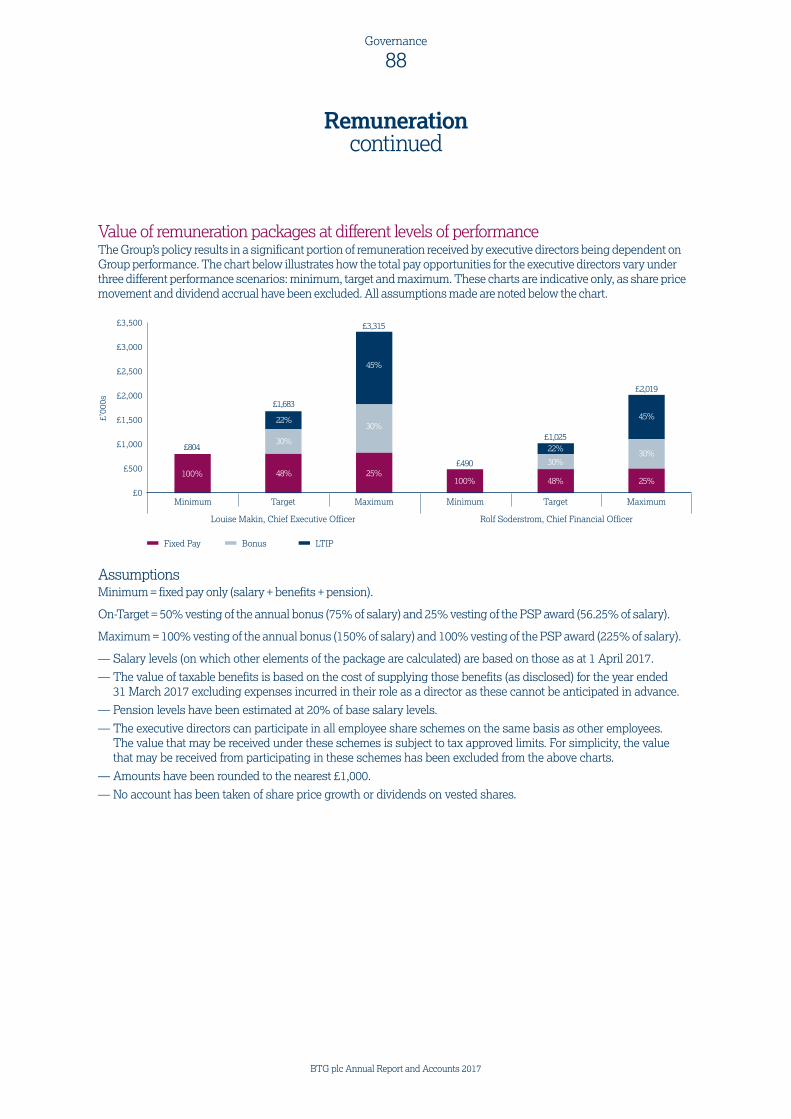
Remunerationcontinued
Value of remuneration packages at different levels of performanceThe Group’s policy results in a significant portion of remuneration received by executive directors being dependent on Group performance. The chart below illustrates how the total pay opportunities for the executive directors vary under three different performance scenarios: minimum, target and maximum. These charts are indicative only, as share price movement and dividend accrual have been excluded. All assumptions made are noted below the chart.
£0
£500
£1,000
£1,500
£2,000
£2,500
£3,000
£3,500
MaximumTarget
Louise Makin, Chief Executive Officer Rolf Soderstrom, Chief Financial Officer
Minimum
Fixed Pay
£’00
0s
Bonus LTIP
MaximumTargetMinimum
100%
£804
48%100%
£490
48% 25%
30%
45%
£2,019
30%
22%£1,025
25%
30%
45%
£3,315
30%
22%
£1,683
Assumptions Minimum = fixed pay only (salary + benefits + pension).
On-Target = 50% vesting of the annual bonus (75% of salary) and 25% vesting of the PSP award (56.25% of salary).
Maximum = 100% vesting of the annual bonus (150% of salary) and 100% vesting of the PSP award (225% of salary).
— Salary levels (on which other elements of the package are calculated) are based on those as at 1 April 2017.
— The value of taxable benefits is based on the cost of supplying those benefits (as disclosed) for the year ended 31 March 2017 excluding expenses incurred in their role as a director as these cannot be anticipated in advance.
— Pension levels have been estimated at 20% of base salary levels.
— The executive directors can participate in all employee share schemes on the same basis as other employees. The value that may be received under these schemes is subject to tax approved limits. For simplicity, the value that may be received from participating in these schemes has been excluded from the above charts.
— Amounts have been rounded to the nearest £1,000.
— No account has been taken of share price growth or dividends on vested shares.
88Governance
BTG plc Annual Report and Accounts 2017 BTG plc Annual Report and Accounts 2017

Non-executive director 2017 remunerationSet out in the table below are the fees paid for the year ended 31 March 2017 and proposed fees for the year ending 31 March 2018.
Director
As from 1 April 2017
£
As from 1 April 2016
£ % increase
Chairman1 235,000 235,000 0%Non-executive director 53,560 52,000 3%Senior independent director fee 5,000 5,000 0%Audit Committee chairmanship fee 10,000 10,000 0%Remuneration Committee chairmanship fee 10,000 10,000 0%
1. The fee is fixed until 31 December 2017, with no additional fee paid for his role as Chair of the Nomination Committee
Shareholder voting at the Annual General MeetingAt last year’s Annual General Meeting held on 14 July 2016, the following votes were received from shareholders:
Remuneration Report (votes) Percentage of eligible votes
Votes cast in favour 321,092,715 98.91%Votes cast against 3,540,586 1.09%Total votes cast 324,633,301 100%Abstentions 1,750,366
Remuneration Policy (votes) Percentage of eligible votes
Votes cast in favour 322,172,730 98.88%Votes cast against 3,654,672 1.12%Total votes cast 325,827,402 100%Abstentions 543,261
Approve PSP (votes) Percentage of eligible votes
Votes cast in favour 322,103,171 98.86%Votes cast against 3,712,538 1.14%Total votes cast 325,815,709 100%Abstentions 567,958
Approval This report was approved by the Board on 15 May 2017 and signed on its behalf by
Ian MuchChairman of the Remuneration Committee
89Governance
Governance
BTG plc Annual Report and Accounts 2017
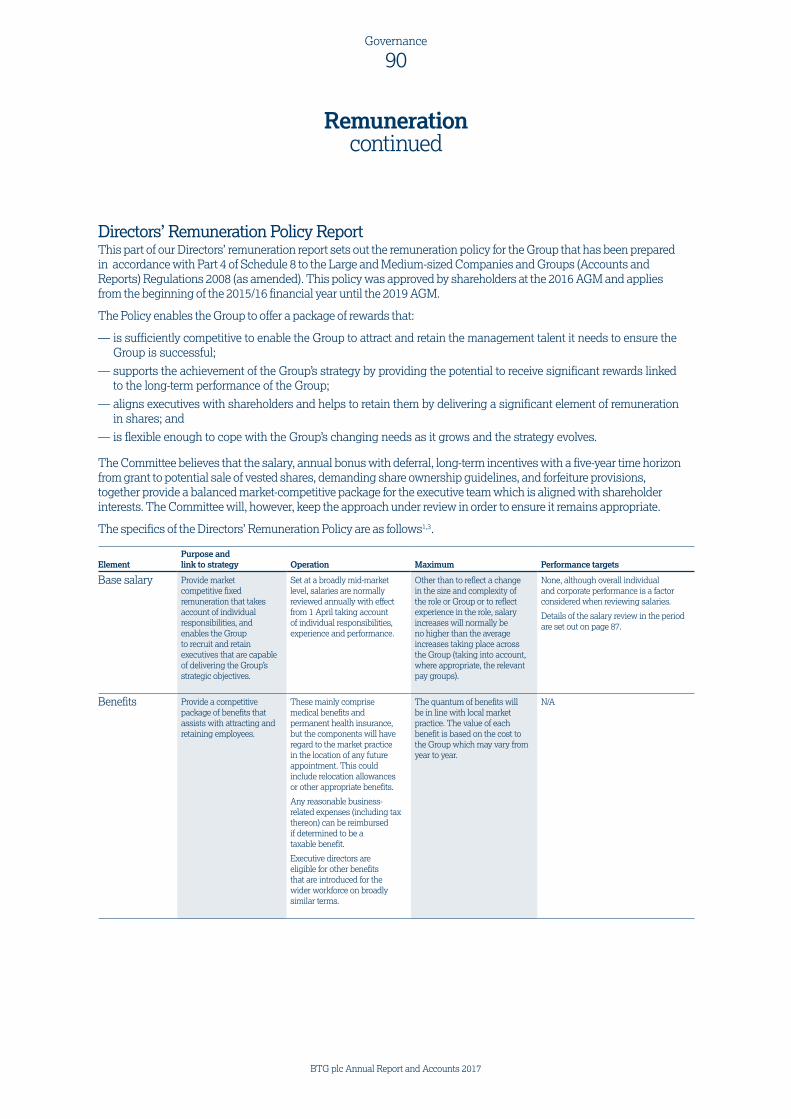
Remunerationcontinued
Directors’ Remuneration Policy ReportThis part of our Directors’ remuneration report sets out the remuneration policy for the Group that has been prepared in accordance with Part 4 of Schedule 8 to the Large and Medium-sized Companies and Groups (Accounts and Reports) Regulations 2008 (as amended). This policy was approved by shareholders at the 2016 AGM and applies from the beginning of the 2015/16 financial year until the 2019 AGM.
The Policy enables the Group to offer a package of rewards that:
— is sufficiently competitive to enable the Group to attract and retain the management talent it needs to ensure the Group is successful;
— supports the achievement of the Group’s strategy by providing the potential to receive significant rewards linked to the long-term performance of the Group;
— aligns executives with shareholders and helps to retain them by delivering a significant element of remuneration in shares; and
— is flexible enough to cope with the Group’s changing needs as it grows and the strategy evolves.
The Committee believes that the salary, annual bonus with deferral, long-term incentives with a five-year time horizon from grant to potential sale of vested shares, demanding share ownership guidelines, and forfeiture provisions, together provide a balanced market-competitive package for the executive team which is aligned with shareholder interests. The Committee will, however, keep the approach under review in order to ensure it remains appropriate.
The specifics of the Directors’ Remuneration Policy are as follows1,3.
ElementPurpose and link to strategy Operation Maximum Performance targets
Base salary Provide market competitive fixed remuneration that takes account of individual responsibilities, and enables the Group to recruit and retain executives that are capable of delivering the Group’s strategic objectives.
Set at a broadly mid-market level, salaries are normally reviewed annually with effect from 1 April taking account of individual responsibilities, experience and performance.
Other than to reflect a change in the size and complexity of the role or Group or to reflect experience in the role, salary increases will normally be no higher than the average increases taking place across the Group (taking into account, where appropriate, the relevant pay groups).
None, although overall individual and corporate performance is a factor considered when reviewing salaries.
Details of the salary review in the period are set out on page 87.
Benefits Provide a competitive package of benefits that assists with attracting and retaining employees.
These mainly comprise medical benefits and permanent health insurance, but the components will have regard to the market practice in the location of any future appointment. This could include relocation allowances or other appropriate benefits.
Any reasonable business-related expenses (including tax thereon) can be reimbursed if determined to be a taxable benefit.
Executive directors are eligible for other benefits that are introduced for the wider workforce on broadly similar terms.
The quantum of benefits will be in line with local market practice. The value of each benefit is based on the cost to the Group which may vary from year to year.
N/A
90Governance
BTG plc Annual Report and Accounts 2017 BTG plc Annual Report and Accounts 2017
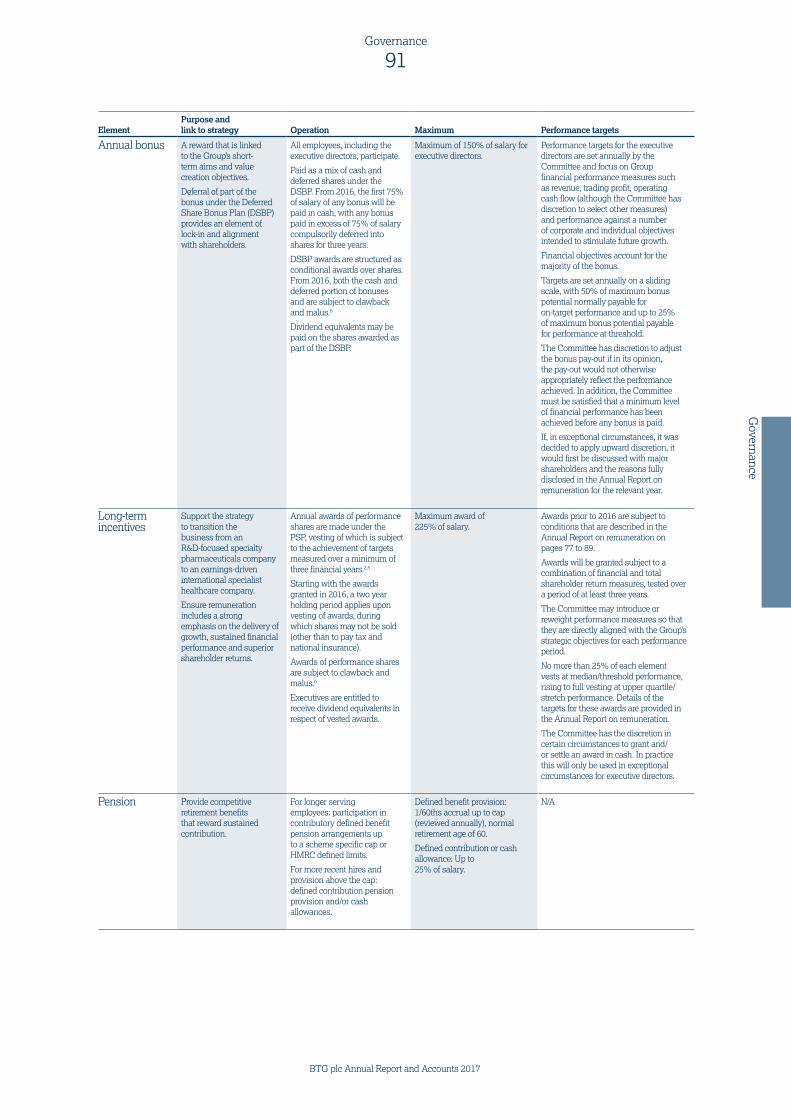
ElementPurpose and link to strategy Operation Maximum Performance targets
Annual bonus A reward that is linked to the Group’s short-term aims and value creation objectives.
Deferral of part of the bonus under the Deferred Share Bonus Plan (DSBP) provides an element of lock-in and alignment with shareholders.
All employees, including the executive directors, participate.
Paid as a mix of cash and deferred shares under the DSBP. From 2016, the first 75% of salary of any bonus will be paid in cash, with any bonus paid in excess of 75% of salary compulsorily deferred into shares for three years.
DSBP awards are structured as conditional awards over shares. From 2016, both the cash and deferred portion of bonuses and are subject to clawback and malus.6
Dividend equivalents may be paid on the shares awarded as part of the DSBP.
Maximum of 150% of salary for executive directors.
Performance targets for the executive directors are set annually by the Committee and focus on Group financial performance measures such as revenue, trading profit, operating cash flow (although the Committee has discretion to select other measures) and performance against a number of corporate and individual objectives intended to stimulate future growth.
Financial objectives account for the majority of the bonus.
Targets are set annually on a sliding scale, with 50% of maximum bonus potential normally payable for on-target performance and up to 25% of maximum bonus potential payable for performance at threshold.
The Committee has discretion to adjust the bonus pay-out if in its opinion, the pay-out would not otherwise appropriately reflect the performance achieved. In addition, the Committee must be satisfied that a minimum level of financial performance has been achieved before any bonus is paid.
If, in exceptional circumstances, it was decided to apply upward discretion, it would first be discussed with major shareholders and the reasons fully disclosed in the Annual Report on remuneration for the relevant year.
Long-term incentives
Support the strategy to transition the business from an R&D-focused specialty pharmaceuticals company to an earnings-driven international specialist healthcare company.
Ensure remuneration includes a strong emphasis on the delivery of growth, sustained financial performance and superior shareholder returns.
Annual awards of performance shares are made under the PSP, vesting of which is subject to the achievement of targets measured over a minimum of three financial years.2,5
Starting with the awards granted in 2016, a two year holding period applies upon vesting of awards, during which shares may not be sold (other than to pay tax and national insurance).
Awards of performance shares are subject to clawback and malus.6
Executives are entitled to receive dividend equivalents in respect of vested awards.
Maximum award of 225% of salary.
Awards prior to 2016 are subject to conditions that are described in the Annual Report on remuneration on pages 77 to 89.
Awards will be granted subject to a combination of financial and total shareholder return measures, tested over a period of at least three years.
The Committee may introduce or reweight performance measures so that they are directly aligned with the Group’s strategic objectives for each performance period.
No more than 25% of each element vests at median/threshold performance, rising to full vesting at upper quartile/stretch performance. Details of the targets for these awards are provided in the Annual Report on remuneration.
The Committee has the discretion in certain circumstances to grant and/or settle an award in cash. In practice this will only be used in exceptional circumstances for executive directors.
Pension Provide competitive retirement benefits that reward sustained contribution.
For longer serving employees: participation in contributory defined benefit pension arrangements up to a scheme specific cap or HMRC defined limits.
For more recent hires and provision above the cap: defined contribution pension provision and/or cash allowances.
Defined benefit provision: 1/60ths accrual up to cap (reviewed annually), normal retirement age of 60.
Defined contribution or cash allowance: Up to 25% of salary.
N/A
91Governance
Governance
BTG plc Annual Report and Accounts 2017

Remunerationcontinued
ElementPurpose and link to strategy Operation Maximum Performance targets
All-employee share plans
Encourages employees to acquire shares in BTG, increasing alignment with shareholders.
Executive directors can participate in BTG’s save-as-you-earn scheme, which is open to all UK employees.
A US Internal Revenue Service 423 Plan with standard terms is operated for US employees.
Participation limits are those set by the relevant tax authorities from time to time.
N/A4
Shareholding guidelines
Provide alignment between executives and shareholders.
Executive directors are required to build significant shareholdings in the Group.7
Executive directors may sell vesting shares to meet tax and national insurance liabilities. In addition, provided they have achieved and continue to meet the applicable shareholding guideline level, they will be permitted to sell shares over and above those required to meet their tax liabilities and national insurance liabilities within 30-day periods after either (i) the announcement of the Group’s results and completion of the related investor road-show or (ii) the date of subsequent vesting of shares with respect to the period to which those results relate (in either case subject to agreement with the Chairman and any other legal restrictions on share dealings).
CEO: 250% of salary.
CFO: 200% of salary.
N/A
Footnotes 1. In line with the Investment Association’s Guidelines on Responsible Investment Disclosure, the Committee will ensure that the incentive
structure for executive directors and senior management will not raise environmental, social or governance (ESG) risks by inadvertently motivating irresponsible behaviour. More generally, the Committee will ensure that the overall remuneration policy does not encourage inappropriate operational risk-taking.
2. Prior to 2013, awards consisted of a mix of market value share options granted under the ESOP and performance shares granted under the 2006 PSP. Awards granted under the 2006 PSP consist of a Core award and a Multiplier award and executive directors are able to roll over 0%, 50% or 100% of any Core award that would vest in return for a Multiplier award that could increase or decrease the value of the Core award, vesting after five years from the date of grant, subject to performance conditions. The full structure of these awards is outlined in the policy approved at the 2013 AGM.
3. A description of how the Group intends to implement the policy set out in this table for 2017 can be found in the Annual Remuneration Report. 4. All-employee share plans do not have performance conditions. Executive directors are eligible to participate in the UK Sharesave Plan
on the same terms as other employees. 5. Copies of the PSP and DSBP plan rules are available on request from the Company Secretary.6. All awards granted post 1 July 2011 under the DSBP, PSP and ESOP are subject to clawback and malus in the event of a material
misstatement of the financial results of the Group for the financial year to which an award relates being discovered, an error in the calculation of performance for an award or individual misconduct resulting in dismissal. The same principle was adopted in 2015 with respect to the annual bonus.
7. Under the shareholding guidelines the executive directors are not permitted to hold their shares in hedging arrangements or as collateral for loans without the express permission of the Board.
92Governance
BTG plc Annual Report and Accounts 2017 BTG plc Annual Report and Accounts 2017

Committee discretions within PolicyThe Committee operates the Group’s variable incentive plans according to their respective rules and in accordance with HMRC rules where relevant. To ensure the efficient administration of these plans, the Committee will apply certain operational discretions. These include the following:
— Selecting the participants in the plans on an annual basis;
— Determining the timing of grants of awards and/or payment;
— Determining the quantum of awards and/or payments (within the limits set out in the Policy table above);
— Determining the extent of vesting based on the assessment of performance;
— Making the appropriate adjustments required in certain circumstances (e.g. change of control, rights issues, corporate restructuring events, and special dividends);
— Determining “good leaver” status for incentive plan purposes and applying the appropriate treatment; and
— Undertaking the annual review of weighting of performance measures, and setting targets for the annual bonus plan and PSP from year to year.
If an event occurs that results in the annual bonus plan or PSP performance conditions and/or targets being deemed no longer appropriate (e.g. a material acquisition or divestment) the Committee will have the ability in limited circumstances to adjust appropriately the measures and/or targets and alter weightings.
Outstanding share incentive awards that remain unvested or unexercised at the date of this report, as detailed on pages 77 to 89 of the Annual Report on remuneration, remain eligible for vesting or exercise based on their original award terms.
Choice of performance measures and approach to target settingAnnual bonus arrangements for the executive directors are normally split between corporate financial and individual non-financial objectives, with the financial targets normally accounting for the majority of the bonus. Financial performance targets are based on the budget and corporate measures and are linked to the achievement of annual objectives that are consistent with BTG’s longer-term growth goals. The Committee reviews these KPIs each year and varies them as appropriate (including the weighting of financial and non-financial targets) to reflect the priorities for the business in the year ahead. A sliding scale of targets is set for each KPI to encourage continuous improvement and challenge the delivery of stretch performance. For each metric, the threshold target will normally require the Group to maintain or improve on the prior year performance, with the stretch target requiring significant out-performance.
For awards granted under the PSP in 2017, the metrics are split between adjusted EPS and relative TSR outperformance of a general market index (for the 2017 awards this will be the FTSE 250), which ensures focus on sustainable growth and superior returns to shareholders (with the weighting between TSR and EPS determined by the Committee annually). The choice of financial metric, comparator index for TSR and weighting between each measure for awards will remain under review. TSR is measured independently for the Committee by New Bridge Street.
How employees’ pay is taken into account in setting the remuneration of the executive directorsThe Committee considers the base salaries for the Leadership Team and, although it does not directly consult with employees regarding remuneration policy, it receives information on general pay levels to ensure that the Committee has due regard to salary levels across the Group in applying the remuneration policy. During the year the Committee considered the application of the Policy to the wider workforce to ensure individual and regional requirements were adequately addressed. Executive remuneration is set having regard to that of the wider workforce subject to a benchmarking exercise at intervals to ensure the overall objectives of retaining and motivating the executive directors are addressed.
BTG’s workforce includes a high proportion of highly qualified scientists, technicians and professionals who are highly sought after by competitors. Ensuring that levels of remuneration for the general workforce are competitive to support staff retention, development in expanded roles and motivation is important to BTG’s ongoing success and this is reflected in the level and range of salary increases awarded to employees. As a result, BTG is required to benchmark and rebase salaries from time to time. The average salary increase awarded to BTG’s general workforce for 2016/17 was 3%. General workforce increases, effective June 2017, will range up to 15%, enabling differentiation for individual performance and geography.
BTG believes it is important to help all its employees understand the value of their pay and the impact of any changes to these arrangements. To support this we offer multiple opportunities for employees to comment on and our leadership to engage in discussions about our pay practices. Our employees obtain updates or can provide feedback at the point of joining BTG, during their performance and pay review discussions, at the annual benefits enrolment window and when completing the employee engagement survey. Our leadership reviews pay on a routine basis during the annual budget and compensation planning cycles.
93Governance
Governance
BTG plc Annual Report and Accounts 2017

As a growing business we constantly monitor the external market to ensure we remain competitive and relevant, which inevitably results in the evolution of our pay offering. To ensure our employees remain connected with any changes we ensure they are engaged in consultations (where relevant), receive updates via our Company-wide meetings or receive specific communications about proposed and legislative changes. Our leadership are regularly engaged in discussions on general and specific individual competitiveness as well as proposed changes.
Finally, where specific legislation requires broader public disclosure, this will also be shared with our employees i.e. Gender Pay, and at the highest level our executive pay and broader pay approach is available for all to review in the Annual Report.
How executive Directors’ Remuneration Policy relates to the wider GroupThe remuneration policy described above provides an overview of the structure that operates for the most senior executives in the Group. A lower incentive opportunity is available below executive level, with specific levels driven by market comparators and the impact of the role.
As explained above, salaries for the Group’s wider workforce are benchmarked externally against comparable companies within the sector and wider industry. The Group aims to ensure that all employees’ salaries are positioned around a mid-market level for the role taking account of performance and individual responsibility.
Employees are provided with a competitive local package of benefits that includes participation in the Group’s pension arrangements.
All employees are eligible to participate in the bonus arrangements with targets aligned to the financial performance of the Group and their individual performance within their specific area of responsibility.
The Group believes that broad-based employee participation in share schemes is an important alignment tool helping to focus employees on delivering value for shareholders. Other senior staff who are considered to have the greatest potential to influence Group performance are also able to receive awards of long-term incentives at a lower maximum percentage of salary than the executive directors. In addition, share ownership guidelines apply to members of BTG’s Leadership Team with lower levels of holding (50% of salary) required than for executive directors. In order to encourage wider employee share ownership, the Group
operates a Sharesave Plan in the UK, with an international section for employees in Australia, Germany, France, Spain and Canada, and a Stock Purchase Plan in the US. In 2017, we will explore extending this offering into Hong Kong, Israel and Taiwan.
How shareholders’ views are taken into accountWhen shaping remuneration policy the Remuneration Committee considers shareholder feedback received in relation to the Annual General Meeting each year and guidance from shareholder representative bodies more generally.
The Remuneration Committee engages proactively with shareholders, and takes seriously their views. When any material changes are made to the remuneration policy, the Remuneration Committee Chairman will inform major shareholders of these in advance, and will offer a meeting to discuss them.
Details of votes cast for and against the resolution to approve last year’s Directors’ Remuneration Report and matters discussed with shareholders during the year are provided in the Annual Report on Remuneration.
In developing its proposals for the changes to the remuneration policy approved at the 2016 AGM, the Committee engaged with its largest shareholders and major representative bodies regarding changes to the executive directors’ remuneration arrangements, in particular the changes to the long-term incentive arrangements and the repositioning of the CEO’s salary.
Approach to recruitment and promotionsThe remuneration package for a new director will be set in accordance with the terms of the Group’s approved remuneration policy in force at the time of appointment but focusing on the objective of appointing the most appropriate incumbent in the right geography.
The salary for a new executive director will be set to reflect their skills and experience, the Group’s target pay positioning and the market rate for the role in the relevant location, subject to the overall goal of attracting the right candidate. Where it is appropriate to do so, salaries may be set below the normal market rate, with phased increases over the first few years as the executive gains experience in their new role.
Remunerationcontinued
94Governance
BTG plc Annual Report and Accounts 2017 BTG plc Annual Report and Accounts 2017

Benefits and pensions will be in line with those offered to other executive directors, taking account of local market practice with relocation expenses provided if necessary. Tax equalisation may also be considered if an executive director is adversely affected by taxation due to their employment with the Group. Legal fees and other costs incurred by the individual may also be met by the Group.
The ongoing incentive opportunity offered to new recruits will be in line with that offered to existing directors. Different measures and targets under the bonus plan or the PSP may be set initially taking account of the responsibilities of the individual and the point in the financial year at which they join. A new employee may be granted normal annual PSP awards in the first year of employment. In addition, the Committee may offer additional cash and/or share-based elements to assist with recruitment (for example to buy out existing entitlements) when it considers these to be in the best interests of the Group and its shareholders. Existing arrangements will be used to the extent possible (subject to the limits set out in the Policy), however, the Committee retains discretion to use the flexibility provided by the Listing Rules to make such awards. Such awards/payments would take account of remuneration relinquished when leaving the former employer and would reflect (as far as possible) the value, nature and time horizons attached to that remuneration and the impact of any performance conditions. Awards may be granted in cash on recruitment if the Group is in a prohibited period at the joining date. Shareholders will be informed of any such awards/payments at the time of appointment.
For an internal executive appointment, any variable pay element awarded in respect of the prior role will be allowed to pay out according to its terms, adjusted as relevant to take into account the timing of the appointment. In addition, any other ongoing remuneration obligations existing prior to appointment may continue, provided that they are put to shareholders for approval at the earliest opportunity.
For the appointment of a new Chairman or non-executive director, the fee arrangement would be set in accordance with the approved remuneration policy in force at that time.
Legacy arrangementsFor the avoidance of doubt, authority is given to the Group to honour any commitments entered into with current or former directors (such as the payment of a pension or the unwind of legacy share schemes) that have been disclosed to shareholders in this or any previous remuneration reports or subsequently agreed in line with the approved policy in force at that time. Details of any payments to former directors will be set out in the Annual Remuneration Report as they arise.
External appointmentsThe Board believes that it may be beneficial to the Group for executives to hold non-executive directorships outside the Group. Any such appointments are subject to approval by the Board and the director may retain any fees received. Louise Makin received fees of £68,000 for being on the Board of Intertek Group during the year to 31 March 2017 (2016: £66,333) and £27,000 for being on the Board of Woodford Patient Capital Trust during the year to 31 March 2017 (2016: £25,581). Rolf Soderstrom does not currently hold any outside directorships.
Service contracts and payments for loss of office Executive directors have rolling service contracts, details of which are summarised in the table below:
Provision Detailed terms
Contract dates Louise Makin – 19 October 2004.Rolf Soderstrom – 4 December 2008.
Notice period 12 months from both the Group and from the executive.
Termination payment
The Group may terminate the contracts of the executive directors with immediate effect by making a payment in lieu of notice.
As the executive directors’ service contracts were put in place more than eight years ago they do not provide for mitigation.
Other than as specifically provided for in the policy with respect to “good leavers” (where for example existing Multiplier awards elected for are retained), the directors’ contracts do not provide for automatic entitlement to bonus or share-based payments.
Remuneration entitlements
Louise Makin’s contract contains the following remuneration-related entitlements:
— salary, membership of Group pension scheme or contribution to a personal pension, medical benefits and permanent health insurance.
Rolf Soderstrom’s contract contains the following remuneration-related entitlements:
— salary, contribution to a personal pension, medical benefits and permanent health insurance.
95Governance
Governance
BTG plc Annual Report and Accounts 2017
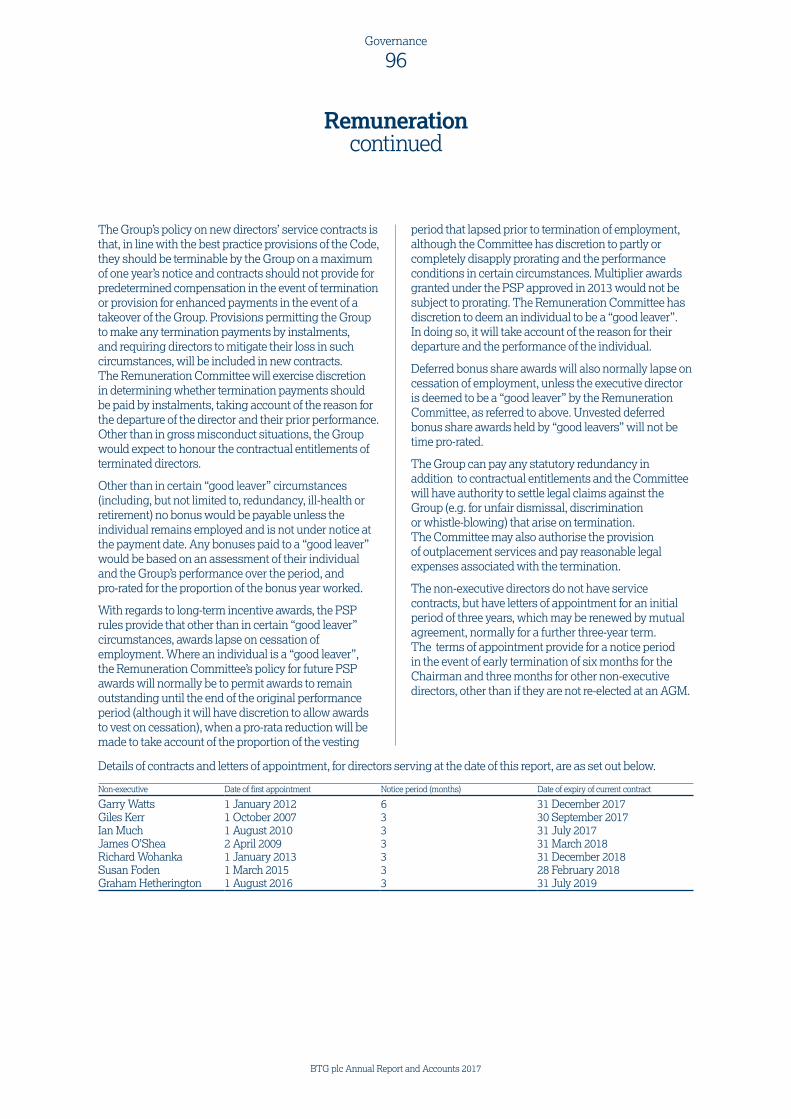
Remunerationcontinued
The Group’s policy on new directors’ service contracts is that, in line with the best practice provisions of the Code, they should be terminable by the Group on a maximum of one year’s notice and contracts should not provide for predetermined compensation in the event of termination or provision for enhanced payments in the event of a takeover of the Group. Provisions permitting the Group to make any termination payments by instalments, and requiring directors to mitigate their loss in such circumstances, will be included in new contracts. The Remuneration Committee will exercise discretion in determining whether termination payments should be paid by instalments, taking account of the reason for the departure of the director and their prior performance. Other than in gross misconduct situations, the Group would expect to honour the contractual entitlements of terminated directors.
Other than in certain “good leaver” circumstances (including, but not limited to, redundancy, ill-health or retirement) no bonus would be payable unless the individual remains employed and is not under notice at the payment date. Any bonuses paid to a “good leaver” would be based on an assessment of their individual and the Group’s performance over the period, and pro-rated for the proportion of the bonus year worked.
With regards to long-term incentive awards, the PSP rules provide that other than in certain “good leaver” circumstances, awards lapse on cessation of employment. Where an individual is a “good leaver”, the Remuneration Committee’s policy for future PSP awards will normally be to permit awards to remain outstanding until the end of the original performance period (although it will have discretion to allow awards to vest on cessation), when a pro-rata reduction will be made to take account of the proportion of the vesting
period that lapsed prior to termination of employment, although the Committee has discretion to partly or completely disapply prorating and the performance conditions in certain circumstances. Multiplier awards granted under the PSP approved in 2013 would not be subject to prorating. The Remuneration Committee has discretion to deem an individual to be a “good leaver”. In doing so, it will take account of the reason for their departure and the performance of the individual.
Deferred bonus share awards will also normally lapse on cessation of employment, unless the executive director is deemed to be a “good leaver” by the Remuneration Committee, as referred to above. Unvested deferred bonus share awards held by “good leavers” will not be time pro-rated.
The Group can pay any statutory redundancy in addition to contractual entitlements and the Committee will have authority to settle legal claims against the Group (e.g. for unfair dismissal, discrimination or whistle-blowing) that arise on termination. The Committee may also authorise the provision of outplacement services and pay reasonable legal expenses associated with the termination.
The non-executive directors do not have service contracts, but have letters of appointment for an initial period of three years, which may be renewed by mutual agreement, normally for a further three-year term. The terms of appointment provide for a notice period in the event of early termination of six months for the Chairman and three months for other non-executive directors, other than if they are not re-elected at an AGM.
Details of contracts and letters of appointment, for directors serving at the date of this report, are as set out below.
Non-executive Date of first appointment Notice period (months) Date of expiry of current contract
Garry Watts 1 January 2012 6 31 December 2017Giles Kerr 1 October 2007 3 30 September 2017Ian Much 1 August 2010 3 31 July 2017James O’Shea 2 April 2009 3 31 March 2018Richard Wohanka 1 January 2013 3 31 December 2018Susan Foden 1 March 2015 3 28 February 2018Graham Hetherington 1 August 2016 3 31 July 2019
96Governance
BTG plc Annual Report and Accounts 2017 BTG plc Annual Report and Accounts 2017

Non-executive directors’ and Chairman’s feesThe table below summarises the Group’s policy in relation to the fees of non-executive directors.
Purpose and link to strategy Operation Maximum
Performance targets
Takes account of recognised practice and set at a level that is sufficient to attract and retain high-calibre non-executives.
Non-executive directors receive fees paid monthly in cash and consist of an annual basic fee plus additional fees for additional responsibilities such as a Committee Chairmanship and the role of Senior Independent Director.
When reviewing fee levels, account is taken of market movements in non-executive director fees, Board committee responsibilities, ongoing time commitments and the general economic environment.
Additional fees may be paid where there is a material increase in the time commitment and responsibilities required of non-executive directors.
Fee increases, if applicable, are normally effective from 1 April each year.
Non-executives do not participate in any pension, bonus or share incentive plans and do not receive any benefits (other than limited benefits relating to travel, accommodation and hospitality provided in relation to the performance of any directors’ duties and any tax thereon).
The maximum level of fees is set in the Articles of Association
N/A
The Chairman, in consultation with the executive directors, is responsible for proposing changes to the non-executive directors’ fees. The Senior Independent Director, in consultation with the executive directors, is responsible for proposing changes to the Chairman’s fees. In each case this follows advice on market fee levels supplied by NBS. In proposing such fees, account is also taken of the time commitments of the Group’s non-executive directors. The decision on fee changes is taken by the Board as a whole. Individual non-executive directors do not take part in discussions on their remuneration.
97Governance
Governance
BTG plc Annual Report and Accounts 2017

Directors’ reportOther statutory information
The directors present their report together with the financial statements and the independent auditor’s report for the year ended 31 March 2017.
Principal ActivityThe principal activity of the Group is the business of healthcare: focusing on Interventional Medicine therapies for cancer, severe emphysema, severe bloodclots and varicose veins, and Specialty Pharmaceuticals for acute care uses, and a licensing business.
Strategic ReportThe Group is required by the Companies Act 2006 to set out a fair and balanced review of the business, including the performance and development of the Group during the year and at the year end and a description of the principal risks it faces. This information is contained within the Strategic Report which can be found on pages 6 to 37 and incorporated into this report by reference:
— The Chairman’s Statement on page 6, the Chief Executive’s review on pages 8 and 9 and the Industry Overview on page 10 provide details of the Group’s principal activities and strategy, its performance during the year and its prospects for future development opportunities.
— Details of the principal risks facing the Group are set out on pages 68 to 70.
— Information relating to the environment, employees and stakeholders, health and safety, ethical considerations, charitable donations and policies regarding its employees is set out on pages 26 to 29.
This information is prepared solely to assist shareholders to assess the Group’s overall strategy, the risks inherent in it and the potential for the strategy to succeed. The directors’ report should not be relied on by any other person or for any other purpose.
Forward-looking statements contained in this report have been made by the directors in good faith based on the information available to them up to the time of their approval of this report and such statements should be treated with caution due to the uncertainties, including economic and business risk factors, inherent in them.
Further information on the Group is available on the website: www.btgplc.com. Notwithstanding the references made in this Annual Report and Accounts to the Group’s website, none of the information made available on the website constitutes part of, or should be deemed to be incorporated by reference into, this Annual Report and Accounts.
Results and dividendsThe results for the year and the financial position at 31 March 2017 are shown in the Consolidated Income Statement on page 110 and the Consolidated Statement of Financial Position on page 112. The directors do not recommend the payment of a dividend for the year (15/16: nil). The results of the Group for the year are explained further on pages 30 to 38.
Directors and their powers and interestsThe directors of the Group at the date of this report, together with their biographical details and dates of appointment, are shown on pages 42 and 43.
The Board confirms that each of the directors who served during the year has been formally appraised during the period. All the directors continue to demonstrate commitment to the Group, the Board and to their role. In accordance with the UK Corporate Governance Code (the Code), all directors of the Company will stand for election or re-election annually.
In accordance with the Company’s articles of association, throughout the year the Company has maintained insurance cover for its directors and officers and those of its subsidiary companies under a directors’ and officers’ liability policy as permitted by sections 232 to 235 of the Companies Act 2006. The Company has also, to the extent permitted by law, entered into separate Deeds of Indemnity in favour of each of its directors to provide them with appropriate protection with respect to potential liabilities arising from the discharge of their duties. Neither the insurance policy nor the indemnities provide cover where the relevant director or officer is found to have acted fraudulently or intentionally breached the law.
Information on directors’ remuneration, contracts, options and their beneficial interests, including those of their immediate families, in the shares of the Company are shown in the Directors’ Remuneration Report on pages 72 to 97. None of the directors had an interest in any contract of significance to which the Company or any of its subsidiaries was party during the year.
Corporate governanceA report on corporate governance may be found on pages 40 to 71.
98Governance
BTG plc Annual Report and Accounts 2017 BTG plc Annual Report and Accounts 2017
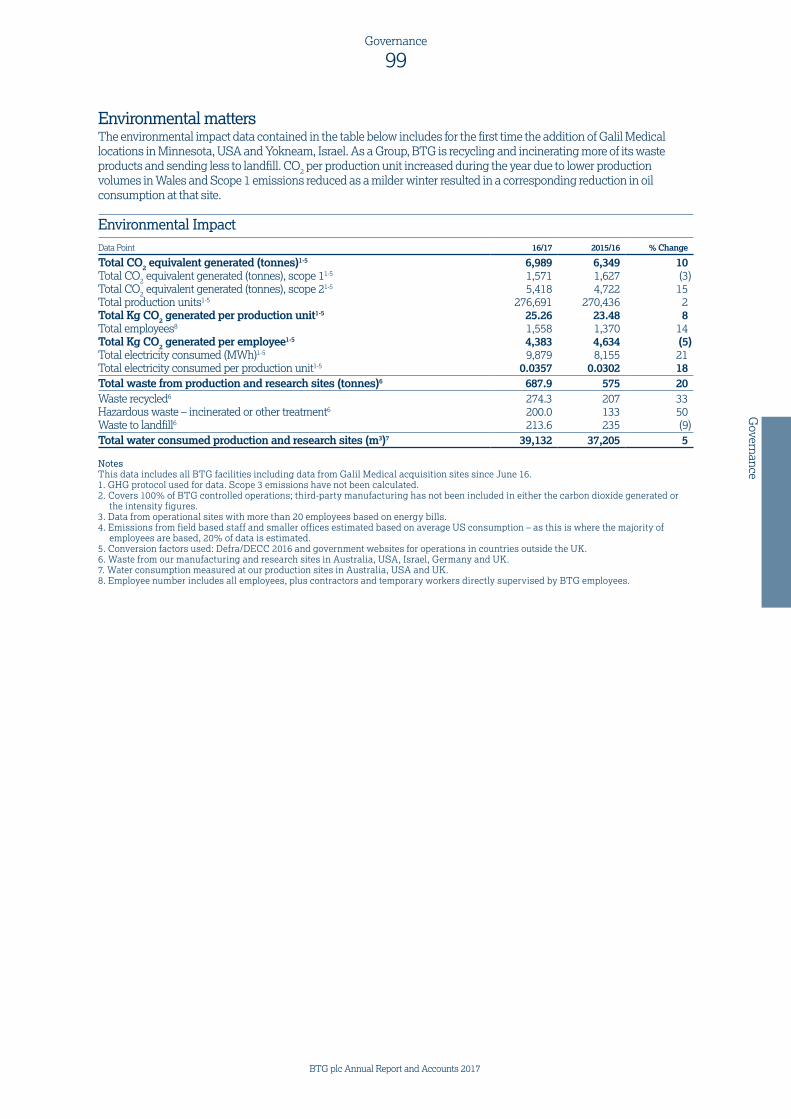
Environmental matters The environmental impact data contained in the table below includes for the first time the addition of Galil Medical locations in Minnesota, USA and Yokneam, Israel. As a Group, BTG is recycling and incinerating more of its waste products and sending less to landfill. CO2 per production unit increased during the year due to lower production volumes in Wales and Scope 1 emissions reduced as a milder winter resulted in a corresponding reduction in oil consumption at that site.
Environmental ImpactData Point 16/17 2015/16 % Change
Total CO2 equivalent generated (tonnes)1-5 6,989 6,349 10Total CO2 equivalent generated (tonnes), scope 11-5 1,571 1,627 (3)Total CO2 equivalent generated (tonnes), scope 21-5 5,418 4,722 15Total production units1-5 276,691 270,436 2Total Kg CO2 generated per production unit1-5 25.26 23.48 8Total employees8 1,558 1,370 14Total Kg CO2 generated per employee1-5 4,383 4,634 (5)Total electricity consumed (MWh)1-5 9,879 8,155 21Total electricity consumed per production unit1-5 0.0357 0.0302 18Total waste from production and research sites (tonnes)6 687.9 575 20Waste recycled6 274.3 207 33Hazardous waste – incinerated or other treatment6 200.0 133 50Waste to landfill6 213.6 235 (9)Total water consumed production and research sites (m3)7 39,132 37,205 5
NotesThis data includes all BTG facilities including data from Galil Medical acquisition sites since June 16.1. GHG protocol used for data. Scope 3 emissions have not been calculated. 2. Covers 100% of BTG controlled operations; third-party manufacturing has not been included in either the carbon dioxide generated or
the intensity figures.3. Data from operational sites with more than 20 employees based on energy bills. 4. Emissions from field based staff and smaller offices estimated based on average US consumption – as this is where the majority of
employees are based, 20% of data is estimated.5. Conversion factors used: Defra/DECC 2016 and government websites for operations in countries outside the UK. 6. Waste from our manufacturing and research sites in Australia, USA, Israel, Germany and UK. 7. Water consumption measured at our production sites in Australia, USA and UK. 8. Employee number includes all employees, plus contractors and temporary workers directly supervised by BTG employees.
99Governance
Governance
BTG plc Annual Report and Accounts 2017

Directors’ reportOther statutory information continued
Share capital and shareholdersAs at 31 March 2017 the issued share capital of the Company was £38,512,753, divided into 385,127,525 shares of 10p each. During the year the share capital increased by 2,135,948 shares due to the exercise and vesting of share awards by employees and former employees under the Company’s employee share schemes. The Company has only one class of shares and there are no restrictions on voting rights or on the holding or transfer of these securities.
Details of the movements in the Company’s share capital are shown in Note 15 to the financial statements on page 135. At 31 March 2017, the Company had 8,764 shareholders (2016: 9,178). Further details of shareholdings and Company reporting dates may be found on page 159.
The BTG Employee Share Trust holds shares in the Company which may be used for the benefit of employees. The shares held by the Trust have the same rights as those held by all other shareholders.
Details of outstanding share options and awards are set out in Note 19 to the financial statements on pages 140 to 142.
As at 2 May 2017, the Company had been notified of the following interests held, directly or indirectly, in 3% or more of the Group’s issued share capital.
Shareholding % holding
Invesco Perpetual Asset Management 83,770,871 21.75Novo A/S 44,173,492 11.47Woodford Investment Management 40,720,021 10.57AXA Investment Managers 21,888,138 5.68Schroder Investment Management 17,994,765 4.67Aviva Investors 15,692,906 4.07Standard Life Investments 13,922,558 3.62
Articles of association The Board may exercise all the powers of the Company, subject to the provisions of relevant statutes, the Company’s articles of association (the Articles) and any directions given by a special resolution of the shareholders.
The articles are available on the Group’s website at www.btgplc.com/responsibility/corporate-governance/
Change of control There are a number of agreements with third parties with terms that take effect after, or terminate upon, a change of control of the Group, such as commercial contracts, bank facility agreements, guarantees, property agreements and employee share plans. None of these are considered to be significant in terms of their likely impact on the business of the Group as a whole. Furthermore, the directors are not aware of any agreements between the Group and its directors or employees that provide for compensation for loss of office or employment following a takeover of the Group.
Research and developmentResearch and development (R&D) is an important part of the Group’s activities focusing in the areas of Interventional Medicine and Specialty Pharmaceuticals. The Group spent £87.8m (2015/6: £77.2m) on R&D during the year.
Treasury managementThe Group’s policy on the use of financial instruments and the management of financial risks is set out in Note 21 to the accounts on pages 143 to 145.
Going concern The Group’s business activities together with the factors affecting its performance, position and future development are set out within the Strategic Report on pages 6 to 37.
The directors have reviewed the current and projected financial position of the Group, making reasonable assumptions about future performance and taking into account the Group’s cash balances and available financial facilities. On the basis of this review, and after making due enquiries, the directors have a reasonable expectation that the Group has adequate resources to continue to operate for the next 12 months. For this reason they continue to adopt the going concern basis in preparing the financial statements.
100Governance
BTG plc Annual Report and Accounts 2017 BTG plc Annual Report and Accounts 2017

Viability Statement In accordance with the 2014 edition of the Code, directors are also required to provide a broader assessment of viability over a longer period. This statement, assessing the viability of the Group over the three-year period of that assessment can be found on page 35 of the Strategic Report.
Political donations The Group did not make any political donations during the financial year (2015/16: nil).
Respecting DiversityOur employees come from a variety of cultures, experiences and backgrounds. They are valued for their varied perspectives and judged solely by their abilities, behaviour, performance and potential. As an Equal Opportunity Employer, we consider employees and applicants for employment without regard to race, colour, religion, sex, national origin, or protected status. And we will not discriminate on the basis of disability.
Data on genderNumber of females who are: 2016/17 2015/16Employees 678 (48%) 591 (58%)Senior Managers 71 (34%) 52 (35%)Leadership Team Members 4 (33%) 3 (25%)Board Directors 2 (22%) 2 (25%)
2017 Annual General Meeting The AGM of the Company will be held at 10.30 am on 13 July 2017 at the offices of Stephenson Harwood LLP, 1 Finsbury Circus, London EC2M 7SH. Matters to be considered at the meeting include resolutions to receive the Annual Report and Accounts, to reappoint the auditor and re-elect the directors.
The Notice convening the meeting is distributed separately to shareholders at least 20 working days before the meeting. It is also available on the Group’s website: www.btgplc.com/investors/reports-and-presentations. The letter accompanying the AGM Notice includes full details of the resolutions.
Members of the Company unable to attend the meeting may elect to vote electronically or using the proxy form accompanying the Notice. In order to vote electronically, members should log on to Capita Asset Services’ (BTG’s registrars) website (www.capitashareportal.com) and follow the instructions on the screen. CREST members may send their proxy votes to the Company’s registrars electronically.
Disclosure of information to the auditorThe directors who held office at the date of approval of this report confirm that, so far as they are each aware, there is no relevant audit information of which the Group’s auditor is unaware; and each director has taken all the steps that they ought to have taken as a director to make themselves aware of any relevant audit information and to establish that the Group’s auditor is aware of that information.
AuditorResolutions will be proposed at the forthcoming AGM, to reappoint KPMG LLP as auditor and to authorise the directors to determine its remuneration.
By order of the Board
Dr Paul MussendenCompany Secretary 15 May 2017
101Governance
Governance
BTG plc Annual Report and Accounts 2017

Statement of directors’ responsibilities in respect of the Annual Report 2017 and the financial statements
The directors are responsible for preparing the Annual Report 2017 and the Group and parent company financial statements in accordance with applicable law and regulations.
Company law requires the directors to prepare Group and parent company financial statements for each financial year. Under that law they are required to prepare the Group financial statements in accordance with IFRSs as adopted by the EU and applicable law and have elected to prepare the parent company financial statements on the same basis.
Under company law the directors must not approve the financial statements unless they are satisfied that they give a true and fair view of the state of affairs of the Group and parent company and of their profit or loss for that period. In preparing each of the Group and parent company financial statements, the directors are required to:
— select suitable accounting policies and then apply them consistently;
— make judgements and estimates that are reasonable and prudent;
— state whether they have been prepared in accordance with IFRSs as adopted by the EU; and
— prepare the financial statements on the going concern basis unless it is inappropriate to presume that the Group and the parent company will continue in business.
The directors are responsible for keeping adequate accounting records that are sufficient to show and explain the parent company’s transactions and disclose with reasonable accuracy at any time the financial position of the parent company and enable them to ensure that its financial statements comply with the Companies Act 2006. They have general responsibility for taking such steps as are reasonably open to them to safeguard the assets of the Group and to prevent and detect fraud and other irregularities.
Under applicable law and regulations, the directors are also responsible for preparing a Strategic Report, Directors’ Report, Directors’ Remuneration Report and Corporate Governance Statement that complies with that law and those regulations.
The directors are responsible for the maintenance and integrity of the corporate and financial information included on the Group’s website. Legislation in the UK governing the preparation and dissemination of financial statements may differ from legislation in other jurisdictions.
Responsibility statement of the directors in respect of the annual financial reportWe confirm that to the best of our knowledge:
— the financial statements, prepared in accordance with the applicable set of accounting standards, give a true and fair view of the assets, liabilities, financial position and profit or loss of the Group and the undertakings included in the consolidation taken as a whole; and
— the strategic report includes a fair review of the development and performance of the business and the position of the issuer and the undertakings included in the consolidation taken as a whole, together with a description of the principal risks and uncertainties that they face.
We consider the Annual Report and accounts, taken as a whole, is fair, balanced and understandable and provides the information necessary for shareholders to assess the Group’s position and performance, business model and strategy.
The Directors’ report comprising pages 98 to 101, and including the sections of the Annual Report and accounts referred to in these pages, has been approved by the Board and signed on its behalf by:
Dame Louise MakinChief Executive Officer
Rolf SoderstromChief Financial Officer 15 May 2017
102Governance
BTG plc Annual Report and Accounts 2017

Financials
Contents104 Independent auditor’s report to
the members of BTG plc only110 Consolidated income statement111 Consolidated statement
of comprehensive income112 Consolidated statement
of financial position113 Consolidated statement
of cash flows114 Consolidated statement
of changes in equity115 Notes to the consolidated
financial statements152 Company financial statements
Statement of financial position153 Statement of cash flows153 Statement of changes in equity154 Notes to the Company
financial statements157 Five-year financial record159 Shareholder information
BTG plc Annual Report and Accounts 2017
103Financials
Financials

Overview
Materiality: group financial statements as a whole
£4.7m (2016: £4.0m) 0.82% (2016: 0.93%) of Revenue
Coverage 95%(2016: 88%) of Revenue
Risks of material misstatement
vs 2016
Recurring risks Recoverability of other intangible assets and goodwillRecognition of deferred tax assets
Opinions and conclusions arising from our audit
1. Our opinion on the financial statements is unmodifiedWe have audited the financial statements of BTG plc (‘the Group’) for the year ended 31 March 2017 set out on pages 110 to 156. In our opinion:
— the financial statements give a true and fair view of the state of the Group’s and of the parent company’s affairs as at 31 March 2017 and of the Group’s profit for the year then ended;
— the Group financial statements have been properly prepared in accordance with International Financial Reporting Standards as adopted by the European Union;
— the parent company financial statements have been properly prepared in accordance with IFRSs as adopted by the EU and as applied in accordance with the provisions of the Companies Act 2006; and
— the financial statements have been prepared in accordance with the requirements of the Companies Act 2006; and, as regards the Group financial statements, Article 4 of the IAS Regulation.
BTG plc Annual Report and Accounts 2017 BTG plc Annual Report and Accounts 2017
104Financials
BTG plc Annual Report and Accounts 2017 BTG plc Annual Report and Accounts 2017
104Financials
Independent auditor’s report to the members of BTG plc only

2. Our assessment of risks of material misstatementIn arriving at our audit opinion above on the financial statements, the risks of material misstatement that had the greatest effect on our audit, in decreasing order of audit significance, were as follows. We note the risk surrounding the Department of Justice’s (DoJ) investigation included in our 2016 report is no longer relevant as this matter was agreed and settled with the US government in the period. We also note that in the prior year the significant risk over recoverability of intangible assets also included goodwill. Goodwill has been removed due to the significant headroom on the prior year impairment review.
The risk Our response
Recoverability of intangible assets(£678.9m; 2016: £599.2m)
Refer to page 61 (Audit Committee Report), page 119 (accounting policy) and page 132 (financial disclosures).
Forecast-based valuationThe assessment of the recoverability of intangible assets requires significant judgement in determining the future prospects, results and forecast cash flows of the cash generating units to which other intangible assets are allocated.
Due to the challenges in expanding reimbursement coverage for Varithena® and PneumRx® Coils and the risk in obtaining required clinical and regulatory approval for PneumRx® Coils in the U.S.,these assets remain relatively more sensitive to impairment. In addition, the litigation risk for the Vistogard asset means it is also relatively more sensitive to impairment.
There is inherent uncertainty involved in forecasting and discounting future cash flows, which are the basis of the assessment of recoverability. The carrying values of intangible assets for Varithena®, PneumRx® Coils and Vistogardat 31 March 2017 were £18.8m, £208.6m and £6.4 m respectively.
Our procedures included:
— Our sector experience: Assess the completeness and existence of the Group’s assessment of potential impairment indicators and independently perform our own assessment of these indicators through inquiry of the business area heads, assessment of performance in the year, and research of publicly available information.
— Methodology choice: Evaluated the process by which the Group prepared its cash flow forecasts and compared them against the latest Board approved plans and forecasts.
— Our sector experience: Using our own valuation specialists to critically challenge the appropriateness of the discount rates used by the Group and benchmark them to those used by an external peer group.
— Historical comparisons: Critically challenge the assumed revenue projections by reference to those achieved historically, and external market data, where available, in terms of market size and expectations of market share.
— Historical comparisons: Critically assess the other assumptions used by the Group using our own assessments and a comparison to recent performance in relation to key inputs such as gross margins. We specifically assessed the probability of FDA approval of PneumRx® Coils and the likelihood of a successful defence in the Wellstat litigation.
— Sensitivity analysis: Apply sensitivities to the assumptions used by the Group in impairment calculations to evaluate the impact on the headroom for each CGU.
— Assessing transparency: Assess whether the Group’s disclosures about the sensitivity of the impairment assessment to changes in key assumptions that have a significant risk of resulting in a material adjustment to the carrying value of the intangible assets in the next financial year are appropriate.
BTG plc Annual Report and Accounts 2017
105Financials
Financials
BTG plc Annual Report and Accounts 2017
105Financials

The risk Our response
Recognition of deferred tax assetsRefer to page 61 (Audit Committee Report), page 121 (accounting policy) and page 129 (financial disclosures).
Forecast-based valuation:The Group has significant tax losses which have been acquired as part of business combinations or from past business performance. There is inherent uncertainty involved in assessing both the availability of losses for use and in forecasting future taxable profits, which determines the extent to which deferred tax assets are recognised.
Our procedures included:
— Our sector experience: Assess whether the use of tax losses within the group is in line with applicable tax laws, and with particular focus on areas which directly impact the carrying value of deferred tax assets; the likelihood of generating sufficient future taxable profits, and the ability to utilise tax losses.
— With the assistance of our tax specialists, in relation to previous acquisitions, we considered previous assessments and conclusions for the continued appropriateness of deferred tax asset recognition. In relation to the Galil Medical acquisition during the period, we critically assessed the Group’s analysis of the historic losses acquired.
— Evaluate the appropriateness of the Group’s key assumptions and estimates, with the assistance of our tax specialists, in particular the likelihood of generating sufficient future taxable profits to support the recognition of deferred tax assets, with reference to recent product launches, performance trends and acquisitions.
— Assessing transparency: Assess whether the Group’s disclosures around the judgements and estimates involved in the recognition of deferred tax assets are appropriate.
BTG plc Annual Report and Accounts 2017 BTG plc Annual Report and Accounts 2017
106Financials
BTG plc Annual Report and Accounts 2017 BTG plc Annual Report and Accounts 2017
106Financials
Independent auditor’s reportto the members of BTG plc only
continued

Revenue£570.5m (2016: £447.5m)
Group Revenue
Group total assets
Group profit before tax
11
87
1
84
95%(2016: 88%)
2
95
1
94
96%(2016: 96%)
1
94
1
89
90%(2016: 95%)
Full scope for group audit purposes 2017 Specified risk-focused audit procedures 2017 Full scope for group audit purposes 2016 Specified risk-focused audit procedures 2016 Residual components
3. Our application of materiality and an overview of the scope of our auditMateriality for the Group financial statements as a whole was set at £4.7 million (2016: £4.0 million), determined with reference to a benchmark of Group revenue, of which it represents 0.82% (2016: 0.93%). We consider Group revenue to be the most appropriate benchmark as revenue remains the key performance indicator of the group monitored by stakeholders.
We reported to the Audit Committee any corrected or uncorrected misstatements identified exceeding £0.2m (2016: £0.2m), in addition to other identified misstatements that warranted reporting on qualitative grounds.
Of the Group’s 28 (2016: 25) reporting components, we subjected 9 (2016:14) to audits for Group reporting purposes and 1 (2016: 1) to specified risk-focused audit procedures on key working capital captions. The latter component was not individually financially significant enough to require an audit for Group reporting purposes, but did present specific individual risks that needed to be addressed. In aggregate, the components within the scope of our work accounted for the following percentages of the group’s results: 95% (2016: 88%) of total Group revenue; 90% (2016: 95%) of Group profit before tax; and 96% (2016: 96%) of the Group’s total assets.
The group team instructed component auditors as to the significant areas to be covered and the information to be reported back. The Group team approved the component materialities, which ranged from £0.1m to £3.2m (2016: £0.2m to £3.9m), having regard to the mix of size and risk profile of the Group across the components. The Group team performed the work on recoverability of intangible assets and recognition of deferred tax assets. Of the 10 components noted above, two are based in the USA, one in Australia and five within sites in the UK (England and Wales), these were all audited by KPMG component teams. The remaining two components were audited by the group team.
The group team visited three (2016: two) component locations in the USA, England and Wales. Video or telephone conference meetings were also held with the component auditors including those that were not physically visited by the group team (Australia). At these visits and meetings, the findings reported to the Group team were discussed in more detail, and any further work required by the group team was then performed by the component auditor.
1
2
1 Revenue 2 Group materiality
Materiality£4.7m (2016: £4.0m)
£4.7mWhole financialstatements materiality(2016: £4.0m)
£0.2mMisstatements reported to the audit committee(2016: £0.2m)
£3.2mRange of materiality at 10 components (£0.1m-£3.2m) �(2016: £0.2m to £3.9m)
BTG plc Annual Report and Accounts 2017
107Financials
Financials
BTG plc Annual Report and Accounts 2017
107Financials

4. Our opinion on other matters prescribed by the Companies Act 2006 is unmodifiedIn our opinion:
— the part of the Directors’ Remuneration Report to be audited has been properly prepared in accordance with the Companies Act 2006; and
— the information given in the Strategic Report and the Directors’ Report for the financial year is consistent with the financial statements.
— Based solely on the work required to be undertaken in the course of the audit of the financial statements and from reading the Strategic Report and the Directors’ Report:
— we have not identified material misstatements in those reports; and
— in our opinion, those reports have been prepared in accordance with the Companies Act 2006.
5. We have nothing to report on the disclosures of principal risksBased on the knowledge we acquired during our audit, we have nothing material to add or draw attention to in relation to:
— the Directors’ statement of viability on page 35, concerning the principal risks, their management, and, based on that, the Directors’ assessment and expectations of the Group’s continuing in operation over the three years to 31 March 2020; or
— the disclosures in note 1 of the financial statements concerning the use of the going concern basis of accounting.
6. We have nothing to report in respect of the matters on which we are required to report by exceptionUnder ISAs (UK and Ireland) we are required to report to you if, based on the knowledge we acquired during our audit, we have identified other information in the Annual Report that contains a material inconsistency with either that knowledge or the financial statements, a material misstatement of fact, or that is otherwise misleading.
In particular, we are required to report to you if:
— we have identified material inconsistencies between the knowledge we acquired during our audit and the Directors’ statement that they consider that the Annual Report and financial statements taken as a whole is fair, balanced and understandable and provides the information necessary for shareholders to assess the Group’s position and performance, business model and strategy; or
— the Audit Committee Report does not appropriately address matters communicated by us to the Audit Committee.
Under the Companies Act 2006 we are required to report to you if, in our opinion:
— adequate accounting records have not been kept by the parent company, or returns adequate for our audit have not been received from branches not visited by us; or
— the parent company financial statements and the part of the Directors’ remuneration report to be audited are not in agreement with the accounting records and returns; or
— certain disclosures of Directors’ remuneration specified by law are not made; or
— we have not received all the information and explanations we require for our audit.
Under the Listing Rules we are required to review:
— the directors’ statements, set out on page 100 and 101, in relation to going concern and longer-term viability; and
— the part of the Corporate Governance Statement on page 44 relating to the company’s compliance with the eleven provisions of the 2014 UK Corporate Governance Code specified for our review.
We have nothing to report in respect of the above responsibilities.
BTG plc Annual Report and Accounts 2017 BTG plc Annual Report and Accounts 2017
108Financials
BTG plc Annual Report and Accounts 2017 BTG plc Annual Report and Accounts 2017
108Financials
Independent auditor’s reportto the members of BTG plc only
continued

Scope and responsibilitiesAs explained more fully in the Directors’ Responsibilities Statement set out on page 102, the Directors are responsible for the preparation of the financial statements and for being satisfied that they give a true and fair view. A description of the scope of an audit of financial statements is provided on the Financial Reporting Council’s website at www.frc.org.uk/auditscopeukprivate. This report is made solely to the Company’s members as a body and is subject to important explanations and disclaimers regarding our responsibilities, published on our website at www.kpmg.com/uk/auditscopeukco2014a, which are incorporated into this report as if set out in full and should be read to provide an understanding of the purpose of this report, the work we have undertaken and the basis of our opinions.
Richard Broadbelt (Senior Statutory Auditor)for and on behalf of KPMG LLP, Statutory Auditor
Chartered Accountants 15 Canada Square Canary Wharf London E14 5GL 15 May 2017
BTG plc Annual Report and Accounts 2017
109Financials
Financials
BTG plc Annual Report and Accounts 2017
109Financials

Note
Year ended31 March
2017£m
Year ended31 March
2016£m
Revenue 4 570.5 447.5Cost of sales (179.9) (140.8)Gross profit 4 390.6 306.7Selling, general and administrative expenses (206.6) (141.4) Research and development (87.8) (77.2)Other operating income 4.4 3.4Amortisation of acquired intangible assets (42.0) (35.0)Acquisition and reorganisation costs (1.1) –Operating profit 5 57.5 56.5Financial income 7 3.3 4.4Financial expense 7 (29.2) (3.4)Profit before tax 31.6 57.5Tax credit 8 2.0 3.0Profit for the year 33.6 60.5
Basic earnings per share 9 8.7p 15.8pDiluted earnings per share 9 8.6p 15.6p
All activities arose from continuing operations.
BTG plc Annual Report and Accounts 2017 BTG plc Annual Report and Accounts 2017
110Financials
BTG plc Annual Report and Accounts 2017 BTG plc Annual Report and Accounts 2017
110Financials
Consolidated income statement

Note
Year ended31 March
2017£m
Year ended31 March
2016£m
Profit for the year 33.6 60.5Other comprehensive incomeItems that may be reclassified subsequently to profit or lossForeign exchange translation differences 91.7 18.7Items that will not be reclassified subsequently to profit or lossActuarial (loss)/gain on defined benefit pension scheme 18 (5.2) 3.3Deferred tax credit/(charge) on defined benefit pension scheme asset 4.1 (1.1)Other comprehensive income for the year 90.6 20.9Total comprehensive income for the year 124.2 81.4
The notes on pages 115 to 151 form part of these financial statements.
BTG plc Annual Report and Accounts 2017
111Financials
Financials
BTG plc Annual Report and Accounts 2017
111Financials
Consolidated statement of comprehensive income
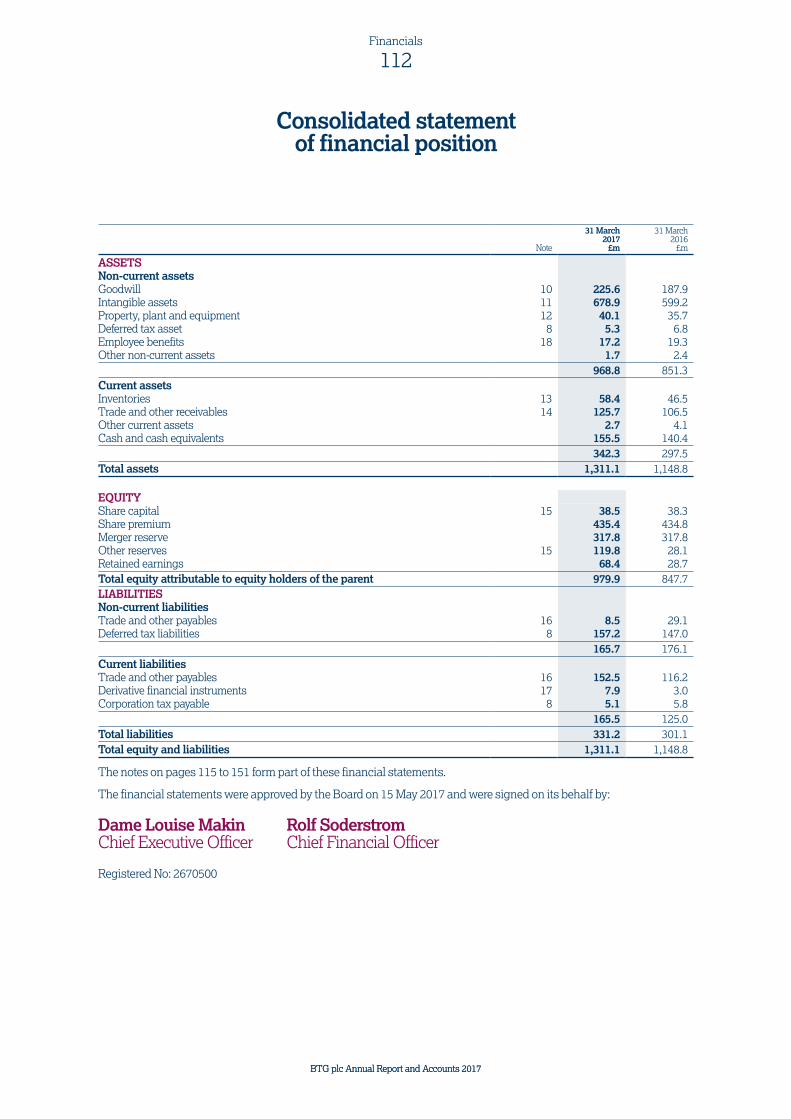
Note
31 March 2017
£m
31 March 2016
£m
ASSETSNon-current assetsGoodwill 10 225.6 187.9Intangible assets 11 678.9 599.2Property, plant and equipment 12 40.1 35.7Deferred tax asset 8 5.3 6.8Employee benefits 18 17.2 19.3Other non-current assets 1.7 2.4
968.8 851.3Current assetsInventories 13 58.4 46.5Trade and other receivables 14 125.7 106.5Other current assets 2.7 4.1 Cash and cash equivalents 155.5 140.4
342.3 297.5Total assets 1,311.1 1,148.8
EQUITYShare capital 15 38.5 38.3Share premium 435.4 434.8Merger reserve 317.8 317.8Other reserves 15 119.8 28.1Retained earnings 68.4 28.7Total equity attributable to equity holders of the parent 979.9 847.7LIABILITIESNon-current liabilitiesTrade and other payables 16 8.5 29.1Deferred tax liabilities 8 157.2 147.0
165.7 176.1Current liabilitiesTrade and other payables 16 152.5 116.2Derivative financial instruments 17 7.9 3.0Corporation tax payable 8 5.1 5.8
165.5 125.0Total liabilities 331.2 301.1Total equity and liabilities 1,311.1 1,148.8
The notes on pages 115 to 151 form part of these financial statements.
The financial statements were approved by the Board on 15 May 2017 and were signed on its behalf by:
Dame Louise Makin Rolf SoderstromChief Executive Officer Chief Financial Officer
Registered No: 2670500
BTG plc Annual Report and Accounts 2017 BTG plc Annual Report and Accounts 2017
112Financials
BTG plc Annual Report and Accounts 2017 BTG plc Annual Report and Accounts 2017
112Financials
Consolidated statement of financial position

Note
Year ended31 March
2017£m
Year ended31 March
2016£m
Profit after tax for the year 33.6 60.5Tax credit 8 (2.0) (3.0)Financial income 7 (3.3) (4.4)Financial expense 7 29.2 3.4Operating profit 57.5 56.5
Adjustments for: Amortisation and impairment of intangible assets 11 46.7 38.0 Depreciation and impairment on property, plant and equipment 12 6.6 6.6 Share-based payments 8.5 6.7 Pension scheme funding 18 (2.9) (2.9) Other non cash items 0.9 3.1Cash from operations before movements in working capital 117.3 108.0
Increase in inventories (9.3) (7.6)Increase in trade and other receivables (8.5) (14.4)Increase in trade and other payables 2.1 14.7Increase in provisions 0.1 1.1Cash from operations 101.7 101.8
Settlement of foreign exchange forward contracts (17.1) –Corporation tax paid (10.4) (6.2)Net cash inflow from operating activities 74.2 95.6
Investing activitiesPurchases of intangible assets 11 (0.6) (24.3)Purchases of property, plant and equipment 12 (8.9) (6.2)Acquisition of business, net of cash acquired 26 (36.2) –Other investing activities 0.4 0.6Net cash outflow from investing activities (45.3) (29.9)
Cash flows from financing activitiesRepayment of debt acquired on business combination 26 (18.9) –Proceeds of share issues 15 0.8 1.1Other financing activities (1.6) (1.1)Net cash outflow from financing activities (19.7) –
Increase in cash and cash equivalents 9.2 65.7Cash and cash equivalents at start of year 140.4 73.8Effect of exchange rate fluctuations on cash held 5.9 0.9Cash and cash equivalents at end of year 155.5 140.4
The notes on pages 115 to 151 form part of these financial statements.
BTG plc Annual Report and Accounts 2017
113Financials
Financials
BTG plc Annual Report and Accounts 2017
113Financials
Consolidated statement of cash flows
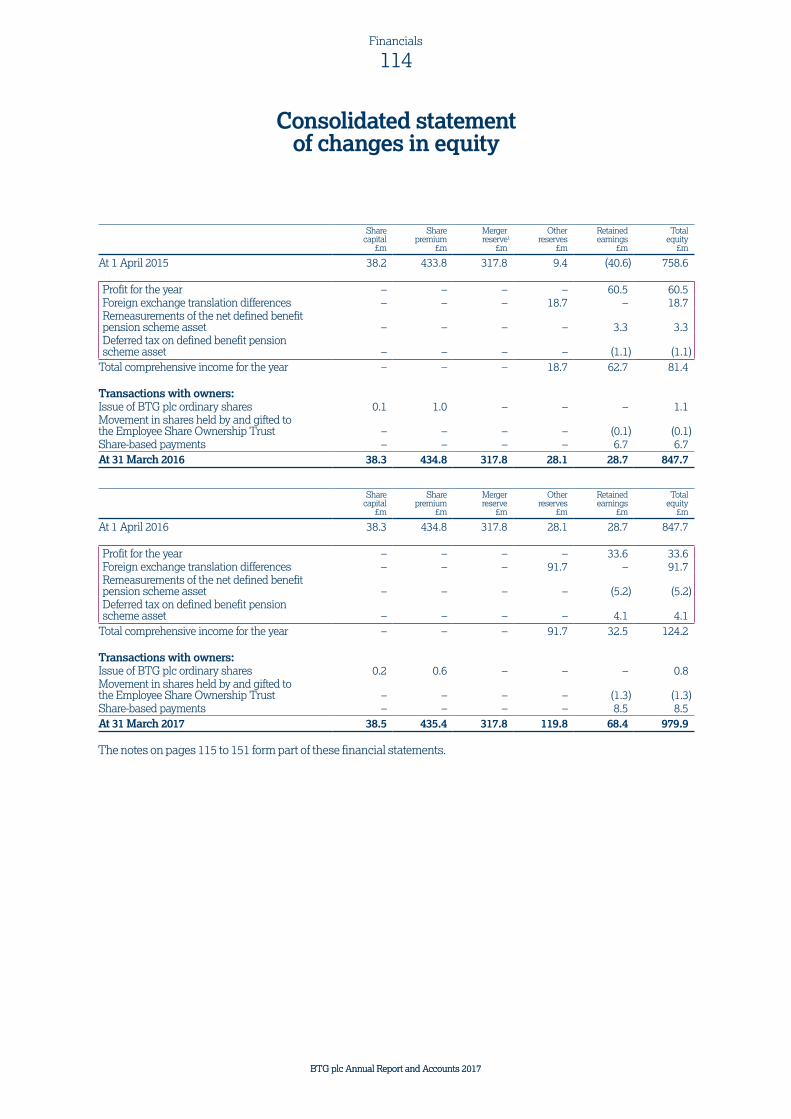
Sharecapital
£m
Sharepremium
£m
Mergerreserve1
£m
Otherreserves
£m
Retainedearnings
£m
Totalequity
£m
At 1 April 2015 38.2 433.8 317.8 9.4 (40.6) 758.6
Profit for the year – – – – 60.5 60.5 Foreign exchange translation differences – – – 18.7 – 18.7 Remeasurements of the net defined benefit pension scheme asset – – – – 3.3 3.3
Deferred tax on defined benefit pension scheme asset – – – – (1.1) (1.1)
Total comprehensive income for the year – – – 18.7 62.7 81.4
Transactions with owners:Issue of BTG plc ordinary shares 0.1 1.0 – – – 1.1Movement in shares held by and gifted to the Employee Share Ownership Trust – – – – (0.1) (0.1)Share-based payments – – – – 6.7 6.7At 31 March 2016 38.3 434.8 317.8 28.1 28.7 847.7
Sharecapital
£m
Sharepremium
£m
Mergerreserve
£m
Otherreserves
£m
Retainedearnings
£m
Totalequity
£m
At 1 April 2016 38.3 434.8 317.8 28.1 28.7 847.7
Profit for the year – – – – 33.6 33.6 Foreign exchange translation differences – – – 91.7 – 91.7 Remeasurements of the net defined benefit pension scheme asset – – – – (5.2) (5.2)
Deferred tax on defined benefit pension scheme asset – – – – 4.1 4.1
Total comprehensive income for the year – – – 91.7 32.5 124.2
Transactions with owners:Issue of BTG plc ordinary shares 0.2 0.6 – – – 0.8Movement in shares held by and gifted to the Employee Share Ownership Trust – – – – (1.3) (1.3)Share-based payments – – – – 8.5 8.5At 31 March 2017 38.5 435.4 317.8 119.8 68.4 979.9
The notes on pages 115 to 151 form part of these financial statements.
BTG plc Annual Report and Accounts 2017 BTG plc Annual Report and Accounts 2017
114Financials
BTG plc Annual Report and Accounts 2017 BTG plc Annual Report and Accounts 2017
114Financials
Consolidated statement of changes in equity

1. General informationBTG plc (the ‘Company’) is a company incorporated and domiciled in the United Kingdom and listed on the London Stock Exchange. The consolidated financial statements of the Company for the year ended 31 March 2017 comprise the results of the Company and its subsidiary undertakings (together referred to as the ‘Group’) and the Group’s interest in associates.
The financial statements were approved for issue by the Board on 15 May 2017.
The financial statements have been prepared in accordance with the Group’s accounting policies as approved by the Board and described below.
Accounting standards adopted in the yearNo standards and interpretations issued by the EU adopted in the year had a significant impact on the Group.
Accounting standards issued but not yet effectiveIFRS 15, ‘Revenue from contracts with customers’, was issued by the IASB in May 2014 and will be implemented by the Group from 1 April 2018. The Standard contains a new set of principles on when and how to recognise and measure revenue as well as new requirements related to disclosures. The new standard replaces IAS 18 Revenues and related interpretations. The Group does not anticipate that the new standard will have a material effect on the Group’s consolidated financial statements.
IFRS 9 ‘Financial instruments’ was issued by the IASB in July 2014, effective for accounting periods beginning on or after 1 January 2018. The Group is currently assessing the impact of IFRS 9 on the Group’s consolidated financial statements.
IFRS 16 ‘Leases’ was issued by the IASB in January 2016, effective for accounting periods beginning on or after 1 January 2019. The Group is currently assessing the impact of IFRS 16 on the Group’s consolidated financial statements.
Going concern basis After making enquiries, the directors have a reasonable expectation that the Company and the Group have adequate resources to continue in operational existence for the next twelve months. Accordingly, they continue to adopt the going concern basis in preparing the Annual Report and Accounts.
This conclusion has been reached having considered the effect of liquidity risk on the Group’s ability to operate effectively. Currently, liquidity risk is not considered a significant business risk to the Group given its level of net cash and cash equivalents, together with its cash flow projections. The Group does not currently require significant levels of debt financing to operate its business. Further details of the Group’s policies and objectives around liquidity risk are given in note 21 to the Accounts and are discussed in the Strategic Report on pages 6 to 38. The key liquidity risks faced by the Group are considered to be the failure of banks where funds are deposited and the failure of key licensees, distribution partners, wholesalers or insurers.
In addition to the liquidity risks considered above, the directors have also considered the following factors when reaching the conclusion to continue to adopt the going concern basis:
— Many of the Group’s products are life-saving in nature, providing some protection against an uncertain economic outlook;
— BTG has a £100m multi-currency revolving credit facility (RCF), with an option to extend this RCF by a further £100m. The RCF has a three-year term, which expires in November 2018, with an option to extend for a further year. The RCF currently remains undrawn; and
— The Group’s principal licensees are global industry leaders in their respective fields and the Group’s royalty-generating intellectual property consists of a portfolio of licensees.
Seasonality of the businessRevenues from the Group’s marketed products are dependent on both the timing of shipments of product to the Group’s distributors and the underlying demand for the products. CroFab®, in particular, demonstrates seasonality since the main snakebite season in the US, when the product is in highest demand, runs from March to October.
BTG plc Annual Report and Accounts 2017
115Financials
Financials
BTG plc Annual Report and Accounts 2017
115Financials
Notes to the consolidated financial statements
2. Significant accounting policiesThe principal accounting policies adopted in the preparation of these financial statements are set out below. These policies have been consistently applied to all years presented unless otherwise stated.
(a) Basis of accounting and preparation of financial statementsThe Group financial statements have been prepared and approved by the directors in accordance with International Financial Reporting Standards as adopted by the EU (‘Adopted IFRSs’).
The Group financial statements are presented in sterling, all values are rounded to the nearest £0.1m except where otherwise indicated, and these financial statements have been prepared on the historical cost basis modified to include revaluation to fair value of certain financial instruments and the recognition of assets acquired and liabilities and contingent liabilities assumed through business combination assets at their fair value.
The preparation of the financial statements in conformity with generally accepted accounting principles requires management to make estimates and assumptions that affect the reported amounts of assets and liabilities at the date of the financial statements and the reported amounts of revenues and expenses during the reporting period. Actual results could differ from those estimates. Judgements made by the directors in the application of these accounting policies that have a significant effect on the financial statements and estimates with a significant risk of material adjustment in future periods are discussed in note 3 “Critical accounting judgements and key sources of estimation uncertainty”.
In the year ended 31 March 2017 the Group changed the presentation of its consolidated income statement. Under the new presentation:
a) No separate column to disclose acquisition adjustments and reorganisation costs arising on corporate acquisitions is presented. The results for each period are now disclosed in a single column.
b) ‘Foreign exchange gains or losses’, ‘Profit or loss on disposal of property, plant and equipment and intangible assets’ and ‘Other operating expenses’ which were previously disclosed separately on the face of the consolidated income statement are now disclosed within ‘Other operating income’.
(b) Basis of consolidationSubsidiary undertakingsSubsidiary undertakings are entities controlled by the Group. The Group controls an entity when it is exposed to, or has rights to, variable returns from its involvement with the entity and has the ability to affect those returns through its power over the entity. The financial statements of subsidiary undertakings are included in the consolidated financial statements from the date that control commences until the date that control ceases.
Acquisition accountingThe purchase method is used to account for the acquisition of businesses by the Group. The cost of an acquisition is measured as the fair value of the assets given, equity instruments issued and liabilities incurred or assumed at the date of exchange. Identifiable assets acquired and liabilities and contingent liabilities assumed are measured initially at their fair values on the date of acquisition, irrespective of the extent of any non-controlling interest. Where the consideration transferred, together with the non-controlling interest exceeds the fair value of the net assets, liabilities and contingent liabilities acquired, the excess is recorded as goodwill. Where necessary, adjustments are made to the financial statements of subsidiaries to bring accounting policies into line with the Group’s accounting policies.
Merger reserveA merger reserve is used where more than 90% of the shares in a subsidiary are acquired and the consideration includes the issue of new shares by the Company, thereby attracting merger relief under s612 and s613 of the Companies Act 2006.
Translation reserveThe translation reserve comprises all foreign exchange differences arising from the translation of the financial statements of foreign operations.
Transactions eliminated on consolidationIntra-group balances and any unrealised gains and losses or income and expenses arising from intra-group transactions, are eliminated in preparing the consolidated financial statements. Unrealised losses are eliminated in the same way as unrealised gains, but only to the extent that there is no evidence of impairment.
BTG plc Annual Report and Accounts 2017 BTG plc Annual Report and Accounts 2017
116Financials
BTG plc Annual Report and Accounts 2017 BTG plc Annual Report and Accounts 2017
116Financials
Notes to the consolidated financial statements
continued

(c) Operating segmentsAn operating segment is defined as a component of the Group (i) that engages in business activities from which it may earn revenues and incur expenses; (ii) whose operating results are regularly reviewed by the Group’s chief operating decision maker to make resource allocation decisions and monitor its performance; and (iii) for which discrete financial information is available.
(d) Foreign currency(i) Foreign currency transactionsTransactions in foreign currencies are translated at the foreign exchange rate ruling at the date of the transaction.
Monetary assets and liabilities denominated in foreign currencies at the balance sheet date are translated at the foreign exchange rate ruling at that date. Foreign exchange differences arising on translation are recognised in the income statement.
Non-monetary assets and liabilities that are measured at historical cost or stated at fair value are translated using the exchange rate ruling at the date of transaction or the date the fair value was determined. Exchange gains/losses on retranslation of foreign currency transactions are recognised in the income statement within ‘Other operating income’.
(ii) Financial statements of foreign operationsThe assets and liabilities of foreign operations are translated into sterling at exchange rates ruling at the balance sheet date. The revenues and expenses of foreign operations are translated into sterling at rates approximating to the exchange rates ruling at the dates of the transactions. Foreign exchange differences arising on retranslation of foreign operations are recognised directly in the currency translation reserve presented in other reserves.
(e) Derivative financial instrumentsDerivative financial instruments, being forward foreign exchange contracts, are recorded in the balance sheet at their fair value, and changes from subsequent remeasurement to fair value at each balance sheet date are recognised immediately in the income statement through ‘Financial income’ (fair value gains) or ‘Financial expense’ (fair value losses) as appropriate.
The fair value of forward exchange contracts is derived from observable inputs from active markets at the balance sheet date.
(f) GoodwillAll business combinations are accounted for by applying the purchase method. Goodwill represents amounts arising on the acquisition of subsidiary undertakings. In respect of business combinations that have occurred since 1 April 2004, goodwill represents the excess between the consideration paid and the fair value of the assets acquired and liabilities and contingent liabilities assumed.
Goodwill is stated at cost less any accumulated impairment losses. Goodwill is deemed to have an indefinite useful life and is allocated to groups of cash-generating units, being the Group’s operating segments. Goodwill is tested at least annually for impairment (see 2(l)).
(g) Intangible assets (i) Initial recognitionIntangible assets acquired as a result of a business combination are initially recognised at their fair value.
Other intangible assets are initially recognised at cost.
(ii) AmortisationIntangible assets are amortised on a straight-line basis, over the useful economic life of the asset. In determining the appropriate useful economic life of the asset, consideration is given to the expected useful economic life of the asset or remaining patent life if different. The useful economic life of each class of asset is determined as follows:
— Developed technology: expected useful economic life, taking into account specific product and market characteristics for each developed technology;
— Contractual relationships: period to expiry of the relevant contractual relationship;
— In-process research and development: amortisation is not charged until the asset is generating an economic return, at which point it is amortised over its expected useful economic life;
— Computer software: the shorter of the licence period and three years;
— Patents: period to patent expiry; and
— Purchase of contractual rights: period to expiry of the relevant contractual right.
BTG plc Annual Report and Accounts 2017
117Financials
Financials
BTG plc Annual Report and Accounts 2017
117Financials
2. Significant accounting policies continuedThe following useful economic lives are applied:
Developed technology 2 to 25 years
Contractual relationships 2 to 15 years
Computer software 3 years
Patents up to 20 years
Purchase of contractual rights 2 to 10 years
(iii) Income statement disclosureAmortisation relating to acquired intangible assets is presented within Amortisation of acquired intangible assets. Other amortisation is shown within Cost of sales, Selling, general and administrative expenses or Research and development dependent on the function to which the related intangible asset relates.
(iv) Subsequent expenditureExpenditure subsequent to the initial acquisition of intangible assets is capitalised only when it increases the future economic benefits embodied in the specific asset to which it relates. All other expenditure is expensed as incurred.
(v) ImpairmentIf an intangible asset is considered to have suffered impairment in value it is written down to its estimated recoverable amount in accordance with the Group’s policy on impairment (see note 2(l)).
(h) Property, plant and equipment(i) Owned assetsItems of property, plant and equipment are stated at cost less accumulated depreciation and impairment losses (see note 2(l)).
(ii) DepreciationDepreciation is charged to the income statement on a straight-line basis to write assets down to their residual value over the following useful economic lives:
Buildings and improvements 10 to 20 years
Leasehold improvements 2 to 10 years
Plant and machinery 3 to 15 years
Furniture and equipment 2 to 15 years
Motor vehicles 5 years
Computer hardware 3 to 5 years
Depreciation is not charged until the asset is brought into use. The residual value of property, plant and equipment is reassessed annually.
(iii) Income statement disclosureDepreciation and impairment of property, plant and equipment is included within Cost of sales, Selling, general and administrative expenses or Research and development dependent on the function to which the related property, plant and equipment relates.
Profits/(losses) on disposals of property, plant and equipment are determined by comparing the proceeds with the carrying amount of the relevant property, plant and equipment, and are included in Other operating income.
(iv) Subsequent expenditureExpenditure subsequent to the initial acquisition of property, plant and equipment is capitalised only when it is probable that the Group will realise future economic benefits from the asset.
(v) ImpairmentIf property, plant and equipment is considered to have suffered impairment in value it is written down to its estimated recoverable amount in accordance with the Group’s policy on impairment (see note 2(l)).
(i) InventoriesInventories are valued at the lower of cost and net realisable value, using the first in, first out method. Cost comprises materials, direct labour and a share of production overheads appropriate to the relevant stage of production. Provision is made for obsolete, slow-moving or defective items where appropriate. Net realisable value is determined at the balance sheet date on commercially saleable products based on estimated selling price less all further costs to completion and all relevant marketing, selling and distribution costs.
Inventories relating to research and development projects are expensed to the income statement unless the Group considers it highly probable it will realise economic value from their sale or use.
If the circumstances that previously caused these inventories to be written down below cost subsequently change and there is clear evidence of an increase in realisable value, the write down is reversed.
BTG plc Annual Report and Accounts 2017 BTG plc Annual Report and Accounts 2017
118Financials
BTG plc Annual Report and Accounts 2017 BTG plc Annual Report and Accounts 2017
118Financials
Notes to the consolidated financial statements
continued

(j) Trade and other receivablesTrade and other receivables do not carry interest and are stated at amortised cost net of any provisions.
(k) Cash and cash equivalentsCash and cash equivalents comprise cash balances and call deposits. Bank overdrafts that are repayable on demand and form an integral part of the Group’s cash management and for which the Group has a legal right of set-off are included as a component of cash and cash equivalents for the purpose of the statement of cash flows.
Cash deposits with a maturity of greater than three months are classified as held to maturity financial assets.
(l) ImpairmentAll assets are reviewed for impairment when there is an indicator of impairment.
In addition, goodwill and unamortised intangible assets (principally IPR&D) are reviewed for impairment at least annually.
An impairment loss is recognised whenever the carrying amount of an asset or its cash-generating unit exceeds its recoverable amount.
The Group reviews its assets for impairment as follows:
(i) Property, plant and equipmentProperty, plant and equipment are reviewed for impairment whenever there are events that indicate that an impairment may have occurred. An impairment loss is recognised if an asset’s carrying amount exceeds the greater of its value in use and fair value less costs to sell. Impairment losses are recognised within Cost of sales, Selling, general and administrative expenses or Research and development dependent on the function to which the relevant property, plant and equipment relates.
(ii) Amortised intangible assetsAmortised intangible assets are tested for impairment whenever there are indications that their carrying value may not be recoverable. For the purpose of impairment testing, intangible assets are grouped at the lowest levels for which there are separately identifiable cash flows. Any impairment losses are recognised immediately in the income statement.
(m) Employee benefits(i) Defined contribution plansObligations for contributions to defined contribution pension plans are recognised as an expense in the income statement as incurred. Payments made to state-managed retirement benefit schemes are dealt with in the same manner as payments to defined contribution plans where the Group’s obligations under the plans are equivalent to a defined contribution retirement benefit plan. The funds of the schemes are independent of the Group’s finances.
(ii) Defined benefit planFor the Group’s defined benefit pension plan, the cost of providing benefits is determined using the projected unit credit method, with actuarial valuations being carried out at each balance sheet date. The assumptions used to determine the valuation are shown in note 18. Actuarial gains and losses are recognised in full in the period in which they occur. Actuarial gains and losses are recognised outside the income statement and presented in the consolidated statement of comprehensive income.
Administrative costs of running the scheme are expensed directly in the Income Statement. Past service cost is recognised immediately through the Income Statement. Assets of the pension scheme are held separately from the Group’s assets.
(iii) Share-based paymentsThe share option programme allows Group employees to acquire shares of the Company, subject to certain criteria. The fair value of options granted is recognised as an expense of employment in the income statement with a corresponding increase in equity. The fair value is measured at the date of grant and spread over the period during which the employees become unconditionally entitled to the options. The fair value of the options granted is measured using a Black-Scholes model, taking into account the terms and conditions upon which the options were granted. The amount recognised as an expense in any year is adjusted to reflect the actual number of share options that are expected to vest. However if share options fail to vest due to the Company’s total shareholder’s return not achieving the designated performance threshold for vesting, no such adjustment takes place.
BTG plc Annual Report and Accounts 2017
119Financials
Financials
BTG plc Annual Report and Accounts 2017
119Financials

2. Significant accounting policies continued(n) Trade and other payablesTrade and other payables, except for contingent consideration liabilities, are not interest bearing and are stated at amortised cost
Contingent consideration liabilities are initially recognised at their fair value. The fair value of contingent consideration liabilities are reassessed at each subsequent balance sheet date, with any change in fair value being immediately reflected in the income statement.
Trade and other payables also includes provisions. A provision is recognised in the balance sheet when the Group has a present legal or constructive obligation as a result of a past event, and it is probable that an outflow of economic benefits will be required to settle the obligation. If the effect is material, provisions are determined by discounting the expected future cash flows at a pre-tax discount rate that reflects current market assessments of the time value of money and, where appropriate, the risks specific to the relevant liability.
A provision for onerous contracts is recognised when the expected benefits to be derived by the Group from a contract are lower than the unavoidable cost of meeting its obligations under the contract.
A charge for reorganisation costs is taken to the income statement when the Group has approved a detailed and formal reorganisation plan, and the reorganisation has either commenced or the Group has a constructive obligation, for example having made an announcement publicly to the employee or the Group as a whole.
A contingent liability is disclosed in the notes to the accounts, but not recognised on the statement of financial position, if a material outflow of economic benefits is expected to be required to settle a legal or constructive obligation as a result of a past event, where the probability of such an outflow is less than probable but more than remote or the liability cannot be reliably estimated.
(o) Revenue recognitionRevenue represents amounts received or receivable in respect of the sale of products to customers during the year, net of trade discounts given, rebates and returns, and value added tax, and in respect of royalty arrangements:
(i) Products The Group recognises revenue for product sales when each condition of IAS 18, paragraph 14 is wholly-satisfied. Where sales arrangements specify a second element of revenue contingent upon a specified event, this revenue is not recognised until this event has occurred and it is certain that the economic benefit triggered by this event will flow to the Group. In cases where product is sold to a customer with a right of replacement, the Group views the transaction as a multi-element arrangement and a portion of the value from the sale is deferred and allocated to the replacement right based on the fair value of the replacement right.
(ii) RoyaltiesRevenues from the Group’s licensed programmes are generated following the grant of a licence to a third party to undertake additional development and commercialisation of a research and development programme or other intellectual property rights.
In addition to an upfront payment, BTG may be entitled to additional revenues such as milestone payments or royalties on revenues generated by the licensee. Revenues associated with royalty arrangements may in turn be linked to additional obligations on BTG.
Royalty income is generated by sales of products incorporating the Group’s proprietary technology. Royalty revenues are recognised once the amounts due can be reliably estimated based on the sale of underlying products and recoverability is assured. Where there is insufficient historical data on sales and returns to fulfil these requirements, for example in the case of a new product, the royalty revenue will not be recognised until the Group can reliably estimate the underlying sales.
(p) Cost of salesCost of sales includes the direct costs incurred in manufacturing and bringing products to sale in the market, revenue sharing costs, and amortisation of other intangibles.
Revenue sharing costs represent amounts due under royalty arrangements to licensors or assignees of technology and similar directly attributable items. Amounts are recognised upon recognition by the Group of amounts due from a licensee. They are recognised on an accruals basis in accordance with the individual agreements relating to the relevant technology, in line with revenue recognition for the related royalties.
BTG plc Annual Report and Accounts 2017 BTG plc Annual Report and Accounts 2017
120Financials
BTG plc Annual Report and Accounts 2017 BTG plc Annual Report and Accounts 2017
120Financials
Notes to the consolidated financial statements
continued
(q) Research and developmentResearch expenditure is charged to the income statement in the period in which it is incurred.
Expenditure incurred on development projects (relating to the design and testing of new or improved products) is recognised as intangible assets when it is probable that the project will generate future economic benefit, considering factors including its commercial and technological feasibility, status of regulatory approval, and the ability to measure costs reliably. Other development expenditures are recognised as an expense as incurred. Development expenditure previously recognised as an expense is not recognised as an asset in a subsequent period. Development expenditure that has a finite useful life and which has been capitalised is amortised from the commencement of the commercial production of the product on a straight-line basis over the period of its expected benefit. No development expenditure has been capitalised in either the current or prior year.
Property, plant and equipment used for research and development is depreciated in accordance with the Group’s policy and the cost is included within ‘Research and development’ in the income statement.
(r) LeasesLeases are classified as finance leases whenever the terms of the lease transfer substantially all the risks and rewards of ownership to the lessee. All other leases are classified as operating leases.
Assets held under finance leases are initially recognised within property, plant and equipment of the Group at their fair value or, if lower, at the present value of the minimum lease payments, each determined at the inception of the lease. The corresponding liability to the lessor is included in the balance sheet as a finance lease obligation. Lease payments are apportioned between finance charges and reduction of the lease obligation so as to achieve a constant rate of interest on the remaining balance of the liability. Finance charges are charged directly against income. Such assets are depreciated over the shorter of their estimated useful lives or the length of the lease. Assets purchased under hire purchase agreements are accounted for similarly, except that these assets are depreciated over their estimated useful lives.
Rentals under operating leases are charged to the income statement on a straight-line basis over the term of the relevant lease within the appropriate functional expenditure heading.
(s) Financial incomeFinancial income comprises interest income receivable during the year, calculated using the effective interest rate method, fair value adjustments and gains on settlement of foreign exchange forward contracts, and fair value adjustments for contingent consideration liabilities.
(t) Financial expenseFinancial expense comprises interest payable during the year, calculated using the effective interest rate method, fair value adjustments and losses on settlement of foreign exchange forward contracts, and fair value adjustments on contingent consideration liabilities, other financing costs and borrowings.
(u) TaxTax on the profit or loss for the year comprises current and deferred tax. Tax is recognised in the income statement except to the extent that it relates to items recognised directly in equity, in which case the related tax effect is recognised directly in equity.
Current tax is the expected tax payable on the taxable income for the year, using tax rates enacted or substantively enacted at the balance sheet date, and any adjustment to tax payable in respect of previous years.
Deferred tax is provided using the balance sheet liability method, providing for temporary differences between the carrying value of assets and liabilities for financial reporting purposes and the amounts used for taxation purposes. The following temporary differences are not provided for: where the deferred tax liability arises from the initial recognition of goodwill or of an asset or liability in a transaction that is not a business combination and, at the time of the transaction, affects neither the accounting profit nor taxable profit or loss; and taxable temporary differences associated with investments in subsidiaries and associates, where it is probable that the temporary differences will not reverse in the foreseeable future.
The amount of deferred tax provided is based on the expected manner of realisation or settlement of the carrying value of assets and liabilities, using tax rates enacted or substantively enacted at the balance sheet date.
A deferred tax asset is recognised only to the extent that it is probable that future taxable profits will be available against which the asset can be utilised.
BTG plc Annual Report and Accounts 2017
121Financials
Financials
BTG plc Annual Report and Accounts 2017
121Financials

2. Significant accounting policies continued(v) BTG Employee Share TrustIncluded within the Group’s financial results are the financial statements of the BTG Employee Share Trust, the costs of which are expensed within the financial statements of the Trust as incurred.
In the consolidated financial statements, the cost of BTG plc ordinary shares held by the Trust is treated as a deduction from shareholders’ funds.
(w) Financial guaranteesWhere the Company enters into financial guarantee contracts to guarantee the indebtedness of other companies within its Group, the Company considers these to be insurance arrangements, and accounts for them as such. In this respect, the Company treats the guarantee contracts as a contingent liability until such time as it becomes probable that the Company will be required to make a payment under the guarantee.
3. Critical accounting judgements and key sources of estimation uncertaintyIn preparing the financial statements, management is required to make estimates and assumptions that affect the reported amounts of assets and liabilities and disclosures of contingent assets and liabilities. As these estimates involve judgement, actual amounts and results could differ from those estimates. The following are considered to be the Group’s critical accounting judgements and key sources of estimation uncertainty:
(i) Recoverability of goodwill and other intangible assetsThe Group has significant goodwill and intangible assets resulting from historical business combinations. As at 31 March 2017, goodwill was £225.6m (2016: £187.9m) and other intangible assets was £678.9m (2016: £599.2m).
Goodwill is deemed to have an indefinite life and is tested annually for impairment or whenever events or changes in circumstances indicate the carrying value of goodwill may not be recoverable. The recoverable amount of the Group’s goodwill is assessed based on the fair value less costs to sell of the relevant group of cash generating units to which goodwill has been allocated. Determining fair value less costs to sell requires the application of significant judgement, particularly in the estimation of forecast future cash flows and the terminal growth rate for each relevant cash generating unit, and
the discount rate used to determine the present value of forecast future cash flows. Further details regarding the estimates and assumptions used in determining the recoverable amount of cash generating units to which goodwill has been allocated are included in note 10 to the financial statements.
The recoverability of all other indefinite lived intangible assets (IPR&D) and those definite lived intangible assets for which management has determined may not be recoverable has been assessed. The recoverable amount of IPR&D and other intangible assets is assessed based on the value-in-use of the relevant intangible asset. Determining value in use requires the application of significant judgement, particularly in estimating risk adjusted forecast future cash flows covering the estimated useful life of the relevant asset, and the discount rate used to determine the present value of forecast future cash flows. Further details of the estimates and assumptions used in determining the recoverable amounts of the Group’s intangible assets are included in note 11 to the financial statements.
The estimates and assumptions on which fair value less costs to sell and value-in-use are based are inherently judgemental. Future events could therefore lead to changes in assumptions used in these recoverability assessments. It is therefore possible a change in any such assumption could lead to future impairment charges, which if recognised, could significantly impact the Group’s financial results.
(ii) Contingent consideration liabilitiesThe fair value of the Group’s contingent liabilities as of 31 March 2017 was £32.1m (2016: £27.2m).
Contingent consideration liabilities represent the fair value of those future milestones, included in deferred payment arrangements from historical business combinations, which the Company may be required to pay if certain development, regulatory or sales milestone events occur. The determination of the fair value of contingent consideration liabilities requires the application of significant judgement, including the probability of the relevant event triggering the milestone occurring, the estimated timing of such relevant events and the discount rate used to determine the present value of the risk adjusted milestone payments.
The Group’s principal contingent consideration liabilities relate to the acquisitions of PneumRx Inc in 2015 and Galil Medical in 2016, see note 21 for further details. The estimates and assumptions used in determining the fair value of these contingent consideration liabilities are inherently judgemental.
BTG plc Annual Report and Accounts 2017 BTG plc Annual Report and Accounts 2017
122Financials
BTG plc Annual Report and Accounts 2017 BTG plc Annual Report and Accounts 2017
122Financials
Notes to the consolidated financial statements
continued

Future events could lead to changes in assumptions used to determine the fair value of contingent consideration liabilities. It is therefore possible that a change in any such assumption could lead to a material fair value charge or credit, which if recognised could significantly impact the Group’s financial results.
(iii) Deferred taxAt March 31, 2017, the Group’s deferred tax assets amounted to £5.3m (2016: £6.8m) and the Group’s net deferred tax liabilities amounted to £157.2m (2016: £147.0m).
Deferred tax assets are recognised to the extent that it is probable that future taxable profits will be available against which the temporary differences can be utilised, based on management’s assumptions relating both to the amount and timing of future taxable profits. In recognising deferred tax assets, management has taken into account expected changes in tax rates in each relevant jurisdiction.
Inherent uncertainties exist as management is required to exercise judgement in determining whether it is more likely than not that it would realise these deferred tax assets. Where deferred tax assets are recognised following an acquisition, management has to exercise judgement to assess the validity of acquired tax losses and the impact of change of control provisions. If actual events differ from management’s estimates, or to the extent that estimates of future taxable profits are adjusted in the future, it is therefore possible that any such change in assumption could lead to a material charge or credit, which if recognised could significantly impact the Group’s financial results.
(iv) Business combinationsIn conjunction with IFRS 3 Business Combinations, the Group has recognised intangible assets in respect of acquired developed technology and in-process research and development (“IPR&D”).
Significant judgement is required in determining the unit of account at which separate intangible assets should be recognised, and the fair values of the identifiable intangible assets as of the acquisition date. Determining the market participant fair value of acquired intangible assets requires the application of significant judgement, including estimates of risk adjusted forecast future cash flows, the probability of regulatory approval for IPR&D assets, determination of market participant or buyer specific synergies, the relevant discount rate to determine the present value of forecast future cash flows and the tax amortisation benefit related to the individual intangible asset.
The estimates and assumptions used to determine the fair value of acquired intangible assets are inherently uncertain, and the adoption of different assumptions and estimates could result in the assignment of a different fair value for acquired intangible assets than has been recognised by the Group.
4. Operating segmentsOperating segments are reported based on the financial information provided to the Group’s chief operating decision-making body, being the Leadership team. The Group is aligned behind three reportable segments, being Interventional Medicine, Specialty Pharmaceuticals and Licensing.
In assessing performance and making resource allocation decisions, the Leadership Team reviews contribution by segment. Contribution is defined as being gross profit less directly attributable selling, general and administrative costs (SG&A). The Licensing operating segment includes SG&A relating to the Group’s centrally managed support functions and corporate overheads. The Group’s reportable segments reflects the management structure and stewardship of the business. No allocation of central overheads is made across the Specialty Pharmaceuticals or Interventional Medicine operating segments. Research and development continues to be managed on a global basis, with investment decisions being made by the Leadership Team as a whole. Research and development is not managed by reference to the Group’s operating segments, though each programme within the pipeline would ultimately provide revenues for one of the operating segments if successful.
BTG plc Annual Report and Accounts 2017
123Financials
Financials
BTG plc Annual Report and Accounts 2017
123Financials
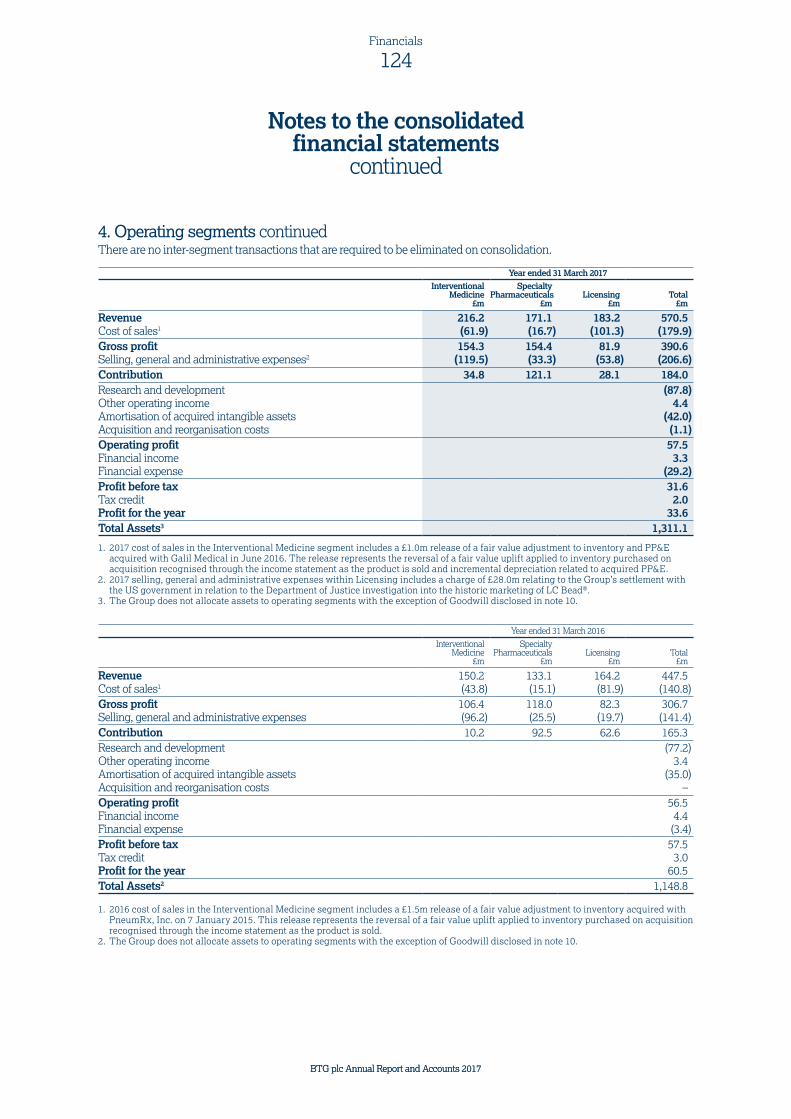
4. Operating segments continuedThere are no inter-segment transactions that are required to be eliminated on consolidation.
Year ended 31 March 2017Interventional
Medicine£m
SpecialtyPharmaceuticals
£mLicensing
£mTotal
£m
Revenue 216.2 171.1 183.2 570.5Cost of sales1 (61.9) (16.7) (101.3) (179.9)Gross profit 154.3 154.4 81.9 390.6Selling, general and administrative expenses2 (119.5) (33.3) (53.8) (206.6)Contribution 34.8 121.1 28.1 184.0Research and development (87.8)Other operating income 4.4Amortisation of acquired intangible assets (42.0)Acquisition and reorganisation costs (1.1)Operating profit 57.5Financial income 3.3Financial expense (29.2)Profit before tax 31.6Tax credit 2.0Profit for the year 33.6Total Assets3 1,311.1
1. 2017 cost of sales in the Interventional Medicine segment includes a £1.0m release of a fair value adjustment to inventory and PP&E acquired with Galil Medical in June 2016. The release represents the reversal of a fair value uplift applied to inventory purchased on acquisition recognised through the income statement as the product is sold and incremental depreciation related to acquired PP&E.
2. 2017 selling, general and administrative expenses within Licensing includes a charge of £28.0m relating to the Group’s settlement with the US government in relation to the Department of Justice investigation into the historic marketing of LC Bead®.
3. The Group does not allocate assets to operating segments with the exception of Goodwill disclosed in note 10.
Year ended 31 March 2016
InterventionalMedicine
£m
SpecialtyPharmaceuticals
£mLicensing
£mTotal
£m
Revenue 150.2 133.1 164.2 447.5Cost of sales1 (43.8) (15.1) (81.9) (140.8)Gross profit 106.4 118.0 82.3 306.7Selling, general and administrative expenses (96.2) (25.5) (19.7) (141.4)Contribution 10.2 92.5 62.6 165.3Research and development (77.2)Other operating income 3.4Amortisation of acquired intangible assets (35.0)Acquisition and reorganisation costs –Operating profit 56.5Financial income 4.4Financial expense (3.4)Profit before tax 57.5Tax credit 3.0Profit for the year 60.5Total Assets2 1,148.8
1. 2016 cost of sales in the Interventional Medicine segment includes a £1.5m release of a fair value adjustment to inventory acquired with PneumRx, Inc. on 7 January 2015. This release represents the reversal of a fair value uplift applied to inventory purchased on acquisition recognised through the income statement as the product is sold.
2. The Group does not allocate assets to operating segments with the exception of Goodwill disclosed in note 10.
BTG plc Annual Report and Accounts 2017 BTG plc Annual Report and Accounts 2017
124Financials
BTG plc Annual Report and Accounts 2017 BTG plc Annual Report and Accounts 2017
124Financials
Notes to the consolidated financial statements
continued

Revenue analysisAnalysis of revenue, based on the geographical location of customers and the source of revenue is provided below:
Geographical analysisYear ended
31 March 2017
£m
Year ended31 March
2016£m
USA 513.7 393.1Europe 41.1 42.3Other regions 15.7 12.1
570.5 447.5
Revenue from major products and servicesYear ended
31 March 2017
£m
Year ended31 March
2016£m
Product sales 387.3 283.3Royalties 183.2 164.2
570.5 447.5
Major customersThe Group’s products are sold both directly and through distribution agreements in the USA, Europe and Asia Pacific region. No individual customer generated income in excess of 10% of the Group revenue during the year ended 31 March 2017 or 31 March 2016.
Products that utilise the Group’s intellectual property rights are sold by licensees. Royalty income is derived from over 40 licences. One licence individually generated royalty income in excess of 10% of Group revenue of £123.2m (2016: £118.9m).
BTG plc Annual Report and Accounts 2017
125Financials
Financials
BTG plc Annual Report and Accounts 2017
125Financials

5. Operating profitOperating profit has been arrived at after charging/(crediting):
Note
Year ended31 March
2017£m
Year ended31 March
2016£m
Depreciation and impairment of property, plant and equipment 12 6.6 6.6Amortisation and impairment of intangible assets 11 46.7 38.0Net foreign exchange gains (4.3) (4.4)Research and development 87.8 77.2Expense relating to settlement of DOJ investigation 28.0 –Staff costs 6 164.0 116.2Operating lease rentals payable on property 3.0 2.5Acquisition and reorganisation costs 1.1 –
Expense relating to the settlement of DOJ investigation In October 2016, BTG announced its Biocompatibles, Inc. subsidiary reached a settlement with the US government in relation to the Department of Justice’s investigation of the historic marketing of LC Bead®. The investigation focused on the period pre-dating BTG’s acquisition of Biocompatibles in January 2011. Biocompatibles agreed to settle all allegations and consequently paid a total penalty of US$36m. BTG was not required to enter into a Corporate Integrity Agreement as part of the settlement. In the year to 31 March 2017, the Group recognised a charge of £28.0m relating to this settlement within ‘Selling, general & administrative expenses’.
Auditor’s remunerationThe analysis of the auditor’s remuneration is as follows:
Year ended31 March
2017£’000
Year ended31 March
2016£’000
Fees payable to the Company’s auditor for the audit of the Group and Company’s annual accounts: 200 168Fees payable to the Company’s auditor and its associates for other services:Audit of the Company’s subsidiaries pursuant to legislation 345 290Audit of pension scheme trust 11 11Other audit related assurance services 60 54Taxation compliance services 424 370
For information on how auditor objectivity and independence is safeguarded when non-audit services are provided by the auditor, see the Audit Committee Report on pages 57 to 65.
6. Staff costsStaff costs (including directors’ emoluments and reorganisation costs) are as follows:
Year ended31 March
2017£m
Year ended31 March
2016£m
Salaries 135.5 94.0Social security costs 12.9 10.4Defined contribution pension costs 6.7 5.0Defined benefit pension costs 0.4 0.1Equity-settled transactions 8.5 6.7
164.0 116.2
Key management personnel are considered to be the directors and their remuneration is disclosed within the Remuneration Report on pages 72 to 97. In addition to the disclosures in the Remuneration Report, the charge to income in respect of equity-settled transactions of key management personnel, in accordance with IFRS 2, was £2.6m (2016: £2.6m).
BTG plc Annual Report and Accounts 2017 BTG plc Annual Report and Accounts 2017
126Financials
BTG plc Annual Report and Accounts 2017 BTG plc Annual Report and Accounts 2017
126Financials
Notes to the consolidated financial statements
continued

The average number of persons employed by the Group during the year (including executive directors), analysed by category, was as follows:
Year ended31 March
2017Number
Year ended31 March
2016Number
Management 99 99Research and production 703 673Sales, administration and business support 553 410
1,355 1,182
7. Financial income and expenseYear ended
31 March 2017
£m
Year ended31 March
2016£m
Interest receivable on money-market and bank deposits 0.3 0.2Fair value movements from foreign exchange forward contracts – 1.2Fair value movements on contingent consideration liabilities 3.0 3.0Financial income 3.3 4.4
Fair value movements and realised losses from foreign exchange forward contracts 25.2 –Fair value movements on contingent consideration liabilities 2.3 1.7Other financial expense 1.7 1.7Financial expense 29.2 3.4
In the year to 31 March 2017, the Group recognised a fair value credit of £3.0m related to the contingent consideration from the PneumRx acquisition and a fair value charge of £2.3m related to the contingent consideration from the Galil Medical acquisition.
In the year to 31 March 2016, fair value changes on contingent consideration related to the PneumRx acquisition was a net credit of £3.0m, being a £12.0m credit relating to the non-payment of the first revenue milestone and a £9.0m charge relating to the US regulatory milestone, and a £1.6m charge related to the contingent consideration milestones for the EKOS acquisition. Further information on the current fair value of the US regulatory milestone relating to the acquisition of PneumRx, and potential future changes to this fair value, is included in Note 21 to these financial statements.
The change in fair value and realised losses on the Group’s forward foreign exchange contracts of £25.2m for the year to 31 March 2017 are now both recorded within financial expense. The loss of £25.2m included realised losses of £17.1m on settlement of forward contracts and unrealised losses of £8.1m on remeasurement of the Group’s outstanding forward contracts to their fair value.
For the year ended 31 March 2016, the Company recorded unrealised gains of £1.2m on the remeasurement of outstanding forward contracts to their fair value in ‘Financial income’, and included realised foreign exchange gains of £1.4m on settlement of forward contracts in ‘Other operating income’ above operating profit.
BTG plc Annual Report and Accounts 2017
127Financials
Financials
BTG plc Annual Report and Accounts 2017
127Financials

8. TaxAn analysis of the tax credit in the income statement for the year, all relating to current operations, is as follows:
Year ended31 March
2017£m
Year ended31 March
2016£m
Current taxUK corporation tax charge – –Overseas corporate tax charge 11.8 11.7Adjustments in respect of prior years (1.7) (2.2)Total current taxation 10.1 9.5
Deferred taxationDeferred tax credit (13.0) (13.8)Adjustment to tax rates 0.9 1.3Total deferred taxation (12.1) (12.5)Total tax credit for the year (2.0) (3.0)
In addition to the tax credit in the income statement, a deferred tax credit of £4.1m (2016: £1.1m charge) has been recognised in the consolidated statement of other comprehensive income relating to the deferred tax on the pension fund surplus.
UK corporation tax is calculated at 20% (2016: 20%) of the estimated taxable profit for the year. Taxation for other jurisdictions is calculated at the rates prevailing in the respective jurisdictions.
Reconciliation of the effective tax rate:
Year ended31 March
2017£m
Year ended31 March
2016£m
Profit before tax 31.6 57.5Tax using UK corporation tax rate of 20% (2016: 20%) 6.3 11.5Effect of overseas tax rates 1.4 4.2Recognition of tax losses1 (6.7) (15.2)Change in unrecognised deferred tax assets (1.2) (0.4)Non-deductible expenses2 4.5 –Effect of UK patent box deduction (5.5) (4.4)Intra-group transfer of subsidiary undertaking – 2.4Adjustment to tax rates 0.9 1.3Adjustments in respect of prior years3 (1.7) (2.4)
(2.0) (3.0)
1. The recognition of historic UK and US tax losses arises from sustained profitability of the related underlying business.2. The non-deductible expenses arises primarily from the settlement of US litigation.3. The prior year adjustment arises mainly from a reassessment of prior year US tax liabilities.
An analysis of amounts included in the Consolidated statement of financial position in respect of income taxes is shown below:
31 March 2017
£m
31 March 2016
£m
Current assetsUK corporation tax receivable 2.6 1.8Overseas corporation tax receivable 0.1 –
2.7 1.8Current liabilitiesOverseas corporate tax payable 5.1 5.8
5.1 5.8
BTG plc Annual Report and Accounts 2017 BTG plc Annual Report and Accounts 2017
128Financials
BTG plc Annual Report and Accounts 2017 BTG plc Annual Report and Accounts 2017
128Financials
Notes to the consolidated financial statements
continued
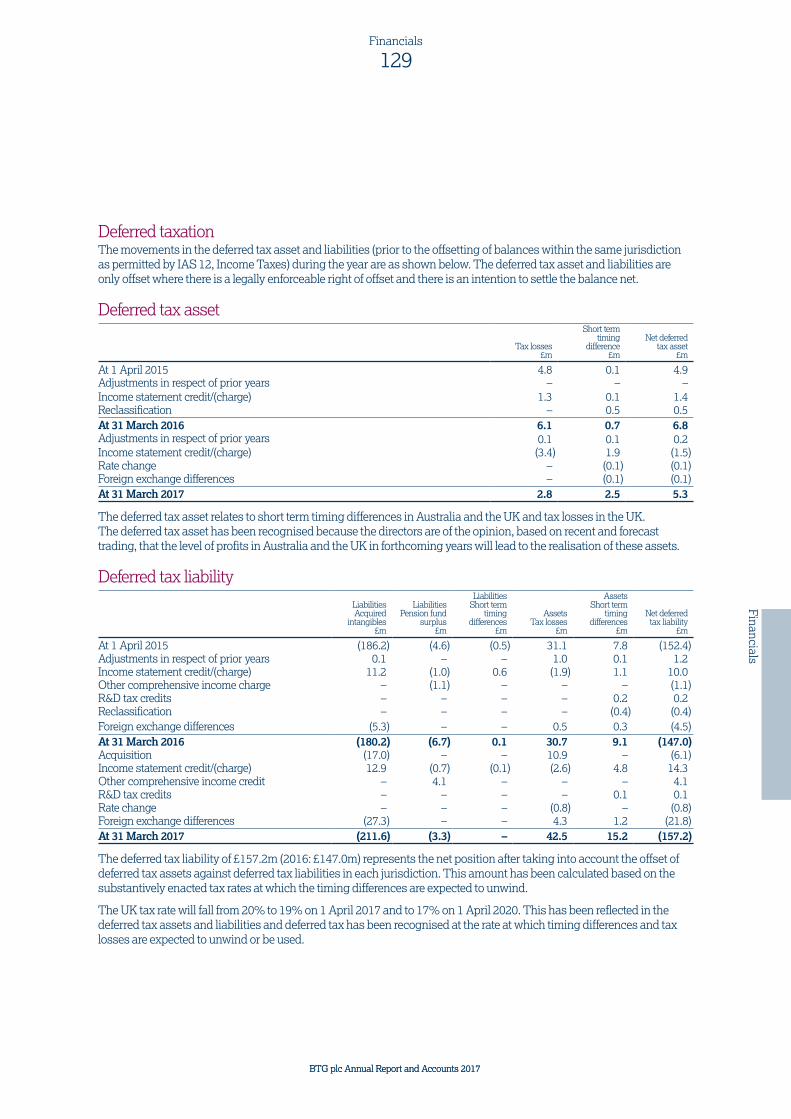
Deferred taxationThe movements in the deferred tax asset and liabilities (prior to the offsetting of balances within the same jurisdiction as permitted by IAS 12, Income Taxes) during the year are as shown below. The deferred tax asset and liabilities are only offset where there is a legally enforceable right of offset and there is an intention to settle the balance net.
Deferred tax asset
Tax losses£m
Short term timing
difference£m
Net deferred tax asset
£m
At 1 April 2015 4.8 0.1 4.9Adjustments in respect of prior years – – –Income statement credit/(charge) 1.3 0.1 1.4Reclassification – 0.5 0.5At 31 March 2016 6.1 0.7 6.8Adjustments in respect of prior years 0.1 0.1 0.2Income statement credit/(charge) (3.4) 1.9 (1.5)Rate change – (0.1) (0.1)Foreign exchange differences – (0.1) (0.1)At 31 March 2017 2.8 2.5 5.3
The deferred tax asset relates to short term timing differences in Australia and the UK and tax losses in the UK. The deferred tax asset has been recognised because the directors are of the opinion, based on recent and forecast trading, that the level of profits in Australia and the UK in forthcoming years will lead to the realisation of these assets.
Deferred tax liabilityLiabilitiesAcquired
intangibles£m
LiabilitiesPension fund
surplus£m
LiabilitiesShort term
timingdifferences
£m
AssetsTax losses
£m
AssetsShort term
timingdifferences
£m
Net deferredtax liability
£m
At 1 April 2015 (186.2) (4.6) (0.5) 31.1 7.8 (152.4)Adjustments in respect of prior years 0.1 – – 1.0 0.1 1.2Income statement credit/(charge) 11.2 (1.0) 0.6 (1.9) 1.1 10.0Other comprehensive income charge – (1.1) – – – (1.1)R&D tax credits – – – – 0.2 0.2Reclassification – – – – (0.4) (0.4)Foreign exchange differences (5.3) – – 0.5 0.3 (4.5)At 31 March 2016 (180.2) (6.7) 0.1 30.7 9.1 (147.0)Acquisition (17.0) – – 10.9 – (6.1)Income statement credit/(charge) 12.9 (0.7) (0.1) (2.6) 4.8 14.3Other comprehensive income credit – 4.1 – – – 4.1R&D tax credits – – – – 0.1 0.1Rate change – – – (0.8) – (0.8)Foreign exchange differences (27.3) – – 4.3 1.2 (21.8)At 31 March 2017 (211.6) (3.3) – 42.5 15.2 (157.2)
The deferred tax liability of £157.2m (2016: £147.0m) represents the net position after taking into account the offset of deferred tax assets against deferred tax liabilities in each jurisdiction. This amount has been calculated based on the substantively enacted tax rates at which the timing differences are expected to unwind.
The UK tax rate will fall from 20% to 19% on 1 April 2017 and to 17% on 1 April 2020. This has been reflected in the deferred tax assets and liabilities and deferred tax has been recognised at the rate at which timing differences and tax losses are expected to unwind or be used.
BTG plc Annual Report and Accounts 2017
129Financials
Financials
BTG plc Annual Report and Accounts 2017
129Financials

8. Tax continuedUnrecognised tax lossesIn addition to the losses on which a deferred tax asset has been recognised, the Group has additional tax losses and other timing differences which have arisen principally as a result of the research and development incurred during the start up of the Group’s activities. These losses and timing differences are shown below. UK tax losses can be carried forward indefinitely.
The US tax losses can be carried forward for 20 years and the first year in which they expire is 2019.
A deferred tax asset has not been recognised in respect of the losses and timing differences shown below as there is uncertainty as to whether such losses and timing differences will be used.
The total amount of tax losses and timing differences not recognised is shown below:
Year ended31 March
2017£m
Year ended31 March
2016£m
UK tax losses 50.1 59.4US tax losses 23.1 22.4Other Regions tax losses 23.6 –Deductible temporary differences 31.0 27.0
127.8 108.8
9. Earnings per shareThe calculation of the basic and diluted earnings per share is based on the following data:
Year ended31 March
2017
Year ended31 March
2016
Profit for the year (£m) 33.6 60.5
Profit per share (p) Basic 8.7 15.8 Diluted 8.6 15.6
Number of shares (m)
Weighted average number of shares – basic 384.4 382.6Effect of share options on issue 5.6 5.7Weighted average number of shares – diluted 390.0 388.3
BTG plc Annual Report and Accounts 2017 BTG plc Annual Report and Accounts 2017
130Financials
BTG plc Annual Report and Accounts 2017 BTG plc Annual Report and Accounts 2017
130Financials
Notes to the consolidated financial statements
continued

10. GoodwillNote £m
At 1 April 2015 183.8Foreign exchange differences 4.1At 31 March 2016 187.9Acquisitions 26 16.4Foreign exchange differences 21.3At 31 March 2017 225.6Accumulated impairment lossesAt 1 April 2015, 31 March 2016 and 31 March 2017 –Net book value at 31 March 2017 225.6Net book value at 31 March 2016 187.9 Net book value at 1 April 2015 183.8
Goodwill has been allocated to groups of cash generating units, being the Group’s operating segments (see note 4) in proportion to the anticipated benefits of goodwill on the relevant operating segment, having regard for the assets and liabilities acquired. The carrying value of goodwill has been allocated to Interventional Medicine £189.1m (2016: £151.4m), to Specialty Pharmaceuticals £16.4m (2016: £16.4m), and to Licensing £20.1m (2016: £20.1m).
In the year ended 31 March 2017, the recoverable amounts of these cash generating units has been determined using a fair value less costs to sell approach. Fair value less costs to sell is calculated using a discounted cash flow approach, with a post-tax discount rate applied to forecast future cash flows and terminal values. In the year ended 31 March 2016, the Group utilised a value-in-use approach to determine the recoverable amounts of its cash generating units.
Key assumptions used to estimate fair value less costs to sell relate to sales growth rates, anticipated profit margins, estimated tax rates, terminal growth rates and discount rates. Sales growth rates are derived from internal forecasts based on both internal and external market information, whilst anticipated profit margins reflect past experience, adjusted for expected future changes. Projected cash flows cover a five year period, and terminal growth rates have been applied to determine the terminal value of each group of cash generating units. These terminal growth rates, based on management’s estimate of future long-term average growth rates, are 2.75% for Interventional Medicine, 0.5% for Specialty Pharmaceuticals and 0% for Licensing. The discount rate of 9% is based on an estimate of the Group’s WACC. The valuation methodology uses significant inputs which are not based on observable market data, therefore this valuation technique is classified as level 3 in the fair value hierarchy. In each case the valuation of each cash generating unit indicated sufficient headroom such that a reasonably possible change to key assumptions is currently unlikely to result in an impairment to the related goodwill.
BTG plc Annual Report and Accounts 2017
131Financials
Financials
BTG plc Annual Report and Accounts 2017
131Financials

11. Intangible assets
Group Note
Developedtechnology
£m
Contractualrelationships
£m
In-processresearch anddevelopment
£m
Computersoftware
£mPatents
£m
Purchase ofcontractual
rights£m
Total£m
CostAt 1 April 2015 577.8 42.1 105.8 1.4 16.6 8.5 752.2Additions – – – 0.4 0.9 23.0 24.3Disposals (0.3) (1.0) – – – – (1.3)Foreign exchange differences 15.1 1.0 3.2 – 0.7 0.2 20.2At 31 March 2016 592.6 42.1 109.0 1.8 18.2 31.7 795.4Acquisitions 47.3 – – 0.4 – – 47.7Additions – – – 0.5 0.2 – 0.7Disposals – – – – (0.8) (1.8) (2.6)Foreign exchange differences 78.4 5.0 15.5 0.2 – 0.9 100.0At 31 March 2017 718.3 47.1 124.5 2.9 17.6 30.8 941.2AmortisationAt 1 April 2015 91.6 41.8 5.8 0.7 13.4 1.0 154.3Amortisation charged 34.7 0.4 – 0.3 0.3 2.3 38.0Disposals (0.3) (1.0) – – – – (1.3)Foreign exchange differences 3.3 0.9 – – 1.0 – 5.2At 31 March 2016 129.3 42.1 5.8 1.0 14.7 3.3 196.2Amortisation charged 42.0 – – 0.8 0.5 2.9 46.2Impairments – – – – 0.5 – 0.5Disposals – – – – (0.1) (0.5) (0.6)Foreign exchange differences 14.9 5.0 – 0.1 – – 20.0At 31 March 2017 186.2 47.1 5.8 1.9 15.6 5.7 262.3Net book valueAt 31 March 2017 532.1 – 118.7 1.0 2.0 25.1 678.9At 31 March 2016 463.3 – 103.2 0.8 3.5 28.4 599.2At 1 April 2015 486.2 0.3 100.0 0.7 3.2 7.5 597.9
Amortisation relating to intangible assets acquired through business combinations of £42.0m (2016: £35.0m) is recorded within Amortisation of acquired intangible assets. All other intangible asset amortisation is recorded within Cost of sales, Selling, general and administrative expenses or Research and development.
Developed technology Developed technology represents intangible assets for products acquired through business combinations. The carrying value of individually significant cash generating units (“CGU’s”) which contain developed technology is:
31 March2017
£m
31 March2016
£m
Remaining amortisation
period at 31 March
2017
PneumRx® Coil (ROW) 111.8 104.9 12.8 yearsEkoSonic® 111.4 105.5 11.3 yearsTheraSphere® 95.1 90.1 11.3 yearsCroFab® 71.6 66.0 16.7 yearsDC Bead® and LC Bead® 62.8 69.9 8.8 yearsGalil Medical® 50.4 – 14.3 yearsDigiFab® 23.1 21.3 16.7 years
BTG plc Annual Report and Accounts 2017 BTG plc Annual Report and Accounts 2017
132Financials
BTG plc Annual Report and Accounts 2017 BTG plc Annual Report and Accounts 2017
132Financials
Notes to the consolidated financial statements
continued

In-process research and development31 March
2017£m
31 March2016
£m
PneumRx® Coil (US) 96.8 84.2Targeted Therapies Assets 21.2 18.4
Purchase of contractual rightsThe carrying value of individually significant CGUs with purchase of contractual rights, which include Varithena®, are outlined below.
31 March 2017
£m
31 March2016
£m
Varithena® 18.8 21.0
Developed technology assets are tested for impairment when indicators of impairment arise, whilst in-process research and development assets are tested for impairment at least annually.
The Group applies a value in use approach to determine the recoverable amount of its developed technology and IPR&D intangible assets. The determination of value in use utilises risk-adjusted cash flow forecasts over the useful economic lives of the relevant assets, with the present value of these forecasts calculated by use of a discount rate of 9% based on an estimate of the Group’s post-tax WACC.
Key assumptions used to estimate value in use relate to sales growth rates, anticipated profit margins, estimated tax rates and discount rates. Sales growth rates are derived from internal forecasts based on both internal and external market information, whilst anticipated profit margins reflect past experience, adjusted for expected future changes. These forecasts are inherently judgemental and are based on outputs from the Group’s planning cycle, with assumptions based on past experience and future expectations.
The recoverability of intangible assets for marketed products (“Developed Technology”) and purchased contractual rights is potentially at risk if pricing, reimbursement and/or market penetration are at lower levels than the Group’s current assumptions. The recoverability of the Group’s Vistogard intangible asset (2017: £6.4m) is at risk in the event of an unfavourable outcome to the ongoing litigation with Wellstat (see Note 20 for further details). Additionally, IPR&D assets carry inherent development and regulatory risks, such that these assets are particularly at risk of impairment in full if the relevant development programmes do not obtain the requisite regulatory approval or reach commercialisation, and there is no alternative use for these assets. Given their nature, impairment charges which may be triggered by future events that have yet to occur could significantly impact the Group’s financial results.
BTG plc Annual Report and Accounts 2017
133Financials
Financials
BTG plc Annual Report and Accounts 2017
133Financials

12. Property, plant and equipment
Group
Leaseholdimprovements
£m
Freehold land and buildings
£m
Plant andmachinery
furniture andequipment
£m
Assets in thecourse of
construction£m
Total£m
Cost or valuationAt 1 April 2015 9.9 14.2 21.2 7.0 52.3Additions 0.1 0.2 2.4 3.5 6.2Disposals – – (1.8) – (1.8)Transfers 0.5 1.3 2.0 (3.8) –Foreign exchange differences – 0.4 0.4 0.3 1.1At 31 March 2016 10.5 16.1 24.2 7.0 57.8Acquisitions – – 1.0 – 1.0Additions 1.2 0.1 3.4 4.2 8.9Disposals (0.2) – (2.0) - (2.2)Transfers 1.8 0.1 3.8 (5.7) –Foreign exchange differences 0.6 1.6 2.5 0.4 5.1At 31 March 2017 13.9 17.9 32.9 5.9 70.6DepreciationAt 1 April 2015 2.1 2.8 11.8 0.1 16.8Depreciation charged 0.7 0.9 4.7 – 6.3Impairment charge – – 0.3 – 0.3Disposals – – (1.7) – (1.7)Foreign exchange differences 0.1 – 0.3 – 0.4At 31 March 2016 2.9 3.7 15.4 0.1 22.1Depreciation charged 1.4 0.5 4.7 – 6.6Impairment charge – – – – –Disposals (0.2) – (1.9) – (2.1)Foreign exchange differences 0.2 0.5 3.2 – 3.9At 31 March 2017 4.3 4.7 21.4 0.1 30.5Net book value at 31 March 2017 9.6 13.2 11.5 5.8 40.1Net book value at 31 March 2016 7.6 12.4 8.8 6.9 35.7Net book value at 1 April 2015 7.8 11.4 9.4 6.9 35.5
13. InventoriesYear ended
31 March 2017
£m
Year ended31 March
2016£m
Raw materials and consumables 23.5 16.4Work in progress 20.6 14.7Finished goods 14.3 15.4
58.4 46.5
Inventory to the value of £1.8m (2016: £3.4m) was written off through Cost of sales during the period.
BTG plc Annual Report and Accounts 2017 BTG plc Annual Report and Accounts 2017
134Financials
BTG plc Annual Report and Accounts 2017 BTG plc Annual Report and Accounts 2017
134Financials
Notes to the consolidated financial statements
continued

14. Trade and other receivablesYear ended
31 March 2017
£m
Year ended31 March
2016£m
Due within one yearTrade receivables, net of provisions for bad and doubtful debts 61.1 41.9Other receivables 13.5 12.1Prepayments and accrued income 51.1 52.5
125.7 106.5
‘Trade receivables, net of provisions for bad and doubtful debts’ represents product sales sold both directly and through distribution agreements and royalty receivables under licence agreements.
The ageing of these amounts was as follows:
2017Gross
£m
2017Provision
£m
2016Gross
£m
2016Provision
£m
Not past due 49.2 – 35.0 –0-30 days 7.5 – 4.4 –31-90 days 2.5 – 1.5 –> 90 days 2.2 (0.3) 1.7 (0.7)Total 61.4 (0.3) 42.6 (0.7)
Provisions for bad and doubtful debts of £0.3m (2016: £0.7m) write downs the value of receivables to their estimated recoverable amounts. The charge for the year to 31 March 2017 in respect of provisions for bad and doubtful debts was £0.2m (2016: £0.2m).
15. EquityThe issued and fully paid share capital of the Company is shown below:
Ordinary shares of 10p each Number2017
£m Number2016
£m
At 1 April 382,991,577 38.3 381,776,703 38.2Issued for cash 2,135,948 0.2 1,214,874 0.1At 31 March 385,127,525 38.5 382,991,577 38.3
The shares issued during the year ended 31 March 2017 were as a result of the exercise of share options.
Other reserves are analysed as follows:
Translation reserve
£m
Fair value reserve
£m
Total otherreserves
£m
At 31 March 2015 9.3 0.1 9.4Total recognised income and expense 18.7 – 18.7At 31 March 2016 28.0 0.1 28.1Total recognised income and expense 91.7 – 91.7At 31 March 2017 119.7 0.1 119.8
Share optionsDetails of outstanding share options are set out in note 19.
BTG plc Annual Report and Accounts 2017
135Financials
Financials
BTG plc Annual Report and Accounts 2017
135Financials

16. Trade and other payables
Note
31 March2017
£m
31 March2016
£m
Amounts falling due within one yearTrade payables 14.2 16.0Accruals and deferred income 105.1 94.8Contingent consideration liabilities 21 28.2 –Other creditors 4.5 4.0Provisions 0.5 1.4
152.5 116.2Amounts falling due after more than one yearAccruals and deferred income 2.0 0.3Contingent consideration liabilities 21 3.9 27.2Provisions 2.6 1.6
8.5 29.1
17. Derivative financial instruments31 March
2017£m
31 March2016
£m
Contracts in an asset position:Forward foreign exchange contracts due within one year 0.1 2.3Forward foreign exchange contracts due after more than one year – 1.0Derivative assets 0.1 3.3
Contracts in a liability position:Forward foreign exchange contracts due within one year 7.9 3.0Derivative liabilities 7.9 3.0
The Group utilises foreign currency derivatives to economically hedge significant future transactions and cash flows. The Group does not currently utilise hedge accounting for outstanding foreign exchange derivatives.
At 31 March 2017 the Group had forward contracts to sell US$169.6m in the period to March 2018 at a weighted average rate of £1:US$1.33. The fair value of these derivative financial instruments at 31 March 2017 was a liability at £7.8m (31 March 2016: £0.3m asset).
The unrealised loss of £8.1m (2016: £1.2m unrealised gain) for the year associated with the remeasurement of these forward contracts to their fair value was included within Financial expense (2016: Financial income).
A 5% strengthening of the US$ against sterling as at 31 March 2017 would result in an incremental charge of £6.8m within ‘Financial expense’ in the income statement and an increase of the derivative liability to £14.6m. Correspondingly a 5% weakening of the US$ against sterling would result in a £6.8m credit within ‘Financial expense’ and a reduction of the derivative liability to £1.0m.
BTG plc Annual Report and Accounts 2017 BTG plc Annual Report and Accounts 2017
136Financials
BTG plc Annual Report and Accounts 2017 BTG plc Annual Report and Accounts 2017
136Financials
Notes to the consolidated financial statements
continued
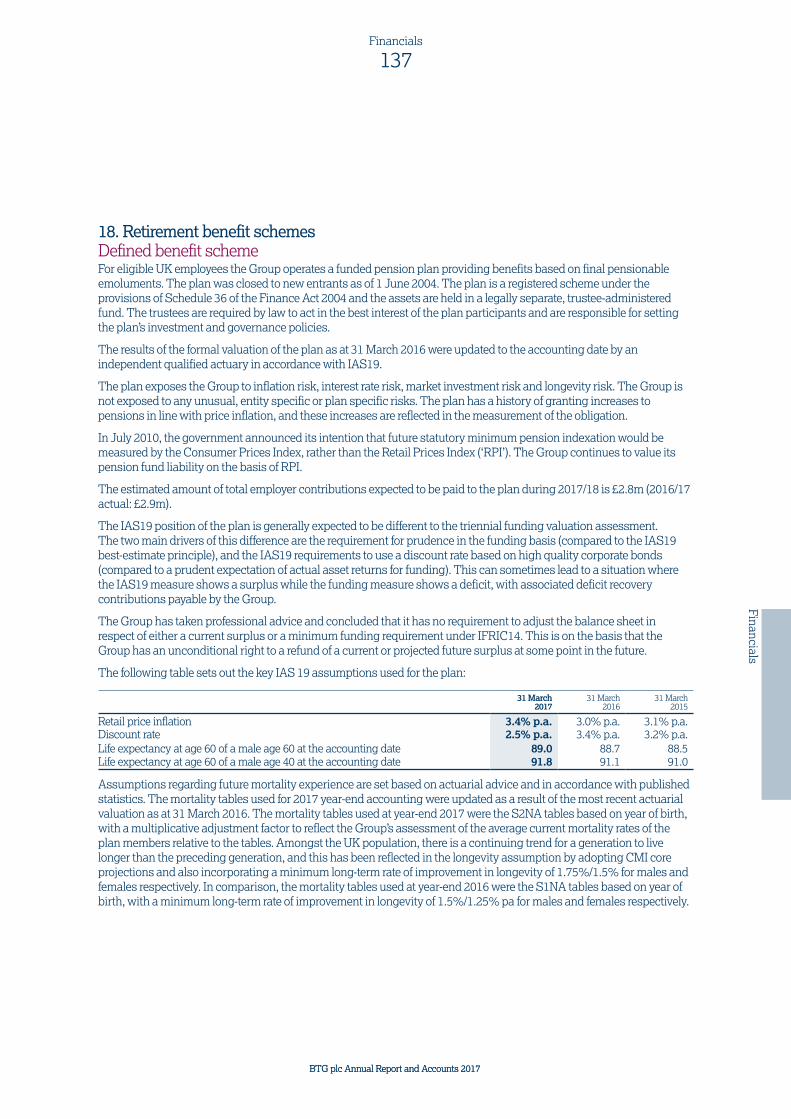
18. Retirement benefit schemesDefined benefit schemeFor eligible UK employees the Group operates a funded pension plan providing benefits based on final pensionable emoluments. The plan was closed to new entrants as of 1 June 2004. The plan is a registered scheme under the provisions of Schedule 36 of the Finance Act 2004 and the assets are held in a legally separate, trustee-administered fund. The trustees are required by law to act in the best interest of the plan participants and are responsible for setting the plan’s investment and governance policies.
The results of the formal valuation of the plan as at 31 March 2016 were updated to the accounting date by an independent qualified actuary in accordance with IAS19.
The plan exposes the Group to inflation risk, interest rate risk, market investment risk and longevity risk. The Group is not exposed to any unusual, entity specific or plan specific risks. The plan has a history of granting increases to pensions in line with price inflation, and these increases are reflected in the measurement of the obligation.
In July 2010, the government announced its intention that future statutory minimum pension indexation would be measured by the Consumer Prices Index, rather than the Retail Prices Index (‘RPI’). The Group continues to value its pension fund liability on the basis of RPI.
The estimated amount of total employer contributions expected to be paid to the plan during 2017/18 is £2.8m (2016/17 actual: £2.9m).
The IAS19 position of the plan is generally expected to be different to the triennial funding valuation assessment. The two main drivers of this difference are the requirement for prudence in the funding basis (compared to the IAS19 best-estimate principle), and the IAS19 requirements to use a discount rate based on high quality corporate bonds (compared to a prudent expectation of actual asset returns for funding). This can sometimes lead to a situation where the IAS19 measure shows a surplus while the funding measure shows a deficit, with associated deficit recovery contributions payable by the Group.
The Group has taken professional advice and concluded that it has no requirement to adjust the balance sheet in respect of either a current surplus or a minimum funding requirement under IFRIC14. This is on the basis that the Group has an unconditional right to a refund of a current or projected future surplus at some point in the future.
The following table sets out the key IAS 19 assumptions used for the plan:
31 March2017
31 March2016
31 March2015
Retail price inflation 3.4% p.a. 3.0% p.a. 3.1% p.a.Discount rate 2.5% p.a. 3.4% p.a. 3.2% p.a.Life expectancy at age 60 of a male age 60 at the accounting date 89.0 88.7 88.5Life expectancy at age 60 of a male age 40 at the accounting date 91.8 91.1 91.0
Assumptions regarding future mortality experience are set based on actuarial advice and in accordance with published statistics. The mortality tables used for 2017 year-end accounting were updated as a result of the most recent actuarial valuation as at 31 March 2016. The mortality tables used at year-end 2017 were the S2NA tables based on year of birth, with a multiplicative adjustment factor to reflect the Group’s assessment of the average current mortality rates of the plan members relative to the tables. Amongst the UK population, there is a continuing trend for a generation to live longer than the preceding generation, and this has been reflected in the longevity assumption by adopting CMI core projections and also incorporating a minimum long-term rate of improvement in longevity of 1.75%/1.5% for males and females respectively. In comparison, the mortality tables used at year-end 2016 were the S1NA tables based on year of birth, with a minimum long-term rate of improvement in longevity of 1.5%/1.25% pa for males and females respectively.
BTG plc Annual Report and Accounts 2017
137Financials
Financials
BTG plc Annual Report and Accounts 2017
137Financials

18. Retirement benefit schemes continuedThe following table sets out related IAS 19 assumptions used:
31 March2017
31 March2016
31 March2015
Pension increases in deferment – RPI inflation 3.4% p.a. 3.0% p.a. 3.1% p.a.Pension increases in payment – RPI inflation 3.4% p.a. 3.0% p.a. 3.1% p.a.Pension increases in payment – inflation capped at 2.5% 2.1% p.a. 2.0% p.a. 2.1% p.a.General salary increases 3.4% p.a. 3.0% p.a. 3.1% p.a.
The amount included in the statement of financial position arising from the Group’s obligations in respect of the plan is as follows:
31 March2017
£m
31 March2016
£m
31 March2015
£m
Present value of defined benefit obligation (142.1) (119.0) (124.9)Fair value of scheme assets 159.3 138.3 138.1Net asset recognised in the statement of financial position 17.2 19.3 13.2
A net asset is presented in the statement of financial position within non-current assets.
The IAS 19 expense is made up of the current service cost, plan administrative expenses, interest cost on the defined benefit obligation and interest income on plan assets, all of which are shown in the change in defined benefit obligation and assets tables below. The expense has been included in ‘Selling, general and administrative expenses’.
The allocation of the plan’s assets is as follows:
31 March2017
31 March2016
31 March2015
Equity instruments 4% 10% 10%Diversified growth funds 6% 9% 11%Liability driven investment 23% 31% 29%Absolute return bonds 8% 19% 20%Illiquid inflation assets 16% 16% 15%Inflation linked bonds 0% 0% 0%Corporate bonds 0% 0% 0%Cash/net current assets 43% 15% 15%
There are no direct investments in the Group’s own shares or property occupied by any member of the Group.
At 31 March 2017, all asset classes are traded in active markets, with the exception of the illiquid inflation assets which are priced and traded on a monthly basis.
In setting the investment strategy the trustees considered the views of the Group, their assessment of the Group’s covenant supporting the actuarial risks faced by the plan, the risks and rewards of a number of possible asset allocation options, the suitability of a wide range of asset classes within each strategy across and within asset classes, and the need for appropriate diversification amongst different asset classes.
BTG plc Annual Report and Accounts 2017 BTG plc Annual Report and Accounts 2017
138Financials
BTG plc Annual Report and Accounts 2017 BTG plc Annual Report and Accounts 2017
138Financials
Notes to the consolidated financial statements
continued

Changes in the present value of the defined benefit obligation, the fair value of the plan assets and the net asset/(liability) over the year ended 31 March 2017 are as follows:
Year ended 31 March 2017Obligation
£mPlan assets
£m
Net asset/(liability)
£m
Beginning of the year (119.0) 138.3 19.3Employer’s part of the current service cost (0.4) – (0.4)Interest income/(cost) (4.0) 4.7 0.7Administrative costs – – –Contributions by the employer – 2.8 2.8Contributions from plan members (0.1) 0.1 –Actuarial gain – experience 0.2 18.5 18.7Actuarial loss – financial assumptions (24.5) – (24.5)Actuarial gain – demographic assumptions 0.6 – 0.6Benefits paid 5.1 (5.1) –End of the Year (142.1) 159.3 17.2
Changes in the present value of the defined benefit obligation, the fair value of the plan assets and the net asset/(liability) over the year ended 31 March 2016 are as follows:
Year ended 31 March 2016Obligation
£mPlan assets
£m
Net asset/(liability)
£m
Beginning of the year (124.9) 138.1 13.2Employer’s part of the current service cost (0.5) – (0.5)Interest income/(cost) (4.0) 4.4 0.4Administrative costs – – –Contributions by the employer – 2.9 2.9Contributions from plan members (0.1) 0.1 –Actuarial (loss)/gain – experience 1.2 (2.2) (1.0)Actuarial gain – financial assumptions 5.0 – 5.0Actuarial loss – demographic assumptions (0.7) – (0.7)Benefits paid 5.0 (5.0) –End of the Year (119.0) 138.3 19.3
The actual return on the plan’s assets over the year to 31 March 2017 was a gain of £23.2m (2016: gain of £2.2m).
The weighted average duration of the defined benefit obligation at the end of the reporting period is around 16 years (2016: 15 years).
The administrative costs shown above are nil as they are paid directly by the Group and are expensed separately outside IAS19.
The sensitivities regarding the principal assumptions used to measure the plan obligations are:
Increase in Obligation Increase in Plan Assets Increase in Net Liability
Change in assumption
31 March2017
£m
31 March2016
£m
31 March2017
£m
31 March2016
£m
31 March2017
£m
31 March2016
£m
Discount rate Decrease 0.1% 2.4 1.7 2.4 2.2 – (0.5)RPI inflation Increase 0.1% 2.1 1.5 2.0 1.9 0.1 (0.4)Life expectancy Increase 1 year 4.7 3.9 – – 4.7 3.9
The sensitivity information has been derived using projected cash flows valued using the relevant assumptions and membership profile as at 31 March 2017. The sensitivity methodology has not changed from prior years. Extrapolation of these results beyond the sensitivity figures shown may not be appropriate.
Defined contribution schemesThe Group offers defined contribution pension schemes for its employees. The total income statement charge in relation to these schemes was £6.7m (2016: £5.0m).
The Group’s defined contribution schemes are operated by external providers. The only obligation of the Group with respect to these schemes is to make the specified contributions.
BTG plc Annual Report and Accounts 2017
139Financials
Financials
BTG plc Annual Report and Accounts 2017
139Financials

19. Share based paymentsShare optionsThe Group makes awards under an equity-settled share option plan that entitles employees to purchase shares in the Company. In accordance with the rules of the plan, options are granted at the market price of the shares on the date of grant with a vesting period of generally three years. They may only be exercised upon the attainment of service, market and non-market criteria. If the performance criteria are not met by the date specified at the time of grant, the options do not vest and will lapse. If the options remain unexercised after a period of ten years from the date of grant, the options expire. Furthermore, options are forfeited if the employee leaves the Group before the options vest unless the conditions under which they leave are such that they are considered to be a “good leaver”. In this case their options remain exercisable for a limited period of time. For further details of current awards, see the Remuneration Report on pages 72 to 97.
Option pricingFor the purposes of valuing options to arrive at the share-based compensation charge, a Black-Scholes option pricing model has been used. The assumptions used in the model are as follows:
31 March2017
31 March2016
Risk-free interest rate 0.1% – 0.4% 0.7% – 1.4%Dividend yield Nil NilVolatility 28% – 30% 26% – 28%Expected lives of options and awards granted under:
— Share option plan 3 years 3 years — Sharesave plan 3.37 years 3.44 years — Stock purchase plan 2.12 years 2.13 years — Performance share plan 3-5 years 3-5 years — Deferred share bonus plan 3 years 3 years
Weighted average fair value for share option plan grants in the year 296.6p 353.2pWeighted average fair value for Sharesave grants in the year 215.0p 222.6pWeighted average fair value for stock purchase plan grants in the year 160.6p 158.4pWeighted average fair value for performance share awards in the year 550.6p 469.6pWeighted average fair value for deferred share bonus awards in the year 673.5p 681.5p
The expected volatility is based on the historic volatility (calculated based on the weighted average remaining life of the share options, restricted or performance shares), adjusted for any expected changes to future volatility due to publicly-available information.
Share options are granted under a service condition, a non-market condition and a market condition. Service and non-market conditions are not taken into account in calculating the fair value measurement of the services received.
Performance shares are awarded under a service condition, a non-market condition and a market condition. Service and non-market conditions are not taken into account in calculating the fair value measurement of the services received.
Awards of share options and performance share awards made in 2009 and later years have a market condition based on a Total Shareholder Return (“TSR”) measure using the FTSE 250 companies excluding investment trusts, companies in the financial services sector (banks, life & non-life insurance, equity & non-equity investment trusts, financial services, real estate investment & services and real estate investment trusts etc.) and companies in the consumer discretionary sector (general retailers, media, travel & leisure, and leisure goods). Earlier share options and performance shares used the FTSE SmallCap (excluding Investment Trusts) index. If the Company’s TSR at least matches the performance of the relevant index over the vesting period, the market-based performance condition will be considered to have been achieved. The fair value of an award of shares under the share option and performance share plans have been adjusted to take into account this market-based performance condition using a pricing model based on expectations about volatility and the correlation of TSR in the relevant index and which incorporates into the valuation the interdependency between TSR and index performance. This adjustment increases the fair value relative to the share price at the date of grant. See the Remuneration Report on pages 72 to 97 for further information.
BTG plc Annual Report and Accounts 2017 BTG plc Annual Report and Accounts 2017
140Financials
BTG plc Annual Report and Accounts 2017 BTG plc Annual Report and Accounts 2017
140Financials
Notes to the consolidated financial statements
continued

Details of options and awards under the Group’s share plans are shown in the tables below.
2017Number of
share options(000)
2017Weighted
average exerciseprice (p)
2016Number of
share options(000)
2016Weighted
average exerciseprice (p)
Share optionsOutstanding at 1 April 1,311 322.4 1,290 222.3Granted during year 55 665.3 145 688.5Lapsed during year (25) 644.3 (12) 495.0Exercised during year (18) 395.1 (112) 380.5Outstanding at 31 March 1,323 329.6 1,311 322.4Exercisable at 31 March 1,085 254.4 1,085 254.4Sharesave planOutstanding at 1 April 617 442.9 575 392.5Granted during year 193 520.5 221 504.4Lapsed during year (98) 491.8 (56) 439.5Exercised during year (166) 297.6 (123) 320.2Outstanding at 31 March 546 505.8 617 442.9Exercisable at 31 March 3 289.5 – –Stock purchase planOutstanding at 1 April 229 543.3 221 489.0Granted during year 174 573.3 93 567.0Lapsed during year (168) 538.1 (48) 503.8Exercised during year (14) 530.0 (37) 332.0Outstanding at 31 March 221 571.1 229 543.3Exercisable at 31 March – – – –
Options outstanding at 31 March 2017:
Number(000)
Weightedexercise price (p)
Latest exercise date
year ended 31 March
Share options granted in year ended 31 March2010 290 179.3 20202011 329 201.3 20212012 253 298.9 20222013 213 386.0 20232015 53 637.2 20182016 131 688.5 20192017 54 665.2 2020
1,323Sharesave plan options granted in year ended 31 March2014 3 289.5 20182015 207 498.7 20182016 173 504.4 20192017 163 520.5 2020
546Stock purchase plan options granted in year ended 31 March2016 55 567.0 20182017 166 573.3 2019
221
BTG plc Annual Report and Accounts 2017
141Financials
Financials
BTG plc Annual Report and Accounts 2017
141Financials

19. Share based payments continuedPerformance share awardsFollowing approval of the Performance Share Plan by shareholders at the 2006 AGM, the Company has made awards to the executive directors and other employees with a vesting period of three years. In 2013, amendments to the rules of the Plan and the terms of new performance conditions were approved at the AGM. These included the opportunity for Executive Directors only to voluntarily elect to carry-forward and put at risk for a further two years shares that would have vested under the core award after three years into a multiplier award.
A Senior Management Performance Share Plan was approved by the Board in 2012 in order to award shares to certain senior employees below board level. The shares will vest on the second anniversary of the grant date.
Movement in the number of performance share awards is as follows:
2017Number of
share awards(000)
2016Number of
share awards(000)
Performance share awardsOutstanding at 1 April 5,639 5,146Granted during year 1,560 1,711Lapsed during year (502) (307)Exercised during year (1,937) (911)Outstanding at 31 March 4,760 5,639Exercisable at 31 March – –Senior Management Performance Share PlanOutstanding at 1 April 112 –Granted during year 51 112Lapsed during year – –Exercised during year – –Outstanding at 31 March 163 112Exercisable at 31 March – –
Deferred share bonus planThe Company established a deferred share bonus plan. The executive directors, members of the leadership team and certain other senior staff have part of their bonus awarded in shares. The shares will vest on the third anniversary of the grant date.
Movement in the number of deferred bonus shares awarded is as follows:
2017Number of
share awards(000)
2016Number of
share awards(000)
Outstanding at 1 April 259 436Granted during year 37 48Lapsed during year – (7)Exercised during year (172) (218)Outstanding at 31 March 124 259Exercisable at 31 March – –
For the performance share awards and the deferred share bonus plan awards are forfeited if the director or other employee leaves the Group before the awards vest, unless the conditions under which they leave are such that they are considered to be a “good leaver”; in which case their award is released following their departure. If the Remuneration Committee decide that a departing beneficiary of an award is a “good leaver”, so their award may be released early, the award will only be released subject to the achievement of the performance conditions set out at the time of the granting of the award and may be subject to proration for time, at the discretion of the Committee. For further details see the Remuneration Report on pages 72 to 97.
BTG plc Annual Report and Accounts 2017 BTG plc Annual Report and Accounts 2017
142Financials
BTG plc Annual Report and Accounts 2017 BTG plc Annual Report and Accounts 2017
142Financials
Notes to the consolidated financial statements
continued

20. Contingent liabilitiesBTG is in a current dispute with Wellstat over the commercialisation of Vistogard. Wellstat are seeking damages and to terminate the commercialisation agreement under which BTG obtained rights to sell Vistogard in US. A trial has been heard in the Court of Chancery of the State of Delaware but no judgement has yet been issued. The Group estimate the likelihood of material financial loss or loss of rights to the asset to be possible, not probable, and therefore no liability has been recognised. It is currently not possible to make a reliable estimate of any amount that may be required to be paid in respect of the dispute.
21. Financial risk management objectives and policiesOverviewThe Group has exposure to credit, liquidity and market risks from its use of financial instruments. This note sets out the Group’s key policies and processes for managing these risks.
Credit riskCredit risk is the risk of financial loss to the Group if a licensee fails to meet its contractual obligations or a customer fails to pay for goods received. The Group’s primary objective with respect to credit risk is to minimise the risk of default by licensees or customers.
A substantial element of the Group’s revenue is derived from royalties which are only payable if a licensee is generating income from sales of licensed products. In such instances the Group’s exposure to credit risk is considered to be inherently relatively low, although is influenced by the unique characteristics of individual licensees. The Group’s policy is to provide against bad and doubtful debts on a specific licence by licence basis.
Product revenues are generated from direct sales as well as sales to several key wholesalers and distributors. Management maintains regular communication with the customers and monitors both sales to and payments from customers to minimise the credit risk exposure.
Liquidity riskLiquidity risk is the risk that the Group will not be able to meet its financial obligations as they fall due. The Group’s approach to managing liquidity is to ensure, as far as possible, that it will always have sufficient liquidity to meet its liabilities as they fall due, under both normal and stressed conditions, without incurring unacceptable losses or risking damage to the Group’s reputation.
The Group has substantial cash balances to fund its operations. The Group has a £100m multi-currency revolving credit facility (‘RCF’) with an option to extend this RCF by a further £100m. The RCF has a three-year term, which expires in November 2018, with an option to extend for a further year. The £100m revolving credit facility has not been utilised in either the current or prior period.
The Group’s policy is to place surplus cash resources on short and medium term fixed interest deposits, to the extent that cash flow can be reasonably predicted. Term deposits are denominated in either US dollars or sterling with institutions rated as A or higher by both Moody’s and Standard & Poor’s.
BTG plc Annual Report and Accounts 2017
143Financials
Financials
BTG plc Annual Report and Accounts 2017
143Financials

21. Financial risk management objectives and policies continuedMarket riskMarket risk is the risk that changes in market prices, such as foreign exchange rates, interest rates and equity prices will affect the Group’s income or the value of its holdings in financial instruments. The Group has little exposure to interest rate risk other than that returns on short-term fixed interest deposits will vary with movements in underlying bank interest rates. The Group’s principal market risk exposure is to movements in foreign exchange rates.
Foreign currency riskThe Group’s principal foreign currency exposure is to USD, as the Group has significant USD denominated revenues and operating costs (although a significant proportion of the Group’s operating costs remain denominated in sterling). The Group is also exposed, albeit to a lesser extent, to the Euro, Canadian dollars and Australian dollars. As a result the Group’s sterling income statement, balance sheet and cash flows may be affected by movements in sterling exchange rates with these currencies.
The Group’s primary objective with respect to managing foreign exchange risk is to provide an appropriate level of certainty over the value of future cash flows. Where possible, anticipated foreign currency operating expenses are matched to foreign currency revenues. The Group economically hedges sufficient USD to cover anticipated GBP net operating cash outflows.
Sensitivity analysisA 5% weakening of the US$ would have resulted in the following decrease in profit before tax:
31 March2017
£m
31 March2016
£m
Decrease in profit before tax 4.4 5.4
Interest rate riskThe Group does not consider the impact of interest rate risk to be material to its results or operations and accordingly no sensitivity analysis is shown.
Market price riskIt is, on occasion, deemed appropriate to take equity stakes in early-stage companies utilising the Group’s technology as part of the overall licensing arrangement and small loans may be granted to these companies to further technology development. These investments will be realised at an appropriate time in the development cycle. These investments form part of the Group’s overall technology portfolio and do not materially affect liquidity.
Capital managementThe Group defines the capital that it manages as the Group’s total equity. The Group’s objectives when managing capital are:
— To safeguard the Group’s ability to continue as a going concern;
— To provide an adequate return to investors based on the level of risk undertaken;
— To have available the necessary financial resources to allow the Group to invest in areas that may deliver future benefits for inventive sources and returns to investors; and
— To maintain sufficient financial resources to mitigate against risks and unforeseen events.
BTG plc Annual Report and Accounts 2017 BTG plc Annual Report and Accounts 2017
144Financials
BTG plc Annual Report and Accounts 2017 BTG plc Annual Report and Accounts 2017
144Financials
Notes to the consolidated financial statements
continued

The Group believes it has sufficient ongoing cash and cash equivalents to meet its stated capital management objectives. The Group’s capital and equity ratio are shown in the table below.
31 March2017
£m
31 March2016
£m
Total equity – capital and reserves attributable to BTG shareholders 979.9 847.7Total assets 1,311.1 1,148.8Equity ratio 74.7% 73.8%
The Group is not subject to regulatory capital adequacy requirements as known in the financial services industry.
Financial instrumentsThe Group’s financial instruments comprise cash, short- and medium-term deposits, foreign currency forward contracts, contingent consideration liabilities and various items such as trade debtors and creditors which arise directly from operations.
Fair valuesThe fair values of the Group’s financial assets and liabilities, together with the carrying values shown in the statement of financial position, are as follows:
Designated at fair value
£m
Forward contracts
at fair value£m
Amortised Cost
£m
Total carrying
value£m
Fair value1
£m
31 March 2017Cash and cash equivalents – – 155.5 155.5 –Forward contracts – (7.8) – (7.8) –Other investments 1.7 – – 1.7 1.7Trade and other receivables – – 125.7 125.7 –Trade and other payables (excluding contingent consideration liabilities and provisions) – – (125.8) (125.8) –Contingent consideration liabilities (32.1) – – (32.1) (32.1)31 March 2016Cash and cash equivalents – – 140.4 140.4 –Forward contracts – 0.3 – 0.3 –Other investments 1.4 – – 1.4 1.4Trade and other receivables – – 106.5 106.5 –Trade and other payables (excluding contingent consideration liabilities and provisions) – – (115.1) (115.1) –Contingent consideration liabilities (27.2) – – (27.2) (27.2)
1. The Group has not disclosed the fair values for financial instruments such as trade receivables and trade payables because their carrying amounts are a reasonable approximation of their fair value.
The following table provides an analysis of financial instruments that are measured subsequent to initial recognition at fair value, grouped into Levels 1 to 3 based on the degree to which the fair value is observable:
Level 1 – quoted prices in active markets for identical assets and liabilities
Level 2 – observable inputs other than quoted prices in active markets for identical assets and liabilities
Level 3 – unobservable inputs
BTG plc Annual Report and Accounts 2017
145Financials
Financials
BTG plc Annual Report and Accounts 2017
145Financials
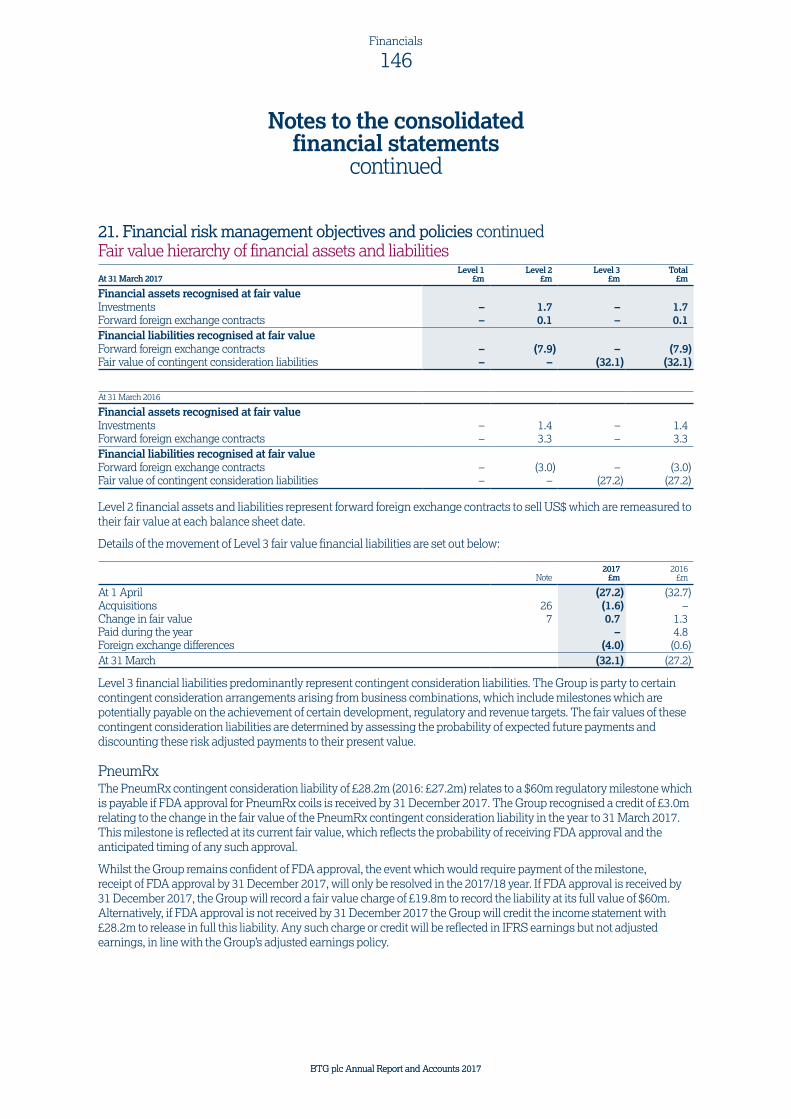
21. Financial risk management objectives and policies continuedFair value hierarchy of financial assets and liabilitiesAt 31 March 2017
Level 1£m
Level 2£m
Level 3£m
Total£m
Financial assets recognised at fair valueInvestments – 1.7 – 1.7Forward foreign exchange contracts – 0.1 – 0.1Financial liabilities recognised at fair valueForward foreign exchange contracts – (7.9) – (7.9)Fair value of contingent consideration liabilities – – (32.1) (32.1)
At 31 March 2016
Financial assets recognised at fair valueInvestments – 1.4 – 1.4Forward foreign exchange contracts – 3.3 – 3.3Financial liabilities recognised at fair valueForward foreign exchange contracts – (3.0) – (3.0)Fair value of contingent consideration liabilities – – (27.2) (27.2)
Level 2 financial assets and liabilities represent forward foreign exchange contracts to sell US$ which are remeasured to their fair value at each balance sheet date.
Details of the movement of Level 3 fair value financial liabilities are set out below:
Note2017
£m2016
£m
At 1 April (27.2) (32.7)Acquisitions 26 (1.6) –Change in fair value 7 0.7 1.3Paid during the year – 4.8Foreign exchange differences (4.0) (0.6)At 31 March (32.1) (27.2)
Level 3 financial liabilities predominantly represent contingent consideration liabilities. The Group is party to certain contingent consideration arrangements arising from business combinations, which include milestones which are potentially payable on the achievement of certain development, regulatory and revenue targets. The fair values of these contingent consideration liabilities are determined by assessing the probability of expected future payments and discounting these risk adjusted payments to their present value.
PneumRxThe PneumRx contingent consideration liability of £28.2m (2016: £27.2m) relates to a $60m regulatory milestone which is payable if FDA approval for PneumRx coils is received by 31 December 2017. The Group recognised a credit of £3.0m relating to the change in the fair value of the PneumRx contingent consideration liability in the year to 31 March 2017. This milestone is reflected at its current fair value, which reflects the probability of receiving FDA approval and the anticipated timing of any such approval.
Whilst the Group remains confident of FDA approval, the event which would require payment of the milestone, receipt of FDA approval by 31 December 2017, will only be resolved in the 2017/18 year. If FDA approval is received by 31 December 2017, the Group will record a fair value charge of £19.8m to record the liability at its full value of $60m. Alternatively, if FDA approval is not received by 31 December 2017 the Group will credit the income statement with £28.2m to release in full this liability. Any such charge or credit will be reflected in IFRS earnings but not adjusted earnings, in line with the Group’s adjusted earnings policy.
BTG plc Annual Report and Accounts 2017 BTG plc Annual Report and Accounts 2017
146Financials
BTG plc Annual Report and Accounts 2017 BTG plc Annual Report and Accounts 2017
146Financials
Notes to the consolidated financial statements
continued

Galil MedicalThe Galil contingent consideration liability of £3.9m (2016: £nil) relates to two regulatory milestones. The Group recognised a charge of £2.3m relating to the fair value of the Galil contingent consideration liability in the year to 31 March 2017.
The first regulatory milestone of $10m is payable to former shareholders of Galil Medical if FDA approval for lung metastases is received by 31 December 2018. This milestone is reflected at its current fair value, which reflects the probability of receiving FDA approval and the anticipated timing of any such approval.
The second regulatory milestone of $5m is payable to former shareholders of Galil Medical if FDA approval for bone metastases is received by 31 December 2018. This milestone is reflected at its current fair value, which reflects the probability of receiving FDA approval and the anticipated timing of any such approval.
Contractual maturity analysis of financial assets/(liabilities)
Forward foreign exchange contracts that mature within:
31 March 2017
£m
31 March 2016
£m
0-3 months (3.5) (0.9)3-6 months (1.6) (1.1)6-12 months (2.7) 1.3>12 months – 1.0Total (7.8) 0.3
Net gains and losses on financial assets and liabilitiesForeign exchange gains of £4.3m (2016: gains of £4.4m) were recognised within operating profit.
The Group recognised a loss of £25.2m relating to forward foreign exchange contracts with financial expense in the year to 31 March 2017. This loss compromises realised FX losses of £17.1m and unrealised losses of £8.1m.
For the year to 31 March 2016, the Group recognised a gain of £1.2m relating to fair value movements on outstanding forward contracts within Financial Income. See note 7 for further details.
Estimation of fair valuesThe following summarises the methods and assumptions used in estimating the fair values of financial instruments reflected in the table.
Trade receivables, trade payables and cash and cash equivalentsTrade payables and receivables have a remaining life of less than one year, such that carrying value is considered to be a reasonable approximation of fair value.
Contingent consideration liabilitiesContingent consideration liabilities are re-measured to fair value at each reporting period, to reflect changes in assumptions underlying the fair value of these liabilities, which includes the probability of technical success, any timing risk to achieving the relevant milestones and the appropriate discount rate.
BTG plc Annual Report and Accounts 2017
147Financials
Financials
BTG plc Annual Report and Accounts 2017
147Financials
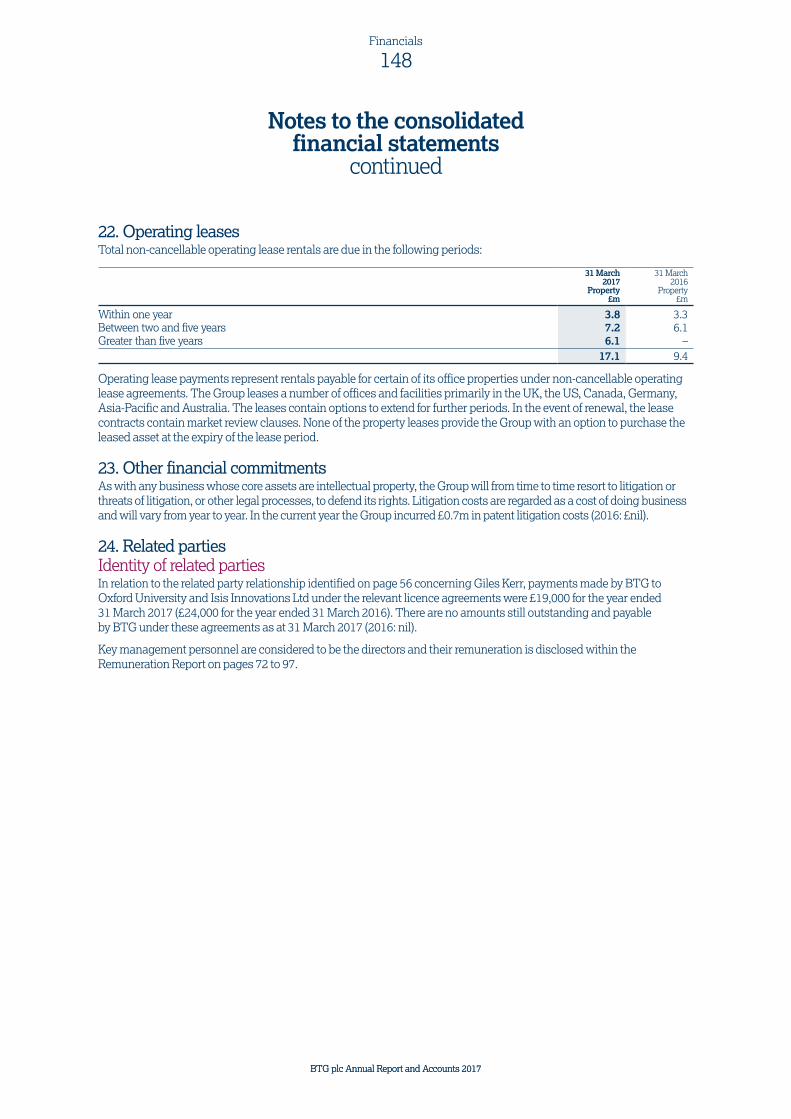
22. Operating leasesTotal non-cancellable operating lease rentals are due in the following periods:
31 March2017
Property£m
31 March2016
Property£m
Within one year 3.8 3.3Between two and five years 7.2 6.1Greater than five years 6.1 –
17.1 9.4
Operating lease payments represent rentals payable for certain of its office properties under non-cancellable operating lease agreements. The Group leases a number of offices and facilities primarily in the UK, the US, Canada, Germany, Asia-Pacific and Australia. The leases contain options to extend for further periods. In the event of renewal, the lease contracts contain market review clauses. None of the property leases provide the Group with an option to purchase the leased asset at the expiry of the lease period.
23. Other financial commitmentsAs with any business whose core assets are intellectual property, the Group will from time to time resort to litigation or threats of litigation, or other legal processes, to defend its rights. Litigation costs are regarded as a cost of doing business and will vary from year to year. In the current year the Group incurred £0.7m in patent litigation costs (2016: £nil).
24. Related partiesIdentity of related partiesIn relation to the related party relationship identified on page 56 concerning Giles Kerr, payments made by BTG to Oxford University and Isis Innovations Ltd under the relevant licence agreements were £19,000 for the year ended 31 March 2017 (£24,000 for the year ended 31 March 2016). There are no amounts still outstanding and payable by BTG under these agreements as at 31 March 2017 (2016: nil).
Key management personnel are considered to be the directors and their remuneration is disclosed within the Remuneration Report on pages 72 to 97.
BTG plc Annual Report and Accounts 2017 BTG plc Annual Report and Accounts 2017
148Financials
BTG plc Annual Report and Accounts 2017 BTG plc Annual Report and Accounts 2017
148Financials
Notes to the consolidated financial statements
continued

25. Group entitiesThe subsidiary undertakings of BTG plc at 31 March 2017 are all wholly owned, incorporated in the United Kingdom and registered in England and Wales, unless shown otherwise. All subsidiary undertakings operate in their country of incorporation and are consolidated in the Group’s financial statements.
Registered Office Class of capital Principal activity
BTG International (Holdings) Ltd*
5 Fleet Place, London EC4M 7RD Ordinary Investment in IPR management companies
Provensis Ltd* 5 Fleet Place, London EC4M 7RD Ordinary Development and commercialisation of IPR
BTG International Ltd 5 Fleet Place, London EC4M 7RD Ordinary Development, management and commercialisation of IPR
BTG Management Services Ltd
5 Fleet Place, London EC4M 7RD Ordinary Investment and management of group companies
Protherics Medicines Development Limited
5 Fleet Place, London EC4M 7RD Ordinary Development, management and commercialisation of IPR
BTG International Inc. Delaware, USA
Five Tower Bridge, 300 Barr Harbor Drive, Suite 800, West Conshohocken, PA 19428, United States
Common stock Research, development and sale of pharmaceutical products
Protherics UK Limited Blaenwaun Ffostrasol, Llandysul, Ceredigion, Wales SA44 5JT
Ordinary Research, development, manufacture and sale of pharmaceutical products
BTG Australasia Pty Limited Australia
Turretfield Research Centre, 129 Holland Road, Rosedale SA 5350, Australia
Ordinary Manufacture and sale of pharmaceutical products
Protherics Utah Inc.Tennessee USA
615 Arapeen drive, Suite 105, Salt Lake City, UT 84108, United States
Common stock The research, development, manufacture and sale of pharmaceutical products
Biocompatibles International Limited*
Chapman House, Farnham Business Park, Weydon Lane, Farnham, Surrey GU9 8QL
Ordinary Investment and management of group companies
Biocompatibles UK Limited
Chapman House, Farnham Business Park, Weydon Lane, Farnham, Surrey GU9 8QL
Ordinary Development, management and commercialisation of IPR
Biocompatibles Inc. Delaware USA
Five Tower Bridge, 300 Barr Harbor Drive, Suite 800, West Conshohocken, PA 19428, United States
Common stock Distribution of Bead products, TheraSphere® and Varithena®
BTG International Germany GmbH Germany
Industriestrasse 19,63755, Alzenau, Germany No par value shares Research and development
BTG International Canada Inc. Canada
11 Hines Road, Suite 200, Ottawa ON K2K 2X1, Canada Common shares Support of Interventional Medicine business
BTG International Asia LtdHong Kong, China
21st Floor, Edinburgh Tower, the Landmark, 15 Queen’s Road Central, Hong Kong
Ordinary Sales support for the interventional medicine business
EKOS CorporationDelaware USA
11911 N. Creek Parkway S., Bothell WA 98011, United States
Common stock Manufacture and commercialisation of therapeutic ultrasound devices
PneumRx Inc.Delaware USA
4255 Burton Drive, Santa Clara, CA 95054, United States
Common stock Development, manufacture and commercialisation of the RePneu® Coil System
PneumRx GmbHGermany
Prinzenallee 19, 40549, Dusseldorf, Germany No par value shares Commercialisation and sale of the RePneu® Coil System
BTG International Healthcare Ltd
5 Fleet Place, London EC4M 7RD Ordinary Group financing
BTG International Healthcare Inc. Delaware USA
Five Tower Bridge, 300 Barr Harbor Drive, Suite 800, West Conshohocken, PA 19428, United States
Common stock Group financing
BTG International Healthcare LLCDelaware USA
Five Tower Bridge, 300 Barr Harbor Drive, Suite 800, West Conshohocken, PA 19428, United States
Ordinary Group financing
IO2 Limited 5 Fleet Place, London EC4M 7RD Ordinary Dormant company
BTG IM Holdings Limited Tavor Building 1, Yokneam Illit Industrial Park, PO Box 224, Yokneam, 2069203, Israel
Ordinary Investment in Galil companies
Galil Medical Inc.Delaware USA
4364 Round Lake Road, Arden Hills MN 55112, United States
Common Stock Manufacture, commercialisation and sale of the Galil System
Galil Medical Limited Tavor Building 1, Yokneam Illit Industrial Park, PO Box 224, Yokneam, 2069203, Israel
OrdinarySeries A-1 Preferred SharesSeries A-2 Preferred SharesSeries B Preferred Shares
Manufacture, Commercialisation and sale of the Galil System
Galil Medical UK Limited 5 Fleet Place, London EC4M 7RD Ordinary Distribution of the Galil System
*Indicates direct subsidiary of BTG plc.
BTG plc Annual Report and Accounts 2017
149Financials
Financials
BTG plc Annual Report and Accounts 2017
149Financials

26. Business CombinationsAcquisitions during the year ended 31 March 2017a) Galil acquisitionOn 15 June 2016 BTG completed the acquisition of 100% of Galil Medical for an aggregate consideration of $84.5m, subject to adjustment for cash and debt assumed at acquisition. Contingent consideration of up to $25.5m may also be payable in future periods based upon the achievement of regulatory and sales based milestones.
The total equity consideration for the acquisition of Galil Medical was £39.1m ($55.1m), representing up-front cash consideration of £37.5m ($52.9m) and the fair value of contingent consideration of £1.6m ($2.2m). The remainder of the aggregate consideration has been used to settle debt and other obligations assumed on acquisition.
Galil Medical’s results of operations have been consolidated from 15 June 2016, and the fair value of acquired assets and liabilities has been determined as of that date. The final determination of these fair values will be completed as soon as possible but no later than one year from the acquisition date.
In the US, Galil Medical’s products are indicated for the treatment and palliative care of kidney and other cancers, in addition to a number of other uses, including in urology. Galil Medical is also conducting two clinical studies that could lead to US regulatory clearance for use in lung metastases and bone metastases. The acquisition complements BTG’s Interventional Medicine platform, building on the Group’s Interventional Oncology business area.
Intangible assets of £47.7m relate to developed cryoablation technology. An estimated useful life of 15 years has been assigned to this developed technology, and associated amortisation expense will be recorded on a straight-line basis. Goodwill arising of £16.4m, which is not deductible for tax purposes, has been assigned to the Interventional Medicine operating segment. Goodwill represents future developments to the cryoablation technology and the value of Galil’s workforce which have not been reflected as separate intangible assets, together with the recognition for accounting purposes of a deferred tax liability of £17.0m relating to recognised developed technology.
BTG plc Annual Report and Accounts 2017 BTG plc Annual Report and Accounts 2017
150Financials
BTG plc Annual Report and Accounts 2017 BTG plc Annual Report and Accounts 2017
150Financials
Notes to the consolidated financial statements
continued

Book Value£m
Fair ValueAdjustment
£mFair Value
£m
ASSETSNon-current assetsIntangible assets 0.4 47.3 47.7Goodwill – 16.4 16.4Property, plant and equipment 0.4 0.6 1.0Current assetsInventories 2.6 0.8 3.4Trade and other receivables 3.7 – 3.7Cash and cash equivalents 1.3 – 1.3
LIABILITIESNon-current liabilitiesNet deferred tax liabilities – (6.1) (6.1)Current liabilitiesTrade and other payables (9.4) – (9.4)Debt obligations (18.9) – (18.9)Book value and fair value of assets and liabilities acquired (19.9) 59.0 39.1Cash consideration 37.5Fair value of contingent consideration 1.6Total equity consideration 39.1
During the period ended 31 March 2017, Galil Medical contributed revenues of £17.2m and an operating loss (including intangible asset amortisation of £2.9m) of £2.3m in the period since acquisition. If the acquisition had taken place on 1 April 2016, the Group’s revenue and profit before tax would have been £573.5m and £30.2m, respectively.
BTG plc Annual Report and Accounts 2017
151Financials
Financials
BTG plc Annual Report and Accounts 2017
151Financials
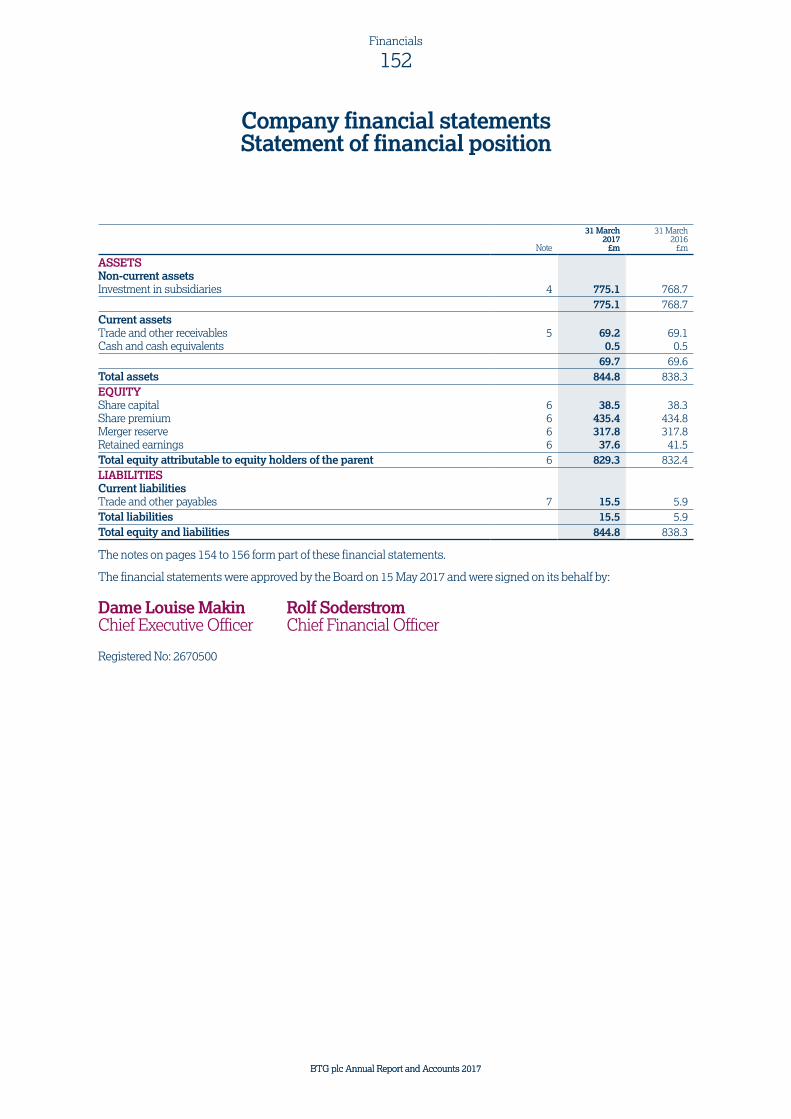
Note
31 March 2017
£m
31 March 2016
£m
ASSETSNon-current assetsInvestment in subsidiaries 4 775.1 768.7
775.1 768.7Current assetsTrade and other receivables 5 69.2 69.1Cash and cash equivalents 0.5 0.5
69.7 69.6Total assets 844.8 838.3EQUITYShare capital 6 38.5 38.3Share premium 6 435.4 434.8Merger reserve 6 317.8 317.8Retained earnings 6 37.6 41.5Total equity attributable to equity holders of the parent 6 829.3 832.4LIABILITIESCurrent liabilitiesTrade and other payables 7 15.5 5.9Total liabilities 15.5 5.9Total equity and liabilities 844.8 838.3
The notes on pages 154 to 156 form part of these financial statements.
The financial statements were approved by the Board on 15 May 2017 and were signed on its behalf by:
Dame Louise Makin Rolf SoderstromChief Executive Officer Chief Financial Officer
Registered No: 2670500
BTG plc Annual Report and Accounts 2017 BTG plc Annual Report and Accounts 2017
152Financials
BTG plc Annual Report and Accounts 2017 BTG plc Annual Report and Accounts 2017
152Financials
Company financial statements Statement of financial position

Note
31 March 2017
£m
31 March 2016
£m
Loss after tax for the year 2 (11.1) (8.6)(Increase)/decrease and other receivables 5 (0.1) 1.4Increase in trade and other payables 7 9.6 3.7Other 0.8 2.4Net cash outflow from operating activities (0.8) (1.1)Investing activitiesIncrease of investment in subsidiary companies – –Net cash outflow from investing activities – –Cash flows from financing activitiesProceeds of share issue 6 0.8 1.1Net cash inflow from financing activities 0.8 1.1Increase in cash and cash equivalents – –Cash and cash equivalents at start of year 0.5 0.5Cash and cash equivalents at end of year 0.5 0.5
Share capital
£m
Share premium
£m
Merger reserve
£m
Retained earnings
£m
Total equity
£m
At 1 April 2016 38.3 434.8 317.8 41.5 832.4
Loss for the year – – – (11.1) (11.1) Other comprehensive income – – – – –Total comprehensive loss for the year – – – (11.1) (11.1)
Transactions with owners:Issue of BTG plc ordinary shares 0.2 0.6 – – 0.8Movement in shares held by and gifted to the Employee Share Ownership Trust – – – (1.3) (1.3)Share-based payments – – – 8.5 8.5At 31 March 2017 38.5 435.4 317.8 37.6 829.3
Share capital
£m
Share premium
£m
Merger reserve
£m
Retained earnings
£m
Total equity
£m
At 1 April 2015 38.2 433.8 317.8 43.5 833.3
Loss for the year – – – (8.6) (8.6) Other comprehensive income – – – – –Total comprehensive loss for the year – – – (8.6) (8.6)
Transactions with owners:Issue of BTG plc ordinary shares 0.1 1.0 – – 1.1Movement in shares held by and gifted to the Employee Share Ownership Trust – – – (0.1) (0.1)Share-based payments – – – 6.7 6.7At 31 March 2016 38.3 434.8 317.8 41.5 832.4
The notes on pages 154 to 156 form part of these financial statements.
BTG plc Annual Report and Accounts 2017
153Financials
Financials
BTG plc Annual Report and Accounts 2017
153Financials
Statement of cash flowsfor the year ended 31 March 2017
Statement of changes in equity
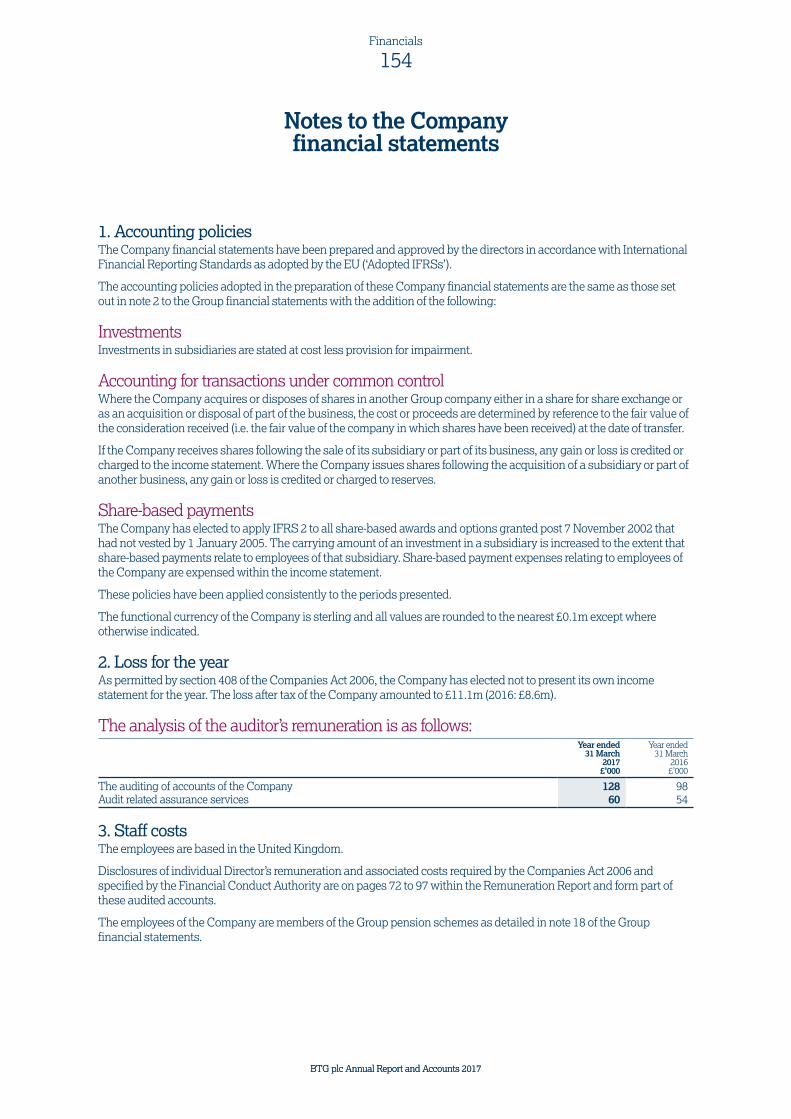
1. Accounting policiesThe Company financial statements have been prepared and approved by the directors in accordance with International Financial Reporting Standards as adopted by the EU (‘Adopted IFRSs’).
The accounting policies adopted in the preparation of these Company financial statements are the same as those set out in note 2 to the Group financial statements with the addition of the following:
InvestmentsInvestments in subsidiaries are stated at cost less provision for impairment.
Accounting for transactions under common controlWhere the Company acquires or disposes of shares in another Group company either in a share for share exchange or as an acquisition or disposal of part of the business, the cost or proceeds are determined by reference to the fair value of the consideration received (i.e. the fair value of the company in which shares have been received) at the date of transfer.
If the Company receives shares following the sale of its subsidiary or part of its business, any gain or loss is credited or charged to the income statement. Where the Company issues shares following the acquisition of a subsidiary or part of another business, any gain or loss is credited or charged to reserves.
Share-based paymentsThe Company has elected to apply IFRS 2 to all share-based awards and options granted post 7 November 2002 that had not vested by 1 January 2005. The carrying amount of an investment in a subsidiary is increased to the extent that share-based payments relate to employees of that subsidiary. Share-based payment expenses relating to employees of the Company are expensed within the income statement.
These policies have been applied consistently to the periods presented.
The functional currency of the Company is sterling and all values are rounded to the nearest £0.1m except where otherwise indicated.
2. Loss for the yearAs permitted by section 408 of the Companies Act 2006, the Company has elected not to present its own income statement for the year. The loss after tax of the Company amounted to £11.1m (2016: £8.6m).
The analysis of the auditor’s remuneration is as follows:Year ended
31 March2017
£’000
Year ended 31 March
2016£’000
The auditing of accounts of the Company 128 98Audit related assurance services 60 54
3. Staff costsThe employees are based in the United Kingdom.
Disclosures of individual Director’s remuneration and associated costs required by the Companies Act 2006 and specified by the Financial Conduct Authority are on pages 72 to 97 within the Remuneration Report and form part of these audited accounts.
The employees of the Company are members of the Group pension schemes as detailed in note 18 of the Group financial statements.
BTG plc Annual Report and Accounts 2017 BTG plc Annual Report and Accounts 2017
154Financials
BTG plc Annual Report and Accounts 2017 BTG plc Annual Report and Accounts 2017
154Financials
Notes to the Company financial statements

4. Investment in subsidiary undertakings£m
CostAt 1 April 2015 764.6Increase of investments in subsidiary companies –Share based payments 4.1At 1 April 2016 768.7Increase of investments in subsidiary companies –Share based payments 6.4At 31 March 2017 775.1
A list of the Company’s principal subsidiary undertakings is shown in note 30 to the Group financial statements.
5. Trade and other receivables31 March
2017£m
31 March2016
£m
Due within one yearPrepayments 0.6 0.7Amounts owed by subsidiary undertakings 68.6 68.4
69.2 69.1
6. Capital and reservesDetails of Company share capital are disclosed in note 15 to the Group financial statements. Details of share options granted by the Company are set out in note 19 to the Group financial statements. Details of shares in the Company held by subsidiaries are shown in note 25 to the Group financial statements.
7. Trade and other payables31 March
2017£m
31 March2016
£m
Due within one yearAccruals and deferred income 3.9 2.7Amounts owed to subsidiary undertakings 11.6 3.2
15.5 5.9
The directors consider the fair value of trade and other payables to be equal to their book value.
8. Financial assets and liabilitiesAmortised
cost£m
Total carrying
value£m
31 March 2016Cash and cash equivalents 0.5 0.5Trade and other receivables 69.1 69.1Trade and other payables (5.9) (5.9)31 March 2017Cash and cash equivalents 0.5 0.5Trade and other receivables 69.2 69.2Trade and other payables (15.5) (15.5)
The Company considers that the carrying amounts of cash and cash equivalents, trade and other receivables and trade and other payables are a reasonable approximation of their fair value.
BTG plc Annual Report and Accounts 2017
155Financials
Financials
BTG plc Annual Report and Accounts 2017
155Financials

Credit riskThe Company’s credit risk relates to the risk that one of its subsidiaries is unable to repay intercompany amounts owing. The recoverability of the Company’s intercompany receivable is considered at each balance sheet date.
Liquidity riskLiquidity risk is the risk that the Company will not be able to meet its financial obligations as they fall due. The Company does not hold significant cash balances as cash is managed centrally within its subsidiaries. Accordingly the Company is funded by its subsidiaries as its liabilities fall due. In November 2015, the Group signed a £100m multi-currency revolving credit facility providing access to funds for a period of three years to November 2018 with a with the option to extend for a further year. The £100m revolving credit facility has not been utilised in the current or prior period.
Market riskMarket risk is the risk that changes in market prices, such as foreign exchange rates, interest rates and equity prices will affect the Group’s income or the value of its holdings in financial instruments. As the holding company of the BTG Group, the Company does not have significant exposure to movements in market prices and accordingly no additional disclosure is provided. There are no foreign currency balances within the Company’s statement of financial position.
Capital ManagementDetails of the Company’s objectives with respect to managing capital are disclosed in note 21 to the Group financial statements.
9. Guarantees and contingent liabilitiesThe Company has entered into an agreement to guarantee payments under the lease of its US subsidiary undertaking.
The Company has provided a Guarantee to certain subsidiary undertakings in respect of the BTG Pension Fund up to a maximum amount equal to the lowest non-negative amount which, when added to the assets of the Fund, would result in the Fund being at least 105% funded on the date on which any liability arose, calculated on the basis set out in section 179 of the Pensions Act 2004, were a valuation to be conducted as at that date. The Company has additionally guaranteed the payment obligations of BTG International Limited in respect of its obligations in relation to the fund, up to a maximum amount of £12m.
10. Related party transactionsThe Company has a related-party relationship with its subsidiary undertakings and its directors.
In relation to the related party relationship identified on page 56 concerning Giles Kerr, payments made by BTG to Oxford University and Isis Innovations Ltd under the relevant licence agreements were £19,000 for the year ended 31 March 2017 (£24,000 during the year ended 31 March 2016). There are no amounts still outstanding and payable by BTG under these agreements as at 31 March 2017 (2017: nil).
Key management personnel are considered to be the directors and their remuneration is disclosed within the Remuneration Report on pages 72 to 97.
11. PensionsCertain employees of the Company participate in the Group’s defined benefit plan. Further information on the defined benefit plan can be found in Note 18 of the Group financial statements.
BTG plc Annual Report and Accounts 2017 BTG plc Annual Report and Accounts 2017
156Financials
BTG plc Annual Report and Accounts 2017 BTG plc Annual Report and Accounts 2017
156Financials
Notes to the Company financial statements
continued

Consolidated income statement20171
£m2016
£m20152
£m20143
£m2013
£m
Revenue 570.5 447.5 367.8 290.5 233.7Cost of sales (179.9) (140.8) (114.7) (95.0) (67.2)Gross profit 390.6 306.7 253.1 195.5 166.5
Selling, general and administrative expenses (206.6) (141.4) (124.8) (84.0) (58.0)Research and development (87.8) (77.2) (68.3) (47.2) (41.2)Other operating income 4.4 3.4 7.0 (3.9) 1.7Amortisation of acquired intangible assets (42.0) (35.0) (28.4) (23.3) (43.4)Acquisition and reorganisation costs (1.1) – (3.7) (9.8) 0.1Operating profit 57.5 56.5 34.9 27.3 25.7Financial income 3.3 4.4 0.1 8.2 1.1Financial expense (29.2) (3.4) (8.3) (2.2) (2.7)Profit before tax 31.6 57.5 26.7 33.3 24.1Tax credit/(charge) 2.0 3.0 6.9 (9.0) (7.7)Profit after tax for the year 33.6 60.5 33.6 24.3 16.4Earnings per share Basic 8.7p 15.8p 9.1p 6.8p 5.0p Diluted 8.6p 15.6p 9.0p 6.7p 5.0p
1. The results for the year ended 31 March 2017 include the results of Galil Medical from the date of acquisition, being 15 June 2016.2. The results for the year ended 31 March 2015 include the results of PneumRx, Inc. from the date of acquisition, being 7 January 2015.3. The results for the year ended 31 March 2014 include the results of EKOS Corporation and the Targeted Therapies Division of Nordion
Inc. from the date of acquisition, being 5 July 2013 and 13 July 2013 respectively.
BTG plc Annual Report and Accounts 2017
157Financials
Financials
BTG plc Annual Report and Accounts 2017
157Financials
Five-year financial recordFor the year ended 31 March

Consolidated statement of financial position20171
£m2016
£m20152
£m20143
£m2013
£m
Goodwill 225.6 187.9 183.8 123.6 59.2Intangible assets 678.9 599.2 597.9 397.9 209.2Property, plant and equipment 40.1 35.7 35.5 31.3 25.4Other investments 1.7 1.4 3.0 3.0 3.0Deferred tax asset 5.3 6.8 4.9 0.8 0.9Employee benefits 17.2 19.3 13.2 8.0 10.3Derivative financial instruments – 1.0 – 0.9 –Total non-current assets 968.8 851.3 838.3 565.5 308.0Current assets 342.3 297.5 207.6 146.2 236.9Total assets 1,311.1 1,148.8 1,045.9 711.7 544.9
EquityShare capital 38.5 38.3 38.2 36.1 32.8Share premium account 435.4 434.8 433.8 288.7 188.6Merger reserve 317.8 317.8 317.8 317.8 317.8Reserves 119.8 28.1 9.4 (32.2) 0.2Retained earnings 68.4 28.7 (40.6) (80.0) (104.8)Total equity 979.9 847.7 758.6 530.4 434.6Total non-current liabilities 165.7 176.1 171.7 93.5 44.7Total current liabilities 165.5 125.0 115.6 87.8 65.6Total liabilities 331.2 301.1 287.3 181.3 110.3Total equity and liabilities 1,311.1 1,148.8 1,045.9 711.7 544.9
1. The statement of financial position for 31 March 2017 includes the assets and liabilities acquired from Galil Medical during the year.2. The statement of financial position for 31 March 2015 includes the assets and liabilities acquired from PneumRx, Inc. during the year.3. The statement of financial position for 31 March 2014 includes the assets and liabilities acquired from EKOS Corporation and the
Targeted Therapies Division of Nordion Inc. during the year.
Consolidated cash flow statement20171
£m2016
£m20152
£m20143
£m2013
£m
Net cash from operating activities 74.2 95.6 47.5 48.5 55.5Net cash used in investing activities (45.3) (29.9) (158.9) (269.4) (4.5)Net cash from/(used in) financing activities (19.7) – 146.2 102.7 0.2Increase/(decrease) in cash and cash equivalents 9.2 65.7 34.8 (118.2) 51.2Effect of exchange rate fluctuations on cash held 5.9 0.9 0.8 (2.3) 0.6Cash and cash equivalents at start of year 140.4 73.8 38.2 158.7 106.9Cash and cash equivalents at end of year 155.5 140.4 73.8 38.2 158.7
1. The results for the year ended 31 March 2017 include the results of Galil Medical from the date of acquisition, being 15 June 2016.2. The results for the year ended 31 March 2015 include the results of PneumRx, Inc. from the date of acquisition, being 7 January 2015.3. The results for the year ended 31 March 2014 include the results of EKOS Corporation and the Targeted Therapies Division of Nordion
Inc. from the date of acquisition, being 5 July 2013 and 13 July 2013 respectively.
BTG plc Annual Report and Accounts 2017 BTG plc Annual Report and Accounts 2017
158Financials
BTG plc Annual Report and Accounts 2017 BTG plc Annual Report and Accounts 2017
158Financials
Five-year financial recordFor the year ended 31 March
continued

Financial calendar Circulation of annual report for the year ended 31 March 2017 13 June 2017
Annual General Meeting 13 July 2017
Announcement of interim results for the six months ended 30 September 2017 November 2017
Preliminary announcement of annual results for the year ended 31 March 2018 May 2018
ShareholdersAt 31 March 2017 there were 8,764 holders of ordinary shares in the Company. Their shareholdings are analysed as follows:
Size of shareholdingNumber of
shareholders
Percentage of total number of shareholders
Number of ordinary shares
Percentage of ordinary shares
1 – 5,000 8,014 91.4 5,223,299 1.35,001 – 50,000 510 5.8 8,155,536 2.150,001 – 100,000 52 0.6 3,722,128 1.0100,001 – 500,000 101 1.2 25,038,986 6.5Over 500,000 87 1.0 342,987,576 89.1Total 8,764 100.0 385,127,525 100.0
Shareholders are further analysed as follows:
Type of ownerNumber of
shareholders
Percentage of total number of shareholders
Number of ordinary shares
Percentage of ordinary shares
Bank and nominee companies 960 11.0 374,790,955 97.3Private shareholders 7,633 87.1 9,349,586 2.5Limited companies 48 0.5 480,970 0.1BTG Employee Share Trust 1 – 32,098 –Insurance companies and pension funds 122 1.4 473,916 0.1
8,764 100.0 385,127,525 100.0
Mutual funds and other institutions, and private shareholders holding their shares within PEPs and ISAs, are included within ‘Bank and nominee companies’.
Capita share dealing servicesA quick and easy share dealing service is available from Capita Asset Services, to either buy or sell more shares. An online and telephone dealing facility is available providing shareholders with an easy-to-access and simple-to-use service. For further information on this service, or to buy and sell shares, please contact: www.capitadeal.com (online dealing) or 0371 664 0445 (telephone dealing – calls are charged at the standard geographic rate and will vary by provider. Calls outside the United Kingdom are charged at the applicable international rate. Lines are open between 8 am – 4.30 pm, Monday to Friday excluding public holidays in England and Wales). Full terms, conditions and risks apply and are available on request or by visiting www.capitadeal.com.
This is not a recommendation to buy or sell shares. The price of shares can go down as well as up, and you are not guaranteed to get back the amount that you originally invested.).
Shareholder change of addressThe Company offers the facility, in conjunction with Capita Asset Services, our Registrars, to conduct a number of routine matters via the web including the ability to notify any change of address. If you are a shareholder and are either unable or would prefer not to use this facility, please do not send the notification to the Company’s registered office. Please write direct to Capita, at their address shown below, where the register is held.
Shareholder information
BTG plc Annual Report and Accounts 2017
159Financials
Financials
BTG plc Annual Report and Accounts 2017
159Financials

Registered office and head officeBTG plc 5 Fleet Place London EC4M 7RD Telephone: +44 (0)20 7575 0000 Facsimile: +44 (0)20 7575 0010 Email: [email protected] Website: www.btgplc.com Registered number 2670500
Cautionary note regarding forward looking statements This Annual Report and Accounts contains certain forward-looking statements with respect to BTG’s business, performance and prospects. Statements and other information included in this report that are not historical facts are forward-looking statements. Words such as ‘expects’, ‘anticipates’, ‘intends’, ‘plans’, ‘believes’, ‘seeks’, ‘estimates’ and ‘potential’, variations of these words and similar expressions are intended to identify forward-looking statements. These statements are based on current expectations and involve risk and uncertainty because they relate to events and depend upon circumstances which may or may not occur in the future. There are a number of factors which could cause actual results or developments to differ materially from those expressed or implied by these forward-looking statements. Current principal risks and uncertainties are described on pages 68 to 70 of this report. Any of the assumptions underlying these forward-looking statements could prove inaccurate or incorrect and therefore any results contemplated in the forward-looking statements may not actually be achieved. BTG undertakes no obligation to update publicly any forward-looking statement, whether as a result of new information, future events or otherwise.
AdvisersStockbrokersJ.P. Morgan Cazenove 25 Bank Street Canary Wharf London E14 5JP Tel +44 (0)20 7742 4000 Fax +44 (0)20 3493 0684
Deutsche Bank AG London Winchester House 1 Great Winchester Street London EC2N 2DB Tel +44 (0)20 3142 8700 Fax +44 (0)20 3142 8735
Auditor KPMG LLP 15 Canada Square London E14 5GL Tel +44 (0)20 7311 1000 Fax +44 (0)20 7311 3311
RegistrarsCapita Asset Services The Registry 34 Beckenham Road Beckenham Kent BR3 4TU
Callers from the UK: Tel 0871 664 0300 (please note that calls cost 12p per minute, plus network extras. Lines are open from, Monday to Friday 9:00am – 5:30pm GMT, excluding public holidays in England and Wales.)
Callers from outside the UK: Tel +44 (0) 37 1664 0300
BTG plc Annual Report and Accounts 2017
160Financials
BTG plc Annual Report and Accounts 2017
160Financials
Shareholder informationcontinued

This report is printed on Revive 50 Silk which is produced using 50% recycled post-consumer waste and 50% wood fibre from fully sustainable forests with
FSC® certification. All pulps used are Elemental Chlorine Free (ECF).
Printed in the UK by Pureprint which is a CarbonNeutral® company. Both the manufacturing mill and the printer are registered
to the Environmental Management System ISO14001 and are Forest Stewardship Council (FSC) chain-of-custody certified.
Designed and produced by MerchantCantos www.merchantcantos.com

btgplc.com
BTG plc 5 Fleet Place London EC4M 7RD UK Tel: +44 (0)20 7575 0000 Fax: +44 (0)20 7575 0010
BT
G plc
Annual R
eport and Accounts 2017