Embed Size (px)
DESCRIPTION
results
Citation preview
Cohort Completion MNot
Completed*
2014/15 27 11 0.0% 59.3%
2013/14 42 14 2.4% 66.7%
2014/15 Cumulative 27 11 14.8%
2013/14 Cumulative 42 14 21.4%
2014/15 217 165 11.1% 24.0%
2013/14 132 84 6.8% 36.4%
2014/15 Cumulative 217 165 37.8%
2013/14 Cumulative 132 84 31.1%
2014/15 3,569 2,925 14.8% 18.0%
2013/14 2,909 2,392 16.7% 17.8%
2014/15 Cumulative 3,569 2,925 68.7%
2013/14 Cumulative 2,909 2,392 65.4%
2014/15 5,865 4,552 19.0% 22.4%
2013/14 5,522 3,929 18.1% 28.8%
2014/15 Cumulative 5,865 4,552 57.9%
2013/14 Cumulative 5,522 3,929 48.2%
2014/15 1,569 1,272 19.4% 18.9%
2013/14 1,906 1,402 21.0% 26.4%
2014/15 Cumulative 1,569 1,272 55.1%
2013/14 Cumulative 1,906 1,402 44.8%
2014/15 37 31 10.8% 16.2%
2013/14 6 4 0.0% 33.3%
2014/15 Cumulative 37 31 13.5%
2013/14 Cumulative 6 4 0.0%
2014/15 1 1 0.0% 0.0%
2013/14 -
2014/15 Cumulative 1 1 100.0%
2013/14 Cumulative -
2014/15 6,390 4,699 16.7% 26.5%
2013/14 6,353 4,618 16.9% 27.3%
2014/15 Cumulative 6,390 4,699 54.3%
2013/14 Cumulative 6,353 4,618 49.9%
2014/15 119 61 9.2% 48.7%
2013/14 127 71 11.0% 44.1%
2014/15 Cumulative 119 61 36.1%
2013/14 Cumulative 127 71 35.4%
2014/15 4 4 0.0% 0.0%
2013/14 25 16 16.0% 36.0%
2014/15 Cumulative 4 4 0.0%
2013/14 Cumulative 25 16 24.0%
BTEC Nationals Results 2014/15
0.0%
11.1% 14.8% 40.7% 40.7%
19.0% 19.0% 33.3%
PEARSON BTEC LEVEL 3
CERTIFICATE - QCFD* D P U
33.3%
Agriculture
11.1% 3.7% 25.9% 0.0%
19.0% 0.0% 11.9%
Animal Management
23.5% 3.2% 38.2% 0.0%
20.5% 3.8% 32.6% 0.0%
23.5% 26.7% 76.0% 76.0%
20.5% 24.2% 63.6% 63.6%
Applied Law
44.3% 9.7% 13.2% 0.0%
38.2% 10.5% 16.8% 0.0%
44.3% 54.0% 82.0% 82.0%
38.2% 48.7% 82.2% 82.2%
Applied Science
29.9% 9.0% 19.7% 0.0%
22.1% 8.0% 22.9% 0.0%
29.9% 38.9% 77.6% 77.6%
22.1% 30.2% 71.2% 71.2%
81.1%
15.3% 23.8% 73.6% 73.6%
66.7%
Art and Design
27.7% 7.9% 26.0% 0.0%
15.3% 8.5% 28.8% 0.0%
27.7% 35.6% 81.1%
Aviation Operations
2.7% 0.0% 70.3% 0.0%
0.0%
2.7% 2.7% 83.8% 83.8%
0.0% 0.0% 66.7%
0.0% 0.0% 66.7%
Blacksmithing and Metalworking
0.0% 100.0% 0.0% 0.0%
0.0% 100.0% 100.0% 100.0%
Business
28.1% 9.5% 19.3% 0.0%
23.3% 9.7% 22.8% 0.0%
28.1% 37.6% 73.5% 73.5%
23.3% 33.0% 72.7% 72.7%
Construction and the Built
Environment
22.7% 4.2% 15.1% 0.0%
17.3% 7.1% 20.5% 0.0%
22.7% 26.9% 51.3% 51.3%
17.3% 24.4% 55.9% 55.9%
100.0%
8.0% 8.0% 64.0% 64.0%
Countryside Management
0.0% 0.0% 100.0% 0.0%
8.0% 0.0% 40.0% 0.0%
0.0% 0.0% 100.0%
* ‘Not Completed’ includes learners who have withdrawn or claimed fallback and learners who are yet to complete at the end of the projected course duration.
Cohort Completion MNot
Completed*
BTEC Nationals Results 2014/15
PEARSON BTEC LEVEL 3
CERTIFICATE - QCFD* D P U
2014/15 2,831 2,110 25.4% 25.5%
2013/14 2,782 2,016 25.2% 27.5%
2014/15 Cumulative 2,831 2,110 52.9%
2013/14 Cumulative 2,782 2,016 51.0%
2014/15 1,609 1,111 16.7% 31.0%
2013/14 1,402 939 13.3% 33.0%
2014/15 Cumulative 1,609 1,111 53.9%
2013/14 Cumulative 1,402 939 47.6%
2014/15 135 64 10.4% 52.6%
2013/14 147 62 7.5% 57.8%
2014/15 Cumulative 135 64 38.5%
2013/14 Cumulative 147 62 32.7%
2014/15 3 3 0.0% 0.0%
2013/14 5 4 0.0% 20.0%
2014/15 Cumulative 3 3 0.0%
2013/14 Cumulative 5 4 40.0%
2014/15 16 10 0.0% 37.5%
2013/14 14 11 0.0% 21.4%
2014/15 Cumulative 16 10 56.3%
2013/14 Cumulative 14 11 78.6%
2014/15 1 - 0.0% 100.0%
2013/14 -
2014/15 Cumulative 1 - 0.0%
2013/14 Cumulative -
2014/15 3,775 2,773 13.7% 26.5%
2013/14 3,734 2,624 12.6% 29.7%
2014/15 Cumulative 3,775 2,773 56.1%
2013/14 Cumulative 3,734 2,624 51.6%
2014/15 13 10 0.0% 23.1%
2013/14 14 9 14.3% 35.7%
2014/15 Cumulative 13 10 15.4%
2013/14 Cumulative 14 9 35.7%
2014/15 38 21 2.6% 44.7%
2013/14 41 34 9.8% 17.1%
2014/15 Cumulative 38 21 44.7%
2013/14 Cumulative 41 34 70.7%
2014/15 598 409 15.6% 31.6%
2013/14 631 386 11.9% 38.8%
2014/15 Cumulative 598 409 44.3%
2013/14 Cumulative 631 386 37.7%
72.5%
Creative Media Production
16.5% 11.1% 21.6% 0.0%
0.1%
16.5% 27.6% 74.5% 74.5%
15.5% 25.9% 72.3%
15.5% 10.4% 21.3%
Engineering
29.0% 8.3% 15.1% 0.0%
26.2% 8.1% 19.4% 0.0%
29.0% 37.3% 69.0% 69.0%
26.2% 34.3% 67.0% 67.0%
Environmental Sustainability
20.7% 7.4% 8.9% 0.0%
19.7% 5.4% 9.5% 0.0%
20.7% 28.1% 47.4% 47.4%
19.7% 25.2% 42.2% 42.2%
Fish Management
0.0% 0.0% 100.0% 0.0%
20.0% 20.0% 40.0% 0.0%
0.0% 0.0% 100.0% 100.0%
20.0% 40.0% 80.0% 80.0%
62.5%
78.6% 78.6% 78.6% 78.6%
Floristry
56.3% 0.0% 6.3% 0.0%
78.6% 0.0% 0.0% 0.0%
56.3% 56.3% 62.5%
Forestry and Arboriculture
0.0% 0.0% 0.0% 0.0%
0.0% 0.0% 0.0% 0.0%
Health and Social Care
34.3% 8.1% 17.4% 0.0%
31.4% 7.6% 18.7% 0.0%
34.3% 42.4% 73.4% 73.5%
31.4% 38.9% 70.3% 70.3%
Horse Management
15.4% 0.0% 61.5% 0.0%
7.1% 14.3% 28.6% 0.0%
15.4% 15.4% 76.9% 76.9%
7.1% 21.4% 64.3% 64.3%
Horticulture
34.2% 7.9% 10.5% 0.0%
56.1% 4.9% 12.2% 0.0%
34.2% 42.1% 55.3% 55.3%
56.1% 61.0% 82.9% 82.9%
68.4%
18.2% 25.8% 61.2% 61.2%
Hospitality
21.9% 6.9% 24.1% 0.0%
18.2% 7.6% 23.5% 0.0%
21.9% 28.8% 68.4%
* ‘Not Completed’ includes learners who have withdrawn or claimed fallback and learners who are yet to complete at the end of the projected course duration.

Cohort Completion MNot
Completed*
BTEC Nationals Results 2014/15
PEARSON BTEC LEVEL 3
CERTIFICATE - QCFD* D P U
2014/15 6,174 4,834 14.9% 21.7%
2013/14 6,847 5,151 16.7% 24.8%
2014/15 Cumulative 6,174 4,834 63.4%
2013/14 Cumulative 6,847 5,151 59.6%
2014/15 5 1 0.0% 80.0%
2013/14 2 - 0.0% 100.0%
2014/15 Cumulative 5 1 0.0%
2013/14 Cumulative 2 - 0.0%
2014/15 1,629 1,336 21.1% 18.0%
2013/14 1,709 1,333 22.5% 22.0%
2014/15 Cumulative 1,629 1,336 69.4%
2013/14 Cumulative 1,709 1,333 63.6%
2014/15 962 799 25.8% 16.9%
2013/14 1,077 867 23.4% 19.5%
2014/15 Cumulative 962 799 65.5%
2013/14 Cumulative 1,077 867 60.0%
2014/15 2,765 2,229 22.6% 19.4%
2013/14 3,008 2,440 23.5% 18.9%
2014/15 Cumulative 2,765 2,229 70.5%
2013/14 Cumulative 3,008 2,440 70.8%
2014/15 540 456 15.2% 15.6%
2013/14 497 386 16.9% 22.3%
2014/15 Cumulative 540 456 66.3%
2013/14 Cumulative 497 386 57.3%
2014/15 349 264 20.1% 24.4%
2013/14 418 316 28.0% 24.4%
2014/15 Cumulative 349 264 53.6%
2013/14 Cumulative 418 316 56.2%
2014/15 1,503 997 12.9% 33.7%
2013/14 2,170 1,440 16.7% 33.6%
2014/15 Cumulative 1,503 997 41.7%
2013/14 Cumulative 2,170 1,440 44.7%
2014/15 3,864 2,689 15.9% 30.4%
2013/14 3,794 2,628 18.4% 30.7%
2014/15 Cumulative 3,864 2,689 52.0%
2013/14 Cumulative 3,794 2,628 50.2%
2014/15 691 533 14.5% 22.9%
2013/14 737 582 17.0% 21.0%
2014/15 Cumulative 691 533 58.5%
2013/14 Cumulative 737 582 57.8%
75.2%
Information Technology
38.7% 9.8% 14.9% 0.0%
0.0%
38.7% 48.5% 78.3% 78.3%
33.6% 42.9% 75.2%
33.6% 9.3% 15.6%
Land-based Technology
0.0% 0.0% 20.0% 0.0%
0.0% 0.0% 0.0% 0.0%
0.0% 0.0% 20.0% 20.0%
0.0% 0.0% 0.0% 0.0%
Music
34.6% 13.7% 12.6% 0.0%
27.9% 13.2% 14.4% 0.0%
34.6% 48.3% 82.0% 82.0%
27.9% 41.1% 78.0% 78.0%
Music Technology
26.0% 13.7% 17.6% 0.0%
23.4% 13.2% 20.5% 0.0%
26.0% 39.7% 83.1% 83.1%
23.4% 36.6% 80.5% 80.5%
80.6%
33.8% 47.3% 81.1% 81.1%
77.7%
Performing Arts
35.3% 12.6% 10.1% 0.0%
33.8% 13.5% 10.3% 0.0%
35.3% 48.0% 80.6%
Personal and Business Finance
40.0% 11.1% 18.1% 0.0%
0.0%
40.0% 51.1% 84.4% 84.4%
27.2% 40.4% 77.7%
27.2% 13.3% 20.3%
Production Arts
22.9% 10.6% 22.1% 0.0%
17.5% 10.8% 19.4% 0.0%
22.9% 33.5% 75.6% 75.6%
17.5% 28.2% 75.6% 75.6%
Public Services
23.7% 5.1% 24.5% 0.1%
20.8% 7.2% 21.6% 0.0%
23.7% 28.8% 66.2% 66.3%
20.8% 28.0% 66.3% 66.4%
Sport
27.7% 8.4% 17.4% 0.1%
24.1% 7.7% 19.0% 0.1%
27.7% 36.1% 69.5% 69.6%
24.1% 31.8% 69.2% 69.3%
Sport and Exercise Sciences
34.0% 10.0% 18.7% 0.0%
33.8% 7.1% 21.2% 0.0%
34.0% 44.0% 77.1% 77.1%
33.8% 40.8% 79.0% 79.0%
* ‘Not Completed’ includes learners who have withdrawn or claimed fallback and learners who are yet to complete at the end of the projected course duration.
Cohort Completion MNot
Completed*
BTEC Nationals Results 2014/15
PEARSON BTEC LEVEL 3
CERTIFICATE - QCFD* D P U
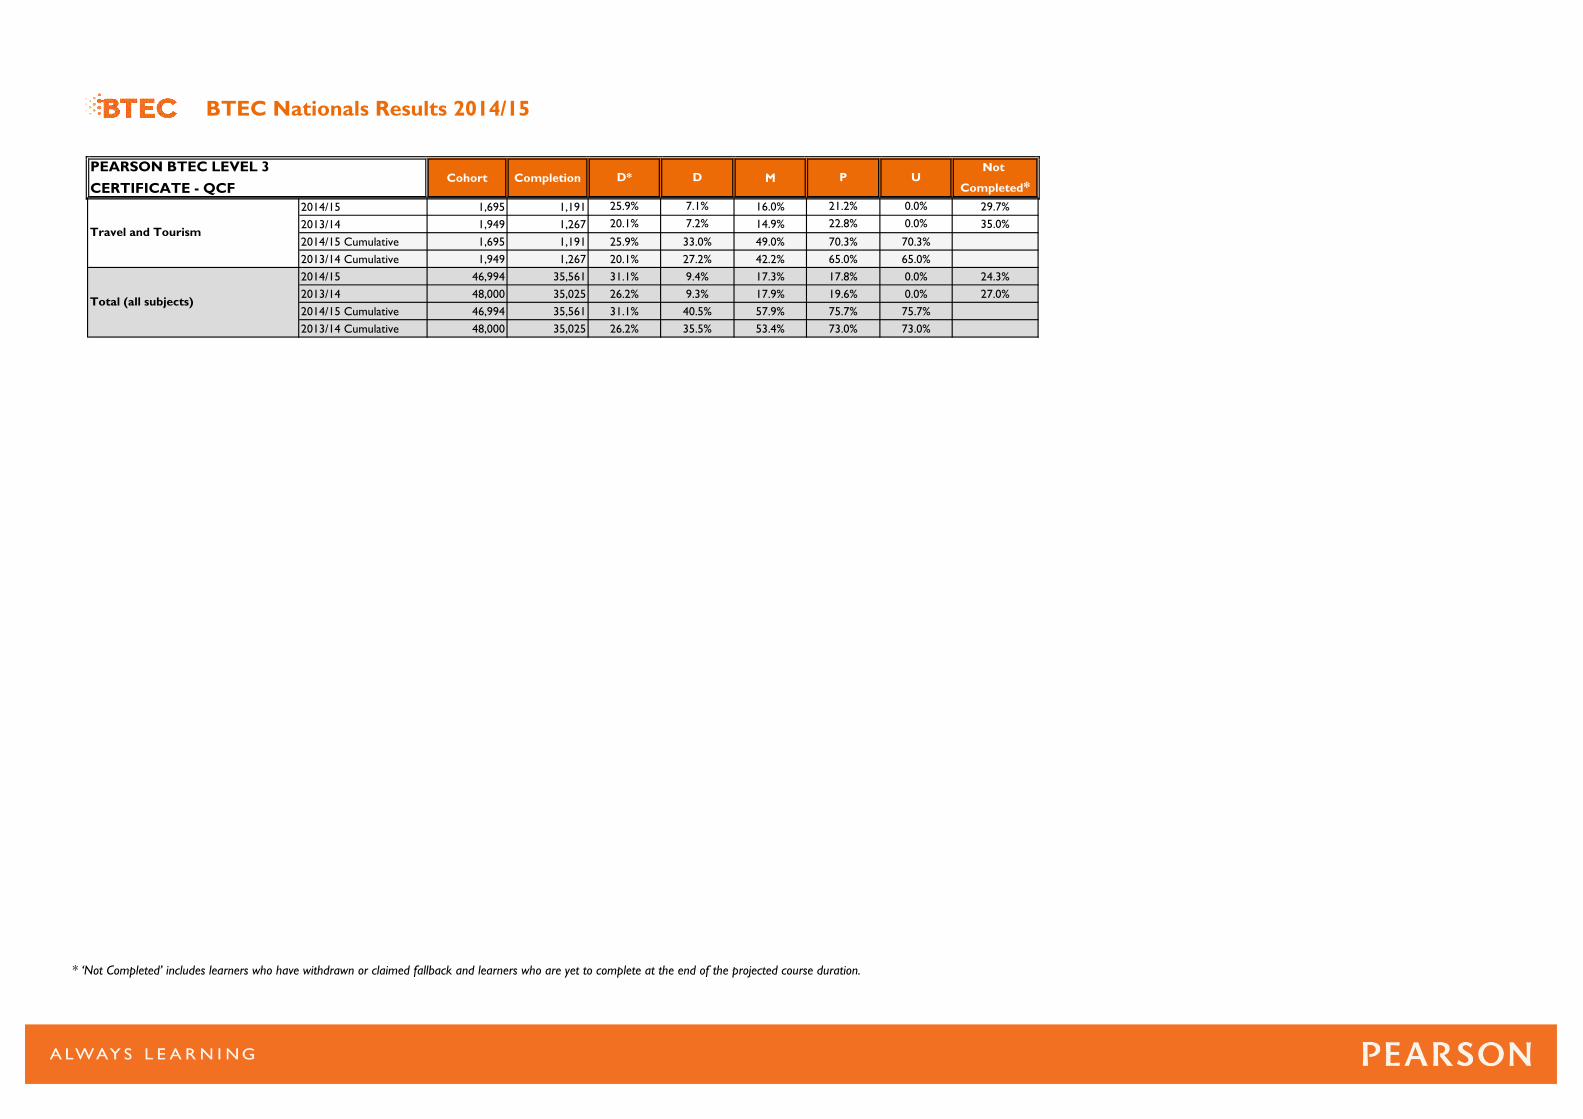
2014/15 1,695 1,191 16.0% 29.7%
2013/14 1,949 1,267 14.9% 35.0%
2014/15 Cumulative 1,695 1,191 49.0%
2013/14 Cumulative 1,949 1,267 42.2%
2014/15 46,994 35,561 17.3% 24.3%
2013/14 48,000 35,025 17.9% 27.0%
2014/15 Cumulative 46,994 35,561 57.9%
2013/14 Cumulative 48,000 35,025 53.4%
7.2% 22.8% 0.0%
25.9% 33.0% 70.3% 70.3%
20.1% 27.2% 65.0%
73.0% 73.0%
65.0%
Total (all subjects)
31.1% 9.4% 17.8% 0.0%
26.2% 9.3% 19.6% 0.0%
31.1% 40.5% 75.7% 75.7%
26.2% 35.5%
Travel and Tourism
25.9% 7.1% 21.2% 0.0%
20.1%
* ‘Not Completed’ includes learners who have withdrawn or claimed fallback and learners who are yet to complete at the end of the projected course duration.
Cohort Completion MNot
Completed*
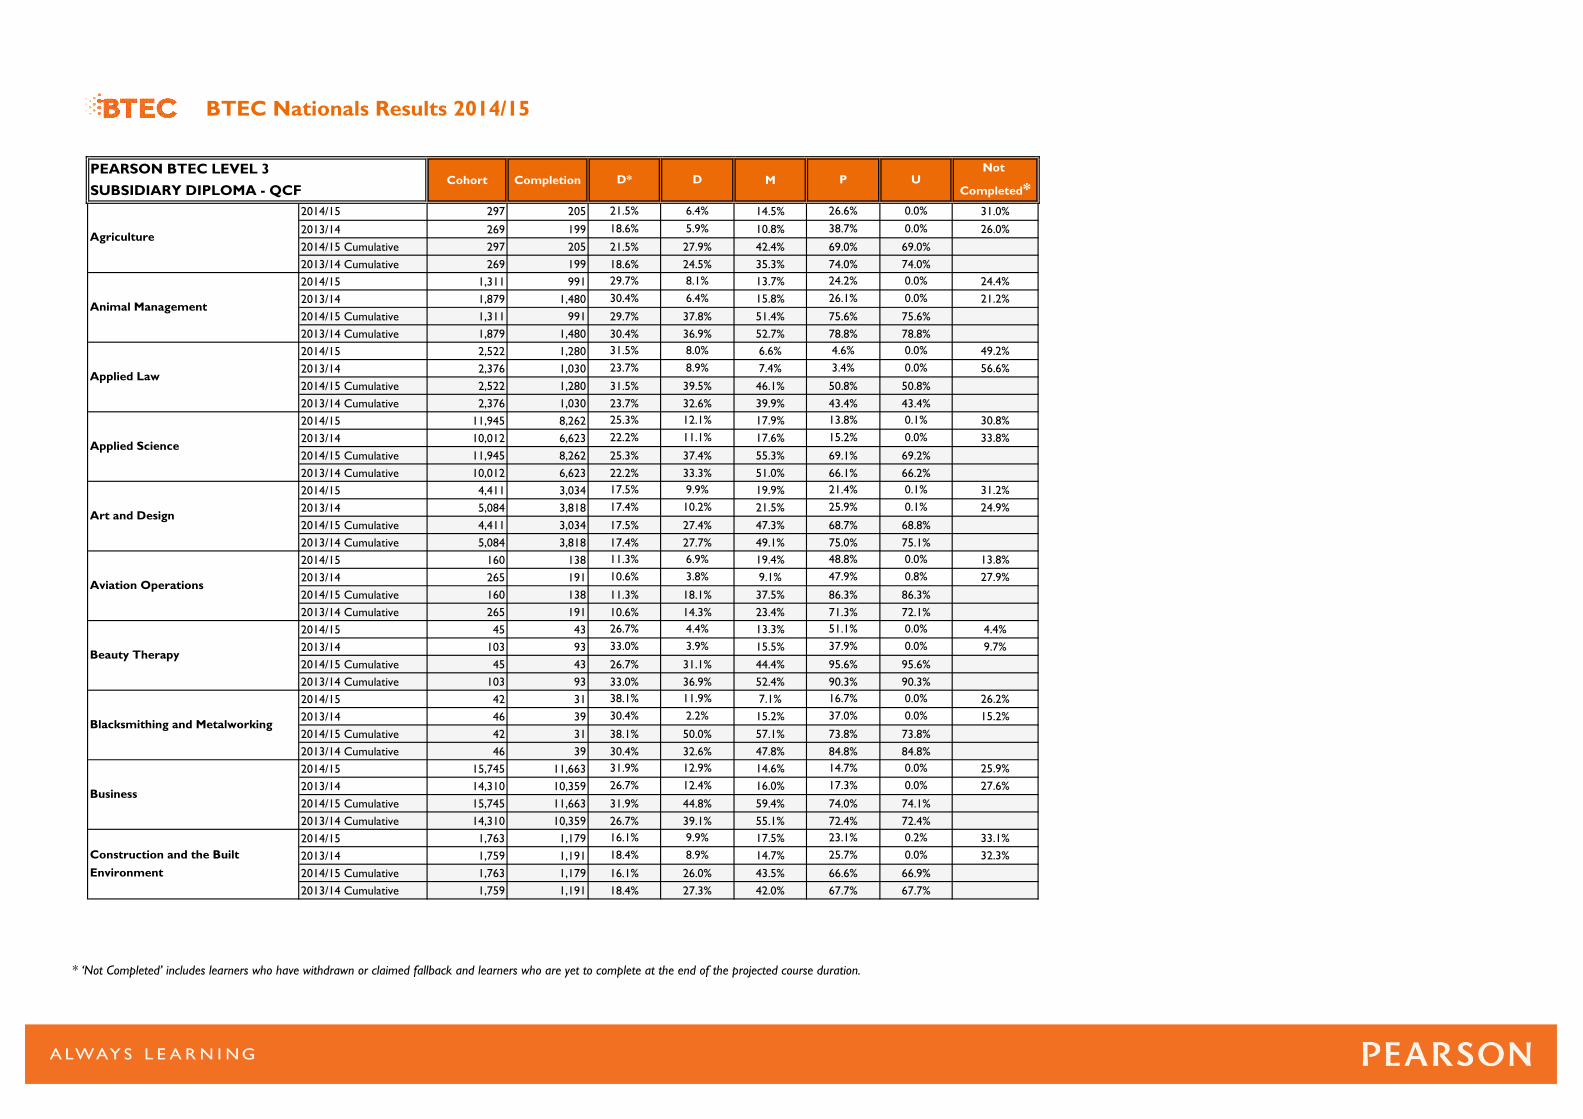
2014/15 297 205 14.5% 31.0%
2013/14 269 199 10.8% 26.0%
2014/15 Cumulative 297 205 42.4%
2013/14 Cumulative 269 199 35.3%
2014/15 1,311 991 13.7% 24.4%
2013/14 1,879 1,480 15.8% 21.2%
2014/15 Cumulative 1,311 991 51.4%
2013/14 Cumulative 1,879 1,480 52.7%
2014/15 2,522 1,280 6.6% 49.2%
2013/14 2,376 1,030 7.4% 56.6%
2014/15 Cumulative 2,522 1,280 46.1%
2013/14 Cumulative 2,376 1,030 39.9%
2014/15 11,945 8,262 17.9% 30.8%
2013/14 10,012 6,623 17.6% 33.8%
2014/15 Cumulative 11,945 8,262 55.3%
2013/14 Cumulative 10,012 6,623 51.0%
2014/15 4,411 3,034 19.9% 31.2%
2013/14 5,084 3,818 21.5% 24.9%
2014/15 Cumulative 4,411 3,034 47.3%
2013/14 Cumulative 5,084 3,818 49.1%
2014/15 160 138 19.4% 13.8%
2013/14 265 191 9.1% 27.9%
2014/15 Cumulative 160 138 37.5%
2013/14 Cumulative 265 191 23.4%
2014/15 45 43 13.3% 4.4%
2013/14 103 93 15.5% 9.7%
2014/15 Cumulative 45 43 44.4%
2013/14 Cumulative 103 93 52.4%
2014/15 42 31 7.1% 26.2%
2013/14 46 39 15.2% 15.2%
2014/15 Cumulative 42 31 57.1%
2013/14 Cumulative 46 39 47.8%
2014/15 15,745 11,663 14.6% 25.9%
2013/14 14,310 10,359 16.0% 27.6%
2014/15 Cumulative 15,745 11,663 59.4%
2013/14 Cumulative 14,310 10,359 55.1%
2014/15 1,763 1,179 17.5% 33.1%
2013/14 1,759 1,191 14.7% 32.3%
2014/15 Cumulative 1,763 1,179 43.5%
2013/14 Cumulative 1,759 1,191 42.0%
BTEC Nationals Results 2014/15
PEARSON BTEC LEVEL 3
SUBSIDIARY DIPLOMA - QCF
Agriculture
Applied Science
Applied Law
43.4%
31.5% 8.0% 4.6%
Animal Management
78.8% 78.8%
21.5% 6.4% 26.6% 0.0%
18.6% 5.9% 38.7% 0.0%
21.5% 27.9% 69.0%
Business
Blacksmithing and Metalworking
38.1% 11.9% 16.7% 0.0%
Beauty Therapy
72.1%
Art and Design
Aviation Operations
31.9% 44.8% 74.0% 74.1%
38.1% 50.0% 73.8% 73.8%
30.4%
12.9% 14.7% 0.0%
26.7% 12.4%
Construction and the Built
Environment
69.0%
68.8%
17.4% 27.7% 75.0%
90.3% 90.3%
32.6%
67.7%
26.7% 39.1% 72.4% 72.4%
16.1% 9.9% 23.1% 0.2%
18.4% 8.9% 25.7% 0.0%
16.1% 26.0% 66.6% 66.9%
18.4% 27.3% 67.7%
17.3% 0.0%
31.9%
0.0%
26.7% 31.1% 95.6% 95.6%
30.4% 2.2% 37.0% 0.0%
33.0% 36.9%
84.8% 84.8%
11.3% 6.9% 48.8% 0.0%
10.6% 3.8% 47.9% 0.8%
11.3% 18.1% 86.3% 86.3%
10.6% 14.3% 71.3%
26.7% 4.4% 51.1% 0.0%
33.0% 3.9% 37.9%
22.2% 11.1% 15.2% 0.0%
25.3% 37.4% 69.1% 69.2%
75.1%
22.2% 33.3% 66.1% 66.2%
17.5% 9.9% 21.4% 0.1%
17.4% 10.2% 25.9% 0.1%
17.5% 27.4% 68.7%
23.7% 8.9% 3.4% 0.0%
31.5% 39.5% 50.8% 50.8%
25.3% 12.1% 13.8% 0.1%
32.6% 43.4%
D* D P U
23.7%
74.0%
29.7% 8.1% 24.2% 0.0%
30.4% 6.4% 26.1% 0.0%
29.7% 37.8% 75.6% 75.6%
30.4% 36.9%
18.6% 24.5% 74.0%
0.0%
* ‘Not Completed’ includes learners who have withdrawn or claimed fallback and learners who are yet to complete at the end of the projected course duration.

Cohort Completion MNot
Completed*
BTEC Nationals Results 2014/15
PEARSON BTEC LEVEL 3
SUBSIDIARY DIPLOMA - QCF
Agriculture
21.5% 6.4% 26.6% 0.0%
D* D P U
2014/15 110 84 16.4% 23.6%
2013/14 143 105 14.0% 26.6%
2014/15 Cumulative 110 84 45.5%
2013/14 Cumulative 143 105 38.5%
2014/15 5,758 3,955 22.6% 31.3%
2013/14 5,479 3,910 22.1% 28.6%
2014/15 Cumulative 5,758 3,955 51.5%
2013/14 Cumulative 5,479 3,910 49.1%
2014/15 5,176 3,612 17.6% 30.2%
2013/14 4,545 3,057 15.6% 32.7%
2014/15 Cumulative 5,176 3,612 46.7%
2013/14 Cumulative 4,545 3,057 41.8%
2014/15 524 315 12.6% 39.9%
2013/14 599 331 9.5% 44.7%
2014/15 Cumulative 524 315 39.5%
2013/14 Cumulative 599 331 36.4%
2014/15 66 32 6.1% 51.5%
2013/14 45 17 6.7% 62.2%
2014/15 Cumulative 66 32 42.4%
2013/14 Cumulative 45 17 26.7%
2014/15 64 52 4.7% 18.8%
2013/14 65 58 16.9% 10.8%
2014/15 Cumulative 64 52 37.5%
2013/14 Cumulative 65 58 56.9%
2014/15 63 57 12.7% 9.5%
2013/14 87 71 6.9% 18.4%
2014/15 Cumulative 63 57 61.9%
2013/14 Cumulative 87 71 47.1%
2014/15 89 78 22.5% 12.4%
2013/14 102 67 20.6% 34.3%
2014/15 Cumulative 89 78 47.2%
2013/14 Cumulative 102 67 37.3%
2014/15 10,812 8,309 15.0% 23.2%
2013/14 10,437 7,783 14.2% 25.4%
2014/15 Cumulative 10,812 8,309 58.6%
2013/14 Cumulative 10,437 7,783 54.3%
2014/15 305 224 18.7% 26.6%
2013/14 302 254 17.2% 15.9%
2014/15 Cumulative 305 224 48.9%
2013/14 Cumulative 302 254 55.0%
Enterprise and Entrepreneurship
Engineering
20.0% 9.1% 23.0% 0.1%
Creative Media Production
73.4%
Countryside Management
17.4% 26.9% 60.1% 60.1%
20.0% 29.1% 69.7% 69.8%
18.0%
9.5% 20.6% 0.0%
15.7% 11.2%
Health and Social Care
Forestry and Arboriculture
15.7% 9.0% 40.4% 0.0%
Floristry
89.2%
Environmental Sustainability
Fish Management
33.3% 43.6% 76.8% 76.8%
15.7% 24.7% 87.6% 87.6%
15.7%
10.3% 18.2% 0.0%
30.8% 9.3%
Horse Management
84.1%
30.8% 40.1% 74.5% 74.6%
23.6% 6.6% 24.6% 0.0%
27.5% 10.3% 29.1% 0.0%
23.6% 30.2% 73.4% 73.4%
27.5% 37.7% 84.1%
20.3% 0.0%
16.7% 65.7% 65.7%
33.3%
0.0%
39.7% 49.2% 90.5% 90.5%
15.7% 1.0% 28.4% 0.0%
81.6% 81.6%37.9% 40.2%
26.6% 6.3% 43.8% 0.0%
33.8% 6.2% 32.3% 0.0%
26.6% 32.8% 81.3% 81.3%
33.8% 40.0% 89.2%
39.7% 9.5% 28.6% 0.0%
37.9% 2.3% 34.5%
37.8%
15.7% 26.9% 55.3% 55.3%
25.8% 10.6% 6.1% 0.0%
17.8% 2.2% 11.1% 0.0%
25.8% 36.4% 48.5% 48.5%
17.8% 20.0% 37.8%
18.9% 0.0%
26.2% 67.3% 67.3%
17.4%
0.0%
17.2% 28.9% 68.7% 68.7%
18.0% 8.2% 25.5% 0.0%
71.3% 71.4%15.8% 27.0%
22.7% 6.4% 30.9% 0.0%
18.9% 5.6% 35.0% 0.0%
22.7% 29.1% 76.4% 76.4%
18.9% 24.5% 73.4%
17.2% 11.7% 17.2% 0.0%
15.8% 11.2% 22.3%
* ‘Not Completed’ includes learners who have withdrawn or claimed fallback and learners who are yet to complete at the end of the projected course duration.

Cohort Completion MNot
Completed*
BTEC Nationals Results 2014/15
PEARSON BTEC LEVEL 3
SUBSIDIARY DIPLOMA - QCF
Agriculture
21.5% 6.4% 26.6% 0.0%
D* D P U
2014/15 50 38 8.0% 24.0%
2013/14 95 61 16.8% 35.8%
2014/15 Cumulative 50 38 34.0%
2013/14 Cumulative 95 61 41.1%
2014/15 1,058 686 13.8% 35.2%
2013/14 1,130 763 13.0% 32.5%
2014/15 Cumulative 1,058 686 50.3%
2013/14 Cumulative 1,130 763 44.4%
2014/15 14,293 10,498 14.4% 26.6%
2013/14 13,589 9,572 14.4% 29.6%
2014/15 Cumulative 14,293 10,498 59.5%
2013/14 Cumulative 13,589 9,572 52.8%
2014/15 84 39 6.0% 53.6%
2013/14 42 22 9.5% 47.6%
2014/15 Cumulative 84 39 20.2%
2013/14 Cumulative 42 22 19.0%
2014/15 2,414 1,586 16.5% 34.3%
2013/14 2,895 1,809 18.0% 37.5%
2014/15 Cumulative 2,414 1,586 54.8%
2013/14 Cumulative 2,895 1,809 51.7%
2014/15 1,510 925 16.1% 38.7%
2013/14 1,662 964 15.6% 42.0%
2014/15 Cumulative 1,510 925 45.2%
2013/14 Cumulative 1,662 964 41.2%
2014/15 4,563 3,192 16.6% 30.0%
2013/14 5,297 3,516 17.3% 33.6%
2014/15 Cumulative 4,563 3,192 62.5%
2013/14 Cumulative 5,297 3,516 57.8%
2014/15 660 447 11.1% 32.3%
2013/14 511 293 11.7% 42.7%
2014/15 Cumulative 660 447 61.4%
2013/14 Cumulative 511 293 49.3%
2014/15 681 415 18.5% 39.1%
2013/14 771 513 18.7% 33.5%
2014/15 Cumulative 681 415 44.6%
2013/14 Cumulative 771 513 45.8%
2014/15 5,353 4,188 17.4% 21.8%
2013/14 5,212 3,990 17.7% 23.4%
2014/15 Cumulative 5,353 4,188 48.0%
2013/14 Cumulative 5,212 3,990 45.3%
Land-based Technology
Information Technology
34.0% 11.2% 13.9% 0.0%
Hospitality
64.2%
Horticulture
10.7% 14.3% 46.4% 46.4%
34.0% 45.1% 73.4% 73.4%
27.5%
3.6% 26.2% 0.0%
4.8% 4.8%
Personal and Business Finance
35.2% 15.2% 6.4% 0.0%
Performing Arts
58.0%
Music
Music Technology
0.0%
32.0% 45.9% 70.0% 70.0%
26.4% 11.2% 8.0% 0.0%
66.4% 66.4%27.1% 40.6%
17.0% 12.1%
Public Services
Production Arts17.5% 26.1% 60.9% 60.9%
76.6%
17.0% 27.1% 66.5% 66.5%
20.6%
31.2% 0.0%
20.6% 30.6% 78.2% 78.2%
30.2% 0.0%
18.2% 9.5%
18.2% 27.6% 76.5%
35.2% 50.3% 67.7% 67.7%
26.4%
8.7% 16.3% 0.0%
17.0% 10.1% 20.8% 0.0%
37.6% 57.3% 57.3%
17.5%
10.0%
16.0% 0.0%
15.0% 10.6% 16.5% 0.2%
17.0% 29.1% 61.3% 61.3%
15.0% 25.6% 57.8%
32.0% 13.9% 7.4% 0.0%
27.1% 13.5% 8.5%
62.5%
4.8% 9.5% 52.4% 52.4%
24.4% 13.8% 10.9% 0.0%
23.4% 10.3% 10.7% 0.0%
24.4% 38.3% 65.7% 65.7%
23.4% 33.7% 62.5%
33.3% 0.0%
38.4% 70.4% 70.4%
10.7%
0.0%
26.7% 36.5% 64.8% 64.8%
27.5% 10.9% 17.6% 0.0%
67.5% 67.5%22.1% 31.4%
14.0% 12.0% 42.0% 0.0%
24.2% 0.0% 23.2% 0.0%
14.0% 26.0% 76.0% 76.0%
24.2% 24.2% 64.2%
26.7% 9.8% 14.6% 0.0%
22.1% 9.3% 23.1%
* ‘Not Completed’ includes learners who have withdrawn or claimed fallback and learners who are yet to complete at the end of the projected course duration.

Cohort Completion MNot
Completed*
BTEC Nationals Results 2014/15
PEARSON BTEC LEVEL 3
SUBSIDIARY DIPLOMA - QCF
Agriculture
21.5% 6.4% 26.6% 0.0%
D* D P U
2014/15 12,909 9,568 16.9% 25.9%
2013/14 12,778 9,422 17.6% 26.3%
2014/15 Cumulative 12,909 9,568 51.5%
2013/14 Cumulative 12,778 9,422 50.7%
2014/15 1,567 1,123 16.2% 28.3%
2013/14 1,530 1,071 15.3% 30.0%
2014/15 Cumulative 1,567 1,123 57.3%
2013/14 Cumulative 1,530 1,071 52.9%
2014/15 4,654 3,443 16.9% 26.0%
2013/14 4,277 3,060 15.6% 28.5%
2014/15 Cumulative 4,654 3,443 49.8%
2013/14 Cumulative 4,277 3,060 47.2%
2014/15 430 287 16.5% 33.3%
2013/14 475 335 15.2% 29.5%
2014/15 Cumulative 430 287 32.6%
2013/14 Cumulative 475 335 37.9%
2014/15 111,434 79,979 16.3% 28.2%
2013/14 108,171 76,067 16.4% 29.7%
2014/15 Cumulative 111,434 79,979 54.2%
2013/14 Cumulative 108,171 76,067 50.5%
Travel and Tourism
Sport and Exercise Sciences
73.7%22.6% 33.1% 73.7%
Sport
70.0% 70.0%28.9% 37.6%
31.6% 71.5% 71.5%22.2%
23.7% 10.8% 22.6% 0.1%
22.6% 10.5% 23.0%
15.6% 7.2% 32.6% 0.0%
10.5% 16.0% 66.7% 66.7%
Total (all subjects)
Vehicle Technology
10.5% 5.6% 34.2% 0.0%
71.8%
23.7% 34.2% 70.3% 70.3%
15.6% 22.7% 70.5% 70.5%
26.8% 11.1% 17.6% 0.0%
23.7% 10.5% 19.8% 0.0%
26.8% 37.9% 71.7%
22.2% 9.4% 24.3% 0.0%
22.9% 32.9% 73.9% 74.0%
22.9% 10.0% 24.1%
0.0%
23.7% 34.6% 74.1% 74.1%
28.9% 8.7% 17.1% 0.0%
29.4% 41.1% 71.6% 71.7%
0.0%
29.4% 11.7% 14.3% 0.1%
* ‘Not Completed’ includes learners who have withdrawn or claimed fallback and learners who are yet to complete at the end of the projected course duration.

Cohort Completion DD MP PP UNot
Completed
2014/15 108 63 6.5% 13.9% 18.5% 0.0% 41.7%
2013/14 55 41 9.1% 7.3% 3.6% 0.0% 25.5%
2014/15 Cumulative 108 63 14.8% 39.8% 58.3% 58.3%
2013/14 Cumulative 55 41 40.0% 70.9% 74.5% 74.5%
2014/15 1,595 1,220 5.3% 9.0% 13.8% 0.0% 23.5%
2013/14 466 313 5.2% 8.8% 14.8% 0.0% 32.8%
2014/15 Cumulative 1,595 1,220 39.1% 62.7% 76.5% 76.5%
2013/14 Cumulative 466 313 32.6% 52.4% 67.2% 67.2%
2014/15 3,833 3,013 6.5% 10.2% 18.4% 0.0% 21.4%
2013/14 3,781 2,839 6.0% 9.6% 19.2% 0.0% 24.9%
2014/15 Cumulative 3,833 3,013 29.8% 60.2% 78.6% 78.6%
2013/14 Cumulative 3,781 2,839 27.8% 55.9% 75.1% 75.1%
2014/15 6,989 5,987 6.5% 15.7% 20.3% 0.0% 14.3%
2013/14 7,749 6,662 7.3% 16.1% 22.1% 0.0% 14.0%
2014/15 Cumulative 6,989 5,987 22.4% 65.4% 85.7% 85.7%
2013/14 Cumulative 7,749 6,662 20.5% 63.8% 86.0% 86.0%
2014/15 180 147 11.1% 9.4% 21.7% 0.0% 18.3%
2013/14 178 108 1.7% 5.1% 36.0% 0.0% 39.3%
2014/15 Cumulative 180 147 33.9% 60.0% 81.7% 81.7%
2013/14 Cumulative 178 108 10.7% 24.7% 60.7% 60.7%
2014/15 8,094 6,444 6.6% 9.7% 17.0% 0.0% 20.4%
2013/14 7,491 5,799 5.9% 9.6% 20.0% 0.0% 22.6%
2014/15 Cumulative 8,094 6,444 33.9% 62.6% 79.6% 79.6%
2013/14 Cumulative 7,491 5,799 30.1% 57.4% 77.4% 77.4%
2014/15 591 419 5.2% 10.2% 22.8% 0.0% 29.1%
2013/14 166 98 4.8% 10.8% 12.0% 0.0% 41.0%
2014/15 Cumulative 591 419 20.3% 48.1% 70.9% 70.9%
2013/14 Cumulative 166 98 22.9% 47.0% 59.0% 59.0%
2014/15 84 67 2.4% 8.3% 25.0% 0.0% 20.2%
2013/14 60 38 3.3% 6.7% 23.3% 0.0% 36.7%
2014/15 Cumulative 84 67 27.4% 54.8% 79.8% 79.8%
2013/14 Cumulative 60 38 18.3% 40.0% 63.3% 63.3%
2014/15 5,934 5,018 6.1% 17.4% 22.0% 0.0% 15.4%
2013/14 6,025 4,936 5.0% 17.4% 23.3% 0.0% 18.1%
2014/15 Cumulative 5,934 5,018 14.7% 62.5% 84.6% 84.6%
2013/14 Cumulative 6,025 4,936 12.4% 58.7% 81.9% 81.9%
2014/15 4,727 3,517 6.0% 10.2% 18.3% 0.0% 25.6%
2013/14 3,918 2,741 5.1% 11.3% 20.2% 0.0% 30.0%
2014/15 Cumulative 4,727 3,517 27.6% 56.1% 74.4% 74.4%
2013/14 Cumulative 3,918 2,741 22.9% 49.7% 70.0% 70.0%
BTEC Nationals Results 2014/15
9.1%
3.7% 8.3% 17.6% 25.9%
18.2% 30.9% 54.5%
PEARSON BTEC LEVEL 3
90-CREDIT DIPLOMA - QCFD*D* D*D DM MM
63.6%
Agriculture
3.7% 4.6% 2.8% 8.3%
18.2% 12.7% 14.5%
Animal Management
27.6% 6.1% 6.5% 8.2%
24.0% 3.4% 5.2% 5.8%
27.6% 33.8% 45.6% 53.7%
24.0% 27.5% 37.8% 43.6%
Applied Science
16.3% 7.1% 9.5% 10.6%
15.6% 6.2% 9.0% 9.4%
16.3% 23.4% 39.4% 50.0%
15.6% 21.8% 36.8% 46.3%
Art and Design
9.5% 6.4% 13.4% 13.9%
7.8% 5.5% 12.4% 14.8%
9.5% 15.9% 35.8% 49.7%
7.8% 13.2% 33.0% 47.8%
50.6%
9.0% 9.0% 15.7% 19.7%
47.9%
Aviation Operations
11.7% 11.1% 7.2% 9.4%
9.0% 0.0% 5.1% 3.9%
11.7% 22.8% 41.1%
Business
19.7% 7.6% 9.2% 9.7%
9.5%
19.7% 27.3% 43.2% 52.9%
18.4% 24.2% 38.4%
18.4% 5.8% 8.3%
Construction and the Built
Environment
10.8% 4.2% 9.5% 8.1%
11.4% 6.6% 5.4% 7.8%
10.8% 15.1% 29.8% 37.9%
11.4% 18.1% 28.3% 36.1%
Countryside Management
21.4% 3.6% 9.5% 9.5%
13.3% 1.7% 10.0% 5.0%
21.4% 25.0% 36.9% 46.4%
13.3% 15.0% 28.3% 33.3%
Creative Media Production
4.2% 4.4% 13.2% 17.3%
4.0% 3.5% 13.1% 15.7%
4.2% 8.6% 27.9% 45.2%
4.0% 7.4% 25.5% 41.2%
45.9%
12.5% 17.8% 30.2% 38.4%
Engineering
15.4% 6.2% 8.9% 9.4%
12.5% 5.3% 7.3% 8.2%
15.4% 21.6% 36.5%
* ‘Not Completed’ includes learners who have withdrawn or claimed fallback and learners who are yet to complete at the end of the projected course duration.

Cohort Completion DD MP PP UNot
Completed
BTEC Nationals Results 2014/15
PEARSON BTEC LEVEL 3
90-CREDIT DIPLOMA - QCFD*D* D*D DM MM
2014/15 229 164 3.5% 6.6% 25.8% 0.0% 28.4%
2013/14 160 124 5.0% 4.4% 29.4% 0.0% 22.5%
2014/15 Cumulative 229 164 24.0% 45.9% 71.6% 71.6%
2013/14 Cumulative 160 124 30.0% 48.1% 77.5% 77.5%
2014/15 13 6 0.0% 0.0% 23.1% 0.0% 53.8%
2013/14 24 21 0.0% 8.3% 66.7% 0.0% 12.5%
2014/15 Cumulative 13 6 15.4% 23.1% 46.2% 46.2%
2013/14 Cumulative 24 21 4.2% 20.8% 87.5% 87.5%
2014/15 10,124 8,077 6.7% 8.4% 15.0% 0.0% 20.2%
2013/14 8,677 6,599 6.2% 7.5% 16.5% 0.0% 23.9%
2014/15 Cumulative 10,124 8,077 38.6% 64.7% 79.8% 79.8%
2013/14 Cumulative 8,677 6,599 36.9% 59.5% 76.1% 76.1%
2014/15 46 34 2.2% 10.9% 26.1% 0.0% 26.1%
2013/14 16 - 0.0% 0.0% 0.0% 0.0% 100.0%
2014/15 Cumulative 46 34 23.9% 47.8% 73.9% 73.9%
2013/14 Cumulative 16 - 0.0% 0.0% 0.0% 0.0%
2014/15 23 19 4.3% 8.7% 26.1% 0.0% 17.4%
2013/14 25 24 20.0% 12.0% 36.0% 0.0% 4.0%
2014/15 Cumulative 23 19 39.1% 56.5% 82.6% 82.6%
2013/14 Cumulative 25 24 44.0% 60.0% 96.0% 96.0%
2014/15 192 160 3.6% 14.6% 40.1% 0.0% 16.7%
2013/14 95 31 1.1% 4.2% 12.6% 0.0% 67.4%
2014/15 Cumulative 192 160 18.2% 43.2% 83.3% 83.3%
2013/14 Cumulative 95 31 8.4% 20.0% 32.6% 32.6%
2014/15 8,297 6,717 6.4% 11.2% 21.2% 0.1% 19.0%
2013/14 7,805 6,131 5.6% 10.7% 22.0% 0.0% 21.4%
2014/15 Cumulative 8,297 6,717 29.9% 59.7% 80.8% 81.0%
2013/14 Cumulative 7,805 6,131 28.5% 56.5% 78.5% 78.6%
2014/15 10 10 0.0% 10.0% 40.0% 0.0% 0.0%
2013/14 15 11 6.7% 6.7% 13.3% 0.0% 26.7%
2014/15 Cumulative 10 10 20.0% 60.0% 100.0% 100.0%
2013/14 Cumulative 15 11 20.0% 60.0% 73.3% 73.3%
2014/15 2,174 1,686 6.8% 17.1% 15.7% 0.0% 22.4%
2013/14 2,368 1,891 6.6% 18.2% 17.1% 0.0% 20.1%
2014/15 Cumulative 2,174 1,686 14.8% 61.9% 77.6% 77.6%
2013/14 Cumulative 2,368 1,891 14.8% 62.7% 79.9% 79.9%
2014/15 1,658 1,276 5.6% 15.6% 20.7% 0.0% 23.0%
2013/14 1,769 1,367 6.7% 16.7% 22.1% 0.0% 22.7%
2014/15 Cumulative 1,658 1,276 15.0% 56.3% 77.0% 77.0%
2013/14 Cumulative 1,769 1,367 14.5% 55.2% 77.3% 77.3%
43.8%
Enterprise and Entrepreneurship
13.1% 7.4% 9.6% 5.7%
10.0%
13.1% 20.5% 33.6% 39.3%
22.5% 25.0% 33.8%
22.5% 2.5% 3.8%
Forestry and Arboriculture
15.4% 0.0% 7.7% 0.0%
4.2% 0.0% 8.3% 0.0%
15.4% 15.4% 23.1% 23.1%
4.2% 4.2% 12.5% 12.5%
Health and Social Care
23.6% 8.2% 9.3% 8.5%
24.0% 6.7% 7.7% 7.5%
23.6% 31.9% 47.9% 56.4%
24.0% 30.7% 44.6% 52.1%
Horse Management
21.7% 0.0% 4.3% 8.7%
0.0% 0.0% 0.0% 0.0%
21.7% 21.7% 28.3% 37.0%
0.0% 0.0% 0.0% 0.0%
47.8%
12.0% 24.0% 48.0% 48.0%
15.8%
Horticulture
30.4% 4.3% 8.7% 0.0%
12.0% 12.0% 4.0% 0.0%
30.4% 34.8% 47.8%
Hospitality
11.5% 3.1% 6.3% 4.2%
3.2%
11.5% 14.6% 24.5% 28.6%
5.3% 7.4% 12.6%
5.3% 2.1% 4.2%
Information Technology
17.1% 6.5% 8.7% 9.9%
17.5% 5.5% 8.3% 9.0%
17.1% 23.6% 38.7% 48.5%
17.5% 22.9% 36.8% 45.8%
Land-based Technology
10.0% 10.0% 30.0% 0.0%
0.0% 13.3% 6.7% 26.7%
10.0% 20.0% 50.0% 50.0%
0.0% 13.3% 26.7% 53.3%
Music
4.2% 3.8% 13.6% 16.3%
3.9% 4.3% 12.4% 17.3%
4.2% 8.0% 28.4% 44.8%
3.9% 8.2% 27.2% 44.6%
40.7%
3.9% 7.7% 24.4% 38.5%
Music Technology
5.5% 3.9% 12.0% 13.7%
3.9% 3.8% 9.9% 14.1%
5.5% 9.4% 27.0%
* ‘Not Completed’ includes learners who have withdrawn or claimed fallback and learners who are yet to complete at the end of the projected course duration.

Cohort Completion DD MP PP UNot
Completed
BTEC Nationals Results 2014/15
PEARSON BTEC LEVEL 3
90-CREDIT DIPLOMA - QCFD*D* D*D DM MM
2014/15 4,004 3,391 10.1% 11.1% 8.6% 0.0% 15.3%
2013/14 4,352 3,595 9.7% 12.5% 8.3% 0.0% 17.4%
2014/15 Cumulative 4,004 3,391 31.1% 76.0% 84.7% 84.7%
2013/14 Cumulative 4,352 3,595 27.8% 74.3% 82.6% 82.6%
2014/15 525 406 5.9% 11.6% 18.5% 0.0% 22.7%
2013/14 171 130 8.2% 15.2% 16.4% 0.0% 24.0%
2014/15 Cumulative 525 406 20.0% 58.9% 77.3% 77.3%
2013/14 Cumulative 171 130 18.1% 59.6% 76.0% 76.0%
2014/15 4,789 4,003 5.0% 12.6% 35.6% 0.0% 16.4%
2013/14 4,773 3,884 4.8% 11.4% 33.1% 0.0% 18.6%
2014/15 Cumulative 4,789 4,003 18.7% 48.0% 83.6% 83.6%
2013/14 Cumulative 4,773 3,884 20.0% 48.2% 81.3% 81.4%
2014/15 8,109 6,613 5.8% 12.4% 24.9% 0.0% 18.4%
2013/14 7,762 6,272 6.3% 10.9% 23.7% 0.0% 19.2%
2014/15 Cumulative 8,109 6,613 23.2% 56.7% 81.6% 81.6%
2013/14 Cumulative 7,762 6,272 26.2% 57.1% 80.8% 80.8%
2014/15 1,973 1,671 7.8% 8.4% 16.4% 0.0% 15.3%
2013/14 1,927 1,619 7.6% 10.5% 14.5% 0.0% 16.0%
2014/15 Cumulative 1,973 1,671 40.2% 68.3% 84.7% 84.7%
2013/14 Cumulative 1,927 1,619 38.6% 69.5% 84.0% 84.0%
2014/15 2,167 1,791 5.1% 12.3% 28.9% 0.0% 17.4%
2013/14 2,101 1,718 6.5% 11.1% 26.7% 0.0% 18.2%
2014/15 Cumulative 2,167 1,791 23.7% 53.7% 82.6% 82.6%
2013/14 Cumulative 2,101 1,718 26.5% 55.1% 81.8% 81.8%
2014/15 76,468 61,919 6.4% 11.8% 20.1% 0.0% 19.0%
2013/14 71,929 56,992 6.2% 11.8% 20.8% 0.0% 20.8%
2014/15 Cumulative 76,468 61,919 27.4% 60.9% 81.0% 81.0%
2013/14 Cumulative 71,929 56,992 25.6% 58.4% 79.2% 79.2%
61.7%
Performing Arts
11.6% 9.4% 17.7% 16.1%
16.8%
11.6% 21.0% 48.8% 64.9%
9.7% 18.2% 44.9%
9.7% 8.4% 17.1%
Production Arts
9.1% 5.0% 14.1% 13.1%
5.3% 4.7% 12.3% 14.0%
9.1% 14.1% 34.1% 47.2%
5.3% 9.9% 30.4% 44.4%
Public Services
8.6% 5.1% 7.6% 9.0%
10.2% 5.0% 8.6% 8.3%
8.6% 13.7% 26.4% 35.4%
10.2% 15.2% 28.5% 36.9%
Sport
12.0% 5.4% 9.8% 11.3%
14.2% 5.7% 9.5% 10.6%
12.0% 17.4% 33.0% 44.2%
14.2% 19.9% 35.7% 46.2%
Sport and Exercise Sciences
24.4% 8.1% 10.3% 9.5%
24.8% 6.2% 10.0% 10.4%
24.4% 32.4% 50.5% 60.0%
24.8% 31.0% 48.5% 59.0%
5.0% 8.9% 8.6%
14.2% 18.6% 31.2% 41.4%
15.0% 20.0% 35.4%
35.5% 46.6%
43.9%
Total (all subjects)
14.6% 6.4% 10.4% 11.2%
13.8% 5.6% 9.9% 11.0%
14.6% 21.0% 37.8% 49.1%
13.8% 19.4%
Travel and Tourism
14.2% 4.4% 7.5% 10.2%
15.0%
* ‘Not Completed’ includes learners who have withdrawn or claimed fallback and learners who are yet to complete at the end of the projected course duration.

Cohort Completion DD MP PP UNot
Completed*
2014/15 276 208 5.8% 12.3% 16.3% 0.0% 24.6%
2013/14 359 210 5.0% 12.0% 11.1% 0.0% 41.5%
2014/15 Cumulative 276 208 27.2% 59.1% 75.4% 75.4%
2013/14 Cumulative 359 210 23.1% 47.4% 58.5% 58.5%
2014/15 41 31 7.3% 12.2% 51.2% 0.0% 24.4%
2013/14 25 14 0.0% 8.0% 32.0% 0.0% 44.0%
2014/15 Cumulative 41 31 7.3% 24.4% 75.6% 75.6%
2013/14 Cumulative 25 14 4.0% 24.0% 56.0% 56.0%
2014/15 596 485 9.6% 10.1% 11.4% 0.0% 18.6%
2013/14 668 564 7.9% 9.6% 19.8% 0.0% 15.6%
2014/15 Cumulative 596 485 41.3% 70.0% 81.4% 81.4%
2013/14 Cumulative 668 564 38.8% 64.7% 84.4% 84.4%
2014/15 2,523 2,049 14.0% 6.7% 11.6% 0.1% 18.8%
2013/14 2,522 2,038 11.6% 7.6% 11.1% 0.1% 19.2%
2014/15 Cumulative 2,523 2,049 41.5% 69.5% 81.1% 81.2%
2013/14 Cumulative 2,522 2,038 39.5% 69.5% 80.7% 80.8%
2014/15 1,831 1,477 10.3% 9.6% 12.9% 0.0% 19.3%
2013/14 2,576 2,141 9.3% 12.2% 17.8% 0.0% 16.9%
2014/15 Cumulative 1,831 1,477 32.9% 67.7% 80.7% 80.7%
2013/14 Cumulative 2,576 2,141 27.2% 65.3% 83.1% 83.1%
2014/15 121 90 3.3% 9.9% 48.8% 0.0% 25.6%
2013/14 38 37 5.3% 10.5% 34.2% 0.0% 2.6%
2014/15 Cumulative 121 90 5.0% 25.6% 74.4% 74.4%
2013/14 Cumulative 38 37 21.1% 63.2% 97.4% 97.4%
2014/15 300 240 13.3% 7.7% 22.0% 0.0% 20.0%
2013/14 433 339 15.5% 6.7% 25.2% 0.0% 21.7%
2014/15 Cumulative 300 240 32.0% 58.0% 80.0% 80.0%
2013/14 Cumulative 433 339 32.1% 53.1% 78.3% 78.3%
2014/15 8 5 0.0% 0.0% 37.5% 0.0% 37.5%
2013/14 6 6 0.0% 0.0% 100.0% 0.0% 0.0%
2014/15 Cumulative 8 5 12.5% 25.0% 62.5% 62.5%
2013/14 Cumulative 6 6 0.0% 0.0% 100.0% 100.0%
2014/15 7,092 5,820 13.2% 5.3% 8.3% 0.0% 17.9%
2013/14 7,049 5,738 13.2% 6.5% 11.5% 0.0% 18.6%
2014/15 Cumulative 7,092 5,820 49.6% 73.8% 82.1% 82.1%
2013/14 Cumulative 7,049 5,738 43.3% 69.9% 81.4% 81.4%
2014/15 1,334 905 5.8% 9.3% 17.5% 0.1% 32.2%
2013/14 1,229 796 5.2% 10.4% 14.2% 0.1% 35.2%
2014/15 Cumulative 1,334 905 22.9% 50.3% 67.8% 67.8%
2013/14 Cumulative 1,229 796 21.7% 50.4% 64.7% 64.8%
BTEC Nationals Results 2014/15
7.0%
14.1% 21.4% 35.5% 46.7%
10.9% 18.1% 28.4%
PEARSON BTEC LEVEL 3
DIPLOMA - QCFD*D* D*D DM MM
35.4%
Aeronautical Engineering
14.1% 7.2% 8.3% 11.2%
10.9% 7.2% 5.3%
Agriculture
0.0% 0.0% 0.0% 4.9%
4.0% 0.0% 4.0% 8.0%
0.0% 0.0% 7.3% 12.2%
4.0% 4.0% 8.0% 16.0%
Animal Management
25.0% 6.7% 8.6% 10.1%
23.1% 7.8% 8.7% 7.6%
25.0% 31.7% 49.8% 59.9%
23.1% 30.8% 47.5% 55.1%
Applied Science
15.7% 11.7% 11.0% 10.3%
15.9% 11.9% 11.7% 10.7%
15.7% 27.4% 52.4% 62.8%
15.9% 27.8% 51.2% 61.9%
58.1%
9.9% 17.9% 39.8% 53.1%
52.6%
Art and Design
13.8% 8.8% 13.5% 11.7%
9.9% 8.0% 12.5% 13.4%
13.8% 22.6% 46.4%
Aviation Operations
0.8% 0.8% 4.1% 6.6%
21.1%
0.8% 1.7% 9.1% 15.7%
13.2% 15.8% 31.6%
13.2% 2.6% 10.5%
Beauty Therapy
1.7% 17.0% 8.0% 10.3%
3.5% 13.2% 7.4% 6.9%
1.7% 18.7% 40.0% 50.3%
3.5% 16.6% 39.5% 46.4%
Blacksmithing and Metalworking
0.0% 12.5% 0.0% 12.5%
0.0% 0.0% 0.0% 0.0%
0.0% 12.5% 12.5% 25.0%
0.0% 0.0% 0.0% 0.0%
Business
25.5% 10.9% 10.3% 8.7%
20.4% 9.6% 10.8% 9.2%
25.5% 36.4% 59.8% 68.5%
20.4% 30.1% 54.1% 63.4%
41.0%
11.1% 16.5% 30.2% 40.0%
Construction and the Built
Environment
9.8% 7.2% 8.2% 10.0%
11.1% 5.4% 8.5% 9.8%
9.8% 17.0% 31.0%
* ‘Not Completed’ includes learners who have withdrawn or claimed fallback and learners who are yet to complete at the end of the projected course duration.

Cohort Completion DD MP PP UNot
Completed*
BTEC Nationals Results 2014/15
PEARSON BTEC LEVEL 3
DIPLOMA - QCFD*D* D*D DM MM
2014/15 32 30 6.3% 21.9% 28.1% 0.0% 6.3%
2013/14 57 44 7.0% 8.8% 33.3% 0.0% 22.8%
2014/15 Cumulative 32 30 15.6% 65.6% 93.8% 93.8%
2013/14 Cumulative 57 44 24.6% 43.9% 77.2% 77.2%
2014/15 1,547 1,299 10.2% 11.9% 15.4% 0.1% 16.0%
2013/14 1,761 1,403 9.6% 12.5% 14.0% 0.1% 20.3%
2014/15 Cumulative 1,547 1,299 29.0% 68.5% 83.9% 84.0%
2013/14 Cumulative 1,761 1,403 23.5% 65.6% 79.6% 79.7%
2014/15 1,502 1,143 7.0% 10.5% 17.7% 0.1% 23.9%
2013/14 1,422 1,105 7.6% 11.9% 21.7% 0.1% 22.3%
2014/15 Cumulative 1,502 1,143 28.0% 58.3% 76.0% 76.1%
2013/14 Cumulative 1,422 1,105 25.2% 55.9% 77.6% 77.7%
2014/15 2,411 1,664 7.5% 8.3% 14.2% 0.0% 31.0%
2013/14 2,218 1,646 7.7% 9.5% 15.9% 0.0% 25.8%
2014/15 Cumulative 2,411 1,664 29.7% 54.8% 69.0% 69.0%
2013/14 Cumulative 2,218 1,646 29.5% 58.3% 74.2% 74.2%
2014/15 263 236 4.6% 6.1% 21.3% 0.4% 10.3%
2013/14 569 438 5.4% 11.8% 19.9% 0.4% 23.0%
2014/15 Cumulative 263 236 41.1% 68.1% 89.4% 89.7%
2013/14 Cumulative 569 438 32.9% 56.8% 76.6% 77.0%
2014/15 1 - 0.0% 0.0% 0.0% 0.0% 100.0%
2013/14 14 11 0.0% 14.3% 21.4% 0.0% 21.4%
2014/15 Cumulative 1 - 0.0% 0.0% 0.0% 0.0%
2013/14 Cumulative 14 11 14.3% 57.1% 78.6% 78.6%
2014/15 30 23 10.0% 13.3% 26.7% 0.0% 23.3%
2013/14 15 11 6.7% 6.7% 26.7% 0.0% 26.7%
2014/15 Cumulative 30 23 26.7% 50.0% 76.7% 76.7%
2013/14 Cumulative 15 11 20.0% 46.7% 73.3% 73.3%
2014/15 36 35 2.8% 8.3% 16.7% 0.0% 2.8%
2013/14 36 32 19.4% 13.9% 8.3% 0.0% 11.1%
2014/15 Cumulative 36 35 50.0% 80.6% 97.2% 97.2%
2013/14 Cumulative 36 32 52.8% 80.6% 88.9% 88.9%
2014/15 60 38 3.3% 13.3% 8.3% 0.0% 36.7%
2013/14 50 45 8.0% 8.0% 36.0% 0.0% 10.0%
2014/15 Cumulative 60 38 15.0% 55.0% 63.3% 63.3%
2013/14 Cumulative 50 45 38.0% 54.0% 90.0% 90.0%
2014/15 4,824 3,858 9.5% 5.2% 8.0% 0.0% 20.0%
2013/14 4,755 3,741 9.3% 5.2% 8.9% 0.0% 21.3%
2014/15 Cumulative 4,824 3,858 51.4% 71.9% 79.9% 80.0%
2013/14 Cumulative 4,755 3,741 47.5% 69.8% 78.7% 78.7%
35.1%
Countryside Management
6.3% 3.1% 9.4% 18.8%
5.3%
6.3% 9.4% 25.0% 43.8%
12.3% 17.5% 29.8%
12.3% 5.3% 5.3%
Creative Media Production
10.0% 8.8% 14.2% 13.4%
7.8% 6.1% 14.7% 14.9%
10.0% 18.8% 43.2% 56.6%
7.8% 13.9% 38.1% 53.0%
Electrical/electronic Engineering
12.2% 8.9% 9.9% 9.9%
11.3% 6.3% 8.5% 10.3%
12.2% 21.0% 37.9% 47.9%
11.3% 17.6% 33.7% 44.0%
Engineering
15.7% 6.5% 8.6% 8.2%
14.7% 7.1% 9.5% 9.7%
15.7% 22.2% 38.3% 46.5%
14.7% 21.8% 39.0% 48.7%
62.0%
19.7% 27.4% 38.7% 45.0%
42.9%
Enterprise and Entrepreneurship
26.6% 9.9% 11.4% 9.5%
19.7% 7.7% 5.8% 6.3%
26.6% 36.5% 52.5%
Environmental Sustainability
0.0% 0.0% 0.0% 0.0%
21.4%
0.0% 0.0% 0.0% 0.0%
0.0% 14.3% 21.4%
0.0% 14.3% 7.1%
Fish Management
13.3% 3.3% 6.7% 3.3%
0.0% 13.3% 20.0% 0.0%
13.3% 16.7% 33.3% 36.7%
0.0% 13.3% 40.0% 40.0%
Floristry
41.7% 5.6% 19.4% 2.8%
33.3% 0.0% 11.1% 2.8%
41.7% 47.2% 69.4% 72.2%
33.3% 33.3% 63.9% 66.7%
Forestry and Arboriculture
11.7% 0.0% 11.7% 15.0%
26.0% 4.0% 6.0% 2.0%
11.7% 11.7% 26.7% 41.7%
26.0% 30.0% 44.0% 46.0%
66.7%
27.3% 38.1% 56.6% 64.6%
Health and Social Care
30.8% 11.0% 9.1% 6.3%
27.3% 10.8% 9.1% 8.1%
30.8% 41.8% 60.4%
* ‘Not Completed’ includes learners who have withdrawn or claimed fallback and learners who are yet to complete at the end of the projected course duration.

Cohort Completion DD MP PP UNot
Completed*
BTEC Nationals Results 2014/15
PEARSON BTEC LEVEL 3
DIPLOMA - QCFD*D* D*D DM MM
2014/15 77 64 16.9% 14.3% 13.0% 0.0% 16.9%
2013/14 98 85 7.1% 13.3% 12.2% 0.0% 13.3%
2014/15 Cumulative 77 64 31.2% 70.1% 83.1% 83.1%
2013/14 Cumulative 98 85 37.8% 74.5% 86.7% 86.7%
2014/15 40 29 7.5% 7.5% 10.0% 0.0% 27.5%
2013/14 70 64 8.6% 10.0% 24.3% 0.0% 8.6%
2014/15 Cumulative 40 29 45.0% 62.5% 72.5% 72.5%
2013/14 Cumulative 70 64 47.1% 67.1% 91.4% 91.4%
2014/15 288 235 7.6% 10.4% 14.9% 0.0% 18.4%
2013/14 326 262 3.7% 12.0% 20.2% 0.0% 19.6%
2014/15 Cumulative 288 235 40.6% 66.7% 81.6% 81.6%
2013/14 Cumulative 326 262 27.3% 60.1% 80.4% 80.4%
2014/15 4,328 3,497 8.9% 8.0% 13.6% 0.0% 19.2%
2013/14 4,226 3,468 9.2% 9.4% 17.3% 0.1% 17.9%
2014/15 Cumulative 4,328 3,497 41.1% 67.1% 80.8% 80.8%
2013/14 Cumulative 4,226 3,468 35.2% 64.6% 82.0% 82.1%
2014/15 37 28 0.0% 2.7% 59.5% 0.0% 24.3%
2013/14 15 12 0.0% 13.3% 40.0% 0.0% 20.0%
2014/15 Cumulative 37 28 0.0% 16.2% 75.7% 75.7%
2013/14 Cumulative 15 12 26.7% 40.0% 80.0% 80.0%
2014/15 749 580 5.3% 11.2% 19.1% 0.0% 22.6%
2013/14 732 561 7.0% 11.9% 22.3% 0.1% 23.4%
2014/15 Cumulative 749 580 25.4% 58.3% 77.4% 77.4%
2013/14 Cumulative 732 561 23.2% 54.2% 76.5% 76.6%
2014/15 882 642 6.7% 9.5% 15.0% 0.1% 27.2%
2013/14 1,051 800 8.1% 11.5% 16.0% 0.0% 23.9%
2014/15 Cumulative 882 642 26.0% 57.7% 72.7% 72.8%
2013/14 Cumulative 1,051 800 30.4% 60.1% 76.1% 76.1%
2014/15 801 658 8.4% 15.2% 11.5% 0.2% 17.9%
2013/14 1,019 795 9.3% 15.4% 12.6% 0.1% 22.0%
2014/15 Cumulative 801 658 26.7% 70.4% 81.9% 82.1%
2013/14 Cumulative 1,019 795 25.8% 65.4% 77.9% 78.0%
2014/15 400 324 10.0% 11.8% 14.5% 0.0% 19.0%
2013/14 499 372 8.6% 9.2% 15.6% 0.0% 25.5%
2014/15 Cumulative 400 324 24.8% 66.5% 81.0% 81.0%
2013/14 Cumulative 499 372 23.0% 58.9% 74.5% 74.5%
2014/15 403 339 9.7% 8.2% 15.6% 0.0% 15.9%
2013/14 499 420 8.4% 11.0% 16.4% 0.0% 15.8%
2014/15 Cumulative 403 339 38.2% 68.5% 84.1% 84.1%
2013/14 Cumulative 499 420 31.1% 67.7% 84.2% 84.2%
61.2%
Horse Management
6.5% 7.8% 10.4% 14.3%
6.1%
6.5% 14.3% 41.6% 55.8%
22.4% 30.6% 55.1%
22.4% 8.2% 17.3%
Horticulture
32.5% 5.0% 5.0% 5.0%
35.7% 2.9% 2.9% 7.1%
32.5% 37.5% 50.0% 55.0%
35.7% 38.6% 50.0% 57.1%
Hospitality
21.9% 11.1% 6.6% 9.0%
16.0% 7.7% 9.5% 11.3%
21.9% 33.0% 47.2% 56.3%
16.0% 23.6% 36.8% 48.2%
Information Technology
23.3% 8.8% 9.6% 8.4%
18.6% 7.4% 10.0% 10.0%
23.3% 32.1% 50.7% 59.1%
18.6% 26.0% 45.2% 55.2%
13.5%
6.7% 26.7% 26.7% 26.7%
42.3%
Land-based Technology
0.0% 0.0% 8.1% 5.4%
6.7% 20.0% 0.0% 0.0%
0.0% 0.0% 8.1%
Manufacturing Engineering
12.7% 7.3% 12.0% 9.7%
11.5%
12.7% 20.0% 37.4% 47.1%
9.3% 16.3% 30.9%
9.3% 7.0% 7.7%
Mechanical Engineering
13.6% 5.7% 10.9% 11.3%
15.6% 6.8% 8.3% 9.9%
13.6% 19.3% 36.8% 48.2%
15.6% 22.4% 38.7% 48.6%
Music
11.4% 7.0% 12.4% 16.1%
10.2% 6.3% 11.3% 12.9%
11.4% 18.4% 39.1% 55.2%
10.2% 16.5% 37.1% 50.0%
Music Technology
6.5% 8.3% 15.3% 14.8%
8.8% 5.6% 14.4% 12.2%
6.5% 14.8% 40.0% 54.8%
8.8% 14.4% 37.5% 49.7%
60.3%
15.8% 22.6% 42.7% 56.7%
Operations and Maintenance
Engineering
19.4% 9.2% 10.4% 11.7%
15.8% 6.8% 11.6% 14.0%
19.4% 28.5% 48.6%
* ‘Not Completed’ includes learners who have withdrawn or claimed fallback and learners who are yet to complete at the end of the projected course duration.
Cohort Completion DD MP PP UNot
Completed*
BTEC Nationals Results 2014/15
PEARSON BTEC LEVEL 3
DIPLOMA - QCFD*D* D*D DM MM
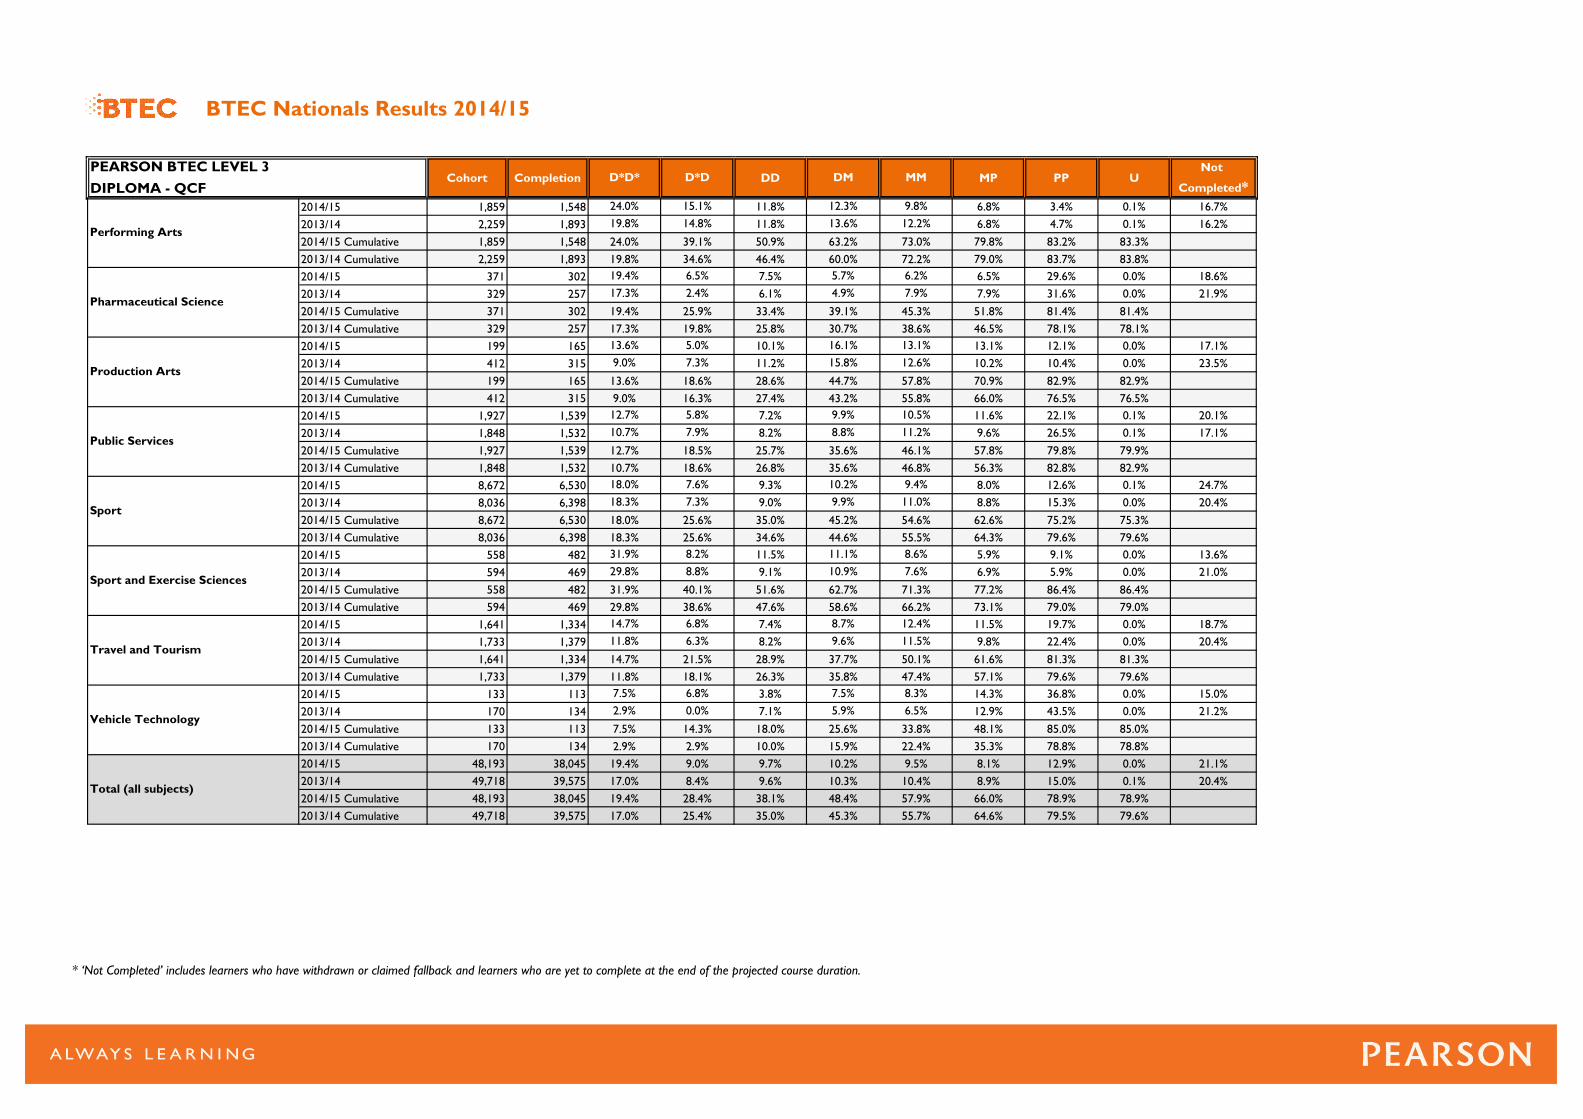
2014/15 1,859 1,548 11.8% 6.8% 3.4% 0.1% 16.7%
2013/14 2,259 1,893 11.8% 6.8% 4.7% 0.1% 16.2%
2014/15 Cumulative 1,859 1,548 50.9% 79.8% 83.2% 83.3%
2013/14 Cumulative 2,259 1,893 46.4% 79.0% 83.7% 83.8%
2014/15 371 302 7.5% 6.5% 29.6% 0.0% 18.6%
2013/14 329 257 6.1% 7.9% 31.6% 0.0% 21.9%
2014/15 Cumulative 371 302 33.4% 51.8% 81.4% 81.4%
2013/14 Cumulative 329 257 25.8% 46.5% 78.1% 78.1%
2014/15 199 165 10.1% 13.1% 12.1% 0.0% 17.1%
2013/14 412 315 11.2% 10.2% 10.4% 0.0% 23.5%
2014/15 Cumulative 199 165 28.6% 70.9% 82.9% 82.9%
2013/14 Cumulative 412 315 27.4% 66.0% 76.5% 76.5%
2014/15 1,927 1,539 7.2% 11.6% 22.1% 0.1% 20.1%
2013/14 1,848 1,532 8.2% 9.6% 26.5% 0.1% 17.1%
2014/15 Cumulative 1,927 1,539 25.7% 57.8% 79.8% 79.9%
2013/14 Cumulative 1,848 1,532 26.8% 56.3% 82.8% 82.9%
2014/15 8,672 6,530 9.3% 8.0% 12.6% 0.1% 24.7%
2013/14 8,036 6,398 9.0% 8.8% 15.3% 0.0% 20.4%
2014/15 Cumulative 8,672 6,530 35.0% 62.6% 75.2% 75.3%
2013/14 Cumulative 8,036 6,398 34.6% 64.3% 79.6% 79.6%
2014/15 558 482 11.5% 5.9% 9.1% 0.0% 13.6%
2013/14 594 469 9.1% 6.9% 5.9% 0.0% 21.0%
2014/15 Cumulative 558 482 51.6% 77.2% 86.4% 86.4%
2013/14 Cumulative 594 469 47.6% 73.1% 79.0% 79.0%
2014/15 1,641 1,334 7.4% 11.5% 19.7% 0.0% 18.7%
2013/14 1,733 1,379 8.2% 9.8% 22.4% 0.0% 20.4%
2014/15 Cumulative 1,641 1,334 28.9% 61.6% 81.3% 81.3%
2013/14 Cumulative 1,733 1,379 26.3% 57.1% 79.6% 79.6%
2014/15 133 113 3.8% 14.3% 36.8% 0.0% 15.0%
2013/14 170 134 7.1% 12.9% 43.5% 0.0% 21.2%
2014/15 Cumulative 133 113 18.0% 48.1% 85.0% 85.0%
2013/14 Cumulative 170 134 10.0% 35.3% 78.8% 78.8%
2014/15 48,193 38,045 9.7% 8.1% 12.9% 0.0% 21.1%
2013/14 49,718 39,575 9.6% 8.9% 15.0% 0.1% 20.4%
2014/15 Cumulative 48,193 38,045 38.1% 66.0% 78.9% 78.9%
2013/14 Cumulative 49,718 39,575 35.0% 64.6% 79.5% 79.6%
72.2%
Performing Arts
24.0% 15.1% 12.3% 9.8%
12.2%
24.0% 39.1% 63.2% 73.0%
19.8% 34.6% 60.0%
19.8% 14.8% 13.6%
Pharmaceutical Science
19.4% 6.5% 5.7% 6.2%
17.3% 2.4% 4.9% 7.9%
19.4% 25.9% 39.1% 45.3%
17.3% 19.8% 30.7% 38.6%
Production Arts
13.6% 5.0% 16.1% 13.1%
9.0% 7.3% 15.8% 12.6%
13.6% 18.6% 44.7% 57.8%
9.0% 16.3% 43.2% 55.8%
Public Services
12.7% 5.8% 9.9% 10.5%
10.7% 7.9% 8.8% 11.2%
12.7% 18.5% 35.6% 46.1%
10.7% 18.6% 35.6% 46.8%
54.6%
18.3% 25.6% 44.6% 55.5%
66.2%
Sport
18.0% 7.6% 10.2% 9.4%
18.3% 7.3% 9.9% 11.0%
18.0% 25.6% 45.2%
11.8% 18.1%
7.6%
31.9% 40.1% 62.7% 71.3%
29.8% 38.6% 58.6%
2.9%
Sport and Exercise Sciences
31.9% 8.2% 11.1% 8.6%
29.8% 8.8% 10.9%
35.8% 47.4%
Travel and Tourism
14.7% 6.8% 8.7% 12.4%
11.8% 6.3% 9.6% 11.5%
14.7% 21.5% 37.7% 50.1%
8.3%
2.9% 0.0% 5.9% 6.5%
7.5% 14.3% 25.6% 33.8%
17.0% 25.4% 45.3% 55.7%
2.9% 15.9% 22.4%
Total (all subjects)
19.4% 9.0% 10.2% 9.5%
17.0% 8.4% 10.3% 10.4%
19.4% 28.4% 48.4% 57.9%
Vehicle Technology
7.5% 6.8% 7.5%
* ‘Not Completed’ includes learners who have withdrawn or claimed fallback and learners who are yet to complete at the end of the projected course duration.

Cohort Completion D*DD DMM MMM MMP MPP PPP UNot
Completed*
2014/15 418 278 6.2% 4.5% 5.3% 6.0% 6.9% 6.2% 0.0% 33.5%
2013/14 407 305 5.2% 7.6% 8.4% 7.6% 7.6% 9.6% 0.2% 25.1%
2014/15 Cumulative 418 278 25.6% 42.1% 47.4% 53.3% 60.3% 66.5% 66.5%
2013/14 Cumulative 407 305 22.9% 41.5% 49.9% 57.5% 65.1% 74.7% 74.9%
2014/15 502 341 3.6% 3.4% 3.8% 4.8% 7.2% 12.4% 0.0% 32.1%
2013/14 558 374 3.8% 5.2% 5.9% 6.3% 6.1% 10.8% 0.0% 33.0%
2014/15 Cumulative 502 341 28.7% 39.8% 43.6% 48.4% 55.6% 67.9% 67.9%
2013/14 Cumulative 558 374 23.5% 38.0% 43.9% 50.2% 56.3% 67.0% 67.0%
2014/15 10 8 10.0% 10.0% 0.0% 20.0% 20.0% 0.0% 0.0% 20.0%
2013/14 24 8 0.0% 4.2% 0.0% 0.0% 4.2% 20.8% 0.0% 66.7%
2014/15 Cumulative 10 8 30.0% 40.0% 40.0% 60.0% 80.0% 80.0% 80.0%
2013/14 Cumulative 24 8 0.0% 8.3% 8.3% 8.3% 12.5% 33.3% 33.3%
2014/15 2,768 2,197 6.4% 6.2% 4.6% 3.5% 4.5% 5.7% 0.0% 20.6%
2013/14 2,987 2,443 5.0% 6.1% 4.7% 4.8% 4.6% 8.6% 0.0% 18.2%
2014/15 Cumulative 2,768 2,197 44.1% 61.2% 65.7% 69.2% 73.7% 79.4% 79.4%
2013/14 Cumulative 2,987 2,443 42.0% 59.1% 63.8% 68.6% 73.2% 81.8% 81.8%
2014/15 5,972 5,184 8.0% 9.3% 7.7% 5.4% 5.3% 8.5% 0.0% 13.2%
2013/14 5,635 4,692 6.9% 10.4% 7.9% 5.7% 5.3% 8.6% 0.0% 16.7%
2014/15 Cumulative 5,972 5,184 32.0% 59.9% 67.6% 73.0% 78.3% 86.8% 86.8%
2013/14 Cumulative 5,635 4,692 27.1% 55.7% 63.6% 69.4% 74.6% 83.3% 83.3%
2014/15 11,550 9,994 6.8% 11.2% 10.8% 8.4% 8.2% 8.0% 0.0% 13.5%
2013/14 12,548 10,820 6.6% 11.4% 10.8% 8.9% 7.8% 8.1% 0.0% 13.8%
2014/15 Cumulative 11,550 9,994 21.0% 51.1% 61.8% 70.2% 78.5% 86.5% 86.5%
2013/14 Cumulative 12,548 10,820 21.1% 50.6% 61.4% 70.3% 78.1% 86.2% 86.2%
2014/15 126 110 2.4% 11.9% 6.3% 5.6% 11.9% 23.0% 0.0% 12.7%
2013/14 36 19 0.0% 0.0% 5.6% 2.8% 2.8% 25.0% 0.0% 47.2%
2014/15 Cumulative 126 110 14.3% 40.5% 46.8% 52.4% 64.3% 87.3% 87.3%
2013/14 Cumulative 36 19 2.8% 16.7% 22.2% 25.0% 27.8% 52.8% 52.8%
2014/15 38 32 13.2% 5.3% 2.6% 0.0% 0.0% 0.0% 0.0% 15.8%
2013/14 12 11 0.0% 0.0% 8.3% 8.3% 0.0% 0.0% 0.0% 8.3%
2014/15 Cumulative 38 32 65.8% 81.6% 84.2% 84.2% 84.2% 84.2% 84.2%
2013/14 Cumulative 12 11 50.0% 75.0% 83.3% 91.7% 91.7% 91.7% 91.7%
2014/15 10,050 8,693 7.1% 8.8% 5.7% 4.7% 5.4% 6.6% 0.0% 13.5%
2013/14 9,734 8,333 6.9% 9.0% 6.9% 4.8% 5.1% 7.8% 0.0% 14.4%
2014/15 Cumulative 10,050 8,693 36.8% 64.0% 69.7% 74.4% 79.8% 86.5% 86.5%
2013/14 Cumulative 9,734 8,333 33.1% 60.9% 67.8% 72.6% 77.8% 85.6% 85.6%
2014/15 1,250 928 5.6% 7.5% 8.0% 4.6% 7.9% 13.0% 0.1% 25.8%
2013/14 1,573 1,083 4.6% 7.3% 6.3% 4.9% 6.4% 12.6% 0.1% 31.2%
2014/15 Cumulative 1,250 928 20.2% 40.7% 48.7% 53.3% 61.2% 74.2% 74.2%
2013/14 Cumulative 1,573 1,083 18.3% 38.6% 44.9% 49.8% 56.2% 68.8% 68.8%
BTEC Nationals Results 2014/15
5.7%
13.6% 19.4% 31.3% 37.6%
11.8% 17.7% 28.3%
PEARSON BTEC LEVEL 3
EXTENDED DIPLOMA - QCFD*D*D* D*D*D DDD DDM
33.9%
Aeronautical Engineering
13.6% 5.7% 5.7% 6.2%
11.8% 5.9% 5.4%
Agriculture
18.3% 6.8% 3.4% 4.4%
14.9% 4.8% 4.3% 5.0%
18.3% 25.1% 32.1% 36.5%
14.9% 19.7% 27.8% 32.8%
Aircraft Maintenance
20.0% 0.0% 0.0% 0.0%
0.0% 0.0% 0.0% 4.2%
20.0% 20.0% 30.0% 30.0%
0.0% 0.0% 0.0% 4.2%
Animal Management
30.3% 7.4% 5.0% 5.8%
30.1% 7.0% 5.4% 5.6%
30.3% 37.7% 49.1% 54.9%
30.1% 37.0% 47.3% 53.0%
50.7%
13.1% 20.2% 35.2% 45.3%
39.2%
Applied Science
16.5% 7.5% 9.0% 9.7%
13.1% 7.2% 8.0% 10.2%
16.5% 24.0% 41.0%
Art and Design
8.4% 5.9% 7.7% 11.1%
10.5%
8.4% 14.2% 28.8% 39.9%
8.6% 14.4% 28.7%
8.6% 5.8% 7.6%
Aviation Operations
9.5% 2.4% 7.1% 7.1%
2.8% 0.0% 2.8% 11.1%
9.5% 11.9% 21.4% 28.6%
2.8% 2.8% 5.6% 16.7%
Blacksmithing and Metalworking
39.5% 13.2% 5.3% 5.3%
41.7% 8.3% 8.3% 16.7%
39.5% 52.6% 71.1% 76.3%
41.7% 50.0% 58.3% 75.0%
Business
22.6% 7.2% 9.7% 8.6%
19.6% 6.6% 9.4% 9.4%
22.6% 29.7% 46.5% 55.2%
19.6% 26.2% 42.5% 51.9%
33.2%
8.5% 13.7% 23.8% 31.3%
Construction and the Built
Environment
9.5% 5.1% 5.5% 7.4%
8.5% 5.1% 5.5% 7.5%
9.5% 14.6% 25.8%
* ‘Not Completed’ includes learners who have withdrawn or claimed fallback and learners who are yet to complete at the end of the projected course duration.

Cohort Completion D*DD DMM MMM MMP MPP PPP UNot
Completed*
BTEC Nationals Results 2014/15
PEARSON BTEC LEVEL 3
EXTENDED DIPLOMA - QCFD*D*D* D*D*D DDD DDM
2014/15 312 240 5.1% 6.7% 6.4% 5.1% 9.6% 13.8% 0.0% 23.1%
2013/14 362 288 4.4% 5.0% 8.3% 6.6% 9.4% 13.3% 0.0% 20.4%
2014/15 Cumulative 312 240 29.2% 42.0% 48.4% 53.5% 63.1% 76.9% 76.9%
2013/14 Cumulative 362 288 26.8% 42.0% 50.3% 56.9% 66.3% 79.6% 79.6%
2014/15 8,260 7,026 4.5% 14.2% 11.6% 10.2% 9.3% 9.2% 0.0% 14.9%
2013/14 8,358 6,989 4.8% 12.5% 11.6% 9.7% 10.3% 9.9% 0.0% 16.4%
2014/15 Cumulative 8,260 7,026 12.3% 44.7% 56.4% 66.6% 75.9% 85.1% 85.1%
2013/14 Cumulative 8,358 6,989 11.7% 42.1% 53.7% 63.4% 73.7% 83.6% 83.6%
2014/15 207 126 4.3% 4.8% 4.3% 5.8% 1.4% 11.6% 0.0% 39.1%
2013/14 169 98 3.6% 7.1% 3.6% 1.8% 8.3% 13.0% 0.0% 42.0%
2014/15 Cumulative 207 126 20.3% 37.7% 42.0% 47.8% 49.3% 60.9% 60.9%
2013/14 Cumulative 169 98 16.6% 31.4% 34.9% 36.7% 45.0% 58.0% 58.0%
2014/15 1,085 878 5.4% 7.6% 8.4% 8.2% 10.8% 11.4% 0.0% 19.1%
2013/14 1,163 906 4.5% 8.6% 10.4% 8.3% 10.7% 12.1% 0.0% 22.1%
2014/15 Cumulative 1,085 878 21.1% 42.1% 50.5% 58.7% 69.5% 80.9% 80.9%
2013/14 Cumulative 1,163 906 16.8% 36.5% 46.9% 55.1% 65.8% 77.9% 77.9%
2014/15 3,244 2,457 6.2% 7.5% 6.1% 7.1% 6.2% 8.6% 0.0% 24.3%
2013/14 2,649 2,034 4.8% 8.3% 7.3% 7.1% 7.2% 12.0% 0.0% 23.2%
2014/15 Cumulative 3,244 2,457 27.0% 47.7% 53.8% 60.9% 67.1% 75.7% 75.7%
2013/14 Cumulative 2,649 2,034 21.8% 43.1% 50.4% 57.6% 64.8% 76.8% 76.8%
2014/15 52 31 9.6% 5.8% 1.9% 1.9% 1.9% 5.8% 0.0% 40.4%
2013/14 12 10 0.0% 0.0% 16.7% 0.0% 8.3% 8.3% 0.0% 16.7%
2014/15 Cumulative 52 31 32.7% 48.1% 50.0% 51.9% 53.8% 59.6% 59.6%
2013/14 Cumulative 12 10 41.7% 50.0% 66.7% 66.7% 75.0% 83.3% 83.3%
2014/15 11 11 0.0% 9.1% 0.0% 9.1% 0.0% 18.2% 0.0% 0.0%
2013/14 32 30 9.4% 9.4% 3.1% 3.1% 6.3% 12.5% 0.0% 6.3%
2014/15 Cumulative 11 11 45.5% 72.7% 72.7% 81.8% 81.8% 100.0% 100.0%
2013/14 Cumulative 32 30 34.4% 68.8% 71.9% 75.0% 81.3% 93.8% 93.8%
2014/15 82 71 2.4% 6.1% 9.8% 12.2% 8.5% 6.1% 0.0% 13.4%
2013/14 63 62 1.6% 7.9% 6.3% 4.8% 4.8% 9.5% 0.0% 1.6%
2014/15 Cumulative 82 71 35.4% 50.0% 59.8% 72.0% 80.5% 86.6% 86.6%
2013/14 Cumulative 63 62 55.6% 73.0% 79.4% 84.1% 88.9% 98.4% 98.4%
2014/15 13 9 0.0% 0.0% 15.4% 0.0% 7.7% 7.7% 0.0% 30.8%
2013/14 30 27 3.3% 3.3% 6.7% 0.0% 0.0% 0.0% 0.0% 10.0%
2014/15 Cumulative 13 9 23.1% 38.5% 53.8% 53.8% 61.5% 69.2% 69.2%
2013/14 Cumulative 30 27 70.0% 83.3% 90.0% 90.0% 90.0% 90.0% 90.0%
2014/15 99 80 1.0% 5.1% 6.1% 7.1% 9.1% 14.1% 0.0% 19.2%
2013/14 114 74 2.6% 1.8% 6.1% 8.8% 10.5% 18.4% 0.0% 35.1%
2014/15 Cumulative 99 80 23.2% 44.4% 50.5% 57.6% 66.7% 80.8% 80.8%
2013/14 Cumulative 114 74 17.5% 21.1% 27.2% 36.0% 46.5% 64.9% 64.9%
37.0%
Countryside Management
19.9% 4.2% 4.8% 1.3%
5.2%
19.9% 24.0% 34.0% 35.3%
17.4% 22.4% 31.8%
17.4% 5.0% 5.0%
Creative Media Production
4.4% 3.3% 7.1% 11.2%
3.9% 3.0% 6.9% 11.0%
4.4% 7.8% 19.4% 30.5%
3.9% 7.0% 18.6% 29.6%
Dental Technology
11.1% 4.8% 5.3% 7.2%
11.2% 1.8% 4.1% 3.6%
11.1% 15.9% 25.6% 32.9%
11.2% 13.0% 20.7% 24.3%
Electrical/electronic Engineering
8.8% 6.9% 6.3% 7.1%
7.8% 4.5% 4.0% 7.1%
8.8% 15.7% 27.4% 34.5%
7.8% 12.3% 20.8% 27.9%
40.2%
12.2% 17.0% 28.0% 34.9%
50.0%
Engineering
15.0% 5.9% 5.9% 7.2%
12.2% 4.8% 6.2% 6.9%
15.0% 20.9% 33.0%
Enterprise and Entrepreneurship
17.3% 5.8% 1.9% 7.7%
0.0%
17.3% 23.1% 34.6% 42.3%
25.0% 41.7% 50.0%
25.0% 16.7% 8.3%
Environmental Sustainability
45.5% 0.0% 18.2% 0.0%
21.9% 3.1% 12.5% 12.5%
45.5% 45.5% 63.6% 63.6%
21.9% 25.0% 46.9% 59.4%
Fish Management
23.2% 9.8% 6.1% 2.4%
38.1% 15.9% 6.3% 3.2%
23.2% 32.9% 41.5% 43.9%
38.1% 54.0% 61.9% 65.1%
Floristry
23.1% 0.0% 7.7% 7.7%
60.0% 6.7% 0.0% 10.0%
23.1% 23.1% 30.8% 38.5%
60.0% 66.7% 70.0% 80.0%
39.4%
11.4% 14.9% 17.5% 19.3%
Forestry and Arboriculture
19.2% 3.0% 8.1% 8.1%
11.4% 3.5% 0.0% 1.8%
19.2% 22.2% 31.3%
* ‘Not Completed’ includes learners who have withdrawn or claimed fallback and learners who are yet to complete at the end of the projected course duration.

Cohort Completion D*DD DMM MMM MMP MPP PPP UNot
Completed*
BTEC Nationals Results 2014/15
PEARSON BTEC LEVEL 3
EXTENDED DIPLOMA - QCFD*D*D* D*D*D DDD DDM
2014/15 15,057 12,400 7.3% 6.5% 5.0% 3.8% 3.5% 5.9% 0.0% 17.6%
2013/14 14,739 12,159 7.0% 7.7% 5.1% 4.2% 4.3% 7.2% 0.0% 17.5%
2014/15 Cumulative 15,057 12,400 41.4% 64.2% 69.2% 73.0% 76.5% 82.3% 82.4%
2013/14 Cumulative 14,739 12,159 37.4% 61.8% 66.8% 71.0% 75.3% 82.5% 82.5%
2014/15 454 384 7.5% 7.3% 5.7% 5.3% 4.6% 4.4% 0.0% 15.4%
2013/14 718 579 4.9% 6.0% 7.2% 7.5% 6.3% 6.4% 0.0% 19.4%
2014/15 Cumulative 454 384 41.9% 64.5% 70.3% 75.6% 80.2% 84.6% 84.6%
2013/14 Cumulative 718 579 35.7% 53.2% 60.4% 68.0% 74.2% 80.6% 80.6%
2014/15 144 112 2.1% 2.8% 6.3% 8.3% 11.8% 17.4% 0.0% 22.2%
2013/14 129 91 3.9% 6.2% 6.2% 9.3% 7.0% 10.9% 0.0% 29.5%
2014/15 Cumulative 144 112 25.0% 34.0% 40.3% 48.6% 60.4% 77.8% 77.8%
2013/14 Cumulative 129 91 21.7% 37.2% 43.4% 52.7% 59.7% 70.5% 70.5%
2014/15 425 354 4.7% 6.1% 5.9% 7.8% 10.4% 15.3% 0.0% 16.7%
2013/14 392 311 5.6% 8.2% 3.3% 6.1% 6.9% 16.3% 0.0% 20.7%
2014/15 Cumulative 425 354 23.5% 44.0% 49.9% 57.6% 68.0% 83.3% 83.3%
2013/14 Cumulative 392 311 26.5% 46.7% 50.0% 56.1% 63.0% 79.3% 79.3%
2014/15 10,917 9,377 6.2% 8.8% 7.0% 6.4% 7.2% 10.3% 0.0% 14.1%
2013/14 10,823 9,186 5.3% 9.1% 8.3% 7.2% 7.8% 11.8% 0.0% 15.1%
2014/15 Cumulative 10,917 9,377 31.0% 55.1% 62.0% 68.4% 75.6% 85.9% 85.9%
2013/14 Cumulative 10,823 9,186 25.8% 49.8% 58.0% 65.2% 73.0% 84.8% 84.9%
2014/15 192 96 1.6% 2.6% 1.0% 4.2% 2.6% 22.4% 0.0% 50.0%
2013/14 316 178 1.6% 4.7% 2.2% 3.8% 5.4% 17.4% 0.0% 43.7%
2014/15 Cumulative 192 96 12.0% 19.8% 20.8% 25.0% 27.6% 50.0% 50.0%
2013/14 Cumulative 316 178 18.0% 27.5% 29.7% 33.5% 38.9% 56.3% 56.3%
2014/15 541 433 3.9% 6.7% 6.5% 8.5% 11.6% 10.5% 0.0% 20.0%
2013/14 467 381 5.1% 6.9% 6.6% 7.5% 8.6% 11.1% 0.0% 18.4%
2014/15 Cumulative 541 433 23.8% 42.9% 49.4% 57.9% 69.5% 80.0% 80.0%
2013/14 Cumulative 467 381 29.3% 47.8% 54.4% 61.9% 70.4% 81.6% 81.6%
2014/15 449 391 8.9% 10.0% 6.9% 6.7% 6.5% 8.2% 0.0% 12.9%
2013/14 395 290 5.6% 8.6% 6.8% 6.6% 7.6% 7.1% 0.0% 26.6%
2014/15 Cumulative 449 391 33.9% 58.8% 65.7% 72.4% 78.8% 87.1% 87.1%
2013/14 Cumulative 395 290 23.3% 45.3% 52.2% 58.7% 66.3% 73.4% 73.4%
2014/15 2,690 2,339 5.2% 11.4% 15.5% 11.2% 9.0% 6.5% 0.0% 13.0%
2013/14 3,227 2,612 5.3% 10.8% 10.6% 10.5% 10.3% 8.1% 0.0% 19.1%
2014/15 Cumulative 2,690 2,339 15.7% 44.8% 60.3% 71.5% 80.5% 87.0% 87.0%
2013/14 Cumulative 3,227 2,612 14.2% 41.4% 52.1% 62.6% 72.8% 80.9% 80.9%
2014/15 2,152 1,804 5.2% 11.4% 12.0% 11.1% 10.3% 7.9% 0.0% 16.2%
2013/14 2,623 2,093 4.2% 13.2% 10.9% 9.4% 9.9% 9.0% 0.0% 20.2%
2014/15 Cumulative 2,152 1,804 13.9% 42.6% 54.6% 65.7% 75.9% 83.8% 83.8%
2013/14 Cumulative 2,623 2,093 12.2% 40.6% 51.5% 60.9% 70.8% 79.8% 79.8%
54.1%
Health and Social Care
25.1% 9.0% 7.5% 8.7%
8.5%
25.1% 34.1% 48.9% 57.6%
22.0% 30.4% 45.6%
22.0% 8.4% 8.2%
Horse Management
24.2% 10.1% 7.3% 8.1%
23.7% 7.1% 4.9% 6.7%
24.2% 34.4% 49.1% 57.3%
23.7% 30.8% 40.5% 47.2%
Horticulture
20.1% 2.8% 1.4% 4.9%
14.7% 3.1% 2.3% 7.0%
20.1% 22.9% 26.4% 31.3%
14.7% 17.8% 24.0% 31.0%
Hospitality
14.4% 4.5% 7.1% 7.3%
14.3% 6.6% 5.1% 6.9%
14.4% 18.8% 30.6% 37.9%
14.3% 20.9% 31.6% 38.5%
46.3%
15.3% 20.5% 32.4% 40.6%
22.8%
Information Technology
18.6% 6.2% 6.8% 8.4%
15.3% 5.2% 6.6% 8.2%
18.6% 24.8% 37.8%
Land-based Technology
6.8% 3.6% 1.6% 3.6%
3.2%
6.8% 10.4% 13.5% 17.2%
12.0% 16.5% 19.6%
12.0% 4.4% 1.6%
Manufacturing Engineering
15.9% 4.1% 5.2% 7.2%
17.6% 6.6% 6.2% 5.4%
15.9% 20.0% 29.0% 36.2%
17.6% 24.2% 35.5% 40.9%
Mechanical Engineering
17.6% 7.3% 6.2% 8.7%
11.6% 6.1% 5.8% 7.6%
17.6% 24.9% 40.1% 48.8%
11.6% 17.7% 29.1% 36.7%
Music
6.0% 4.5% 7.7% 10.0%
5.3% 3.6% 6.5% 9.9%
6.0% 10.5% 23.4% 33.4%
5.3% 8.9% 20.7% 30.6%
31.2%
4.7% 8.0% 18.6% 27.5%
Music Technology
5.1% 3.7% 7.3% 9.9%
4.7% 3.2% 6.4% 8.9%
5.1% 8.8% 21.3%
* ‘Not Completed’ includes learners who have withdrawn or claimed fallback and learners who are yet to complete at the end of the projected course duration.

Cohort Completion D*DD DMM MMM MMP MPP PPP UNot
Completed*
BTEC Nationals Results 2014/15
PEARSON BTEC LEVEL 3
EXTENDED DIPLOMA - QCFD*D*D* D*D*D DDD DDM
2014/15 83 67 3.6% 12.0% 8.4% 12.0% 8.4% 14.5% 0.0% 19.3%
2013/14 112 69 5.4% 6.3% 6.3% 5.4% 12.5% 9.8% 0.0% 38.4%
2014/15 Cumulative 83 67 12.0% 37.3% 45.8% 57.8% 66.3% 80.7% 80.7%
2013/14 Cumulative 112 69 11.6% 27.7% 33.9% 39.3% 51.8% 61.6% 61.6%
2014/15 6,078 5,221 8.5% 11.3% 8.5% 6.0% 3.8% 1.7% 0.0% 14.1%
2013/14 6,638 5,766 9.3% 11.8% 9.2% 6.7% 4.1% 2.0% 0.0% 13.1%
2014/15 Cumulative 6,078 5,221 32.4% 65.8% 74.3% 80.3% 84.1% 85.9% 85.9%
2013/14 Cumulative 6,638 5,766 31.3% 64.9% 74.1% 80.8% 84.9% 86.8% 86.9%
2014/15 662 540 7.6% 10.0% 12.5% 7.6% 5.4% 4.5% 0.0% 18.4%
2013/14 719 568 6.5% 9.7% 9.9% 6.8% 6.8% 5.8% 0.0% 21.0%
2014/15 Cumulative 662 540 24.0% 51.5% 64.0% 71.6% 77.0% 81.6% 81.6%
2013/14 Cumulative 719 568 19.7% 49.7% 59.5% 66.3% 73.2% 79.0% 79.0%
2014/15 6,420 5,434 5.4% 7.3% 7.5% 7.3% 8.4% 19.4% 0.0% 15.4%
2013/14 6,819 5,796 4.7% 7.4% 7.8% 7.3% 8.8% 21.1% 0.0% 15.0%
2014/15 Cumulative 6,420 5,434 22.8% 42.0% 49.5% 56.8% 65.2% 84.6% 84.6%
2013/14 Cumulative 6,819 5,796 20.6% 39.9% 47.7% 55.0% 63.9% 85.0% 85.0%
2014/15 13,608 11,348 5.9% 8.6% 8.0% 6.2% 6.9% 9.4% 0.0% 16.6%
2013/14 13,299 11,036 5.3% 8.3% 8.5% 6.8% 6.8% 10.2% 0.0% 17.0%
2014/15 Cumulative 13,608 11,348 28.7% 52.9% 60.9% 67.1% 74.0% 83.4% 83.4%
2013/14 Cumulative 13,299 11,036 27.0% 50.7% 59.2% 66.0% 72.8% 83.0% 83.0%
2014/15 3,189 2,799 7.1% 7.7% 7.0% 4.7% 4.9% 6.4% 0.1% 12.2%
2013/14 3,128 2,682 5.9% 8.3% 6.3% 5.7% 6.3% 6.1% 0.0% 14.3%
2014/15 Cumulative 3,189 2,799 40.2% 64.7% 71.7% 76.4% 81.3% 87.7% 87.8%
2013/14 Cumulative 3,128 2,682 35.0% 61.3% 67.6% 73.3% 79.6% 85.7% 85.7%
2014/15 2,868 2,414 5.0% 9.2% 8.4% 6.5% 7.7% 11.6% 0.0% 15.8%
2013/14 3,238 2,741 4.8% 8.6% 7.6% 6.8% 8.7% 13.4% 0.0% 15.3%
2014/15 Cumulative 2,868 2,414 26.5% 50.0% 58.4% 64.9% 72.6% 84.2% 84.2%
2013/14 Cumulative 3,238 2,741 23.5% 48.1% 55.7% 62.5% 71.2% 84.7% 84.7%
2014/15 376 245 6.1% 5.3% 5.1% 3.5% 4.8% 11.2% 0.0% 34.8%
2013/14 466 350 3.9% 6.0% 4.9% 5.6% 5.6% 20.8% 0.0% 24.9%
2014/15 Cumulative 376 245 23.1% 40.7% 45.7% 49.2% 54.0% 65.2% 65.2%
2013/14 Cumulative 466 350 20.6% 38.2% 43.1% 48.7% 54.3% 75.1% 75.1%
2014/15 112,354 94,452 6.4% 9.1% 7.9% 6.4% 6.5% 8.6% 0.0% 15.9%
2013/14 114,714 95,494 5.9% 9.3% 8.1% 6.8% 6.9% 9.6% 0.0% 16.8%
2014/15 Cumulative 112,354 94,452 29.2% 54.6% 62.5% 68.9% 75.5% 84.0% 84.1%
2013/14 Cumulative 114,714 95,494 26.2% 51.8% 59.9% 66.7% 73.6% 83.2% 83.2%
21.4%
Operations and Maintenance
Engineering
3.6% 4.8% 7.2% 6.0%
4.5%
3.6% 8.4% 19.3% 25.3%
4.5% 6.3% 17.0%
4.5% 1.8% 5.4%
Performing Arts
15.1% 8.9% 10.0% 12.0%
12.7% 9.2% 9.1% 12.7%
15.1% 24.0% 42.5% 54.5%
12.7% 21.9% 40.4% 53.1%
Production Arts
9.1% 7.4% 8.2% 9.4%
7.4% 5.8% 9.0% 11.1%
9.1% 16.5% 32.2% 41.5%
7.4% 13.2% 28.8% 39.9%
Public Services
10.9% 6.5% 5.0% 6.9%
9.7% 6.3% 5.5% 6.3%
10.9% 17.4% 27.8% 34.6%
9.7% 16.0% 26.2% 32.5%
44.2%
16.3% 21.7% 34.1% 42.4%
52.9%
Sport
17.3% 5.5% 7.0% 8.6%
16.3% 5.4% 7.2% 8.2%
17.3% 22.8% 35.7%
14.1% 18.7%
9.5%
25.5% 33.2% 48.4% 57.0%
22.6% 29.0% 43.5%
12.4%
Sport and Exercise Sciences
25.5% 7.7% 8.2% 8.6%
22.6% 6.5% 8.5%
30.3% 39.4%
Travel and Tourism
16.3% 5.2% 6.5% 7.9%
14.1% 4.6% 6.8% 9.2%
16.3% 21.4% 33.0% 40.9%
7.2%
12.4% 4.3% 5.2% 6.4%
11.2% 17.0% 28.2% 35.4%
14.2% 20.3% 33.5% 42.5%
16.7% 25.8% 32.2%
Total (all subjects)
16.3% 6.5% 7.4% 9.0%
14.2% 6.0% 7.3% 9.0%
16.3% 22.8% 36.6% 45.6%
Vehicle Technology
11.2% 5.9% 5.1%
* ‘Not Completed’ includes learners who have withdrawn or claimed fallback and learners who are yet to complete at the end of the projected course duration.

Cohort Completion D M P
423 225 0.0% 6.1% 20.6%
440 259 0.0% 2.3% 22.5%
423 225 0.7% 6.9% 27.4%
440 259 0.0% 2.3% 24.8%
423 225 0.0% 6.1% 20.6%
440 259 0.0% 2.3% 22.5%
423 225 0.7% 6.9% 27.4%
440 259 0.0% 2.3% 24.8%
Cohort Completion D M P
2014/15 1,108 685 6.0% 22.7% 10.3%
2013/14 424 234 9.2% 20.0% 14.4%
2014/15 Cumulative 1,108 685 6.2% 28.9% 39.2%
2013/14 Cumulative 424 234 10.1% 30.2% 44.6%
2014/15 1,108 685 6.0% 22.7% 10.3%
2013/14 424 234 9.2% 20.0% 14.4%
2014/15 Cumulative 1,108 685 6.2% 28.9% 39.2%
2013/14 Cumulative 424 234 10.1% 30.2% 44.6%
BTEC Nationals Results 2014/15
PEARSON BTEC LEVEL 3 NATIONAL
SUBSIDIARY AWARD (180 GLH) - NQFD* U
Not
Completed*
Children's Play, Learning and
Development
2014/15 0.7% 25.8%
2014/15 Cumulative 0.7% 53.2%
46.8%
2013/14 0.0% 34.1% 41.1%
2013/14 Cumulative 0.0% 58.9%
Total (all subjects)
2014/15 0.7% 25.8%
2014/15 Cumulative 0.7% 53.2%
2013/14 Cumulative 0.0% 58.9%
46.8%
2013/14 0.0% 34.1% 41.1%
55.2%
10.6%
55.2%
61.8%0.3%
D*PEARSON BTEC LEVEL 3 NATIONAL
AWARD (360 GLH) - NQF
38.2%22.7%0.3%
UNot
Completed*
10.6%
0.9%
Total (all subjects)
44.8%
38.2%
44.8%0.9%
61.8%0.3%
Children's Play, Learning and
Development
0.9%
22.7%0.3%
0.9%
* ‘Not Completed’ includes learners who have withdrawn or claimed fallback and learners who are yet to complete at the end of the projected course duration.

Cohort Completion DD MP PP UNot
Completed*
2014/15 1,228 675 6.8% 5.5% 7.4% 22.6% 45.0%
2013/14 121 61 9.1% 5.8% 19.8% 6.6% 49.6%
2014/15 Cumulative 1,228 675 8.5% 24.9% 32.3% 55.0%
2013/14 Cumulative 121 61 11.6% 24.0% 43.8% 50.4%
2014/15 1,228 675 6.8% 5.5% 7.4% 22.6% 45.0%
2013/14 121 61 9.1% 5.8% 19.8% 6.6% 49.6%
2014/15 Cumulative 1,228 675 8.5% 24.9% 32.3% 55.0%
2013/14 Cumulative 121 61 11.6% 24.0% 43.8% 50.4%
Cohort Completion DD MP PP UNot
Completed*
2014/15 117 40 2.6% 3.4% 7.7% 6.0% 65.8%
2013/14 77 51 3.9% 13.0% 20.8% 1.3% 33.8%
2014/15 Cumulative 117 40 5.1% 20.5% 28.2% 34.2%
2013/14 Cumulative 77 51 15.6% 44.2% 64.9% 66.2%
2014/15 117 40 2.6% 3.4% 7.7% 6.0% 65.8%
2013/14 77 51 3.9% 13.0% 20.8% 1.3% 33.8%
2014/15 Cumulative 117 40 5.1% 20.5% 28.2% 34.2%
2013/14 Cumulative 77 51 15.6% 44.2% 64.9% 66.2%23.4% 31.2%
31.2%
Total (all subjects)
0.9% 1.7% 3.4% 8.5%
1.3% 10.4% 7.8% 7.8%
0.9% 2.6% 8.5% 17.1%
1.3% 11.7%
Children's Play, Learning and
Development
0.9% 1.7%
0.9% 2.6%
3.4% 8.5%
1.3% 10.4% 7.8% 7.8%
8.5% 17.1%
1.3% 11.7% 23.4%
PEARSON BTEC LEVEL 3 NATIONAL
CERTIFICATE (720 GLH) - NQFD*D* D*D DM MM
BTEC Nationals Results 2014/15
PEARSON BTEC LEVEL 3 NATIONAL
SUBSIDIARY CERTIFICATE (540 GLH) - NQFD*D* D*D DM MM
14.2% 19.4%
1.7% 2.5% 15.7%
5.7% 5.2%
1.7% 0.8% 4.1% 2.5%
1.7% 2.5%
Children's Play, Learning and
Development
1.4% 0.2%
1.4% 1.6%
15.7% 18.2%
18.2%
Total (all subjects)
1.4% 0.2% 5.7% 5.2%
1.7% 0.8% 4.1% 2.5%
1.4% 1.6% 14.2% 19.4%
* ‘Not Completed’ includes learners who have withdrawn or claimed fallback and learners who are yet to complete at the end of the projected course duration.

Cohort Completion D*DD DMM MMM MMP MPP PPP UNot
Completed*
2014/15 397 197 3.5% 4.5% 2.5% 4.0% 1.8% 8.1% 6.3% 50.4%
2013/14 410 279 2.4% 6.6% 3.9% 5.4% 9.0% 14.1% 5.1% 32.0%
2014/15 Cumulative 397 197 17.4% 27.0% 29.5% 33.5% 35.3% 43.3% 49.6%
2013/14 Cumulative 410 279 14.1% 30.5% 34.4% 39.8% 48.8% 62.9% 68.0%
2014/15 397 197 3.5% 4.5% 2.5% 4.0% 1.8% 8.1% 6.3% 50.4%
2013/14 410 279 2.4% 6.6% 3.9% 5.4% 9.0% 14.1% 5.1% 32.0%
2014/15 Cumulative 397 197 17.4% 27.0% 29.5% 33.5% 35.3% 43.3% 49.6%
2013/14 Cumulative 410 279 14.1% 30.5% 34.4% 39.8% 48.8% 62.9% 68.0%
BTEC Nationals Results 2014/15
PEARSON BTEC LEVEL 3 NATIONAL
DIPLOMA (1080 GLH) - NQFD*D*D* D*D*D DDD DDM
18.6% 22.4%
8.8% 11.7% 17.1%
1.3% 3.8%
8.8% 2.9% 2.9% 6.8%
8.8% 11.7%
Children's Play, Learning and
Development
8.6% 5.3%
8.6% 13.9%
17.1% 23.9%
23.9%
Total (all subjects)
8.6% 5.3% 1.3% 3.8%
8.8% 2.9% 2.9% 6.8%
8.6% 13.9% 18.6% 22.4%
* ‘Not Completed’ includes learners who have withdrawn or claimed fallback and learners who are yet to complete at the end of the projected course duration.