Embed Size (px)
Citation preview

Process Operator & Address Main Contact at Site Type of Process
Installation Name
Permit Number
Permit Reference
Date(s) of Test(s) / Sampling:
Report Date Parameters MeasuredVersion
Report By:
MCERTS Number:
MCERTS Level:
Technical Endorsements:
Report Approved By:
MCERTS Number:
Business Title:
Technical Endorsements:
Signature: ESG Job Number
ESG Laboratory Performing this Work: Your Contact at ESG: For technical enquiries contact:
East Kilbride Laboratory David Hay Andy Tiffen
2-4 Langlands Place Senior Team Leader Tel: 0161 443 0980
Kelvin South Business Park Tel: 01355 247 514 Fax: 0161 480 4642
East Kilbride Fax: 01355 249 669 Email: [email protected]
G75 0YF Email: [email protected]
Tel: 01355 246 730
770
Section 1A
Tel: +353 21 4862374
Peripheral Measurements
Volatile Organic Compounds (VOCs)
Hydrogen Chloride
Sulphur Dioxide
Oxides of Nitrogen
Total Particulate Matter
Email: [email protected]
Carbon Monoxide
Linearity of Gaseous Analysers:
Linearity of Total Particulate Matter Analyser:
CEMs Functional Checks: 5th June 2013
N/A
5th June 2013
11th - 14th June 2013
10th - 14th June 2013
LEK09311
MM 07 885
Mcerts Level 2 - Team Leader
TE's 1, 2, 3 & 4
MM 05 640
MCERTS Level 2 - Team Leader
TE's 1, 2 & 4
BS EN 14181:2004 - QAL2 CEMs Calibration Report
Novartis
Ringaskiddy
County Cork
Noel Aherne
Ireland
Waste Incinerator
SWI
-
Comparative Measurements of Gaseous Parameters:
Andy Tiffen
12th July 2013
1
Comparative Measurements of Total Particulate Matter:
Cormac Dunne
Page 1 of 82
LEK09311
5th - 14th June 2013
Permit No. 770
Novartis
Ringaskiddy
-
For
insp
ectio
n pur
pose
s only
.
Conse
nt of
copy
right
owne
r req
uired
for a
ny ot
her u
se.
EPA Export 04-01-2017:02:05:34

Title Page
Contents
Section 1 - Executive Summary
UKAS and ESG Disclaimer Statement
Calibration Summary
Deviation from the Standard Reference Methods
Deviations from BS EN 14181:2004
Inpact of Deviations on the Results
Actions Required
Section 2 - Regulatory Information
Regulated Determinands, Emission Limit Values and Required Measurement Uncertainty
Process Description
Standard Reference Method (SRM) Sampling Location
Duct Characteristics
Sampling Lines and Sample Points
Sampling Platform Information
Sampling Location / Platform Improvement Recommendations
Sampling Location Compliance with BS EN 15259:2007
Diagram / Photographs of Emission Point and Platform
Information about the CEMs
Description of the CEMs
CEMs Measurement of Stack Temperature and Pressure
CEMs & CEMs Probe Location
CEMs Self Checking / Calibration Periods
Sites Reference Materials
7
8
9
9
10
7
7
9
4
5
6
6
6
Contents
Page Number
1
2
4
9
9
7
7
7
6
7
7
7
Page 2 of 82
LEK09311
5th - 14th June 2013
Permit No. 770
Novartis
Ringaskiddy
-
For
insp
ectio
n pur
pose
s only
.
Conse
nt of
copy
right
owne
r req
uired
for a
ny ot
her u
se.
EPA Export 04-01-2017:02:05:34

Section 3 - Information About the Monitoring Campaign
Stack Emissions Monitoring Team
Description of the Standard Reference Method (SRM)
Standard Reference Method (SRM) Monitoring Methods
Sampling Methods with Subsequent Analysis
On Site Testing
Section 4 - Data Handling
Procedure for Selecting Datapairs.
Section 4A - Data and Calculations
Section 5 - Functional Test Report Audit
Section 6 - Calibrateable Equipment Checklist
79
82
12
12
13
11
12
12
Contents (continued)
Page Number
11
13
14
Page 3 of 82
LEK09311
5th - 14th June 2013
Permit No. 770
Novartis
Ringaskiddy
-
For
insp
ectio
n pur
pose
s only
.
Conse
nt of
copy
right
owne
r req
uired
for a
ny ot
her u
se.
EPA Export 04-01-2017:02:05:34
Opinions and interpretations expressed herein are outside the scope of UKAS accreditation.
Section 1 - Executive Summary
UKAS & ESG Disclaimer Statement
This test report shall not be reproduced, except in full, without the written approval of Environmental Scientifics Group Limited.
Page 4 of 82
LEK09311
5th - 14th June 2013
Permit No. 770
Novartis
Ringaskiddy
-
For
insp
ectio
n pur
pose
s only
.
Conse
nt of
copy
right
owne
r req
uired
for a
ny ot
her u
se.
EPA Export 04-01-2017:02:05:34
Section 1B
Y
Y
Y
N
N
N/A
150.3
5.2
10.7
2.2
-2.0
20.8
26.7
A or B
used?
N/A
B
N/A
N/A
N/A
N/A
B
B
Parameter Calibration
Reportable Conditions
VOCsPasses
Variability TestN/A 30
Where the Operator decides to use the calibration functions, then the Environment Agency of England and Wales have
asked that this test house make the Operator aware of the following statement. "Once applied, the calibration only
remains valid so long as the CEM is not adjusted, unless any adjustments are triggered and permitted through the
QAL3 procedure, in order to return the zero and span readings to the original baselines that were in place during the
QAL2 and when the calibration function was applied."
If the difference between the standardised CEM values (before applying the calibration function) and the standardised
SRM measurements do not differ by more than half of the allowable 95% confidence interval of the daily average ELV,
then it may not be necessary to apply the calibration function. This is because the differences bewteen the SRM and
CEM results can be attributed to the uncertainty of the SRM and CEM measurements. If such cases occur, then it is
advisable to contact the local site inspector for approval for this approach.
MoisturePasses
Variability TestN/A 30
Variability Calibration Interval
of the
N/A N/A 30
Hydrogen ChloridePasses
Variability TestN/A 40
Sulphur DioxidePasses
Variability TestN/A 20
Carbon MonoxidePasses
Variability TestN/A 20
Oxides of NitrogenPasses
Variability TestN/A 20
Total Particulate Matter
OxygenPasses
Variability TestN/A 10
Test
(AST only)
Test Acceptance %
Extended Range
Derived
of Calibration at
Sulphur Dioxide y=1.010x +0.451 50.0
Hydrogen Chloride y = 1.479x -1.553 8.5
VOCs y=1.015x -0.006
Validated Range
of Calibration at
Ref Conditions
Is Function
Derived From
Linearity?
N/A
N
Y
10.0
Parameter Outcome Outcome Legislation
Oxygen y = 0.953x +0.219 20.9
Moisture y = 0.961x +0.221 N/A
- - SWI
5th - 14th June 2013
Function
Method
Carbon Monoxide y=1.007x -1.402 50.0
Total Particulate Matter N/A N/A
Oxides of Nitrogen y = 1.165x +1.437 286.4
Section 1 - Executive Summary
QAL2 Calibration Summary
Novartis, Ringaskiddy
of the Confidence
Do the standardised
CEM and SRM values
differ by less than half
the allowable
confidence interval?
N/A
No
Yes
Yes
No
Yes
No
Yes
Page 5 of 82
LEK09311
5th - 14th June 2013
Permit No. 770
Novartis
Ringaskiddy
-
For
insp
ectio
n pur
pose
s only
.
Conse
nt of
copy
right
owne
r req
uired
for a
ny ot
her u
se.
EPA Export 04-01-2017:02:05:34

Section 1C
None
Deviations from the Standard Reference Methods
Deviations from BS EN 14181:2004
None
Impact of Deviations on the Results
N/A
Actions Required
The CEM system has passed the requirements of the QAL2. The calibration function derived should now be
applied to all CEM data. No additional actions are required
Project Deviations
Page 6 of 82
LEK09311
5th - 14th June 2013
Permit No. 770
Novartis
Ringaskiddy
-
For
insp
ectio
n pur
pose
s only
.
Conse
nt of
copy
right
owne
r req
uired
for a
ny ot
her u
se.
EPA Export 04-01-2017:02:05:34

Novartis
Ringaskiddy
County Cork, Ireland,
Waste Incineration
2.2.2 Type of Fuel
Fuel Ratio
Is a mulitple calibration function required
2.2.3 Abatement
Section 2.3.1 Stack and sampling ports
Duct Characteristics Sampling Lines & Sample Points
Section 2.3.2 Monitoring platform and site-provisions
Sampling Location / Platform Improvement Recommendations
Section 2.3.3 Sample - how representative is it?
Sampling Location Compliance with BS EN 15259:2007
770
2.1.1 Name of the operator
2.1.2 Name of the installation
2.1.3 Address of the installation
2.1.4 Sector for the installation
2.1.5 Permit Number
2.1.6 Date of the last QAL2/AST
Percentage of Load Varied throughout test
Nature of process Continuous
2.2.1 Process type and variations in emissions
Abatement Type OtherCatalytic Thermal Oxidisers
If emissions are at or near zero what provisions are in place to deal with
this and does the operator know and understand the implications?
Performed Linearity checks on all components
Fuel Type
Is there easy & Safe access to the CEM?
Do site have adequate reference materials?
Do site hold suitable tools
Do site stock spare parts
See page 10 for reference materials stocked at site
Yes
Yes
YesCan ref gases be injected at inlet & probe? Yes
Ratio of highest to lowest flows 0
mm
Exposed to elementsSufficient Weather Protection
Natural Gas
N/A
No
Safe & Clean Working Environment Yes
Type Permanent
Location Outside
Sampling Platform Information
m Orientation Horizontal Horizontal
4" BSP 4" BSP
Cross Sectional Area 0.06 m2 Number Points / Line 1 1
Width -
70 Filtration LocationPort Depth In-Stack In-Stack
Depth
The sampling location meets all the requirements specified in EA Guidance Note M1.
The cross sectional area of the Standard Reference Method sampling location is less than one square meter, so it
is not necessary to demonstrate that the gas distribution is homogenous.
Are emissions at or near zero
0.27 m Number Used 1 1
Shape Circular - Sample Port Size
Volatile Organic Compounds (VOCs) as C 20 10 30%
Oxygen 25 10%
Value Units TPM Gases
2.3 Monitoring provisions at the installation - perodic monitoring
Any expected variation in emissions None
Water Vapour 30 30%
2.2 Operational Information and site monitoring provisions
No
Other factors that may affect monitoring results None
Yes
Oxides of Nitrogen as NO2 400 20%
Carbon Monoxide 100 50 20%
Sulphur Dioxide 200 50 20%
Hydrogen Chloride 60 10 40%
Will emissions variations influence representative sampling
2.1.7 Regulated Determinands, Emission Limit Values and Required Measurement Uncertainty
Determinand Short Term ELV Daily ELV Virtual ELV Required
Section 2 - 2.1 Regulatory Information
(mg/m3) (mg/m
3) % Uncertainty
Total Particulate Matter 30 10 30%
Page 7 of 82
LEK09311
5th - 14th June 2013
Permit No. 770
Novartis
Ringaskiddy
-
For
insp
ectio
n pur
pose
s only
.
Conse
nt of
copy
right
owne
r req
uired
for a
ny ot
her u
se.
EPA Export 04-01-2017:02:05:34
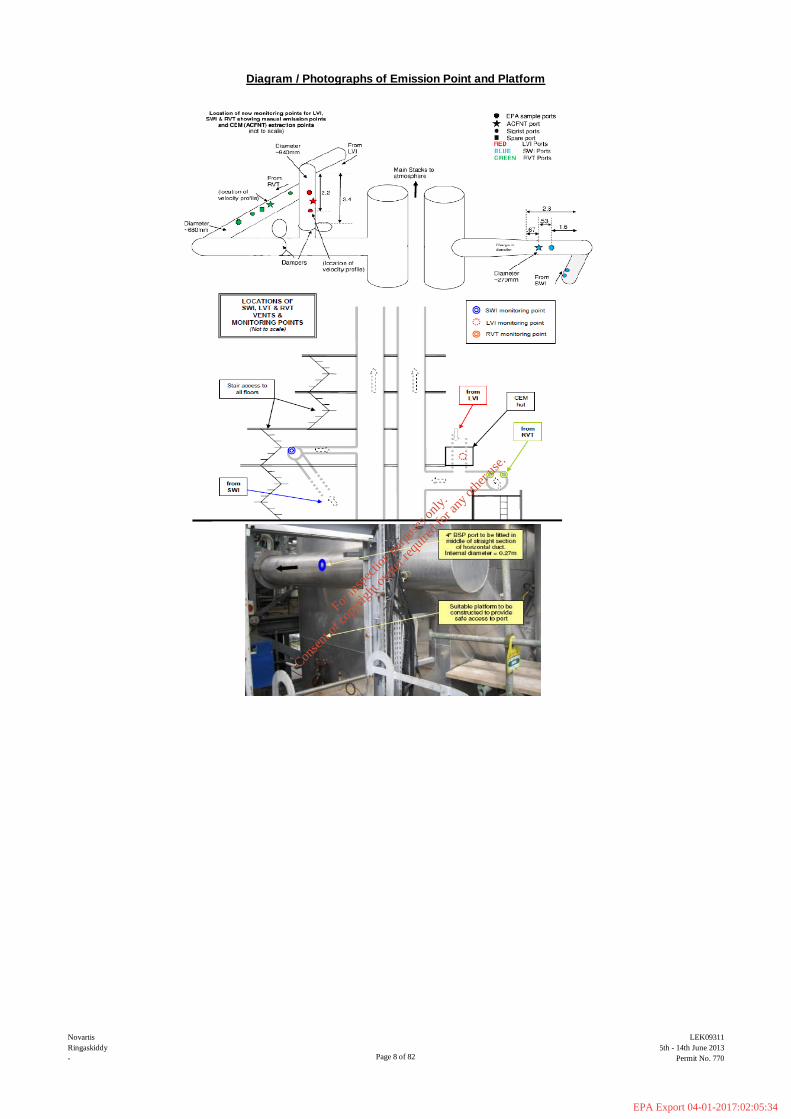
Diagram / Photographs of Emission Point and Platform
Page 8 of 82
LEK09311
5th - 14th June 2013
Permit No. 770
Novartis
Ringaskiddy
-
For
insp
ectio
n pur
pose
s only
.
Conse
nt of
copy
right
owne
r req
uired
for a
ny ot
her u
se.
EPA Export 04-01-2017:02:05:34
TPM
NO
NO2
CO
SO2
HCl
VOCs
Oxygen
The CEMs analyser is located in a clean safe environment with sufficient weather protection.
There is safe access to the CEMs probe / analyser head.
The CEMs sampling location has been subjected to a BS EN 15259 homogeneity test.
Section 2.4.2 Types of monitoring for peripheral determinands
The temperature and pressure of the stack are not recorded.
See below table 4.1 for each component for details of what corrections applied to data to obtain reportable conditions
The CEMs probe / analyser head is located 1 hydraulic diameters downstream of the Standard Reference Method sampling
location.
CEMs Self Checking / Calibration Periods
Any data that is gathered across these periods will not be used as part of the datapairs used in the derivation of any calibration
function(s).
Checks are carried out manually by engineers on a weekly basis
-
-
MC030016/04
Water Vapour extractive ABB ACFNT - - FTIR MC030016/04
extractive ABB ACFNT 20.9% 20.9 Zirconia
CEMs Measurement of Stack Temperature, Pressure & Moisture
CEMs & CEMs Probe Location
MC030016/04
extractive ABB ACFNT 15 15 FTIR MC030016/04
extractive ABB ACFNT 75 75 FTIR
MC030015/02extractive ABB MultiFID 15 15 FID
extractive ABB ACFNT 200 200 FTIR MC030016/04
extractive Sigrist Stackguard 0.05 - Photometer
MC030016/04
extractive ABB ACFNT 75 75 FTIR MC030016/04
extractive ABB ACFNT 200 200 FTIR
Certificate
mg/m3
Number
Range
MC060081/03
2.4.1 Types of CEMs for each main determinand, oxygen and moisture
Pollutant Type of CEM Instrument Minimum Actual Measurement QAL 1
Technique /
Provider Certified mg/m3
MCERTS
CEMs System Model MCERTS Range
2.4 Continuous Emission Monitoring Systems (CEMs) at the installations
Page 9 of 82
LEK09311
5th - 14th June 2013
Permit No. 770
Novartis
Ringaskiddy
-
For
insp
ectio
n pur
pose
s only
.
Conse
nt of
copy
right
owne
r req
uired
for a
ny ot
her u
se.
EPA Export 04-01-2017:02:05:34
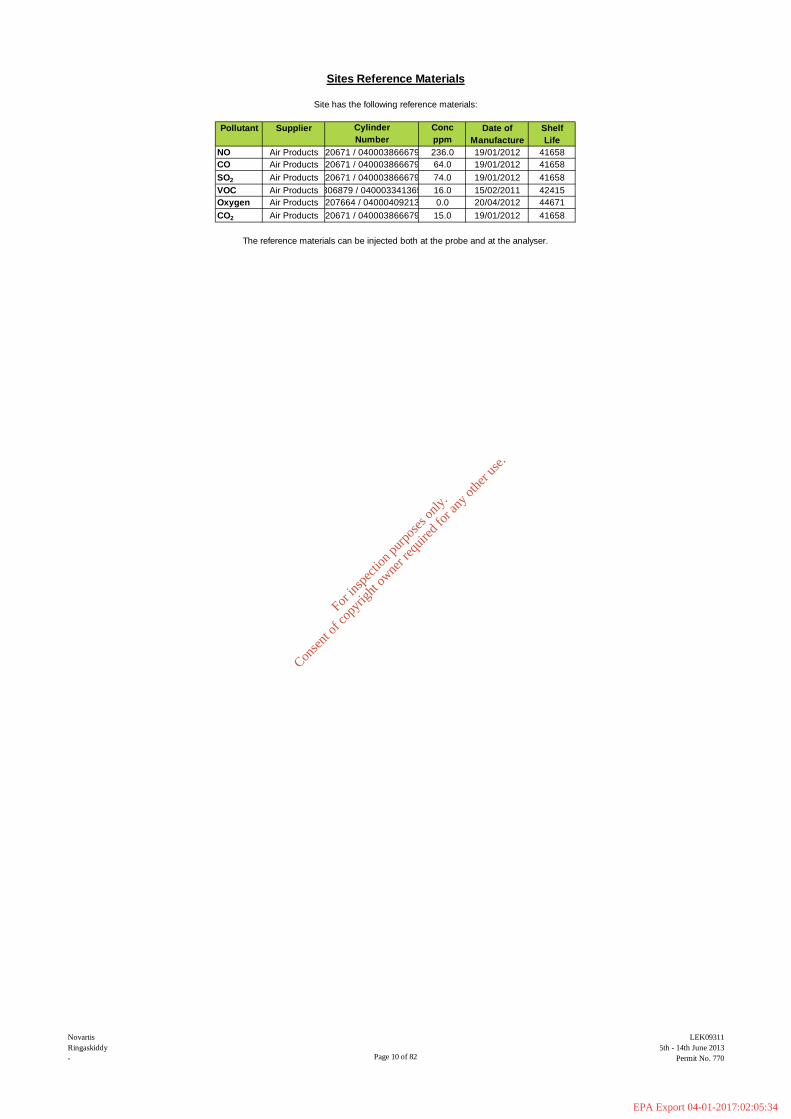
VOC Air Products 306879 / 040003341365 16.0 15/02/2011
Number ppm
42415
19/01/2012 41658
SO2 Air Products 20671 / 040003866679
19/01/2012 41658
The reference materials can be injected both at the probe and at the analyser.
CO2 Air Products 20671 / 040003866679 15.0
20/04/2012 44671Oxygen Air Products 207664 / 04000409213 0.0
Sites Reference Materials
Pollutant Supplier Cylinder Conc Date of Shelf
Site has the following reference materials:
74.0 19/01/2012
CO Air Products 20671 / 040003866679 64.0
41658
NO Air Products 20671 / 040003866679 236.0 19/01/2012 41658
Manufacture Life
Page 10 of 82
LEK09311
5th - 14th June 2013
Permit No. 770
Novartis
Ringaskiddy
-
For
insp
ectio
n pur
pose
s only
.
Conse
nt of
copy
right
owne
r req
uired
for a
ny ot
her u
se.
EPA Export 04-01-2017:02:05:34

Jun-16
N/A
MM 05 640
Mcerts Trainee
N/A
N/A
Dec-17
N/A
Dec-17
N/A
Jun-16
N/A
N/A
N/A
Certification level with expiry date
Cormac Dunne MM 07 885
L1 L2 TE1 TE2 TE3 TE4
N/A Mar-17 Sep-16 Mar-17 Dec-16 Dec-16
Name Reg Number
Andy Tiffen
Tadeusz Tazbierski
Section 3 - Information About the Monitoring Campaign
3.1 Stack Emissions Monitoring Team
Page 11 of 82
LEK09311
5th - 14th June 2013
Permit No. 770
Novartis
Ringaskiddy
-
For
insp
ectio
n pur
pose
s only
.
Conse
nt of
copy
right
owne
r req
uired
for a
ny ot
her u
se.
EPA Export 04-01-2017:02:05:34
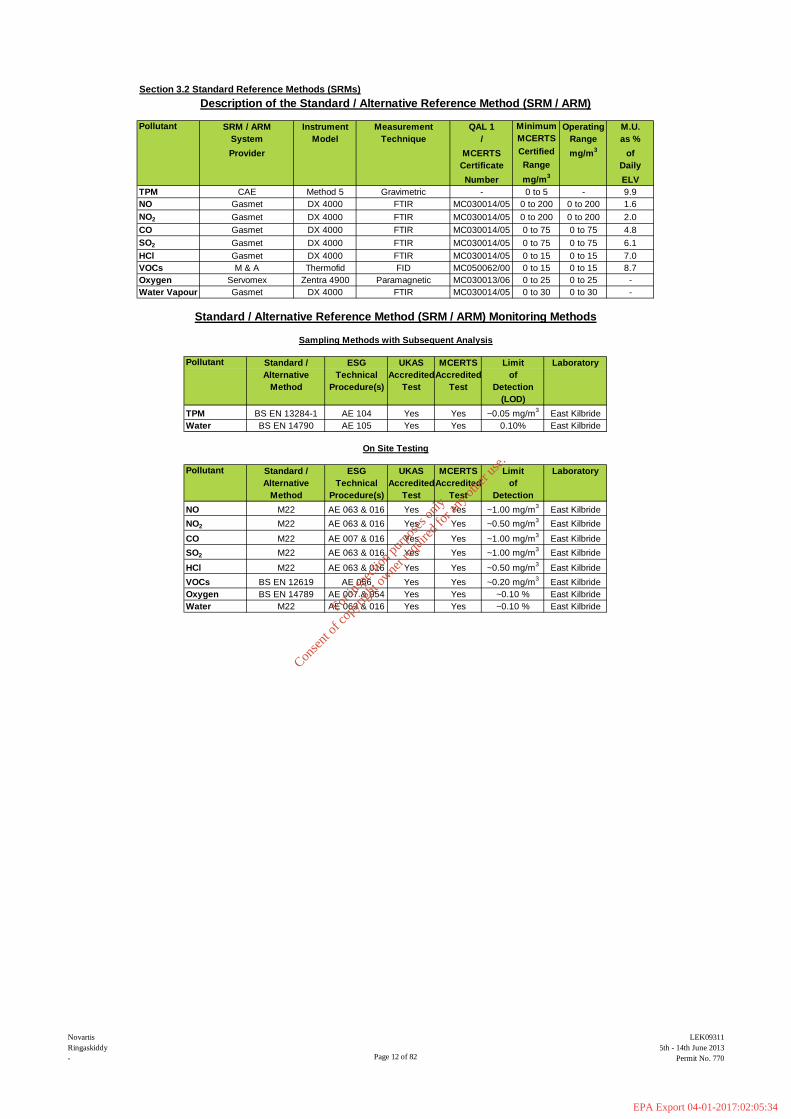
Section 3.2 Standard Reference Methods (SRMs)
TPM
NO
NO2
CO
SO2
HCl
VOCs
Oxygen
DX 4000 FTIR MC030014/05 0 to 200 0 to 200 1.6
System Model Technique / MCERTS Range as %
Gasmet DX 4000 FTIR MC030014/05 0 to 75 0 to 75 4.8
Gasmet DX 4000 FTIR
Gasmet
Pollutant SRM / ARM Instrument Measurement QAL 1 Minimum Operating M.U.
Description of the Standard / Alternative Reference Method (SRM / ARM)
Number mg/m3
ELV
CAE Method 5 Gravimetric - 0 to 5 - 9.9
Provider MCERTS Certified mg/m3
of
Certificate Range Daily
Gasmet DX 4000 FTIR MC030014/05 0 to 200 0 to 200 2.0
Servomex Zentra 4900 Paramagnetic MC030013/06 0 to 25 0 to 25 -
Water Vapour Gasmet DX 4000 FTIR MC030014/05 0 to 30 0 to 30 -
Gasmet DX 4000 FTIR MC030014/05 0 to 15 0 to 15 7.0
M & A Thermofid FID MC050062/00 0 to 15 0 to 15 8.7
MC030014/05 0 to 75 0 to 75 6.1
Alternative Technical AccreditedAccredited of
Standard / Alternative Reference Method (SRM / ARM) Monitoring Methods
Sampling Methods with Subsequent Analysis
Pollutant Standard / ESG UKAS MCERTS Limit Laboratory
(LOD)
Method Procedure(s) Test Test Detection
Water BS EN 14790 AE 105 Yes Yes 0.10% East Kilbride
TPM BS EN 13284-1 AE 104 Yes Yes ~0.05 mg/m3
East Kilbride
Alternative Technical AccreditedAccredited of
On Site Testing
Pollutant Standard / ESG UKAS MCERTS Limit Laboratory
NO M22 AE 063 & 016 Yes Yes ~1.00 mg/m3
East Kilbride
Method Procedure(s) Test Test Detection
CO M22 AE 007 & 016 Yes Yes ~1.00 mg/m3
East Kilbride
NO2 M22 AE 063 & 016 Yes Yes ~0.50 mg/m3
East Kilbride
HCl M22 AE 063 & 016 Yes Yes ~0.50 mg/m3
East Kilbride
SO2 M22 AE 063 & 016 Yes Yes ~1.00 mg/m3
East Kilbride
Oxygen BS EN 14789 AE 007 & 054 Yes Yes ~0.10 % East Kilbride
VOCs BS EN 12619 AE 056 Yes Yes ~0.20 mg/m3
East Kilbride
Water M22 AE 063 & 016 Yes Yes ~0.10 % East Kilbride
Page 12 of 82
LEK09311
5th - 14th June 2013
Permit No. 770
Novartis
Ringaskiddy
-
For
insp
ectio
n pur
pose
s only
.
Conse
nt of
copy
right
owne
r req
uired
for a
ny ot
her u
se.
EPA Export 04-01-2017:02:05:34
When the SRM / ARM is performed using a manual extractive technique, the timing of such samples is stated in full.
Data is averaged in line with the site short term ELV averaging time. i.e. For sites with half hourly ELV's, half hour averages are
used. Sites with 1 hourly ELV's, 1 hour averages are used. If the site does not have a short term ELV, then a minimum of half
hour averages are used.
Section 4 - Data Handling
Procedure for Selecting Datapairs.
Where Environmental Scientifics Group Limited have used continuous analysers to perform the Standard or Alternative
Reference Methods monitoring, they initially average the data as follows:
BS EN 14181 states that if the sampling time is shorter than 1 hour, then the time interval between the start of each sample shall
be at least 1 hour.
When a Homogeneity Test to BS EN 15259:2007 has been carried out prior to the QAL 2 testing and the outcome of that testing
suggests that grid sampling is the best approach to use, then the timings of such samples are stated in full.
Once the data pairs have been assembled, any pairs that cover periods of either SRM / ARM and or CEMs zero / self checking
are discarded (as they are not deemed to be valid results). The remaining results are then subjected to an outlier test which is
described in detail in this report.
Note: Environmental Scientifics Group Limited have entered into the UKAS / Environment Agency's proficiency testing scheme
for data handling for BS EN 14181. Their submission has proven that their data handling procedure is robust enough. Therefore
this report has a start point for all calibrations when the SRM value has been converted to the same units as the CEMs reading.
Therefore the actual raw SRM may not be stated in this report.
Page 13 of 82
LEK09311
5th - 14th June 2013
Permit No. 770
Novartis
Ringaskiddy
-
For
insp
ectio
n pur
pose
s only
.
Conse
nt of
copy
right
owne
r req
uired
for a
ny ot
her u
se.
EPA Export 04-01-2017:02:05:34

to
to
to
to
to
to
to
to
to
to
to
to
to
to
to
to
to
to
to
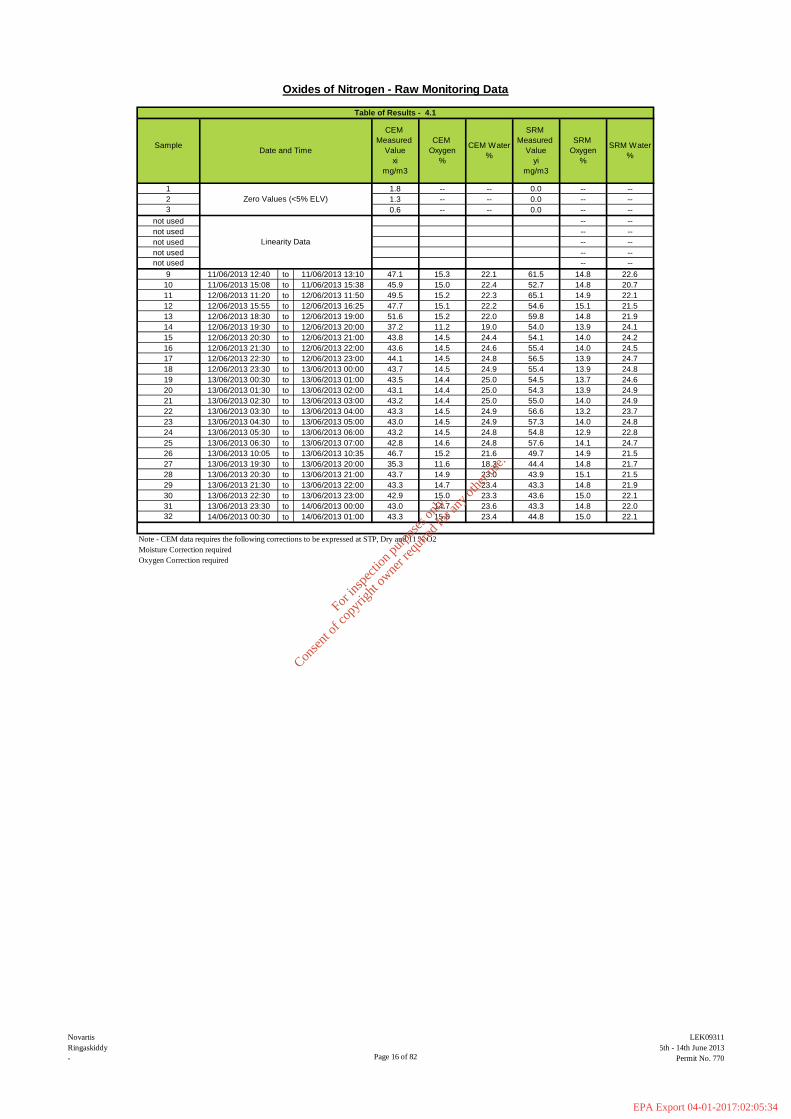
Note - CEM data requires the following corrections to be expressed at STP, Dry and 11 % O2
Temperature Correction not required
Pressure Correction not required
Moisture Correction required
Oxygen Correction required
SRM
Temp
Deg C
SRM
Press.
Mbar
- -
- -
- -
- -
- -
- -
- -
- -
142.0 1009.6
139.0 1009.6
142.0 1009.6
142.0 1009.6
143.0 1008.6
143.0 1008.6
142.0 1008.6
143.0 1008.6
--
--
--
--
--
--
--
--
14.5
15.0
15.1
14.8
14.6
14.2
15.1
15.4
15.2
15.0
15.4
15.4
15.4
15.5
15.3
13.7
13.8
14.6
13.3
143.0 1008.6
141.0 1008.6
142.0 1008.6
142.0 1008.6
143.0 1008.6
142.0 1008.6
145.0 1008.6
144.0 1008.6
143.0 1008.6
142.0 1008.6
142.0 1008.6
SRM
Water
%
--
--
--
--
--
--
--
--
13.8
20.6
20.7
10.3
22.2
21.2
21.6
20.8
21.2
22.2
21.0
20.1
20.3
20.2
20.1
22.2
20.0
19.1
19.3
SRM
Oxygen
%
-0.1
-0.1
-0.1
-0.1
-0.1
-0.1
-0.1
-0.1
-0.1
SRM
Measured
Value
yi
mg/m3
0.0
0.0
0.0
1.2
2.0
2.2
2.3
1.6
0.7
1.3
1.5
1.4
0.1
0.2
0.4
1.3
1.0
1.7
1.4
0.2
0.2
0.1
859.5
1081.2
1067.1
968.6
957.3
714.3
981.5
1012.3
1029.1
1076.4
142.4
CEM
Press.
Mbar
13/06/2013 11:51
13/06/2013 13:22
13/06/2013 14:37
13/06/2013 15:39
13/06/2013 16:47
14/06/2013 08:53
14/06/2013 09:53
14/06/2013 10:55
14/06/2013 12:01
11/06/2013 11:56
11/06/2013 16:04
11/06/2013 17:16
12/06/2013 10:18
12/06/2013 11:48
12/06/2013 13:03
12/06/2013 14:09
12/06/2013 15:16
12/06/2013 16:23
12/06/2013 17:25
13/06/2013 12:23
13/06/2013 13:54
13/06/2013 15:09
13/06/2013 16:11
13/06/2013 17:19
14/06/2013 09:25
14/06/2013 10:25
14/06/2013 11:27
14/06/2013 12:33
-
-
-
721.9
885.1
834.0
679.2
693.0
892.0
873.1
947.3
878.7
11/06/2013 11:14
11/06/2013 15:08
11/06/2013 16:44
12/06/2013 09:41
12/06/2013 11:16
12/06/2013 12:31
12/06/2013 13:37
12/06/2013 14:44
12/06/2013 15:51
-0.1
-0.1
-0.1
-0.1
-0.1
-0.1
CEM
Temp
Deg C
-
-
-
-
-
-
-
-
142.3
140.7
141.5
142.3
142.5
142.5
141.8
--
--
--
22.5
22.7
22.1
22.9
22.7
22.3
22.4
21.8
CEM
Measured
Value
xi
mg/m3
0.0
0.0
0.0
0.0
-0.1
-0.1
12/06/2013 16:53 -0.1
-
-
-
-
-
22.4
Linearity Data
Zero Values (<5% ELV)
Date and Time
15.0
14.1
15.1
15.4
15.3
15.2
15.2
CEM
Oxygen
%
--
--
--
15.1
15.0
15.2
15.0
14.9
15.2
15.2
15.5
15.2
15.3
CEM
Water
%
22.1
Total Particulate Matter - Raw Monitoring Data
Section 4A - Data and Calculations
Table of Results - 4.1
21.8
21.4
21.5
21.5
21.6
22.2
21.6
21.6
21.4
not used
not used
9
10
11
12
13
14
15
16
17
18
19
20
21
22
23
24
25
26
27 15.0
15.1
Sample
1
2
3
not used
not used
not used
141.8
140.8
141.2
141.3
141.9
141.7
143.0
143.5
142.2
141.2
141.7
Page 14 of 82
LEK09311
5th - 14th June 2013
Permit No. 770
Novartis
Ringaskiddy
-
For
insp
ectio
n pur
pose
s only
.
Conse
nt of
copy
right
owne
r req
uired
for a
ny ot
her u
se.
EPA Export 04-01-2017:02:05:34
to
to
to
to
to
to
to
to
to
to
to
to
to
to
to
to
to
to
to
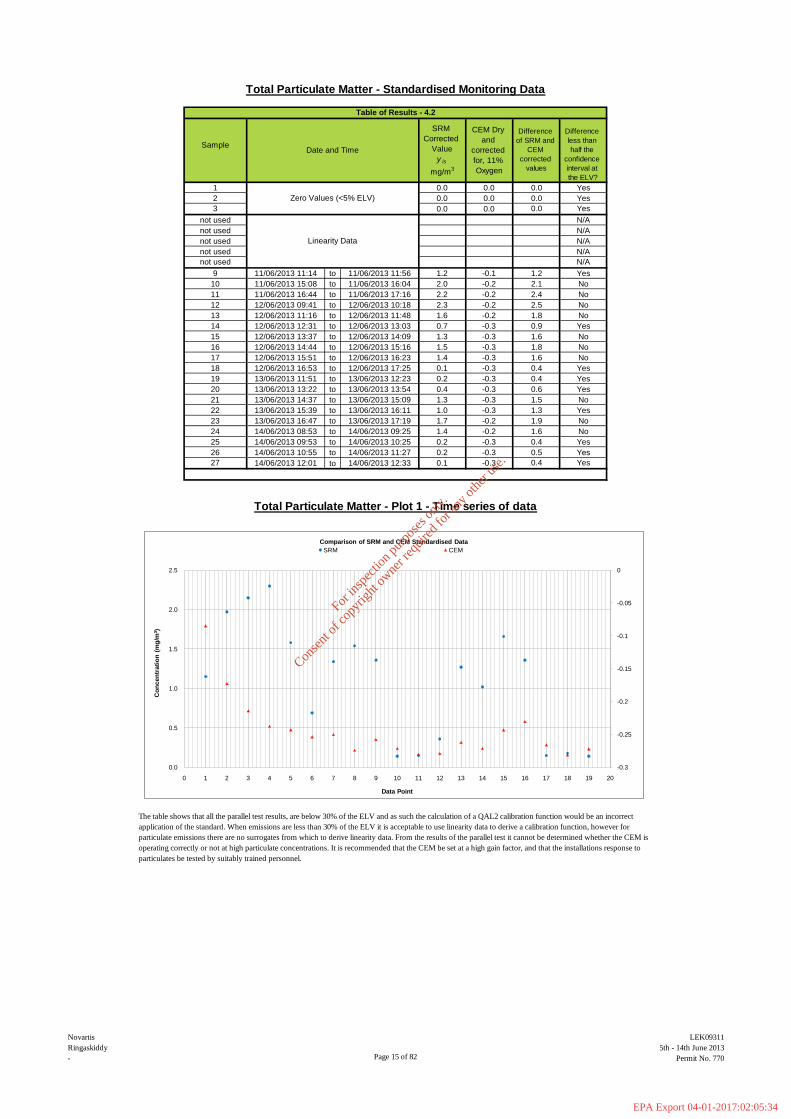
The table shows that all the parallel test results, are below 30% of the ELV and as such the calculation of a QAL2 calibration function would be an incorrect
application of the standard. When emissions are less than 30% of the ELV it is acceptable to use linearity data to derive a calibration function, however for
particulate emissions there are no surrogates from which to derive linearity data. From the results of the parallel test it cannot be determined whether the CEM is
operating correctly or not at high particulate concentrations. It is recommended that the CEM be set at a high gain factor, and that the installations response to
particulates be tested by suitably trained personnel.
SampleDate and Time
SRM
Corrected
Value
y is
mg/m3
CEM Dry
and
corrected
for, 11%
Oxygen
Zero Values (<5% ELV)
Linearity Data
1
2
3
not used
not used
not used
not used
not used
14/06/2013 10:25
14/06/2013 11:27
-0.2
-0.2
-0.2
-0.3
11/06/2013 11:5611/06/2013 11:14
11/06/2013 15:08
11/06/2013 16:44
12/06/2013 09:41
12/06/2013 11:16
12/06/2013 12:31
12/06/2013 13:37
12/06/2013 14:44
12/06/2013 15:51
12/06/2013 16:53
13/06/2013 11:51
13/06/2013 13:22
13/06/2013 14:37
13/06/2013 15:39
13/06/2013 16:47
18
19
20
21
22
23
9
10
11
12
13
14
15
16
17
14/06/2013 08:53
14/06/2013 09:53
14/06/2013 10:55
-0.3
-0.3
Difference
of SRM and
CEM
corrected
values
1.2
24
25
26
1.5
1.4
0.1
0.213/06/2013 12:23
13/06/2013 13:54
13/06/2013 15:09
13/06/2013 16:11
13/06/2013 17:19
14/06/2013 09:25
14/06/2013 12:33
11/06/2013 16:04
11/06/2013 17:16
12/06/2013 10:18
12/06/2013 11:48
12/06/2013 13:03
12/06/2013 14:09
12/06/2013 15:16
12/06/2013 16:23
12/06/2013 17:25
0.4
1.3
1.0
1.7
1.4
0.2
0.2
0.0
0.0
0.0
1.2
2.0
2.2
2.3
1.6
0.7
1.3
Total Particulate Matter - Standardised Monitoring Data
Total Particulate Matter - Plot 1 - Time series of data
-0.3
-0.3
-0.2
-0.2
-0.3
-0.3
-0.3
0.0
0.0
0.0
-0.1
-0.2
-0.3
-0.3
-0.3
-0.3
14/06/2013 12:01 0.127
Yes
N/A
N/A
N/A
N/A
N/A
Yes
No
No
No
No
Yes
No
No
No
Yes
Yes
Yes
No
Yes
No
No
Yes
Yes
Yes
Table of Results - 4.2
0.0
0.0
0.0
2.1
2.4
2.5
1.8
0.9
1.6
1.8
1.6
0.4
0.4
0.6
1.5
1.3
1.9
1.6
0.4
0.5
0.4
Difference
less than
half the
confidence
interval at
the ELV?
Yes
Yes
-0.3
-0.25
-0.2
-0.15
-0.1
-0.05
0
0.0
0.5
1.0
1.5
2.0
2.5
0 1 2 3 4 5 6 7 8 9 10 11 12 13 14 15 16 17 18 19 20
Co
ncen
trati
on
(m
g/m
3)
Data Point
Comparison of SRM and CEM Standardised Data
SRM CEM
Page 15 of 82
LEK09311
5th - 14th June 2013
Permit No. 770
Novartis
Ringaskiddy
-
For
insp
ectio
n pur
pose
s only
.
Conse
nt of
copy
right
owne
r req
uired
for a
ny ot
her u
se.
EPA Export 04-01-2017:02:05:34
to
to
to
to
to
to
to
to
to
to
to
to
to
to
to
to
to
to
to
to
to
to
to
to
Note - CEM data requires the following corrections to be expressed at STP, Dry and 11 % O2
Moisture Correction required
Oxygen Correction required
not used -- --
9 47.1 15.3
2 1.3 -- -- 0.0 -- --
3 0.6 -- -- 0.0 -- --
not used -- --
not used -- --
not used -- --
not used -- --
22.1 61.5 14.8 22.6
Oxides of Nitrogen - Raw Monitoring Data
10 11/06/2013 15:08 11/06/2013 15:38 45.9 15.0 22.4 52.7 14.8 20.7
11 12/06/2013 11:20 12/06/2013 11:50 49.5 15.2 22.3 65.1 14.9 22.1
12 12/06/2013 15:55 12/06/2013 16:25 47.7 15.1 22.2 54.6 15.1 21.5
13 12/06/2013 18:30 12/06/2013 19:00 51.6 15.2 22.0 59.8 14.8 21.9
14 12/06/2013 19:30 12/06/2013 20:00 37.2 11.2 19.0 54.0 13.9 24.1
15 12/06/2013 20:30 12/06/2013 21:00 43.8 14.5 24.4 54.1 14.0 24.2
16 12/06/2013 21:30 12/06/2013 22:00 43.6 14.5 24.6 55.4 14.0 24.5
17 12/06/2013 22:30 12/06/2013 23:00 44.1 14.5 24.8 56.5 13.9 24.7
18 12/06/2013 23:30 13/06/2013 00:00 43.7 14.5 24.9 55.4 13.9 24.8
19 13/06/2013 00:30 13/06/2013 01:00 43.5 14.4 25.0 54.5 13.7 24.6
20 13/06/2013 01:30 13/06/2013 02:00 43.1 14.4 25.0 54.3 13.9 24.9
21 13/06/2013 02:30 13/06/2013 03:00 43.2 14.4 25.0 55.0 14.0 24.9
22 13/06/2013 03:30 13/06/2013 04:00 43.3 14.5 24.9 56.6 13.2 23.7
23 13/06/2013 04:30 13/06/2013 05:00 43.0 14.5 24.9 57.3 14.0 24.8
24 13/06/2013 05:30 13/06/2013 06:00 43.2 14.5 24.8 54.8 12.9 22.8
25 13/06/2013 06:30 13/06/2013 07:00 42.8 14.6 24.8 57.6 14.1 24.7
26 13/06/2013 10:05 13/06/2013 10:35 46.7 15.2 21.6 49.7 14.9 21.5
27 13/06/2013 19:30 13/06/2013 20:00 35.3 11.6 18.3 44.4 14.8 21.7
28 13/06/2013 20:30 13/06/2013 21:00 43.7 14.9 23.0 43.9 15.1 21.5
29 13/06/2013 21:30 13/06/2013 22:00 43.3 14.7 23.4 43.3 14.8 21.9
22.1
30 13/06/2013 22:30 13/06/2013 23:00 42.9 15.0 23.3 43.6 15.0 22.1
31 13/06/2013 23:30 14/06/2013 00:00 43.0 14.7 23.6 43.3 14.8 22.0
32 14/06/2013 00:30 14/06/2013 01:00 43.3 15.0 23.4 44.8 15.0
CEM
Oxygen
%
CEM Water
%
SRM
Measured
Value
yi
mg/m3
SRM
Oxygen
%
SRM Water
%
SampleDate and Time
1
Zero Values (<5% ELV)
Linearity Data
1.8 --0.0 ------
11/06/2013 13:1011/06/2013 12:40
Table of Results - 4.1
CEM
Measured
Value
xi
mg/m3
Page 16 of 82
LEK09311
5th - 14th June 2013
Permit No. 770
Novartis
Ringaskiddy
-
For
insp
ectio
n pur
pose
s only
.
Conse
nt of
copy
right
owne
r req
uired
for a
ny ot
her u
se.
EPA Export 04-01-2017:02:05:34

to
to
to
to
to
to
to
to
to
to
to
to
to
to
to
to
to
to
to
to
to
to
to
to
2 0.0 1.3
3 0.0 0.6
not used
0.0
SampleDate and Time
SRM
Corrected
Value
y is
mg/m3
CEM Dry
and
corrected
for, 11%
Oxygen
Zero Values (<5% ELV)
1
not used
not used
not used
not used
9 128.6 105.9
10 11/06/2013 15:08 11/06/2013 15:38 107.6 99.9
11/06/2013 13:1011/06/2013 12:40
Linearity Data
11 12/06/2013 11:20 12/06/2013 11:50 136.8 111.3
12 12/06/2013 15:55 12/06/2013 16:25 118.0 105.6
13 12/06/2013 18:30 12/06/2013 19:00 123.6 114.5
14 12/06/2013 19:30 12/06/2013 20:00 100.7 47.1
15 12/06/2013 20:30 12/06/2013 21:00 103.0 89.7
16 12/06/2013 21:30 12/06/2013 22:00 105.6 90.0
17 12/06/2013 22:30 12/06/2013 23:00 106.1 90.4
18 12/06/2013 23:30 13/06/2013 00:00 104.6 89.3
19 13/06/2013 00:30 13/06/2013 01:00 99.9 89.0
20 13/06/2013 01:30 13/06/2013 02:00 102.8 88.1
21 13/06/2013 02:30 13/06/2013 03:00 104.4 88.3
22 13/06/2013 03:30 13/06/2013 04:00 95.5 88.7
93.3
23 13/06/2013 04:30 13/06/2013 05:00 109.6 88.4
24 13/06/2013 05:30 13/06/2013 06:00 87.5 89.3
25 13/06/2013 06:30 13/06/2013 07:00 111.1 88.8
26 13/06/2013 10:05 13/06/2013 10:35 103.5 103.4
31 13/06/2013 23:30 14/06/2013 00:00 90.2 90.4
32 14/06/2013 00:30 14/06/2013 01:00 96.0 94.4
27 13/06/2013 19:30 13/06/2013 20:00 92.7 45.9
28 13/06/2013 20:30 13/06/2013 21:00 96.1 94.3
29 13/06/2013 21:30 13/06/2013 22:00 89.9 90.9
30 13/06/2013 22:30 13/06/2013 23:00 93.6
Oxides of Nitrogen - Standardised Monitoring Data
Oxides of Nitrogen - Plot 1 - Time series of data
1.8
Difference
of SRM and
CEM
corrected
values
22.7
Yes
Yes
Yes
Yes
Yes
Yes
Yes
Yes
No
Yes
Yes
Yes
Yes
Yes
0.6
1.3
1.8
7.7
25.5
12.4
9.1
53.6
13.3
15.6
15.7
15.3
10.9
14.6
16.1
6.8
21.2
1.8
22.3
0.2
46.7
1.8
0.9
0.2
0.2
1.6
Difference
less than
half the
confidence
interval at
the ELV?
Yes
Yes
Yes
N/A
N/A
N/A
N/A
N/A
Yes
Yes
Yes
Yes
Yes
No
Yes
Yes
Yes
Yes
Table of Results - 4.2
0
20
40
60
80
100
120
140
160
0 1 2 3 4 5 6 7 8 9 10 11 12 13 14 15 16 17 18 19 20 21 22 23 24 25 26
Co
ncen
trati
on
(m
g/m
3)
Data Point
Comparison of SRM and CEM Standardised Data
SRM CEM
Page 17 of 82
LEK09311
5th - 14th June 2013
Permit No. 770
Novartis
Ringaskiddy
-
For
insp
ectio
n pur
pose
s only
.
Conse
nt of
copy
right
owne
r req
uired
for a
ny ot
her u
se.
EPA Export 04-01-2017:02:05:34
No
43.3 43.3 -0.1 No
42.9 43.6 0.7 No
43.0 43.3 0.3 No43.3 44.8 1.5 No
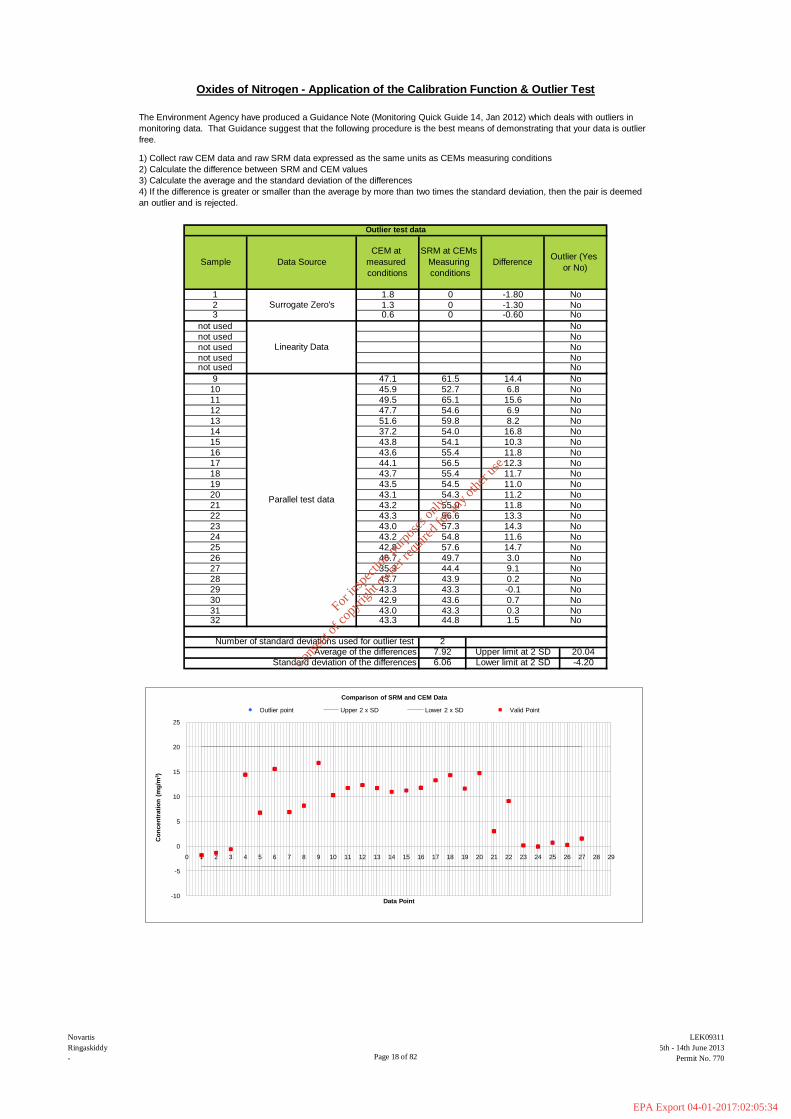
Upper limit at 2 SD
Lower limit at 2 SD
20.04
-4.20
43.2 55.0 11.8 No
43.3 56.6 13.3 No
43.0 57.3 14.3 No
43.2 54.8 11.6 No
42.8 57.6 14.7 No
46.7 49.7 3.0 No
35.3 44.4 9.1 No
43.7 43.9 0.2
The Environment Agency have produced a Guidance Note (Monitoring Quick Guide 14, Jan 2012) which deals with outliers in
monitoring data. That Guidance suggest that the following procedure is the best means of demonstrating that your data is outlier
free.
Data Source
Surrogate Zero's
Linearity Data
Parallel test data
1.8
1.3
0
0
-1.80
-1.30
No
No0.6 0 -0.60 No
No
No
No
Outlier test data
30
3132
CEM at
measured
conditions
SRM at CEMs
Measuring
conditions
DifferenceOutlier (Yes
or No)Sample
1
23
not used
not used
not used
not usednot used
9
10
11
12
13
14
54.5 11.0 No
43.1 54.3 11.2 No
2Number of standard deviations used for outlier test
Average of the differences
Standard deviation of the differences
7.92
6.06
15
16
17
18
19
20
21
22
23
24
25
26
27
28
29
14.4
45.9 52.7 6.8
49.5 65.1 15.6
47.7 54.6 6.9
NoNo
47.1 61.5 No
No
No
No
51.6 59.8 8.2 No
37.2 54.0 16.8 No
43.8 54.1 10.3 No
43.6 55.4 11.8 No
44.1 56.5 12.3 No
43.7 55.4 11.7 No
43.5
Oxides of Nitrogen - Application of the Calibration Function & Outlier Test
1) Collect raw CEM data and raw SRM data expressed as the same units as CEMs measuring conditions
2) Calculate the difference between SRM and CEM values
3) Calculate the average and the standard deviation of the differences
4) If the difference is greater or smaller than the average by more than two times the standard deviation, then the pair is deemed
an outlier and is rejected.
-10
-5
0
5
10
15
20
25
0 1 2 3 4 5 6 7 8 9 10 11 12 13 14 15 16 17 18 19 20 21 22 23 24 25 26 27 28 29
Co
ncen
trati
on
(m
g/m
3)
Data Point
Comparison of SRM and CEM Data
Outlier point Upper 2 x SD Lower 2 x SD Valid Point
Page 18 of 82
LEK09311
5th - 14th June 2013
Permit No. 770
Novartis
Ringaskiddy
-
For
insp
ectio
n pur
pose
s only
.
Conse
nt of
copy
right
owne
r req
uired
for a
ny ot
her u
se.
EPA Export 04-01-2017:02:05:34
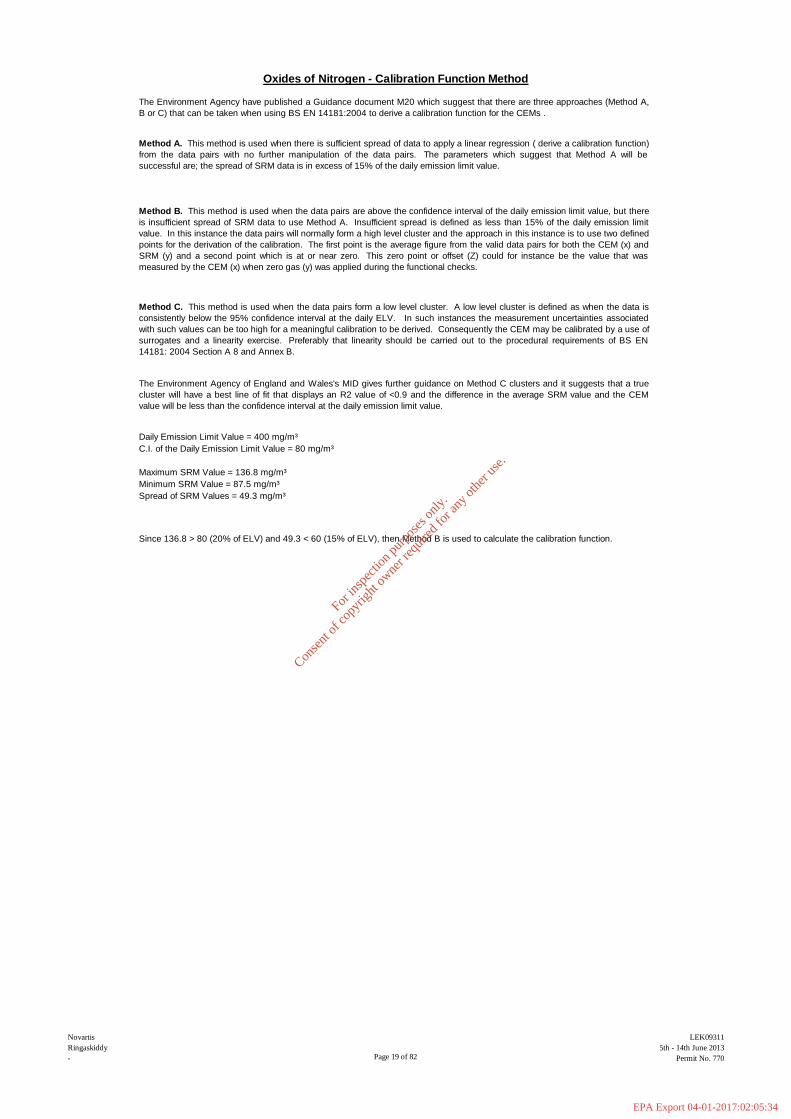
Daily Emission Limit Value = 400 mg/m³
C.I. of the Daily Emission Limit Value = 80 mg/m³
Oxides of Nitrogen - Calibration Function Method
Spread of SRM Values = 49.3 mg/m³
Since 136.8 > 80 (20% of ELV) and 49.3 < 60 (15% of ELV), then Method B is used to calculate the calibration function.
The Environment Agency have published a Guidance document M20 which suggest that there are three approaches (Method A,
B or C) that can be taken when using BS EN 14181:2004 to derive a calibration function for the CEMs .
Method A. This method is used when there is sufficient spread of data to apply a linear regression ( derive a calibration function)
from the data pairs with no further manipulation of the data pairs. The parameters which suggest that Method A will be
successful are; the spread of SRM data is in excess of 15% of the daily emission limit value.
Method B. This method is used when the data pairs are above the confidence interval of the daily emission limit value, but there
is insufficient spread of SRM data to use Method A. Insufficient spread is defined as less than 15% of the daily emission limit
value. In this instance the data pairs will normally form a high level cluster and the approach in this instance is to use two defined
points for the derivation of the calibration. The first point is the average figure from the valid data pairs for both the CEM (x) and
SRM (y) and a second point which is at or near zero. This zero point or offset (Z) could for instance be the value that was
measured by the CEM (x) when zero gas (y) was applied during the functional checks.
Method C. This method is used when the data pairs form a low level cluster. A low level cluster is defined as when the data is
consistently below the 95% confidence interval at the daily ELV. In such instances the measurement uncertainties associated
with such values can be too high for a meaningful calibration to be derived. Consequently the CEM may be calibrated by a use of
surrogates and a linearity exercise. Preferably that linearity should be carried out to the procedural requirements of BS EN
14181: 2004 Section A 8 and Annex B.
The Environment Agency of England and Wales's MID gives further guidance on Method C clusters and it suggests that a true
cluster will have a best line of fit that displays an R2 value of <0.9 and the difference in the average SRM value and the CEM
value will be less than the confidence interval at the daily emission limit value.
Maximum SRM Value = 136.8 mg/m³
Minimum SRM Value = 87.5 mg/m³
Page 19 of 82
LEK09311
5th - 14th June 2013
Permit No. 770
Novartis
Ringaskiddy
-
For
insp
ectio
n pur
pose
s only
.
Conse
nt of
copy
right
owne
r req
uired
for a
ny ot
her u
se.
EPA Export 04-01-2017:02:05:34
to
to
to
to
to
to
to
to
to
to
to
to
to
to
to
to
to
to
to
to
to
to
to
to
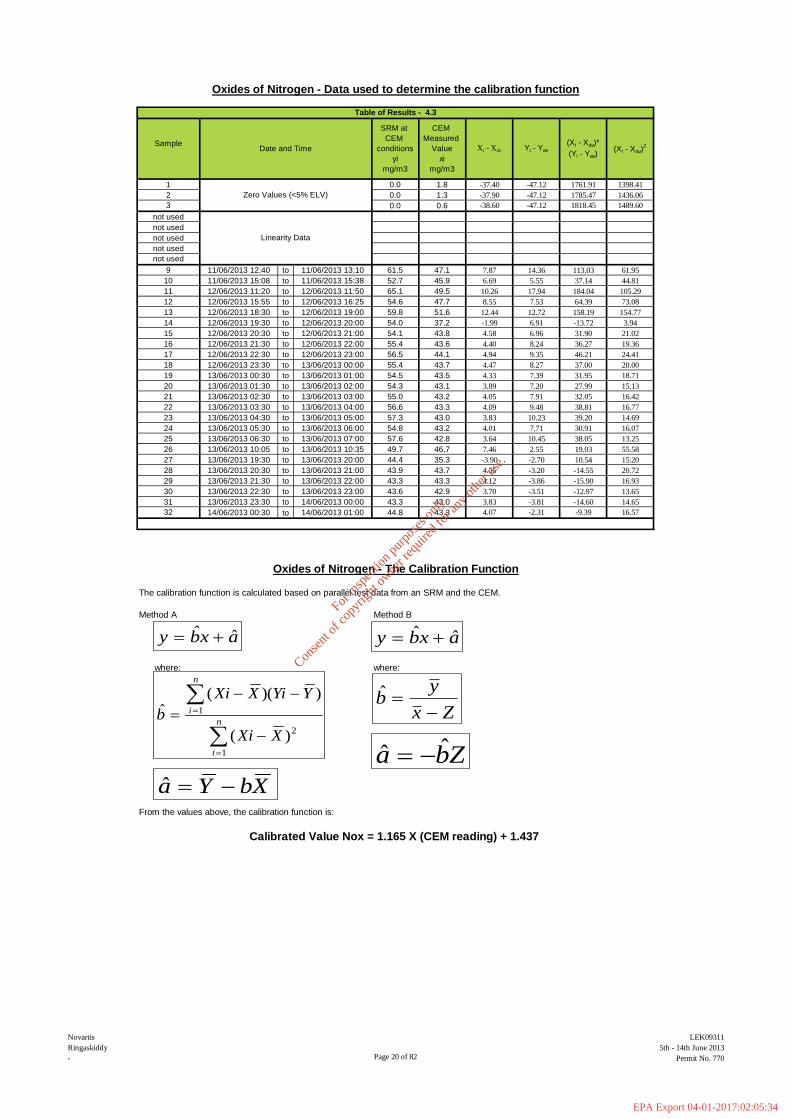
The calibration function is calculated based on parallel test data from an SRM and the CEM.
Method A Method B
where: where:
From the values above, the calibration function is:
Oxides of Nitrogen - Data used to determine the calibration function
2 0.0 1.3
3 0.0 0.6
not used
0.0 1.8
Date and Time
Zero Values (<5% ELV)
Sample
SRM at
CEM
conditions
yi
mg/m3
CEM
Measured
Value
xi
mg/m3
not used
not used
not used
not used
9 61.5 47.1
Xi - Xav Yi - Yav
(Xi - Xav)*
(Yi - Yav)(Xi - Xav)
2
-37.40
-37.90
-38.60
7.87
Table of Results - 4.3
10 11/06/2013 15:08 11/06/2013 15:38 52.7 45.9
11/06/2013 13:1011/06/2013 12:40
Linearity Data
11 12/06/2013 11:20 12/06/2013 11:50 65.1 49.5
12 12/06/2013 15:55 12/06/2013 16:25 54.6 47.7
13 12/06/2013 18:30 12/06/2013 19:00 59.8 51.6
14 12/06/2013 19:30 12/06/2013 20:00 54.0 37.2
15 12/06/2013 20:30 12/06/2013 21:00 54.1 43.8
16 12/06/2013 21:30 12/06/2013 22:00 55.4 43.6
17 12/06/2013 22:30 12/06/2013 23:00 56.5 44.1
18 12/06/2013 23:30 13/06/2013 00:00 55.4 43.7
19 13/06/2013 00:30 13/06/2013 01:00 54.5 43.5
20 13/06/2013 01:30 13/06/2013 02:00 54.3 43.1
21 13/06/2013 02:30 13/06/2013 03:00 55.0 43.2
22 13/06/2013 03:30 13/06/2013 04:00 56.6 43.3
23 13/06/2013 04:30 13/06/2013 05:00 57.3 43.0
24 13/06/2013 05:30 13/06/2013 06:00 54.8 43.2
25 13/06/2013 06:30 13/06/2013 07:00 57.6 42.8
26 13/06/2013 10:05 13/06/2013 10:35 49.7 46.7
27 13/06/2013 19:30 13/06/2013 20:00 44.4 35.3
28 13/06/2013 20:30 13/06/2013 21:00 43.9 43.7
29 13/06/2013 21:30 13/06/2013 22:00 43.3 43.3
30 13/06/2013 22:30 13/06/2013 23:00 43.6 42.9
31 13/06/2013 23:30 14/06/2013 00:00 43.3 43.0
32 14/06/2013 00:30 14/06/2013 01:00 44.8 43.3
Calibrated Value Nox = 1.165 X (CEM reading) + 1.437
Oxides of Nitrogen - The Calibration Function
-12.97 13.65
1
-15.90
-14.55
10.54
19.03
38.05
30.91
6.69
10.26
8.55
12.44
-1.99
4.58
4.40
4.94
4.47
4.33
3.89
4.05
4.09
3.83
4.01
3.64
14.65
16.57
7.46
-3.90
4.55
4.12
3.70
3.83
4.07
-47.12
-47.12
-47.12
14.36
5.55
17.94
7.53
12.72
6.91
6.96
8.24
9.35
8.27
7.39
7.20
7.91
9.48
10.23
7.71
10.45
2.55
-2.70
-3.20
-3.86
-3.51
-3.81
-2.31 -9.39
-14.60
39.20
38.81
32.05
27.99
31.95
37.00
46.21
36.27
31.90
-13.72
158.19
64.39
184.04
37.14
113.03
1761.91
1785.47
1818.45
1398.41
1436.06
1489.60
61.95
44.81
105.29
73.08
154.77
3.94
21.02
19.36
24.41
20.00
18.71
15.13
16.42
16.77
14.69
16.07
13.25
55.58
15.20
20.72
16.93
Zx
yb
ˆ
Zba ˆˆ
axby ˆˆ axby ˆˆ
n
i
n
i
XXi
YYiXXi
b
1
2
1
)(
))((ˆ
XbYa ˆ
Page 20 of 82
LEK09311
5th - 14th June 2013
Permit No. 770
Novartis
Ringaskiddy
-
For
insp
ectio
n pur
pose
s only
.
Conse
nt of
copy
right
owne
r req
uired
for a
ny ot
her u
se.
EPA Export 04-01-2017:02:05:34
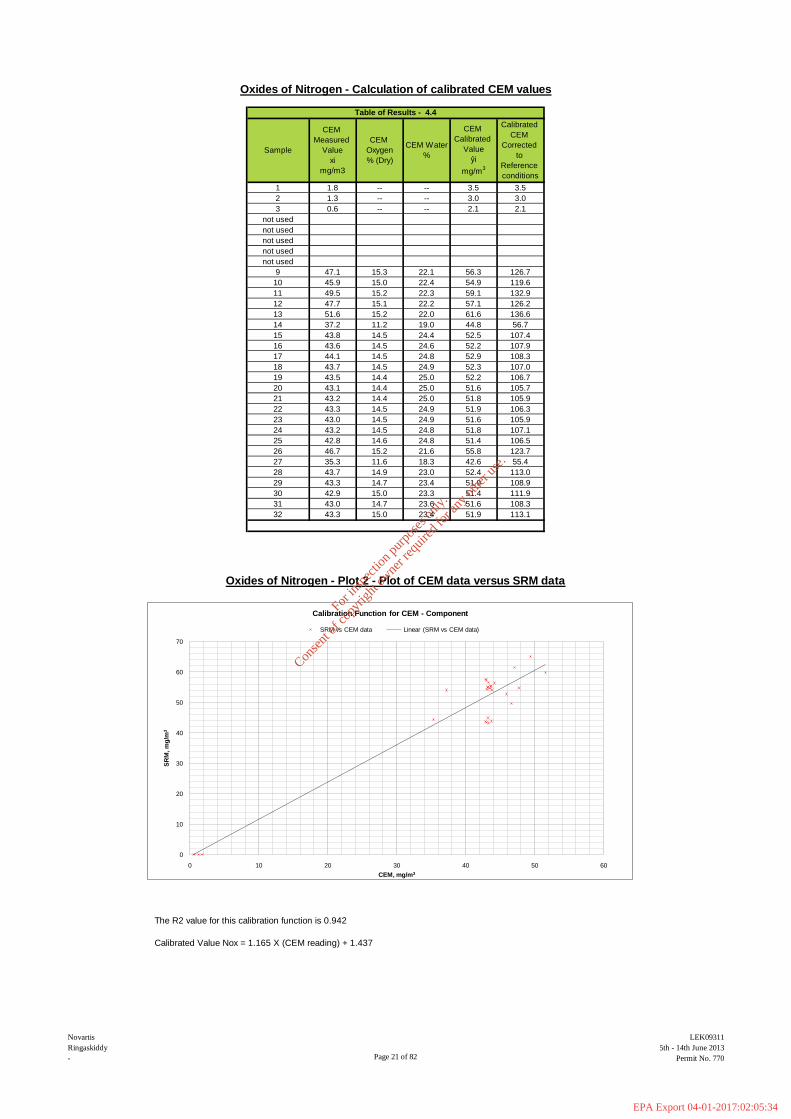
The R2 value for this calibration function is 0.942
Calibrated Value Nox = 1.165 X (CEM reading) + 1.437
2 1.3 -- -- 3.0 3.0
3 0.6 -- -- 2.1 2.1
Oxides of Nitrogen - Calculation of calibrated CEM values
not used
Table of Results - 4.4
1 1.8 -- -- 3.5 3.5
Sample
CEM
Measured
Value
xi
mg/m3
CEM
Oxygen
% (Dry)
CEM Water
%
CEM
Calibrated
Value
ŷi
mg/m3
Calibrated
CEM
Corrected
to
Reference
conditions
not used
not used
not used
not used
9 47.1 15.3 22.1 56.3 126.7
10 45.9 15.0 22.4 54.9 119.6
11 49.5 15.2 22.3 59.1 132.9
12 47.7 15.1 22.2 57.1 126.2
13 51.6 15.2 22.0 61.6 136.6
14 37.2 11.2 19.0 44.8 56.7
15 43.8 14.5 24.4 52.5 107.4
16 43.6 14.5 24.6 52.2 107.9
14.6 24.8 51.4 106.5
26 46.7 15.2 21.6 55.8 123.7
35.3 11.6 18.3 42.6 55.4
28 43.7 14.9 23.0 52.4 113.0
17 44.1 14.5 24.8 52.9 108.3
18 43.7 14.5 24.9 52.3 107.0
19 43.5 14.4 25.0 52.2 106.7
20 43.1 14.4 25.0 51.6 105.7
21 43.2 14.4 25.0 51.8 105.9
22 43.3 14.5 24.9 51.9 106.3
31 43.0 14.7 23.6 51.6 108.3
32 43.3 15.0 23.4 51.9 113.1
Oxides of Nitrogen - Plot 2 - Plot of CEM data versus SRM data
29 43.3 14.7 23.4 51.9 108.9
30 42.9 15.0 23.3 51.4 111.9
23 43.0 14.5 24.9 51.6 105.9
24 43.2 14.5 24.8 51.8 107.1
25 42.8
27
0
10
20
30
40
50
60
70
0 10 20 30 40 50 60
SR
M, m
g/m
3
CEM, mg/m3
Calibration Function for CEM - Component
SRM vs CEM data Linear (SRM vs CEM data)
Page 21 of 82
LEK09311
5th - 14th June 2013
Permit No. 770
Novartis
Ringaskiddy
-
For
insp
ectio
n pur
pose
s only
.
Conse
nt of
copy
right
owne
r req
uired
for a
ny ot
her u
se.
EPA Export 04-01-2017:02:05:34

The variability is accepted if: Sd ≤ Qo x Kv
Where
Qo is the uncertainty laid down by the Authorities at the emission limit value as a 95% confidence interval.
Qo = Daily Emission Limit Value X Measurement Uncertainty
Where Daily Emission Limit = 400 mg/m³ Measurement Uncertainty = 20%
Kv = the test parameter (for 27 Pairs of Data is 0.9861)
Variability Pass Criteria
2 3.0 0.0 -3.0 1.1 1.2
3 2.1 0.0 -2.1 1.9 3.6
Oxides of Nitrogen - Data Used for the variability test
1 3.5 0.0 -3.5 0.5 0.3
not used
not used
not used
not used
not used
9 126.7 128.6 1.9 5.9 35.3
10 119.6 107.6 -12.0 -8.0 63.4
11 132.9 136.8 3.9 7.9 62.8
12 126.2 118.0 -8.2 -4.2 17.5
13 136.6 123.6 -13.0 -9.0 81.0
14 56.7 100.7 44.0 48.1 2308.8
15 107.4 103.0 -4.5 -0.4 0.2
16 107.9 105.6 -2.2 1.8 3.2
17 108.3 106.1 -2.2 1.8 3.4
18 107.0 104.6 -2.5 1.6 2.5
19 106.7 99.9 -6.8 -2.8 7.7
20 105.7 102.8 -2.9 1.1 1.3
21 105.9 104.4 -1.5 2.5 6.5
59.5
24 107.1 87.5 -19.5 -15.5 239.9
31 108.3 90.2 -18.1 -14.1 198.2
32 113.1 96.0 -17.2 -13.1 172.3
28 113.0 96.1 -16.9 -12.9 166.1
29 108.9 89.9 -19.0 -14.9 223.2
30 111.9 93.6 -18.3 -14.3
CEM HAS PASSED VARIABILITY TEST
204.5
25 106.5 111.1 4.6 8.6 74.8
26 123.7 103.5 -20.1 -16.1 259.0
27 55.4 92.7 37.3 41.3 1705.2
Sample
CEM Dry
and
corrected
for 11%
Oxygen
SRM
Corrected
Value*
y is
mg/m3
Difference
between
SRM and
CEM
Difference
(D - Dmean)
Square of
Difference
(D - Dmean)2
Table of Results - 4.5
22 106.3 95.5 -10.8 -6.7 45.3
23 105.9 109.6 3.7 7.7
Oxides of Nitrogen - Variability Test
The next stage of the calibration process is to determine if the proposed calibration function passes the variability test.
Sd is the standard deviation of the differences between the SRM value at Reportable Conditions and the Calibrated CEM value at Reportable
Conditions.
1.96
15.12 < 40.25vD ks 0
Page 22 of 82
LEK09311
5th - 14th June 2013
Permit No. 770
Novartis
Ringaskiddy
-
For
insp
ectio
n pur
pose
s only
.
Conse
nt of
copy
right
owne
r req
uired
for a
ny ot
her u
se.
EPA Export 04-01-2017:02:05:34
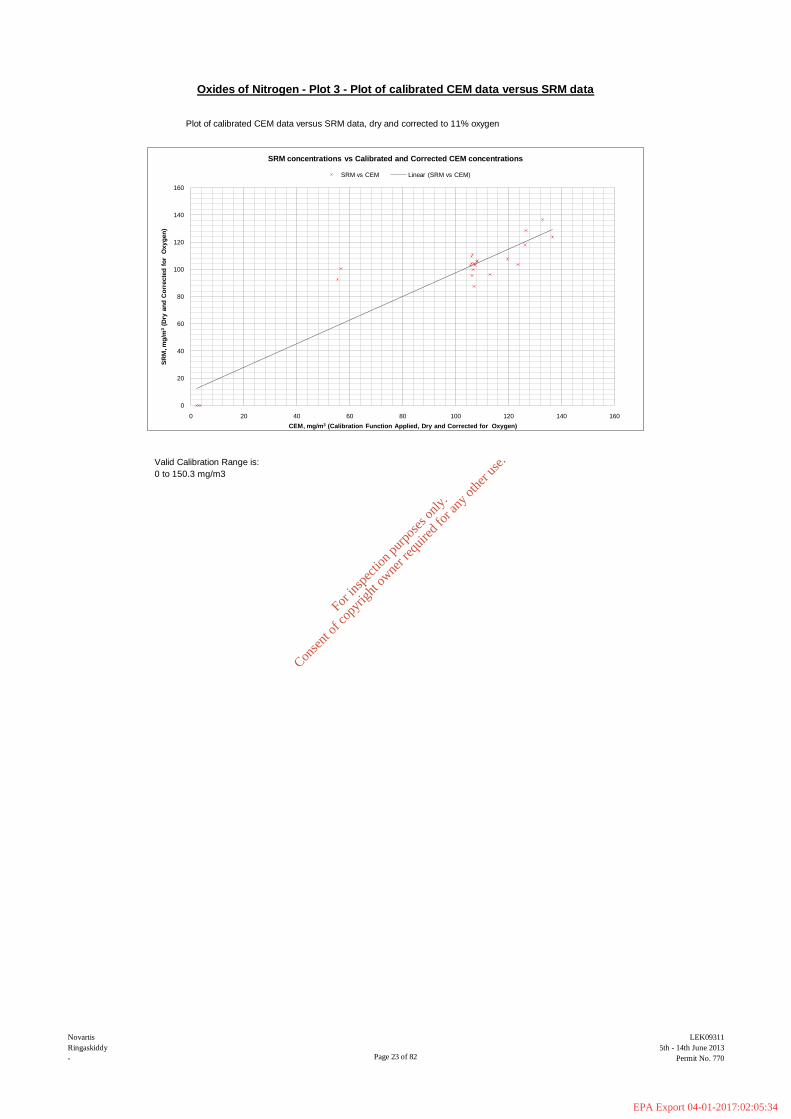
Plot of calibrated CEM data versus SRM data, dry and corrected to 11% oxygen
Valid Calibration Range is:
0 to 150.3 mg/m3
Oxides of Nitrogen - Plot 3 - Plot of calibrated CEM data versus SRM data
0
20
40
60
80
100
120
140
160
0 20 40 60 80 100 120 140 160
SR
M, m
g/m
3(D
ry a
nd
Co
rrecte
d f
or
Oxy
gen
)
CEM, mg/m3 (Calibration Function Applied, Dry and Corrected for Oxygen)
SRM concentrations vs Calibrated and Corrected CEM concentrations
SRM vs CEM Linear (SRM vs CEM)
Page 23 of 82
LEK09311
5th - 14th June 2013
Permit No. 770
Novartis
Ringaskiddy
-
For
insp
ectio
n pur
pose
s only
.
Conse
nt of
copy
right
owne
r req
uired
for a
ny ot
her u
se.
EPA Export 04-01-2017:02:05:34
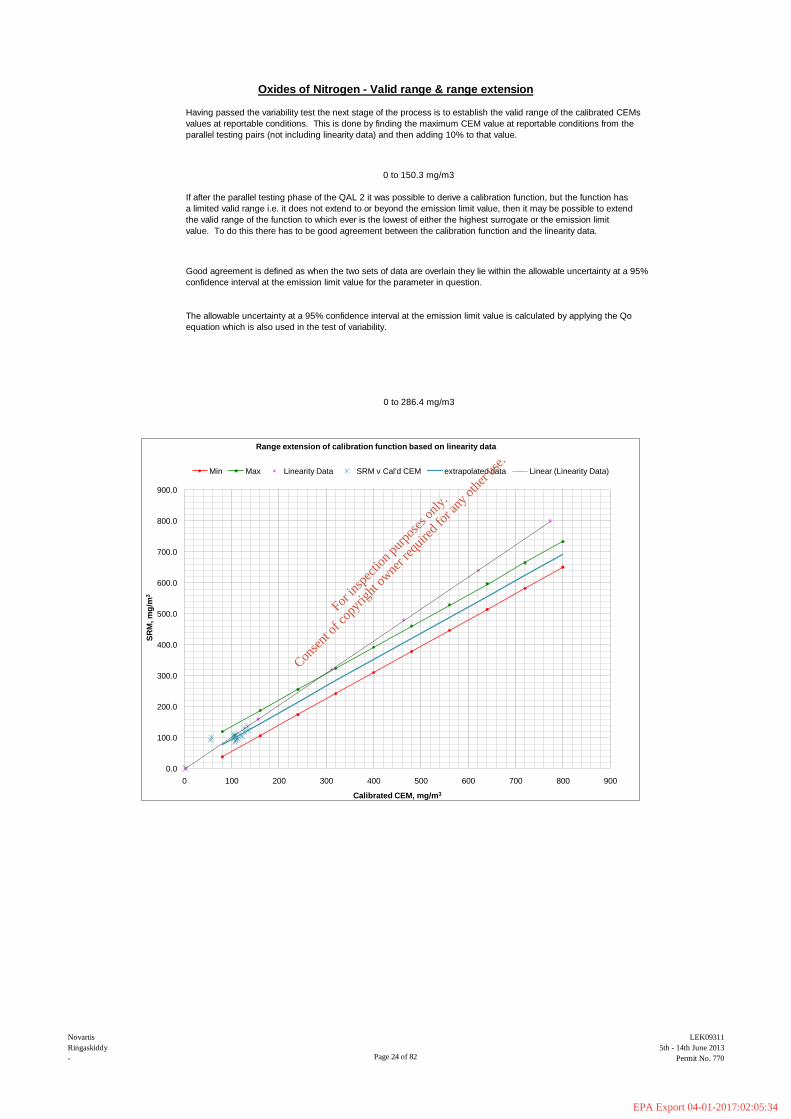
Oxides of Nitrogen - Valid range & range extension
0 to 286.4 mg/m3
Having passed the variability test the next stage of the process is to establish the valid range of the calibrated CEMs
values at reportable conditions. This is done by finding the maximum CEM value at reportable conditions from the
parallel testing pairs (not including linearity data) and then adding 10% to that value.
0 to 150.3 mg/m3
If after the parallel testing phase of the QAL 2 it was possible to derive a calibration function, but the function has
a limited valid range i.e. it does not extend to or beyond the emission limit value, then it may be possible to extend
the valid range of the function to which ever is the lowest of either the highest surrogate or the emission limit
value. To do this there has to be good agreement between the calibration function and the linearity data.
Good agreement is defined as when the two sets of data are overlain they lie within the allowable uncertainty at a 95%
confidence interval at the emission limit value for the parameter in question.
The allowable uncertainty at a 95% confidence interval at the emission limit value is calculated by applying the Qo
equation which is also used in the test of variability.
0.0
100.0
200.0
300.0
400.0
500.0
600.0
700.0
800.0
900.0
0 100 200 300 400 500 600 700 800 900
SR
M, m
g/m
3
Calibrated CEM, mg/m3
Range extension of calibration function based on linearity data
Min Max Linearity Data SRM v Cal'd CEM extrapolated data Linear (Linearity Data)
Page 24 of 82
LEK09311
5th - 14th June 2013
Permit No. 770
Novartis
Ringaskiddy
-
For
insp
ectio
n pur
pose
s only
.
Conse
nt of
copy
right
owne
r req
uired
for a
ny ot
her u
se.
EPA Export 04-01-2017:02:05:34

to
to
to
to
to
to
to
to
to
to
to
to
to
to
to
to
to
to
to
to
to
to
to
to
Note - CEM data requires the following corrections to be expressed at STP, Dry and 11 % O2
Moisture Correction required
Oxygen Correction required
15.1
14.8
15.0
14.8
15.0
14.0
13.9
13.9
13.7
13.9
14.0
13.2
14.0
12.9
--
--
14.8
14.8
14.9
15.1
14.8
13.9
14.0
60.0
80.0
-7.1
-7.6
-8.2
-7.2
--
--
--
--
--
24.1
21.9
21.5
22.1
20.7
22.6
--
--
--
24.8
23.7
24.9
24.9
24.6
24.8
24.7
24.5
24.2
22.1
22.0
22.1
21.9
21.5
21.7
21.5
24.7
22.8
14.1
14.9
14.8
101.3
0.0
0.0
0.0 --
--
--
--
--
--
-7.0
-6.6
-5.1
-4.7
-4.5
-1.7
2.2
20.0
40.0
14.7
-11.2
-11.6
-8.5
-6.9
-6.7
-6.5
-14.0
24.9
24.8
24.8
21.6
18.3
23.0
23.4
23.3
23.6
--
--
--
--
--
--
--
22.1
--
22.4
22.3
22.2
22.0
19.0
24.4
24.6
24.8
24.9
25.0
25.0
25.0
24.9
--
--
--
--
--
--
--
--
15.3
15.0
15.2
15.1
15.2
11.2
14.5
14.5
14.5
14.5
14.4
14.4
14.4not used
not used
not used
not used
not used
not used
2
3
4
5
6
7
8
not used
not used
not used
not used
not used
not used
not used
not used
not used
not used
not used
not used
13/06/2013 10:35
not used
not used
14/06/2013 00:30
-0.5
-0.6
-0.6
-0.6
-0.6
-0.6
-0.5
11/06/2013 15:38
12/06/2013 11:50
12/06/2013 16:25
12/06/2013 19:00
12/06/2013 20:00
12/06/2013 21:00
12/06/2013 22:00
12/06/2013 23:00
13/06/2013 00:00
13/06/2013 01:00
13/06/2013 02:00
13/06/2013 03:00
13/06/2013 04:00
13/06/2013 05:00
13/06/2013 06:00
13/06/2013 07:00
0.6
100.9
80.7
61.1
43.0
22.9
1.5
13/06/2013 20:00
-0.613/06/2013 21:00
14.5
14.5
14.5
14.6
15.2
11.6
14.9
11/06/2013 13:10
15.0not used
not used
13/06/2013 20:30
13/06/2013 21:30
13/06/2013 22:30
13/06/2013 23:30
not used
-6.8
-6.7
23.4 -9.0
-10.5
-8.9
-7.5
not used
11/06/2013 12:40
11/06/2013 15:08
12/06/2013 11:20
12/06/2013 15:55
12/06/2013 18:30
12/06/2013 19:30
12/06/2013 20:30
12/06/2013 21:30
12/06/2013 22:30
12/06/2013 23:30
13/06/2013 00:30
13/06/2013 01:30
13/06/2013 02:30
13/06/2013 03:30
13/06/2013 04:30
13/06/2013 05:30
13/06/2013 06:30
13/06/2013 10:05
13/06/2013 19:30
-0.6
-0.7
-0.6
-0.6
13/06/2013 22:00
13/06/2013 23:00
14/06/2013 00:00
14/06/2013 01:00
14.7
15.0
Carbon Monoxide - Raw Monitoring Data
-0.5
-0.7
-0.1
-0.2
-0.3
-0.4
-0.6
-0.6
-0.6
-0.5
-0.6
Table of Results - 4.1
CEM
Measured
Value
xi
mg/m3
CEM
Oxygen
%
CEM Water
%
SRM
Measured
Value
yi
mg/m3
SRM
Oxygen
%
SRM Water
%Sample Date and Time
1
Zero Values (<5% ELV)
Linearity Data
0.6
0.6
Page 25 of 82
LEK09311
5th - 14th June 2013
Permit No. 770
Novartis
Ringaskiddy
-
For
insp
ectio
n pur
pose
s only
.
Conse
nt of
copy
right
owne
r req
uired
for a
ny ot
her u
se.
EPA Export 04-01-2017:02:05:34
to
to
to
to
to
to
to
to
to
to
to
to
to
to
to
to
to
to
to
to
to
to
to
to
1
2
13/06/2013 19:30
13/06/2013 20:30
-14.0
CEM Dry
and
corrected
for, 11%
Oxygen
Zero Values (<5% ELV)
Linearity Data
0.0
0.0
0.0
101.3
80.0
60.0
40.0
20.0
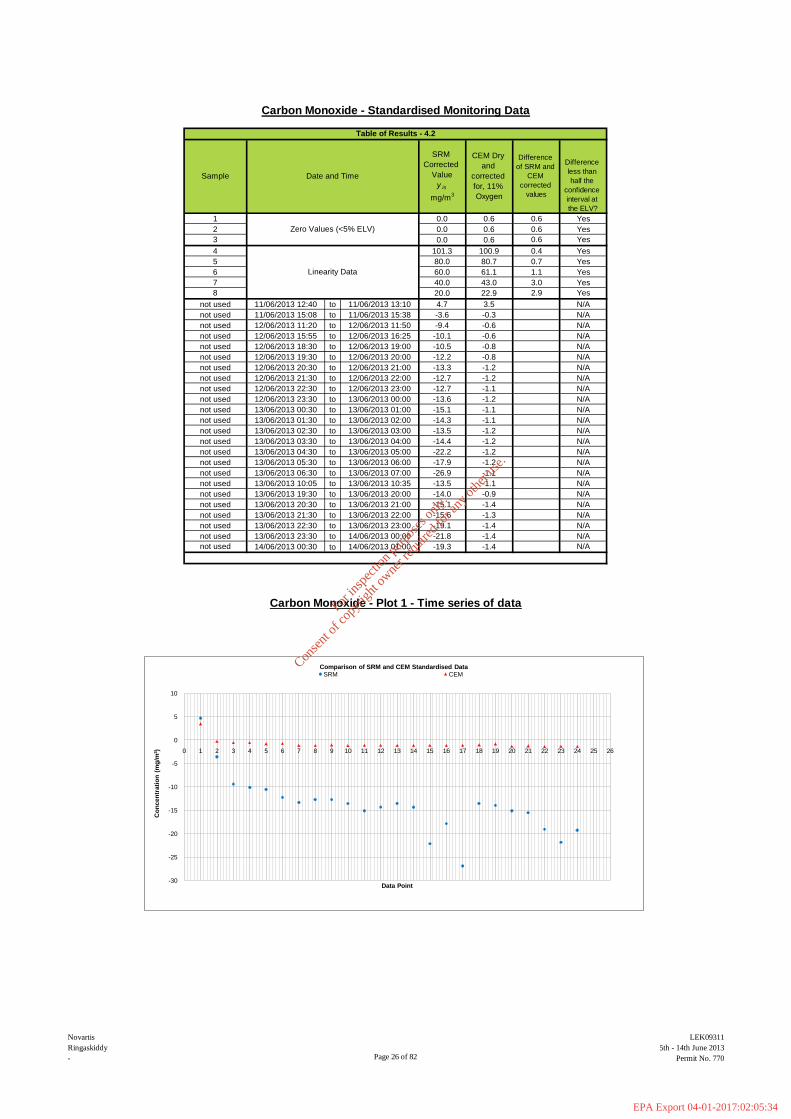
Carbon Monoxide - Standardised Monitoring Data
0.6
0.6
-15.113/06/2013 21:00
13/06/2013 21:30
13/06/2013 22:30
13/06/2013 23:30
14/06/2013 00:30
5
6
7
8
13/06/2013 07:00
13/06/2013 10:35
-0.6
-0.6
-0.8
-0.8
11/06/2013 13:1011/06/2013 12:40
11/06/2013 15:08
Carbon Monoxide - Plot 1 - Time series of data
-1.2
-1.2
-1.2
-1.2
-1.1
-1.1
-0.9
-1.4
-1.3-15.6
-19.1
-21.8
-19.3
4.7
-3.6
-9.4
-10.1
-10.5
-12.2
-22.2
-17.9
-26.9
0.6
100.9
80.7
61.1
43.0
22.9
3.5
-0.3
-1.2
-1.2
-1.1
-1.2
-1.1
-1.1
not used
not used
not used
not used
not used
not used
not used
not used
not used
13/06/2013 01:30
13/06/2013 02:30
13/06/2013 03:30
13/06/2013 04:30
not used
not used
not used
not used
not used
not used
not used
not used
not used
not used
not used
not used
not used
not used
not used
3
4
-1.4
-1.4
-1.4
13/06/2013 22:00
13/06/2013 23:00
14/06/2013 00:00
14/06/2013 01:00
-15.113/06/2013 01:00
13/06/2013 02:00
13/06/2013 03:00
13/06/2013 04:00
13/06/2013 05:00
13/06/2013 06:00
13/06/2013 20:00
11/06/2013 15:38
12/06/2013 11:50
12/06/2013 16:25
-13.5
12/06/2013 19:00
12/06/2013 20:00
12/06/2013 21:00
12/06/2013 22:00
Table of Results - 4.2
Sample Date and Time
SRM
Corrected
Value
y is
mg/m3
12/06/2013 11:20
12/06/2013 15:55
12/06/2013 18:30
12/06/2013 19:30
12/06/2013 20:30
12/06/2013 21:30
12/06/2013 22:30
12/06/2013 23:30
13/06/2013 00:30
-13.3
-12.7
-12.7
-13.6
12/06/2013 23:00
13/06/2013 00:00
13/06/2013 05:30
13/06/2013 06:30
13/06/2013 10:05
-14.3
-13.5
-14.4
N/A
N/A
N/A
N/A
N/A
N/A
N/A
N/A
N/A
N/A
Difference
of SRM and
CEM
corrected
values
2.9
3.0
1.1
0.7
0.4
N/A
N/A
N/A
N/A
N/A
N/A
N/A
N/A
N/A
N/A
N/A
N/A
N/A
N/A
0.6
0.6
0.6
Difference
less than
half the
confidence
interval at
the ELV?
Yes
Yes
Yes
Yes
Yes
Yes
Yes
Yes
-30
-25
-20
-15
-10
-5
0
5
10
0 1 2 3 4 5 6 7 8 9 10 11 12 13 14 15 16 17 18 19 20 21 22 23 24 25 26
Co
ncen
trati
on
(m
g/m
3)
Data Point
Comparison of SRM and CEM Standardised Data SRM CEM
Page 26 of 82
LEK09311
5th - 14th June 2013
Permit No. 770
Novartis
Ringaskiddy
-
For
insp
ectio
n pur
pose
s only
.
Conse
nt of
copy
right
owne
r req
uired
for a
ny ot
her u
se.
EPA Export 04-01-2017:02:05:34
-6.6 No
-0.5 -8.2 -7.7 No
-0.6 -7.6 -7.0 No
not used
2Number of standard deviations used for outlier test
Average of the differences
Standard deviation of the differences
-5.33
3.56
Data Source
Surrogate Zero's
Linearity Data
Parallel test data
0.6
0.6
0
0
-0.60
-0.60
No
No0.6 0 -0.60 No
100.87 101.3 0.43 No
80.73 80 -0.73 No
61.13 60 -1.13 No
Sample
1
23
4
5
6
78
not used
not used
not used
not used
not used
not used
not used
not used
not used
not used
not used
not used
not used
not used
not used
not used
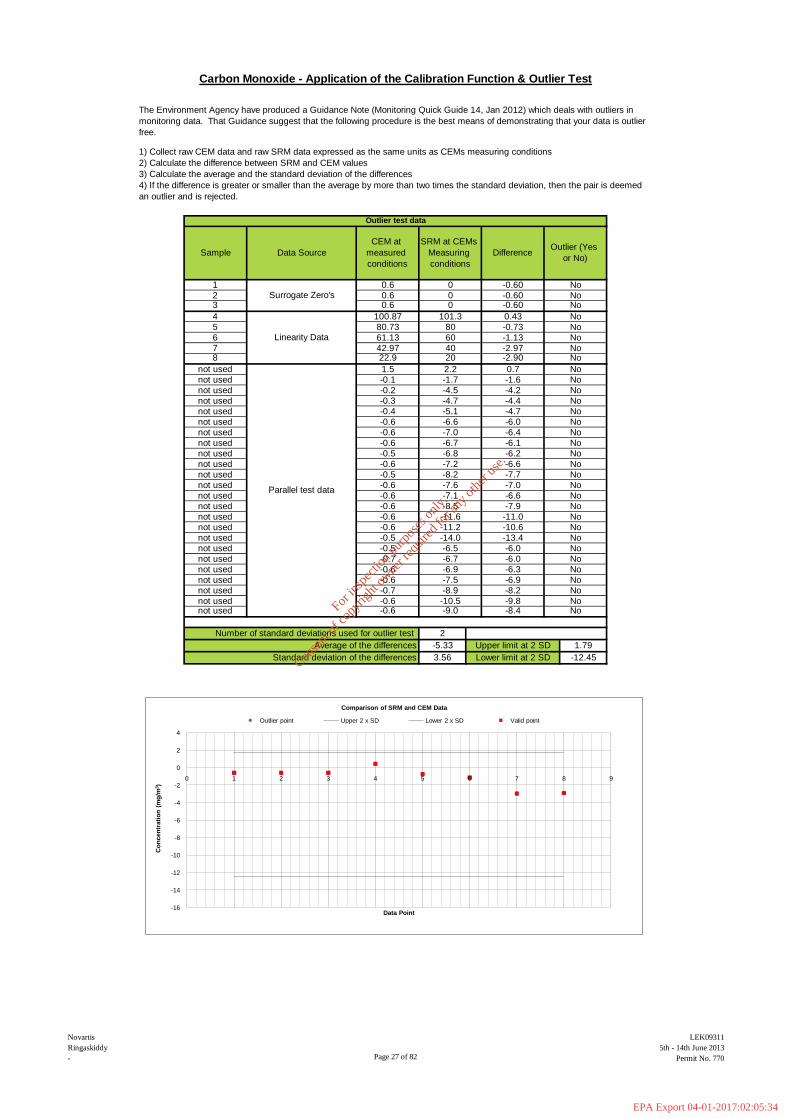
The Environment Agency have produced a Guidance Note (Monitoring Quick Guide 14, Jan 2012) which deals with outliers in
monitoring data. That Guidance suggest that the following procedure is the best means of demonstrating that your data is outlier
free.
not used
not used
not used
not used
not used
Outlier test data
not used
not used
42.97 40 -2.97 No22.9 20 -2.90 No
1.5 2.2 0.7 No
-0.1 -1.7 -1.6 No
-0.2 -4.5 -4.2 No
-0.3 -4.7 -4.4 No
-0.4 -5.1 -4.7 No
-0.6 -6.6 -6.0 No
-0.6 -7.0 -6.4 No
-0.6 -6.7 -6.1 No
-0.5 -6.8 -6.2 No
-0.6 -7.2
CEM at
measured
conditions
SRM at CEMs
Measuring
conditions
DifferenceOutlier (Yes
or No)
Lower limit at 2 SD
1.79
-12.45
-0.5 -14.0 -13.4 No
-0.5 -6.5 -6.0 No
-0.7 -6.7 -6.0 No
-0.6 -6.9 -6.3 No
-0.6 -7.5 -6.9 No
-0.7 -8.9 -8.2 No
-0.6 -10.5 -9.8 No-0.6 -9.0
Carbon Monoxide - Application of the Calibration Function & Outlier Test
1) Collect raw CEM data and raw SRM data expressed as the same units as CEMs measuring conditions
2) Calculate the difference between SRM and CEM values
3) Calculate the average and the standard deviation of the differences
4) If the difference is greater or smaller than the average by more than two times the standard deviation, then the pair is deemed
an outlier and is rejected.
-8.4 No
Upper limit at 2 SD
-0.6 -7.1 -6.6 No
-0.6 -8.5 -7.9 No
-0.6 -11.6 -11.0 No
-0.6 -11.2 -10.6 No
-16
-14
-12
-10
-8
-6
-4
-2
0
2
4
0 1 2 3 4 5 6 7 8 9
Co
ncen
trati
on
(m
g/m
3)
Data Point
Comparison of SRM and CEM Data
Outlier point Upper 2 x SD Lower 2 x SD Valid point
Page 27 of 82
LEK09311
5th - 14th June 2013
Permit No. 770
Novartis
Ringaskiddy
-
For
insp
ectio
n pur
pose
s only
.
Conse
nt of
copy
right
owne
r req
uired
for a
ny ot
her u
se.
EPA Export 04-01-2017:02:05:34
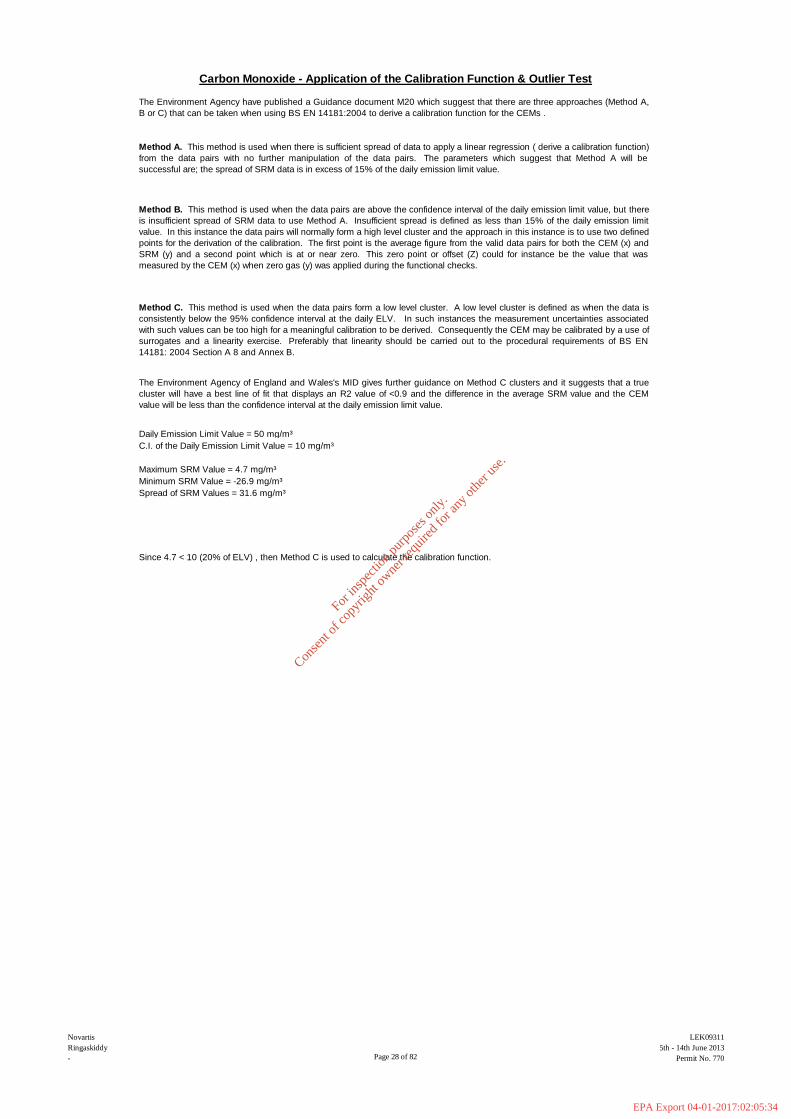
Daily Emission Limit Value = 50 mg/m³
C.I. of the Daily Emission Limit Value = 10 mg/m³
Method B. This method is used when the data pairs are above the confidence interval of the daily emission limit value, but there
is insufficient spread of SRM data to use Method A. Insufficient spread is defined as less than 15% of the daily emission limit
value. In this instance the data pairs will normally form a high level cluster and the approach in this instance is to use two defined
points for the derivation of the calibration. The first point is the average figure from the valid data pairs for both the CEM (x) and
SRM (y) and a second point which is at or near zero. This zero point or offset (Z) could for instance be the value that was
measured by the CEM (x) when zero gas (y) was applied during the functional checks.
Method C. This method is used when the data pairs form a low level cluster. A low level cluster is defined as when the data is
consistently below the 95% confidence interval at the daily ELV. In such instances the measurement uncertainties associated
with such values can be too high for a meaningful calibration to be derived. Consequently the CEM may be calibrated by a use of
surrogates and a linearity exercise. Preferably that linearity should be carried out to the procedural requirements of BS EN
14181: 2004 Section A 8 and Annex B.
The Environment Agency of England and Wales's MID gives further guidance on Method C clusters and it suggests that a true
cluster will have a best line of fit that displays an R2 value of <0.9 and the difference in the average SRM value and the CEM
value will be less than the confidence interval at the daily emission limit value.
Maximum SRM Value = 4.7 mg/m³
Minimum SRM Value = -26.9 mg/m³
Spread of SRM Values = 31.6 mg/m³
Since 4.7 < 10 (20% of ELV) , then Method C is used to calculate the calibration function.
Carbon Monoxide - Application of the Calibration Function & Outlier Test
The Environment Agency have published a Guidance document M20 which suggest that there are three approaches (Method A,
B or C) that can be taken when using BS EN 14181:2004 to derive a calibration function for the CEMs .
Method A. This method is used when there is sufficient spread of data to apply a linear regression ( derive a calibration function)
from the data pairs with no further manipulation of the data pairs. The parameters which suggest that Method A will be
successful are; the spread of SRM data is in excess of 15% of the daily emission limit value.
Page 28 of 82
LEK09311
5th - 14th June 2013
Permit No. 770
Novartis
Ringaskiddy
-
For
insp
ectio
n pur
pose
s only
.
Conse
nt of
copy
right
owne
r req
uired
for a
ny ot
her u
se.
EPA Export 04-01-2017:02:05:34

to
to
to
to
to
to
to
to
to
to
to
to
to
to
to
to
to
to
to
to
to
to
to
to
The calibration function is calculated based on linearity data.
Method A Method B
where: where:
From the values above, the calibration function is:
Calibrated Value CO = 1.007 X (CEM reading) -1.402
-0.6
-0.6
-0.6
-0.6
-0.6
-0.5
-0.5
-0.7
-0.6
-6.7
-6.9
-7.5
-8.9
-10.5
-9.0
Carbon Monoxide - The Calibration Function
not used
not used
-0.5
-0.6
-0.5
-7.2
-8.2
-7.6
-0.6
-8.5
-11.6
-11.2
-14.0
-6.5
13/06/2013 21:00
13/06/2013 22:00
13/06/2013 23:00
14/06/2013 00:00
14/06/2013 01:00
0.0
0.0
101.3
80.0
60.0
40.0
20.0
-6.7
-6.8
13/06/2013 00:00
13/06/2013 01:00
61.1
13/06/2013 20:00
-0.7
-0.6
-0.6
0.0 0.6
not used
not used
not used
not used
not used
11/06/2013 12:40
12/06/2013 23:30
13/06/2013 00:30
13/06/2013 01:30
13/06/2013 02:30
13/06/2013 03:30
13/06/2013 04:30
13/06/2013 05:30
13/06/2013 06:30
13/06/2013 10:05
13/06/2013 19:30
13/06/2013 20:30
13/06/2013 21:30
13/06/2013 22:30
13/06/2013 23:30
14/06/2013 00:30
not used
not used
not used
not used
not used
not used
not used
not used
not used
12/06/2013 21:30
12/06/2013 22:30
7
8
not used
not used
Zero Values (<5% ELV)
Linearity Data
1
2
3
4
5
6
11/06/2013 15:08
12/06/2013 11:20
12/06/2013 15:55
12/06/2013 18:30
12/06/2013 19:30
12/06/2013 20:30
-0.1
0.6
0.6
100.9
80.7
43.0
-0.2
-0.3
-0.4
-0.6
-0.6
-0.6
13/06/2013 07:00
13/06/2013 10:35
11/06/2013 13:10
-7.1
22.9
1.5
11/06/2013 15:38
12/06/2013 11:50
12/06/2013 16:25
12/06/2013 19:00
12/06/2013 20:00
12/06/2013 21:00
12/06/2013 22:00
12/06/2013 23:00
not used
13/06/2013 02:00
13/06/2013 03:00
13/06/2013 04:00
13/06/2013 05:00
13/06/2013 06:00
2.2
-1.7
-4.5
-4.7
-5.1
-6.6
-7.0
Carbon Monoxide - Data used to determine the calibration function
not used
not used
not used
not used
not used
Date and TimeSample
SRM at
CEM
conditions
yi
mg/m3
CEM
Measured
Value
xi
mg/m3
Xi - Xav Yi - Yav
(Xi - Xav)*
(Yi - Yav)(Xi - Xav)
2
-38.20
-38.20
-38.20
62.07
41.93
Table of Results - 4.3
-37.66
-37.66
-37.66
63.64
42.34
22.34
2.34
-17.66
22.33
4.17
-15.90 280.83
9.74
498.87
1775.35
3949.77
1438.71
1438.71
1438.71
1459.24
1459.24
1459.24
3852.27
1758.40
498.78
17.36
252.81
Zx
yb
ˆ
Zba ˆˆ
axby ˆˆ axby ˆˆ
n
i
n
i
XXi
YYiXXi
b
1
2
1
)(
))((ˆ
XbYa ˆ
Page 29 of 82
LEK09311
5th - 14th June 2013
Permit No. 770
Novartis
Ringaskiddy
-
For
insp
ectio
n pur
pose
s only
.
Conse
nt of
copy
right
owne
r req
uired
for a
ny ot
her u
se.
EPA Export 04-01-2017:02:05:34

The R2 value for this calibration function is 0.999
Calibrated Value CO = 1.007 X (CEM reading) -1.402
Carbon Monoxide - Plot 2 - Plot of CEM data versus SRM data
14.4
14.5
15.0
24.8
21.6
18.3
23.3
23.6
23.4
-0.8
-0.8
100.2
79.9
60.1
41.9
21.7
23.0
23.4
--
--
--
--
--
--
--
22.1
22.4
22.3
22.2
22.0
19.0
24.4
-0.6not used
not used
not used
-0.6
-0.5
-0.5
-0.7
-0.6
-0.6
-0.7
-0.6
5
Table of Results - 4.4
0.6
0.6
100.9
80.7
61.1
43.0
22.9
1.5
-0.1
-0.2
-0.3
-0.4
-0.6
-0.6
-0.6
-0.5
-0.6
-0.5
-0.6
-0.6
-0.6
14.7
11.2
14.5
14.5
14.5
14.5
14.4
14.4
-0.6not used
not used
not used
not used
not used
not used
not used
not used
not used
not used
not used
not used
not used
not used
-0.8
-0.8
100.2
79.9
60.1
41.9
21.7
not used
not used
6
7
8
not used
not used
not used
not used
not used
1 0.6 -- -- -0.8 -0.8
2
3
4
--
--
--
--
--
--
--
15.3
15.0
15.2
15.1
15.2
24.6
24.8
24.9
25.0
25.0
25.0
24.9
24.9
24.8
14.5
14.5
14.6
15.2
11.6
14.9
14.7
15.0
Sample
CEM
Measured
Value
xi
mg/m3
CEM
Oxygen
% (Dry)
CEM Water
%
CEM
Calibrated
Value
ŷi
mg/m3
Calibrated
CEM
Corrected
to
Reference
conditions
Carbon Monoxide - Calculation of calibrated CEM values
0
20
40
60
80
100
120
0 20 40 60 80 100 120
SR
M, m
g/m
3
CEM, mg/m3
Calibration Function for CEM - Component
SRM vs CEM data Linear (SRM vs CEM data)
Page 30 of 82
LEK09311
5th - 14th June 2013
Permit No. 770
Novartis
Ringaskiddy
-
For
insp
ectio
n pur
pose
s only
.
Conse
nt of
copy
right
owne
r req
uired
for a
ny ot
her u
se.
EPA Export 04-01-2017:02:05:34
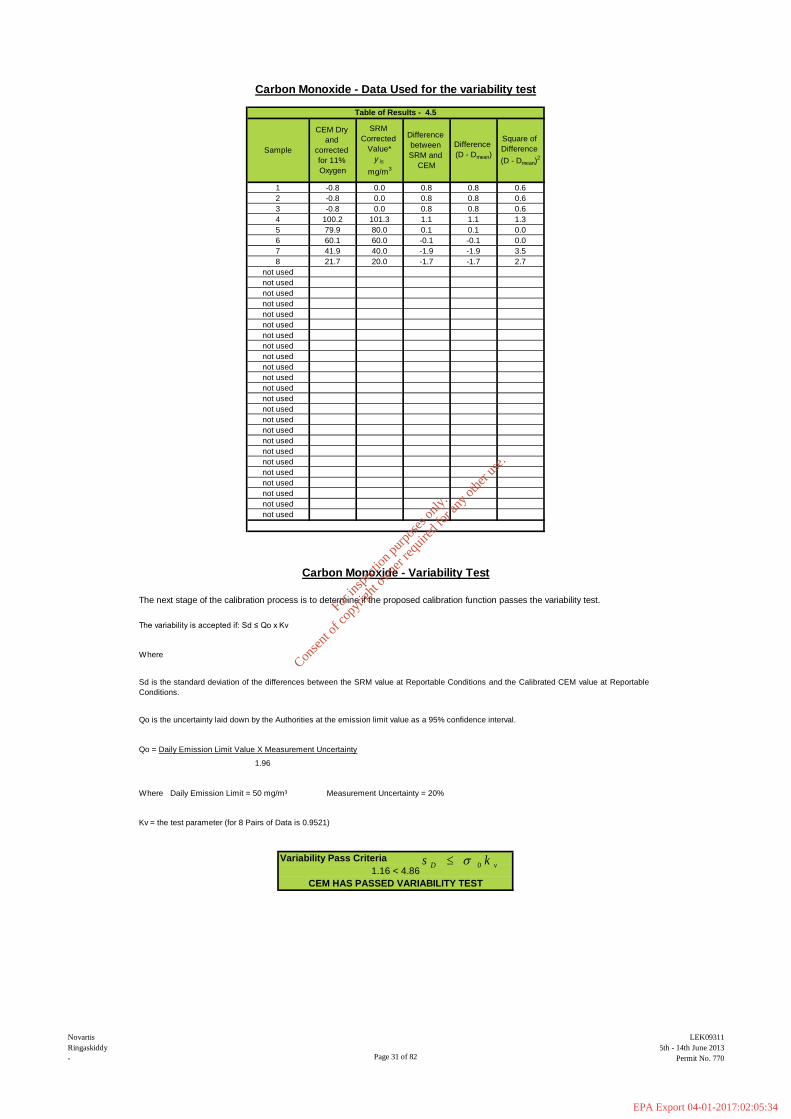
The variability is accepted if: Sd ≤ Qo x Kv
Where
Qo is the uncertainty laid down by the Authorities at the emission limit value as a 95% confidence interval.
Qo = Daily Emission Limit Value X Measurement Uncertainty
Where Daily Emission Limit = 50 mg/m³ Measurement Uncertainty = 20%
Kv = the test parameter (for 8 Pairs of Data is 0.9521)
Variability Pass Criteria
Carbon Monoxide - Data Used for the variability test
SRM
Corrected
Value*
y is
mg/m3
Difference
between
SRM and
CEM
Difference
(D - Dmean)
Square of
Difference
(D - Dmean)2
Table of Results - 4.5
1
2
3
4
5
6
7
8
not used
not used
not used
not used
not used
not used
CEM Dry
and
corrected
for 11%
Oxygen
-0.8
-0.8
100.2
79.9
60.1
41.9
21.7
3.5
2.7
not used
not used
not used
not used
-0.8 0.0 0.8 0.8 0.6
not used
not used
not used
not used
not used
not used
0.0
101.3
80.0
60.0
40.0
20.0
0.0
1.3
0.0
0.0
Sample
not used
not used
not used
not used
not used
not used
0.8
0.8
1.1
0.1
-0.1
-1.9
-1.7
0.8
0.8
1.1
0.1
-0.1
-1.9
-1.7
0.6
0.6
Carbon Monoxide - Variability Test
The next stage of the calibration process is to determine if the proposed calibration function passes the variability test.
Sd is the standard deviation of the differences between the SRM value at Reportable Conditions and the Calibrated CEM value at Reportable
Conditions.
1.96
1.16 < 4.86
CEM HAS PASSED VARIABILITY TEST
not used
not used
vD ks 0
Page 31 of 82
LEK09311
5th - 14th June 2013
Permit No. 770
Novartis
Ringaskiddy
-
For
insp
ectio
n pur
pose
s only
.
Conse
nt of
copy
right
owne
r req
uired
for a
ny ot
her u
se.
EPA Export 04-01-2017:02:05:34
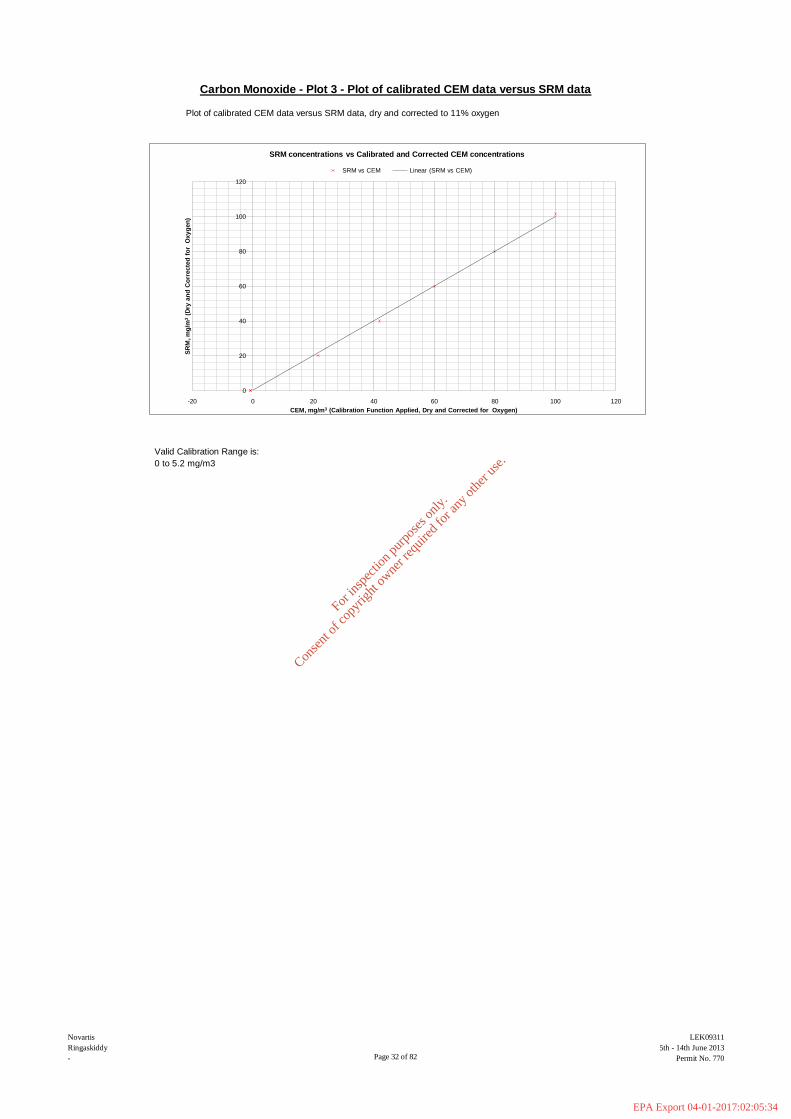
Plot of calibrated CEM data versus SRM data, dry and corrected to 11% oxygen
Valid Calibration Range is:
0 to 5.2 mg/m3
Carbon Monoxide - Plot 3 - Plot of calibrated CEM data versus SRM data
0
20
40
60
80
100
120
-20 0 20 40 60 80 100 120
SR
M, m
g/m
3(D
ry a
nd
Co
rrecte
d f
or
Oxy
gen
)
CEM, mg/m3 (Calibration Function Applied, Dry and Corrected for Oxygen)
SRM concentrations vs Calibrated and Corrected CEM concentrations
SRM vs CEM Linear (SRM vs CEM)
Page 32 of 82
LEK09311
5th - 14th June 2013
Permit No. 770
Novartis
Ringaskiddy
-
For
insp
ectio
n pur
pose
s only
.
Conse
nt of
copy
right
owne
r req
uired
for a
ny ot
her u
se.
EPA Export 04-01-2017:02:05:34
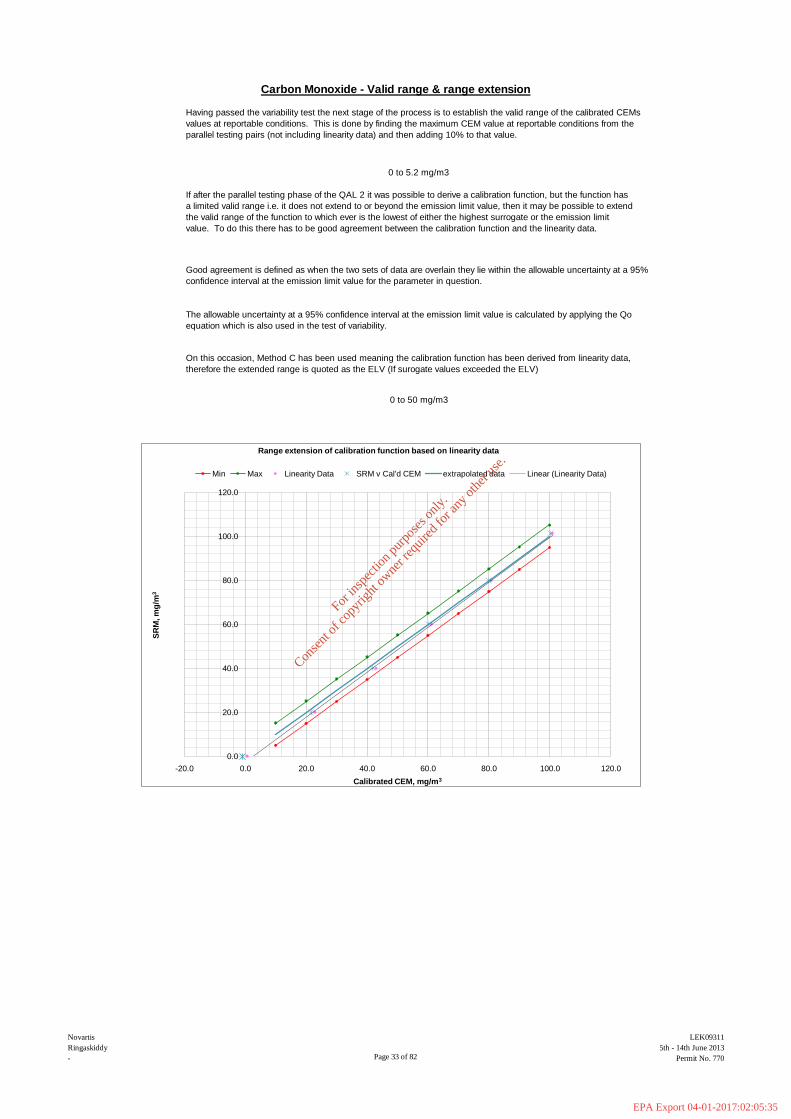
Having passed the variability test the next stage of the process is to establish the valid range of the calibrated CEMs
values at reportable conditions. This is done by finding the maximum CEM value at reportable conditions from the
parallel testing pairs (not including linearity data) and then adding 10% to that value.
0 to 5.2 mg/m3
0 to 50 mg/m3
Carbon Monoxide - Valid range & range extension
If after the parallel testing phase of the QAL 2 it was possible to derive a calibration function, but the function has
a limited valid range i.e. it does not extend to or beyond the emission limit value, then it may be possible to extend
the valid range of the function to which ever is the lowest of either the highest surrogate or the emission limit
value. To do this there has to be good agreement between the calibration function and the linearity data.
Good agreement is defined as when the two sets of data are overlain they lie within the allowable uncertainty at a 95%
confidence interval at the emission limit value for the parameter in question.
The allowable uncertainty at a 95% confidence interval at the emission limit value is calculated by applying the Qo
equation which is also used in the test of variability.
On this occasion, Method C has been used meaning the calibration function has been derived from linearity data,
therefore the extended range is quoted as the ELV (If surogate values exceeded the ELV)
0.0
20.0
40.0
60.0
80.0
100.0
120.0
-20.0 0.0 20.0 40.0 60.0 80.0 100.0 120.0
SR
M, m
g/m
3
Calibrated CEM, mg/m3
Range extension of calibration function based on linearity data
Min Max Linearity Data SRM v Cal'd CEM extrapolated data Linear (Linearity Data)
Page 33 of 82
LEK09311
5th - 14th June 2013
Permit No. 770
Novartis
Ringaskiddy
-
For
insp
ectio
n pur
pose
s only
.
Conse
nt of
copy
right
owne
r req
uired
for a
ny ot
her u
se.
EPA Export 04-01-2017:02:05:35
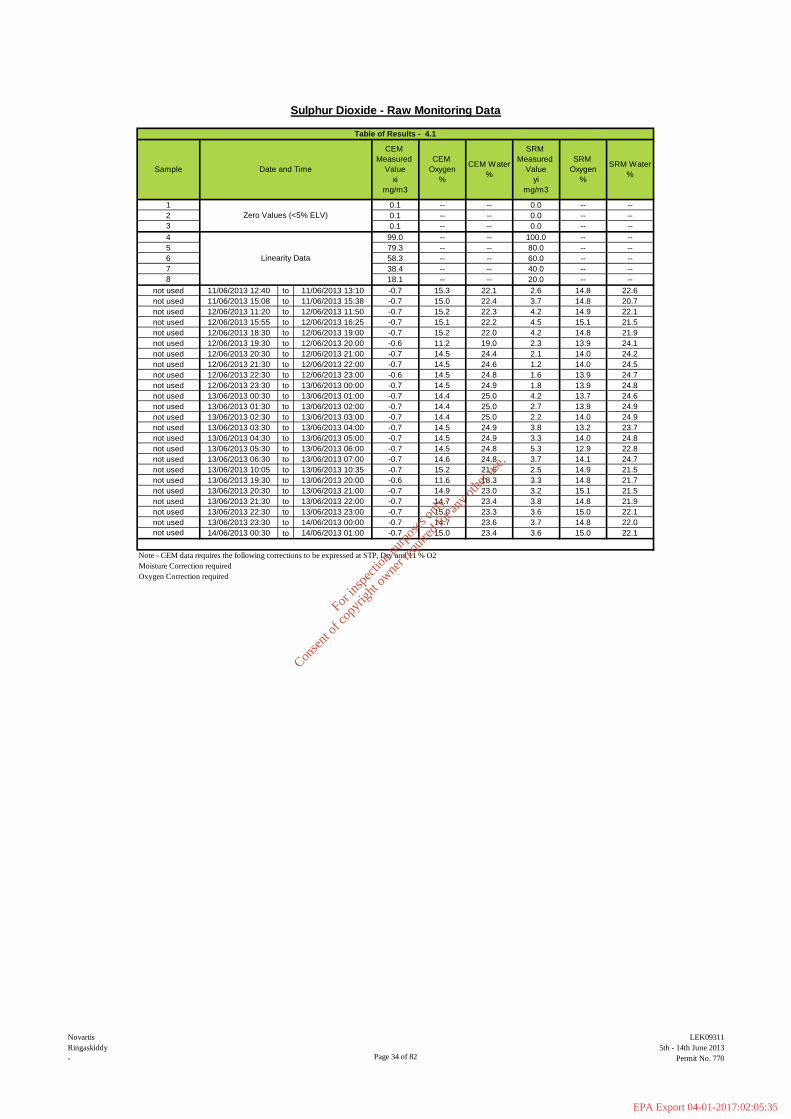
to
to
to
to
to
to
to
to
to
to
to
to
to
to
to
to
to
to
to
to
to
to
to
to
Note - CEM data requires the following corrections to be expressed at STP, Dry and 11 % O2
Moisture Correction required
Oxygen Correction required
--0.0 ------
11/06/2013 13:1011/06/2013 12:40
1
Zero Values (<5% ELV)
Linearity Data
0.1
not used 14/06/2013 00:30 14/06/2013 01:00 -0.7 15.0 23.4 3.6 15.0 22.1
not used 13/06/2013 22:30 13/06/2013 23:00 -0.7 15.0 23.3 3.6 15.0 22.1
not used 13/06/2013 23:30 14/06/2013 00:00 -0.7 14.7 23.6 3.7 14.8 22.0
not used 13/06/2013 20:30 13/06/2013 21:00 -0.7 14.9 23.0 3.2 15.1 21.5
not used 13/06/2013 21:30 13/06/2013 22:00 -0.7 14.7 23.4 3.8 14.8 21.9
not used 13/06/2013 10:05 13/06/2013 10:35 -0.7 15.2 21.6 2.5 14.9 21.5
not used 13/06/2013 19:30 13/06/2013 20:00 -0.6 11.6 18.3 3.3 14.8 21.7
not used 13/06/2013 05:30 13/06/2013 06:00 -0.7 14.5 24.8 5.3 12.9 22.8
not used 13/06/2013 06:30 13/06/2013 07:00 -0.7 14.6 24.8 3.7 14.1 24.7
not used 13/06/2013 03:30 13/06/2013 04:00 -0.7 14.5 24.9 3.8 13.2 23.7
not used 13/06/2013 04:30 13/06/2013 05:00 -0.7 14.5 24.9 3.3 14.0 24.8
not used 13/06/2013 01:30 13/06/2013 02:00 -0.7 14.4 25.0 2.7 13.9 24.9
not used 13/06/2013 02:30 13/06/2013 03:00 -0.7 14.4 25.0 2.2 14.0 24.9
not used 12/06/2013 23:30 13/06/2013 00:00 -0.7 14.5 24.9 1.8 13.9 24.8
not used 13/06/2013 00:30 13/06/2013 01:00 -0.7 14.4 25.0 4.2 13.7 24.6
not used 12/06/2013 21:30 12/06/2013 22:00 -0.7 14.5 24.6 1.2 14.0 24.5
not used 12/06/2013 22:30 12/06/2013 23:00 -0.6 14.5 24.8 1.6 13.9 24.7
not used 12/06/2013 19:30 12/06/2013 20:00 -0.6 11.2 19.0 2.3 13.9 24.1
not used 12/06/2013 20:30 12/06/2013 21:00 -0.7 14.5 24.4 2.1 14.0 24.2
not used 12/06/2013 15:55 12/06/2013 16:25 -0.7 15.1 22.2 4.5 15.1 21.5
not used 12/06/2013 18:30 12/06/2013 19:00 -0.7 15.2 22.0 4.2 14.8 21.9
22.1 2.6 14.8 22.6
not used 11/06/2013 15:08 11/06/2013 15:38 -0.7 15.0 22.4 3.7 14.8 20.7
not used 12/06/2013 11:20 12/06/2013 11:50 -0.7 15.2 22.3 4.2 14.9 22.1
58.3 -- -- 60.0 -- --
7 38.4 -- -- 40.0 -- --
8 18.1 -- -- 20.0 -- --
not used -0.7 15.3
2 0.1 -- -- 0.0 -- --
3 0.1 -- -- 0.0 -- --
4 99.0 -- -- 100.0 -- --
5 79.3 -- -- 80.0 -- --
6
Sulphur Dioxide - Raw Monitoring Data
Table of Results - 4.1
CEM
Measured
Value
xi
mg/m3
CEM
Oxygen
%
CEM Water
%
SRM
Measured
Value
yi
mg/m3
SRM
Oxygen
%
SRM Water
%Sample Date and Time
Page 34 of 82
LEK09311
5th - 14th June 2013
Permit No. 770
Novartis
Ringaskiddy
-
For
insp
ectio
n pur
pose
s only
.
Conse
nt of
copy
right
owne
r req
uired
for a
ny ot
her u
se.
EPA Export 04-01-2017:02:05:35

to
to
to
to
to
to
to
to
to
to
to
to
to
to
to
to
to
to
to
to
to
to
to
to
not used 13/06/2013 23:30 14/06/2013 00:00 7.8 -1.5
not used 14/06/2013 00:30 14/06/2013 01:00 7.8 -1.5
not used 13/06/2013 19:30 13/06/2013 20:00 7.0 -0.8
not used 13/06/2013 20:30 13/06/2013 21:00 6.9 -1.5
not used 13/06/2013 21:30 13/06/2013 22:00 7.9 -1.5
not used 13/06/2013 22:30 13/06/2013 23:00 7.7 -1.5
not used 13/06/2013 04:30 13/06/2013 05:00 6.4 -1.4
not used 13/06/2013 05:30 13/06/2013 06:00 8.4 -1.4
not used 13/06/2013 06:30
Sulphur Dioxide - Standardised Monitoring Data
Sulphur Dioxide - Plot 1 - Time series of data
0.1
13/06/2013 07:00 7.1 -1.4
not used 13/06/2013 10:05 13/06/2013 10:35 5.3 -1.5
not used 13/06/2013 00:30 13/06/2013 01:00 7.7 -1.4
not used 13/06/2013 01:30 13/06/2013 02:00 5.1 -1.3
not used 13/06/2013 02:30 13/06/2013 03:00 4.2 -1.3
not used 13/06/2013 03:30 13/06/2013 04:00 6.4 -1.4
not used 12/06/2013 20:30 12/06/2013 21:00 4.0 -1.4
not used 12/06/2013 21:30 12/06/2013 22:00 2.2 -1.4
not used 12/06/2013 22:30 12/06/2013 23:00 3.1 -1.3
not used 12/06/2013 23:30 13/06/2013 00:00 3.4 -1.4
not used 12/06/2013 11:20 12/06/2013 11:50 8.9 -1.6
not used 12/06/2013 15:55 12/06/2013 16:25 9.7 -1.5
not used 12/06/2013 18:30 12/06/2013 19:00 8.6 -1.5
not used 12/06/2013 19:30 12/06/2013 20:00 4.3 -0.8
5 80.0 79.3
6 60.0 58.3
7 40.0 38.4
8 20.0 18.1
not used 5.4 -1.6
not used 11/06/2013 15:08 11/06/2013 15:38 7.6 -1.5
11/06/2013 13:1011/06/2013 12:40
Linearity Data
2 0.0 0.1
3 0.0 0.1
4 100.0 99.0
0.0
Sample Date and Time
SRM
Corrected
Value
y is
mg/m3
CEM Dry
and
corrected
for, 11%
Oxygen
Zero Values (<5% ELV)
1
Difference
of SRM and
CEM
corrected
values
Difference
less than
half the
confidence
interval at
the ELV?
Table of Results - 4.2
1.9
1.6
1.7
0.7
1.0
N/A
N/A
N/A
N/A
N/A
N/A
N/A
N/A
N/A
N/A
N/A
N/A
N/A
N/A
0.1
0.1
0.1 Yes
Yes
Yes
Yes
Yes
Yes
Yes
Yes
N/A
N/A
N/A
N/A
N/A
N/A
N/A
N/A
N/A
N/A
-4
-2
0
2
4
6
8
10
12
0 1 2 3 4 5 6 7 8 9 10 11 12 13 14 15 16 17 18 19 20 21 22 23 24 25 26
Co
ncen
trati
on
(m
g/m
3)
Data Point
Comparison of SRM and CEM Standardised Data
SRM CEM
Page 35 of 82
LEK09311
5th - 14th June 2013
Permit No. 770
Novartis
Ringaskiddy
-
For
insp
ectio
n pur
pose
s only
.
Conse
nt of
copy
right
owne
r req
uired
for a
ny ot
her u
se.
EPA Export 04-01-2017:02:05:35
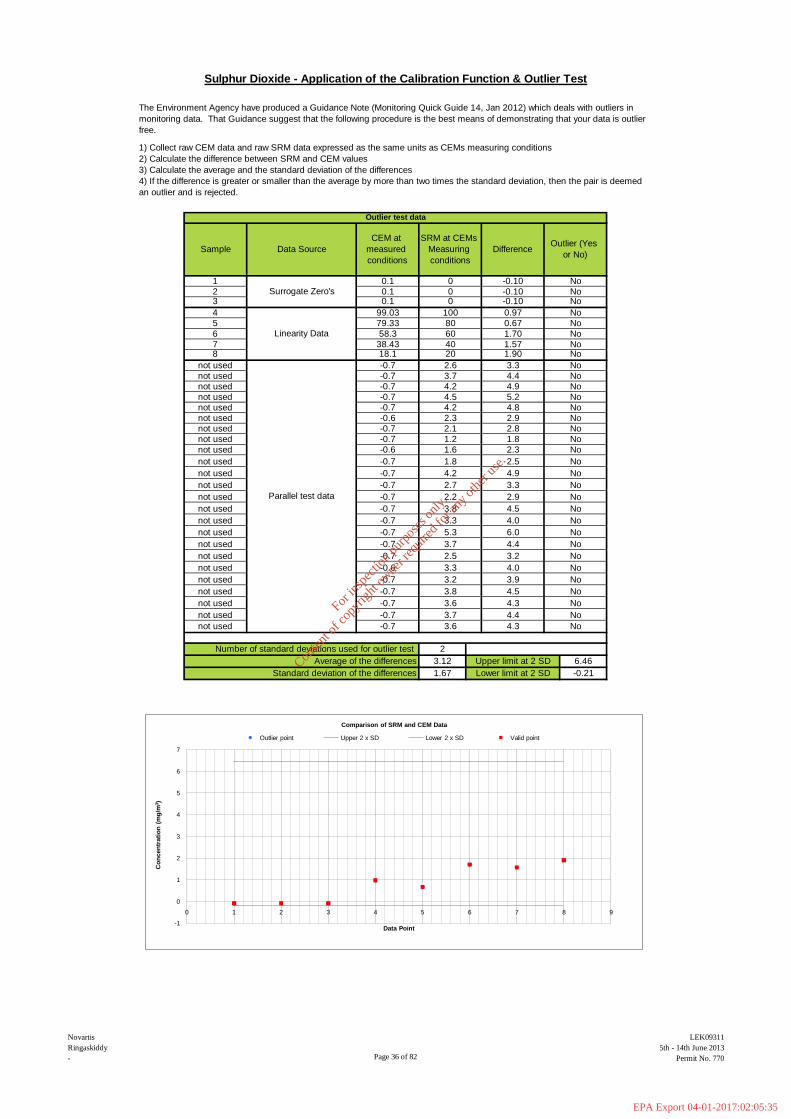
2Number of standard deviations used for outlier test
Average of the differences
Standard deviation of the differences
3.12
1.67
Data Source
Surrogate Zero's
Linearity Data
Parallel test data
0.1
0.1
0
0
-0.10
-0.10
No
No0.1 0 -0.10 No
99.03 100 0.97 No
79.33 80 0.67 No
58.3 60 1.70 No
5
6
78
not used
not used
not used
not used
not used
not used
not used
not used
not used
not used
not used
not used
not used
not used
not used
not used
not used
not used
not used
not used
not used
not used
not used
not used
CEM at
measured
conditions
SRM at CEMs
Measuring
conditions
-0.7 3.3 4.0 No
-0.7 5.3 6.0 No
38.43 40 1.57 No18.1 20 1.90 No
-0.7 2.6 3.3 No
-0.7 3.7 4.4 No
-0.7 4.2 4.9 No
-0.7 4.5 5.2 No
-0.7 4.2 4.8 No
-0.6 2.3 2.9 No
-0.7 2.1 2.8 No
1.6 2.3 No
-0.7 1.8 2.5 No
-0.7 4.2 4.9 No
-0.7 2.7 3.3 No
-0.7 2.2 2.9 No
-0.7 3.8 4.5
Outlier test data
DifferenceOutlier (Yes
or No)
No
Sample
1
The Environment Agency have produced a Guidance Note (Monitoring Quick Guide 14, Jan 2012) which deals with outliers in
monitoring data. That Guidance suggest that the following procedure is the best means of demonstrating that your data is outlier
free.
Sulphur Dioxide - Application of the Calibration Function & Outlier Test
1) Collect raw CEM data and raw SRM data expressed as the same units as CEMs measuring conditions
2) Calculate the difference between SRM and CEM values
3) Calculate the average and the standard deviation of the differences
4) If the difference is greater or smaller than the average by more than two times the standard deviation, then the pair is deemed
an outlier and is rejected.
Lower limit at 2 SD
6.46
-0.21
-0.7 3.7 4.4 No
-0.7 2.5 3.2 No
-0.6 3.3 4.0 No
-0.7 3.2 3.9 No
-0.7 3.8 4.5 No
-0.7 3.6 4.3 No
-0.7 3.7
23
4
4.4 No
-0.7 3.6 4.3 No
Upper limit at 2 SD
-0.7 1.2 1.8 No
-0.6
-1
0
1
2
3
4
5
6
7
0 1 2 3 4 5 6 7 8 9
Co
ncen
trati
on
(m
g/m
3)
Data Point
Comparison of SRM and CEM Data
Outlier point Upper 2 x SD Lower 2 x SD Valid point
Page 36 of 82
LEK09311
5th - 14th June 2013
Permit No. 770
Novartis
Ringaskiddy
-
For
insp
ectio
n pur
pose
s only
.
Conse
nt of
copy
right
owne
r req
uired
for a
ny ot
her u
se.
EPA Export 04-01-2017:02:05:35

Daily Emission Limit Value = 50 mg/m³
C.I. of the Daily Emission Limit Value = 10 mg/m³
The Environment Agency have published a Guidance document M20 which suggest that there are three approaches (Method A,
B or C) that can be taken when using BS EN 14181:2004 to derive a calibration function for the CEMs .
Method A. This method is used when there is sufficient spread of data to apply a linear regression ( derive a calibration function)
from the data pairs with no further manipulation of the data pairs. The parameters which suggest that Method A will be
successful are; the spread of SRM data is in excess of 15% of the daily emission limit value.
Method B. This method is used when the data pairs are above the confidence interval of the daily emission limit value, but there
is insufficient spread of SRM data to use Method A. Insufficient spread is defined as less than 15% of the daily emission limit
value. In this instance the data pairs will normally form a high level cluster and the approach in this instance is to use two defined
points for the derivation of the calibration. The first point is the average figure from the valid data pairs for both the CEM (x) and
SRM (y) and a second point which is at or near zero. This zero point or offset (Z) could for instance be the value that was
measured by the CEM (x) when zero gas (y) was applied during the functional checks.
Spread of SRM Values = 7.5 mg/m³
Since 9.7 < 10 (20% of ELV) , then Method C is used to calculate the calibration function.
Method C. This method is used when the data pairs form a low level cluster. A low level cluster is defined as when the data is
consistently below the 95% confidence interval at the daily ELV. In such instances the measurement uncertainties associated
with such values can be too high for a meaningful calibration to be derived. Consequently the CEM may be calibrated by a use of
surrogates and a linearity exercise. Preferably that linearity should be carried out to the procedural requirements of BS EN
14181: 2004 Section A 8 and Annex B.
The Environment Agency of England and Wales's MID gives further guidance on Method C clusters and it suggests that a true
cluster will have a best line of fit that displays an R2 value of <0.9 and the difference in the average SRM value and the CEM
value will be less than the confidence interval at the daily emission limit value.
Maximum SRM Value = 9.7 mg/m³
Minimum SRM Value = 2.2 mg/m³
Sulphur Dioxide - Calibration Function Method
Page 37 of 82
LEK09311
5th - 14th June 2013
Permit No. 770
Novartis
Ringaskiddy
-
For
insp
ectio
n pur
pose
s only
.
Conse
nt of
copy
right
owne
r req
uired
for a
ny ot
her u
se.
EPA Export 04-01-2017:02:05:35
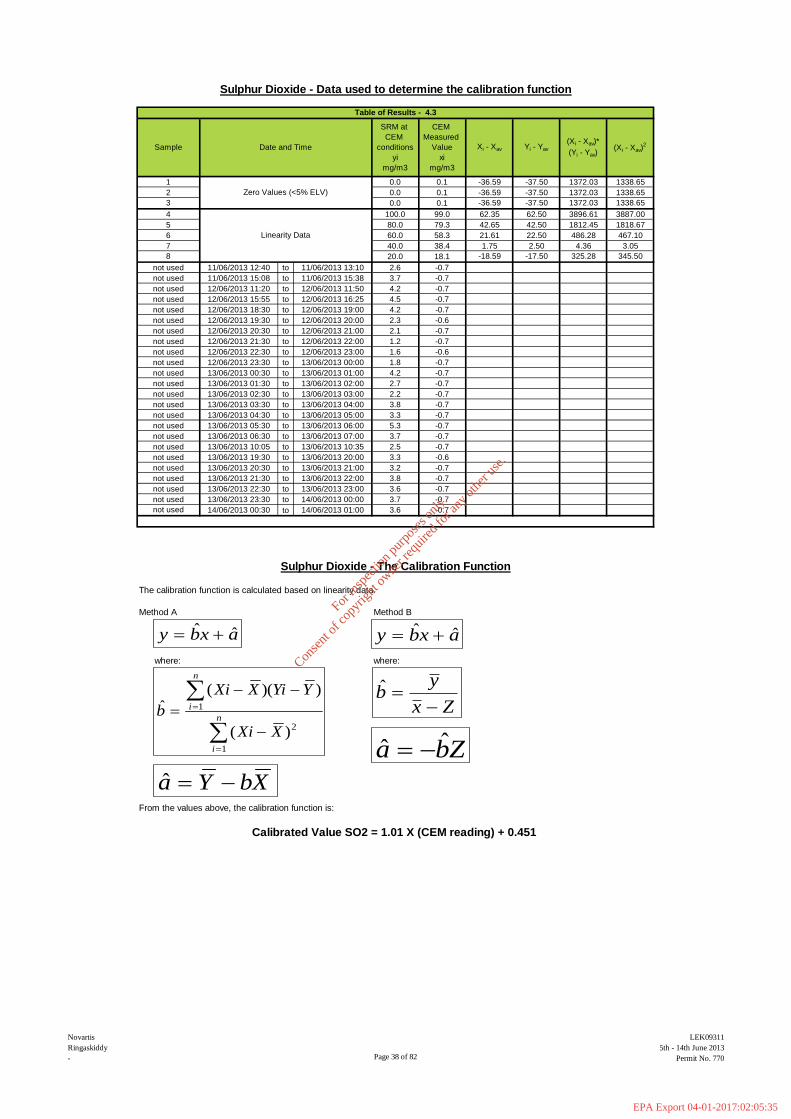
to
to
to
to
to
to
to
to
to
to
to
to
to
to
to
to
to
to
to
to
to
to
to
to
The calibration function is calculated based on linearity data.
Method A Method B
where: where:
From the values above, the calibration function is:
1
not used 13/06/2013 23:30 14/06/2013 00:00 3.7 -0.7
not used 14/06/2013 00:30 14/06/2013 01:00 3.6 -0.7
Calibrated Value SO2 = 1.01 X (CEM reading) + 0.451
not used 13/06/2013 19:30 13/06/2013 20:00 3.3 -0.6
not used 13/06/2013 20:30 13/06/2013 21:00 3.2 -0.7
not used 13/06/2013 21:30 13/06/2013 22:00 3.8 -0.7
not used 13/06/2013 22:30 13/06/2013 23:00 3.6 -0.7
Sulphur Dioxide - The Calibration Function
not used 13/06/2013 04:30 13/06/2013 05:00 3.3 -0.7
not used 13/06/2013 05:30 13/06/2013 06:00 5.3 -0.7
not used 13/06/2013 06:30 13/06/2013 07:00 3.7 -0.7
not used 13/06/2013 10:05 13/06/2013 10:35 2.5 -0.7
not used 13/06/2013 00:30 13/06/2013 01:00 4.2 -0.7
not used 13/06/2013 01:30 13/06/2013 02:00 2.7 -0.7
not used 13/06/2013 02:30 13/06/2013 03:00 2.2 -0.7
not used 13/06/2013 03:30 13/06/2013 04:00 3.8 -0.7
not used 12/06/2013 20:30 12/06/2013 21:00 2.1 -0.7
not used 12/06/2013 21:30 12/06/2013 22:00 1.2 -0.7
not used 12/06/2013 22:30 12/06/2013 23:00 1.6 -0.6
not used 12/06/2013 23:30 13/06/2013 00:00 1.8 -0.7
not used 12/06/2013 11:20 12/06/2013 11:50 4.2 -0.7
not used 12/06/2013 15:55 12/06/2013 16:25 4.5 -0.7
not used 12/06/2013 18:30 12/06/2013 19:00 4.2 -0.7
not used 12/06/2013 19:30 12/06/2013 20:00 2.3 -0.6
5 80.0 79.3
6 60.0 58.3
7 40.0 38.4
8 20.0 18.1
not used 2.6 -0.7
not used 11/06/2013 15:08 11/06/2013 15:38 3.7 -0.7
11/06/2013 13:1011/06/2013 12:40
Linearity Data
2 0.0 0.1
3 0.0 0.1
4 100.0 99.0
0.0 0.1
Date and Time
Zero Values (<5% ELV)
Sample
SRM at
CEM
conditions
yi
mg/m3
CEM
Measured
Value
xi
mg/m3
Sulphur Dioxide - Data used to determine the calibration function
325.28
4.36
486.28
1812.45
3896.61
1372.03
1372.03
1372.03
1338.65
1338.65
1338.65
3887.00
1818.67
467.10
3.05
345.50
Xi - Xav Yi - Yav
(Xi - Xav)*
(Yi - Yav)(Xi - Xav)
2
-36.59
-36.59
-36.59
62.35
42.65
21.61
1.75
-18.59
Table of Results - 4.3
-37.50
-37.50
-37.50
62.50
42.50
22.50
2.50
-17.50
Zx
yb
ˆ
Zba ˆˆ
axby ˆˆ axby ˆˆ
n
i
n
i
XXi
YYiXXi
b
1
2
1
)(
))((ˆ
XbYa ˆ
Page 38 of 82
LEK09311
5th - 14th June 2013
Permit No. 770
Novartis
Ringaskiddy
-
For
insp
ectio
n pur
pose
s only
.
Conse
nt of
copy
right
owne
r req
uired
for a
ny ot
her u
se.
EPA Export 04-01-2017:02:05:35
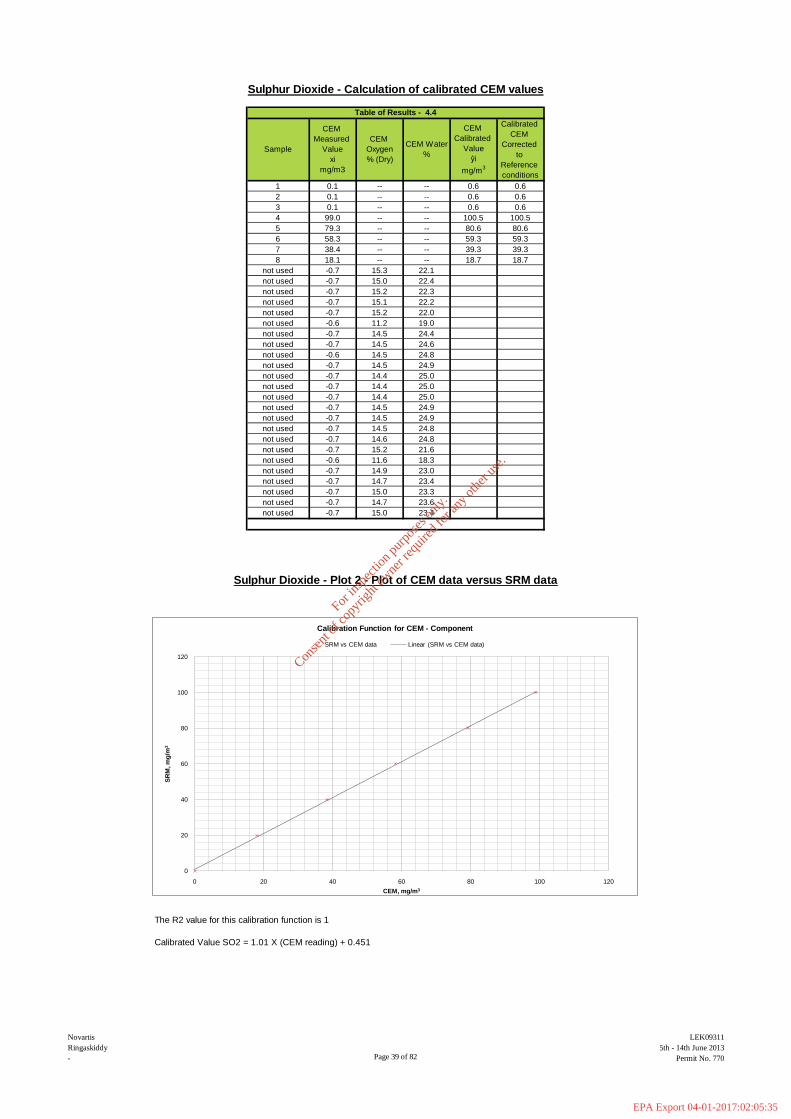
The R2 value for this calibration function is 1
Calibrated Value SO2 = 1.01 X (CEM reading) + 0.451
CEM
Measured
Value
xi
mg/m3
Sulphur Dioxide - Calculation of calibrated CEM values
Sulphur Dioxide - Plot 2 - Plot of CEM data versus SRM data
not used -0.7 14.7 23.6
not used -0.7 15.0 23.4
23.4
not used -0.7 15.0 23.3
not used -0.7 14.6 24.8
not used -0.7 15.2 21.6
not used -0.6 11.6 18.3
not used -0.7 14.7
not used -0.7 14.5 24.9
not used -0.7 14.5 24.9
not used -0.7 14.5 24.8
not used -0.7 14.9 23.0
not used -0.7 14.4 25.0
not used -0.7 14.4 25.0
not used -0.7 14.4 25.0
not used -0.7 14.5 24.6
not used -0.6 14.5 24.8
not used -0.7 14.5 24.9
not used -0.7 15.2 22.0
not used -0.6 11.2 19.0
not used -0.7 14.5 24.4
not used -0.7 15.0 22.4
not used -0.7 15.2 22.3
not used -0.7 15.1 22.2
7 38.4 -- -- 39.3 39.3
8 18.1 -- -- 18.7 18.7
not used -0.7 15.3 22.1
4 99.0 -- -- 100.5 100.5
5 79.3 -- -- 80.6 80.6
6 58.3 -- -- 59.3 59.3
2 0.1 -- -- 0.6 0.6
3 0.1 -- -- 0.6 0.6
Table of Results - 4.4
1 0.1 -- -- 0.6 0.6
Sample
CEM
Oxygen
% (Dry)
CEM Water
%
CEM
Calibrated
Value
ŷi
mg/m3
Calibrated
CEM
Corrected
to
Reference
conditions
0
20
40
60
80
100
120
0 20 40 60 80 100 120
SR
M, m
g/m
3
CEM, mg/m3
Calibration Function for CEM - Component
SRM vs CEM data Linear (SRM vs CEM data)
Page 39 of 82
LEK09311
5th - 14th June 2013
Permit No. 770
Novartis
Ringaskiddy
-
For
insp
ectio
n pur
pose
s only
.
Conse
nt of
copy
right
owne
r req
uired
for a
ny ot
her u
se.
EPA Export 04-01-2017:02:05:35

The variability is accepted if: Sd ≤ Qo x Kv
Where
Qo is the uncertainty laid down by the Authorities at the emission limit value as a 95% confidence interval.
Qo = Daily Emission Limit Value X Measurement Uncertainty
Where Daily Emission Limit = 50 mg/m³ Measurement Uncertainty = 20%
Kv = the test parameter (for 8 Pairs of Data is 0.9521)
Variability Pass Criteria
Sulphur Dioxide - Data Used for the variability test
not used
not used
not used
not used
not used
not used
0.76 < 4.86
Sulphur Dioxide - Variability Test
The next stage of the calibration process is to determine if the proposed calibration function passes the variability test.
Sd is the standard deviation of the differences between the SRM value at Reportable Conditions and the Calibrated CEM value at Reportable
Conditions.
not used
not used
not used
not used
not used
not used
CEM HAS PASSED VARIABILITY TEST
not used
1.96
not used
not used
not used
not used
not used
not used
not used
not used
not used
7 39.3 40.0 0.7 0.7 0.5
8 18.7 20.0 1.3 1.3 1.6
not used
4 100.5 100.0 -0.5 -0.5 0.2
5 80.6 80.0 -0.6 -0.6 0.3
6 59.3 60.0 0.7 0.7 0.5
2 0.6 0.0 -0.6 -0.6 0.3
3 0.6 0.0 -0.6 -0.6 0.3
1 0.6 0.0 -0.6 -0.6 0.3
Sample
CEM Dry
and
corrected
for 11%
Oxygen
SRM
Corrected
Value*
y is
mg/m3
Difference
between
SRM and
CEM
Difference
(D - Dmean)
Square of
Difference
(D - Dmean)2
Table of Results - 4.5
not used
vD ks 0
Page 40 of 82
LEK09311
5th - 14th June 2013
Permit No. 770
Novartis
Ringaskiddy
-
For
insp
ectio
n pur
pose
s only
.
Conse
nt of
copy
right
owne
r req
uired
for a
ny ot
her u
se.
EPA Export 04-01-2017:02:05:35

Plot of calibrated CEM data versus SRM data, dry and corrected to 11% oxygen
Valid Calibration Range is:
0 to 10.7 mg/m3
Sulphur Dioxide - Plot 3 - Plot of calibrated CEM data versus SRM data
0
20
40
60
80
100
120
0 20 40 60 80 100 120
SR
M, m
g/m
3(D
ry a
nd
Co
rrecte
d f
or
Oxy
gen
)
CEM, mg/m3 (Calibration Function Applied, Dry and Corrected for Oxygen)
SRM concentrations vs Calibrated and Corrected CEM concentrations
SRM vs CEM Linear (SRM vs CEM)
Page 41 of 82
LEK09311
5th - 14th June 2013
Permit No. 770
Novartis
Ringaskiddy
-
For
insp
ectio
n pur
pose
s only
.
Conse
nt of
copy
right
owne
r req
uired
for a
ny ot
her u
se.
EPA Export 04-01-2017:02:05:35

0 to 50 mg/m3
0 to 10.7 mg/m3
Sulphur Dioxide - Valid range & range extension
Having passed the variability test the next stage of the process is to establish the valid range of the calibrated CEMs
values at reportable conditions. This is done by finding the maximum CEM value at reportable conditions from the
parallel testing pairs (not including linearity data) and then adding 10% to that value.
If after the parallel testing phase of the QAL 2 it was possible to derive a calibration function, but the function has
a limited valid range i.e. it does not extend to or beyond the emission limit value, then it may be possible to extend
the valid range of the function to which ever is the lowest of either the highest surrogate or the emission limit
value. To do this there has to be good agreement between the calibration function and the linearity data.
Good agreement is defined as when the two sets of data are overlain they lie within the allowable uncertainty at a 95%
confidence interval at the emission limit value for the parameter in question.
The allowable uncertainty at a 95% confidence interval at the emission limit value is calculated by applying the Qo
equation which is also used in the test of variability.
On this occasion, Method C has been used meaning the calibration function has been derived from linearity data,
therefore the extended range is quoted as the ELV (If surogate values exceeded the ELV)
0.0
20.0
40.0
60.0
80.0
100.0
120.0
0.0 20.0 40.0 60.0 80.0 100.0 120.0
SR
M, m
g/m
3
Calibrated CEM, mg/m3
Range extension of calibration function based on linearity data
Min Max Linearity Data SRM v Cal'd CEM extrapolated data Linear (Linearity Data)
Page 42 of 82
LEK09311
5th - 14th June 2013
Permit No. 770
Novartis
Ringaskiddy
-
For
insp
ectio
n pur
pose
s only
.
Conse
nt of
copy
right
owne
r req
uired
for a
ny ot
her u
se.
EPA Export 04-01-2017:02:05:35

to
to
to
to
to
to
to
to
to
to
to
to
to
to
to
to
to
to
to
to
to
to
to
to
Note - CEM data requires the following corrections to be expressed at STP, Dry and 11 % O2
Moisture Correction required
Oxygen Correction required
--
--
--
--
--
--
--
22.1
--
11/06/2013 15:38
0.0
0.9
0.8
0.9
0.8
0.7
14.5
14.5
14.5
14.4
14.4
14.4
14.7
15.0-0.1
11/06/2013 12:40
11/06/2013 15:08
12/06/2013 11:20
12/06/2013 15:55
13/06/2013 22:30
13/06/2013 23:30
11/06/2013 13:10
not used
not used
23.4
23.3
23.6
15.0
--
--
--
15.3
not used 13/06/2013 22:00
13/06/2013 23:00
14/06/2013 00:00
2.9
12/06/2013 20:00
12/06/2013 21:00
12/06/2013 22:00
13/06/2013 21:00
25.0
25.0
24.9
not used
not used
not used
not used
not used
not used
not used
not used
not used
not used
not used
not used
not used
not used
not used
not used
not used
not used
not used
not used
14/06/2013 01:00
13/06/2013 06:00
13/06/2013 07:00
13/06/2013 10:35
14/06/2013 00:30not used
15.0
15.2
15.1
15.2
11.2
14.5
0.0
0.0
0.0 --
--
--
--
--
--
--
--
--
--
2
3
4
5
6
7
8
12/06/2013 11:50
-0.1
-0.1
-0.1
12/06/2013 23:00
13/06/2013 00:00
13/06/2013 01:00
13/06/2013 02:00
13/06/2013 03:00
13/06/2013 04:00
13/06/2013 05:00
22.2
22.0
19.0
24.4
24.6
24.8
24.9
25.0
12/06/2013 23:30
13/06/2013 00:30
13/06/2013 01:30
13/06/2013 02:30
13/06/2013 03:30
13/06/2013 04:30
13/06/2013 05:30
13/06/2013 06:30
13/06/2013 10:05
13/06/2013 19:30
-0.1
-0.1
-0.1
-0.1
-0.1
-0.1
-0.1
14.5
14.5
14.5
14.6
15.2
14.7
13/06/2013 20:30
13/06/2013 21:30
8.0
22.8
14.1
1.0
0.8
0.7
0.9
0.8
0.8
0.8
0.9
0.8
23.4
Hydrogen Chloride - Raw Monitoring Data
-0.1
0.0
-0.1
-0.2
-0.2
-0.2
-0.1
-0.1
-0.1
-0.1
-0.1
Table of Results - 4.1
CEM
Measured
Value
xi
mg/m3
CEM
Oxygen
%
CEM Water
%
SRM
Measured
Value
yi
mg/m3
SRM
Oxygen
%
SRM Water
%Sample Date and Time
1
Zero Values (<5% ELV)
Linearity Data
0.1
0.1
0.1
16.7
13.4
9.6
6.1
13/06/2013 20:00
-0.1
12/06/2013 16:25
12/06/2013 19:00
0.7
0.9
0.9
24.9
24.8
24.8
21.6
18.3
23.0
--
--
--
--
--
16.0
20.0
12/06/2013 18:30
12/06/2013 19:30
12/06/2013 20:30
12/06/2013 21:30
12/06/2013 22:30
24.1
21.9
21.5
22.1
20.7
22.6
--
--
--
24.8
23.7
24.9
24.9
24.6
24.8
24.7
24.5
24.2
22.1
22.0
22.1
21.9
21.5
21.7
21.5
24.7
--
--
14.8
14.8
14.9
15.1
14.8
13.9
14.0
12.0 --
0.9
0.9
0.8
0.6
0.8
0.9
1.0
4.0
14.8
15.1
14.8
15.0
14.8
15.0
14.0
13.9
13.9
13.7
13.9
14.0
13.2
14.0
12.9
14.9
22.4
22.3
11.6
14.9
Page 43 of 82
LEK09311
5th - 14th June 2013
Permit No. 770
Novartis
Ringaskiddy
-
For
insp
ectio
n pur
pose
s only
.
Conse
nt of
copy
right
owne
r req
uired
for a
ny ot
her u
se.
EPA Export 04-01-2017:02:05:35

to
to
to
to
to
to
to
to
to
to
to
to
to
to
to
to
to
to
to
to
to
to
to
to -0.214/06/2013 01:00
0.0
0.0
0.0
20.0
16.0
12.0
8.0
4.0
2.0
1.9
1.6
1.4
1.7
1.7
not used
not used
not used
not used
not used
not used
not used
not used
not used
13/06/2013 05:30
13/06/2013 22:00
13/06/2013 23:00
14/06/2013 00:00
Hydrogen Chloride - Plot 1 - Time series of data
-0.2
-0.2
-0.2
-0.2
-0.2
-0.3
0.0
-0.2
-0.21.6
1.9
1.7
1.9
0.1
0.1
0.1
16.7
13.4
9.6
6.1
2.9
-0.1
-0.2
-0.2
-0.2
-0.2
-0.2
-0.2
13/06/2013 19:30
13/06/2013 20:30
1.5
1.413/06/2013 21:00
13/06/2013 21:30
13/06/2013 22:30
13/06/2013 23:30
14/06/2013 00:30
not used
not used
3
4
5
6
7
8
-0.4
-0.4
-0.4
-0.2
11/06/2013 13:1011/06/2013 12:40not used
13/06/2013 06:30
13/06/2013 10:05
-0.3
not used
not used
not used
not used
1.6
Difference
of SRM and
CEM
corrected
values
1.1
1.9
2.4
2.6
3.3
N/A
N/A
N/A
N/A
N/A
N/A
N/A
N/A
N/A
N/A
Table of Results - 4.2
not used
not used
Sample Date and Time
SRM
Corrected
Value
y is
mg/m3
CEM Dry
and
corrected
for, 11%
Oxygen
Zero Values (<5% ELV)
Linearity Data
1
2
-0.2
-0.2not used
1.7
1.6
Hydrogen Chloride - Standardised Monitoring Data
1.5
1.513/06/2013 01:00
13/06/2013 02:00
13/06/2013 03:00
13/06/2013 04:00
13/06/2013 05:00
13/06/2013 06:00
13/06/2013 20:00
11/06/2013 15:38
12/06/2013 11:50
12/06/2013 16:25
12/06/2013 19:00
12/06/2013 20:00
12/06/2013 21:00
12/06/2013 22:00
12/06/2013 23:00
13/06/2013 00:00
Difference
less than
half the
confidence
interval at
the ELV?
Yes
Yes
Yes
No
No
No
Yes
Yes
N/A
N/A
N/A
N/A
N/A
N/A
N/A
N/A
N/A
N/A
N/A
N/A
N/A
1.5
1.6
1.3
1.6
1.5
1.8
1.9
13/06/2013 07:00
13/06/2013 10:35
11/06/2013 15:08
12/06/2013 11:20
12/06/2013 15:55
12/06/2013 18:30
12/06/2013 19:30
12/06/2013 20:30
12/06/2013 21:30
12/06/2013 22:30
12/06/2013 23:30
13/06/2013 00:30
13/06/2013 01:30
13/06/2013 02:30
13/06/2013 03:30
13/06/2013 04:30
not used
not used
not used
not used
not used
N/A
0.1
0.1
0.1
-1.0
-0.5
0.0
0.5
1.0
1.5
2.0
2.5
0 1 2 3 4 5 6 7 8 9 10 11 12 13 14 15 16 17 18 19 20 21 22 23 24 25 26
Co
ncen
trati
on
(m
g/m
3)
Data Point
Comparison of SRM and CEM Standardised Data SRM CEM
Page 44 of 82
LEK09311
5th - 14th June 2013
Permit No. 770
Novartis
Ringaskiddy
-
For
insp
ectio
n pur
pose
s only
.
Conse
nt of
copy
right
owne
r req
uired
for a
ny ot
her u
se.
EPA Export 04-01-2017:02:05:35

The Environment Agency have produced a Guidance Note (Monitoring Quick Guide 14, Jan 2012) which deals with outliers in
monitoring data. That Guidance suggest that the following procedure is the best means of demonstrating that your data is outlier
free.
not used
CEM at
measured
conditions
SRM at CEMs
Measuring
conditions
Difference
12 2.40 No
No
-0.1 1.0 1.1 No
Sample
1
23
4
5
6
78
not used
not used
not used
not used
not used
not used
not used
not used
not used
not used
not used
not used
not used
not used
not used
not used
No
-0.1 0.7 0.9 No
-0.1 0.8
0.9 1.1 No
-0.1 0.9 1.0 No
-0.1 0.8 0.9 No
-0.1 0.9 1.0 No
-0.1 0.8 0.9 No
-0.1 0.8 0.9 No
-0.1
2.40
-0.30
-0.1 0.9 1.0 No
-0.1 0.9 1.1 No
0.0 0.7 0.7 No
-0.1 0.7 0.8 No
-0.1 0.8 0.9 No
-0.1 0.9 1.0 No
-0.1 0.8 0.9 No
-0.1 0.9 1.0 No
Upper limit at 2 SD
2Number of standard deviations used for outlier test
Average of the differences
Standard deviation of the differences
1.05
0.67
not used
not used
Parallel test data
not used
not used
not used
not used
not used
0.8 0.9 No
Lower limit at 2 SD
Outlier (Yes
or No)Data Source
-0.1 0.9 1.0
Surrogate Zero's
Linearity Data
0.06
0.06
0
0
-0.06
-0.06
No
No0.06 0 -0.06 No
16.73 20 3.27 No
13.38333333 16 2.62 No
9.603333333
0.9
Outlier test data
6.13 8 1.87 No2.946666667 4 1.05 No
0.0 1.0 1.0 No
-0.1 0.9 1.0 No
-0.2 0.8 0.9 No
-0.2 0.6 0.8 No
-0.2 0.8 1.0 No
-0.1
Hydrogen Chloride - Application of the Calibration Function & Outlier Test
1) Collect raw CEM data and raw SRM data expressed as the same units as CEMs measuring conditions
2) Calculate the difference between SRM and CEM values
3) Calculate the average and the standard deviation of the differences
4) If the difference is greater or smaller than the average by more than two times the standard deviation, then the pair is deemed
an outlier and is rejected.
-0.5
0.0
0.5
1.0
1.5
2.0
2.5
3.0
3.5
0 1 2 3 4 5 6 7 8 9
Co
ncen
trati
on
(m
g/m
3)
Data Point
Comparison of SRM and CEM Data
Outlier point Upper 2 x SD Lower 2 x SD Valid point
Page 45 of 82
LEK09311
5th - 14th June 2013
Permit No. 770
Novartis
Ringaskiddy
-
For
insp
ectio
n pur
pose
s only
.
Conse
nt of
copy
right
owne
r req
uired
for a
ny ot
her u
se.
EPA Export 04-01-2017:02:05:35

Daily Emission Limit Value = 10 mg/m³
C.I. of the Daily Emission Limit Value = 4 mg/m³
Hydrogen Chloride - Calibration Function Method
Spread of SRM Values = 0.7 mg/m³
Since 2 < 4 (40% of ELV) , then Method C is used to calculate the calibration function.
The Environment Agency have published a Guidance document M20 which suggest that there are three approaches (Method A,
B or C) that can be taken when using BS EN 14181:2004 to derive a calibration function for the CEMs .
Method A. This method is used when there is sufficient spread of data to apply a linear regression ( derive a calibration function)
from the data pairs with no further manipulation of the data pairs. The parameters which suggest that Method A will be
successful are; the spread of SRM data is in excess of 15% of the daily emission limit value.
Method B. This method is used when the data pairs are above the confidence interval of the daily emission limit value, but there
is insufficient spread of SRM data to use Method A. Insufficient spread is defined as less than 15% of the daily emission limit
value. In this instance the data pairs will normally form a high level cluster and the approach in this instance is to use two defined
points for the derivation of the calibration. The first point is the average figure from the valid data pairs for both the CEM (x) and
SRM (y) and a second point which is at or near zero. This zero point or offset (Z) could for instance be the value that was
measured by the CEM (x) when zero gas (y) was applied during the functional checks.
Method C. This method is used when the data pairs form a low level cluster. A low level cluster is defined as when the data is
consistently below the 95% confidence interval at the daily ELV. In such instances the measurement uncertainties associated
with such values can be too high for a meaningful calibration to be derived. Consequently the CEM may be calibrated by a use of
surrogates and a linearity exercise. Preferably that linearity should be carried out to the procedural requirements of BS EN
14181: 2004 Section A 8 and Annex B.
The Environment Agency of England and Wales's MID gives further guidance on Method C clusters and it suggests that a true
cluster will have a best line of fit that displays an R2 value of <0.9 and the difference in the average SRM value and the CEM
value will be less than the confidence interval at the daily emission limit value.
Maximum SRM Value = 2 mg/m³
Minimum SRM Value = 1.3 mg/m³
Page 46 of 82
LEK09311
5th - 14th June 2013
Permit No. 770
Novartis
Ringaskiddy
-
For
insp
ectio
n pur
pose
s only
.
Conse
nt of
copy
right
owne
r req
uired
for a
ny ot
her u
se.
EPA Export 04-01-2017:02:05:35

to
to
to
to
to
to
to
to
to
to
to
to
to
to
to
to
to
to
to
to
to
to
to
to
The calibration function is calculated based on linearity data.
Method A Method B
where: where:
From the values above, the calibration function is:
Hydrogen Chloride - Data used to determine the calibration function
Hydrogen Chloride - The Calibration Function
Date and Time
Zero Values (<5% ELV)
Linearity Data
Sample
SRM at
CEM
conditions
yi
mg/m3
CEM
Measured
Value
xi
mg/m3
1
2
3
4
5
6
11/06/2013 15:08
12/06/2013 11:20
12/06/2013 15:55
12/06/2013 18:30
12/06/2013 19:30
12/06/2013 20:30
-0.1
0.0 0.1
0.0
0.0
20.0
16.0
12.0
8.0
4.0
1.0
0.9
0.8
7
8
not used
not used
not used
not used
3.48
0.01
not used
not used
not used
not used
not used
not used
not used
not used
11/06/2013 12:40
12/06/2013 23:30
13/06/2013 00:30
13/06/2013 01:30
13/06/2013 02:30
13/06/2013 03:30
13/06/2013 04:30
13/06/2013 05:30
13/06/2013 06:30
13/06/2013 10:05
13/06/2013 19:30
13/06/2013 20:30
13/06/2013 21:30
13/06/2013 22:30
13/06/2013 23:30
14/06/2013 00:30
not used
not used
not used
not used
not used
not used
not used
not used
not used
12/06/2013 21:30
12/06/2013 22:30
11/06/2013 15:38
12/06/2013 11:50
12/06/2013 16:25
12/06/2013 19:00
12/06/2013 20:00
12/06/2013 21:00
12/06/2013 22:00
12/06/2013 23:00
not used
13/06/2013 02:00
13/06/2013 03:00
13/06/2013 04:00
13/06/2013 05:00
13/06/2013 06:00
13/06/2013 20:00
not used
not used
13/06/2013 21:00
13/06/2013 22:00
13/06/2013 23:00
14/06/2013 00:00
-0.1
-0.1
-0.1
-0.1
-0.1
-0.1
-0.1
-0.1
0.0
-0.1
0.7
0.7
0.8
0.9
0.8
0.9
0.1
0.1
16.7
13.4
6.1
0.9
0.8
0.9
13/06/2013 00:00
13/06/2013 01:00
9.6
13/06/2013 07:00
13/06/2013 10:35
11/06/2013 13:10
0.9
2.9
0.0
-0.2
-0.2
-0.2
-0.1
-0.1
-0.1
-0.1
-0.1
-0.1
0.8
0.8
0.8
-0.1
0.7
0.8
1.0
0.9
0.9
-0.1
-0.1
0.6
0.8
0.9
-6.06
10.61
7.26
14/06/2013 01:00
Calibrated Value HCl = 1.479 X (CEM reading) -1.553
Xi - Xav Yi - Yav
(Xi - Xav)*
(Yi - Yav)(Xi - Xav)
2
-6.06
-6.06
Table of Results - 4.3
36.74
36.74
36.74
112.54
52.73
12.12
0.00
10.08
-7.50
-7.50
-7.50
12.50
8.50
4.50
0.50
-3.50
0.00
15.67
61.72
132.60
45.46
45.46
45.46
-3.18 11.11
Zx
yb
ˆ
Zba ˆˆ
axby ˆˆ axby ˆˆ
n
i
n
i
XXi
YYiXXi
b
1
2
1
)(
))((ˆ
XbYa ˆ
Page 47 of 82
LEK09311
5th - 14th June 2013
Permit No. 770
Novartis
Ringaskiddy
-
For
insp
ectio
n pur
pose
s only
.
Conse
nt of
copy
right
owne
r req
uired
for a
ny ot
her u
se.
EPA Export 04-01-2017:02:05:35
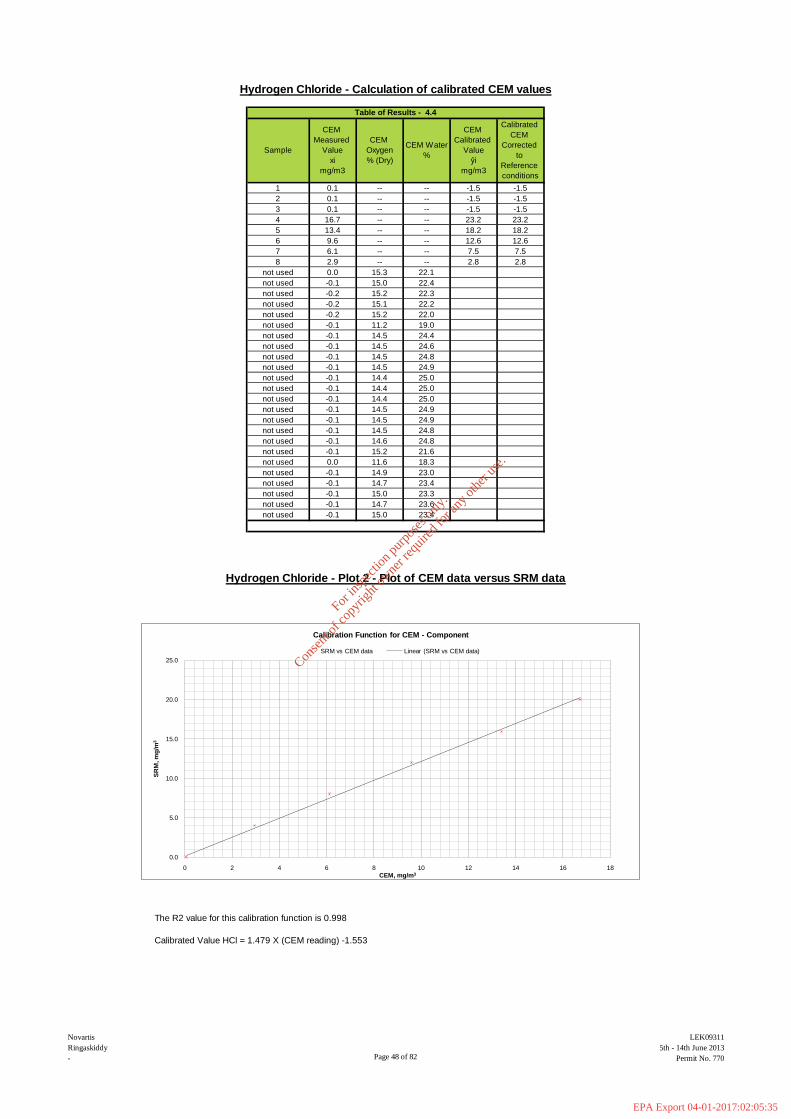
The R2 value for this calibration function is 0.998
Calibrated Value HCl = 1.479 X (CEM reading) -1.553
Hydrogen Chloride - Calculation of calibrated CEM values
Hydrogen Chloride - Plot 2 - Plot of CEM data versus SRM data
CEM
Calibrated
Value
ŷi
mg/m3
Calibrated
CEM
Corrected
to
Reference
conditions
5
6
7
8
not used
not used
not used
1 0.1 -- -- -1.5 -1.5
2
3
4
--
--
--
--
--
--
--
15.3
15.0
15.2
15.1
15.2
-0.1not used
not used
not used
not used
not used
not used
22.0
19.0
24.4
24.6
24.8
24.9
25.0
25.0
25.0
24.9
24.9
24.8
14.5
14.5
14.6
15.2
11.6
14.9
--
22.1
22.4
22.3
22.2
not used
not used
Sample
CEM
Measured
Value
xi
mg/m3
CEM
Oxygen
% (Dry)
CEM Water
%
not used
not used
not used
not used
not used
not used
not used
not used
not used
not used
-0.1
-0.1
-0.1
0.0
-0.1
-0.1
-0.1
-0.1
-0.1not used
Table of Results - 4.4
0.1
0.1
16.7
13.4
9.6
6.1
2.9
0.0
-0.1
-0.2
-0.2
-0.2
-0.1
-0.1
-0.1
-0.1
-0.1
-0.1
-0.1
-0.1
-0.1
14.7
11.2
14.5
14.5
14.5
14.5
14.4
14.4
15.0
--
--
--
--
--
--
23.3
23.6
23.4
-1.5
-1.5
23.2
18.2
12.6
7.5
2.8
23.0
23.4
14.4
14.5
-1.5
-1.5
23.2
18.2
12.6
7.5
2.8
24.8
21.6
18.3
not used
not used
14.7
15.0
0.0
5.0
10.0
15.0
20.0
25.0
0 2 4 6 8 10 12 14 16 18
SR
M, m
g/m
3
CEM, mg/m3
Calibration Function for CEM - Component
SRM vs CEM data Linear (SRM vs CEM data)
Page 48 of 82
LEK09311
5th - 14th June 2013
Permit No. 770
Novartis
Ringaskiddy
-
For
insp
ectio
n pur
pose
s only
.
Conse
nt of
copy
right
owne
r req
uired
for a
ny ot
her u
se.
EPA Export 04-01-2017:02:05:35

The variability is accepted if: Sd ≤ Qo x Kv
Where
Qo is the uncertainty laid down by the Authorities at the emission limit value as a 95% confidence interval.
Qo = Daily Emission Limit Value X Measurement Uncertainty
Where Daily Emission Limit = 10 mg/m³ Measurement Uncertainty = 40%
Kv = the test parameter (for 8 Pairs of Data is 0.9521)
Variability Pass Criteria
Hydrogen Chloride - Data Used for the variability test
Hydrogen Chloride - Variability Test
The next stage of the calibration process is to determine if the proposed calibration function passes the variability test.
Sd is the standard deviation of the differences between the SRM value at Reportable Conditions and the Calibrated CEM value at Reportable
Conditions.
1.96
1.84 < 1.94
CEM HAS PASSED VARIABILITY TEST
not used
not used
not used
not used
not used
not used
not used
not used
2.1
10.2
5.0
0.4
0.2
1.4
0.5
not used
not used
not used
not used
not used
not used
not used
not used
not used
not used
not used
not used
0.0
0.0
20.0
16.0
12.0
8.0
4.0
-2.2
-0.66
7
8
not used
not used
1.5
1.5
-3.2
-1.5 0.0 1.5 1.5 2.1
-1.5
-1.5
1.2
0.5
1.2
-0.6
23.2
18.2
12.6
7.5
2.8
2.11.5
1.5
-3.2
-2.2
Sample
CEM Dry
and
corrected
for 11%
Oxygen
SRM
Corrected
Value*
y is
mg/m3
Difference
between
SRM and
CEM
Difference
(D - Dmean)
not used
not used
Square of
Difference
(D - Dmean)2
Table of Results - 4.5
1
2
3
4
5
vD ks 0
Page 49 of 82
LEK09311
5th - 14th June 2013
Permit No. 770
Novartis
Ringaskiddy
-
For
insp
ectio
n pur
pose
s only
.
Conse
nt of
copy
right
owne
r req
uired
for a
ny ot
her u
se.
EPA Export 04-01-2017:02:05:35
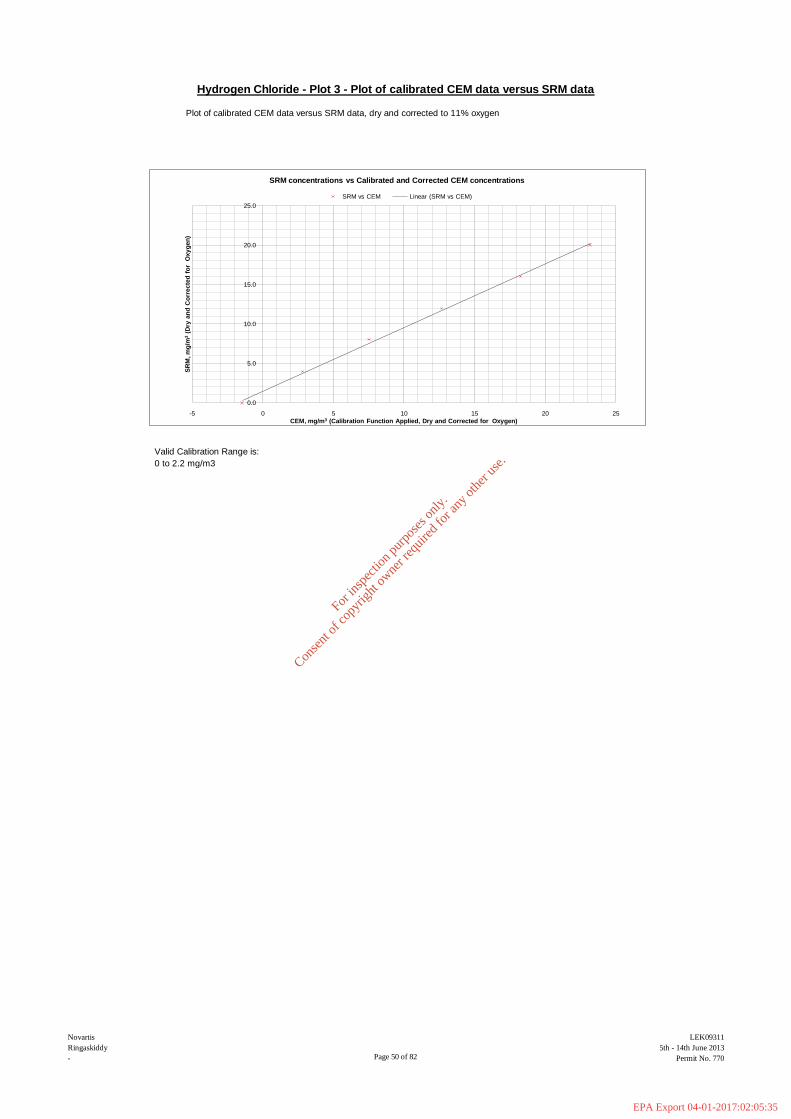
Plot of calibrated CEM data versus SRM data, dry and corrected to 11% oxygen
Valid Calibration Range is:
0 to 2.2 mg/m3
Hydrogen Chloride - Plot 3 - Plot of calibrated CEM data versus SRM data
0.0
5.0
10.0
15.0
20.0
25.0
-5 0 5 10 15 20 25
SR
M, m
g/m
3(D
ry a
nd
Co
rrecte
d f
or
Oxy
gen
)
CEM, mg/m3 (Calibration Function Applied, Dry and Corrected for Oxygen)
SRM concentrations vs Calibrated and Corrected CEM concentrations
SRM vs CEM Linear (SRM vs CEM)
Page 50 of 82
LEK09311
5th - 14th June 2013
Permit No. 770
Novartis
Ringaskiddy
-
For
insp
ectio
n pur
pose
s only
.
Conse
nt of
copy
right
owne
r req
uired
for a
ny ot
her u
se.
EPA Export 04-01-2017:02:05:35
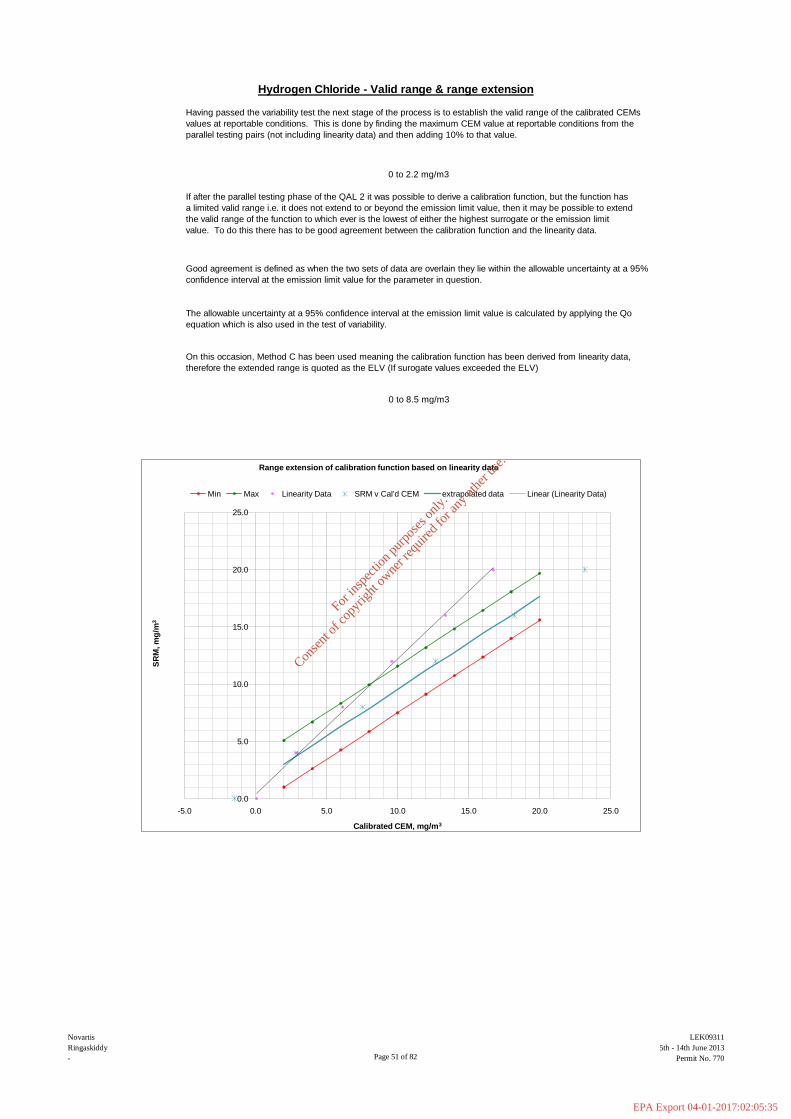
Having passed the variability test the next stage of the process is to establish the valid range of the calibrated CEMs
values at reportable conditions. This is done by finding the maximum CEM value at reportable conditions from the
parallel testing pairs (not including linearity data) and then adding 10% to that value.
0 to 2.2 mg/m3
0 to 8.5 mg/m3
Hydrogen Chloride - Valid range & range extension
If after the parallel testing phase of the QAL 2 it was possible to derive a calibration function, but the function has
a limited valid range i.e. it does not extend to or beyond the emission limit value, then it may be possible to extend
the valid range of the function to which ever is the lowest of either the highest surrogate or the emission limit
value. To do this there has to be good agreement between the calibration function and the linearity data.
Good agreement is defined as when the two sets of data are overlain they lie within the allowable uncertainty at a 95%
confidence interval at the emission limit value for the parameter in question.
The allowable uncertainty at a 95% confidence interval at the emission limit value is calculated by applying the Qo
equation which is also used in the test of variability.
On this occasion, Method C has been used meaning the calibration function has been derived from linearity data,
therefore the extended range is quoted as the ELV (If surogate values exceeded the ELV)
0.0
5.0
10.0
15.0
20.0
25.0
-5.0 0.0 5.0 10.0 15.0 20.0 25.0
SR
M, m
g/m
3
Calibrated CEM, mg/m3
Range extension of calibration function based on linearity data
Min Max Linearity Data SRM v Cal'd CEM extrapolated data Linear (Linearity Data)
Page 51 of 82
LEK09311
5th - 14th June 2013
Permit No. 770
Novartis
Ringaskiddy
-
For
insp
ectio
n pur
pose
s only
.
Conse
nt of
copy
right
owne
r req
uired
for a
ny ot
her u
se.
EPA Export 04-01-2017:02:05:35
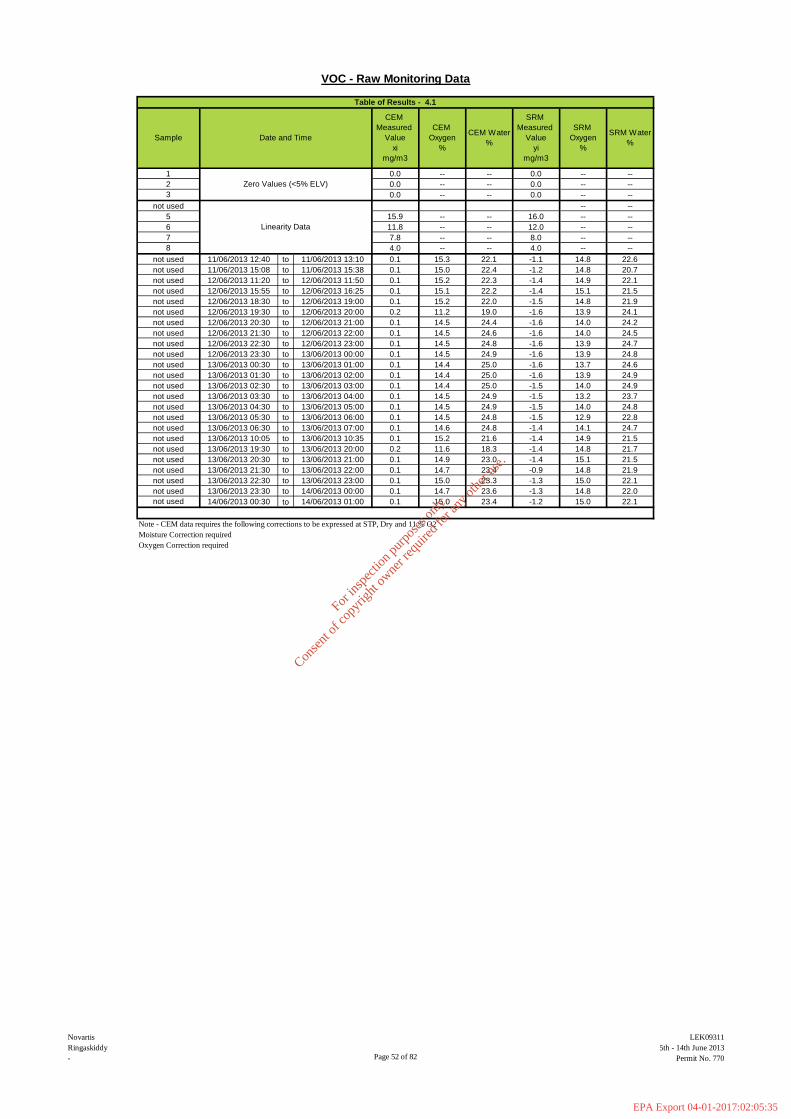
to
to
to
to
to
to
to
to
to
to
to
to
to
to
to
to
to
to
to
to
to
to
to
to
Note - CEM data requires the following corrections to be expressed at STP, Dry and 11 % O2
Moisture Correction required
Oxygen Correction required
8 4.0 -- -- 4.0 -- --
not used 0.1 15.3
2 0.0 -- -- 0.0 -- --
3 0.0 -- -- 0.0 -- --
not used -- --
5 15.9 -- -- 16.0 -- --
6 11.8 -- -- 12.0 -- --
7 7.8 -- -- 8.0 -- --
22.1 -1.1 14.8 22.6
--
VOC - Raw Monitoring Data
not used 11/06/2013 15:08 11/06/2013 15:38 0.1 15.0 22.4 -1.2 14.8 20.7
not used 12/06/2013 11:20 12/06/2013 11:50 0.1 15.2 22.3 -1.4 14.9 22.1
11/06/2013 12:40
not used 12/06/2013 15:55 12/06/2013 16:25 0.1 15.1 22.2 -1.4 15.1 21.5
not used 12/06/2013 18:30 12/06/2013 19:00 0.1 15.2 22.0 -1.5 14.8 21.9
not used 12/06/2013 19:30 12/06/2013 20:00 0.2 11.2 19.0 -1.6 13.9 24.1
not used 12/06/2013 20:30 12/06/2013 21:00 0.1 14.5 24.4 -1.6 14.0 24.2
not used 12/06/2013 21:30 12/06/2013 22:00 0.1 14.5 24.6 -1.6 14.0 24.5
not used 12/06/2013 22:30 12/06/2013 23:00 0.1 14.5 24.8 -1.6 13.9 24.7
not used 12/06/2013 23:30 13/06/2013 00:00 0.1 14.5 24.9 -1.6 13.9 24.8
not used 13/06/2013 00:30 13/06/2013 01:00 0.1 14.4 25.0 -1.6 13.7 24.6
not used 13/06/2013 01:30 13/06/2013 02:00 0.1 14.4 25.0 -1.6 13.9 24.9
not used 13/06/2013 02:30 13/06/2013 03:00 0.1 14.4 25.0 -1.5 14.0 24.9
not used 13/06/2013 03:30 13/06/2013 04:00 0.1 14.5 24.9 -1.5 13.2 23.7
not used 13/06/2013 04:30 13/06/2013 05:00 0.1 14.5 24.9 -1.5 14.0 24.8
not used 13/06/2013 05:30 13/06/2013 06:00 0.1 14.5 24.8 -1.5 12.9 22.8
not used 13/06/2013 06:30 13/06/2013 07:00 0.1 14.6 24.8 -1.4 14.1 24.7
not used 13/06/2013 10:05 13/06/2013 10:35 0.1 15.2 21.6 -1.4 14.9 21.5
not used 13/06/2013 19:30 13/06/2013 20:00 0.2 11.6 18.3 -1.4 14.8 21.7
not used 13/06/2013 20:30 13/06/2013 21:00 0.1 14.9 23.0 -1.4 15.1 21.5
not used 13/06/2013 21:30 13/06/2013 22:00 0.1 14.7 23.4 -0.9 14.8 21.9
not used 13/06/2013 22:30 13/06/2013 23:00 0.1 15.0 23.3 -1.3 15.0 22.1
not used 13/06/2013 23:30 14/06/2013 00:00 0.1 14.7 23.6 -1.3 14.8 22.0
not used 14/06/2013 00:30 14/06/2013 01:00 0.1 15.0 23.4 -1.2 15.0 22.1
Table of Results - 4.1
CEM
Measured
Value
xi
mg/m3
CEM
Oxygen
%
CEM Water
%
SRM
Measured
Value
yi
mg/m3
SRM
Oxygen
%
SRM Water
%Sample Date and Time
1
Zero Values (<5% ELV)
Linearity Data
0.0 0.0 ------
11/06/2013 13:10
Page 52 of 82
LEK09311
5th - 14th June 2013
Permit No. 770
Novartis
Ringaskiddy
-
For
insp
ectio
n pur
pose
s only
.
Conse
nt of
copy
right
owne
r req
uired
for a
ny ot
her u
se.
EPA Export 04-01-2017:02:05:35
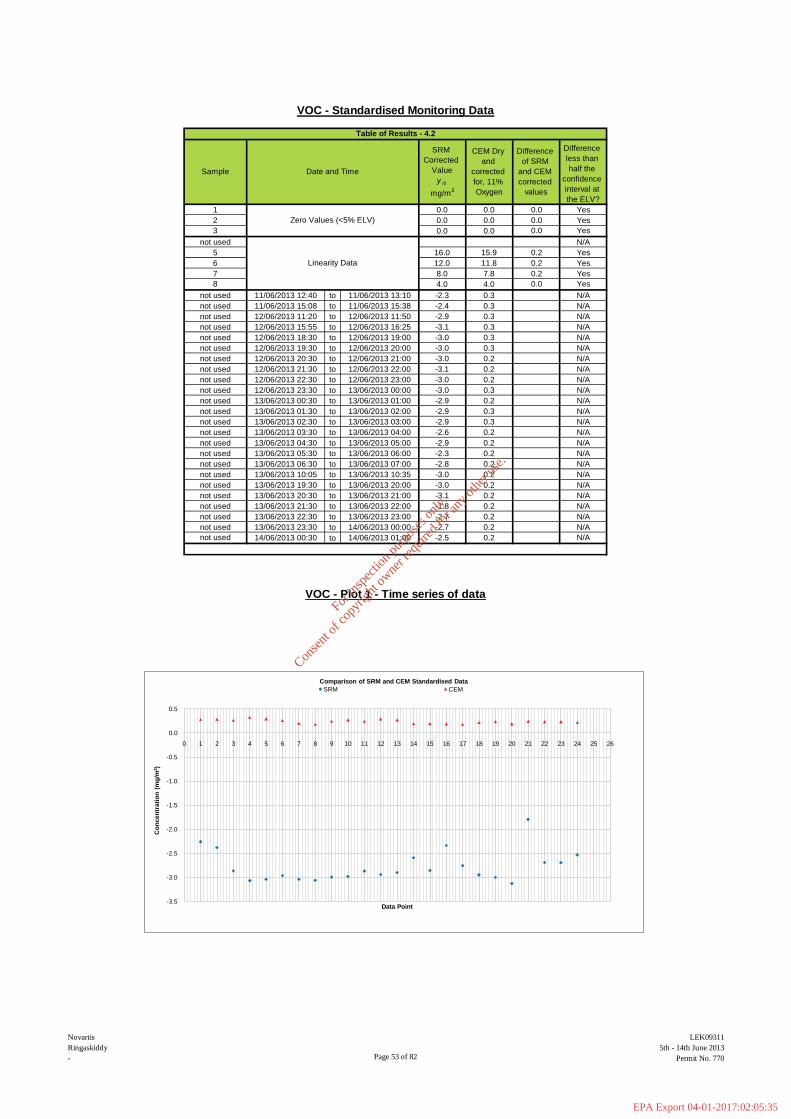
to
to
to
to
to
to
to
to
to
to
to
to
to
to
to
to
to
to
to
to
to
to
to
to
2 0.0 0.0
3 0.0 0.0
not used
0.0
Sample Date and Time
SRM
Corrected
Value
y is
mg/m3
CEM Dry
and
corrected
for, 11%
Oxygen
Zero Values (<5% ELV)
1 0.0
VOC - Standardised Monitoring Data
Difference
of SRM
and CEM
corrected
values
Difference
less than
half the
confidence
interval at
the ELV?
5 16.0 15.9
6 12.0 11.8
7 8.0 7.8
8 4.0 4.0
not used -2.3 0.3
not used 11/06/2013 15:08 11/06/2013 15:38 -2.4 0.3
11/06/2013 13:1011/06/2013 12:40
Linearity Data
not used 12/06/2013 11:20 12/06/2013 11:50 -2.9 0.3
not used 12/06/2013 15:55 12/06/2013 16:25 -3.1 0.3
not used 12/06/2013 18:30 12/06/2013 19:00 -3.0 0.3
not used 12/06/2013 19:30 12/06/2013 20:00 -3.0 0.3
not used 12/06/2013 20:30 12/06/2013 21:00 -3.0 0.2
not used 12/06/2013 21:30 12/06/2013 22:00 -3.1 0.2
not used 12/06/2013 22:30 12/06/2013 23:00 -3.0 0.2
not used 12/06/2013 23:30 13/06/2013 00:00 -3.0 0.3
not used 13/06/2013 00:30 13/06/2013 01:00 -2.9 0.2
not used 13/06/2013 01:30 13/06/2013 02:00 -2.9 0.3
not used 13/06/2013 02:30 13/06/2013 03:00 -2.9 0.3
not used 13/06/2013 03:30 13/06/2013 04:00 -2.6 0.2
0.2
not used 13/06/2013 04:30 13/06/2013 05:00 -2.9 0.2
not used 13/06/2013 05:30 13/06/2013 06:00 -2.3 0.2
not used 13/06/2013 06:30 13/06/2013 07:00 -2.8 0.2
not used 13/06/2013 10:05 13/06/2013 10:35 -3.0 0.2
not used 13/06/2013 23:30 14/06/2013 00:00 -2.7 0.2
not used 14/06/2013 00:30 14/06/2013 01:00 -2.5 0.2
not used 13/06/2013 19:30 13/06/2013 20:00 -3.0 0.2
not used 13/06/2013 20:30 13/06/2013 21:00 -3.1 0.2
not used 13/06/2013 21:30 13/06/2013 22:00 -1.8 0.2
not used 13/06/2013 22:30 13/06/2013 23:00 -2.7
VOC - Plot 1 - Time series of data
N/A
N/A
N/A
N/A
N/A
N/A
Table of Results - 4.2
Yes
Yes
Yes
N/A
Yes
Yes
Yes
Yes
N/A
N/A
N/A
N/A
0.0
0.2
0.2
0.2
N/A
N/A
N/A
N/A
N/A
N/A
N/A
N/A
N/A
N/A
N/A
N/A
N/A
N/A
0.0
0.0
0.0
-3.5
-3.0
-2.5
-2.0
-1.5
-1.0
-0.5
0.0
0.5
0 1 2 3 4 5 6 7 8 9 10 11 12 13 14 15 16 17 18 19 20 21 22 23 24 25 26
Co
ncen
trati
on
(m
g/m
3)
Data Point
Comparison of SRM and CEM Standardised Data
SRM CEM
Page 53 of 82
LEK09311
5th - 14th June 2013
Permit No. 770
Novartis
Ringaskiddy
-
For
insp
ectio
n pur
pose
s only
.
Conse
nt of
copy
right
owne
r req
uired
for a
ny ot
her u
se.
EPA Export 04-01-2017:02:05:35
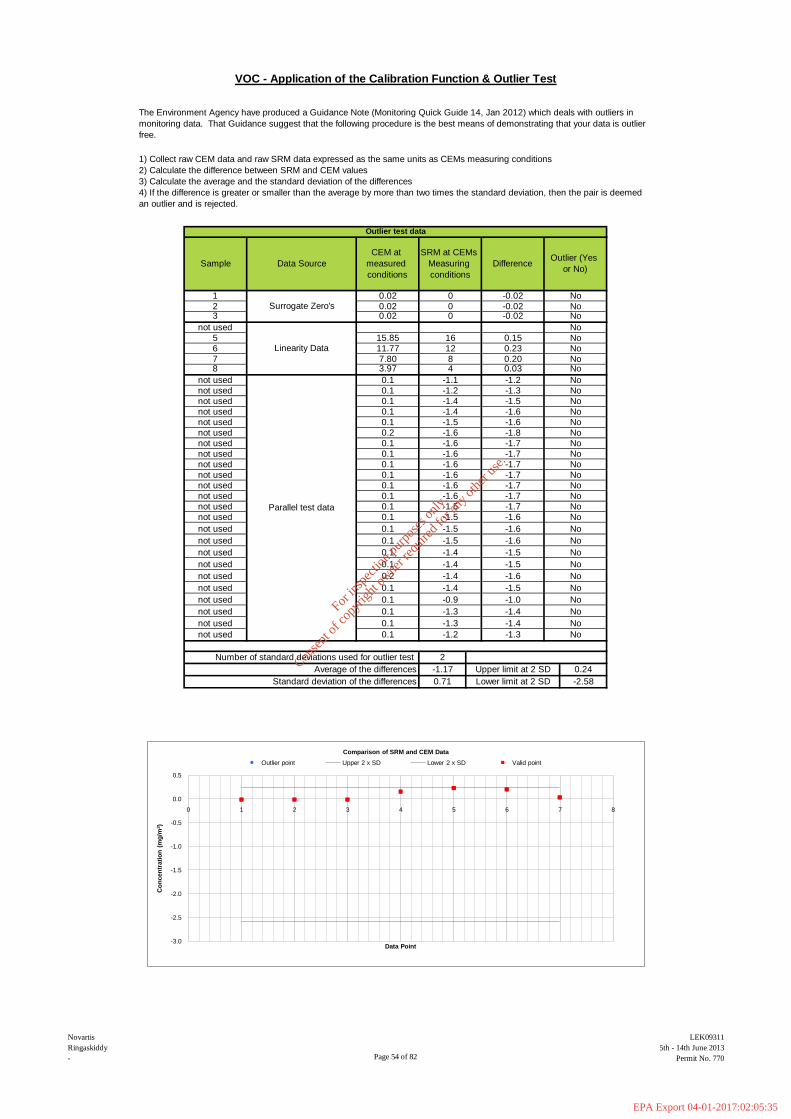
The Environment Agency have produced a Guidance Note (Monitoring Quick Guide 14, Jan 2012) which deals with outliers in
monitoring data. That Guidance suggest that the following procedure is the best means of demonstrating that your data is outlier
free.
not used
not used
not used
not used
not used
not used
not used
not used
not used
not used
not used
not used
not used
not used
No
0.1 -1.6 -1.7 No
0.1 -1.5 -1.7 No
0.1 -1.5 -1.6
not used
CEM at
measured
conditions
SRM at CEMs
Measuring
conditions
DifferenceOutlier (Yes
or No)
2Number of standard deviations used for outlier test
Average of the differences
Standard deviation of the differences
-1.17
0.71
Data Source
Surrogate Zero's
Linearity Data
Parallel test data
0.02
0.02
0
0
-0.02
-0.02
No
No0.02 0 -0.02 No
No
15.85 16 0.15 No
11.77 12 0.23 No
-1.5 No
0.1 -1.4 -1.6 No
0.1 -1.5 -1.6 No
0.2 -1.6 -1.8 No
0.1 -1.6 -1.7 No
Sample
1
23
78
not used
not used
not used
not used
not used
not used
not used
Lower limit at 2 SD
0.24
-2.58
0.1 -1.4 -1.5 No
0.1 -1.4 -1.5 No
0.2 -1.4 -1.6 No
0.1 -1.4 -1.5 No
0.1 -0.9 -1.0 No
0.1 -1.3 -1.4 No
0.1 -1.3 -1.4 No
0.1 -1.2 -1.3 No
Upper limit at 2 SD
0.1 -1.6 -1.7 No
0.1 -1.6 -1.7 No
0.1 -1.6 -1.7 No
0.1 -1.6 -1.7
Outlier test data
not used
not used
VOC - Application of the Calibration Function & Outlier Test
1) Collect raw CEM data and raw SRM data expressed as the same units as CEMs measuring conditions
2) Calculate the difference between SRM and CEM values
3) Calculate the average and the standard deviation of the differences
4) If the difference is greater or smaller than the average by more than two times the standard deviation, then the pair is deemed
an outlier and is rejected.
No
0.1 -1.5 -1.6 No
0.1 -1.5 -1.6 No
7.80 8 0.20 No3.97 4 0.03 No
0.1 -1.1 -1.2 No
0.1 -1.2 -1.3 No
0.1 -1.4
not used
5
6
-3.0
-2.5
-2.0
-1.5
-1.0
-0.5
0.0
0.5
0 1 2 3 4 5 6 7 8
Co
ncen
trati
on
(m
g/m
3)
Data Point
Comparison of SRM and CEM Data
Outlier point Upper 2 x SD Lower 2 x SD Valid point
Page 54 of 82
LEK09311
5th - 14th June 2013
Permit No. 770
Novartis
Ringaskiddy
-
For
insp
ectio
n pur
pose
s only
.
Conse
nt of
copy
right
owne
r req
uired
for a
ny ot
her u
se.
EPA Export 04-01-2017:02:05:35
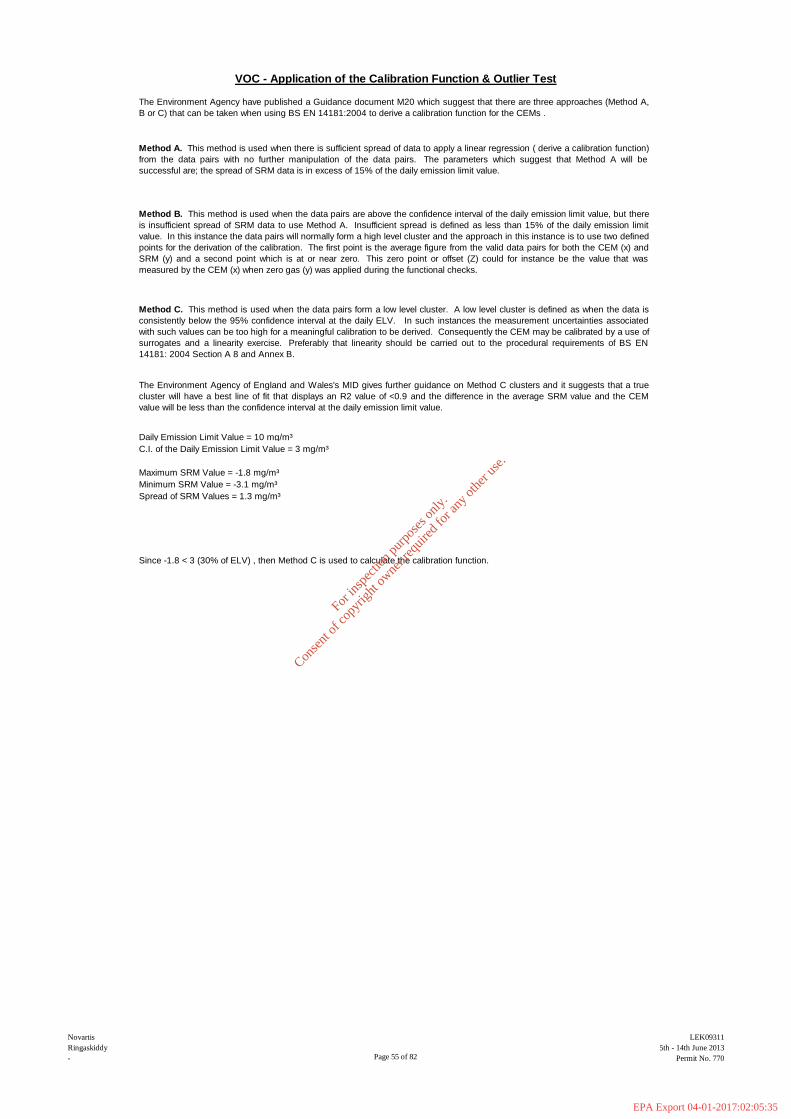
Daily Emission Limit Value = 10 mg/m³
C.I. of the Daily Emission Limit Value = 3 mg/m³
VOC - Application of the Calibration Function & Outlier Test
Spread of SRM Values = 1.3 mg/m³
Minimum SRM Value = -3.1 mg/m³
Since -1.8 < 3 (30% of ELV) , then Method C is used to calculate the calibration function.
The Environment Agency have published a Guidance document M20 which suggest that there are three approaches (Method A,
B or C) that can be taken when using BS EN 14181:2004 to derive a calibration function for the CEMs .
Method A. This method is used when there is sufficient spread of data to apply a linear regression ( derive a calibration function)
from the data pairs with no further manipulation of the data pairs. The parameters which suggest that Method A will be
successful are; the spread of SRM data is in excess of 15% of the daily emission limit value.
Method B. This method is used when the data pairs are above the confidence interval of the daily emission limit value, but there
is insufficient spread of SRM data to use Method A. Insufficient spread is defined as less than 15% of the daily emission limit
value. In this instance the data pairs will normally form a high level cluster and the approach in this instance is to use two defined
points for the derivation of the calibration. The first point is the average figure from the valid data pairs for both the CEM (x) and
SRM (y) and a second point which is at or near zero. This zero point or offset (Z) could for instance be the value that was
measured by the CEM (x) when zero gas (y) was applied during the functional checks.
Method C. This method is used when the data pairs form a low level cluster. A low level cluster is defined as when the data is
consistently below the 95% confidence interval at the daily ELV. In such instances the measurement uncertainties associated
with such values can be too high for a meaningful calibration to be derived. Consequently the CEM may be calibrated by a use of
surrogates and a linearity exercise. Preferably that linearity should be carried out to the procedural requirements of BS EN
14181: 2004 Section A 8 and Annex B.
The Environment Agency of England and Wales's MID gives further guidance on Method C clusters and it suggests that a true
cluster will have a best line of fit that displays an R2 value of <0.9 and the difference in the average SRM value and the CEM
value will be less than the confidence interval at the daily emission limit value.
Maximum SRM Value = -1.8 mg/m³
Page 55 of 82
LEK09311
5th - 14th June 2013
Permit No. 770
Novartis
Ringaskiddy
-
For
insp
ectio
n pur
pose
s only
.
Conse
nt of
copy
right
owne
r req
uired
for a
ny ot
her u
se.
EPA Export 04-01-2017:02:05:35
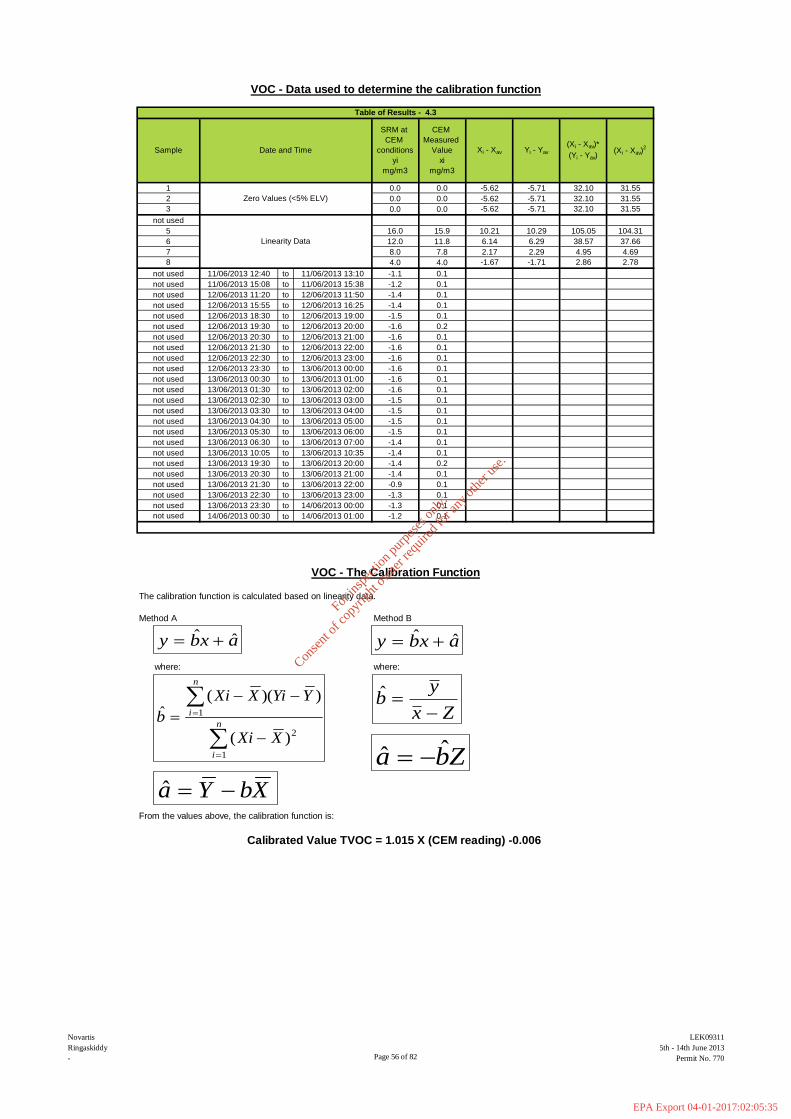
to
to
to
to
to
to
to
to
to
to
to
to
to
to
to
to
to
to
to
to
to
to
to
to
The calibration function is calculated based on linearity data.
Method A Method B
where: where:
From the values above, the calibration function is:
VOC - Data used to determine the calibration function
VOC - The Calibration Function
0.0 0.0
Date and Time
Zero Values (<5% ELV)
Sample
SRM at
CEM
conditions
yi
mg/m3
CEM
Measured
Value
xi
mg/m3
5 16.0 15.9
6 12.0 11.8
7 8.0 7.8
8 4.0 4.0
not used -1.1 0.1
Xi - Xav Yi - Yav
(Xi - Xav)*
(Yi - Yav)(Xi - Xav)
2
-5.62
-5.62
-5.62
10.21
6.14
2.17
-1.67
12/06/2013 11:20 12/06/2013 11:50 -1.4 0.1
not used 12/06/2013 15:55 12/06/2013 16:25 -1.4 0.1
not used 12/06/2013 18:30 12/06/2013 19:00 -1.5 0.1
not used 12/06/2013 19:30 12/06/2013 20:00 -1.6 0.2
not used 12/06/2013 20:30 12/06/2013 21:00 -1.6 0.1
2 0.0 0.0
3 0.0 0.0
not used
not used 12/06/2013 21:30 12/06/2013 22:00 -1.6 0.1
not used 12/06/2013 22:30 12/06/2013 23:00 -1.6 0.1
not used 12/06/2013 23:30 13/06/2013 00:00 -1.6 0.1
not used 13/06/2013 00:30 13/06/2013 01:00 -1.6 0.1
not used 13/06/2013 01:30 13/06/2013 02:00 -1.6 0.1
not used 13/06/2013 02:30 13/06/2013 03:00 -1.5 0.1
not used 13/06/2013 03:30 13/06/2013 04:00 -1.5 0.1
not used 13/06/2013 04:30 13/06/2013 05:00 -1.5 0.1
not used 13/06/2013 05:30 13/06/2013 06:00 -1.5 0.1
not used 13/06/2013 06:30 13/06/2013 07:00 -1.4 0.1
not used 13/06/2013 10:05 13/06/2013 10:35 -1.4 0.1
not used 13/06/2013 19:30 13/06/2013 20:00 -1.4 0.2
not used 13/06/2013 20:30 13/06/2013 21:00 -1.4 0.1
not used 13/06/2013 21:30 13/06/2013 22:00 -0.9 0.1
not used 13/06/2013 22:30 13/06/2013 23:00 -1.3 0.1
not used 13/06/2013 23:30 14/06/2013 00:00 -1.3 0.1
not used 14/06/2013 00:30 14/06/2013 01:00 -1.2 0.1
Calibrated Value TVOC = 1.015 X (CEM reading) -0.006
1
not used 11/06/2013 15:08 11/06/2013 15:38 -1.2 0.1
11/06/2013 13:1011/06/2013 12:40
Linearity Data
not used
-5.71
-5.71
-5.71
10.29
6.29
2.29
-1.71 2.86
4.95
38.57
105.05
32.10
32.10
32.10
31.55
31.55
31.55
104.31
37.66
4.69
2.78
Table of Results - 4.3
Zx
yb
ˆ
Zba ˆˆ
axby ˆˆ axby ˆˆ
n
i
n
i
XXi
YYiXXi
b
1
2
1
)(
))((ˆ
XbYa ˆ
Page 56 of 82
LEK09311
5th - 14th June 2013
Permit No. 770
Novartis
Ringaskiddy
-
For
insp
ectio
n pur
pose
s only
.
Conse
nt of
copy
right
owne
r req
uired
for a
ny ot
her u
se.
EPA Export 04-01-2017:02:05:35
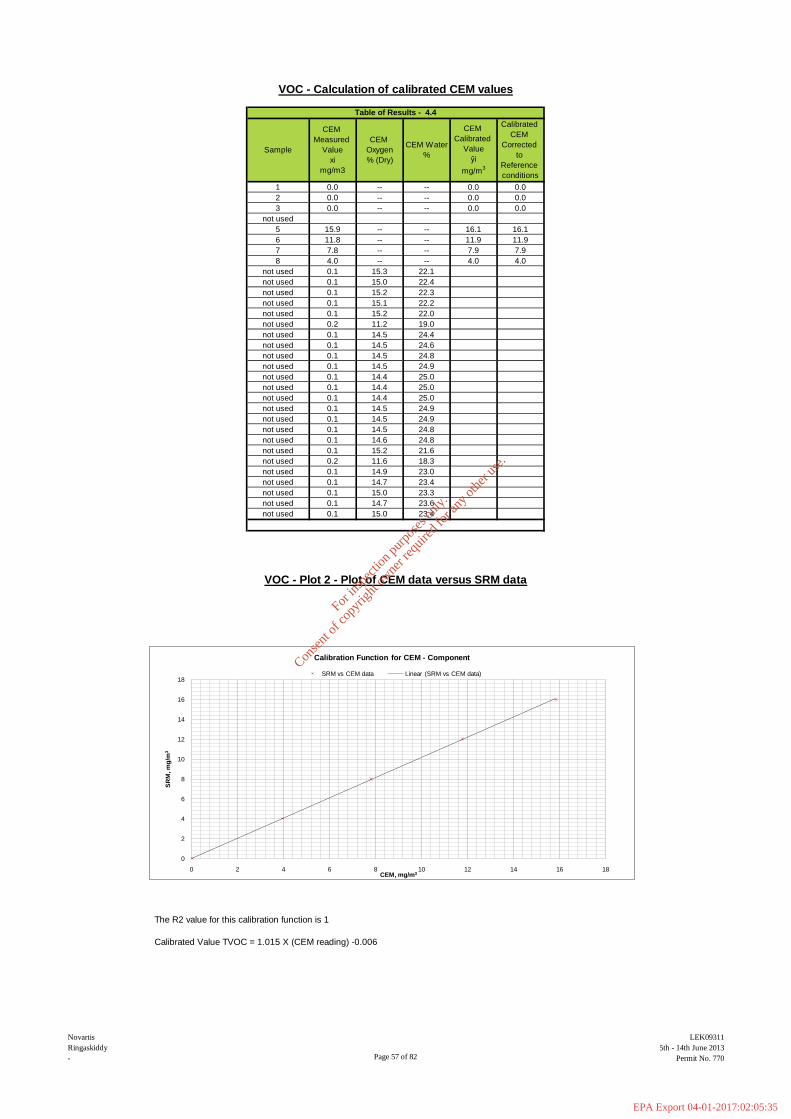
The R2 value for this calibration function is 1
Calibrated Value TVOC = 1.015 X (CEM reading) -0.006
VOC - Calculation of calibrated CEM values
VOC - Plot 2 - Plot of CEM data versus SRM data
2 0.0 -- -- 0.0 0.0
3 0.0 -- -- 0.0 0.0
not used
CEM
Oxygen
% (Dry)
CEM Water
%
CEM
Calibrated
Value
ŷi
mg/m3
Calibrated
CEM
Corrected
to
Reference
conditions
5 15.9 -- -- 16.1 16.1
6 11.8 -- -- 11.9 11.9
7 7.8 -- -- 7.9 7.9
8 4.0 -- -- 4.0 4.0
not used 0.1 15.3 22.1
not used 0.1 15.0 22.4
not used 0.1 15.2 22.3
not used 0.1 15.1 22.2
not used 0.1 15.2 22.0
not used 0.2 11.2 19.0
not used 0.1 14.5 24.4
not used 0.1 14.5 24.6
not used 0.1 14.5 24.8
not used 0.1 14.5 24.9
not used 0.1 14.4 25.0
not used 0.1 14.4 25.0
not used 0.1 14.4 25.0
not used 0.1 14.5 24.9
not used 0.1 14.5 24.9
not used 0.1 14.5 24.8
not used 0.1 14.6 24.8
not used 0.1 15.2 21.6
not used 0.2 11.6 18.3
not used 0.1 14.9 23.0
not used 0.1 14.7 23.4
not used 0.1 15.0 23.3
not used 0.1 14.7 23.6
not used 0.1 15.0 23.4
Table of Results - 4.4
1 0.0 -- -- 0.0 0.0
Sample
CEM
Measured
Value
xi
mg/m3
0
2
4
6
8
10
12
14
16
18
0 2 4 6 8 10 12 14 16 18
SR
M, m
g/m
3
CEM, mg/m3
Calibration Function for CEM - Component
SRM vs CEM data Linear (SRM vs CEM data)
Page 57 of 82
LEK09311
5th - 14th June 2013
Permit No. 770
Novartis
Ringaskiddy
-
For
insp
ectio
n pur
pose
s only
.
Conse
nt of
copy
right
owne
r req
uired
for a
ny ot
her u
se.
EPA Export 04-01-2017:02:05:35

The variability is accepted if: Sd ≤ Qo x Kv
Where
Qo is the uncertainty laid down by the Authorities at the emission limit value as a 95% confidence interval.
Qo = Daily Emission Limit Value X Measurement Uncertainty
Where Daily Emission Limit = 10 mg/m³ Measurement Uncertainty = 30%
Kv = the test parameter (for 7 Pairs of Data is 0.9441)
Variability Pass Criteria
VOC - Data Used for the variability test
2 0.0 0.0 0.0 0.0 0.0
3 0.0 0.0 0.0 0.0 0.0
Sample
CEM Dry
and
corrected
for 11%
Oxygen
SRM
Corrected
Value*
y is
mg/m3
Difference
between
SRM and
CEM
Difference
(D - Dmean)
Square of
Difference
(D - Dmean)2
Table of Results - 4.5
1 0.0 0.0 0.0 0.0 0.0
not used
not used
not used
not used
5 16.1 16.0 -0.1 -0.1 0.0
6 11.9 12.0 0.1 0.1 0.0
7 7.9 8.0 0.1 0.1 0.0
8 4.0 4.0 0.0 0.0 0.0
not used
not used
not used
not used
not used
not used
not used
not used
not used
not used
not used
not used
CEM HAS PASSED VARIABILITY TEST
VOC - Variability Test
not used
The next stage of the calibration process is to determine if the proposed calibration function passes the variability test.
Sd is the standard deviation of the differences between the SRM value at Reportable Conditions and the Calibrated CEM value at Reportable
Conditions.
1.96
0.06 < 1.45
not used
not used
not used
not used
not used
not used
not used
not used
vD ks 0
Page 58 of 82
LEK09311
5th - 14th June 2013
Permit No. 770
Novartis
Ringaskiddy
-
For
insp
ectio
n pur
pose
s only
.
Conse
nt of
copy
right
owne
r req
uired
for a
ny ot
her u
se.
EPA Export 04-01-2017:02:05:35

Plot of calibrated CEM data versus SRM data, dry and corrected to 11% oxygen
Valid Calibration Range is:
0 to -2 mg/m3
VOC - Plot 3 - Plot of calibrated CEM data versus SRM data
0
2
4
6
8
10
12
14
16
18
0 2 4 6 8 10 12 14 16 18
SR
M, m
g/m
3(D
ry a
nd
Co
rrecte
d f
or
Oxy
gen
)
CEM, mg/m3 (Calibration Function Applied, Dry and Corrected for Oxygen)
SRM concentrations vs Calibrated and Corrected CEM concentrations
SRM vs CEM Linear (SRM vs CEM)
Page 59 of 82
LEK09311
5th - 14th June 2013
Permit No. 770
Novartis
Ringaskiddy
-
For
insp
ectio
n pur
pose
s only
.
Conse
nt of
copy
right
owne
r req
uired
for a
ny ot
her u
se.
EPA Export 04-01-2017:02:05:35
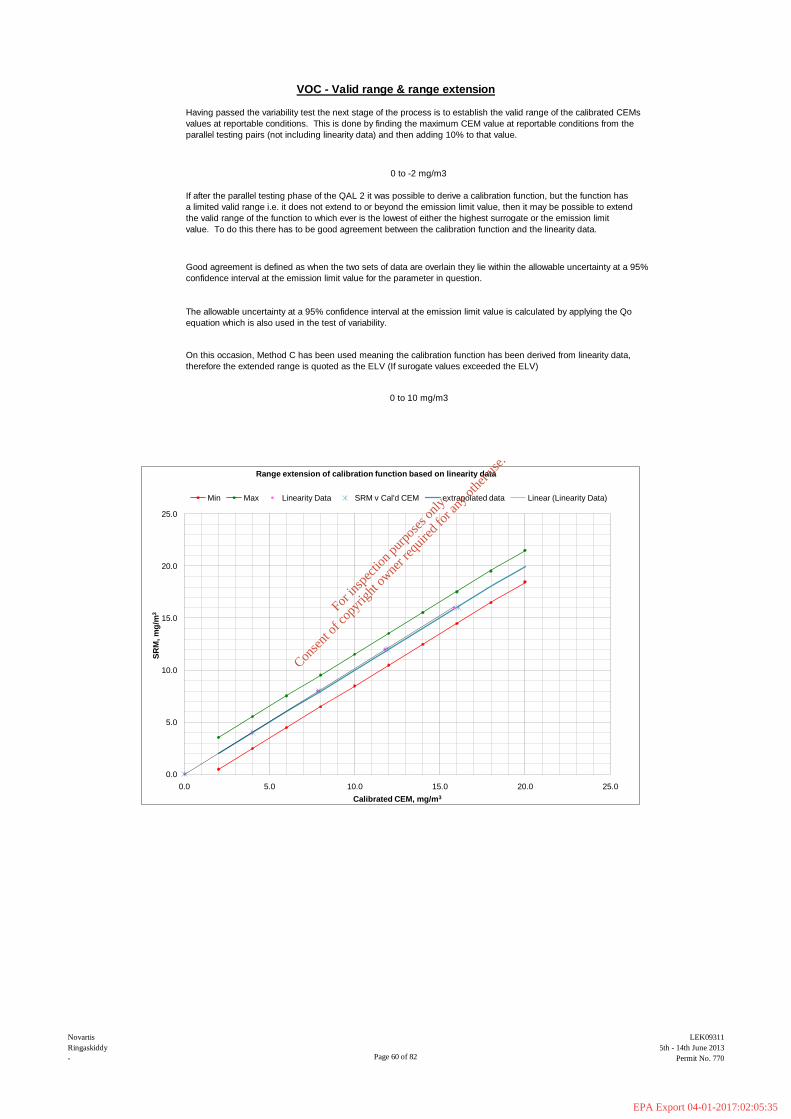
VOC - Valid range & range extension
0 to 10 mg/m3
Having passed the variability test the next stage of the process is to establish the valid range of the calibrated CEMs
values at reportable conditions. This is done by finding the maximum CEM value at reportable conditions from the
parallel testing pairs (not including linearity data) and then adding 10% to that value.
0 to -2 mg/m3
If after the parallel testing phase of the QAL 2 it was possible to derive a calibration function, but the function has
a limited valid range i.e. it does not extend to or beyond the emission limit value, then it may be possible to extend
the valid range of the function to which ever is the lowest of either the highest surrogate or the emission limit
value. To do this there has to be good agreement between the calibration function and the linearity data.
Good agreement is defined as when the two sets of data are overlain they lie within the allowable uncertainty at a 95%
confidence interval at the emission limit value for the parameter in question.
The allowable uncertainty at a 95% confidence interval at the emission limit value is calculated by applying the Qo
equation which is also used in the test of variability.
On this occasion, Method C has been used meaning the calibration function has been derived from linearity data,
therefore the extended range is quoted as the ELV (If surogate values exceeded the ELV)
0.0
5.0
10.0
15.0
20.0
25.0
0.0 5.0 10.0 15.0 20.0 25.0
SR
M, m
g/m
3
Calibrated CEM, mg/m3
Range extension of calibration function based on linearity data
Min Max Linearity Data SRM v Cal'd CEM extrapolated data Linear (Linearity Data)
Page 60 of 82
LEK09311
5th - 14th June 2013
Permit No. 770
Novartis
Ringaskiddy
-
For
insp
ectio
n pur
pose
s only
.
Conse
nt of
copy
right
owne
r req
uired
for a
ny ot
her u
se.
EPA Export 04-01-2017:02:05:35
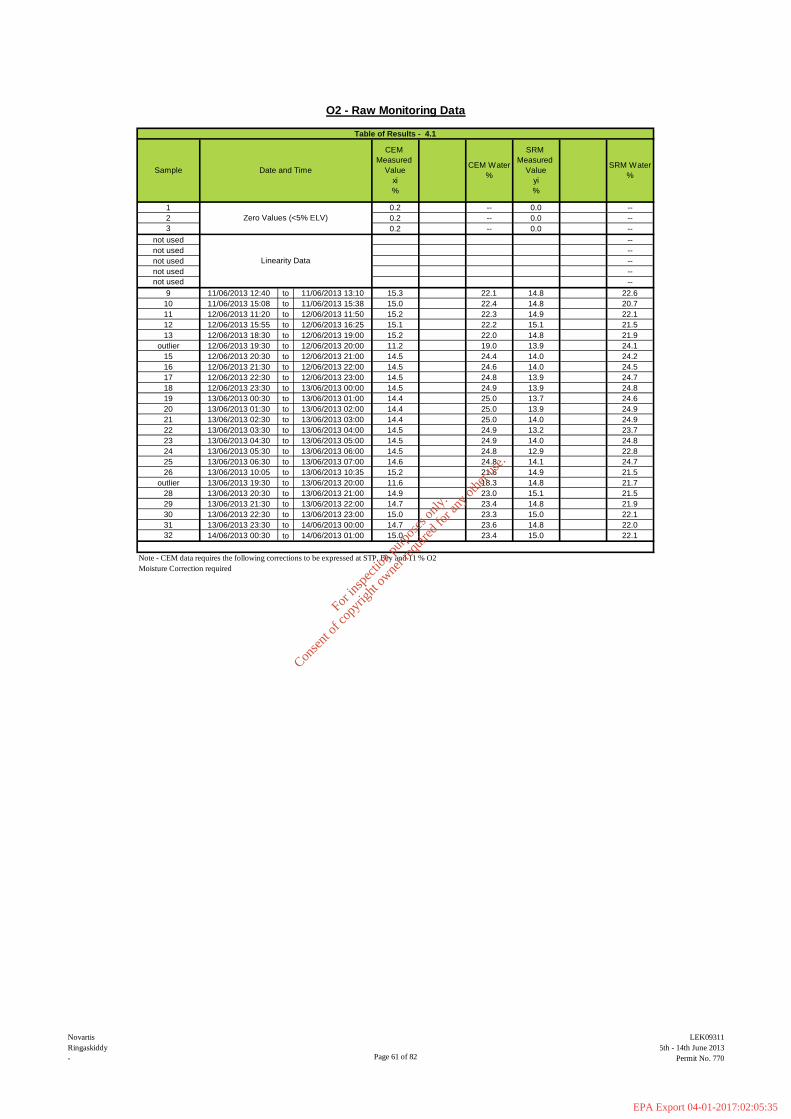
to
to
to
to
to
to
to
to
to
to
to
to
to
to
to
to
to
to
to
to
to
to
to
to
Note - CEM data requires the following corrections to be expressed at STP, Dry and 11 % O2
Moisture Correction required
0.0--
11/06/2013 13:10
O2 - Raw Monitoring Data
--
Table of Results - 4.1
CEM
Measured
Value
xi
%
CEM Water
%
SRM
Measured
Value
yi
%
SRM Water
%Sample Date and Time
1
Zero Values (<5% ELV)
Linearity Data
0.2
22.132 14/06/2013 00:30 14/06/2013 01:00 15.0 23.4 15.0
31 13/06/2013 23:30 14/06/2013 00:00 14.7 23.6 14.8 22.0
29 13/06/2013 21:30 13/06/2013 22:00 14.7 23.4 14.8 21.9
30 13/06/2013 22:30 13/06/2013 23:00 15.0 23.3 15.0 22.1
outlier 13/06/2013 19:30 13/06/2013 20:00 11.6 18.3 14.8 21.7
13/06/2013 20:30 13/06/2013 21:00 14.9 23.0 15.1 21.5
25 13/06/2013 06:30 13/06/2013 07:00 14.6 24.8 14.1 24.7
26 13/06/2013 10:05 13/06/2013 10:35 15.2 21.6 14.9 21.5
28
20 13/06/2013 01:30 13/06/2013 02:00 14.4 25.0 13.9 24.9
17 12/06/2013 22:30 12/06/2013 23:00 14.5 24.8 13.9 24.7
18 12/06/2013 23:30 13/06/2013 00:00 14.5 24.9 13.9 24.8
23 13/06/2013 04:30 13/06/2013 05:00 14.5 24.9 14.0 24.8
24 13/06/2013 05:30 13/06/2013 06:00 14.5 24.8 12.9 22.8
21 13/06/2013 02:30 13/06/2013 03:00 14.4 25.0 14.0 24.9
22 13/06/2013 03:30 13/06/2013 04:00 14.5 24.9 13.2 23.7
16 12/06/2013 21:30 12/06/2013 22:00 14.5 24.6 14.0 24.5
13 12/06/2013 18:30 12/06/2013 19:00 15.2 22.0 14.8 21.9
outlier 12/06/2013 19:30 12/06/2013 20:00 11.2 19.0 13.9 24.1
19 13/06/2013 00:30 13/06/2013 01:00 14.4 25.0 13.7 24.6
12/06/2013 16:25 15.1 22.2 15.1 21.5
not used --
not used --
not used --
15 12/06/2013 20:30 12/06/2013 21:00 14.5 24.4 14.0 24.2
2 0.2 -- 0.0 --
3 0.2 -- 0.0 --
not used --
not used --
9 15.3 22.1 14.8 22.6
10 11/06/2013 15:08 11/06/2013 15:38 15.0 22.4 14.8 20.7
11 12/06/2013 11:20 12/06/2013 11:50 15.2 22.3 14.9 22.1
11/06/2013 12:40
12 12/06/2013 15:55
Page 61 of 82
LEK09311
5th - 14th June 2013
Permit No. 770
Novartis
Ringaskiddy
-
For
insp
ectio
n pur
pose
s only
.
Conse
nt of
copy
right
owne
r req
uired
for a
ny ot
her u
se.
EPA Export 04-01-2017:02:05:35

to
to
to
to
to
to
to
to
to
to
to
to
to
to
to
to
to
to
to
to
to
to
to
to
outlier 13/06/2013 19:30 13/06/2013 20:00 14.8 11.6
28 13/06/2013 20:30 13/06/2013 21:00 15.1 14.9
29 13/06/2013 21:30 13/06/2013 22:00 14.8 14.7
30 13/06/2013 22:30
O2 - Standardised Monitoring Data
O2 - Plot 1 - Time series of data
31 13/06/2013 23:30 14/06/2013 00:00 14.8 14.7
32 14/06/2013 00:30 14/06/2013 01:00 15.0 15.0
13/06/2013 23:00 15.0
21 13/06/2013 02:30 13/06/2013 03:00 14.0 14.4
22 13/06/2013 03:30 13/06/2013 04:00 13.2 14.5
15.0
23 13/06/2013 04:30 13/06/2013 05:00 14.0 14.5
24 13/06/2013 05:30 13/06/2013 06:00 12.9 14.5
25 13/06/2013 06:30 13/06/2013 07:00 14.1 14.6
26 13/06/2013 10:05 13/06/2013 10:35 14.9 15.2
17 12/06/2013 22:30 12/06/2013 23:00 13.9 14.5
18 12/06/2013 23:30 13/06/2013 00:00 13.9 14.5
19 13/06/2013 00:30 13/06/2013 01:00 13.7 14.4
20 13/06/2013 01:30 13/06/2013 02:00 13.9 14.4
13 12/06/2013 18:30 12/06/2013 19:00 14.8 15.2
outlier 12/06/2013 19:30 12/06/2013 20:00 13.9 11.2
15 12/06/2013 20:30 12/06/2013 21:00 14.0 14.5
16 12/06/2013 21:30 12/06/2013 22:00 14.0 14.5
11 12/06/2013 11:20 12/06/2013 11:50 14.9 15.2
12 12/06/2013 15:55 12/06/2013 16:25 15.1 15.1
Zero Values (<5% ELV)
1 0.2
not used
not used
not used
not used
2 0.0 0.2
3 0.0 0.2
not used
0.0
Sample Date and Time
SRM
Corrected
Value
y is
%
CEM Dry
9 14.8 19.6
10 11/06/2013 15:08 11/06/2013 15:38 14.8 15.0
11/06/2013 13:1011/06/2013 12:40
Linearity Data
Yes
Table of Results - 4.2
Difference
of SRM and
CEM
corrected
values
4.8
Yes
Yes
Yes
Yes
Yes
No
Yes
Yes
N/A
Yes
Yes
Yes
Yes
Yes
0.2
0.2
0.2
0.2
0.4
0.1
0.4
0.5
0.5
0.6
0.5
0.7
0.5
0.5
1.2
0.5
1.7
0.5
0.3
0.2
0.1
0.0
0.1
0.0
Difference
less than
half the
confidence
interval at
the ELV?
Yes
Yes
Yes
N/A
N/A
N/A
N/A
N/A
No
Yes
Yes
Yes
N/A
Yes
Yes
Yes
Yes
0
5
10
15
20
25
0 1 2 3 4 5 6 7 8 9 10 11 12 13 14 15 16 17 18 19 20 21 22 23 24 25 26
Co
ncen
trati
on
(%
)
Data Point
Comparison of SRM and CEM Standardised Data SRM CEM
Page 62 of 82
LEK09311
5th - 14th June 2013
Permit No. 770
Novartis
Ringaskiddy
-
For
insp
ectio
n pur
pose
s only
.
Conse
nt of
copy
right
owne
r req
uired
for a
ny ot
her u
se.
EPA Export 04-01-2017:02:05:35
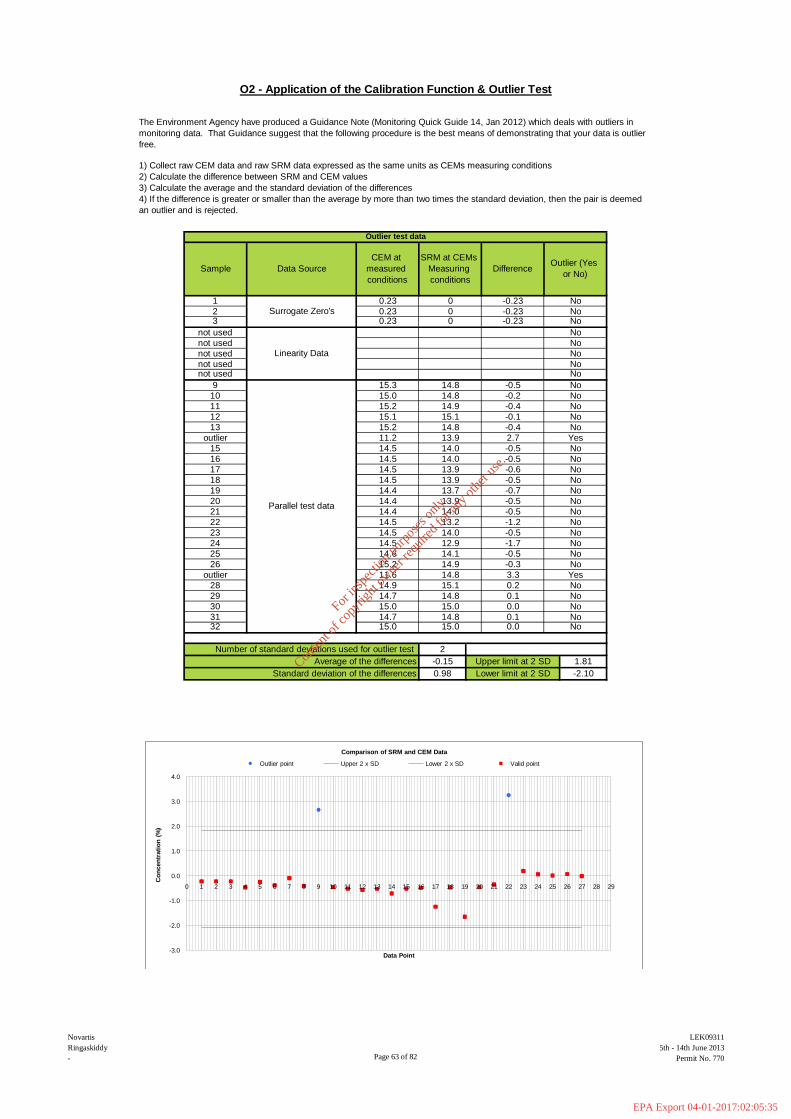
The Environment Agency have produced a Guidance Note (Monitoring Quick Guide 14, Jan 2012) which deals with outliers in
monitoring data. That Guidance suggest that the following procedure is the best means of demonstrating that your data is outlier
free.
21
22
23
24
25
26
outlier
28
29
Outlier test data
30
3132
CEM at
measured
conditions
SRM at CEMs
Measuring
conditions
DifferenceOutlier (Yes
or No)
2Number of standard deviations used for outlier test
Average of the differences
Standard deviation of the differences
-0.15
0.98
Data Source
Surrogate Zero's
Linearity Data
Parallel test data
0.23
0.23
0
0
-0.23
-0.23
No
No0.23 0 -0.23 No
No
No
No
15.1 15.1 -0.1 No
15.2 14.8 -0.4 No
11.2
14.0 -0.5 No
Sample
1
23
not used
not used
not used
not usednot used
9
10
11
12
13
outlier
15
16
Lower limit at 2 SD
1.81
-2.10
14.6 14.1 -0.5 No
15.2 14.9 -0.3 No
11.6 14.8 3.3 Yes
14.9 15.1 0.2 No
14.7 14.8 0.1 No
15.0 15.0 0.0 No
14.7 14.8 0.1 No15.0 15.0 0.0 No
Upper limit at 2 SD
14.5 14.0 -0.5
17
18
19
20
No
14.5 13.9 -0.5 No
14.4 13.7 -0.7 No
14.4 13.9 -0.5 No
14.4 14.0 -0.5 No
14.5 13.2 -1.2
13.9 2.7 Yes
14.5
O2 - Application of the Calibration Function & Outlier Test
1) Collect raw CEM data and raw SRM data expressed as the same units as CEMs measuring conditions
2) Calculate the difference between SRM and CEM values
3) Calculate the average and the standard deviation of the differences
4) If the difference is greater or smaller than the average by more than two times the standard deviation, then the pair is deemed
an outlier and is rejected.
No
14.5 14.0 -0.5 No
14.5 12.9 -1.7 No
NoNo
15.3 14.8 -0.5 No
15.0 14.8 -0.2 No
15.2 14.9 -0.4 No
No
14.5 13.9 -0.6
-3.0
-2.0
-1.0
0.0
1.0
2.0
3.0
4.0
0 1 2 3 4 5 6 7 8 9 10 11 12 13 14 15 16 17 18 19 20 21 22 23 24 25 26 27 28 29
Co
ncen
trati
on
(%
)
Data Point
Comparison of SRM and CEM Data
Outlier point Upper 2 x SD Lower 2 x SD Valid point
Page 63 of 82
LEK09311
5th - 14th June 2013
Permit No. 770
Novartis
Ringaskiddy
-
For
insp
ectio
n pur
pose
s only
.
Conse
nt of
copy
right
owne
r req
uired
for a
ny ot
her u
se.
EPA Export 04-01-2017:02:05:35

Daily Emission Limit Value = 25 %
C.I. of the Daily Emission Limit Value = 2.5 %
Minimum SRM Value = 12.9 %
The Environment Agency have published a Guidance document M20 which suggest that there are three approaches (Method A,
B or C) that can be taken when using BS EN 14181:2004 to derive a calibration function for the CEMs .
Method A. This method is used when there is sufficient spread of data to apply a linear regression ( derive a calibration function)
from the data pairs with no further manipulation of the data pairs. The parameters which suggest that Method A will be
successful are; the spread of SRM data is in excess of 15% of the daily emission limit value.
Method B. This method is used when the data pairs are above the confidence interval of the daily emission limit value, but there
is insufficient spread of SRM data to use Method A. Insufficient spread is defined as less than 15% of the daily emission limit
value. In this instance the data pairs will normally form a high level cluster and the approach in this instance is to use two defined
points for the derivation of the calibration. The first point is the average figure from the valid data pairs for both the CEM (x) and
SRM (y) and a second point which is at or near zero. This zero point or offset (Z) could for instance be the value that was
measured by the CEM (x) when zero gas (y) was applied during the functional checks.
Method C. This method is used when the data pairs form a low level cluster. A low level cluster is defined as when the data is
consistently below the 95% confidence interval at the daily ELV. In such instances the measurement uncertainties associated
with such values can be too high for a meaningful calibration to be derived. Consequently the CEM may be calibrated by a use of
surrogates and a linearity exercise. Preferably that linearity should be carried out to the procedural requirements of BS EN
14181: 2004 Section A 8 and Annex B.
The Environment Agency of England and Wales's MID gives further guidance on Method C clusters and it suggests that a true
cluster will have a best line of fit that displays an R2 value of <0.9 and the difference in the average SRM value and the CEM
value will be less than the confidence interval at the daily emission limit value.
Maximum SRM Value = 15.1 %
Spread of SRM Values = 2.3 %
Since 15.1 > 2.5 (10% of ELV) and 2.3 < 3.75 (15% of ELV), then Method B is used to calculate the calibration function.
O2 - Application of the Calibration Function & Outlier Test
Page 64 of 82
LEK09311
5th - 14th June 2013
Permit No. 770
Novartis
Ringaskiddy
-
For
insp
ectio
n pur
pose
s only
.
Conse
nt of
copy
right
owne
r req
uired
for a
ny ot
her u
se.
EPA Export 04-01-2017:02:05:35

to
to
to
to
to
to
to
to
to
to
to
to
to
to
to
to
to
to
to
to
to
to
to
to
The calibration function is calculated based on parallel test data from an SRM and the CEM.
Method A Method B
where: where:
From the values above, the calibration function is:
1
31 13/06/2013 23:30 14/06/2013 00:00 14.8 14.7
32 14/06/2013 00:30 14/06/2013 01:00 15.0 15.0
Calibrated Value Oxygen = 0.953 X (CEM reading) + 0.219
outlier 13/06/2013 19:30 13/06/2013 20:00 14.8 11.6
28 13/06/2013 20:30 13/06/2013 21:00 15.1 14.9
29 13/06/2013 21:30 13/06/2013 22:00 14.8 14.7
30 13/06/2013 22:30 13/06/2013 23:00 15.0 15.0
23 13/06/2013 04:30 13/06/2013 05:00 14.0 14.5
24 13/06/2013 05:30 13/06/2013 06:00 12.9 14.5
25 13/06/2013 06:30 13/06/2013 07:00 14.1 14.6
26 13/06/2013 10:05 13/06/2013 10:35 14.9 15.2
19 13/06/2013 00:30 13/06/2013 01:00 13.7 14.4
20 13/06/2013 01:30 13/06/2013 02:00 13.9 14.4
21 13/06/2013 02:30 13/06/2013 03:00 14.0 14.4
22 13/06/2013 03:30 13/06/2013 04:00 13.2 14.5
15 12/06/2013 20:30 12/06/2013 21:00 14.0 14.5
16 12/06/2013 21:30 12/06/2013 22:00 14.0 14.5
17 12/06/2013 22:30 12/06/2013 23:00 13.9 14.5
18 12/06/2013 23:30 13/06/2013 00:00 13.9 14.5
11 12/06/2013 11:20 12/06/2013 11:50 14.9 15.2
12 12/06/2013 15:55 12/06/2013 16:25 15.1 15.1
13 12/06/2013 18:30 12/06/2013 19:00 14.8 15.2
outlier 12/06/2013 19:30 12/06/2013 20:00 13.9 11.2
not used
not used
not used
not used
9 14.8 15.3
10 11/06/2013 15:08 11/06/2013 15:38 14.8 15.0
11/06/2013 13:1011/06/2013 12:40
Linearity Data
2 0.0 0.2
3 0.0 0.2
not used
0.0 0.2
Date and Time
Zero Values (<5% ELV)
Sample
SRM at
CEM
conditions
yi
%
CEM
Measured
Value
xi
%
O2 - Data used to determine the calibration function
O2 - The Calibration Function
Xi - Xav Yi - Yav
(Xi - Xav)*
(Yi - Yav)(Xi - Xav)
2
-12.79
-12.79
-12.79
2.24
2.02
2.22
2.13
2.16
1.45
1.44
1.43
1.43
4.62
5.20
4.96
4.40
4.86
161.38
161.38
161.38
163.52
163.52
163.52
5.02
4.10
4.92
4.54
4.65
2.21
2.34
2.11
1.31
1.11
1.31
2.06
2.05
2.05
1.33
0.59
1.39
0.25
1.47
2.23
2.51
2.18
2.36
2.18
2.35 4.61
3.74
4.61
3.75
4.82
4.87
2.26
0.38
2.04
0.86
1.89
1.87
1.59
1.88
1.86
2.15
2.121.49
1.53
2.01
2.09
2.14
2.29
2.36
4.76
3.68
2.96
3.81
Table of Results - 4.3
1.42
1.45
1.46
1.51
1.53
2.94
3.85
2.18
1.92
1.72
1.95
1.71
1.96
-12.62
-12.62
-12.62
2.17
2.17
2.23
2.44
2.14
1.42
1.41
1.28
Zx
yb
ˆ
Zba ˆˆ
axby ˆˆ axby ˆˆ
n
i
n
i
XXi
YYiXXi
b
1
2
1
)(
))((ˆ
XbYa ˆ
Page 65 of 82
LEK09311
5th - 14th June 2013
Permit No. 770
Novartis
Ringaskiddy
-
For
insp
ectio
n pur
pose
s only
.
Conse
nt of
copy
right
owne
r req
uired
for a
ny ot
her u
se.
EPA Export 04-01-2017:02:05:35

The R2 value for this calibration function is 0.993
Calibrated Value Oxygen = 0.953 X (CEM reading) + 0.219
Table of Results - 4.4
1 0.2 -- 0.4 0.4
Sample
CEM
Measured
Value
xi
%
CEM Water
%
CEM
Calibrated
Value
ŷi
%
Calibrated
CEM
Corrected
to
Reference
conditions
31 14.7 23.6 14.3 14.3
32 15.0 23.4 14.5 14.5
28 14.9 23.0 14.4 14.4
29 14.7 23.4 14.3 14.3
30 15.0 23.3 14.5 14.5
25 14.6 24.8 14.1 14.1
26 15.2 21.6 14.7 14.7
outlier 11.6 18.3
22 14.5 24.9 14.0 14.0
23 14.5 24.9 14.0 14.0
24 14.5 24.8 14.1 14.1
19 14.4 25.0 14.0 14.0
20 14.4 25.0 14.0 14.0
21 14.4 25.0 14.0 14.0
16 14.5 24.6 14.1 14.1
17 14.5 24.8 14.0 14.0
18 14.5 24.9 14.0 14.0
13 15.2 22.0 14.7 14.7
outlier 11.2 19.0
15 14.5 24.4 14.0 14.0
10 15.0 22.4 14.5 14.5
11 15.2 22.3 14.7 14.7
12 15.1 22.2 14.7 14.7
not used
not used
9 15.3 22.1 14.8 18.9
not used
not used
not used
2 0.2 -- 0.4 0.4
3 0.2 -- 0.4 0.4
O2 - Calculation of calibrated CEM values
O2 - Plot 2 - Plot of CEM data versus SRM data
0
2
4
6
8
10
12
14
16
0 2 4 6 8 10 12 14 16 18
SR
M, %
CEM, %
Calibration Function for CEM - Component
SRM vs CEM data Linear (SRM vs CEM data)
Page 66 of 82
LEK09311
5th - 14th June 2013
Permit No. 770
Novartis
Ringaskiddy
-
For
insp
ectio
n pur
pose
s only
.
Conse
nt of
copy
right
owne
r req
uired
for a
ny ot
her u
se.
EPA Export 04-01-2017:02:05:35

The variability is accepted if: Sd ≤ Qo x Kv
Where
Qo is the uncertainty laid down by the Authorities at the emission limit value as a 95% confidence interval.
Qo = Daily Emission Limit Value X Measurement Uncertainty
Where Surrogate Emission Limit = 25 % Measurement Uncertainty = 10%
Kv = the test parameter (for 25 Pairs of Data is 0.9861)
Variability Pass Criteria
Sample CEM Dry
SRM
Corrected
Value
y is
%
Difference
between
SRM and
CEM
Difference
(D - Dmean)
Square of
Difference
(D - Dmean)2
Table of Results - 4.5
1 0.4 0.0 -0.4 -0.3 0.1
O2 - Variability Test
The next stage of the calibration process is to determine if the proposed calibration function passes the variability test.
Sd is the standard deviation of the differences between the SRM value at Reportable Conditions and the Calibrated CEM value at Reportable
Conditions.
1.96
0.93 < 1.26
0.3 0.1
outlier
CEM HAS PASSED VARIABILITY TEST
30 14.5 15.0 0.5 0.7 0.4
25 14.1 14.1 0.0 0.2 0.0
26 14.7 14.9 0.2
24 14.1 12.9 -1.2 -1.0 1.0
16 14.1 14.0 0.0 0.1 0.0
17 14.0 13.9 -0.1 0.1 0.0
18 14.0 13.9 -0.1 0.1 0.0
13 14.7 14.8 0.1 0.3 0.1
outlier
0.9 0.7
29 14.3 14.8 0.5 0.7
19 14.0 13.7 -0.3 -0.1 0.0
20 14.0 13.9 -0.1 0.1 0.0
21 14.0 14.0 0.0 0.1 0.0
22 14.0 13.2 -0.8 -0.6 0.4
23 14.0 14.0 0.0 0.2 0.0
0.5
0.2 0.015 14.0 14.0 0.0
10 14.5 14.8 0.2 0.4 0.2
11 14.7 14.9 0.1 0.3 0.1
12 14.7 15.1 0.4 0.6 0.3
not used
not used
9 18.9 14.8 -4.1 -4.0 15.8
not used
not used
not used
2 0.4 0.0 -0.4 -0.3 0.1
3 0.4 0.0 -0.4 -0.3 0.1
O2 - Data Used for the variability test
31 14.3 14.8 0.6 0.7 0.5
32 14.5 15.0 0.5 0.6 0.4
28 14.4 15.1 0.7
vD ks 0
Page 67 of 82
LEK09311
5th - 14th June 2013
Permit No. 770
Novartis
Ringaskiddy
-
For
insp
ectio
n pur
pose
s only
.
Conse
nt of
copy
right
owne
r req
uired
for a
ny ot
her u
se.
EPA Export 04-01-2017:02:05:35
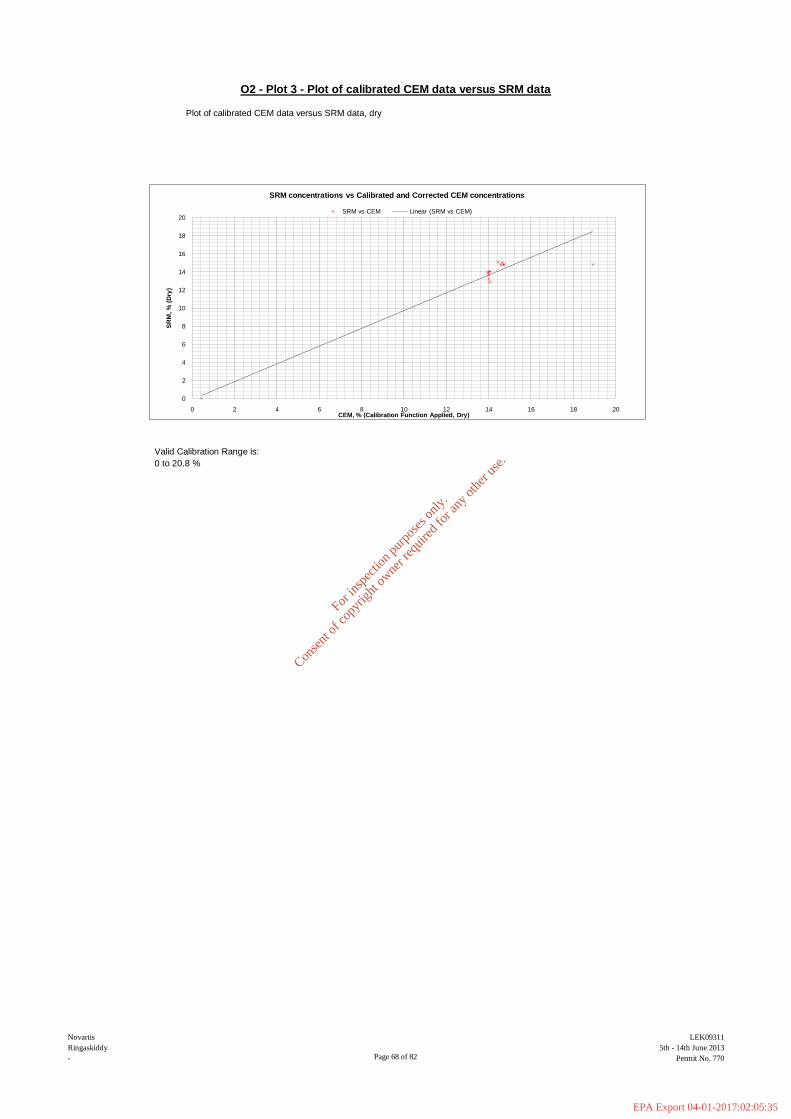
Plot of calibrated CEM data versus SRM data, dry
Valid Calibration Range is:
0 to 20.8 %
O2 - Plot 3 - Plot of calibrated CEM data versus SRM data
0
2
4
6
8
10
12
14
16
18
20
0 2 4 6 8 10 12 14 16 18 20
SR
M, %
(D
ry)
CEM, % (Calibration Function Applied, Dry)
SRM concentrations vs Calibrated and Corrected CEM concentrations
SRM vs CEM Linear (SRM vs CEM)
Page 68 of 82
LEK09311
5th - 14th June 2013
Permit No. 770
Novartis
Ringaskiddy
-
For
insp
ectio
n pur
pose
s only
.
Conse
nt of
copy
right
owne
r req
uired
for a
ny ot
her u
se.
EPA Export 04-01-2017:02:05:35

Having passed the variability test the next stage of the process is to establish the valid range of the calibrated CEMs
values at reportable conditions. This is done by finding the maximum CEM value at reportable conditions from the
parallel testing pairs (not including linearity data) and then adding 10% to that value.
0 to 20.8 %
O2 - Valid range & range extension
0 to 20.9 %
If after the parallel testing phase of the QAL 2 it was possible to derive a calibration function, but the function has
a limited valid range i.e. it does not extend to or beyond the emission limit value, then it may be possible to extend
the valid range of the function to which ever is the lowest of either the highest surrogate or the emission limit
value. To do this there has to be good agreement between the calibration function and the linearity data.
Good agreement is defined as when the two sets of data are overlain they lie within the allowable uncertainty at a 95%
confidence interval at the emission limit value for the parameter in question.
The allowable uncertainty at a 95% confidence interval at the emission limit value is calculated by applying the Qo
equation which is also used in the test of variability.
0.0
10.0
20.0
30.0
40.0
50.0
60.0
0.0 10.0 20.0 30.0 40.0 50.0 60.0
SR
M, %
Calibrated CEM, %
Range extension of calibration function based on linearity data
Min Max Linearity Data SRM v Cal'd CEM extrapolated data Linear (Linearity Data)
Page 69 of 82
LEK09311
5th - 14th June 2013
Permit No. 770
Novartis
Ringaskiddy
-
For
insp
ectio
n pur
pose
s only
.
Conse
nt of
copy
right
owne
r req
uired
for a
ny ot
her u
se.
EPA Export 04-01-2017:02:05:35

to
to
to
to
to
to
to
to
to
to
to
to
to
to
to
to
to
to
to
to
to
to
to
to
Table of Results - 4.1
CEM
Measured
Value
xi
%
SRM
Measured
Value
yi
%
Sample Date and Time
1
Zero Values (<5% ELV)
Linearity Data
0.2
H2O - Raw Monitoring Data
0.0
11/06/2013 13:10
22.1
30 13/06/2013 22:30 13/06/2013 23:00 23.3 22.1
31 13/06/2013 23:30 14/06/2013 00:00 23.6 22.0
outlier 13/06/2013 19:30 13/06/2013 20:00 18.3 21.7
28 13/06/2013 20:30 13/06/2013 21:00 23.0 21.5
32 14/06/2013 00:30 14/06/2013 01:00 23.4
23 13/06/2013 04:30 13/06/2013 05:00 24.9 24.8
29 13/06/2013 21:30 13/06/2013 22:00 23.4 21.9
24 13/06/2013 05:30 13/06/2013 06:00 24.8 22.8
25 13/06/2013 06:30 13/06/2013 07:00 24.8 24.7
26 13/06/2013 10:05 13/06/2013 10:35 21.6 21.5
19 13/06/2013 00:30 13/06/2013 01:00 25.0 24.6
20 13/06/2013 01:30 13/06/2013 02:00 25.0 24.9
21 13/06/2013 02:30 13/06/2013 03:00 25.0 24.9
22 13/06/2013 03:30 13/06/2013 04:00 24.9 23.7
15 12/06/2013 20:30 12/06/2013 21:00 24.4 24.2
16 12/06/2013 21:30 12/06/2013 22:00 24.6 24.5
17 12/06/2013 22:30 12/06/2013 23:00 24.8 24.7
18 12/06/2013 23:30 13/06/2013 00:00 24.9 24.8
12/06/2013 11:20 12/06/2013 11:50 22.3 22.1
11/06/2013 12:40
12 12/06/2013 15:55 12/06/2013 16:25 22.2 21.5
13 12/06/2013 18:30 12/06/2013 19:00 22.0 21.9
outlier 12/06/2013 19:30 12/06/2013 20:00 19.0 24.1
not used -- --
9 22.1 22.6
10 11/06/2013 15:08 11/06/2013 15:38 22.4 20.7
11
not used --
0.2 0.0
3 0.2 0.0
not used -- --
not used -- --
not used -- --
--
2
Page 70 of 82
LEK09311
5th - 14th June 2013
Permit No. 770
Novartis
Ringaskiddy
-
For
insp
ectio
n pur
pose
s only
.
Conse
nt of
copy
right
owne
r req
uired
for a
ny ot
her u
se.
EPA Export 04-01-2017:02:05:35
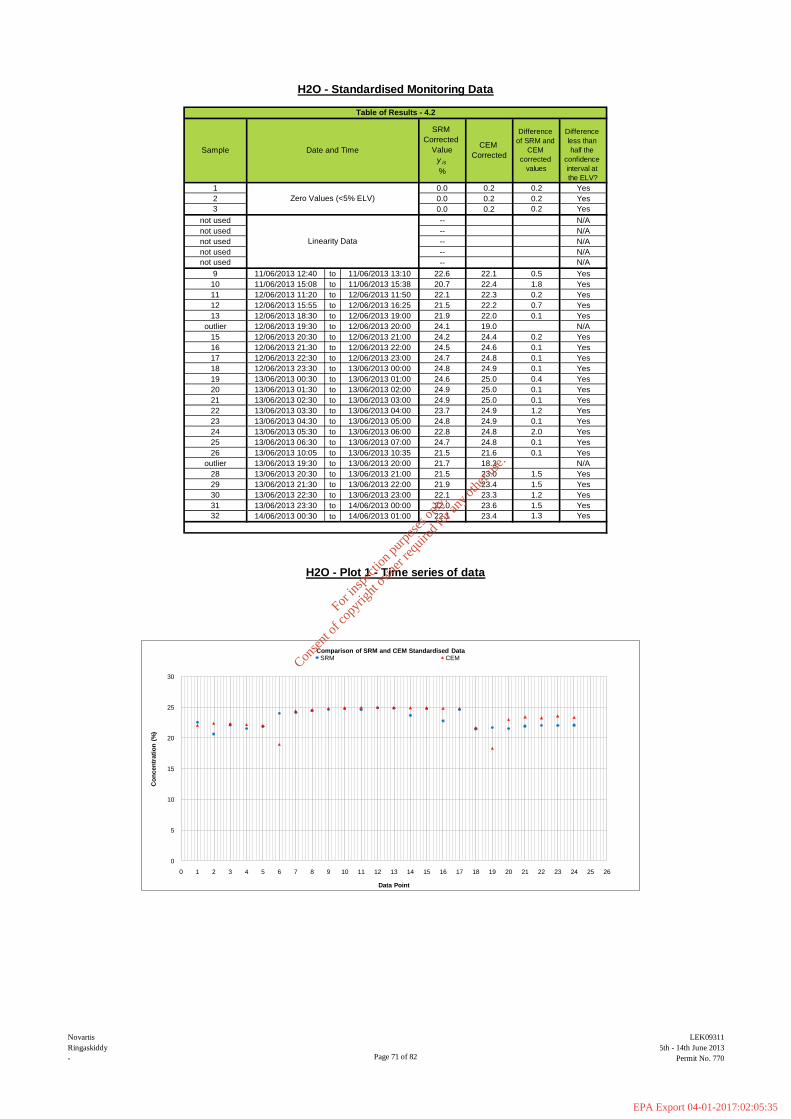
to
to
to
to
to
to
to
to
to
to
to
to
to
to
to
to
to
to
to
to
to
to
to
to
24.9 25.0
21 13/06/2013 02:30 13/06/2013 03:00 24.9 25.0
22 13/06/2013 03:30 13/06/2013 04:00 23.7 24.9
23.3
23 13/06/2013 04:30 13/06/2013 05:00 24.8 24.9
24 13/06/2013 05:30 13/06/2013 06:00 22.8 24.8
25 13/06/2013 06:30 13/06/2013 07:00 24.7 24.8
26 13/06/2013 10:05 13/06/2013 10:35 21.5 21.6
14/06/2013 01:00 22.1 23.4
31 13/06/2013 23:30 14/06/2013 00:00 22.0
12 12/06/2013 15:55 12/06/2013 16:25 21.5 22.2
1.5
1.3
H2O - Plot 1 - Time series of data
0.0
Sample Date and Time
SRM
Corrected
Value
y is
%
CEM
Corrected
Zero Values (<5% ELV)
1 0.2
not used --
not used --
not used --
not used --
H2O - Standardised Monitoring Data
Yes
Yes
Yes
Yes
Yes
N/A
Yes
Table of Results - 4.2
0.2
0.2
1.8
0.2
0.7
0.1
0.2
9 22.6 22.1
10
23.6
32 14/06/2013 00:30
23.4
30 13/06/2013 22:30 13/06/2013 23:00
0.4
0.1
0.1
1.2
0.1
2.0
0.1
0.1
1.5
1.5
1.2
22.0
outlier 12/06/2013 19:30 12/06/2013 20:00 24.1 19.0
15 12/06/2013 20:30 12/06/2013 21:00 24.2 24.4
16 12/06/2013 21:30 12/06/2013 22:00 24.5 24.6
17 12/06/2013 22:30 12/06/2013 23:00 24.7 24.8
18 12/06/2013 23:30 13/06/2013 00:00 24.8 24.9
19
13/06/2013 21:00 21.5
22.1
13 12/06/2013 18:30 12/06/2013 19:00 21.9
13/06/2013 22:00 21.9
2 0.0 0.2
3 0.0 0.2
not used --
N/A
N/A
N/A
11/06/2013 15:08 11/06/2013 15:38 20.7 22.4
11/06/2013 13:1011/06/2013 12:40
Linearity Data
11 12/06/2013 11:20 12/06/2013 11:50 22.1 22.3
Difference
less than
half the
confidence
interval at
the ELV?
Yes
Yes
Yes
N/A
N/A
Yes
Yes
Yes
Yes
Yes
Yes
N/A
Yes
Yes
Yes
Yes
Yes
Difference
of SRM and
CEM
corrected
values
0.5
Yes
Yes
0.2
13/06/2013 00:30 13/06/2013 01:00 24.6 25.0
20 13/06/2013 01:30 13/06/2013 02:00
Yes
Yes
Yes
0.1
0.1
0.1
outlier 13/06/2013 19:30 13/06/2013 20:00 21.7 18.3
28 13/06/2013 20:30 23.0
29 13/06/2013 21:30
0
5
10
15
20
25
30
0 1 2 3 4 5 6 7 8 9 10 11 12 13 14 15 16 17 18 19 20 21 22 23 24 25 26
Co
ncen
trati
on
(%
)
Data Point
Comparison of SRM and CEM Standardised Data SRM CEM
Page 71 of 82
LEK09311
5th - 14th June 2013
Permit No. 770
Novartis
Ringaskiddy
-
For
insp
ectio
n pur
pose
s only
.
Conse
nt of
copy
right
owne
r req
uired
for a
ny ot
her u
se.
EPA Export 04-01-2017:02:05:35
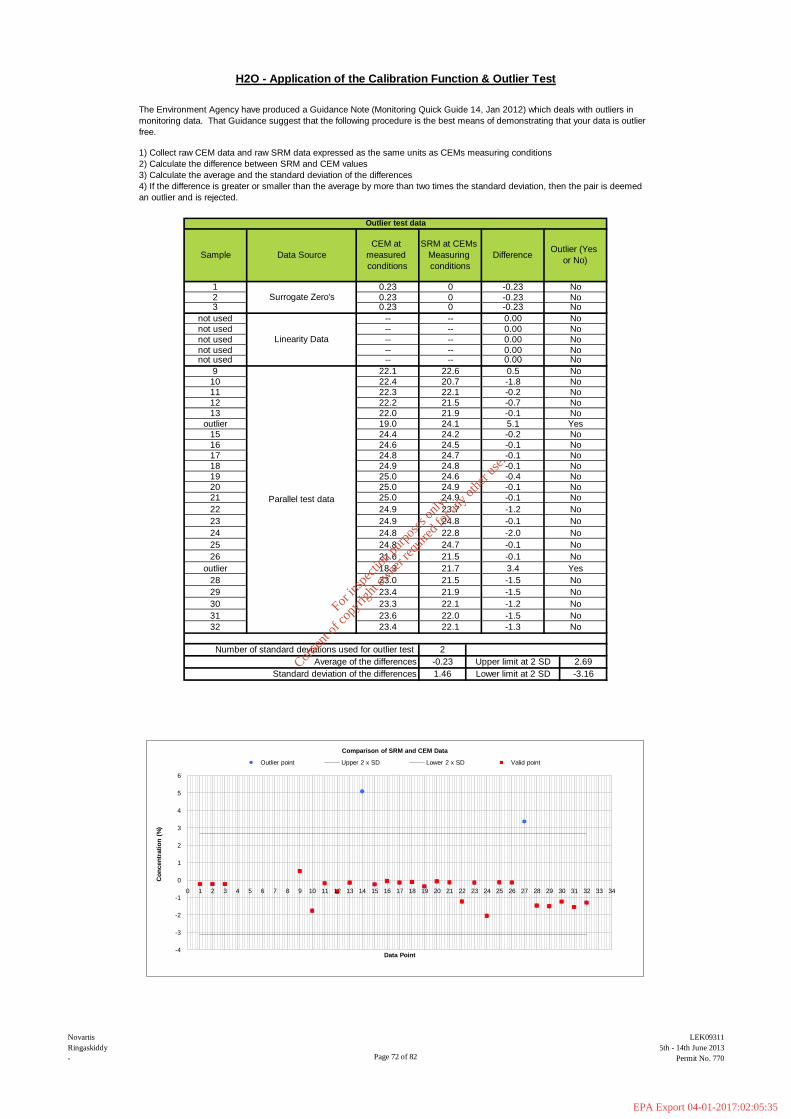
15
16
17
18
19
20
21
22
23
24
25
26
outlier
28
29
--
The Environment Agency have produced a Guidance Note (Monitoring Quick Guide 14, Jan 2012) which deals with outliers in
monitoring data. That Guidance suggest that the following procedure is the best means of demonstrating that your data is outlier
free.
22.1 -0.2 No
No
22.0 21.9 -0.1 No
19.0 24.1 5.1 Yes
24.4 24.2 -0.2 No
2Number of standard deviations used for outlier test
Average of the differences
Standard deviation of the differences
-0.23
1.46
12
13
outlier
Data Source
Surrogate Zero's
Linearity Data
Parallel test data
0.23
0.23
0
0
-0.23
-0.23
No
No0.23 0 -0.23 No
-- -- 0.00 No
-- -- 0.00 No
-- -- 0.00 No
1
23
not used
not used
not used
not usednot used
9
10
11
22.2 21.5 -0.7
Lower limit at 2 SD
2.69
-3.16
24.8 24.7 -0.1 No
21.6 21.5 -0.1 No
18.3 21.7 3.4 Yes
23.0 21.5 -1.5 No
23.4 21.9 -1.5 No
23.3 22.1 -1.2 No
23.6 22.0 -1.5 No
23.4 22.1 -1.3 No
Upper limit at 2 SD
24.6 24.5 -0.1 No
24.8 24.7 -0.1 No
24.9 24.8 -0.1 No
25.0 24.6 -0.4 No
25.0 24.9 -0.1 No
25.0 24.9 -0.1 No
24.9 23.7 -1.2
22.4 20.7 -1.8 No
22.3
Outlier test data
30
31
32
CEM at
measured
conditions
SRM at CEMs
Measuring
conditions
DifferenceOutlier (Yes
or No)
No
24.9 24.8 -0.1 No
24.8 22.8 -2.0 No
-- 0.00 No-- -- 0.00 No
22.1 22.6 0.5 No
H2O - Application of the Calibration Function & Outlier Test
1) Collect raw CEM data and raw SRM data expressed as the same units as CEMs measuring conditions
2) Calculate the difference between SRM and CEM values
3) Calculate the average and the standard deviation of the differences
4) If the difference is greater or smaller than the average by more than two times the standard deviation, then the pair is deemed
an outlier and is rejected.
Sample
-4
-3
-2
-1
0
1
2
3
4
5
6
0 1 2 3 4 5 6 7 8 9 10 11 12 13 14 15 16 17 18 19 20 21 22 23 24 25 26 27 28 29 30 31 32 33 34
Co
ncen
trati
on
(%
)
Data Point
Comparison of SRM and CEM Data
Outlier point Upper 2 x SD Lower 2 x SD Valid point
Page 72 of 82
LEK09311
5th - 14th June 2013
Permit No. 770
Novartis
Ringaskiddy
-
For
insp
ectio
n pur
pose
s only
.
Conse
nt of
copy
right
owne
r req
uired
for a
ny ot
her u
se.
EPA Export 04-01-2017:02:05:35
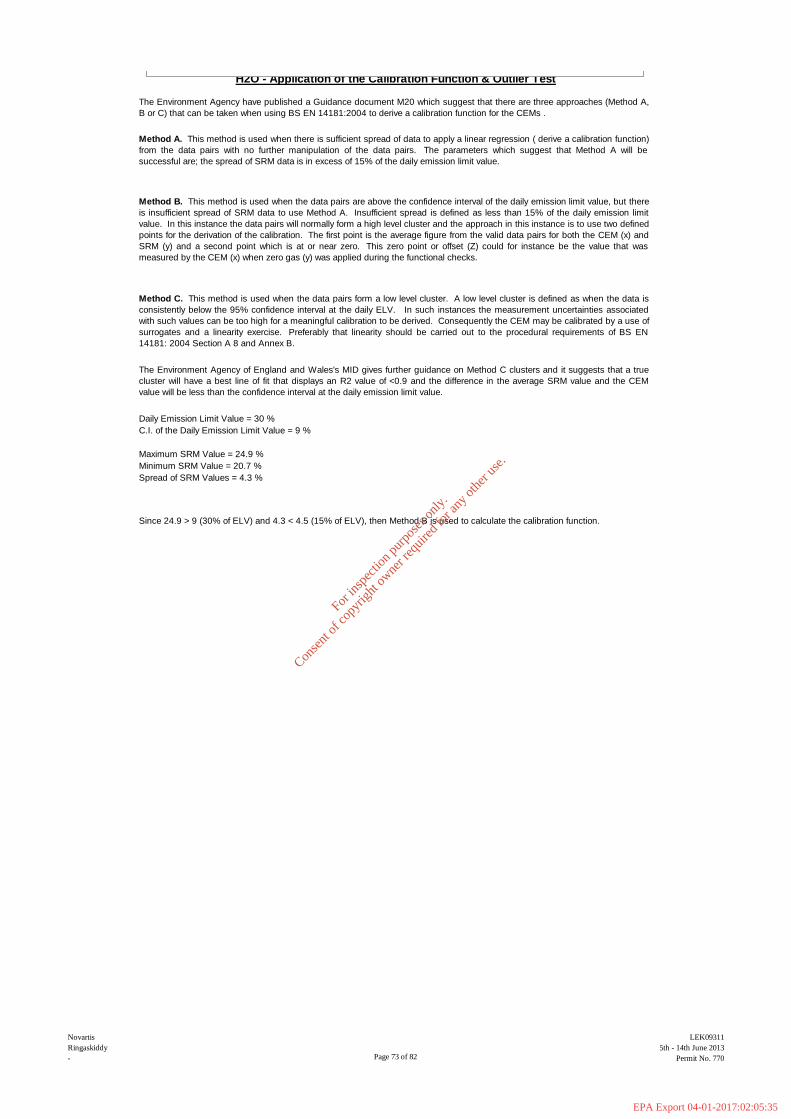
Daily Emission Limit Value = 30 %
C.I. of the Daily Emission Limit Value = 9 %
The Environment Agency have published a Guidance document M20 which suggest that there are three approaches (Method A,
B or C) that can be taken when using BS EN 14181:2004 to derive a calibration function for the CEMs .
Method A. This method is used when there is sufficient spread of data to apply a linear regression ( derive a calibration function)
from the data pairs with no further manipulation of the data pairs. The parameters which suggest that Method A will be
successful are; the spread of SRM data is in excess of 15% of the daily emission limit value.
Method B. This method is used when the data pairs are above the confidence interval of the daily emission limit value, but there
is insufficient spread of SRM data to use Method A. Insufficient spread is defined as less than 15% of the daily emission limit
value. In this instance the data pairs will normally form a high level cluster and the approach in this instance is to use two defined
points for the derivation of the calibration. The first point is the average figure from the valid data pairs for both the CEM (x) and
SRM (y) and a second point which is at or near zero. This zero point or offset (Z) could for instance be the value that was
measured by the CEM (x) when zero gas (y) was applied during the functional checks.
Method C. This method is used when the data pairs form a low level cluster. A low level cluster is defined as when the data is
consistently below the 95% confidence interval at the daily ELV. In such instances the measurement uncertainties associated
with such values can be too high for a meaningful calibration to be derived. Consequently the CEM may be calibrated by a use of
surrogates and a linearity exercise. Preferably that linearity should be carried out to the procedural requirements of BS EN
14181: 2004 Section A 8 and Annex B.
The Environment Agency of England and Wales's MID gives further guidance on Method C clusters and it suggests that a true
cluster will have a best line of fit that displays an R2 value of <0.9 and the difference in the average SRM value and the CEM
value will be less than the confidence interval at the daily emission limit value.
Maximum SRM Value = 24.9 %
Spread of SRM Values = 4.3 %
Since 24.9 > 9 (30% of ELV) and 4.3 < 4.5 (15% of ELV), then Method B is used to calculate the calibration function.
Minimum SRM Value = 20.7 %
H2O - Application of the Calibration Function & Outlier Test
Page 73 of 82
LEK09311
5th - 14th June 2013
Permit No. 770
Novartis
Ringaskiddy
-
For
insp
ectio
n pur
pose
s only
.
Conse
nt of
copy
right
owne
r req
uired
for a
ny ot
her u
se.
EPA Export 04-01-2017:02:05:35
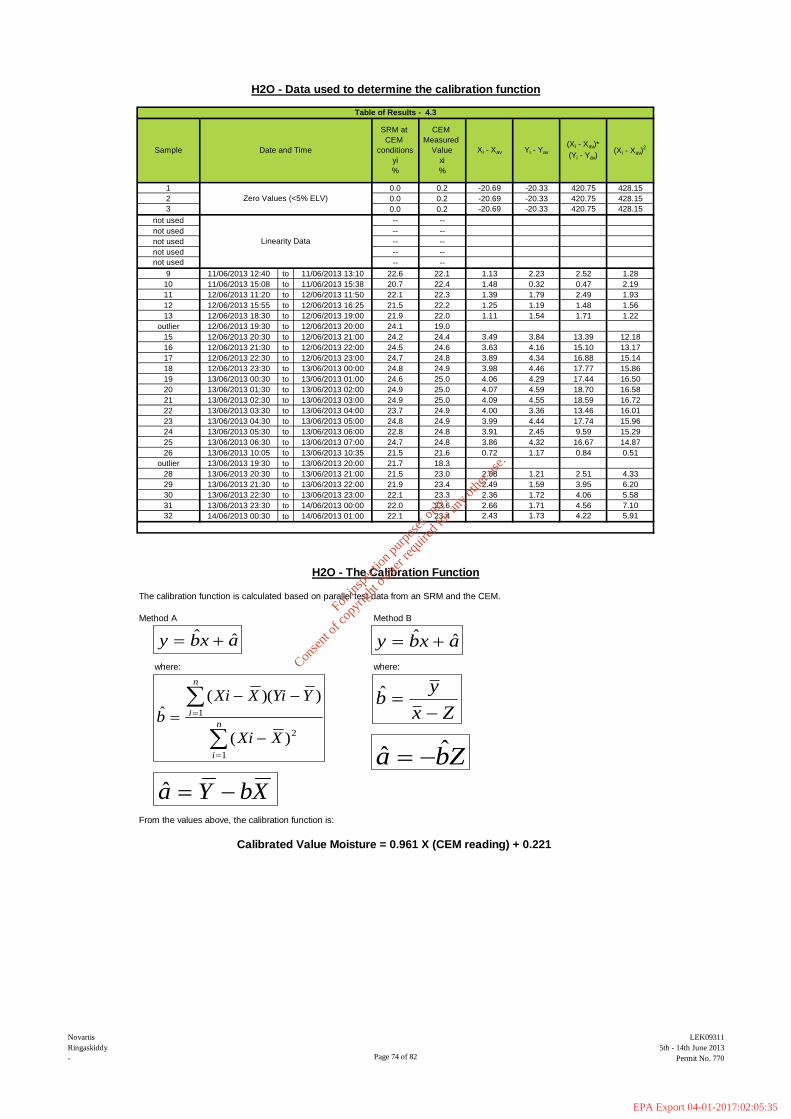
to
to
to
to
to
to
to
to
to
to
to
to
to
to
to
to
to
to
to
to
to
to
to
to
The calibration function is calculated based on parallel test data from an SRM and the CEM.
Method A Method B
where: where:
From the values above, the calibration function is:
1
29 13/06/2013 21:30 13/06/2013 22:00 21.9 23.4
30 13/06/2013 22:30 13/06/2013 23:00 22.1 23.3
26 13/06/2013 10:05 13/06/2013 10:35 21.5 21.6
H2O - The Calibration Function
31 13/06/2013 23:30 14/06/2013 00:00 22.0 23.6
32 14/06/2013 00:30 14/06/2013 01:00 22.1 23.4
Calibrated Value Moisture = 0.961 X (CEM reading) + 0.221
24 13/06/2013 05:30 13/06/2013 06:00 22.8 24.8
24.6 25.0
20 13/06/2013 01:30 13/06/2013 02:00 24.9 25.0
21 13/06/2013 02:30 13/06/2013 03:00 24.9 25.0
22 13/06/2013 03:30 13/06/2013 04:00 23.7
25 13/06/2013 06:30 13/06/2013 07:00 24.7 24.8
outlier 13/06/2013 19:30 13/06/2013 20:00 21.7 18.3
4.00
28 13/06/2013 20:30 13/06/2013 21:00 21.5 23.0
2 0.0 0.2
3 0.0 0.2
not used -- --
0.0 0.2
Date and Time
Zero Values (<5% ELV)
Sample
SRM at
CEM
conditions
yi
%
CEM
Measured
Value
xi
%
not used -- --
not used -- --
not used
1.281.13
11 12/06/2013 11:20 12/06/2013 11:50 22.1 22.3
12 12/06/2013 15:55 12/06/2013 16:25 21.5
9 22.6 22.1
10 11/06/2013 15:08 11/06/2013 15:38 20.7 22.4
11/06/2013 13:1011/06/2013 12:40
Linearity Data
H2O - Data used to determine the calibration function
22.2
420.75
420.75
420.75
Xi - Xav Yi - Yav
(Xi - Xav)*
(Yi - Yav)(Xi - Xav)
2
-20.69
-20.69
-20.69
3.99
3.91
3.86
7.10
5.91
0.72
2.08
2.49
2.36
2.66
2.43
-20.33
-20.33
-20.33
2.23
0.32
1.79
1.19
1.54
3.84
4.16
4.34
4.46
4.29
4.59
4.55
3.36
4.44
2.45
4.32
1.17
1.21
1.59
1.72
1.71
1.73 4.22
4.56
4.06
3.95
2.51
0.84
16.67
9.59
17.74
13.46
18.59
1.48
1.39
1.25
1.11
18 12/06/2013 23:30 13/06/2013 00:00 24.8 24.9
19 13/06/2013 00:30 13/06/2013 01:00
-- --
not used -- --
13 12/06/2013 18:30 12/06/2013 19:00 21.9 22.0
outlier 12/06/2013 19:30 12/06/2013 20:00 24.1 19.0
15 12/06/2013 20:30 12/06/2013 21:00 24.2 24.4
16 12/06/2013 21:30 12/06/2013 22:00 24.5 24.6
17 12/06/2013 22:30 12/06/2013 23:00 24.7 24.8
24.9
23 13/06/2013 04:30 13/06/2013 05:00 24.8 24.9
2.19
1.93
1.56
1.22
12.18
13.17
15.14
16.72
16.01
15.96
15.29
14.87
0.51
4.33
6.20
5.58
Table of Results - 4.3
15.86
16.50
16.58
3.49
3.63
3.89
3.98
18.70
17.44
17.77
16.88
15.10
13.39
1.71
1.48
2.49
0.47
2.52
428.15
428.15
428.15
4.06
4.07
4.09
Zx
yb
ˆ
Zba ˆˆ
axby ˆˆ axby ˆˆ
n
i
n
i
XXi
YYiXXi
b
1
2
1
)(
))((ˆ
XbYa ˆ
Page 74 of 82
LEK09311
5th - 14th June 2013
Permit No. 770
Novartis
Ringaskiddy
-
For
insp
ectio
n pur
pose
s only
.
Conse
nt of
copy
right
owne
r req
uired
for a
ny ot
her u
se.
EPA Export 04-01-2017:02:05:35
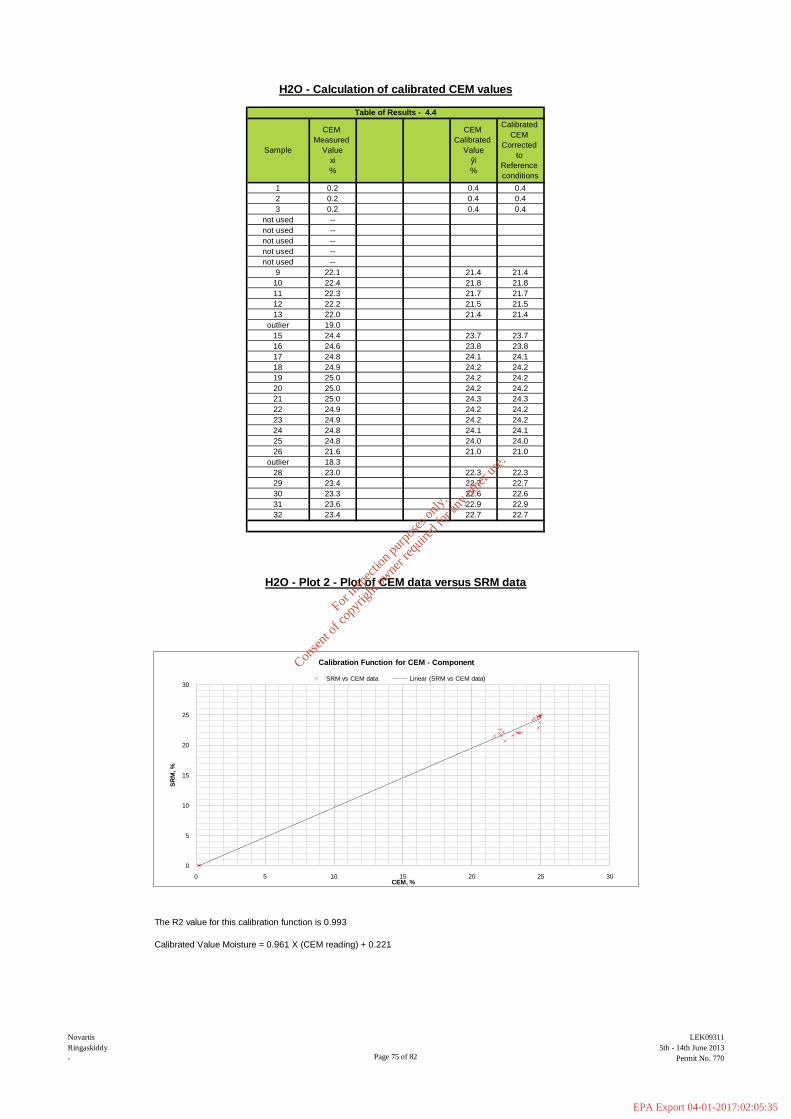
The R2 value for this calibration function is 0.993
Calibrated Value Moisture = 0.961 X (CEM reading) + 0.221
Table of Results - 4.4
1 0.2 0.4 0.4
Sample
CEM
Measured
Value
xi
%
CEM
Calibrated
Value
ŷi
%
Calibrated
CEM
Corrected
to
Reference
conditions
28 23.0 22.3 22.3
29 23.4 22.7 22.7
30 23.3 22.6 22.6
31 23.6 22.9 22.9
32 23.4 22.7 22.7
22 24.9 24.2 24.2
23 24.9 24.2 24.2
24 24.8 24.1 24.1
25 24.8 24.0 24.0
26 21.6 21.0 21.0
outlier 18.3
16 24.6 23.8 23.8
17 24.8 24.1 24.1
18 24.9 24.2 24.2
19 25.0 24.2 24.2
20 25.0 24.2 24.2
21 25.0 24.3 24.3
10 22.4 21.8 21.8
11 22.3 21.7 21.7
12 22.2 21.5 21.5
13 22.0 21.4 21.4
outlier 19.0
15 24.4 23.7 23.7
not used --
not used --
not used --
not used --
not used --
9 22.1 21.4 21.4
2 0.2 0.4 0.4
H2O - Calculation of calibrated CEM values
3 0.2 0.4 0.4
H2O - Plot 2 - Plot of CEM data versus SRM data
0
5
10
15
20
25
30
0 5 10 15 20 25 30
SR
M, %
CEM, %
Calibration Function for CEM - Component
SRM vs CEM data Linear (SRM vs CEM data)
Page 75 of 82
LEK09311
5th - 14th June 2013
Permit No. 770
Novartis
Ringaskiddy
-
For
insp
ectio
n pur
pose
s only
.
Conse
nt of
copy
right
owne
r req
uired
for a
ny ot
her u
se.
EPA Export 04-01-2017:02:05:35
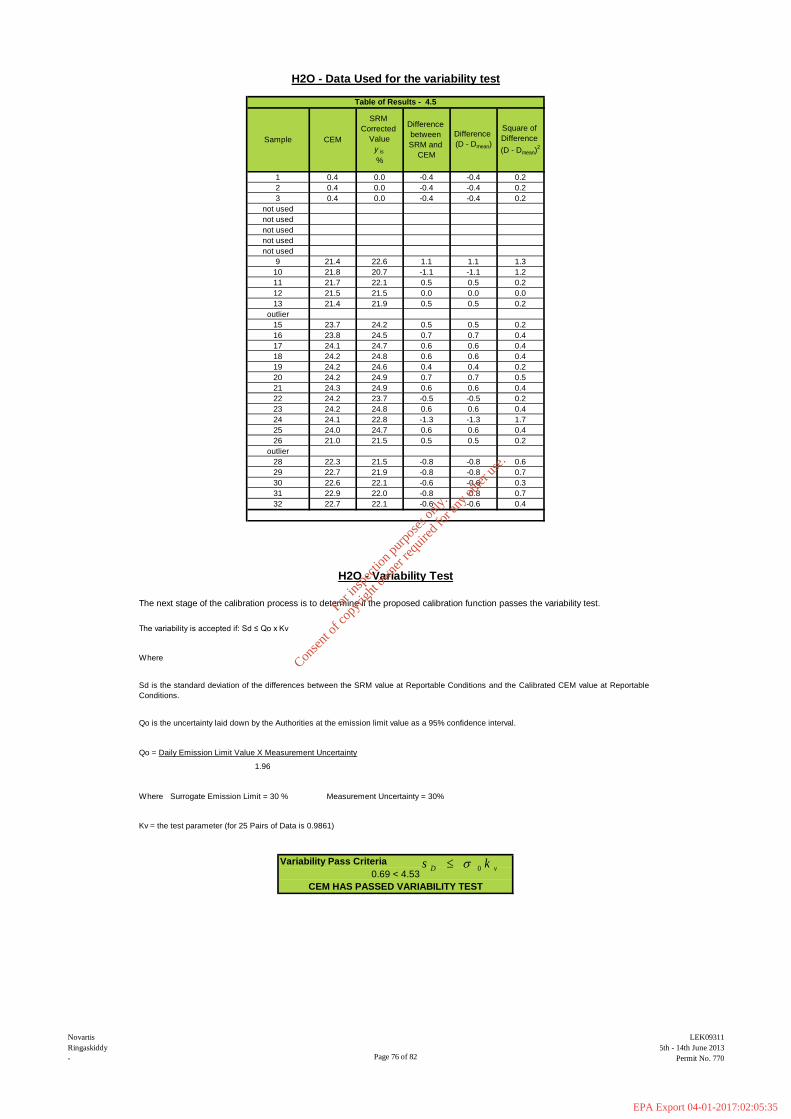
The variability is accepted if: Sd ≤ Qo x Kv
Where
Qo is the uncertainty laid down by the Authorities at the emission limit value as a 95% confidence interval.
Qo = Daily Emission Limit Value X Measurement Uncertainty
Where Surrogate Emission Limit = 30 % Measurement Uncertainty = 30%
Kv = the test parameter (for 25 Pairs of Data is 0.9861)
Variability Pass Criteria
Sample CEM
SRM
Corrected
Value
y is
%
Difference
between
SRM and
CEM
Difference
(D - Dmean)
Square of
Difference
(D - Dmean)2
Table of Results - 4.5
0.4
24.9 0.7
31
0.5 0.2
13
CEM HAS PASSED VARIABILITY TEST
0.3
25 24.0 24.7 0.6 0.6 0.4
26 21.0 21.5 0.5
24 24.1 22.8
0.5 0.2
not used
not used
9
24.1 24.7 0.6 0.6 0.4
18 24.2
22.9 22.0 -0.8 -0.8 0.7
32 22.7 22.1 -0.6 -0.6 0.4
28 22.3 21.5 -0.8 -0.8 0.6
29 22.7 21.9 -0.8 -0.8
19 24.2 24.6
H2O - Variability Test
The next stage of the calibration process is to determine if the proposed calibration function passes the variability test.
Sd is the standard deviation of the differences between the SRM value at Reportable Conditions and the Calibrated CEM value at Reportable
Conditions.
1.96
0.69 < 4.53
21.4 21.9
15 23.7 24.2 0.5
-1.3 -1.3 1.7
23 24.2 24.8 0.6 0.6 0.4
0.7
30 22.6 22.1 -0.6 -0.6
16 23.8 24.5 0.7 0.7 0.4
17
0.4 0.2
20 24.2 0.7 0.5
21 24.3 24.9 0.6 0.6 0.4
22 24.2 23.7 -0.5 -0.5 0.2
outlier
0.6 0.6 0.4
0.5 0.5 0.2
outlier
24.8
10 21.8 20.7 -1.1 -1.1 1.2
11 21.7 22.1 0.5 0.5 0.2
12 21.5 21.5 0.0 0.0
not used
not used
not used
21.4 22.6 1.1 1.1 1.3
0.0
2 0.4 0.0 -0.4 -0.4 0.2
3 0.4 0.0 -0.4 -0.4 0.2
1 0.4 0.0 -0.4 -0.4 0.2
H2O - Data Used for the variability test
vD ks 0
Page 76 of 82
LEK09311
5th - 14th June 2013
Permit No. 770
Novartis
Ringaskiddy
-
For
insp
ectio
n pur
pose
s only
.
Conse
nt of
copy
right
owne
r req
uired
for a
ny ot
her u
se.
EPA Export 04-01-2017:02:05:35
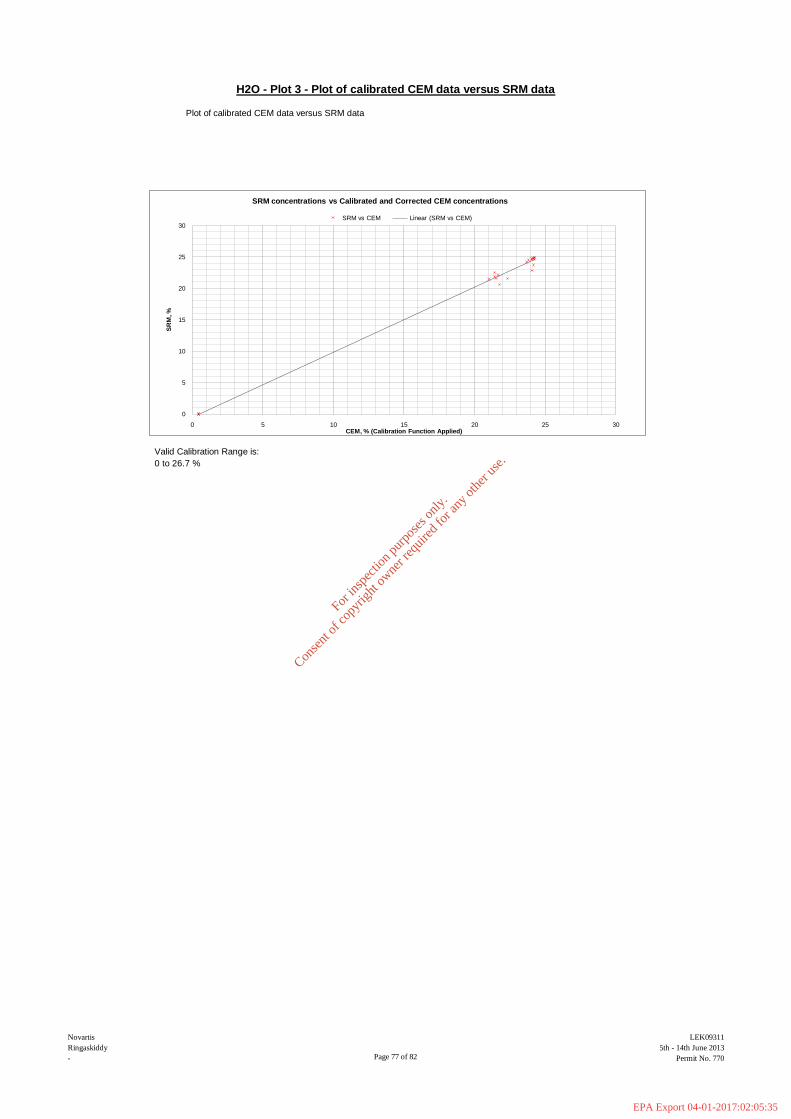
Plot of calibrated CEM data versus SRM data
Valid Calibration Range is:
0 to 26.7 %
H2O - Plot 3 - Plot of calibrated CEM data versus SRM data
0
5
10
15
20
25
30
0 5 10 15 20 25 30
SR
M, %
CEM, % (Calibration Function Applied)
SRM concentrations vs Calibrated and Corrected CEM concentrations
SRM vs CEM Linear (SRM vs CEM)
Page 77 of 82
LEK09311
5th - 14th June 2013
Permit No. 770
Novartis
Ringaskiddy
-
For
insp
ectio
n pur
pose
s only
.
Conse
nt of
copy
right
owne
r req
uired
for a
ny ot
her u
se.
EPA Export 04-01-2017:02:05:35

It is not possible to extend the range further
Having passed the variability test the next stage of the process is to establish the valid range of the calibrated CEMs
values at reportable conditions. This is done by finding the maximum CEM value at reportable conditions from the
parallel testing pairs (not including linearity data) and then adding 10% to that value.
0 to 26.7 %
H2O - Valid range & range extension
If after the parallel testing phase of the QAL 2 it was possible to derive a calibration function, but the function has
a limited valid range i.e. it does not extend to or beyond the emission limit value, then it may be possible to extend
the valid range of the function to which ever is the lowest of either the highest surrogate or the emission limit
value. To do this there has to be good agreement between the calibration function and the linearity data.
Good agreement is defined as when the two sets of data are overlain they lie within the allowable uncertainty at a 95%
confidence interval at the emission limit value for the parameter in question.
The allowable uncertainty at a 95% confidence interval at the emission limit value is calculated by applying the Qo
equation which is also used in the test of variability.
Page 78 of 82
LEK09311
5th - 14th June 2013
Permit No. 770
Novartis
Ringaskiddy
-
For
insp
ectio
n pur
pose
s only
.
Conse
nt of
copy
right
owne
r req
uired
for a
ny ot
her u
se.
EPA Export 04-01-2017:02:05:35

Note - CEMS Functional testing and associated reporting do not form part of ESG's Mcerts accreditation.
Gas conditioning systems Yes
Pumps Yes
Contamination control (internal check of optical surfaces) Yes
2. Sampling Systems
A visual inspection of the sampling system shall be performed, noting the condition of the following components, when fitted:
Sampling probe Yes
After re-assembly at the measurement location at least the
following shall be checked
Yes
Alignment of the measuring system Yes
Obstructions in the optical path Yes
A visual inspection, with reference to the CEMs manuals, shall be carried out on the following when applicable:
Internal check of the CEM Yes
Cleanliness of the optical components Yes
EA Proforma Functional Checks
Requirement Yes / No / N/A Notes
1. Alignment and Cleanliness
Flushing air supply Yes
4. Zero and Span check
Reference zero and span materials shall be used to verify the
corresponding readings of the CEM.
Yes
In case of non-extractive CEM, zero and span checks shall be
performed using a reference-path free of flue gas before and
after readjustment and after re-assembly of the CEM at the
measurement location.
N/A
The sampling system shall be in good condition and free of
any visible faults, which may decrease the quality of data
Yes
3. Leak testing
Leak testing shall be performed according to the CEMs
manuals. The test shall cover the entire sampling system.
Yes
Power supplies Yes
Filters Yes
All connections Yes
Sample lines Yes
Section - Functional Test Report
Page 79 of 82
LEK09311
5th - 14th June 2013
Permit No. 770
Novartis
Ringaskiddy
-
For
insp
ectio
n pur
pose
s only
.
Conse
nt of
copy
right
owne
r req
uired
for a
ny ot
her u
se.
EPA Export 04-01-2017:02:05:35
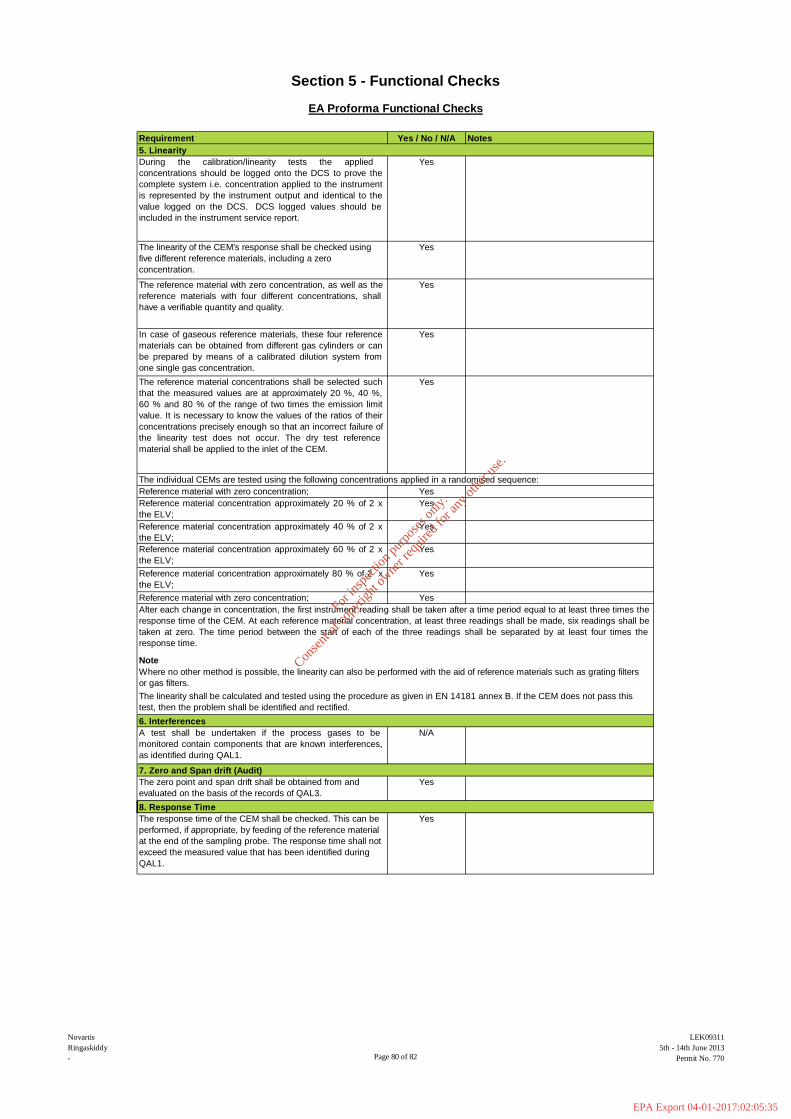
Section 5 - Functional Checks
EA Proforma Functional Checks
Requirement Yes / No / N/A Notes
5. Linearity
Reference material with zero concentration; Yes
After each change in concentration, the first instrument reading shall be taken after a time period equal to at least three times the
response time of the CEM. At each reference material concentration, at least three readings shall be made, six readings shall be
taken at zero. The time period between the start of each of the three readings shall be separated by at least four times the
response time.
Note
Where no other method is possible, the linearity can also be performed with the aid of reference materials such as grating filters
or gas filters.
Reference material concentration approximately 60 % of 2 x
the ELV;
Yes
Reference material concentration approximately 80 % of 2 x
the ELV;
Yes
Reference material concentration approximately 20 % of 2 x
the ELV;
Yes
Reference material concentration approximately 40 % of 2 x
the ELV;
Yes
The reference material concentrations shall be selected such
that the measured values are at approximately 20 %, 40 %,
60 % and 80 % of the range of two times the emission limit
value. It is necessary to know the values of the ratios of their
concentrations precisely enough so that an incorrect failure of
the linearity test does not occur. The dry test reference
material shall be applied to the inlet of the CEM.
Yes
The individual CEMs are tested using the following concentrations applied in a randomised sequence:
Reference material with zero concentration; Yes
The reference material with zero concentration, as well as the
reference materials with four different concentrations, shall
have a verifiable quantity and quality.
Yes
In case of gaseous reference materials, these four reference
materials can be obtained from different gas cylinders or can
be prepared by means of a calibrated dilution system from
one single gas concentration.
Yes
During the calibration/linearity tests the applied
concentrations should be logged onto the DCS to prove the
complete system i.e. concentration applied to the instrument
is represented by the instrument output and identical to the
value logged on the DCS. DCS logged values should be
included in the instrument service report.
Yes
The linearity of the CEM's response shall be checked using
five different reference materials, including a zero
concentration.
Yes
8. Response Time
The response time of the CEM shall be checked. This can be
performed, if appropriate, by feeding of the reference material
at the end of the sampling probe. The response time shall not
exceed the measured value that has been identified during
QAL1.
Yes
7. Zero and Span drift (Audit)
The zero point and span drift shall be obtained from and
evaluated on the basis of the records of QAL3.
Yes
The linearity shall be calculated and tested using the procedure as given in EN 14181 annex B. If the CEM does not pass this
test, then the problem shall be identified and rectified.
6. Interferences
A test shall be undertaken if the process gases to be
monitored contain components that are known interferences,
as identified during QAL1.
N/A
Page 80 of 82
LEK09311
5th - 14th June 2013
Permit No. 770
Novartis
Ringaskiddy
-
For
insp
ectio
n pur
pose
s only
.
Conse
nt of
copy
right
owne
r req
uired
for a
ny ot
her u
se.
EPA Export 04-01-2017:02:05:35
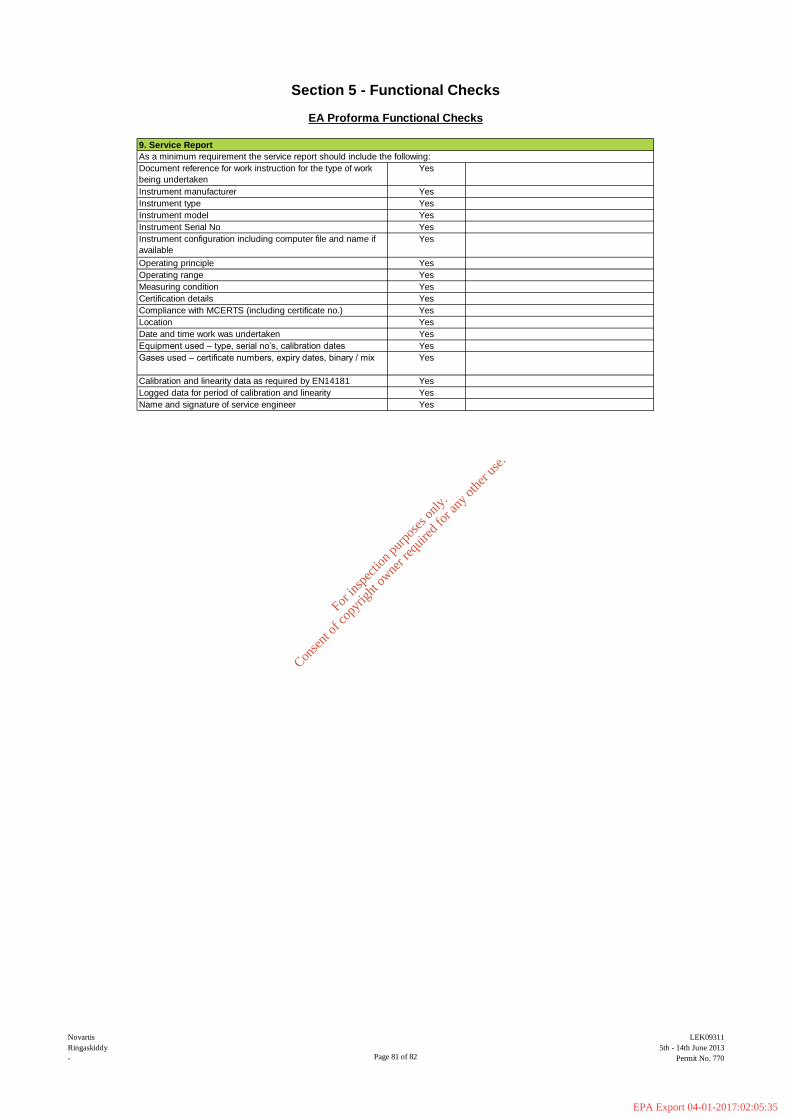
Instrument Serial No Yes
Instrument configuration including computer file and name if
available
Yes
Instrument type Yes
Instrument model Yes
Document reference for work instruction for the type of work
being undertaken
Yes
Instrument manufacturer Yes
9. Service Report
As a minimum requirement the service report should include the following:
Section 5 - Functional Checks
EA Proforma Functional Checks
Logged data for period of calibration and linearity Yes
Name and signature of service engineer Yes
Gases used – certificate numbers, expiry dates, binary / mix Yes
Calibration and linearity data as required by EN14181 Yes
Date and time work was undertaken Yes
Equipment used – type, serial no’s, calibration dates Yes
Compliance with MCERTS (including certificate no.) Yes
Location Yes
Measuring condition Yes
Certification details Yes
Operating principle Yes
Operating range Yes
Page 81 of 82
LEK09311
5th - 14th June 2013
Permit No. 770
Novartis
Ringaskiddy
-
For
insp
ectio
n pur
pose
s only
.
Conse
nt of
copy
right
owne
r req
uired
for a
ny ot
her u
se.
EPA Export 04-01-2017:02:05:35

Control Box DGM Horiba PG-250 Analyser Laboratory Balance
Box Thermocouples JCT JCC P-1 Cooler Tape Measure
Meter In Thermocouple MAK 10 Cooler Stopwatch
Meter Out Thermocouple FT-IR Protractor
Control Box Timer FT-IR Oven Box Barometer
Umbilical Bernath 3006 FID Digital Micromanometer
Oven Box Signal 3030 FID Digital Temperature Meter
Probe Servomex Stack Thermocouple
Probe Thermocouple JCT Heated Head Filter Mass Flow Controller
Probe Thermo FID Mass Flow Control Box
Probe Thermocouple Stackmaster 1m Heated Line (1)
Probe 1m Heated Line (2)
Probe Thermocouple 1m Heated Line (3)
S-Pitot 5m Heated Line (1)
L-Pitot 5m Heated Line (2)
Site Balance 10m Heated Line (1)
Last Impinger Arm 10m Heated Line (2)
Dioxins Cond. TC 15m Heated Line (1)
Callipers 15m Heated Line (2)
Small DGM 20m Heated Line (1)
Heater Controller 20m Heated Line (2)
Ecophysics Analyser
- -
13.21 -
- 8.11
- -
- - -
6.46 -
1.35 -
14.CD -
- -
13.13 - 12.2
11.24 - 10.24
10.24 - -
- 8.15 -
- - -
- FTIR Heater Box for - -
Section 6 - Calibrateable Equipment Checklist
Extractive Sampling Instrumental Analyser/s Miscellaneous
Equipment Equipment I.D. Equipment Equipment I.D. Equipment Equipment I.D.
9.17 12.5 -
9.11 - 20.4
9.17 - 17.21
9.17 05854 23.13
17.6 - 16.2
- - 15.7
END OF REPORT
Page 82 of 82
LEK09311
5th - 14th June 2013
Permit No. 770
Novartis
Ringaskiddy
-
For
insp
ectio
n pur
pose
s only
.
Conse
nt of
copy
right
owne
r req
uired
for a
ny ot
her u
se.
EPA Export 04-01-2017:02:05:35