Embed Size (px)
Citation preview

Bryan A. BlackBryan A. Black
Hatfield Marine Science CenterHatfield Marine Science CenterOregon State UniversityOregon State UniversityNewport, OregonNewport, Oregon
Rockfish, tree rings, and climate-driven linkages Rockfish, tree rings, and climate-driven linkages between marine and terrestrial ecosystemsbetween marine and terrestrial ecosystems

Temporal and spatial variability of growth
Tree rings most familiar example-effects of competition-effects of site factors, pollutants-effects of climate-reconstructions (thousands of yrs.!)
VERY VERSATILE
Importance of IncrementsImportance of Increments

Many organisms form annual increments-mollusks, corals, sponges, dinosaurs
Dendrochronology applied to other organismsDendrochronology applied to other organisms
and… FISH
In fish, growth increments formed in:-vertebrae, various bones-fin rays-scales-otoliths

Resolving otolith incrementsResolving otolith increments
cut here

Growth increment formation- opaque zone: fast growth, low protein- translucent zone: slow growth, high protein
OtolithsOtoliths
1939: year of1939: year ofbirthbirth
1989: year of1989: year ofcapturecapture
direction of growth
direction of growth

Candidate for dendrochronology techniques?-no resorption problems-some fish can get old!
ex. 100 yr old yelloweye rockfish-increments appear to be annual
Should be long enough time series if incrementsare clear
Dendrochronology applied to other organismsDendrochronology applied to other organisms

The physical environment affects otolith ring width-induces synchronous growth patterns-”bar codes” should match among otoliths-if not: error likely
Method of accurately dating each growth increment
Dendrochronology (tree-ring analysis): crossdating
Required: Synchronous GrowthRequired: Synchronous Growth

Matching growth “bar codes”
Required: Synchronous GrowthRequired: Synchronous Growth
Tree 1
Tree 2
Tree 3
Trees cored in year 2000Trees cored in year 20002000
2000
19951995
19901990
1985
1985
1980
1980
most recent increment(formed in 2000)
to tree center

Photo credit: H.D. Grissino-Mayer, The Ultimate Tree-Ring Web Pages
Crossdating in TreesCrossdating in Trees
18371837narrownarrowyearyear
1806 1806 narrownarrowyearyear
18161816widewideyearyear
18301830widewideyearyear
direction of growthdirection of growth
bark
bark

That works for trees, but will it apply to fish???
Crossdating in FishCrossdating in Fish
19831983

Sebastes diploproa, splitnose rockfish
Photo credit:Lifted from M. Love’s webpagePhoto credit:Lifted from M. Love’s webpage
Target Species: Splitnose RockfishTarget Species: Splitnose Rockfish
15 clear splitnose otolithscollected in 1989 NMFS surveyvariety of ages (31 to 64 yrs)thin sectioned

Axis of measurementAxis of measurement

Signature Year ExampleSignature Year Example
1983El Nino

19051905
1994199419941994
19301930

0
0.01
0.02
0.03
0.04
0.05
0.06
0.07
0.08
0.09
0.1
1920 1930 1940 1950 1960 1970 1980 1990
year
rin
g w
idth
(m
m)
Measurements of splitnose rockfish
Synchronous GrowthSynchronous Growth
19361936 19581958 19701970 19831983

Statistically, how do we prove it?-correlate all otoliths with one another-low correlation = potential errors
but we only want the climate signal
must remove effects of:-age, vigor, artifacts of preparation
isolate climate signal via DETRENDING
CrossdatingCrossdating

DetrendingDetrending
0
0.01
0.02
0.03
0.04
0.05
0.06
0.07
0.08
1930 1940 1950 1960 1970 1980 1990
year
rin
g w
idth
(m
m)

DetrendingDetrending
0
0.01
0.02
0.03
0.04
0.05
0.06
0.07
0.08
1930 1940 1950 1960 1970 1980 1990
year
rin
g w
idth
(m
m)ring width
measurements,splines
0.7
0.8
0.9
1
1.1
1.2
1.3
1930 1940 1950 1960 1970 1980 1990
year
rin
g w
idth
in
de
xdetrended,
mean = 1

all splitnose residual chronologiesN = 15
DetrendingDetrending
0.4
0.6
0.8
1
1.2
1.4
1.6
1920 1930 1940 1950 1960 1970 1980 1990
year
rin
g w
idth
in
de
x
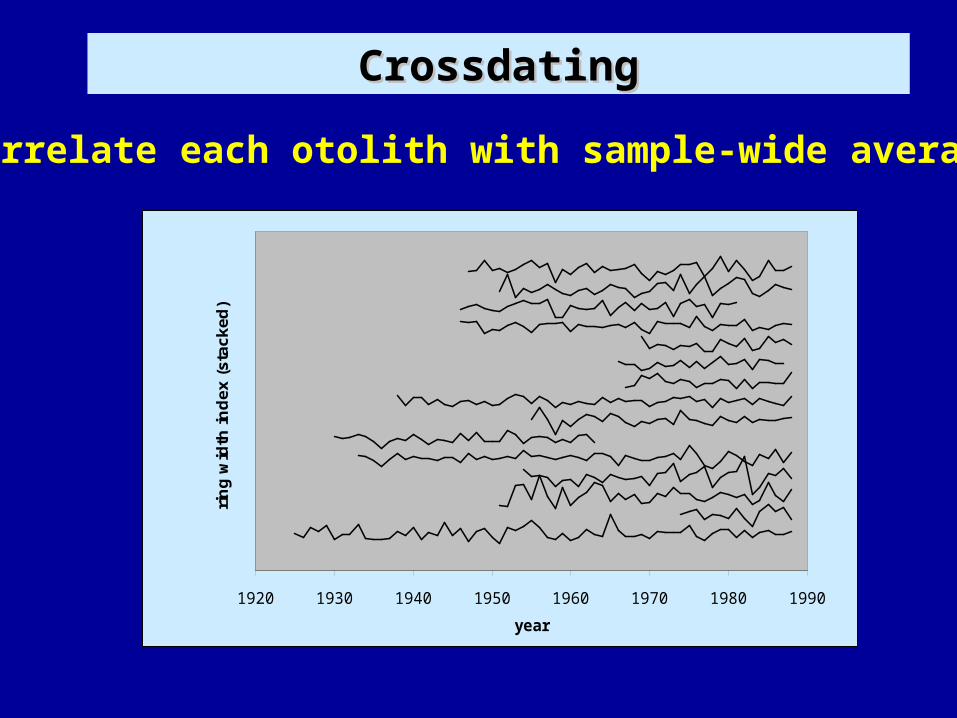
Correlate each otolith with sample-wide averages
CrossdatingCrossdating
1920 1930 1940 1950 1960 1970 1980 1990
year
rin
g w
idth
in
de
x (
sta
ck
ed
)

Step 1: select the first otolith time series
CrossdatingCrossdating
1920 1930 1940 1950 1960 1970 1980 1990
year
rin
g w
idth
in
de
x (
sta
ck
ed
)
selected seriesselected series

Step 2: average remaining (14) samples
CrossdatingCrossdating
1920 1930 1940 1950 1960 1970 1980 1990
year
rin
g w
idth
in
de
x (
sta
ck
ed
)
selected seriesselected series
rem
ain
ing
14 s
erie
sre
mai
nin
g 14
ser
ies
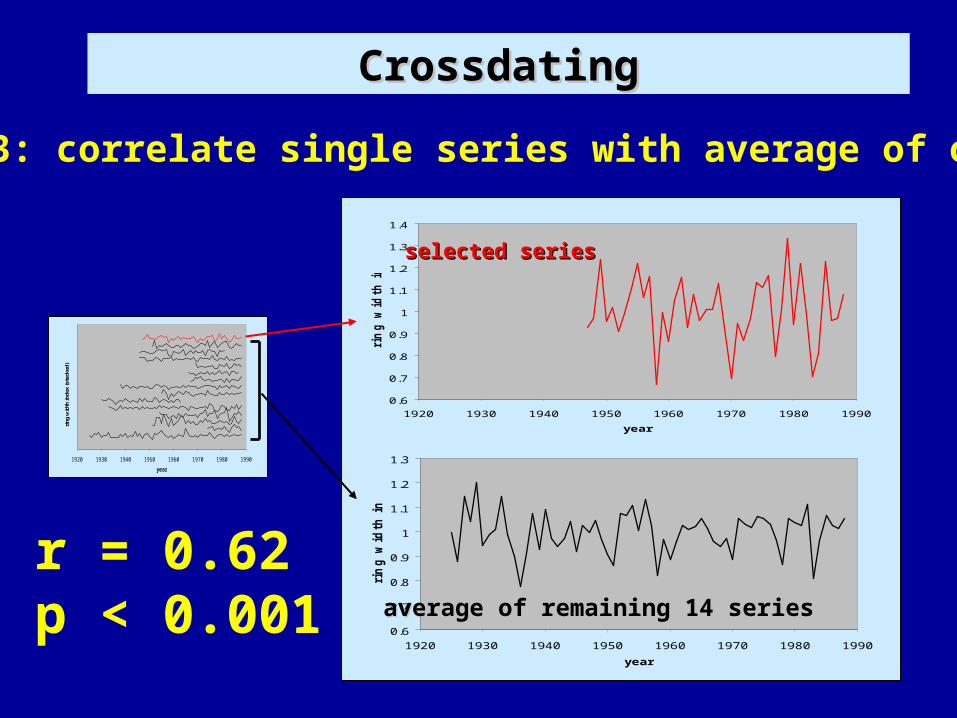
Step 3: correlate single series with average of others
CrossdatingCrossdating
1920 1930 1940 1950 1960 1970 1980 1990
year
ring
wid
th in
dex
(sta
cked
)
0.6
0.7
0.8
0.9
1
1.1
1.2
1.3
1920 1930 1940 1950 1960 1970 1980 1990
year
rin
g w
idth
in
de
x
0.6
0.7
0.8
0.9
1
1.1
1.2
1.3
1.4
1920 1930 1940 1950 1960 1970 1980 1990
year
rin
g w
idth
in
de
x
average of remaining 14 seriesaverage of remaining 14 series
r = 0.62p < 0.001
selected seriesselected series

If we overlooked 1983 (combined 1984 and 1983)
CrossdatingCrossdating
1920 1930 1940 1950 1960 1970 1980 1990
year
ring
wid
th in
dex
(sta
cked
)
0.6
0.7
0.8
0.9
1
1.1
1.2
1.3
1920 1930 1940 1950 1960 1970 1980 1990
year
rin
g w
idth
in
de
x
average of remaining 14 seriesaverage of remaining 14 series
r = -0.11
0.6
0.8
1
1.2
1.4
1.6
1.8
1920 1930 1940 1950 1960 1970 1980 1990
year
rin
g w
idth
in
de
x selected seriesselected serieswith errorwith error

Step 4: repeat for each of the series
CrossdatingCrossdating
1920 1930 1940 1950 1960 1970 1980 1990
year
rin
g w
idth
in
de
x (
sta
ck
ed
)
selected seriesselected seriesr = 0.58r = 0.58

Step 4: repeat for each of the series
CrossdatingCrossdating
1920 1930 1940 1950 1960 1970 1980 1990
year
rin
g w
idth
in
de
x (
sta
ck
ed
) selected seriesselected seriesr = 0.64r = 0.64

Step 4: repeat for each of the series
CrossdatingCrossdating
1920 1930 1940 1950 1960 1970 1980 1990
year
rin
g w
idth
in
de
x (
sta
ck
ed
)
selected seriesselected seriesr = 0.45r = 0.45

CrossdatingCrossdating
sample 1 r = 0.62r = 0.62
sample 2 r = 0.58r = 0.58
sample 3 r = 0.64r = 0.64
sample 4 r = 0.45r = 0.45
sample 5 r = 0.49r = 0.49
sample 6 r = 0.64r = 0.64
sample 7 r = 0.44r = 0.44
sample 8 r = 0.60r = 0.60
sample 9 r = 0.72r = 0.72
sample 10 r = 0.61r = 0.61
sample 11 r = 0.71r = 0.71
sample 12 r = 0.61r = 0.61
sample 13 r = 0.21r = 0.21
sample 14 r = 0.17r = 0.17
sample 15 r = 0.43r = 0.43
averageaverage r = 0.528r = 0.528

CrossdatingCrossdating
sample 1 r = 0.62r = 0.62
sample 2 r = 0.58r = 0.58
sample 3 r = 0.64r = 0.64
sample 4 r = 0.45r = 0.45
sample 5 r = 0.49r = 0.49
sample 6 r = 0.64r = 0.64
sample 7 r = 0.44r = 0.44
sample 8 r = 0.60r = 0.60
sample 9 r = 0.72r = 0.72
sample 10 r = 0.61r = 0.61
sample 11 r = 0.71r = 0.71
sample 12 r = 0.61r = 0.61
sample 13 r = 0.21 potential problemsr = 0.21 potential problems
sample 14 r = 0.17 potential problemsr = 0.17 potential problems
sample 15 r = 0.43r = 0.43
averageaverage r = 0.528r = 0.528

Step 5: check thenremeasure, drop, orkeep problematic series
context:eastern forestshemlock, maplespruce, beech: ISC = 0.5 – 0.6
CrossdatingCrossdating
sample 1 r = 0.62 r = 0.62 r = 0.69r = 0.69
sample 2 r = 0.58 r = 0.58 r = 0.59r = 0.59
sample 3 r = 0.64 r = 0.64 r = 0.66r = 0.66
sample 4 r = 0.45 r = 0.45 r = 0.45r = 0.45
sample 5 r = 0.49 r = 0.49 r = 0.50r = 0.50
sample 6 r = 0.64 r = 0.64 r = 0.62r = 0.62
sample 7 r = 0.44 r = 0.44 r = 0.45r = 0.45
sample 8 r = 0.60 r = 0.60 r = 0.54r = 0.54
sample 9 r = 0.72 r = 0.72 r = 0.72r = 0.72
sample 10 r = 0.61 r = 0.61 r = 0.63r = 0.63
sample 11 r = 0.71 r = 0.71 r = 0.70r = 0.70
sample 12 r = 0.61 r = 0.61 r = 0.61r = 0.61
sample 13 r = 0.21 r = 0.21 r = 0.42r = 0.42
sample 14 r = 0.17 r = 0.17 r = 0.36r = 0.36
sample 15 r = 0.43 r = 0.43 r = 0.43r = 0.43
averageaverage r = 0.528 r = 0.528 r = 0.545r = 0.545

Spatial considerationsSpatial considerations
Initial data set included fish from approx. 36-40 degrees latitude
I attempted to add more otoliths
Twelve out of 20 didn’t work!
Why?

Spatial considerationsSpatial considerations
-0.2
0
0.2
0.4
0.6
0.8
1
34 36 38 40 42 44 46 48 50
Latitude (degrees)
Inte
rse
rie
s c
orr
ela
tio
n
new otolithoriginal otolith

Splitnose chronology: 48 otolithsSplitnose chronology: 48 otoliths
0.7
0.8
0.9
1
1.1
1.2
1920 1930 1940 1950 1960 1970 1980 1990 2000
year
rin
g w
idth
in
dex
valid: 36 to 40 degrees latitudevalid: 36 to 40 degrees latitude

Age ValidationAge Validation
1989: year of1989: year ofcapturecapture
1939: year of1939: year ofbirthbirth
1983: El Nino1983: El Nino
1958: El Nino1958: El Nino
all growth increments correctly datedex. 51 year old fish

Splitnose chronology: 48 otolithsSplitnose chronology: 48 otoliths
0.7
0.8
0.9
1
1.1
1.2
1920 1930 1940 1950 1960 1970 1980 1990 2000
year
rin
g w
idth
in
dex
valid: 36 to 40 degrees latitudevalid: 36 to 40 degrees latitude

El NiEl Niñño / La Niñao / La Niña
Figure credit: NOAA Climate Prediction Center
Departures from normal….
El Niño La Niña

Pacific Decadal OscillationPacific Decadal Oscillation
Figure credit: Joint Institute for the Study of the Atmosphere and Ocean: U. Washington
warm phase cool phase

UpwellingUpwelling
Upwelling events: deep, cold, nutrient-rich watervery productive!
Figure credit: D. Reed and Pacific Marine Environmental Lab

Environmental indicesEnvironmental indices
High values = COOL watersUpwelling IndexNorthern Oscillation Index (El Niño)
High values = WARM watersSea Surface TemperaturesPacific Decadal Oscillation
USE MONTHLY AVERAGES

10
11
12
13
14
1940 1950 1960 1970 1980 1990 2000
year
tem
pe
ra
ture
( C
)
0.7
0.8
0.9
1
1.1
1.2
1.3
1940 1950 1960 1970 1980 1990 2000
year
rin
g w
idth
in
de
x
Effects of environmentEffects of environment
splitnose master chronologysplitnose master chronology
Feb average SSTFeb average SST
r = -0.60; p < 0.001r = -0.60; p < 0.001
ring
wid
th in
de
xte
mp
era
ture
( C
)
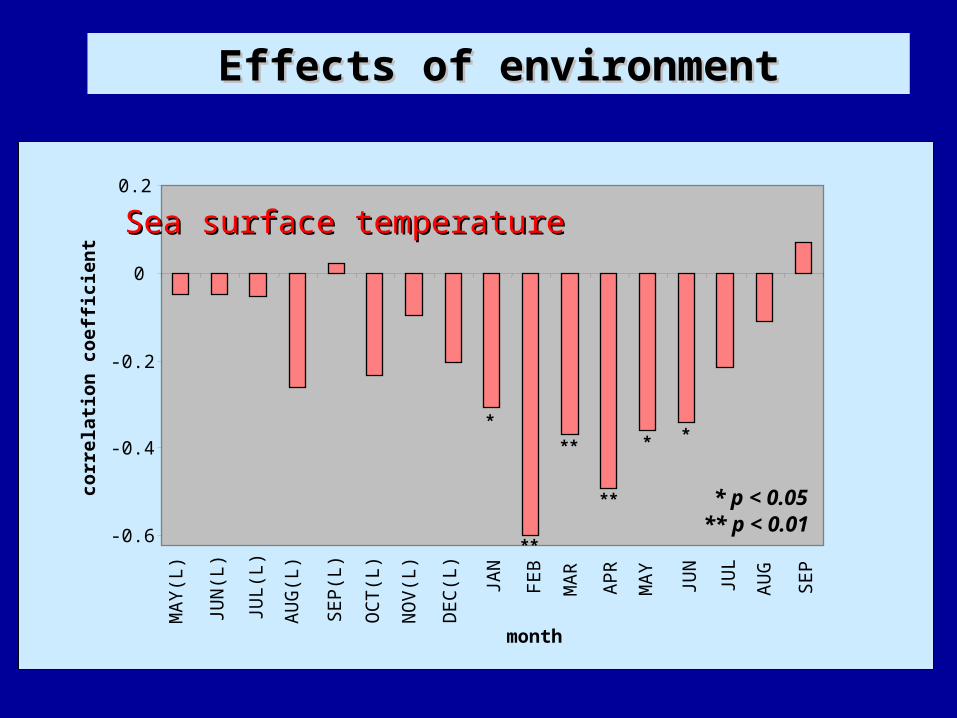
Effects of environmentEffects of environment
-0.6
-0.4
-0.2
0
0.2M
AY
(L)
JUN
(L)
JUL
(L)
AU
G(L
)
SE
P(L
)
OC
T(L
)
NO
V(L
)
DE
C(L
)
JAN
FE
B
MA
R
AP
R
MA
Y
JUN
JUL
AU
G
SE
P
month
corr
elat
ion
co
effi
cien
t
Sea surface temperatureSea surface temperature
**
**
**
** *
** p < 0.01* p < 0.05

Effects of environmentEffects of environment
-0.6
-0.4
-0.2
0
0.2
0.4
0.6
MA
Y(L
)
JUN
(L)
JUL(
L)
AU
G(L
)
SE
P(L
)
OC
T(L
)
NO
V(L
)
DE
C(L
)
JAN
FE
B
MA
R
AP
R
MA
Y
JUN
JUL
AU
G
SE
P
month
corr
elat
ion
co
effi
cien
t
upwelling index
Northern Oscillation Index
Pacific Decadal Oscillation
sea surface temperature
**
**
**
** *
*** *
***
** **
**
**
** * **
**
** p < 0.01* p < 0.05

Spatial components of growth–environment relationships?Spatial components of growth–environment relationships?
February sea surface temperatures 1950:1994
2 degree x 2 degree cells
correlate with splitnose chronology

Spatial components of growth–environment relationships?Spatial components of growth–environment relationships?

Otolith and tree ring chronologies comparable
Possible sites: tree line in Coast Mountains-strong maritime influence-harsh conditions
Noble fir on Marys Peak
Terrestrial vs. marine growth patternsTerrestrial vs. marine growth patterns

Noble fir measurementsNoble fir measurements
0
2
4
6
8
10
12
14
16
1820 1840 1860 1880 1900 1920 1940 1960 1980 2000 2020
year
rin
g w
idth
(m
m)
24 trees24 trees47 radii;47 radii;
crossdating check: ISC of 0.7; all trees significant

Noble fir chronologyNoble fir chronology
0.4
0.6
0.8
1
1.2
1.4
1.6
1.8
2
1800 1820 1840 1860 1880 1900 1920 1940 1960 1980 2000 2020
year
rin
g w
idth
in
de
x
noble fir master chronologynoble fir master chronology

Effects of environment: temperatureEffects of environment: temperature
-5
0
5
10
15
20
25
1880 1900 1920 1940 1960 1980 2000 2020year
de
gre
es
( C
)
JanT
FebT
MarT
AprT
MayT
JunT
JulT
AugT
SepT
OctT
NovT
DecT

Effects of environment: TERRESTRIALEffects of environment: TERRESTRIAL
-0.4
-0.3
-0.2
-0.1
0
0.1
0.2
0.3
0.4
0.5
JUL(
L)
AU
G(L
)
SE
P(L
)
OC
T(L
)
NO
V(L
)
DE
C(L
)
JAN
FE
B
MA
R
AP
R
MA
Y
JUN
JUL
AU
G
SE
P
OC
T
NO
V
DE
C
corr
elat
ion
co
effi
cien
t
temperaturetemperatureprecipitationprecipitation
**
**
**
* *
*
*
*
** p < 0.01* p < 0.05

Effects of environment: MARINEEffects of environment: MARINE
JUL(
L)
AU
G(L
)
SE
P(L
)
OC
T(L
)
NO
V(L
)
DE
C(L
)
JAN
FE
B
MA
R
AP
R
MA
Y
JUN
JUL
AU
G
SE
P
OC
T
NO
V
DE
C
corr
elat
ion
co
effi
cien
t
-0.4
-0.3
-0.2
-0.1
0
0.1
0.2
0.3
0.4Sea Surface TemperatureSea Surface TemperaturePacific Decadal OscillationPacific Decadal OscillationNorthern Oscillation IndexNorthern Oscillation Index
*
*
**
** p < 0.01* p < 0.05

Do rockfish and noble fir correlate?
The BIG questionThe BIG question
Not at all! Not at all! r = 0.05r = 0.05
NOAA ITRDB
tree chronologies throughout OR, WA, CA
correlations with rockfish chronology?
Other tree ring chronologiesOther tree ring chronologies

Rockfish and tree-ring correlationsRockfish and tree-ring correlations

Mountain hemlock vs. rockfishMountain hemlock vs. rockfish
-4
-3
-2
-1
0
1
2
3
4
1920 1930 1940 1950 1960 1970 1980 1990 2000
year
no
rmal
ized
rin
g w
idth
ind
ex
splitnose rockfish
mountain hemlcok(on Mt. Rainier)

Mountain hemlock: terrestrial corr.Mountain hemlock: terrestrial corr.
JUL(
L)
AU
G(L
)
SE
P(L
)
OC
T(L
)
NO
V(L
)
DE
C(L
)
JAN
FE
B
MA
R
AP
R
MA
Y
JUN
JUL
AU
G
SE
P
OC
T
NO
V
DE
C
-0.3
-0.2
-0.1
0
0.1
0.2
0.3
0.4
corr
elat
ion
co
effi
cien
t
temperaturetemperatureprecipitationprecipitation
** p < 0.01* p < 0.05
****
**
**
**

Mountain hemlock: marine corr.Mountain hemlock: marine corr.
JUL(
L)
AU
G(L
)
SE
P(L
)
OC
T(L
)
NO
V(L
)
DE
C(L
)
JAN
FE
B
MA
R
AP
R
MA
Y
JUN
JUL
AU
G
SE
P
OC
T
NO
V
DE
C
-0.4
-0.3
-0.2
-0.1
0
0.1
0.2
0.3
0.4
0.5
corr
elat
ion
co
effi
cien
t
Sea Surface TemperatureSea Surface TemperaturePacific Decadal OscillationPacific Decadal OscillationNorthern Oscillation IndexNorthern Oscillation Index
** p < 0.01* p < 0.05
** ****
**
** *** *
**
**
****
*
*
**
*
*
**

corr
elat
ion
co
effi
cien
t
-0.3-0.2-0.1
00.10.20.30.4
CascadesCascadeshemlockhemlock
JUL(
L)
AU
G(L
)
SE
P(L
)
OC
T(L
)
NO
V(L
)
DE
C(L
)
JAN
FE
B
MA
R
AP
R
MA
Y
JUN
JUL
AU
G
SE
P
OC
T
NO
V
DE
C
-0.4
-0.2
0
0.2
0.4 splitnose splitnose rockfishrockfish
Sea Surface TemperatureSea Surface TemperaturePacific Decadal OscillationPacific Decadal OscillationNorthern Oscillation IndexNorthern Oscillation Index
Correlations comparedCorrelations compared

corr
elat
ion
co
effi
cien
t
-0.3-0.2-0.1
00.10.20.30.4
CascadesCascades
JUL(
L)
AU
G(L
)
SE
P(L
)
OC
T(L
)
NO
V(L
)
DE
C(L
)
JAN
FE
B
MA
R
AP
R
MA
Y
JUN
JUL
AU
G
SE
P
OC
T
NO
V
DE
C
-0.3
-0.2
-0.1
0
0.1
0.2
Sea Surface TemperatureSea Surface TemperaturePacific Decadal OscillationPacific Decadal OscillationNorthern Oscillation IndexNorthern Oscillation Index
Marys Marys PeakPeak
-0.4
-0.2
0
0.2
0.4 splitnose splitnose rockfishrockfish

Rockfish growth reconstruction:Select tree crns. that
-significantly correlate w/ rockfish-extend to 1990-excellent quality throughout
Average tree ring crns together-back to 1880 (20 crns)
Simple linear regression
Trees as Proxy Data for RockfishTrees as Proxy Data for Rockfish

Reconstruction to 1880Reconstruction to 1880
RR22 = 0.44 = 0.44
0.6
0.8
1
1.2
1.4
1860 1880 1900 1920 1940 1960 1980 2000
year
rin
g w
idth
in
dex
rockfish chronologyreconstruction
y = -0.4217*tree_ring + 1.4155

Reconstruction to 1600Reconstruction to 1600
0.8
0.9
1
1.1
1.2
1600 1650 1700 1750 1800 1850 1900 1950 2000
year
ring
wid
th in
dex
y = -0.37*tree_ring + 1.3683
RR22 = 0.39 = 0.39

Growth increment data: Not limited to trees!
Uses:1) age validation2) effects of environment
Important for management and ecology!
ConclusionsConclusions

Future directions: geoduck clamsFuture directions: geoduck clams
150 yrs old!

strong synchronous growthmax. ages of 100 yrs.river chronometers
Future directions: freshwater musselsFuture directions: freshwater mussels
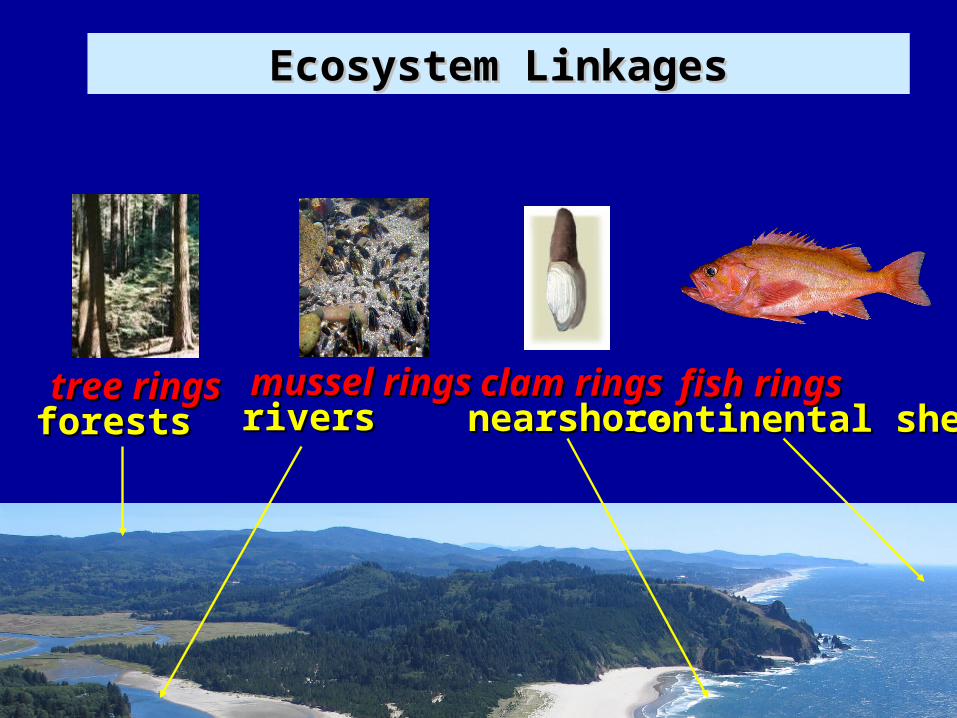
Ecosystem LinkagesEcosystem Linkages
forestsforeststree ringstree rings
riversriversmussel ringsmussel rings
nearshorenearshoreclam ringsclam rings
continental shelfcontinental shelffish ringsfish rings

Hatfield Marine Science CenterNewport, OR Tues. May 30 to Wed. June 7
Dendro Fieldweek 2006Dendro Fieldweek 2006