Embed Size (px)
Citation preview

BRUEGEL 10 YEAR ANNIVERSARY
EUROPE AND THE EMERGING
MARKETS
Rome, 5 May 2015
Christian Kastrop Director, Policy Studies Branch
Economics Department, OECD
Growth prospects have improved slightly compared to a few months ago
GDP growth1
Volume, per cent
1. Major economies representing over 70% of global GDP measured at 2013 PPP exchange rates .
2
0
1
2
3
4
5
0
1
2
3
4
5
November 2014 Outlook forecasts
March Interim Outlook forecasts

The oil price drop is positive for global growth
Brent crude price USD per barrel
3
Impact of fall in oil price between 2014 and 2015 on trade balance1
Billions of US dollars
1. Assumed average oil price (Brent) of $57 per barrel in 2015.
-600
-400
-200
0
200
400
600
-600
-400
-200
0
200
400
600
40
50
60
70
80
90
100
110
120
40
50
60
70
80
90
100
110
120
$85 per barrel = November 2014 Outlook assumption
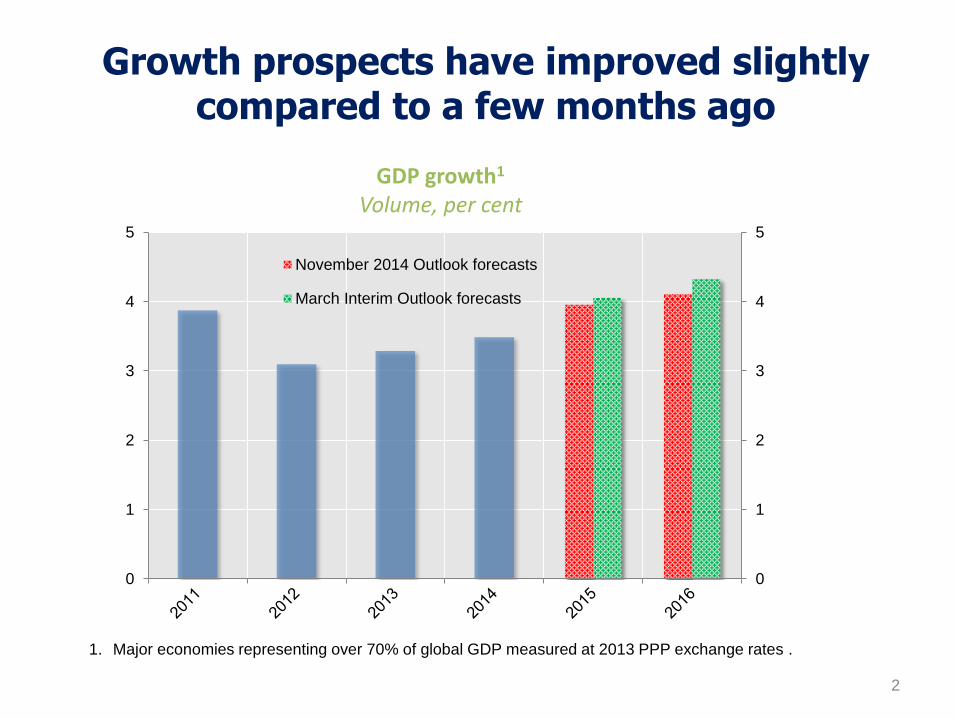
Many central banks have eased monetary policy
4
Note: size of bubbles indicates relative GDP (at PPP). Russia, which raised policy rates sharply in
December before cutting twice since, is not included as an easer over this period.
Timeline of easing decisions since December 2014
Central banks of countries
accounting for about 48%
of global GDP have eased
over the past 3 months
EgyptIndia
Switzerland
Peru Turkey Canada
Euro area
AustraliaIsrael
China
SerbiaKorea
Pakistan Singapore
RomaniaDenmarkSwedenIndonesia
January 2015 →
← February 2015
March 2015 →
India
NorwaySwitzerland
← December 2014
Iceland
Poland
DenmarkDenmark
Denmark
China
Thailand
Romania
Turkey
Morocco
Uzbekistan
Botswana

The ECB’s action is working through financial markets
Yield curves Instantaneous forward rates
Nominal effective exchange rate Index, Jan 2014 = 100
5
-0.5
0.0
0.5
1.0
1.5
2.0
2.5
3.0
3.5
4.0
-0.5
0.0
0.5
1.0
1.5
2.0
2.5
3.0
3.5
4.0
1 2 3 4 5 6 7 8 9 10Years
March 2014
November
2014
March 2015
84
86
88
90
92
94
96
98
100
102
84
86
88
90
92
94
96
98
100
102
Announcement of
expansion of the
asset purchase
De
pre
cia
tio
n

A welcome fall in unemployment, but low employment rates suggest that slack remains
Employment and unemployment rates G7 countries, per cent
6
55
56
57
58
59
60
4
5
6
7
8
9Unemployment rate (left scale)
Employment rate (right scale)
Real wage and labour productivity G7 countries, average growth rates, per cent
0.0
0.2
0.4
0.6
0.8
1.0
1.2
1.4
1.6
0.0
0.2
0.4
0.6
0.8
1.0
1.2
1.4
1.6
2000Q2-2009Q4 2010Q1-2014Q4
Real wage growth Labour productivity growth

United States – continued cyclical recovery, despite weather
7
Cyclical recovery continues, though one-offs (e.g. severe winter weather) may mask underlying strength
Absent brinksmanship, fiscal policy is expected to remain neutral
Federal Reserve likely to delay first interest rate increase due to low inflation and dollar appreciation
Domestic demand growing faster than output – the United States is adding to demand in the rest of the world
Estimated effect of lower energy prices on share of energy in household spending
Nominal effective exchange rate Trade weighted, broad currency index 2010 = 100
0
1
2
3
4
5
6
0
1
2
3
4
5
6
2014 2015
Households save approx.
$90/month on energy
90
95
100
105
110
115
90
95
100
105
110
115
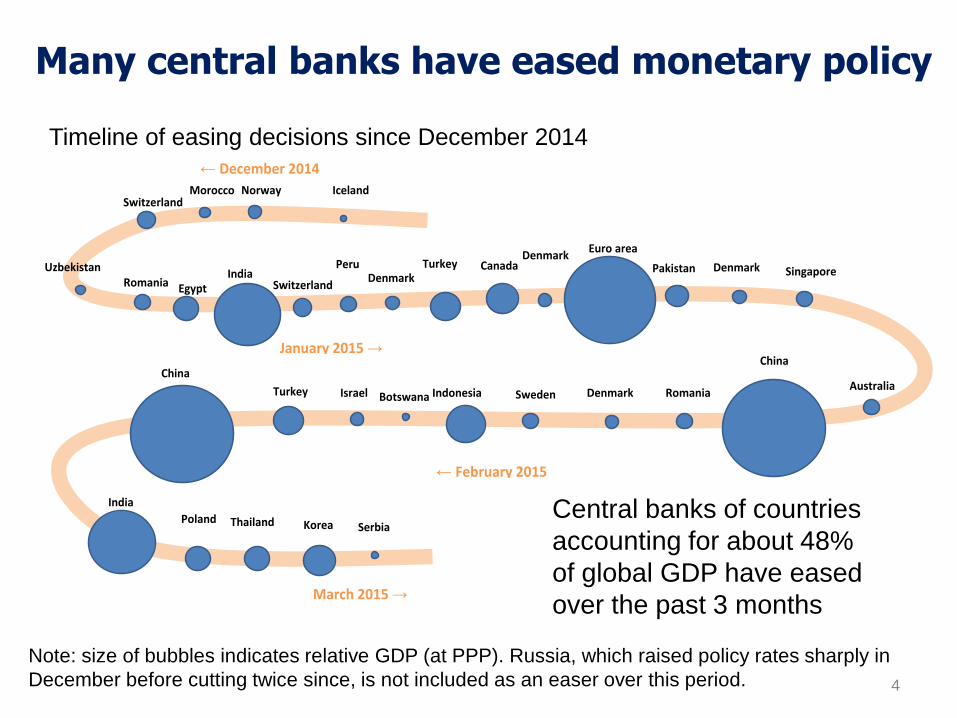
Retail trade 3-month moving average volume index, 2010=100
Euro area – tailwinds offer escape from stagnation
PMI New Orders/Incoming New Business
8
Mortgage rates Per cent
Share prices Euro Stoxx 50 index, Jan 2011=100
96
97
98
99
100
101
96
97
98
99
100
101
40
45
50
55
60
40
45
50
55
60
Values above 50
indicate expansion
2.0
2.5
3.0
3.5
4.0
4.5
5.0
2.0
2.5
3.0
3.5
4.0
4.5
5.0
Average Difference between max. and min.
60
70
80
90
100
110
120
130
140
60
70
80
90
100
110
120
130
140
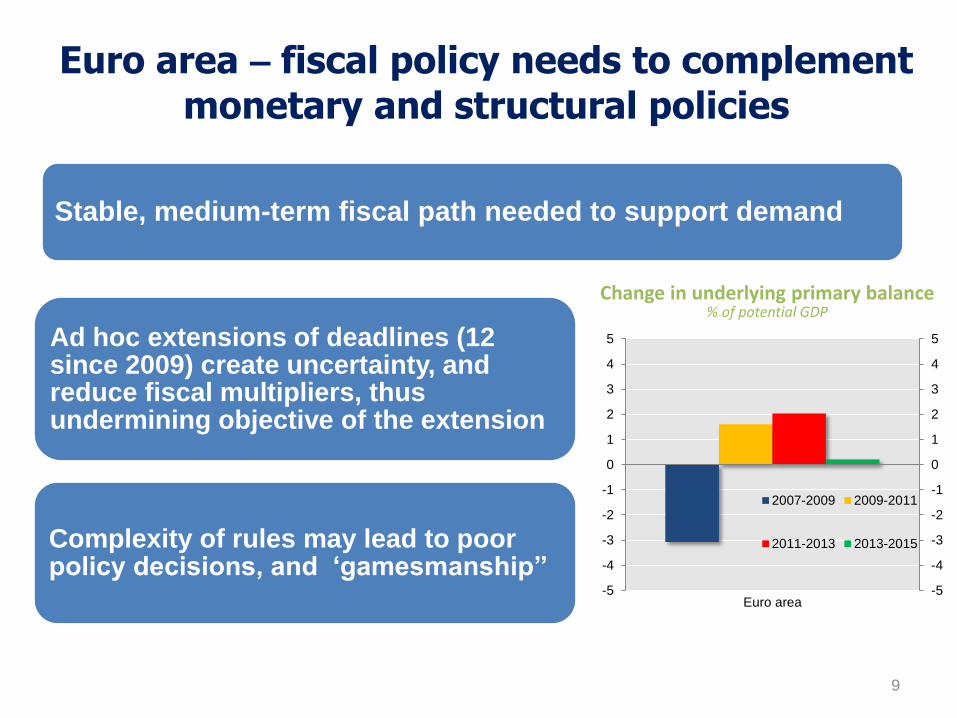
Euro area – fiscal policy needs to complement
monetary and structural policies
Stable, medium-term fiscal path needed to support demand
Ad hoc extensions of deadlines (12 since 2009) create uncertainty, and reduce fiscal multipliers, thus undermining objective of the extension
Complexity of rules may lead to poor policy decisions, and ‘gamesmanship’’
9
Change in underlying primary balance % of potential GDP
-5
-4
-3
-2
-1
0
1
2
3
4
5
-5
-4
-3
-2
-1
0
1
2
3
4
5
Euro area
2007-2009 2009-2011
2011-2013 2013-2015
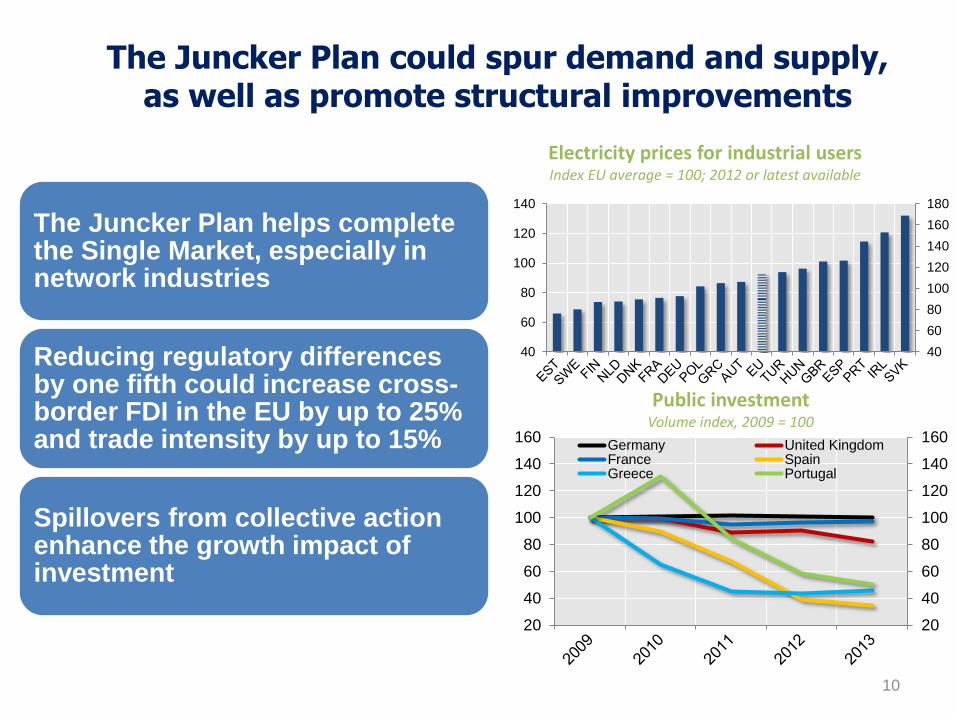
The Juncker Plan could spur demand and supply, as well as promote structural improvements
10
The Juncker Plan helps complete the Single Market, especially in network industries
Reducing regulatory differences by one fifth could increase cross-border FDI in the EU by up to 25% and trade intensity by up to 15%
Spillovers from collective action enhance the growth impact of investment
Electricity prices for industrial users Index EU average = 100; 2012 or latest available
20
40
60
80
100
120
140
160
20
40
60
80
100
120
140
160Germany United KingdomFrance SpainGreece Portugal
Public investment Volume index, 2009 = 100
40
60
80
100
120
140
160
180
40
60
80
100
120
140
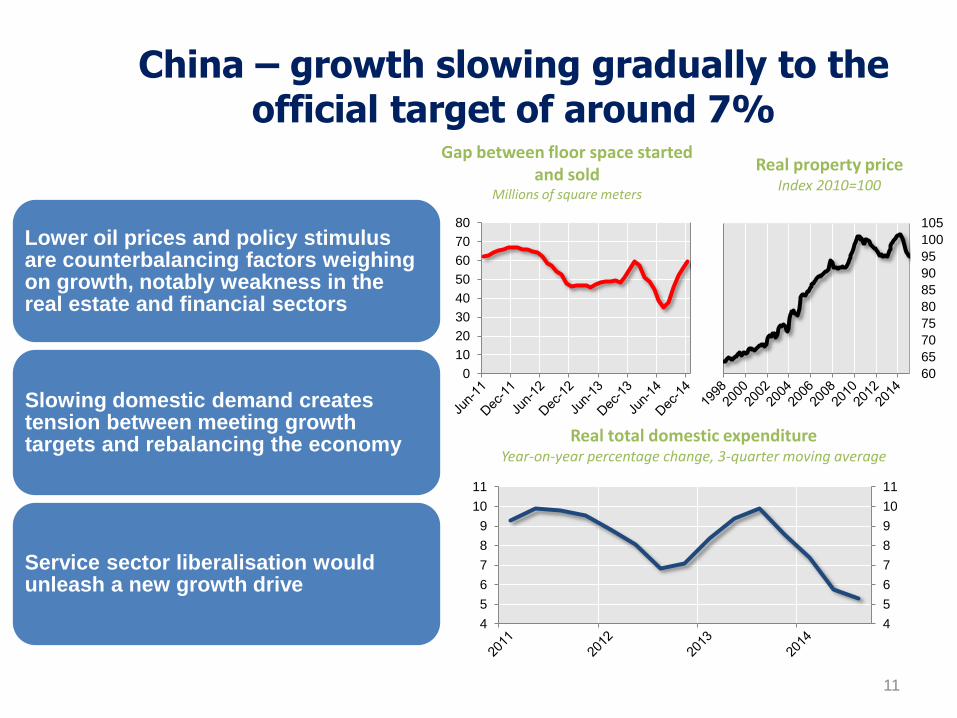
China – growth slowing gradually to the official target of around 7%
11
Lower oil prices and policy stimulus are counterbalancing factors weighing on growth, notably weakness in the real estate and financial sectors
Slowing domestic demand creates tension between meeting growth targets and rebalancing the economy
Service sector liberalisation would unleash a new growth drive
Gap between floor space started and sold
Millions of square meters
Real total domestic expenditure Year-on-year percentage change, 3-quarter moving average
60
65
70
75
80
85
90
95
100
105
Real property price Index 2010=100
0
10
20
30
40
50
60
70
80
4
5
6
7
8
9
10
11
4
5
6
7
8
9
10
11
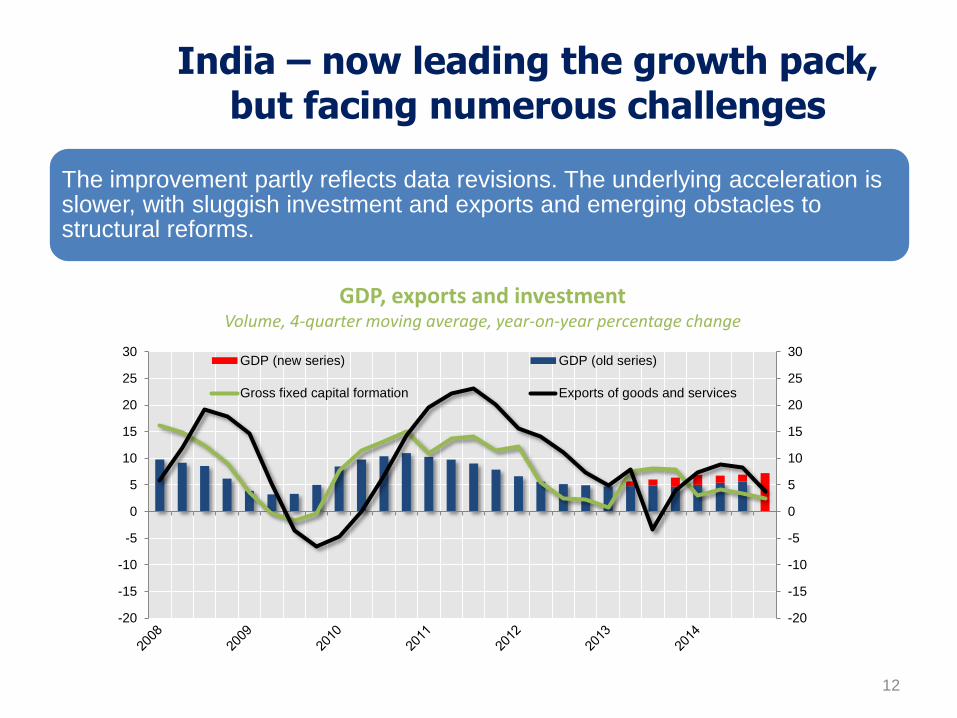
India – now leading the growth pack, but facing numerous challenges
The improvement partly reflects data revisions. The underlying acceleration is slower, with sluggish investment and exports and emerging obstacles to structural reforms.
12
-20
-15
-10
-5
0
5
10
15
20
25
30
-20
-15
-10
-5
0
5
10
15
20
25
30GDP (new series) GDP (old series)
Gross fixed capital formation Exports of goods and services
GDP, exports and investment Volume, 4-quarter moving average, year-on-year percentage change

Brazil: Offsetting the positive – commodity economies
The fall in commodity prices goes well beyond oil, and is hurting commodity-exporting economies like Brazil
13
Brazil: contribution to GDP Volume , year-on-year percentage change
60
70
80
90
100
110
120
60
70
80
90
100
110
120
Agricultural raw materials
Metals and Minerals
Food and Tropical Beverages
Non-oil commodity prices Index, 2011=100
-6
-4
-2
0
2
4
6
8
10
12
14
-6
-4
-2
0
2
4
6
8
10
12
14
Imports ExportsConsumption InvestmentGDP
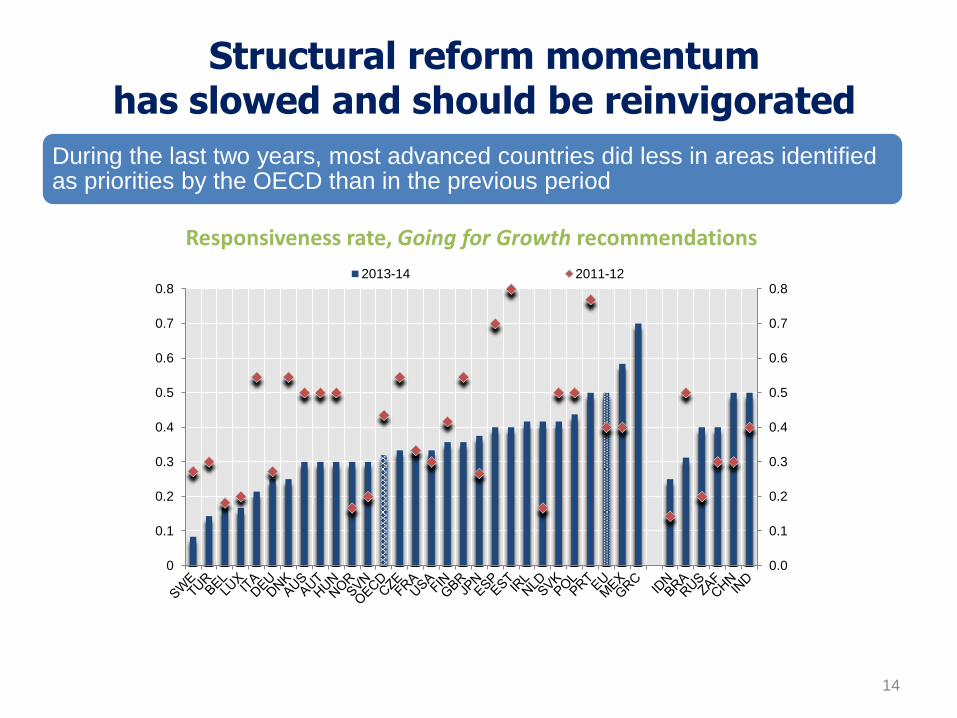
Structural reform momentum has slowed and should be reinvigorated
14
During the last two years, most advanced countries did less in areas identified as priorities by the OECD than in the previous period
Responsiveness rate, Going for Growth recommendations
0.0
0.1
0.2
0.3
0.4
0.5
0.6
0.7
0.8
0
0.1
0.2
0.3
0.4
0.5
0.6
0.7
0.82013-14 2011-12

ANNEX
15

Interim Outlook – small upward revisions,
still only moderate growth
1. GDP at market prices adjusted for working days.
2. Economies representing over 70% of global GDP measured at 2013 PPP exchange rates.
16
Real GDP1
Percentage change 2014
Column1 Column2
March 2015
Interim
Forecasts
difference from
November
Outlook
March 2015
Interim
Forecasts2
difference2from
November
Outlook
United States 2.4 3.1 0.0 3.0 0.0
Euro area 0.9 1.4 0.3 2.0 0.3
Japan 0.0 1.0 0.2 1.4 0.4
Germany 1.6 1.7 0.6 2.2 0.4
France 0.4 1.1 0.3 1.7 0.2
Italy -0.4 0.6 0.4 1.3 0.3
United Kingdom 2.6 2.6 -0.1 2.5 0.0
Canada 2.5 2.2 -0.4 2.1 -0.3
China 7.4 7.0 -0.1 6.9 0.0
India 7.3 7.7 1.3 8.0 1.4
Brazil 0.0 -0.5 -2.0 1.2 -0.8
Aggregate2
3.7 4.0 0.1 4.3 0.2
2015 2016

Deflation risks: The oil price fall added disinflationary impetus
when inflation was already low
17
Number of countries with negative 12-month headline inflation rate
Headline inflation in OECD countries Per cent
Where inflation was already too low, the challenge of getting back to target has increased
Deflation increases the vulnerability of indebted households, firms and governments and aggravates stagnation risks
-5
0
5
10
15
20
25
30
-5
0
5
10
15
20
25
30 25th percentile Median 75th percentile
0
5
10
15
20
25
0
5
10
15
20
25
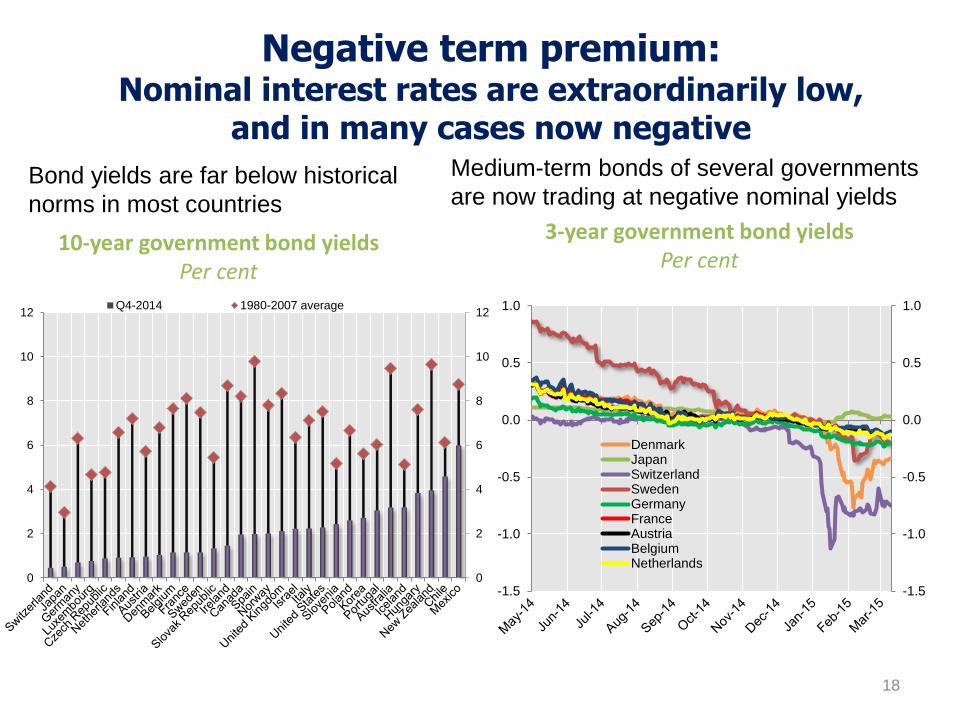
Negative term premium: Nominal interest rates are extraordinarily low,
and in many cases now negative
18
Medium-term bonds of several governments
are now trading at negative nominal yields Bond yields are far below historical
norms in most countries
10-year government bond yields Per cent
0
2
4
6
8
10
12
0
2
4
6
8
10
12Q4-2014 1980-2007 average
-1.5
-1.0
-0.5
0.0
0.5
1.0
-1.5
-1.0
-0.5
0.0
0.5
1.0
DenmarkJapanSwitzerlandSwedenGermanyFranceAustriaBelgiumNetherlands
3-year government bond yields Per cent
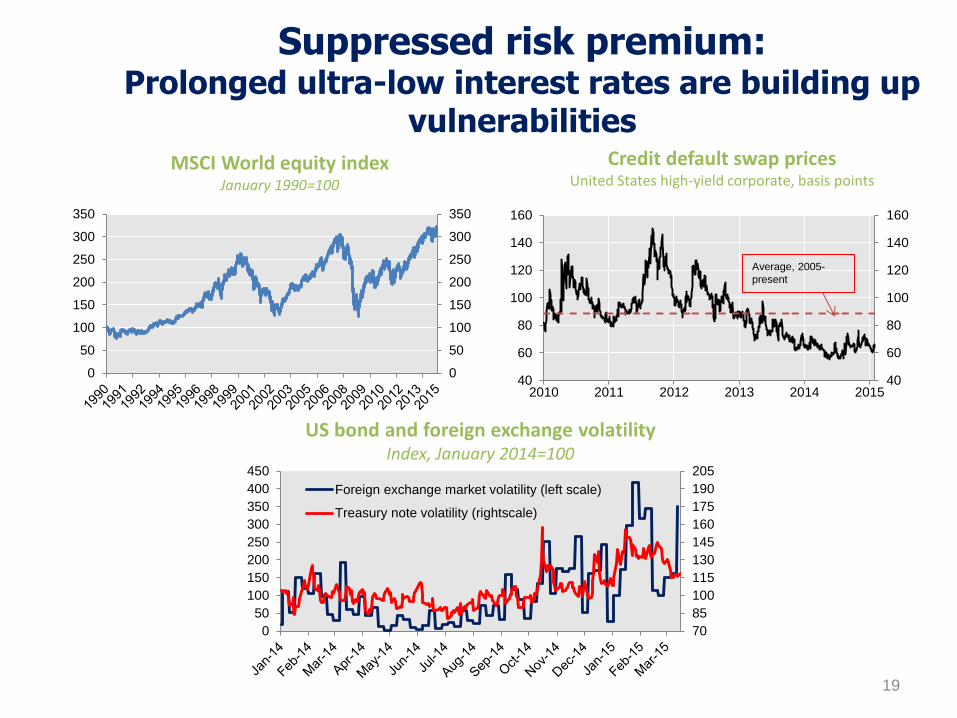
Suppressed risk premium: Prolonged ultra-low interest rates are building up
vulnerabilities
19
US bond and foreign exchange volatility Index, January 2014=100
Credit default swap prices United States high-yield corporate, basis points
40
60
80
100
120
140
160
40
60
80
100
120
140
160
2010 2011 2012 2013 2014 2015
Average, 2005-
present
MSCI World equity index January 1990=100
0
50
100
150
200
250
300
350
0
50
100
150
200
250
300
350
70
85
100
115
130
145
160
175
190
205
0
50
100
150
200
250
300
350
400
450
Foreign exchange market volatility (left scale)
Treasury note volatility (rightscale)