Embed Size (px)
Citation preview
THE GEMINI 11 UFO SIGHTING AND PHOTOGRAPHIC ANALYSIS
by
Bruce S. Maccabee c August, 2000 INTRODUCTION
This presentation is a combination of two papers with extensive documentation and analysis in the appendices.
The first paper ("On the Probable Misidentification of an Object Sighted by the Gemini 11 Astronauts") was written in 1975. It shows that images of the object that appears in the photographs taken September 13, 1966 from the Gemini 11 spacecraft and the verbal testimony of the astronauts are not consistent with the claim by NORAD that the object was the Russian Proton 3 satellite (and its booster rocket) at a distance of 450 km.
The first paper was presented at the May, 1975, meeting of the American Physical Society (the published abstract follows this introduction). (Historical note: this is the first of several UFO-related papers I have presented before that august body, the APS.) A shortened version was published by the National Investigations Committee on Unidentified Flying Objects (NICAP) in its magazine, THE UFO INVESTIGATOR during the summer of 1975.
Subsequent to the publication a controversy arose over the distance between the two satellites at the time of the photos. The estimate of 450 km was given by the North American Air Defense Command (NORAD) a day after the sighting. The controversy arose when it became apparent from photographic analysis that if the photos did show the Proton 3 and/or its booster, then it actually must have been within 2 km of the Gemini 11. The question arose, could NORAD have been that much in error?
The second paper, "An Update on the Gemini 11 Sighting of an Object from Orbit," was published, in shortened form, in the NICAP INVESTIGATOR in August, 1977. This paper presented the result of detailed orbital calculations, carried out independently by Brad Sparks and me, which showed that the Proton 3 was far behind the Gemini 11 spacecraft. The paper was supported by extensive calculations that have not published to date and are presented here in Appendix 1. The testimony of the astronauts is in Appendix 2.
The results of attempt to learn something about the orbit of the UFO, if it were an orbiting satellite (Unidentified Orbiting Object, a "UOO"), are presented for the first time Appendix 3. The original 1977 paper has been modified and improved for presentation here. The conclusion is that, if the UOO was a man-made satellite, it was quite close (less than 40 km away) when the Gemini passed over the USA about 20 minutes before the sighting. This raises the question, why didn't NORAD identify it?
On the other hand, if it UFO was not a UOO then it wasn't bound by the rules of orbital mechanics and it could have been near the Gemini craft at the time of the encounter and "anywhere" before and after.
[][][][][][][][][][][][][][][][][][][][][][][][][][][][][][][][][][][][][][] ____________________________________________________________________________
FIRST PAPER: ********************************************************************* ABSTRACT PUBLISHED IN THE BULLETIN OF THE AMERICAN PHYSICAL SOCIETY, VOLUME 20, PAGE 728 (1975)
On the Probable Misidentification of an Object Sighted by the Gemini 11 Astronauts
Bruce S. Maccabee
Naval Surface Weapons Center Silver Spring, Md. 20910
Franklin Roach (1) accepted the explanation offered by NORAD that Astronaut Pete Conrad had sighted and photographed the Proton 3 satellite plus "possibly its booster and several other components." The Proton 3 was tracked by NORAD as being roughly 450 km away from the Gemini capsule at the time of the sighting. From an analysis of the original photographs it was concluded that the image size on the film plane (about 0.5 mm in greatest extension) was much larger than the image expected of the Proton 3 (satellite: 3 m long by 4 m dia.; booster: 10 m long by 4 m dia.; expected largest image dimension using the Hasselblad camera with a 38 mm focal length: 0.001 mm). The images on the photographs are too detailed to be specular reflections from very distant objects.
(1)"The Scientific Study of Unidentified Flying Objects," AFOSR study, E. U. Condon, Director (Bantam Books, New York, 1969); page 198.
***************************************************************** *****************************************************************
COMPLETE TEXT AND ILLUSTRATIONS PRESENTED AT THE AMERICAN PHYSICAL SOCIETY MEETING :
On the Probable Misidentification of an Object Sighted by the Gemini 11 Astronauts
INTRODUCTION
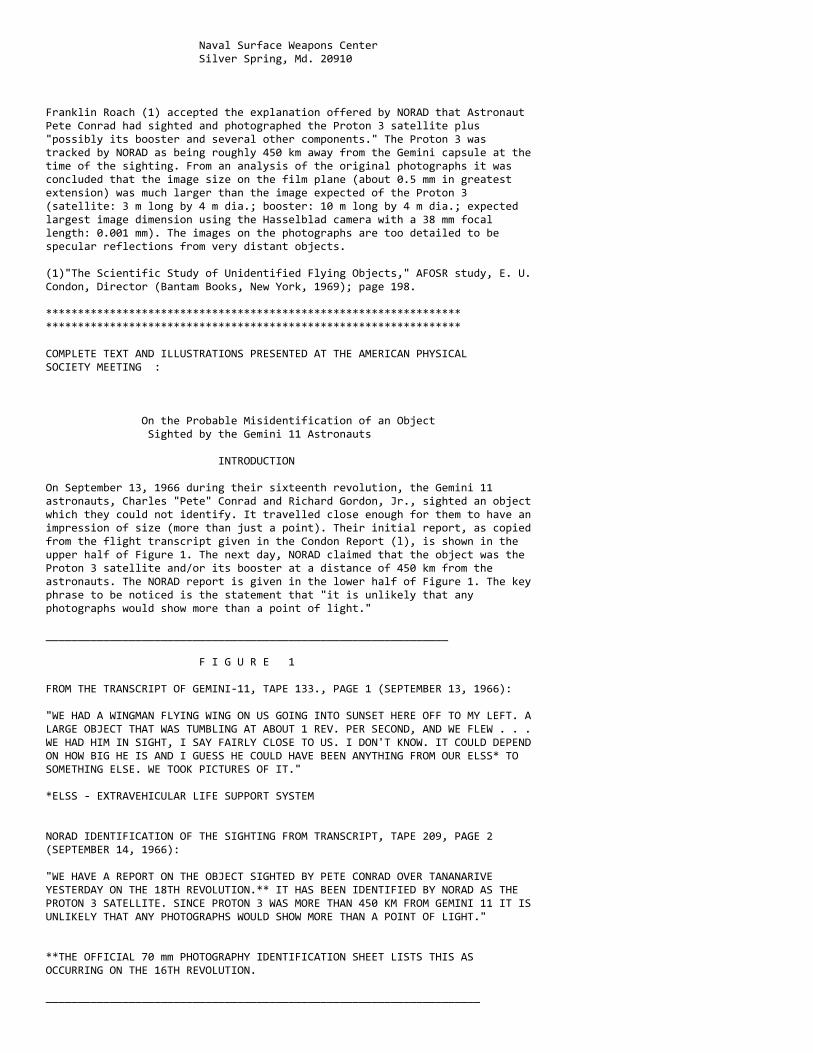
On September 13, 1966 during their sixteenth revolution, the Gemini 11 astronauts, Charles "Pete" Conrad and Richard Gordon, Jr., sighted an object which they could not identify. It travelled close enough for them to have an impression of size (more than just a point). Their initial report, as copied from the flight transcript given in the Condon Report (l), is shown in the upper half of Figure 1. The next day, NORAD claimed that the object was the Proton 3 satellite and/or its booster at a distance of 450 km from the astronauts. The NORAD report is given in the lower half of Figure 1. The key phrase to be noticed is the statement that "it is unlikely that any photographs would show more than a point of light."
_______________________________________________________________
F I G U R E 1
FROM THE TRANSCRIPT OF GEMINI-11, TAPE 133., PAGE 1 (SEPTEMBER 13, 1966):
"WE HAD A WINGMAN FLYING WING ON US GOING INTO SUNSET HERE OFF TO MY LEFT. A LARGE OBJECT THAT WAS TUMBLING AT ABOUT 1 REV. PER SECOND, AND WE FLEW . . . WE HAD HIM IN SIGHT, I SAY FAIRLY CLOSE TO US. I DON'T KNOW. IT COULD DEPEND ON HOW BIG HE IS AND I GUESS HE COULD HAVE BEEN ANYTHING FROM OUR ELSS* TO SOMETHING ELSE. WE TOOK PICTURES OF IT."
*ELSS - EXTRAVEHICULAR LIFE SUPPORT SYSTEM
NORAD IDENTIFICATION OF THE SIGHTING FROM TRANSCRIPT, TAPE 209, PAGE 2 (SEPTEMBER 14, 1966):
"WE HAVE A REPORT ON THE OBJECT SIGHTED BY PETE CONRAD OVER TANANARIVE YESTERDAY ON THE 18TH REVOLUTION.** IT HAS BEEN IDENTIFIED BY NORAD AS THE PROTON 3 SATELLITE. SINCE PROTON 3 WAS MORE THAN 450 KM FROM GEMINI 11 IT IS UNLIKELY THAT ANY PHOTOGRAPHS WOULD SHOW MORE THAN A POINT OF LIGHT."
**THE OFFICIAL 70 mm PHOTOGRAPHY IDENTIFICATION SHEET LISTS THIS AS OCCURRING ON THE 16TH REVOLUTION.
____________________________________________________________________
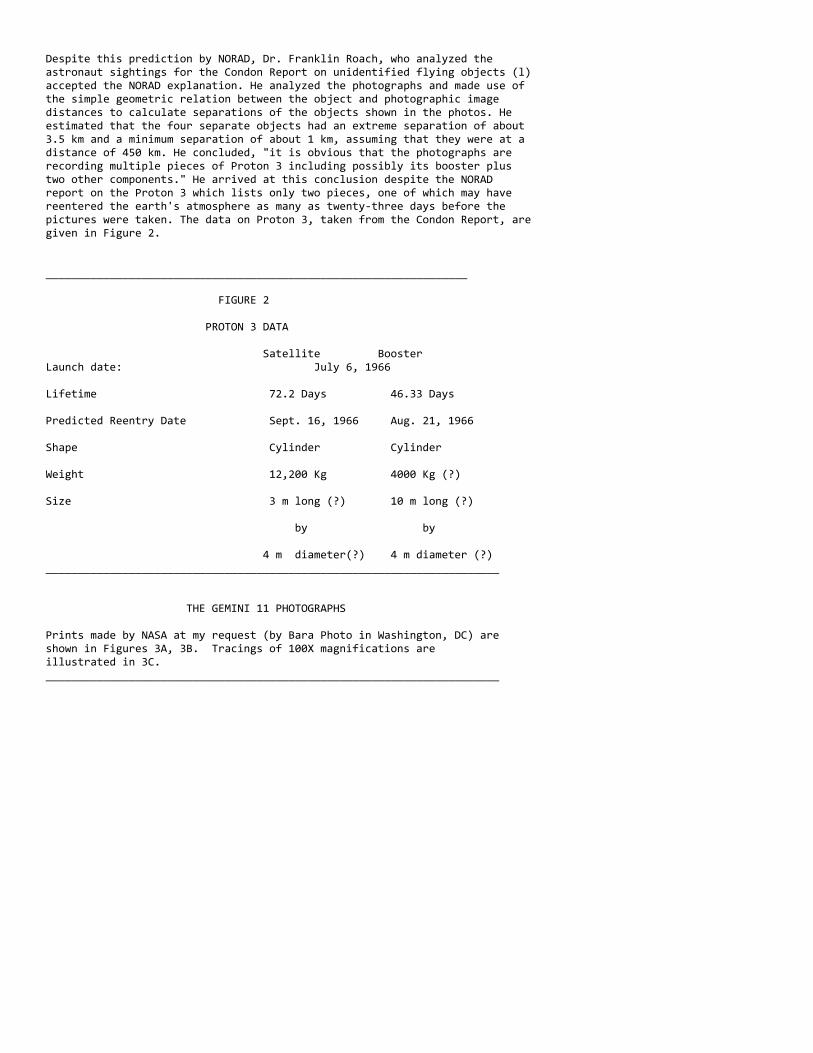
Despite this prediction by NORAD, Dr. Franklin Roach, who analyzed the astronaut sightings for the Condon Report on unidentified flying objects (l) accepted the NORAD explanation. He analyzed the photographs and made use of the simple geometric relation between the object and photographic image distances to calculate separations of the objects shown in the photos. He estimated that the four separate objects had an extreme separation of about 3.5 km and a minimum separation of about 1 km, assuming that they were at a distance of 450 km. He concluded, "it is obvious that the photographs are recording multiple pieces of Proton 3 including possibly its booster plus two other components." He arrived at this conclusion despite the NORAD report on the Proton 3 which lists only two pieces, one of which may have reentered the earth's atmosphere as many as twenty-three days before the pictures were taken. The data on Proton 3, taken from the Condon Report, are given in Figure 2.
__________________________________________________________________
FIGURE 2
PROTON 3 DATA
Satellite Booster Launch date: July 6, 1966
Lifetime 72.2 Days 46.33 Days
Predicted Reentry Date Sept. 16, 1966 Aug. 21, 1966
Shape Cylinder Cylinder
Weight 12,200 Kg 4000 Kg (?)
Size 3 m long (?) 10 m long (?)
by by
4 m diameter(?) 4 m diameter (?) _______________________________________________________________________
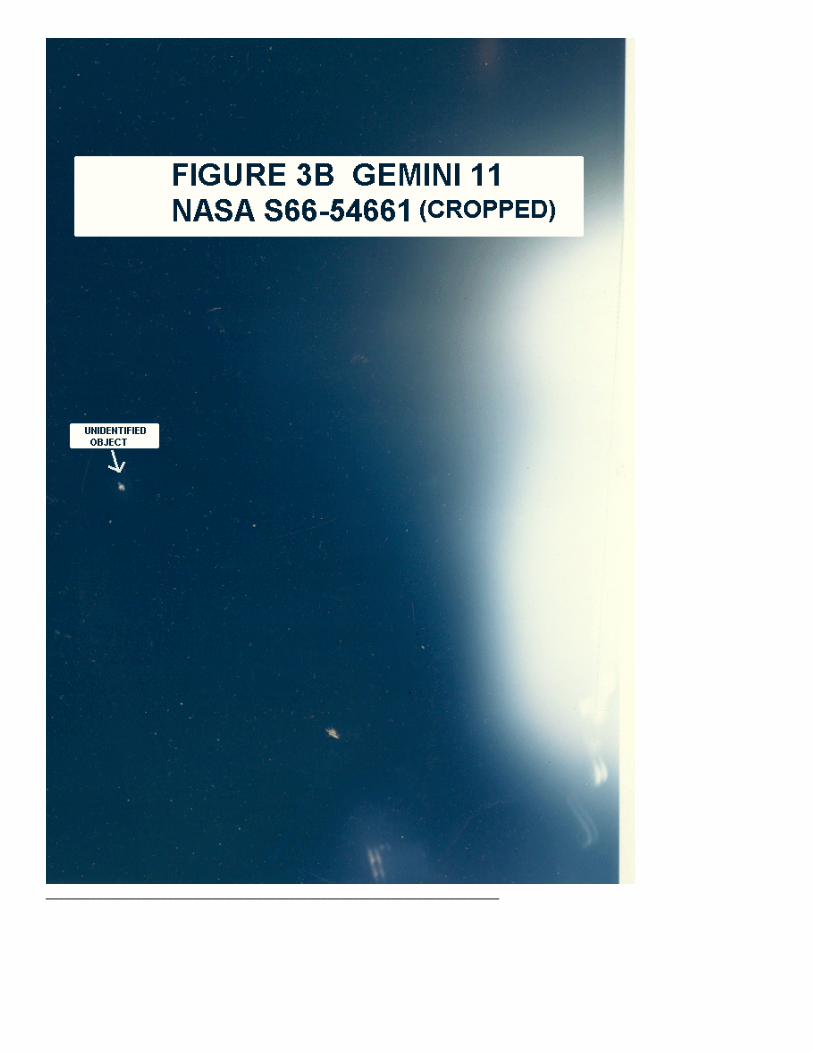
THE GEMINI 11 PHOTOGRAPHS
Prints made by NASA at my request (by Bara Photo in Washington, DC) are shown in Figures 3A, 3B. Tracings of 100X magnifications are illustrated in 3C. _______________________________________________________________________

_______________________________________________________________________
_______________________________________________________________________
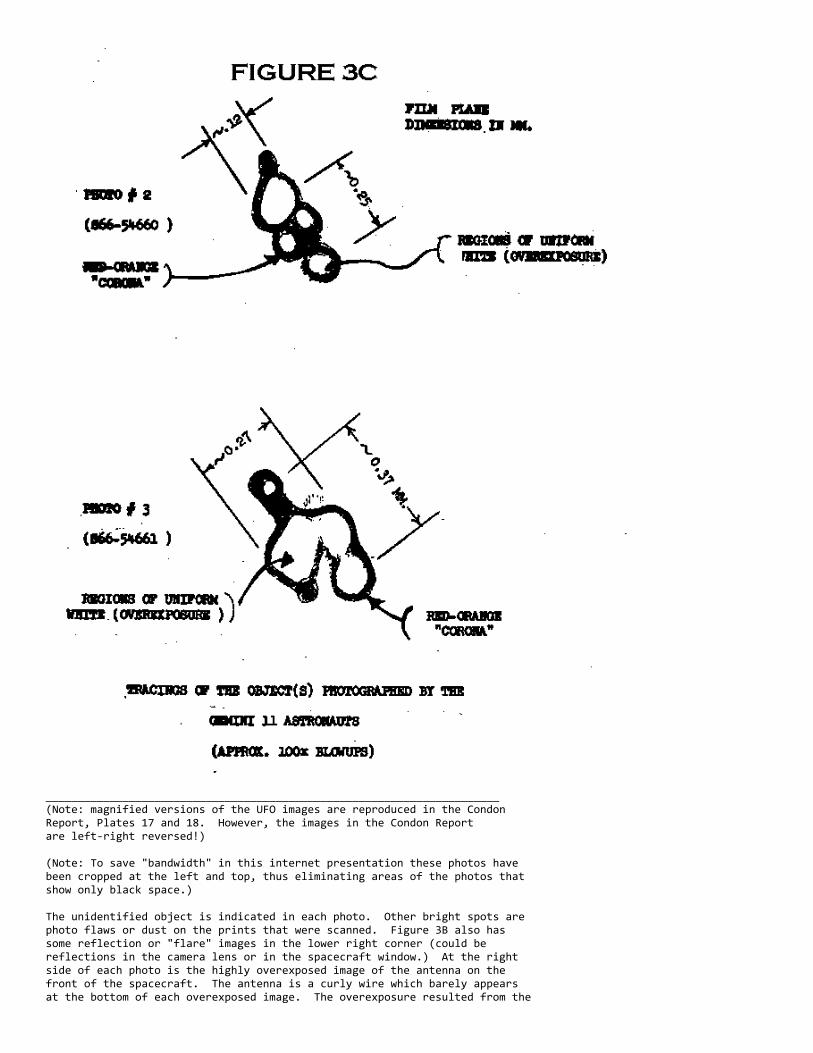
_______________________________________________________________________ (Note: magnified versions of the UFO images are reproduced in the Condon Report, Plates 17 and 18. However, the images in the Condon Report are left-right reversed!)
(Note: To save "bandwidth" in this internet presentation these photos have been cropped at the left and top, thus eliminating areas of the photos that show only black space.)
The unidentified object is indicated in each photo. Other bright spots are photo flaws or dust on the prints that were scanned. Figure 3B also has some reflection or "flare" images in the lower right corner (could be reflections in the camera lens or in the spacecraft window.) At the right side of each photo is the highly overexposed image of the antenna on the front of the spacecraft. The antenna is a curly wire which barely appears at the bottom of each overexposed image. The overexposure resulted from the

direct solar illumination of the antenna (sun behind the astronauts).
(Note: Brightness contours around the overexposed antenna image that are evident upon blowing up the images result from the digitization process necessary for this internet presentation. The overall color of the prints is a deep, dark bluish with the antenna overexposure area is white.)
The photos of the unidentified object(s) show considerably more detail than just points of light. The amount of overexposure in the uniform white regions is comparable with that made by reflective objects which are close to the camera and are fully illuminated by the sun.
The astronauts took three photos in the direction of the object(s). In the first photo, I was not able to locate an image comparable to the images in the second and third photos anywhere in the transparency. The second photo (Figure 3A) shows four distinct white overexposed regions, herein called "ORs", of various sizes with a red-orange "corona" surrounding them (due to "halation" which is light scattered sideways within the film). A similar corona also surrounds the completely overexposed white region around the L- Band antenna, which appears at the right hand edge of all three photos and was only several meters from the camera. Thus, the ORs resulted from extreme overexposure of the film and the corona around the ORs from slightly less exposure. However, the overexposure corona from objects follows the general shape of the overexposure region produced by the object, whereas the corona around the ORs in photos 2 and 3 (Figure 3C) does not always follow the shape of the ORs. In some places the corona seems to exist "on its own" (upward corona protrusion at top of the UFO image in Figure 3A; downward protrusion near bottom of the UFO image in Figure 3B). Thus, it seems that at least some of the corona shape must be attributed to the shape of the object(s) which made the image. The third photo shows three main ORs more or less joined together and a long upward protrusion which includes a slightly less exposed whitish central region. These ORs are in a different arrangement suggesting either relative motion of separate objects or some sort of rotation of a single large object during the time interval of a minute or less between the pictures.
EXPECTED VS. ACTUAL IMAGE SIZES
The images recorded in photos 2 and 3 can be compared with expected images of the known pieces of the Proton 3 by simple geometrical relationships knowing the focal length of the camera, the distance to the Proton 3, and the geometrical sizes of the known parts of the Proton 3. The pertinent camera data are given in Figure 4 along with other data.
___________________________________________________________________
FIGURE 4
PHOTOGRAPHY IDENTIFICATION AND CAMERA SPECIFICATIONS
Camera: Hasselblad, Super Wide Angle, 70 mm film LENS: Zeiss Biogon, 38 mm focal length; f/4.5 FILM: Kodak Ektachrome, MS (S. O. 368); 70 mm wide; 55 mm by 55 mm format SHUTTER SPEED: 1/250 sec
PHOTO # NASA/MSC REVOLUTION # G.E.T.* DATE INITIAL DESIGNATION TIME (MSC) IDENTIICATION**
1 S66-54659 16 27:47 9/13/66 L band antenna overexposed
2 S66-54660 " " " "
3 S66-54661 " " " "
* G.E.T. = Ground Elapsed Time in hours and minutes (27 h, 47 m)
** Initial identifications were made by Richard Underwood, NASA/MSC. The initial identification shown in the above table was made several

weeks before Mr. Underwood was told that astronaut Conrad was photographing another object moving with respect to the space capsule. The object is presently listed by NASA as unidentified.
__________________________________________________________________________
The focal length of the camera was 38 mm which corresponds to a film plane image size calibration of 1/38 rad/mm = 0.0263 rad/mm. The expected ANGULAR size of the Proton 3 booster if at 450 km is 10 m/450 km long by 4 m/450 km wide, or 2.22E-5 rad. x 8.9E-6 rad (see Figure 5; rad = radian, a measure of angle, 1 rad = 57.3 degrees; E means exponential notation, ten raised to a power, such that E0 = 1, E1 = 10, E2 = 10^2 = 100, E3 = 10^3 = 1000, E-1 = 1/10 = 0.1, E-2 = 1/100 = 0.01, E-3 = 0.001, for example). _________________________________________________________________________
_________________________________________________________________________ Thus, the expected image size of the largest piece of the Proton 3 booster, based on the simple geometric imaging of the camera, [(image size/focal length) = (object size/distance)] is 8E-4 mm x 3E-4 mm. These dimensions are considerably smaller than those of the smallest overexposed OR (photo 2; Figure 3a) which is roughly 4E-2 mm in diameter.
Clearly if the sizes of the ORs on the film plane are in the expected geometric proportions to the size(s) of the object(s) which caused the ORs, the object(s) were not associated with the Proton 3. Diffraction and, in particular, extreme brightness can make the area covered by image exposure larger than the expected geometrical image size. With the f# of the camera (Hasselblad) given as 4.5 (minimum), the diffraction disk of a
point source is expected to be on the order of 5.5E-3 mm in diameter (see Figure 5) which is about one seventh of the size of the smallest OR in photo 2. Unfortunately, the exact f# is not known for certain since the astronauts operated with a fixed shutter speed (1/250 sec.) (ref. 2) and varied the film exposures by changing the camera aperture opening (the f#). However, they probably had the camera "wide open" or nearly wide open because the nearby L-Band antenna was greatly overexposed, and even the ORs in the object(s) were overexposed.
The expected brightness of the largest part of the Proton booster can be estimated using a formula given by Roach in the Condon Report: m = apparent magnitude = -7.16 - 5.0 log (d) + 5.0 log (r), where logs are to base 10, d is the diameter in meters and r is the range or distance in km. As an object, illuminated by the sun, moves away its brightness decreases but its apparent magnitude increases. The maximum possible broadside area of the Proton booster is comparable to that of a 7 m diameter circle. The magnitude equation then yields m as about 1.9. This magnitude is considerably greater than the value 0.3 which was estimated to be the largest magnitude for which the Agena vehicle (at a distance of 122 km) was visible to the astronauts iduring the Gemini 11 flight. Thus, this brightness calculation suggests that the Proton would be just at the limit of visibility, if at all visible, to the astronauts. Such a large magnitude (i.e., such a low intensity) would not overexpose the film in the camera, even with the lens "wide open" (smallest f#).
DYNAMICS OF THE IMAGE SYSTEM
The white ORs changed their relative positions between photos. If the ORs were caused by pieces of the Proton satellite and booster at the distance of 450 km, then the relative positions changed by distances of the order of hundreds of meters. For example, the approximate centers of the large upper OR and medium sized lower OR of photo 2 may have (if the same OR are correctly identified) moved 0.05 mm closer to one another on the film plane, corresponding to a distance of about 600 meters at the 450 km distance. If such a motion is attributed to rotation of one massive body about another, or specifically, of the Proton satellite about its booster, it would correspond to a considerable angular momentum and a considerable centrifugal force. The centrifugal force would exceed by many orders of magnitude any gravitational attraction over the hundreds of meters of separation between the two objects. Thus, even if the satellite and its booster were momentarily rotating about one another immediately after separation (after the launch into orbit), two months before the sighting, they would have ceased to do so by the time the Gemini 11 astronauts were in orbit. There seems to be no relative motion between the Proton satellite and its booster that would be consistent both with the usual dynamics of objects in the same or nearly the same orbit (slow relative motion with one object slowly lagging behind the other) and the apparently rather high relative velocity necessary for objects 450 km away to change their relative positions in the manner recorded on the photos in a time of less than a minute.
DISCUSSION
I have shown that the photographs taken by the astronauts are not consistent with what would be expected of photographs of the Proton booster and satellite at the distance given by NORAD. The inconsistencies are: (a) the image sizes and spacings are much bigger than expected; (b) the image brightnesses are much greater than expected; and (c) the relative motions are much greater than would be expected for relative motions between the satellite and its booster during the minute or less between pictures. There is yet another probable, though not definite, inconsistency in the number of objects photographed: (d) four objects (or four bright areas of a single object, etc.) are shown, whereas only two objects were known to be associated with the Proton 3, and one of them had probably fallen back to earth by the time of the sighting.
Another inconsistency was reported by Lloyd Mallan (3) who published a story about the Gemini 11 sighting in Science and Mechanics Magazine, June 1969. Mallan reported that the astronauts were facing (southeast forward going into sunset) away from the direction of the Proton 3, which was about 400 km behind them. This is illustrated in Figure 6. ___________________________________________________________________________

___________________________________________________________________________ (There is a 50 km discrepancy between the distance listed by Mallan and the distance in the Condon Report.) Since the spacecraft windows only allowed a narrow forward view (they can only see about 1200 square degrees or 6 per cent of the forward hemisphere) it would have been "impossible" for them to have seen the Proton 3. Moreover, according to Mallan, Astronaut Gordon stated that the object was first seen out their left window, it "flew out in front of us and then we lost it when it sort of dropped down in front of us." This direction of motion is roughly opposite to that of the Proton 3 according to the NORAD report quoted in Mallan's article (see Figure 6).
Thus we have inconsistency (e), the Proton was behind the Gemini spacecraft and (f), the object(s) were not even travelling in the direction of the Proton satellite and booster.
According to Mallan, NORAD claimed that they were not tracking anything in front of the space capsule. Thus, for all of these reasons the object(s) could not have been the Proton. A more reasonable identification would be that it was some nearby trash. However, it could not have been trash from the Gemini 11 since it was apparently in a different orbital plane (assuming it was in orbit). The likelihood of a close encounter with trash in another orbit is statistically miniscule, but, of course, it is not impossible.
According to Mallan, Astronaut Gordon had the impression that the object was metallic (reflected light the way-most metals in orbit do) and was about 50 miles away. Of course, without knowing the size of the object(s), the distance is only a guess. At 50 miles (80 km.) the separation between the two most distant ORs in photo 2 would have been about 500 meters and the largest sized OR would correspond to a diameter of about 200 meters. Objects of such size would clearly not be earth-launched satellites. Of course, if the distance had been actually much smaller, the object(s) could become commensurate with earth-launched satellites. For example, a distance of five miles would correspond to object sizes on the order of tens of meters.
If it were possible to accurately determine the duration of the sighting, the angle of view corresponding to that duration, and the distance moved by the Gemini 11 spacecraft during the sighting it might be possible to determine whether or not the motion of the object(s) was consistent with the expected motion of a satellite in orbit around the earth. Unfortunately, such information is probably not available.
CONCLUSION
The photographic evidence presented in this paper appear to be totally inconsistent with the hypothesis that the Gemini 11 astronauts photographed the Proton 3 and/or its booster rocket. Verbal evidence presented by Mallan supports this conclusion. This writer has found no evidence to support the conclusion stated by Roach in the Condon Report. Note: This sighting is carried as "unidentified" by NASA.
BIBLIOGRAPHY
1. _The Scientific Study of Unidentified Flying Objects_, AFOSR #F44620-67- C-0035, E. U. Condon, Director (Bantam Books, New York, 1969); Pg. 198.
2. Richard Underwood, private communication.
3. Lloyd Mallan, Science and Mechanics, June 1969.
******************************************************************* *******************************************************************
SECOND PAPER A shortened version was published in the NICAP INVESTIGATOR in August 1977
An Update on the Gemini 11 Sighting of an Object from Orbit
by Dr. Bruce Maccabee, NICAP Consultant, July 1977
In the August 1975 issue of the investigator I published a paper in which I argued that the photographs taken by astronauts Gordon and Conrad on Sept. 13, 1966 during their eighteenth revolution (this was incorrectly called the sixteenth in the 1975 article) could not have been photographs of a Russian satellite called Proton 3. The reasons given were a) the two satellites were too far apart, b) the astronauts were facing away from the direction to the P-3, and c) the astronauts reported that what they saw would have been traveling in a roughly northwest to southeast direction (nearly parallel to their own orbit), whereas the P-3 was traveling,in a roughly southwest toward northeast direction.
Reason (a) was based on the claim by NORAD, which was later reiterated by Dr. Roach in the Condon Report (1), that the P-3 and GT-11 (abbreviation for Gemini 11) satellites were about 450 km or 280 miles apart when the photos were taken. At such a great distance, the various parts of the P-3 and its booster could not have produced the spacings of the overexposed regions in the photos (see, for example, the Condon Report or the August 1975 investigator). Reasons (b) and (c) came from an article by Lloyd Mallan in Science and Mechanics (2). However, if the distance estimate was incorrect and the P-3 was a lot closer, then one probably could not reject the Proton satellite as a possible explanation.
Since the publication of my paper a controversy has arisen over the separation of the two satellites. Jim Oberg published several articles in different UFO and space-related magazines (OFFICIAL UFO Magazine, Oct. 1976 issue but published in August, "Astronauts and UFOs, The Whole Story", GT-11 discussed on pg 41; ANALOG Science Fiction/Science Fact, November, 1976, "Unidentified Fraudulent Objects," GT-11 discussed on page 106; SPACE WORLD, February, 1977, "Astronauts and UFOs, the Whole Story," GT-11 discussed on page 13). In these articles he claimed that even a cursory analysis of the orbital data of the P-3 is sufficient to show that it was running ahead of schedule and thus might have passed in front of instead of behind , the GT- 11. In ANALOG, Oberg wrote:
"NORAD predictions ...put the Soviet satellite a few hundred miles behind the Gemini over the Indian Ocean on September 12, 1966. The crew, however, reported an object quite close in. Their photographs

show resolvable detail and a large angular size. Therefore, say UFO investigators, the object was 'too big to have been at the range of Proton-3, or much closer than Proton-3.'
The whole line of reasoning collapses when the actual range is computed. Since the Proton was in the final stages of orbital decay (it burned up 36 hours later), it was running far ahead of its predicted schedule. Once I had obtained several consecutive orbital predictions over the final few days, I was able to determine just how far off the initial NORAD estimates had been, several hundred miles per day. The contradiction between range and size vanished."
(Note: the basic idea of Oberg's analysis is that as a satellite loses energy because of air friction it decreases in altitude and actually increases in orbital speed. Hence he argued that the P-3 was traveling FASTER than the NORAD computer predictions indicated and that therefore it could have "caught up with the GT-11.)
My own analysis of data which has recently (1976) become available, thanks to the efforts of Jim Oberg, Brad Sparks, and myself, shows that rather than traveling ahead of schedule, at the time of the photos the P-3 was actually behind schedule. (From studying orbital data which Jim sent me I discovered that he had made a simple math error, a minus sign instead of a plus sign (!), which led him to the conclusion that the Proton was traveling "ahead of schedule"; I informed him of this error in June, 1976 and he acknowledged it in August.) Subsequent analysis showed that the two spacecraft were not separated by 450 km, but rather by more than ten times that distance and that the orientation of the spacecraft was as remembered by the astronauts: facing forward (southeastward) in orbit, heads up. This latter information was taken directly from a NASA tracking record (computer printout). The information related to the spacing was obtained from analysis of several NORAD bulletins which list orbital elements and predicted positions of the P-3.
The information related to the distance was obtained from the NORAD bulletins, from the NASA printout, from a TRW reconstruction of the GT-11 trajectory, and from a photo analysis paper by Richard Underwood who gave the time of the photos (27 hours, 43 minutes Ground Elapsed Time, which corresponded to 18 hours, 25 minutes Greenwich Mean Time). All of the available information was used in a set of calculations to determine the 'exact' locations of the two satellites (see FIGURE 7).
________________________________________________________________________

_________________________________________________________________________
Since the photo time may be off by several minutes the positions of the satellites at the time of the photos may be off by several minutes times their orbital velocities (about 290 miles/minute). However, since the GT-11 was moving away from the orbit of the P-3 (see FIGURE 7), the satellites were never closer than a thousand miles during the time frame allowed for the pictures (roughly 18:25 GMT to 18:30 GMT). For those who wish to locate the exact (to within one or two degrees) positions an a globe or a flat map (be careful of flat maps - they lie (!) - because the distance scale changes with position on the map), the calculated coordinates are (at 18:25 GMT on Sept. 13, 1966): Proton 3 - 52 degrees south latitude by 59 degrees west longitude; Gemini 11 - 25 degrees south latitude by 8 degrees west longitude (south latitude measured south of the equator; west longitude measured west of the Greenwich meridian). Thus it appears that the Gemini 11 astronauts either saw a satellite so secret that NORAD didn't know about it or didn't want anyone else to know about it, or else they saw a ..... (something else!).
*************************************************************************** [][][][][][][][][][][][][][][][][][][][][][][][][][][][][][][][][][][][][] The following material is published here for the first time with some modifications for clarity of presentation (August, 2000)
APPENDIX 1
DETERMINATION OF THE POSITIONS OF GEMINI 11 AND OF PROTON 3 AT THE TIME OF THE PHOTOS
B.S. Maccabee;June, 1977
The analysis proceeds as follows: A) From GT-11 data determine the estimated time of the sighting B) From orbital data determine the location of the P-3 C) From orbital data determine the location of the GT-11 D) Determine the distance and sighting direction between them E) Conclusion
A) TIME OF THE SIGHTING
NASA DATA FOR GEMINI 11
LAUNCH: Sept.12/14:42:26.5Z (date/hours:minutes:sec in "zulu" or "universal" time or Greenwich Mean Time - GMT)
PHOTO TIME:- Definitely between loss of signal at Ascension Island (27:41:24 Ground Elapsed Time, GET) at 13/18:23:50.5Z and acquisition at Tananarive (27:52:21 GET) at 13/18:34:47.5Z (from transcript MAC#C-115958)(data supplied by J. Oberg)
In his initial photographic identification chart, dated Sept. 19, 1966, and included as final identification information with the photos that Bara Photo has in storage, NASA photo analyst Richard Underwood initially placed the photo time at 25:47 GET, which is two hours too early. Subsequently, Cdr. Conrad at a photographic debriefing on Sept. 21, 1966, claimed the photos of the "stranger" were taken at 27:43 GET. Underwood then wrote a memo in which he included the statement that the pictures were taken on Revolution #18, "over South Atlantic, 1000 miles or so west of South Africa's mouth of the Orange River". Underwood mentioned that Conrad viewed the images at 100 X magnification and confirmed the identification as the "stranger". Underwood indicated in the memo that if the object were 280 miles (450 km) away, as stated by NORAD for the distance to the P-3, the "stranger" was "about 18 miles (95,150 ft) long." (Data supplied by Brad Sparks)
According to the astronauts' statement in the Condon report and in transcripts of the flight debriefing the object was seen "going into sunset." A calculation of sunset for the GT-11 capsule by Sparks yields 13/18:30 Z.
Robert Emenegger's book, UFOs, PAST PRESENT AND FUTURE (Ballantine Books, 1974) gives the time as 27:47 GET, but this may be in error by 4 minutes.
In an interview with Dr.James Harder in 1976 Conrad pointed put that they viewed the "stranger" and talked about it, decided to photograph it, got the camera, took a picture, wound the camera, took a second picture, etc. (3 photos total), so it must have been at least several tens of seconds between when they first saw it and when they actually finished taking pictures. Conrad thought it had been visible for maybe 30 seconds or more. He also recalled that they weren't in contact with earth at the time. This places the photos probably more than 30 seconds after loss of signal Ascension Island. (Information supplied by B. Sparks.)
The available data, summarized above, place the photo time in the range 13/18:24 Z to 13/18:30 Z, with 13/18:25 Z as the specific time referred to by Underwood (27:43 GET). Since GT-11 was moving eastward away from the P-3 orbit I will use 13/18:25 Z to obtain the MINIMUM SEPARATION between GT-11 and P-3 that is consistent with the photo time data above, while fully realizing that it probably was several minutes later (and, hence, farther from the P-3), considering that the spacecraft went into darkness at about 18:30 Z, shortly after the sighting.)
B) LOCATION OF THE PROTON 3
DATA FOR THE PROTON 3 The position of Proton 3 was calculated from orbital parameters obtained from Goddard Space Flight Center (GSFC) microfilm data obtained by J. Oberg and B. Maccabee (Bulletins 28-33). Of particular interest are the data on Bulletin 32 for which the epoch was Sept. 13/11:17.52Z, and Bulletin 33 for which the epoch was Sept. 14/09:25.1Z. The pertinent data are given below. (In what follows, h = hours, r = revolution, Arg = argument, Incl = inclination, Eccent = eccentricity of elliptical orbit, RA = right ascension, NBEC = north bound equator crossing, d = degrees):
Bull. Mean Motion Semi-Major Arg. Incl. Eccent. Rate of Orbit # in r/day, Axis in of (e) Change (each starts h/r Earth Radii Perigee RA at NBEC) (d) (d) (d/day)
32 16.253, 1.03226 56.56 63.405 0.0078 -3.99 1090 1.4766
33 16.290 1.03070 57.464 63.453 0.0075 -4.005 1105
From these data I calculated the number of orbits from 13/11:17.5Z to 13/l8:25Z using 1.476 h/r and found 4.827 (4 complete orbits and 0.827 of the fifth), so the photos were taken during orbit # 1094 of the P-3 (specifically at orbit 1094.827). This corresponds to being 0.827x3600 = 297.7 d along orbit 1094, or 62.3 d (measured along the orbit) before the next NBEC (the beginning of orbit #1095). A location 62.3 d measured southward from the equator along an orbital path of inclination 63.4 d corresponds to a particular latitude south of the equator and a certain longitude west of the NBEC.
The longitude of the NBEC of orbit 1095 was estimated from data on Bulletin 32 which says that the NBEC for orbit 1097 was (if I can read it correctly) 67.03 d west. The NBEC for 1095 was calculated from
(a) the motion of Greenwich Meridian (GM): 15 d/h eastward (b) the rate of change of the R.A. : 4 d/day toward the west or 0.167 d/hr west. (c) the total change in longitude with respect to GM per hour is the sum of (a) and (b): 15.167 d/h (d) the orbit time: 1.476 h (e) the total change in longitude from one orbit to the next is the product of ((c) and (d): 22.4 d/orbit
(Note: the tabular data on Bulletins 32 and 33 agree with this change in longitude from orbit to orbit to within several tenths of the degree per orbit.)
Since the GM moves eastward the NBEC values increase in a westerly direction with respect to the GM as the orbit number increases. Thus the NBEC for 1095 would have been
67.03 d - (#1097 - #1095) x 22.40 = 22.23 d west of the GM
LOCATION OF THE PROTON #3
Imagine a triangle with the upper right corner lying on the equator at a point 22.23 d west of the GM. This is the NBEC. The plane of the orbit passes through this point. The orbit crosses the equator at an angle 63.4 d measured COUNTERCLOCKWISE from the equator. The upper left corner of the triangle is at a point on the equator at location 40.4 d west of the NBEC or 62.63 d west of the GM. The left side of the triangle is a "vertical" line (a longitude line) that extends 49 d southward from the equator. The complete triangle is thus made up of a section of the orbit that that is 62.3 d of arc long, a section of the equator that is 40.4 d long and a section of a longitude line that is 49 d long. The P-3 was at the lower corner of this triangle. The actual location on the globe is indicated in Figure 7. These angles were calculated from the following equations.
latitude = arcsin[sin(incl)x sin(orbital distance)/sin90] = arcsin [sin(63.4)sin(62.3)/l] = 52.3 d south of the equator

Longitude = longitude at NBEC + arctan[cos(incl)tan(orbit distance)] - (22.4 d/r )x(fraction of revolution) = 22.23 + 40.45 - 3.87 = 58.8 d west of the GM
NOTE: this position is just east of the Falkland Islands off Argentina.
It is also of interest to calculate the altitude of the P-3. For orbit 1094 the following values are estimated to be approximately correct: a = the semi-major axis of the orbit, about 1.0315, re = the radius of the earth = 6378 km, e = eccentricity = 0.0077 and E = the argument of the perigee = 56.8 d. Then the altitude is given by
Altitude = a re (1-e)[(1-ecos(E+62.2)/(1-e)] {Note:(1-e) cancels}
= 1.0315(6378)[(1 - cos(56.8+62.2)]
= 6603 km above the center of earth
Altitude above earth's surface =6603 - 6378 = 225 km
RELATED INFORMATION:
The orbital velocity of the of P-3 was calculated as follows (nmi = nautical miles, 6077 ft):
avg. radius 6579 km (apogee 6629; perigee 6528km) avg. orbital distance (circumference) = 41337 km avg. orbital period = 1.476 hr =88.56 min. avg. orbital velocity = 467 km/min or 290 nmi/min
(The computer printout from GSFC indicates an orbital velocity of 288 nmi/min which is close enough for government work!)
Thus from 13/18:25Z to 13/18:30Z, which is the time frame that bounds the time the pictures were taken, the satellite would have moved about 1450 mi. along its orbit. The GT-11 speed was about the same (see below). The relative directions of the orbits are such that the distance between the satellites would have remain about constant (as the P-3 moved toward the orbital plane of the GT-11, the GT-11 moved away from the orbital plane of the P-3).
C) LOCATION OF THE GT-11
NASA ORBITAL DATA FOR GT-11: from a NASA computer printout giving latitude, longitude, altitude, velocity, eccentricity, perigee, apogee, capsule orientation (roll, pitch), etc. every 30 seconds (data supplied by Brad Sparks) I find, at 18:25 on the 18th orbit, the pertinent data are: (in the following d stands for degrees, ' stands for minutes, S is south, W is west; unless otherwise noted, altitudes are in nmi )
Latitude Longitude Alt. Incl. Roll Pitch Azimuth 25d 30'S 8d 24'W 164 28.83 d 0 d -.040 d (forward in (geocentric) (303.7 km) (heads (parallel orbit and up) to earth's travelling surface) east-southeast)
These coordinates correspond to a point roughly 1500 miles from the mouth of the Orange River (about 1500 miles due west and 200 miles due north), in agreement with Underwood's statement.
A DIRECT CALCULATION OF THE LOCATION FOLLOWS:
The following calculation is based on information supplied by Jim Oberg. This information was taken from a reconstruction of the GT-11 orbit and reentry by TRW (Note 66FMT-262; 20 December 1966; library code U67-11,034).
According to this information the GT-11 orbital parameters were:
Apogee Perigee Period inclination

172.95 152.30 90.54 min. 28.86 d (320 km) (282 km)
Also according to the TRW Note, the NBEC that took place before 13/18:25Z occurred at 13/17:24:4.17 Z at 127.26 d East longitude. The orbital period during this revolution was 90.54 minutes.
The subsequent South Bound Equator Crossing (SBEC) that took place just before the sighting occurred is calculated as follows:
127.26 d E + 180 d E - (1/2)23.1 = 295.71 E = 64.29 W
where (1/2)23.1 corrects for the rotation of the earth and of the orbital plane during half an orbit ( 23.1 d per orbit was obtained from the TRW note by comparing successive orbits). The SBEC occurred at 17:24:4.17 Z + (1/2)(90 min,32.4 sec.) = 17:69:20.37 = 18:09:20.37 Z. The difference between this and 18:25:00 = 18:24:60 Z is 00:15:39.63 or 15.66 minutes. During this time the GT-11 traveled (15.66/90.54)(360) = 62.27 d along its orbit in a southeasterly direction along inclination 28.86 d. The GM also moved eastward by (15.66/90.54)(23.1) = 3.995 d. Making use of the inclination angle given as 28.86 d, the position of the GT-11 at 18:25:00 Z was approximately
Latitude = arcsin (sin 28.86 x sin 62.27) = 25.29 = 25 d 17.4' South (Compare with NASA data above: 25 degrees 30 minutes South)
Longitude = 64.29 - arctan(cos 28.86 x tan 62.727) + 3.995 = 9.26 = 9 degrees 15.6 minutes West (Compare with NASA data above: 8 degrees 24 minutes West)
In comparing the TRW note with the NASA data I find some differences as follows:
Source Apogee Perigee Period inclination
NASA 165.2 nmi 155.8 nm 90.46 min. 28.83 d TRW 172.95 nmi 152.30 nm 90.54 min. 28.86 d
These differences are sufficiently small as to have a negligible effect on the conclusion presented in this paper. Therefore it would be pointless to argue over which set of data is the more accurate.
D) DISTANCE BETWEEN P-3 and GT-11 at 13/18:25
The calculated positions are:
P-3 : 52.3 d S 58.8 d W GT-11: 25.5 d S 8.4 d W
These positions correspond to a separation of about 3200 statute miles or abou 5100 km during the time frame of the photos as measured on a flat map such as Figure 7. A more accurate calculation that is not subject to the distortions of a flat map gives the following result.
The angular distance w.r.t. the center of the earth is
arccos[cos(52.3 - 25.5) cos(58.8 - 8.4)] = 55.32 d = 0.965 radians
which corresponds to 6400 km in circumferential measure at an average height of 250 km.
The straight line distance between these points is found from the law of cosines with two long sides being the distances from the center of the earth to the two satellites and the straight line distance being a chord of a circle (R = distance from center of earth; ^2 means square, ^0.5 means square root; distances in km):
[(R of P-3)^2 + (R of GT-11)^2 - 2(R of P-3)(R of GT-11)cos(55.3)]^0.5
= [(6594)^2 + (6680)^2- 2 x 6594 x 6680 x cos(55.3)]^0.5
= 6150 km or about 3800 miles
Note that the horizon (ignoring refraction) from the GT-11 (alt. 303 km; 6680 km from the center of earth) is at a distance of
(6680^2 - 6378^2)^0.5 = 1986 km
Note also that the horizon is at a depression angle of (distances in km)
arccos(6378/6680) = 17.3 d.
The straight line of sight from GT-11 to the P-3 is at a depression angle of
90 - arccos[-(6594^2 - 6680^2 - 6150^2)/(2 x 6680 x 6150)]
= 90 - 61.7 = 28.3 d.
Because the depression angle of the line of sight to the P-3 exceeds the depression angle of the horizon (see above), the astronauts could not have seen the P-3 even if they had been facing in the correct direction since the earth blocked the line of sight!!
Bruce Maccabee June 14, 1977
E) CONCLUSION
Had the initial NORAD report, whether correctly or incorrectly, placed the Proton 3 satellite at a distance within 10 km of the Gemini 11, there probably would have been no dispute over the identity of the unknown and this paper would never have been written. However, the glaring inconsistency between the NORAD distance, the sighting direction, the duration and apparent size (image size) made it impossible to ignore the inconsistency.
How NORAD arrived at its estimate is unknown at this date. (NOTE: this was true in 1977 and still is in the year 2000 !). Quite possibly it was just a best guess estimate since they did not have accurate figures on the Gemini 11 location, and since they only had computer predictions of the track of the Proton 3.
There has been speculation that the unknown was a satellite, the existence of which NORAD didn't wish to make known. It is difficult to imagine that it could have been a known satellite which, somehow, NORAD overlooked.
Unfortunately the observational data on the unknown are too inexact to allow a determination of whether or not the unknown was in a "legitimate" earth orbit or was "something" that just happened to be, um, " passing by" (?).
(BUT SEE APPENDIX 3).
However, it seems quite certain that, even if the above calculations are not perfectly accurate, the astronauts did not see the P-3. How do I know this? Consider the following "variations" which assume gross errors by NASA and NORAD.
Suppose by some chance the P-3 had gotten so far along its orbit that it was not 62.3 d before the NBEC, but was only, say, 20 d before NBEC. (This would correspond to "horrible" GFSC preditions resulting in about a 10 minute error in locating the satellite.) Then its latitude would have been 17.8 d and its longitude would have been 22.2 + 9.25 - 1.24 = 30.20 d West.
Its radial distance from the earth's center would have been about 6567 km (189 km altitude above surface).
Its earth-central angle from the GT-11 (25.7 d S, 8.4 d W) would have been
arccos[cos(25.5 - 17.8)cos(30.2 - 8.4) = 23 d

and its straight line distance from the Gt-11 would have been
(6567^2 + 6680^2 - 2 x 6567 x 6680 cos23.1)^0.5
= 2654 km = 1650 mi.
This would have been about the closest approach of the P-3 orbit to the GT- 11 during orbit 1094 of the P-3 and orbit 18 of the GT-11 during the allowed time frame for the pictures, assuming the position of the GT-11 at 18:25Z is correct (as determined by TRW and NASA).
Suppose that the angular predictions were ALL wrong and that the GT-11 was actually close enough in angular position to the P-3 for the astronauts to have seen it. There still would be the altitude difference. Assume the minimum altitude for the GT-11, 280 km, and the maximum for the P-3, about 220 km. There is still at least 60 km spacing if the GT-11 could look straight down at the P-3 (which it couldn't). Recall that the image sizes correspond to the size of the P-3 at a distance of several km. In other words, even 60 km would be too great for the P-3 to make images the size of those in the photos.
Thus I conclude that unless NORAD and NASA had completely incorrect orbital parameters (incorrect angular position and incorrect height) for at least the P-3 satellite, these calculations reject the P-3 as the "Gemini 11 UFO."
BSM June 19, 1977
Acknowledgements: The detailed analysis presented here would not have been possible without information obtained by James Oberg and Brad Sparks. I thank Brad Sparks, in particular, for many helpful suggestions and access to the results of his very careful analysis.
*****************************************************************
APPENDIX 2
DESCRIPTIONS BY THE ASTRONAUTS
THE TIME OF THE SIGHTING From the transcript of the Gemini XI Mission Commentary, 9/13/66, 12:34 p.m. (Tape 133, pg. 1):
(27:52) Houston, TX, Manned Spacecraft Center: "This is Gemini Control, 27 hours 52 minutes into the flight. Gemini 11 is down over south Africa on the night side of its 18th revolution,within range of Tananarive now. We'll standby for air ground transmission during this pass."
(27:52:26) Spacecraft: "Hello Houston, 11 here. How do you read? "
(27:52:29) HOU: "Read you loud and clear. "
(27:52:31) S/C: "Okay. We had a wingman flying wing on us going into sunset here, off to my left. A large object that was tumbling at about one revolution per second and we flew... we had him in sight, I say fairly close to us, I don't know, it could depend on how big he is and I guess he could have been anything from our ELSS to something else. We took some pictures of it."
(27:52:59) HOU: "Roger This is Gemini Control, 28 hours into the flight. Gemini 11 has just passed out of the range of the Tananarive station. We have no additional information on this object reported by Pete Conrad. He was unable to identify it. He said it was tumbling at about one revolution per second and that they did get some photographs of it. The next station to acquire will be --------- "
(Note: the ground elapsed times -GET- quoted in parentheses above are from the formerly classified "Gemini XI Voice communications document , MAC Control No. C-115958.)
_________________________ THE NORAD IDENTIFICATION

The NORAD Identification of the object is contained in the transcript of the Gemini 11 Mission Commentary, 9/14/66, 2:39 p.in.itape 209, page 1):
"This is Gemini Control, 54 hours 5 minutes into the flight. Gemini 11 has just passed out of range of Tananarive. We have a report on the object sighted by Pete Conrad over Tananarive yesterday on the 18th revolution. It has been identified by NORAD as the Proton 3 satellite. Since Proton 3 was more than 450 kilometers from Gemini 11, it is unlikely that any photographs would show more than a point of light. Gemini 11 will be acquired by ----" __________________________
THE DESCRIPTION OF THE OBJECT ACCORDING TO THE ASTRONAUTS:
a) (from Lloyd Mallan's article) "It looked just like spacecraft look when they're flying. It was a brilliant source of light. I'd say the color was a sort of yellow-orange. It looked just the way the sun reflects off most metals up there . It had to be made of something like a metallic material to reflect light the way it was doing. It looked just like a bright object. There was nothing that we could distinguish as having shape. We thought the object was tumbling because it would flash. You know, the reflected light from it would be flashing." (This description by was given by Gordon in 1968 or 1969.)
b) (from Astronautics and Aeronautics, January 1967, pg. 68; this is an article describing a meeting where Conrad spoke) "A tremendous account of the Gemini XI flight by its command pilot, Astronaut Charles Conrad (was presented). ........ He remarked that he had seen the Soviet Union's Proton 3, photographed it, and could give an exact technical description of its external structure, including undetached propellant tanks ........"
c). (from Gemini XI Technical Debriefing, formerly classified - Oct. 1966) Conrad: "We didn't see our own booster on orbital flight at all. We did spot the one satellite, and I thought I saw another one later, but it turned out that it was a large particle outside the spacecraft. But the satellite we picked up, boy, it was loud and clear. They told me it was 289 miles away. it must have been awfully big. I read that it was the Proton 3.
Gordon: "Oh, is that right?"
Conrad: "I assume that this is a booster that they left up there with it. I had the impression, and I told Dick, that it looked like it was a booster. I didn't think it was that far away. It was big, whatever it was. I could tell it was long and cylindrical, and I had the impression that it looked like the second stage of a Titan. I had the impression that I could see an engine bell." _________________________________
IDENTIFICATION OF THE PHOTOS
The initial 70 mm photographic identification was made by Richard Underwood. He overlooked (didn't notice) the images of the unknown and labelled the three photos in question as "L-band antenna, overexposed." (This is the curly object that appears highly overexposed at the right side of each photo.) These three were 66-HC-1591, 92 and 93 (NASA headquarters numbers). Photo 1590 was listed as totally blank. After the September 21 conversation with Pete Conrad, Underwood looked again and found the "stranger" on two exposures, -1592 and -1593. Gordon and Conrad viewed the images at 100x magnification and subsequently agreed that the images were of the unknown object. Underwood calculated, from the image sizes and known camera focal length, that "If the stranger is 280 miles distance (sic), it is about 18 miles (95,150 ft) long."
(NOTE: Accurate measurements of the images have shown that the maximum separation between bright images on 66-KC-1592 is 0.25mm, and the maximum separation on -1593 is 0.37 mm. Since the focal length of the Hasselblad Super Wide maximum Angle lens was 38 mm., the angular separation of the bright images in -1592 was about 0.0066 radians (6.6 meters at 1 km or 6.6 feet at 1000 ft), and in 1593 it was about 0.0097 radians (9.7 meters at 1 km).
________________________________
DURATION OF THE SIGHTING
Underwood (private communication) estimated 5 to 10 seconds between pictures.
Conrad said he took four photos (only two of which showed the object).
Since the astronauts had time to talk about the object and prepare the camera (set the f-stop), etc. (from a private communication between J. Harder and Conrad; data suppplied by B. Sparks)
Hence the estimated minimum duration of the sighting is 20 seconds and a possible maximum duration is about a minute. _________________________________________________________________
APPARENT FLIGHT PATH OF THE OBJECT WITH RESPECT TO THE GEMINI 11:
(from Lloyd Mallan's article): "We were going SEF (which means Small End Forward), heads up in orbit. And it came from our left and went across us and down below us. In other words, it came into view from our left window, flew out in front of us and then we lost it when it sort of dropped down in front of us."
(From a letter from Richard Gordon to Jim Oberg): "It appeared at ten o'clock and disappeared when it was no longer in sunlight at about eleven thirty to twelve o'clock."
_____________________________________________________________________ ********************************************************************
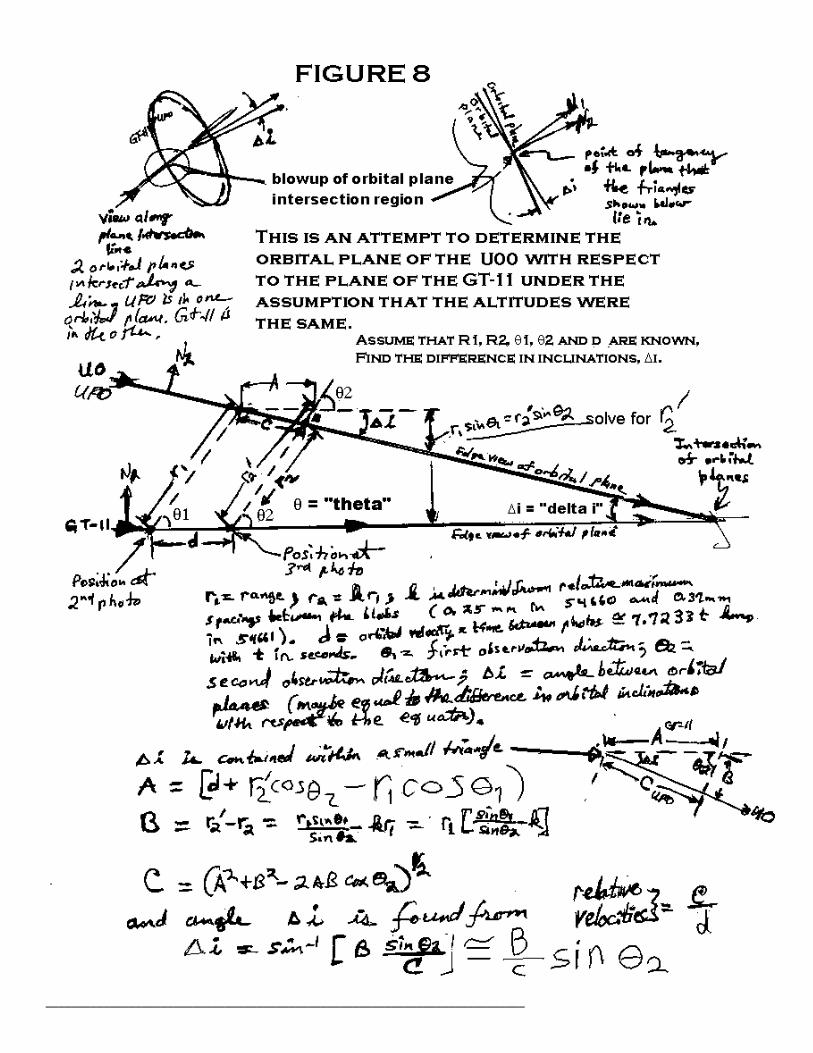
APPENDIX 3
FURTHER ANALYSIS OF THE GT-11/UNIDENTIFIED OBJECT ENCOUNTER by B. Maccabee June, 1977 and August, 2000
The following analysis is an attempt to determine whether or not the UFO could have been a UOO - Unidentified Orbiting Object. The attempt is made by assuming it was in orbit and using the photographic and testimonial data to determine as much as possible about the nature of its orbit.
In order to carry out this analysis certain assumptions are made:
l)the size of the UOO satellite is set at 10 meters a the maximum separation of reflecting surfaces expected for man-made satellites of the 1966 vintage; this assumption is probably not correct even if there were a satellite with 10 m between extremeties because we do not see, in the photos, the extreme edges, but rather the overexposed areas of the image and the centers of the overexposed areas would correspond roughly to the centers of the reflecting areas rather than the extreme edges.
2) the angle between the orbital planes can be found sufficiently accurately using plane geometry approach (the portion of the orbit of the GT-11 and the portion of the orbit of the assumed UOO satellite can be represented as straight lines that lie in a plane).
The second assumption seems reasonable in view of the evidence (the astronaut's claim that the UFO passed in front of them and the photographic evidence, described below) that suggests a) the GT-11 travelled at most several degrees of its orbit during the total encounter and less than 1 degree during the time between pictures (photos 2 and 3, assumed to be 10 seconds or less) and b) the UO was apparently at the same altitude or within a few kilometers of being at the same altitude since the astronauts appeared to be looking horizontally out of their craft when they took the pictures. (Actually they may have been looking slightly upward since their line of sight toward the object was nearly "level" with the center of the Agena antenna).
With respect to (2) above, consider a crossing point of two circular orbits

that lie in different planes (different angles of inclination relative to the equator) but at the same altitude. Call this crossing point "zero degrees." Imagine a plane tangent to the two orbits at the crossing point (actually tangent to a sphere with the radius of the orbits). Now move along one of the (circular) orbits away from that point by an amount S = R W where S is a distance along the orbit (a circular arc), R is the orbit radius and W is an angle as measured from the center of the orbit (center of the earth). With respect to the tangent plane at the crossing point, the point on the orbit at distance S or angle W lies "below" the tangent plane by an amount, H, given approximately (for small S or W) by H = S^2/(2R) = RW^2/2, where W is measured in radians. Assume the GT-11 was 30 seconds away from reaching the crossover point. Thirty seconds is 1/2 of a minute or (1/2)(1/90.5) = 1/181 of a 90.5 minute orbit (90.5 minutes to cover 360 degrees or 3.98 degrees per minute). The angle is W = 2 pi/181 = 0.0347 radians (2 degrees). With R = 6678 km (300 km altitude of the GT-11), H = 4.02 km, which means that when the GT-11 was 30 seconds from reaching the intersection "point", it was about 4 km "below" the plane tangent to the orbit at the intersection point. On the other hand, during that 30 seconds the satellite travelled S = RW = 231 km, so the distance from the tangent plane (the plane of the triangles in the following analysis) is very small compared to the distance moved during the sighting as projected onto the tangent plane. Therefore the following analysis treats the orbital tracks as if they were projected onto the tangent plane. A more accurate, and more difficult , approach would be to used spherical-trigonometry. However, I believe calculation method used here is sufficiently accurate, considering the lack of precise data, to a)allow for an estimate the angle between the orbital planes and b) whether or not the track of the UOO is consistent with that expected of an orbiting satellite.
Figure 8 illustrates the orbital plane intersections and the (not to scale) plane triangles formed by the orbital tracks and the sighting lines as projected onto a plane that is tangent to the orbits at the intersection point. ___________________________________________________________________________
___________________________________________________________________________
In Figure 1 the distance d along the GT-11 track is the distance travelled (39 km to 77 km) during the time, 5 to 10 seconds, between the photos.
Since the photos are the only hard data available on the apparent size of the object I have decided to use them to estimate the distances r1 and r2 to the UOO and the angles of the sighting lines, theta 1 and theta 2. The sighting direction angles with respect to the overexposed Agena antenna are reasonably straightforward to calculate from film measurements. Unfortunately the overexposure makes it very difficult to locate the actual antenna wires. However, they are barely visible.
The relative distances to the UOO can be estimated from the photos provided a certain, slightly unfounded, assumption is made. I have noted that the maximum separations of the overexposed regions are different. This could be due to rotation of the UOO with no distance change. However, because the astronaut descriptions indicate that the UOO actually moved closer to the GT-11 during the sighting, for analysis purposes I have ascribed the difference in the maximum spacing of the overexposed regions to distance change. As will be seen, this assumption leads to an intersection of the orbits that is reasonable in terms of the time from the initial photo to the time of disappearance of the UO in front of the GT-11. Other assumptions will lead to other values of the difference in inclination, delta i.
I have done this calculation as a first attempt to determine whether or not any interesting information can be obtained from the data available and I have not tried to take into account the effects of modifying this and other assumptions.
"HARD" DATA Relative Distances: from measurements on blowups it appears that the maximum spacing of overexposed regions in the two photos is (see Figure 6 for sketches) 0.25 mm in the second photo (S-66-54660) and 0.37 mm in the third photo (S-66-54661). Thus the maximum spacing increased by a ratio of 1.48. This is interpreted as being due to a distance shrinkage by a factor of k = (1/1.48) = 0.676 where k = r2/r1 because the image size is inversely proportional to the object distance, assuming that the object itself does not change in size (by rotation or dilation) as projected onto the line of sight (r1 is the distance in photo 2 and r2 is the distance in photo 3; these distances are not known but the RATIO of the distances can be estimated from the photo images). These quantities are defined in Figure 8. Note that if the change in maximum spacing of overexposed regions were due totally to rotation of the UOO and none was due to distance change then r2/r1 = 1. This would only happen if the UOO were traveling parallel to the GT-11. However, since the tracks apparently did cross it is reasonable to attribute at least some of the increase in image spacing to a decrease in the distance (r2 < r1).
Sighting directions: angles, theta, with respect to the antenna were obtained by measuring, on 1:1 scale copies of the 100x blowups, the distance between the largest overexposed image and a line drawn through the faint, twisted antenna image (overexposed). The measurement was done along a line essentially perpendicular to the antenna. There was very little change in spacing between the antenna and UOO images from photo 2 to photo 3.
Specifically I found the separation to be 27.7± 0.5 mm in photo 2 and 28.0± 0.5 mm in photo 3. The error bar is due mainly to a problem in locating the antenna image exactly. The point on the antenna where the perpendicular line from the UOO image intersected was about the same (halfway up) on each photo.
Thus the sighting directions with respect to the antenna were:
theta 1 = arctan(27.7/38) = 36.1 +/- 0.5 degrees theta 2 = arctan(28.0/38) = 36.4 +/- 0.5 degrees
According to the NASA data given in Appendix 1 the centerline if the GT-11 was aligned with the orbital track and the "roll" was zero, meaning that the antenna pointed radially away from the earth ("straight up.) Therefore,
to obtain the angles with respect to the direction of the orbit, it is only necessary to correct for the fact that the sighting line from the left spacecraft window to the antenna was at some angle to the right of straight ahead. Not knowing the exact distance of the windows from the centerline of the capsule, and not knowing the exact distance of the antenna from the window, I have assumed the first distance to be 1/2 meter, and the second to be 3 meters. This yields a sighting line to the antenna which is about 9.5 degrees to the right. Since this is based on crude estimates, I use 10 degrees as the correction angle with the realization that it might lie somewhere between 5 and 15 degrees.
Thus the angles to the UOO with respect to straight ahead are estimated at
theta 1 = 36.09 - (10 +/- 5) = 26.1 +/- 5 degrees theta 2 = 36.39 - (10 +/- 5) = 26.4 +/- 5 degrees.
The most important result from the photo measurement is that the difference in the angles is only a few tenths of a degree, whereas the angles themselves might range from about 21 to about 31 degrees. (The second angle being larger than the first seems to suggest that the UOO was "dropping back" relative to the GT-11, i.e.,traveling more slowly than the GT-11.)
CALCULATION
Figure 8 shows the equations which allow for calculation of the inclination difference, delta i. These have been incorporated into a BASIC computer program for convenience. To complete the calculation two more assumptions are necessary:
a) from the maximum spacing of overexposed regions in photo 2 (0.25 mm) and from the requirement that this correspond to a spacing of no more than 10 meters, the distance r1 is set equal to (38 mm/0.25 mm) x l0m = 1.5 km.
b) the time between photos is set to 5 seconds.
With these assumptions and the speed of the GT-11, 7.7263 km/sec, we have: k = 0.6757; d = 38.63 km; A = 38.61 km (slightly less than d); B = 0.471 km; C = 38.19 km (slightly less than A); delta i = 0.314 degree = 0.00554 radians
When the calculation is done for 10 seconds between photos the long distances are doubled (d = 77.263, A = 77.245, C = 76.82) and B remains the same so the difference in inclination angle is cut in half to 0.156 degrees.
OBSERVATIONS
The difference in orbital inclinations is very small whether there were 5 seconds or 10 seconds between the pictures. This suggests that the UOO should have passed over roughly the same areas of the earth as the GT-11 if it were in a normal orbit. The greatest separation between the GT-11 and the UOO would occur 1/4 of an orbit or about 22 minutes before or after the intersection considered here. At that time the maximum distance between the GT-11 and the UUO would be equal to the orbital radius times the difference in inclination, delta i, (in radians). For the 5 second time delta i = .314 degrees = .00554 rad and the maximum spacing, for a 300 km altitude, would be 0.00554 x 6678 = 37 km. The spacing would be half that for the 10 second time. About 22 minutes before the fateful encounter, GT-11 and the UOO (if in a normal orbit) would have been over "ye goode olde USA." Would NORAD have missed a 10 m sized satellite traveling, say, 37 km away from (and to the north of) the GT-11, and nearly parallel to the GT-11 on a track which, 22 minutes later, would bring them to within 2 km of one another?
(Note that if k were greater than 0.676, meaning that r2 was closer to being equal to r1, then delta i would be smaller and the orbits would be more "parallel" and the unknown would be less likely to escape detection. For example if only "half" of the image size increase could be attributed to a
decrease in distance, then the size ratio would be 1.24 instead of 1.48 and k = 0.806 which leads to delta i = 0.18 degrees and the maximum separation would be 21 km. If the image size ratio attributable to distance change were only 1.1, then k = 0.909, delta i = 0.08 degrees and the maximum separation would be only 9 km.)
It appears that the distance travelled by the UOO was slightly less than that travelled by the GT-11 in the same time. Specifically, for the 5 second time estimate the (linear, projected) velocity of the UOO is calculated from the above to be 38.19 km/5 sec = 7.638 km/sec. Since orbital velocity decreases with altitude this result suggests that the UOO was in a slightly higher orbit. The orbital velocity for a circular orbit at 300 km is calculated as follows, where g = 0.0098 km/sec^2 at the surface of the earth and h is the altitude above the mean earth radius:
v = [g/(6378+h)]^0.5 x 6378 = 631.7118 /(6378+h)1/2 = 7.7263 km/sec.
The velocity at 301 km is 7.7257 km/sec. Thus the change in v is (- 0.0006) km/sec per km increase in height. (The negative sign means that the velocity decreases as height increases. Note that this calculation yields a velocity consistent with what has been used above as the velocity of the GT- 11.) For the 5 second time the difference in velocities between the GT-11 and the UOO is about 7.726 - 7.638 = 0.088 km/sec which would correspond to a height difference of about 0.088/0.0006 = 146 km above the the GT-11. (For the 10 second time the altitude difference calculates to about 73 km.) Clearly this calculation, based on the assumption that the UOO was in a standard earth orbit, makes no sense because the photos show it had to be within 2 km of the GT-11.
One solution to this problem is to assume that k was larger than 0.676, in which case the velocities were more nearly the same. However, in order to reduce the height difference based on orbital velocities to several km it is necessary to decrease the image size ratio attributable to distance decrease to 1.01 or less (k = 0.99), in which case the height difference is 5 km or less. Under these circumstances delta i = 0.00065 degrees and the maximum separation is only about 76 meters! (Making k smaller makes the problem worse.)
On the other hand, one should keep in mind that, if the orbital velocities were very different, then the orbits were not at the same altitude and the plane geometry approach to calculating delta i and other quantities becomes a worse approximation to reality.
But this does raise an interesting question: do the photos indicate a velocity difference and, if so, what are the implications for an orbiting satellite? Is there a contradiction here such as, there exists no orbit within 2 km of the GT-11 and consistent with the photos and sighting duration for which the orbital speed of the UOO is noticeably less than that of the GT-11?
Unless, of course, the velocity of the UUO was not constrained by orbital requirements, in which case it could have "any" velocity!!
Using the law of sines it is possible to calculate the distance from the location of the GT-11 when photo 2 was taken to the orbit crossing point. The law of sines is written as r1/sin(delta i) = D/sin(180 - delta i - theta 1) where D is the distance desired: D = r1 sin(180 - delta i - theta 1)/ sin(delta i). Again assuming the 5 second time between photos and the image ratio of 1.48, D = 121.8 km and the time to reach the crossing would be 15.762 seconds. That is, about 10 seconds after the third photo was taken the GT-11 would have reached the orbit crossing point.
A similar calculation yields the distance that the UOO had to travel to reach the crossing point, 120.4 km, and the time it took after photo 2 was taken would have been about 15.767 seconds. This result indicates that the UOO and GT-11, AS DETERMINED BY THIS MATHEMATICAL MODEL, were only about 0.005 sec apart at the crossing and GT-11 GOT THERE FIRST!!
(If the image size ratio attributable to distance change were only 1.24 instead of 1.48, then k = 0.806, d = 38.63 km, C = 38.37 km, the distance of the GT-11 from the crossing point was about 208.8 km and it took 27.03 seconds to get there while the UOO was 207.5 km from the crossing point and
took 27.04 seconds to get there, arriving 0.01 seconds AFTER the GT-11.)
The astute reader will have noted that there is a problem here. The astronauts stated that the UOO seemed to pass in front of them and perhaps a bit below. Yet this calculation suggests that the UOO should have been visible out the left window, with the sighting angle (angle between the UOO and the antenna) actually increasing noticeably near the end of the sighting as the GT-11 moved "ahead" of the UOO to arrive at the crossover first.
The solution to this problem (and to the height problem) is to have the second angle, theta 2 be considerably smaller than theta 1. Furthermore, k would have to be larger, approach unity. For example for the UOO velocity to exceed the GT-11 velocity with k = 0.9 (image ratio = 1.1) theta 2 would have to be as low as 10 degrees. The photo data are, not compatible with such a low value for theta 2. In fact, there appears to be no photographic evidence that the angle was shrinking. Perhaps if Conrad had taken a fourth photo there would be such evidence.
COMMENT
There is as yet no conclusion. One can try to be more accurate measuring the photos and perhaps get a better estimate of the angle between straight ahead and the Agena antenna to make theta 1 and theta 2 precise. In particular one would like to know whether or not the UOO was in fact, traveling slightly more slowly than the GT-11. If theta 2 really is greater than theta 1 or even if it is the same, then it appears that there is a contradiction between orbital requirements (slower speed implies higher orbit) and the photos. As of this writing (Aug. 2000) this remains intriguing but unresolved.
NOTE: it has been assumed that the UOO was in fact some large object at a distance measured in km. However, one might also suggest a small object close by. Could it be trash ejected by GT-11? Probably not because trash would tend to remain in the same orbital plane, although the altitude could decrease and the speed could increase.
Whatever is proposed, if it was man-made it must obey orbital physics.