Embed Size (px)
Citation preview

conjunctural survey of italian firmsquarterly survey of the business tendency of italian firms and their relationships with banks
presentation leaflet
rome, january 2015 (13212fo)

2
agenda survey's architecture
investigated phenomena
research perimeter
network of phenomena
methods
output
timing
quality plan
buying solutions
rights and code of conduct
references

3
• Format's Conjunctural Survey of Italian Firms represents a multiclient
research service, realized quarterly by Format Research since 2008.
• The survey analyzes the business tendency of Italian firms with
respect to a set of major indicators: their climate of trust, the financial
requirements, the demand for credit, etc., investigated on the basis
of the firms' structural characteristics (area, sector, size, etc.) and
their relationships with banks (use of banks, Brands, etc.)
• The study relies on a representative sample of Italian firms, whose
viewpoints are investigated by means of a structured interview /
questionnaire (CATI / CAWI1), aiming at measuring observed trends in
the considered quarter, and forecasted trends in the following quarter.
survey's architecture |
1 CATI: Computer Assisted Telephone Interview; CAWI: Computer Assisted Web Interview.

4
Climate of Trust
Business Tendencies and Financial Requirements
Credit Demand & Supply, Investments
Relationships with Banks
1
2
3
4
investigated phenomena | the main themes of the survey

5
Small Business(firms with a turnover up to €2.5 million)
- Size- Economic Sector- Area (Residence)
Small Business(firms with a turnover up to €2.5 million)
- Size- Economic Sector- Area (Residence)
Enterprises(firms with a turnover over €2.5 million)
- Size- Economic Sector- Area (Residence)
Enterprises(firms with a turnover over €2.5 million)
- Size- Economic Sector- Area (Residence)
Format's segmentation of firms is carried out according to different parameters (area, size, turnover up to / over €2.5million, etc.). Other types of segmentation can be requested and / or customized on the Client's demand and with no
additional charge, e.g. turnover up to / over €5 million, etc.
Format's segmentation of firms is carried out according to different parameters (area, size, turnover up to / over €2.5million, etc.). Other types of segmentation can be requested and / or customized on the Client's demand and with no
additional charge, e.g. turnover up to / over €5 million, etc.
research perimeter | domains and levels of analysis

6
Conjunctural Analysis(trends observed in the last quarter)
Conjunctural Analysis(trends observed in the last quarter)
research perimeter | perspectives of analysis
Perspective Analysis(trends forecasted in the following quarter,
measured on the basis of the firms'
viewpoints)
Perspective Analysis(trends forecasted in the following quarter,
measured on the basis of the firms'
viewpoints)
Time-Series Analysis(time-series of the evolution of the
considered phenomena – available from
the IV quarter 2008)
Time-Series Analysis(time-series of the evolution of the
considered phenomena – available from
the IV quarter 2008)
Structural Analysis(number of firms belonging to a certain
segment / area and having relationships
with specific banks)
Structural Analysis(number of firms belonging to a certain
segment / area and having relationships
with specific banks)

7
network of phenomena | business tendencies
Determinants of business tendencies as reported by the interviewed firms, with respect to the following domains:
- ...the estimation of
investments
- …the anticipation of the
cycle
- …the demand for credit
(loans / credit lines).
CLIMATE OF TRUST
� The country's economic situation
� The business tendencies of firms
FINANCIAL TRENDS AND REQUIREMENTS
� Profit
� Employment
� Delays in payments
� Vendor prices
� Financial requirements (ability to cope with
duties towards suppliers, employees, the
Government, banks, etc.)
8
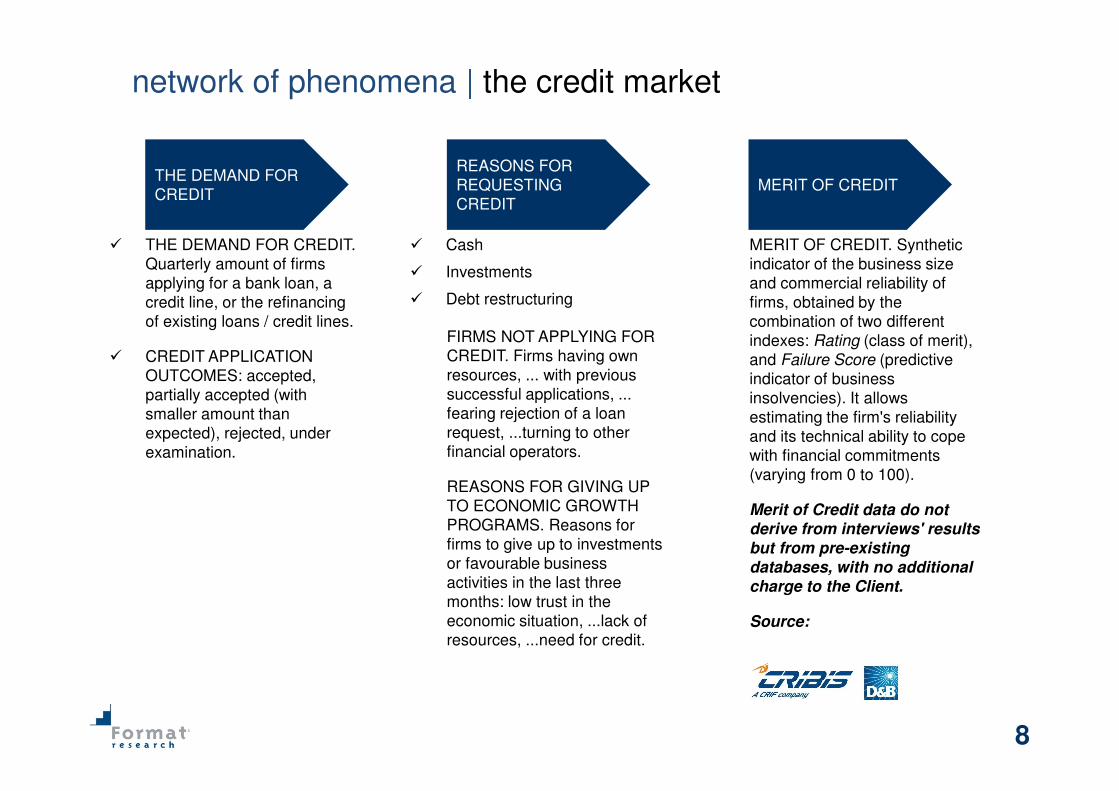
network of phenomena | the credit market
� THE DEMAND FOR CREDIT.
Quarterly amount of firms
applying for a bank loan, a
credit line, or the refinancing
of existing loans / credit lines.
� CREDIT APPLICATION
OUTCOMES: accepted,
partially accepted (with
smaller amount than
expected), rejected, under
examination.
� Cash
� Investments
� Debt restructuring
MERIT OF CREDIT. Synthetic
indicator of the business size
and commercial reliability of
firms, obtained by the
combination of two different
indexes: Rating (class of merit),
and Failure Score (predictive
indicator of business
insolvencies). It allows
estimating the firm's reliability
and its technical ability to cope
with financial commitments
(varying from 0 to 100).
Merit of Credit data do not derive from interviews' results but from pre-existing databases, with no additional charge to the Client.
Source:
FIRMS NOT APPLYING FOR
CREDIT. Firms having own
resources, ... with previous
successful applications, ...
fearing rejection of a loan
request, ...turning to other
financial operators.
REASONS FOR GIVING UP
TO ECONOMIC GROWTH
PROGRAMS. Reasons for
firms to give up to investments
or favourable business
activities in the last three
months: low trust in the
economic situation, ...lack of
resources, ...need for credit.
THE DEMAND FOR
CREDIT
REASONS FOR
REQUESTING
CREDIT
MERIT OF CREDIT
9
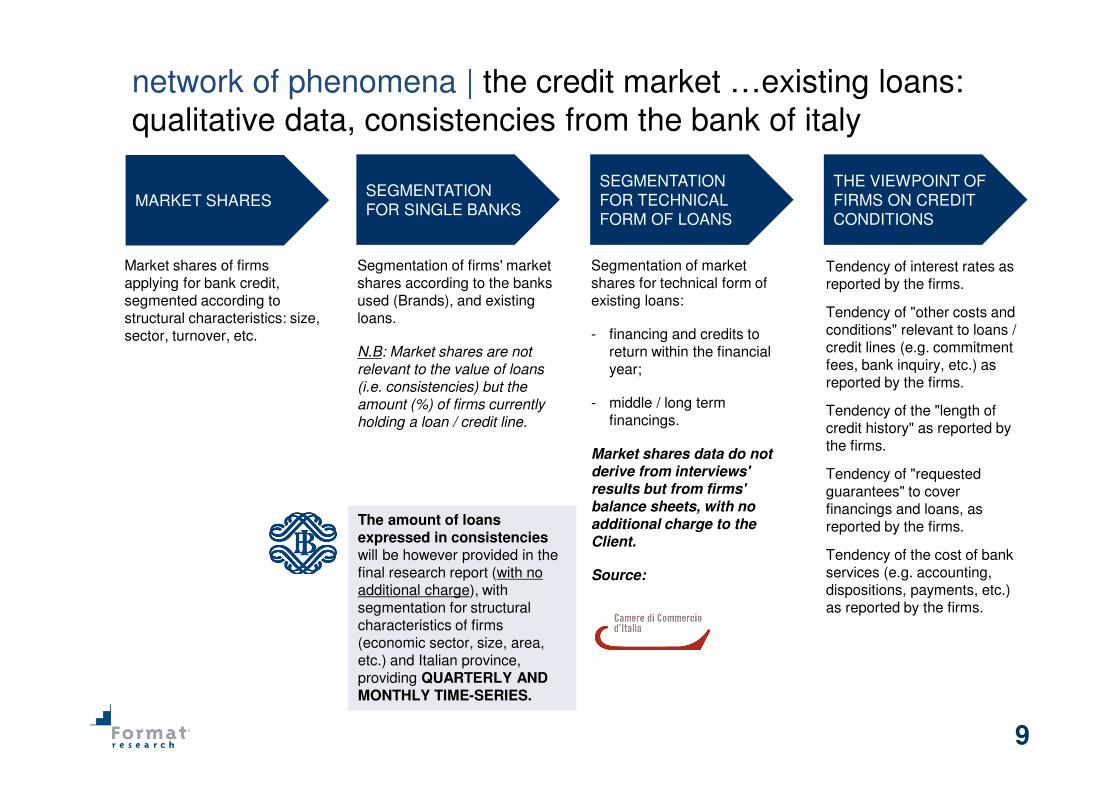
network of phenomena | the credit market …existing loans:
qualitative data, consistencies from the bank of italy
MARKET SHARESSEGMENTATION
FOR SINGLE BANKS
SEGMENTATION
FOR TECHNICAL
FORM OF LOANS
THE VIEWPOINT OF
FIRMS ON CREDIT
CONDITIONS
Market shares of firms applying for bank credit, segmented according to structural characteristics: size, sector, turnover, etc.
Segmentation of firms' market shares according to the banks used (Brands), and existing loans.
N.B: Market shares are not relevant to the value of loans (i.e. consistencies) but the amount (%) of firms currently holding a loan / credit line.
Segmentation of market shares for technical form of existing loans:
- financing and credits to return within the financial year;
- middle / long term financings.
Market shares data do not derive from interviews' results but from firms' balance sheets, with no additional charge to the Client.
Source:
The amount of loans expressed in consistencies will be however provided in the final research report (with no additional charge), with segmentation for structural characteristics of firms (economic sector, size, area, etc.) and Italian province, providing QUARTERLY AND MONTHLY TIME-SERIES.
Tendency of interest rates as reported by the firms.
Tendency of "other costs and conditions" relevant to loans / credit lines (e.g. commitment fees, bank inquiry, etc.) as reported by the firms.
Tendency of the "length of credit history" as reported by the firms.
Tendency of "requested guarantees" to cover financings and loans, as reported by the firms.
Tendency of the cost of bank services (e.g. accounting, dispositions, payments, etc.) as reported by the firms.
10
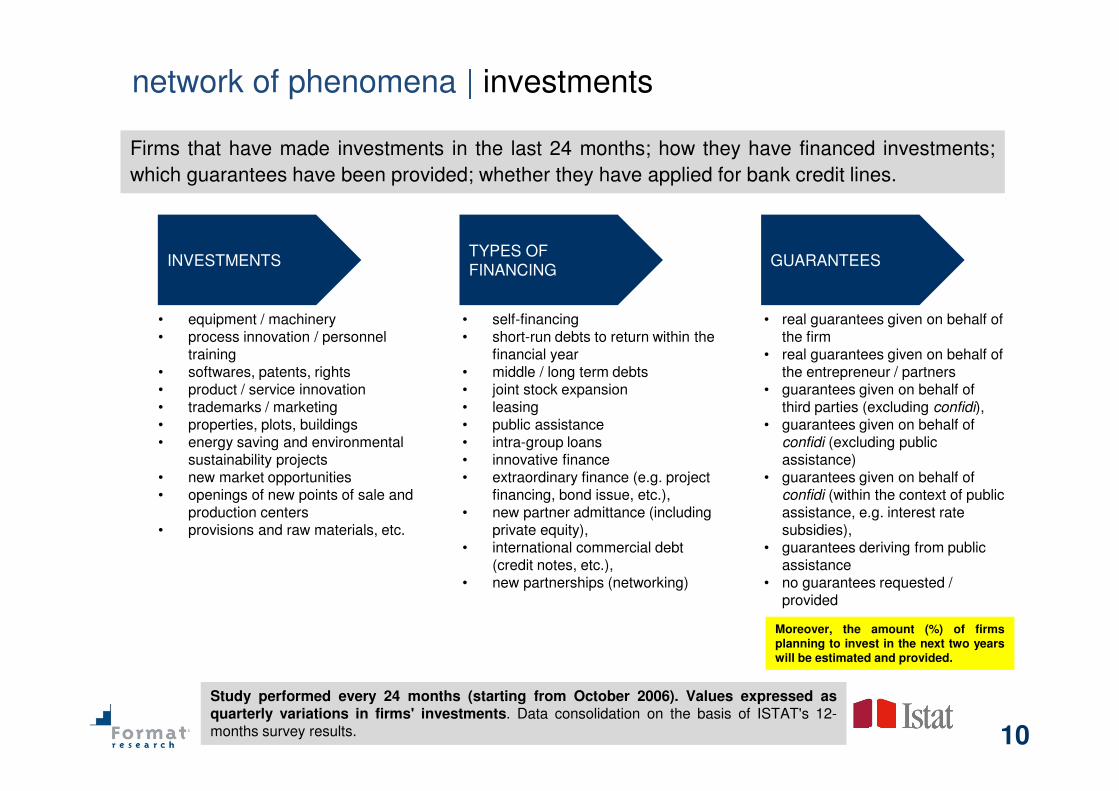
network of phenomena | investments
INVESTMENTSTYPES OF
FINANCING GUARANTEES
• equipment / machinery • process innovation / personnel
training• softwares, patents, rights• product / service innovation• trademarks / marketing • properties, plots, buildings • energy saving and environmental
sustainability projects• new market opportunities• openings of new points of sale and
production centers• provisions and raw materials, etc.
• self-financing• short-run debts to return within the
financial year• middle / long term debts• joint stock expansion• leasing• public assistance• intra-group loans • innovative finance• extraordinary finance (e.g. project
financing, bond issue, etc.), • new partner admittance (including
private equity), • international commercial debt
(credit notes, etc.), • new partnerships (networking)
• real guarantees given on behalf of the firm
• real guarantees given on behalf of the entrepreneur / partners
• guarantees given on behalf of third parties (excluding confidi),
• guarantees given on behalf of confidi (excluding public assistance)
• guarantees given on behalf of confidi (within the context of public assistance, e.g. interest rate subsidies),
• guarantees deriving from public assistance
• no guarantees requested / provided
Firms that have made investments in the last 24 months; how they have financed investments;
which guarantees have been provided; whether they have applied for bank credit lines.
Study performed every 24 months (starting from October 2006). Values expressed asquarterly variations in firms' investments. Data consolidation on the basis of ISTAT's 12-months survey results.
Moreover, the amount (%) of firmsplanning to invest in the next two yearswill be estimated and provided.

11
network of phenomena | relationships with banks
Segments of Firms
n 1
n
n
n
2
3
4
nn
.
.
.
BanksUsed
Main Banks
RELATIONSHIPS
WITH BANKS
� Number of banks used
� Analysis by Brand
� Analysis of “main banks”
(Brands) vs. ...
� ....“non-main banks” (other
Brands).
USE OF BANKS
Limited to those segments of firms
using more than 1 bank.
� Firms' allocation of corporate
banking activities among
banks ("main" vs. "non-main"
banks)...
� …and by Brand
CORPORATE
BANKING
ACTIVITIES
ALLOCATION
Limited to those segments of firms
using more than 1 bank.

12
CLUSTER 3East Europe (non-UE)
CLUSTER 2Asia (Japan)Asia (China) Asia (Australia and New Zealand) Asia (other)
CLUSTER 4Middle East
CLUSTER 1North America (USA and Canada)
CLUSTER 5South America (Mexico)South America (Brazil) South America (Other)
CLUSTER “UE”Other UE countries
network of phenomena | customization… focus on the
internationalization of firms
In-depth analyses are available on request, e.g. regarding the internationalization of firms. In this case, an oversampling of
manufacturing firms would be provided, particularly those with more than 9 employees and turnover higher than €2,5 million,
segmented by export destination country. Such analyses are targeted to six different clusters (one relevant to UE countries vs. 5
relevant to Extra UE countries). For each cluster, “Share-of-Wallet” studies are also available, i.e. analyses of banks
serving Italian firms that operate abroad.

13
methods | technical characteristics
Sample
Representative sample of Italian firms, excluding agriculture and finance. Sample: 2,500 interviews perquarter (10,000 interviews per year). Confidence interval: 0,95. Error: +2,1%. Sample expansion is availableon request, up to 8,000 cases per quarter (32,000 per year) with regional representativity.
Area
Sample representative of the following Italian geographical areas: North-West, North-East, Center,South/Islands. Regional representativity is available on request (19 regions and 2 autonomous provinces).
Sectors
Sample representative of the following sectors: Manufacturing, Construction, Trade, Tourism (reclassificationof different ATECO 2007 / NACE clusters), Services to Firms, Services to Persons.
Size
Sample representative of the following dimensional classes: Number of employees (Micro, 1-9 employees;Small, 10-49 employees; Medium, 50-249 employees; Big, >249 employees); Turnover (Small Business,<€2.5 million turnover; Enterprise, >€2.5 million turnover).
Contact and Data Collection Methods
Data Collection Technique: CATI (Computer Assisted Telephone Interview), and CAWI (Computer AssistedWeb Interview) structured interviews / questionnaires; CAWI is default at medium and big firms.Target person: entrepreneur or any person holding a position of responsibility within the firm (Director,Executive, Senior Manager, etc.).
Methodological paper available on requestMethodological paper available on request
14
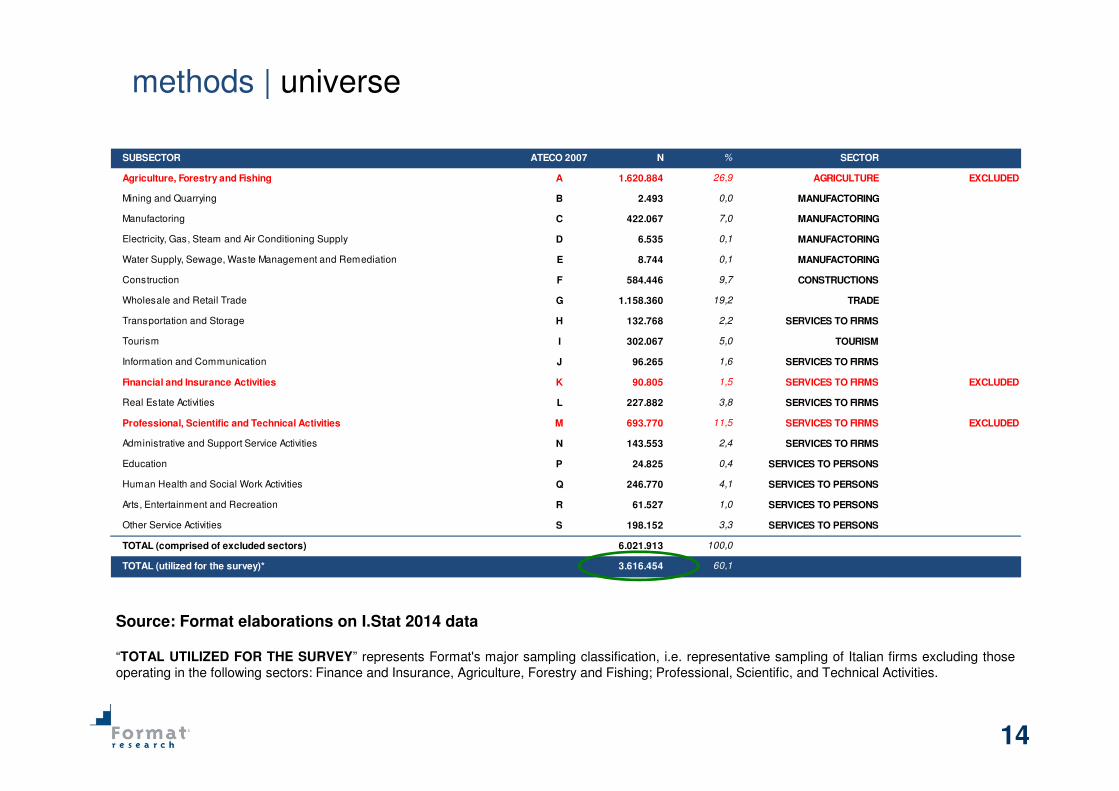
SUBSECTOR ATECO 2007 N % SECTOR
Agriculture, Forestry and Fishing A 1.620.884 26,9 AGRICULTURE EXCLUDED
Mining and Quarrying B 2.493 0,0 MANUFACTORING
Manufactoring C 422.067 7,0 MANUFACTORING
Electricity, Gas, Steam and Air Conditioning Supply D 6.535 0,1 MANUFACTORING
Water Supply, Sewage, Waste Management and Remediation E 8.744 0,1 MANUFACTORING
Construction F 584.446 9,7 CONSTRUCTIONS
Wholesale and Retail Trade G 1.158.360 19,2 TRADE
Transportation and Storage H 132.768 2,2 SERVICES TO FIRMS
Tourism I 302.067 5,0 TOURISM
Information and Communication J 96.265 1,6 SERVICES TO FIRMS
Financial and Insurance Activities K 90.805 1,5 SERVICES TO FIRMS EXCLUDED
Real Estate Activities L 227.882 3,8 SERVICES TO FIRMS
Professional, Scientific and Technical Activities M 693.770 11,5 SERVICES TO FIRMS EXCLUDED
Administrative and Support Service Activities N 143.553 2,4 SERVICES TO FIRMS
Education P 24.825 0,4 SERVICES TO PERSONS
Human Health and Social Work Activities Q 246.770 4,1 SERVICES TO PERSONS
Arts, Entertainment and Recreation R 61.527 1,0 SERVICES TO PERSONS
Other Service Activities S 198.152 3,3 SERVICES TO PERSONS
TOTAL (comprised of excluded sectors) 6.021.913 100,0
TOTAL (utilized for the survey)* 3.616.454 60,1
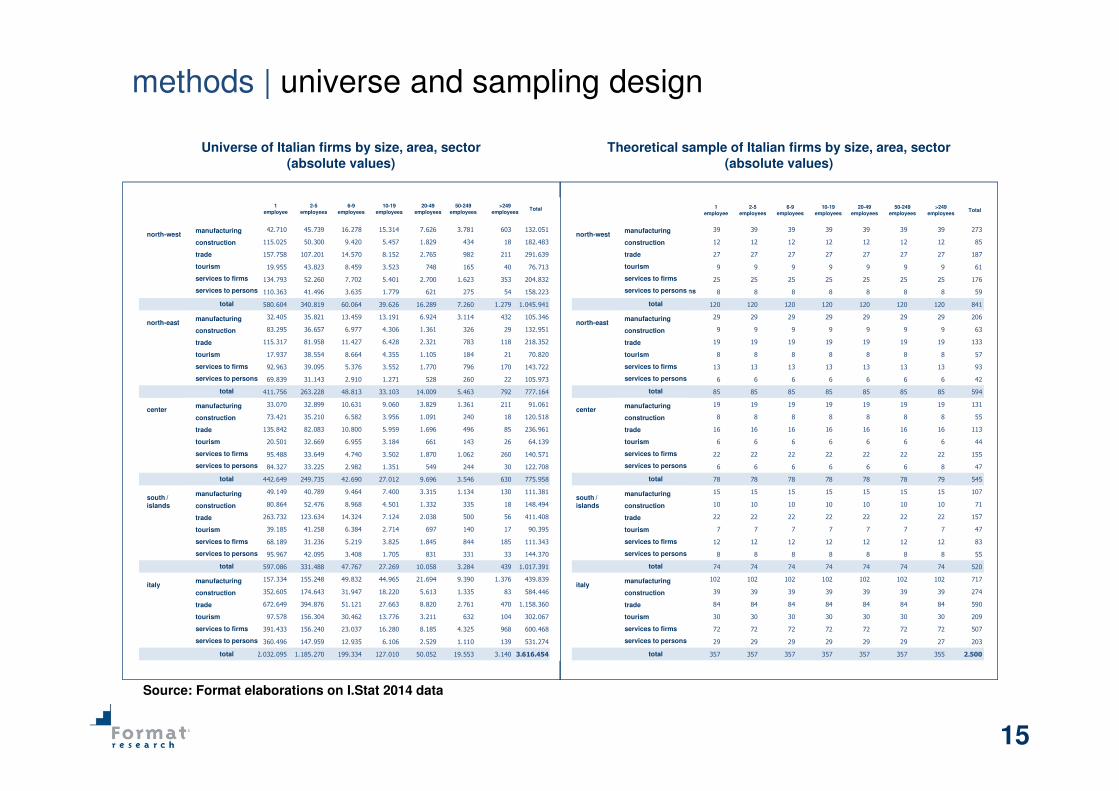
methods | universe
Source: Format elaborations on I.Stat 2014 data
“TOTAL UTILIZED FOR THE SURVEY” represents Format's major sampling classification, i.e. representative sampling of Italian firms excluding those
operating in the following sectors: Finance and Insurance, Agriculture, Forestry and Fishing; Professional, Scientific, and Technical Activities.
15
Theoretical sample of Italian firms by size, area, sector(absolute values)
Source: Format elaborations on I.Stat 2014 data
Universe of Italian firms by size, area, sector(absolute values)
methods | universe and sampling design
1
addetto
2-5
addetti
6-9
addetti
10-19
addetti
20-49
addetti
50-249
addetti
> 249
addettiTotale
1
addetto
2-5
addetti
6-9
addetti
10-19
addetti
20-49
addetti
50-249
addetti
> 249
addettiTotale
nord ovest manifattura 42.710 45.739 16.278 15.314 7.626 3.781 603 132.051 nord ovest manifattura 39 39 39 39 39 39 39 273
costruzioni 115.025 50.300 9.420 5.457 1.829 434 18 182.483 costruzioni 12 12 12 12 12 12 12 85
commercio 157.758 107.201 14.570 8.152 2.765 982 211 291.639 commercio 27 27 27 27 27 27 27 187
turismo 19.955 43.823 8.459 3.523 748 165 40 76.713 turismo 9 9 9 9 9 9 9 61
servizi alle imprese 134.793 52.260 7.702 5.401 2.700 1.623 353 204.832 servizi alle imprese 25 25 25 25 25 25 25 176
servizi alle persone 110.363 41.496 3.635 1.779 621 275 54 158.223 servizi alle persone 8 8 8 8 8 8 8 59
totale 580.604 340.819 60.064 39.626 16.289 7.260 1.279 1.045.941 totale 120 120 120 120 120 120 120 841
nord est manifattura 32.405 35.821 13.459 13.191 6.924 3.114 432 105.346 nord est manifattura 29 29 29 29 29 29 29 206
costruzioni 83.295 36.657 6.977 4.306 1.361 326 29 132.951 costruzioni 9 9 9 9 9 9 9 63
commercio 115.317 81.958 11.427 6.428 2.321 783 118 218.352 commercio 19 19 19 19 19 19 19 133
turismo 17.937 38.554 8.664 4.355 1.105 184 21 70.820 turismo 8 8 8 8 8 8 8 57
servizi alle imprese 92.963 39.095 5.376 3.552 1.770 796 170 143.722 servizi alle imprese 13 13 13 13 13 13 13 93
servizi alle persone 69.839 31.143 2.910 1.271 528 260 22 105.973 servizi alle persone 6 6 6 6 6 6 6 42
totale 411.756 263.228 48.813 33.103 14.009 5.463 792 777.164 totale 85 85 85 85 85 85 85 594
centro manifattura 33.070 32.899 10.631 9.060 3.829 1.361 211 91.061 centro manifattura 19 19 19 19 19 19 19 131
costruzioni 73.421 35.210 6.582 3.956 1.091 240 18 120.518 costruzioni 8 8 8 8 8 8 8 55
commercio 135.842 82.083 10.800 5.959 1.696 496 85 236.961 commercio 16 16 16 16 16 16 16 113
turismo 20.501 32.669 6.955 3.184 661 143 26 64.139 turismo 6 6 6 6 6 6 6 44
servizi alle imprese 95.488 33.649 4.740 3.502 1.870 1.062 260 140.571 servizi alle imprese 22 22 22 22 22 22 22 155
servizi alle persone 84.327 33.225 2.982 1.351 549 244 30 122.708 servizi alle persone 6 6 6 6 6 6 8 47
totale 442.649 249.735 42.690 27.012 9.696 3.546 630 775.958 totale 78 78 78 78 78 78 79 545
sud e isole manifattura 49.149 40.789 9.464 7.400 3.315 1.134 130 111.381 sud e isole manifattura 15 15 15 15 15 15 15 107
costruzioni 80.864 52.476 8.968 4.501 1.332 335 18 148.494 costruzioni 10 10 10 10 10 10 10 71
commercio 263.732 123.634 14.324 7.124 2.038 500 56 411.408 commercio 22 22 22 22 22 22 22 157
turismo 39.185 41.258 6.384 2.714 697 140 17 90.395 turismo 7 7 7 7 7 7 7 47
servizi alle imprese 68.189 31.236 5.219 3.825 1.845 844 185 111.343 servizi alle imprese 12 12 12 12 12 12 12 83
servizi alle persone 95.967 42.095 3.408 1.705 831 331 33 144.370 servizi alle persone 8 8 8 8 8 8 8 55
totale 597.086 331.488 47.767 27.269 10.058 3.284 439 1.017.391 totale 74 74 74 74 74 74 74 520
italia manifattura 157.334 155.248 49.832 44.965 21.694 9.390 1.376 439.839 italia manifattura 102 102 102 102 102 102 102 717
costruzioni 352.605 174.643 31.947 18.220 5.613 1.335 83 584.446 costruzioni 39 39 39 39 39 39 39 274
commercio 672.649 394.876 51.121 27.663 8.820 2.761 470 1.158.360 commercio 84 84 84 84 84 84 84 590
turismo 97.578 156.304 30.462 13.776 3.211 632 104 302.067 turismo 30 30 30 30 30 30 30 209
servizi alle imprese 391.433 156.240 23.037 16.280 8.185 4.325 968 600.468 servizi alle imprese 72 72 72 72 72 72 72 507
servizi alle persone 360.496 147.959 12.935 6.106 2.529 1.110 139 531.274 servizi alle persone 29 29 29 29 29 29 27 203
totale 2.032.095 1.185.270 199.334 127.010 50.052 19.553 3.140 3.616.454 totale 357 357 357 357 357 357 355 2.500
north-west manufacturing
construction
trade
tourism
services to firms
services to persons
north-eastmanufacturing
construction
trade
tourism
services to firms
services to persons
north-westmanufacturing
construction
trade
tourism
services to firms
services to persons
centermanufacturing
construction
trade
tourism
services to firms
services to persons
south /islands
manufacturing
construction
trade
tourism
services to firms
services to persons
italymanufacturing
construction
trade
tourism
services to firms
services to persons
total
total
total
total
total
1employee
2-5employees
6-9employees
10-19employees
20-49employees
50-249employees
>249employees
Total 1employee
2-5employees
6-9employees
10-19employees
20-49employees
50-249employees
>249employees
Total

16
..........
Manufacturing
North-West
Enterprise (>€2.5 million turnover)
Small business
Variations estimated on the basis of the previous year.
output | representation of phenomena
0,0
10,0
20,0
30,0
40,0
50,0
60,0
70,0
80,0
90,0
100,0
III IV 13 II III IV 14 II III IV 15 II III IV
contrazione
espansione
REPRESENTATION OF RESULTS: FREQUENCY DISTRIBUTIONS (%)AND SYNTHETIC INDICATORS
Brand Secondary Bank Number of banksMain Bank
percentuali indicatore
periodo migliore uguale peggiore saldo
2013 I I 0,3 54,5 45,2 27,6
2013 I I I 0,2 53,5 46,3 27,0
2013 I V 0,3 51,0 48,7 25,8
2014 I 0,3 53,0 46,7 26,8
2014 I I 1,0 52,0 47,0 27,0
2014 I I I 1,5 53,0 45,5 28,0
improved unchanged worsenedquarter indicator
expansion
crunch
17,1 15,6 13,2 12,9 12,5 13,0 15,6 17,8 18,8
III IV 13 II III IV 14 II III
"Hanno chiesto un fido, o la rinegoziazione di un fido esistente, nei trimestri" (% di imprese)
0,0
10,0
20,0
30,0
40,0
50,0
60,0
70,0
80,0
90,0
100,0
III IV 13 II III IV 14 II III
Percentuali di imprese che hanno chiesto un credito al sistema bancario nel terzo trimestre 2014
45,4
15,0
25,6
11,0 3,0
Accolta Accolta (inferiore) Non accolta In attesa (non farà richiesta prox
trim)
In attesa (farà richiesta prox
trim)
"Esiti delle richieste delle imprese che hanno chiesto un fido, o la rinegoziazione di un fido esistente, nel trimestre" (% di imprese)
Irrigidimento
Stabilità e/o allentamento
45,4
40,6
44,0
39,4
Percentages of firms that have applied for a bank loan / credit line in the 3rd quarter of 2014
Firms that have applied for an overdraft or the refinancing of an existing overdraft in the quarters (%)
Credit application outcomes 3rd quarter of 2014 (percentages of firms)
Approved Partially approved (smaller amount than
requested)
Rejected Under examination (not applying next quarter)
Under examination
(applying next quarter)

17
output | materials
apr | DB
RResearch Report I quarter Database (Macrodata)
mayU
| Newsletter (Updates)
jun |
jul | DB
RResearch Report II quarter Database (Macrodata)
augU
| Newsletter (Updates)
sep |
DBoct |R
Research Report III quarter Database (Macrodata)
novU
|
dec |
janU
|
feb DB|R
Research Report IV quarter Database (Macrodata)
mar |
Newsletter (Updates)
Newsletter (Updates)

18
January February March April
May June July August
September October November December
Data Collection and Analysis
Quarterly Report(about the 15th of each indicated release month)
Newsletter – Updates(about the 15th of each indicated release month)
timing | release calendar

19
Quality audit of the services provided will be guaranteed by means of specific project cycle management
procedures and preliminary identification of management responsibilities. Periodic checks and
assessments will allow continuous monitoring of the state of the project and relevant activities, their
compliance with organizational, logistical, time, and quality standards with respect to the expected product
and the program shared with the Client. In case of proven non-compliance, in agreement with the Client,
major determinants will be investigated, and subsequently valid corrective actions will be systematically
implemented. The approach offered by our institute is either simple and structured, as it focuses on eight
priority objectives that are consistent to the ISO9001 certification:
quality plan |
Garantire la sicurezza e la riservatezza
Accurate procedure interne per la sicurezza fisica e logica dei dati e dei deliverable
Garantire la continuità
Corretta allocazione e gestione delle risorse durante la realizzazione del progetto e costante trasferimento del know how
Verificare la soddisfazione del cliente
Monitoraggio periodico dei livelli di soddisfazione del cliente mediante l’utilizzo di strumenti standard (es. Questionari, interviste, …)
Assicurare la qualità dei deliverables
Analisi e revisione della documentazione prodotta a più livelli (es. Responsabile di progetto, Consulenti senior)
Pianificare il progetto
Pianificazione di dettaglio di attività, risorse, tempo, milestones, deliverables
Monitorare l’andamento del progetto
Indicatori quantitativi di performance sulle attivitàsvolte (es. APQ rilevati)
Consuntivare i risultati
Schede di avanzamento lavoro standard per tutta la durata del progetto
Comunicare e condividere i risultati
Riunioni di lavoro ed utilizzo di strumenti informatici per la condivisione dello stato del progetto e della base informativa disponibile
Piano della qualità
1
2
3
45
6
7
8
Ensuring Safety and Confidentiality
Accurate internal procedures aimed at ensuring
physical and logical protection of data and
deliverables
Ensuring Continuity
Allocation and management of resources
over the whole project execution and
constant know-how transfer
Customer Satisfaction
Periodical customer satisfaction analyses
by means of standardized tools
(questionnaires, interviews, ...)
Project Management
Detailed planning of activities, resources,
time, milestones, deliverables
Project Monitoring
Estimation of quantitative activity
performance indicators (e.g. APQ)
Preliminary Results Exploration
Production of reports on the state-of-the-
project over the whole project execution
Sharing of Final Results
Live and remote sharing of final results
and the available information base
by means of meetings and electronic tools
QualityPlan
QUALITY PLAN – PRIORITIES
Quality Assessment of Deliverables
Multi-level assessment and review of
deliverables (by Project Leaders, Senior
Consultants, etc.)
20
rights and ethical code |
RIGHTS
All rights of the Conjunctural Survey of Italian Firms are the property of FormatSrl - ricerche di mercato. It is explicitly prohibited to disclose it to third partiesfor commercial purposes. All the results of the customizations are the propertyof the Client.
ETHICAL CODE
The survey is conducted in respect of the following rules:
� ICC/ESOMAR Code on Market and Social Research
� ASSIRM Code
� Code of the SIS (Italian Statistical Society)
� Italian Law on Privacy D.lgs 196/03

21
Emanuele FinoAccount Researcher
Tel: +39 06 86328681
Email: [email protected]
Scientific
Director
Info
Pierluigi Ascani
Chairman of the Board of Directors
Philosopher. Founder, President and Scientific Director of Format
Research since 1992. Twenty-year experience in marketing research,
customer satisfaction, political, economical and social studies. Adjunct
Professor in Social Research Methods at Sapienza University of Rome,
Faculty of Philosophy.
Mobile: +39 320 7489273
Email: [email protected]
Daniele Serio
Project Leader
Statistician, working in Format Research since 2008. Manager and
coordinator of several quantitative research projects in the area of
economics and its application to financial systems and organizations.
Mobile: +39 345 3397685
Email: [email protected]
references |

22
This document is the base for an oral presentation,without which it has limited significance and maygive rise to misunderstandings.
Reproductions, albeit partial, of the content of thisdocument, are forbidden without previous writtenauthorization by Format.
2015 © Copyright Format Srl – ricerche di mercato
format S.r.l. LEGAL RESIDENCE & OPERATIONAL HEADQUARTER: via ugo balzani 77, 00162 roma, italiatel +39.06.86.32.86.81, fax +39.06.86.38.49.96, email: [email protected]
format nord estOPERATIONAL DIVISION: via caboto 22, 33170 pordenone, italia
vat number: 04268451004economic administrative index: roma 747042joint stock. € 10.340,00 i.v.
www.formatresearch.com