Embed Size (px)
DESCRIPTION
brocade best practives
Citation preview
DATA CENTER
Bottleneck Detection Best Practices Guide
A technical guide to the Brocade® Fabric OS Bottleneck Detection feature to detect latency and traffic congestion bottlenecks in Fibre Channel SANs.
DATA CENTER BEST PRACTICES GUIDE
Bottleneck Detection Best Practices Guide 2 of 2
CONTENTS Introduction..........................................................................................................................................................................................................................................4 Acknowledgements..........................................................................................................................................................................................................................4 Disclaimer.............................................................................................................................................................................................................................................4 Audience and Scope.........................................................................................................................................................................................................................4 Overview................................................................................................................................................................................................................................................4
Storage Administrator Dilemma .....................................................................................................................................5 Bottleneck Detection Feature .......................................................................................................................................................................................................6 Usage—Fabric OS Releases ...........................................................................................................................................................................................................7
Fabric OS Release 6.3.....................................................................................................................................................7 Bottleneckmon Parameters (6.3)............................................................................................................................7 Specifying Ports and Port Ranges ...........................................................................................................................8 CLI Examples ............................................................................................................................................................8 Display Commands ..................................................................................................................................................8
Fabric OS Release 6.4.....................................................................................................................................................9 Bottleneckmon Parameters (6.4)......................................................................................................................... 10 CLI Examples ......................................................................................................................................................... 10 Display Commands ............................................................................................................................................... 11
Deployment Scenarios .................................................................................................................................................................................................................13 Alert-Based Monitoring .................................................................................................................................................................................................................13
Pros................................................................................................................................................................................ 13 Cons ............................................................................................................................................................................... 13
Periodic Monitoring........................................................................................................................................................................................................................13 Pros................................................................................................................................................................................ 14 Cons ............................................................................................................................................................................... 14
Ad Hoc Monitoring..........................................................................................................................................................................................................................14 Pros................................................................................................................................................................................ 14 Cons ............................................................................................................................................................................... 14
Parameter Tuning...........................................................................................................................................................................................................................15 Alerts and Notifications.................................................................................................................................................................................................................15
RASlog............................................................................................................................................................................ 15 Fabric OS 6.3 ................................................................................................................................................................ 15 Fabric OS 6.4 ................................................................................................................................................................ 16
Question: both F-Port and E-Port links?..................................................................................................................................................................................16 Use of Syslog ................................................................................................................................................................. 16
Bottleneck Detection Filter ................................................................................................................................... 16 SNMP ............................................................................................................................................................................. 17
Constraints ........................................................................................................................................................................................................................................17 Workload Virtualization ................................................................................................................................................ 17 Storage Virtualization ................................................................................................................................................... 17
DATA CENTER BEST PRACTICES GUIDE
Bottleneck Detection Best Practices Guide 3 of 3
Brocade 48000 Director .............................................................................................................................................. 17 NPIV ............................................................................................................................................................................... 17
Appendix A: Some Suggested Parameter Settings...........................................................................................................................................................18 Conservative, Normal, Aggressive ............................................................................................................................... 18
Appendix B: Additional Controls in Fabric OS 6.3 and 6.4...............................................................................................................................................19 Affected Seconds.......................................................................................................................................................... 19
Zero Tx Credits Percentage................................................................................................................................... 19 Transmit Utilization ............................................................................................................................................... 19 Example of bottleneckmon alert written to RASlog ............................................................................................ 20
Appendix C: BD MIB.......................................................................................................................................................................................................................21 bdTraps.......................................................................................................................................................................... 21 bdStats .......................................................................................................................................................................... 22
Appendix D: References...............................................................................................................................................................................................................24 Software and Hardware Product Documentation....................................................................................................... 24 Technical Briefs............................................................................................................................................................. 24 Brocade Compatibility Matrix ....................................................................................................................................... 24 Brocade Scalability Guidelines .................................................................................................................................... 24 Brocade SAN Health Support Matrix ........................................................................................................................... 24
DATA CENTER BEST PRACTICES GUIDE
Bottleneck Detection Best Practices Guide 4 of 4
INTRODUCTION This document is a high-level design and best practices guide based on the Fabric OS feature called Bottleneck Detection. The guidelines in this document do not apply to every environment but will help guide you through the decisions that you need to successfully deploy Bottleneck Detection.
It is designed to be an introduction to Bottleneck Detection and provide some guidelines in its use. It is NOT a replacement for information in the various Fabric OS manuals nor is it a recipe in detail on how to implement the feature. Follow-on releases of this document will by necessity lag somewhat behind newer Fabric OS releases and so always refer to the version of the Fabric OS you intend to use to deploy Bottleneck Detection
ACKNOWLEDGEMENTS This document was the result of some successful early implementations of Bottleneck Detection in enterprise infrastructures where the need for more background information and general guidelines on using the facility became very apparent. While many people helped with the creation and review of this document three deserve special mention. Many thanks Rishi Sinha, David Duvall and Geoff Heintz.
DISCLAIMER This document is meant to help administrators understand Bottleneck Detection and suggest how it may be deployed in end user environments. It is NOT intended to supplant information in other Brocade documents such as the Command Reference Manual. Always refer to the Command Reference Manual and other appropriate manuals when setting up Bottleneck Detection in your infrastructures.
AUDIENCE AND SCOPE This guide is for technically focused architects and SAN fabric administrators directly or indirectly responsible for SAN design based on the Brocade product line. It describes a relatively recent feature of the Brocade Fabric OS called Bottleneck Detection and provides a general guide in deploying Bottleneck Detection in large production fabrics. This content is not definitive and must be augmented by more detailed information found in the various Fabric OS manuals referenced in Appendix D.
OVERVIEW Modern Fibre Channel fabrics have evolved from simple SCSI I/O transports over Fibre Channel to much more complex infrastructures today. Fabrics containing thousands of hosts and hundreds of storage ports are now common. I/O levels and consequently traffic volumes, particularly across fabric cores, are much higher.
Fabric usage has also changed. There are more high availability clusters such as IBM HACMP, VMware and Windows. Workload has also become much more complex. Instead of simple host target port pairs we now see Hypervisors such as VMware VSphere, Windows Hyper-V and IBM VIOS servicing large numbers of virtualized hosts. This makes it much more difficult to isolate application problems when application performance becomes a problem.
Storage virtualization has created its own special I/O requirements, adding a degree of complexity to the I/O complex previously unseen outside of very complex mainframe environments.
All this has a serious impact on storage and particularly fabric problem determination. There are more entities to mange such as LUNS, hosts, storage, virtual machines, more things to go wrong and the operational environment is much more difficult to troubleshoot then even a few years ago. Rogue or badly behaving devices have much more impact on production environment than previously and management tools have not kept up with the changes.
We increasingly see virtualized host clusters running in hypervisor clusters accessing virtualized storage: an infrastructural perfect storm waiting to happen.
DATA CENTER BEST PRACTICES GUIDE
Bottleneck Detection Best Practices Guide 5 of 5
Much of the new behaviors generate by the innovation in the workload and storage infrastructures have generated a corresponding difference in fabric traffic patterns and fabric manageability. We have observed, for example, a significant increase in very short frames such as those encapsulating SCSI Reserves and in-band Fibre Channel control frames used by workload and storage virtualization products.
N-Port ID Virtualization (NPIV) hides flow information that was previously reported on individual ports.
The result of all this change is that we see increasing issues with application performance that seem to be associated with storage performance in some way but which cannot be sufficiently identified to result in some form of corrective action.
Storage Administrator Dilemma When application performance problems become obvious the storage complex is frequently blamed. Storage administrators usually have no metrics that might point to some other component in the infrastructure. Frequently the result is very long delays before the culprit or culprits are identified and measures taken to address the problem. The impact of such outages ranges from an inconvenience to a massive outage where mission critical application availability is compromised and the enterprise is seriously affected. The experience is never positive.
Brocade recognized the need for better problem determination aids and has started a series of initiatives to address the problem of relevant performance and problem determination metrics in the fabric. Bottleneck Detection is one of the first results of this work. Bottleneck Detection is designed to positively identify bottlenecks in the fabric.
Two types of bottlenecks are detected:
• Bandwidth-based determined by high link utilization. These are called “Congestion Bottlenecks”. Congestion bottlenecks are relatively easy to detect and, in effect can be detected by other Brocade products such as Fabric Watch. Bottleneck Detection provides an alternative mechanism and more information about the congestion.
• Device latency-based bottlenecks, called “Latency Bottlenecks” are much more difficult to detect. This is the primary focus of Bottleneck Detection and much of the remainder of this paper will concentrate on latency bottlenecks.
Latency detection is frame-based and identifies buffer credit problems. One of the major strength of Fibre Channel is that it creates lossless connections by implementing a flow control scheme based on buffer credits. The disadvantage of such an approach is that the number of available buffers is limited and may eventually be totally consumed.
The temporary unavailability of buffer credits creates a temporary bottleneck. The longer the credits are unavailable, the more serious the bottleneck. Some temporary credit loss is expected in normal Fibre Channel operation. It is the longer durations that concern use here.
Long periods without buffer credits are typically manifested as performance problems and are usually the result of device latencies. Exceptional situations cause fabric back pressure that can extend all the way across the fabric and back. Excessive back pressure can create serious problems in an operational SAN.
Chronic back pressure can exacerbate the effect of hardware failures and misbehaving devices and also contribute to serious operational issues as the existence of existing bottlenecks will increase the probability of a failure.
There are several common sources of high latencies:
• Storage ports (targets) often produce latencies that can slow down applications because they do not deliver data at the rate expected by the host platform. Even well-architected storage array performance can deteriorate over time. For example, LUN provisioning policies such as putting too many LUNs behind a given port can contribute to poor performance of the storage if the control processor in the
DATA CENTER BEST PRACTICES GUIDE
Bottleneck Detection Best Practices Guide 6 of 6
array cannot deliver data from all the LUNs quickly enough to satisfy read requests. The overheads of dealing with a very large number of LUNSs may the cause for the slow delivery.
• Hosts (initiators) may also produce significant latencies by requesting more data than they are capable of processing in a timely manner.
• Distance links can frequently consume all the buffer credits reserved for them and create a serious bottleneck in the middle of a fabric that can have serious consequences for any applications sharing that link.
• Misbehaving devices such as defective HBAs can create havoc in a well-constructed SAN and increase the threat to the fabric.
Eliminating bottlenecks will contribute to the overall stability of a fabric by reducing the effects of other events in the SAN. Back pressure in the fabric produced by latencies and congestion will exacerbate the effects of other events in a SAN and reduce the ability of the fabric to deal with problems such as misbehaving devices. At best application performance will be impacted. In extreme cases, SAN outages can occur.
BOTTLENECK DETECTION FEATURE Bottleneck Detection is a feature integrated into the base Fabric OS that detects device latencies and link congestion and optionally generates alerts based on thresholds. Depending on where it is activated and what ports are monitored Bottleneck Detection will identify bottlenecks
• Originating in devices (F-ports – latencies and bandwidth congestion) and
• Existing in ISLs (E-Ports and EX-Ports - bandwidth congestion and latencies). Note that director chassis containing Inter Chassis Links (ICLs) are also candidates for Bottleneck Detection monitoring.
Functionality is provided that monitors R-RDY and available bandwidth to determine if a latency exists on an F-Port or E-Port or that bandwidth is consistently 95% or greater of link capacity. For device latencies we assume that if no credit is available for 98% of a given second then the connected device is assumed to have latency. We consider a link that is utilized at 95% capacity or greater to be congested.
Bottleneckmon makes a calculation to determine an “affected second.” The parameters used to calculate an affected second are the percentage of time when there are zero transmit buffer credits and the transmit utilization of the port over a second. Affected seconds are counted over a time interval and alerts are generated if the number of affected seconds exceeds a predefined threshold.
Bottleneckmon measurement metric:
• Bottleneck measurement is a percentage over a configurable averaging interval
• It is a percentage of affected 1-second periods over the averaging interval.
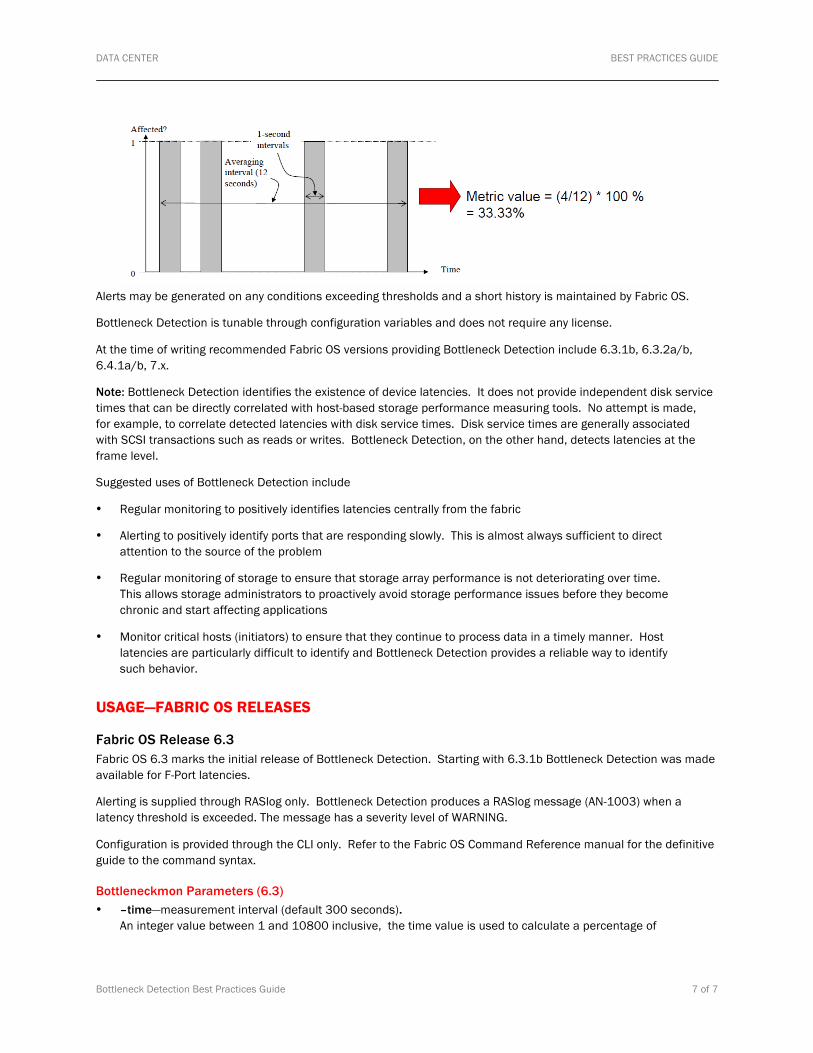
The figure below demonstrates affected seconds graphically. Here we see four affected seconds over an averaging interval of 12 seconds. If we wanted Bottleneck Detection to catch this situation we would have an interval of 12 seconds and a threshold level of .33 or 33%.
Note: In extreme cases, the definition of affected seconds can be altered for latencies only. Refer to Appendix B below to see how to do this in Fabric OS releases 6.3 and 6.4.
DATA CENTER BEST PRACTICES GUIDE
Bottleneck Detection Best Practices Guide 7 of 7
Alerts may be generated on any conditions exceeding thresholds and a short history is maintained by Fabric OS.
Bottleneck Detection is tunable through configuration variables and does not require any license.
At the time of writing recommended Fabric OS versions providing Bottleneck Detection include 6.3.1b, 6.3.2a/b, 6.4.1a/b, 7.x.
Note: Bottleneck Detection identifies the existence of device latencies. It does not provide independent disk service times that can be directly correlated with host-based storage performance measuring tools. No attempt is made, for example, to correlate detected latencies with disk service times. Disk service times are generally associated with SCSI transactions such as reads or writes. Bottleneck Detection, on the other hand, detects latencies at the frame level.
Suggested uses of Bottleneck Detection include
• Regular monitoring to positively identifies latencies centrally from the fabric
• Alerting to positively identify ports that are responding slowly. This is almost always sufficient to direct attention to the source of the problem
• Regular monitoring of storage to ensure that storage array performance is not deteriorating over time. This allows storage administrators to proactively avoid storage performance issues before they become chronic and start affecting applications
• Monitor critical hosts (initiators) to ensure that they continue to process data in a timely manner. Host latencies are particularly difficult to identify and Bottleneck Detection provides a reliable way to identify such behavior.
USAGE—FABRIC OS RELEASES
Fabric OS Release 6.3 Fabric OS 6.3 marks the initial release of Bottleneck Detection. Starting with 6.3.1b Bottleneck Detection was made available for F-Port latencies.
Alerting is supplied through RASlog only. Bottleneck Detection produces a RASlog message (AN-1003) when a latency threshold is exceeded. The message has a severity level of WARNING.
Configuration is provided through the CLI only. Refer to the Fabric OS Command Reference manual for the definitive guide to the command syntax.
Bottleneckmon Parameters (6.3) • –time—measurement interval (default 300 seconds).
An integer value between 1 and 10800 inclusive, the time value is used to calculate a percentage of
DATA CENTER BEST PRACTICES GUIDE
Bottleneck Detection Best Practices Guide 8 of 8
affected seconds that is compared to the threshold percentage to determine if an alert can be generated.
• –qtime—reporting interval (default 300 seconds) An integer value between 1 and 10800 inclusive, the quiet time value is the minimum amount of time in seconds between alerts for a port. Alerts will be suppressed until the quiet time has been satisfied.
• –thresh—latency threshold (minimum % of –time when a latency detected) default (.1 or 10%) A decimal value with 3 digits of precision between 0 and 1, when the value is multiplied by 100 it gives a latency threshold percentage. When the percentage of affected seconds over the time value is greater than the latency threshold percentage an alert can be produced depending on the quiet time setting.
• -–alert—Adding this parameter specifies that an alert be generated when a threshold is exceeded.
• –show—Displays a history of the bottleneck severity on the specified port. The output shows the percentage of one-second intervals affected by the bottleneck condition within the specified time interval. This command succeeds only on online F_Ports.
• –interval interval_size—Specifies the time window in seconds over which the bottlenecking percentage is displayed in the output. The maximum interval is 10800 seconds. The default is 10 seconds.
• –span span_size—Specifies the total duration in seconds covered in the output. History data are maintained for a maximum of three hours per port, so the span can be 10800 seconds at most.
• –status—Lists the ports for which bottleneck detection is enabled in the current logical switch along with alert configuration settings. The ports may have been moved to a different logical switch but are still shown if their configuration is retained.
Specifying Ports and Port Ranges Ports may be specified by port number, port index number, port ranges by slot 2/0-5 or wild card “*” to specify all ports. Note that there is a constraint on 48000 directors only that no more than 100 ports be monitored at a time. Port numbers and ranges may be supplied in a list as the last parameters on the command line.
Parameter values are activated only when the monitors are enabled. You must disable monitors first before a parameter value may be changed.
CLI Examples bottleneckmon ––enable –alert 2/1 2/5-15 2/18-21 Enable Bottleneck Detection using defaults on ports 1, 5 to 15 and 18 to 21 on blade 2
Bottleneckmon ––enable –alert –thresh 0.2 –time 30 /0-31 Enable Bottleneck Detection on blade 1, ports 0 to 31 with a threshold of 20% and a time interval of 30 seconds
Bottleneckmon ––disable “*” Disable Bottleneck Detection on all ports
Bottleneckmon -––disable 2/1 2/12-15 Disable Bottleneck Detection on ports 1 and 12 to 15 on blade 2.
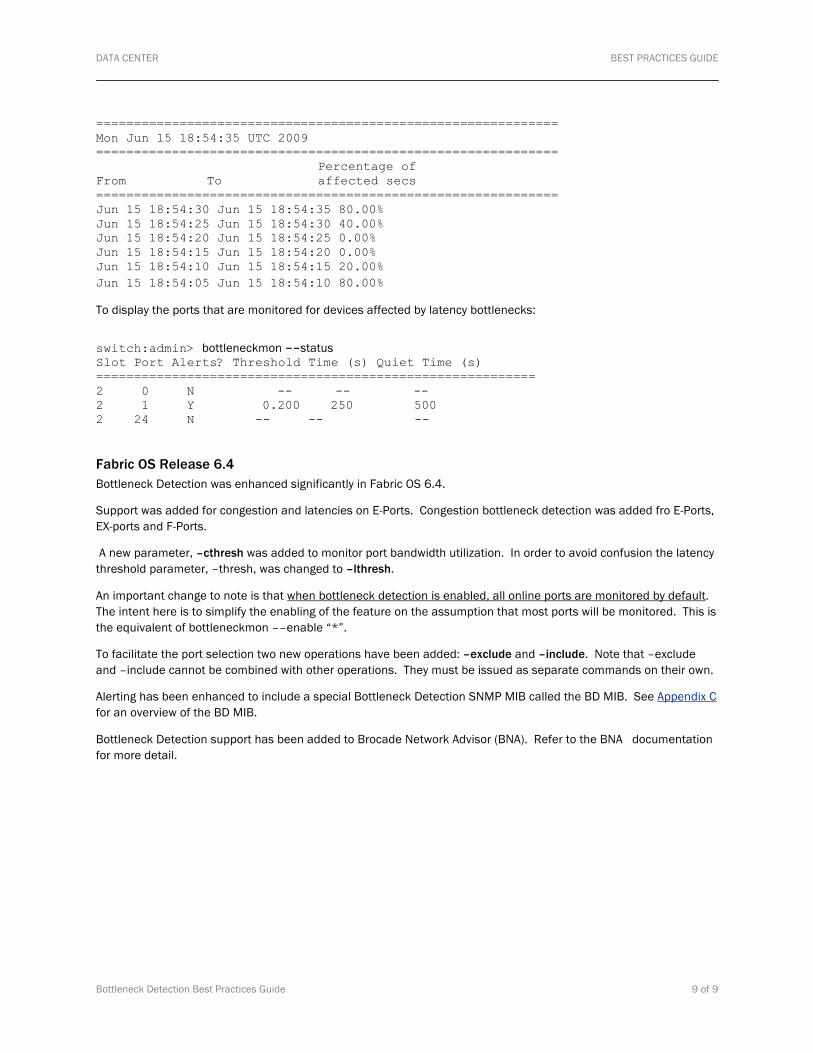
Display Commands To display bottleneck statistics on a specified port:
switch:admin> bottleneckmon ––show –interval 5 –span 30 2/24
DATA CENTER BEST PRACTICES GUIDE
Bottleneck Detection Best Practices Guide 9 of 9
============================================================= Mon Jun 15 18:54:35 UTC 2009 =============================================================
Percentage of From To affected secs ============================================================= Jun 15 18:54:30 Jun 15 18:54:35 80.00% Jun 15 18:54:25 Jun 15 18:54:30 40.00% Jun 15 18:54:20 Jun 15 18:54:25 0.00% Jun 15 18:54:15 Jun 15 18:54:20 0.00% Jun 15 18:54:10 Jun 15 18:54:15 20.00% Jun 15 18:54:05 Jun 15 18:54:10 80.00%
To display the ports that are monitored for devices affected by latency bottlenecks:
switch:admin> bottleneckmon --status Slot Port Alerts? Threshold Time (s) Quiet Time (s) ========================================================== 2 0 N -- -- -- 2 1 Y 0.200 250 500 2 24 N -- -- --
Fabric OS Release 6.4 Bottleneck Detection was enhanced significantly in Fabric OS 6.4.
Support was added for congestion and latencies on E-Ports. Congestion bottleneck detection was added fro E-Ports, EX-ports and F-Ports.
A new parameter, –cthresh was added to monitor port bandwidth utilization. In order to avoid confusion the latency threshold parameter, –thresh, was changed to –lthresh.
An important change to note is that when bottleneck detection is enabled, all online ports are monitored by default. The intent here is to simplify the enabling of the feature on the assumption that most ports will be monitored. This is the equivalent of bottleneckmon ––enable “*”.
To facilitate the port selection two new operations have been added: –exclude and –include. Note that –exclude and –include cannot be combined with other operations. They must be issued as separate commands on their own.
Alerting has been enhanced to include a special Bottleneck Detection SNMP MIB called the BD MIB. See Appendix C for an overview of the BD MIB.
Bottleneck Detection support has been added to Brocade Network Advisor (BNA). Refer to the BNA documentation for more detail.
DATA CENTER BEST PRACTICES GUIDE
Bottleneck Detection Best Practices Guide 10 of 10
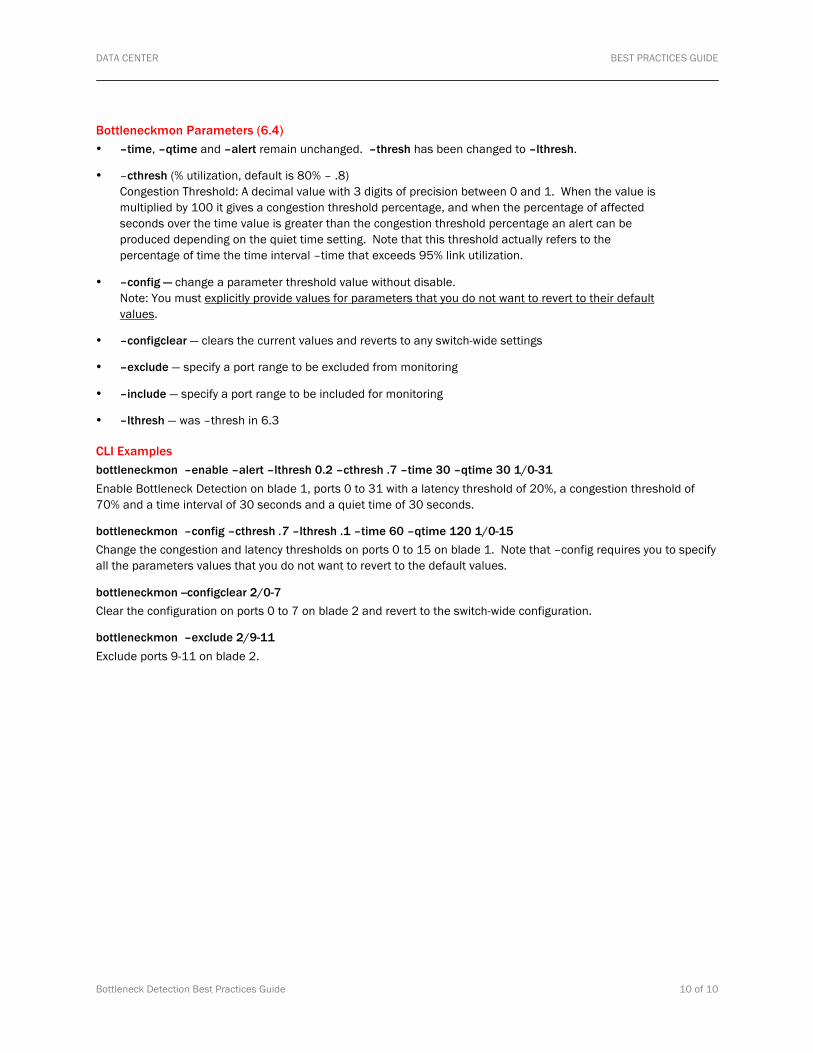
Bottleneckmon Parameters (6.4) • –time, –qtime and –alert remain unchanged. –thresh has been changed to –lthresh.
• –cthresh (% utilization, default is 80% – .8) Congestion Threshold: A decimal value with 3 digits of precision between 0 and 1. When the value is multiplied by 100 it gives a congestion threshold percentage, and when the percentage of affected seconds over the time value is greater than the congestion threshold percentage an alert can be produced depending on the quiet time setting. Note that this threshold actually refers to the percentage of time the time interval –time that exceeds 95% link utilization.
• –config — change a parameter threshold value without disable. Note: You must explicitly provide values for parameters that you do not want to revert to their default values.
• –configclear — clears the current values and reverts to any switch-wide settings
• –exclude — specify a port range to be excluded from monitoring
• –include — specify a port range to be included for monitoring
• –lthresh — was –thresh in 6.3
CLI Examples bottleneckmon –enable –alert –lthresh 0.2 –cthresh .7 –time 30 –qtime 30 1/0-31 Enable Bottleneck Detection on blade 1, ports 0 to 31 with a latency threshold of 20%, a congestion threshold of 70% and a time interval of 30 seconds and a quiet time of 30 seconds.
bottleneckmon –config –cthresh .7 –lthresh .1 –time 60 –qtime 120 1/0-15 Change the congestion and latency thresholds on ports 0 to 15 on blade 1. Note that –config requires you to specify all the parameters values that you do not want to revert to the default values.
bottleneckmon --configclear 2/0-7 Clear the configuration on ports 0 to 7 on blade 2 and revert to the switch-wide configuration.
bottleneckmon –exclude 2/9-11 Exclude ports 9-11 on blade 2.
DATA CENTER BEST PRACTICES GUIDE
Bottleneck Detection Best Practices Guide 11 of 11
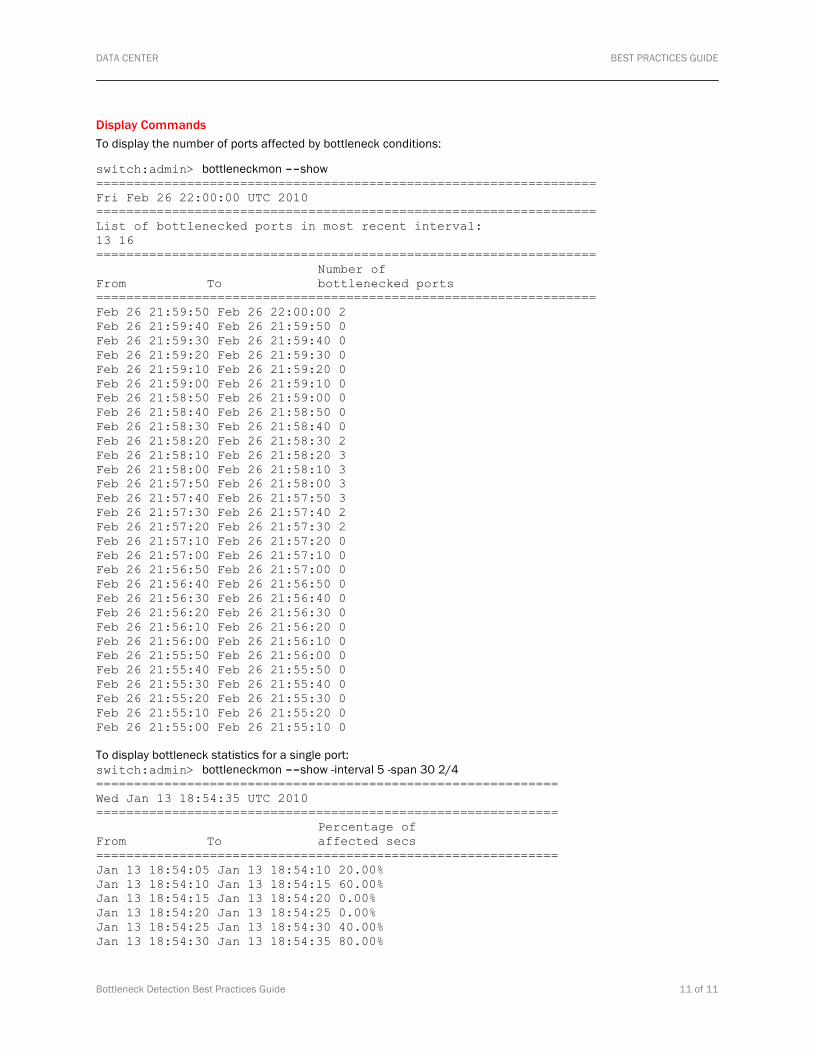
Display Commands To display the number of ports affected by bottleneck conditions:
switch:admin> bottleneckmon --show ================================================================== Fri Feb 26 22:00:00 UTC 2010 ================================================================== List of bottlenecked ports in most recent interval: 13 16 ==================================================================
Number of From To bottlenecked ports ================================================================== Feb 26 21:59:50 Feb 26 22:00:00 2 Feb 26 21:59:40 Feb 26 21:59:50 0 Feb 26 21:59:30 Feb 26 21:59:40 0 Feb 26 21:59:20 Feb 26 21:59:30 0 Feb 26 21:59:10 Feb 26 21:59:20 0 Feb 26 21:59:00 Feb 26 21:59:10 0 Feb 26 21:58:50 Feb 26 21:59:00 0 Feb 26 21:58:40 Feb 26 21:58:50 0 Feb 26 21:58:30 Feb 26 21:58:40 0 Feb 26 21:58:20 Feb 26 21:58:30 2 Feb 26 21:58:10 Feb 26 21:58:20 3 Feb 26 21:58:00 Feb 26 21:58:10 3 Feb 26 21:57:50 Feb 26 21:58:00 3 Feb 26 21:57:40 Feb 26 21:57:50 3 Feb 26 21:57:30 Feb 26 21:57:40 2 Feb 26 21:57:20 Feb 26 21:57:30 2 Feb 26 21:57:10 Feb 26 21:57:20 0 Feb 26 21:57:00 Feb 26 21:57:10 0 Feb 26 21:56:50 Feb 26 21:57:00 0 Feb 26 21:56:40 Feb 26 21:56:50 0 Feb 26 21:56:30 Feb 26 21:56:40 0 Feb 26 21:56:20 Feb 26 21:56:30 0 Feb 26 21:56:10 Feb 26 21:56:20 0 Feb 26 21:56:00 Feb 26 21:56:10 0 Feb 26 21:55:50 Feb 26 21:56:00 0 Feb 26 21:55:40 Feb 26 21:55:50 0 Feb 26 21:55:30 Feb 26 21:55:40 0 Feb 26 21:55:20 Feb 26 21:55:30 0 Feb 26 21:55:10 Feb 26 21:55:20 0 Feb 26 21:55:00 Feb 26 21:55:10 0 To display bottleneck statistics for a single port: switch:admin> bottleneckmon --show -interval 5 -span 30 2/4 ============================================================= Wed Jan 13 18:54:35 UTC 2010 =============================================================
Percentage of From To affected secs ============================================================= Jan 13 18:54:05 Jan 13 18:54:10 20.00% Jan 13 18:54:10 Jan 13 18:54:15 60.00% Jan 13 18:54:15 Jan 13 18:54:20 0.00% Jan 13 18:54:20 Jan 13 18:54:25 0.00% Jan 13 18:54:25 Jan 13 18:54:30 40.00% Jan 13 18:54:30 Jan 13 18:54:35 80.00%
DATA CENTER BEST PRACTICES GUIDE
Bottleneck Detection Best Practices Guide 12 of 12
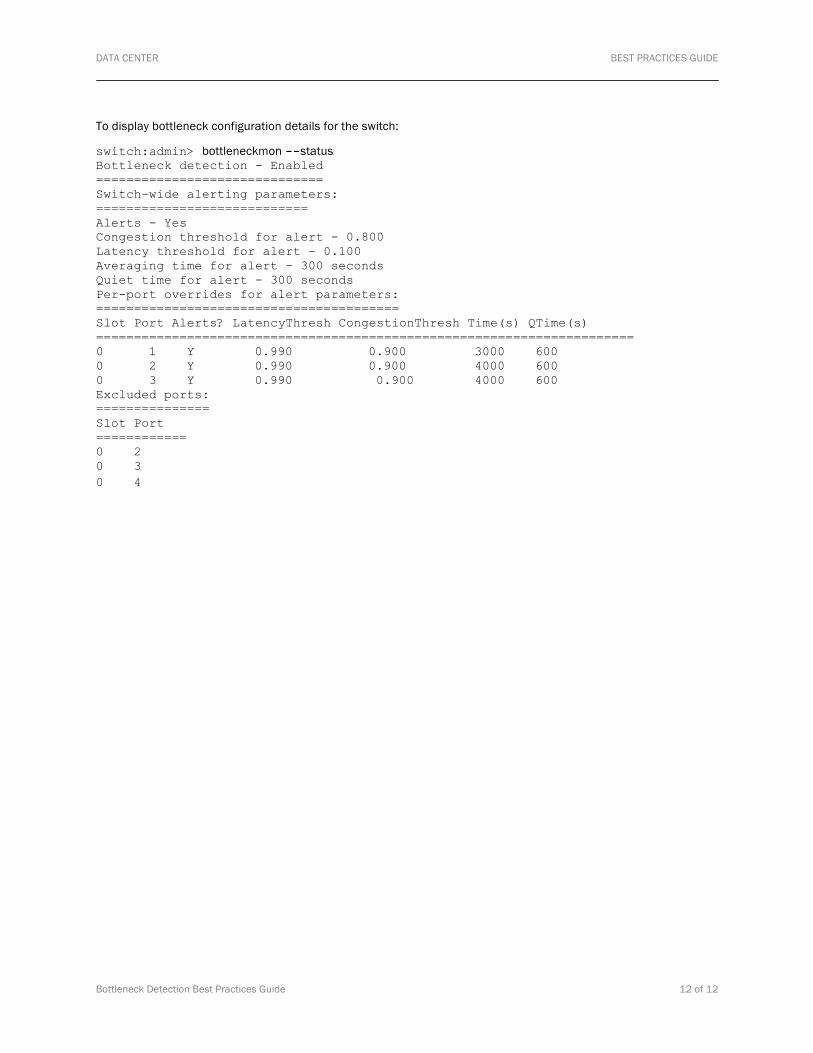
To display bottleneck configuration details for the switch:
switch:admin> bottleneckmon --status Bottleneck detection - Enabled ============================== Switch-wide alerting parameters: ============================ Alerts - Yes Congestion threshold for alert - 0.800 Latency threshold for alert - 0.100 Averaging time for alert - 300 seconds Quiet time for alert - 300 seconds Per-port overrides for alert parameters: ======================================== Slot Port Alerts? LatencyThresh CongestionThresh Time(s) QTime(s) ======================================================================= 0 1 Y 0.990 0.900 3000 600 0 2 Y 0.990 0.900 4000 600 0 3 Y 0.990 0.900 4000 600 Excluded ports: =============== Slot Port ============ 0 2 0 3 0 4
DATA CENTER BEST PRACTICES GUIDE
Bottleneck Detection Best Practices Guide 13 of 13
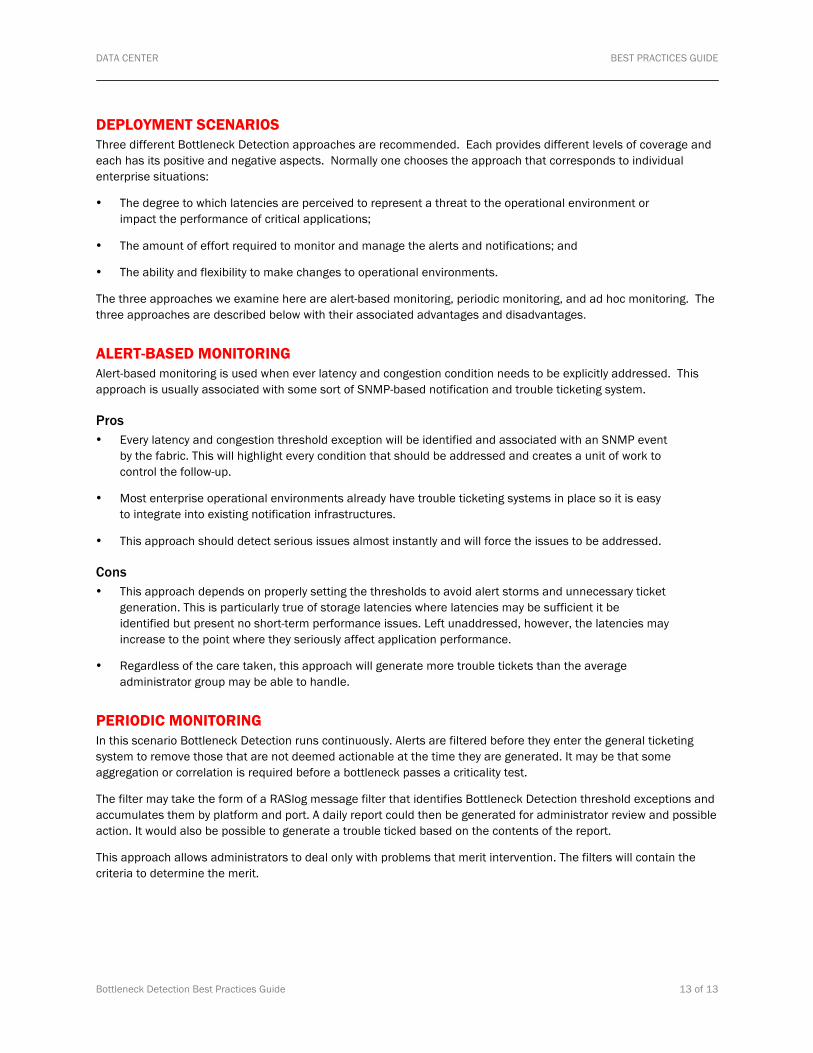
DEPLOYMENT SCENARIOS Three different Bottleneck Detection approaches are recommended. Each provides different levels of coverage and each has its positive and negative aspects. Normally one chooses the approach that corresponds to individual enterprise situations:
• The degree to which latencies are perceived to represent a threat to the operational environment or impact the performance of critical applications;
• The amount of effort required to monitor and manage the alerts and notifications; and
• The ability and flexibility to make changes to operational environments.
The three approaches we examine here are alert-based monitoring, periodic monitoring, and ad hoc monitoring. The three approaches are described below with their associated advantages and disadvantages.
ALERT-BASED MONITORING Alert-based monitoring is used when ever latency and congestion condition needs to be explicitly addressed. This approach is usually associated with some sort of SNMP-based notification and trouble ticketing system.
Pros • Every latency and congestion threshold exception will be identified and associated with an SNMP event
by the fabric. This will highlight every condition that should be addressed and creates a unit of work to control the follow-up.
• Most enterprise operational environments already have trouble ticketing systems in place so it is easy to integrate into existing notification infrastructures.
• This approach should detect serious issues almost instantly and will force the issues to be addressed.
Cons • This approach depends on properly setting the thresholds to avoid alert storms and unnecessary ticket
generation. This is particularly true of storage latencies where latencies may be sufficient it be identified but present no short-term performance issues. Left unaddressed, however, the latencies may increase to the point where they seriously affect application performance.
• Regardless of the care taken, this approach will generate more trouble tickets than the average administrator group may be able to handle.
PERIODIC MONITORING In this scenario Bottleneck Detection runs continuously. Alerts are filtered before they enter the general ticketing system to remove those that are not deemed actionable at the time they are generated. It may be that some aggregation or correlation is required before a bottleneck passes a criticality test.
The filter may take the form of a RASlog message filter that identifies Bottleneck Detection threshold exceptions and accumulates them by platform and port. A daily report could then be generated for administrator review and possible action. It would also be possible to generate a trouble ticked based on the contents of the report.
This approach allows administrators to deal only with problems that merit intervention. The filters will contain the criteria to determine the merit.
DATA CENTER BEST PRACTICES GUIDE
Bottleneck Detection Best Practices Guide 14 of 14
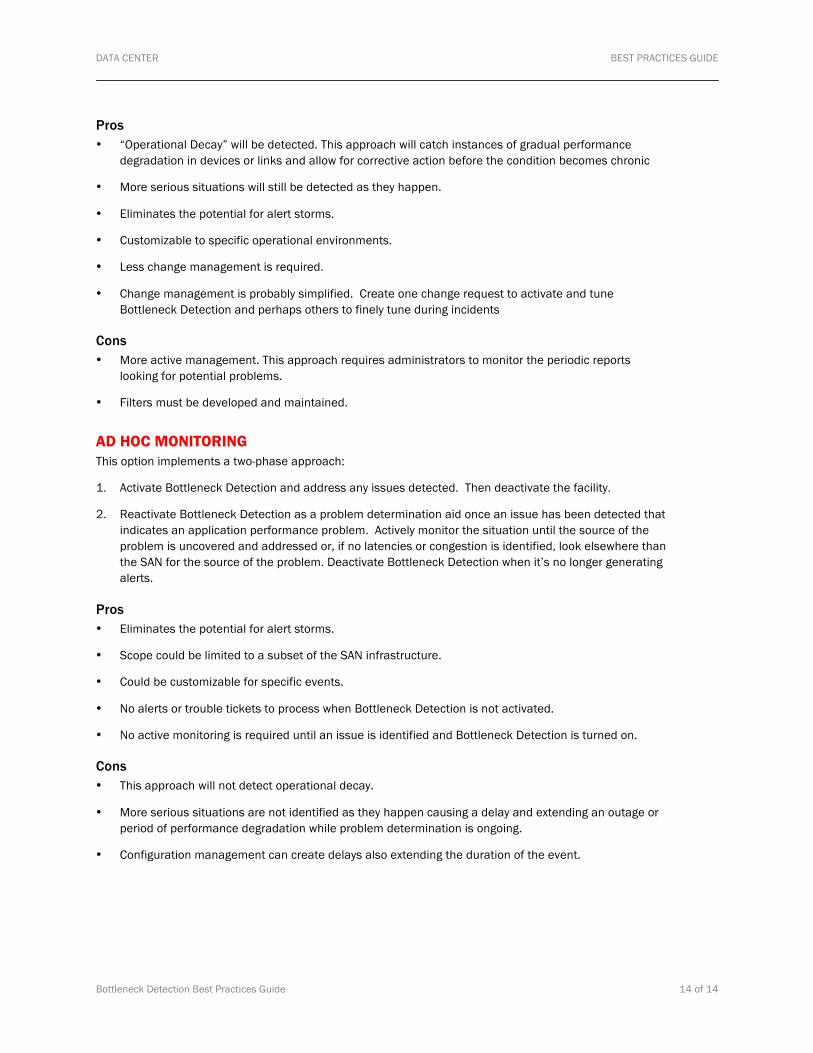
Pros • “Operational Decay” will be detected. This approach will catch instances of gradual performance
degradation in devices or links and allow for corrective action before the condition becomes chronic
• More serious situations will still be detected as they happen.
• Eliminates the potential for alert storms.
• Customizable to specific operational environments.
• Less change management is required.
• Change management is probably simplified. Create one change request to activate and tune Bottleneck Detection and perhaps others to finely tune during incidents
Cons • More active management. This approach requires administrators to monitor the periodic reports
looking for potential problems.
• Filters must be developed and maintained.
AD HOC MONITORING This option implements a two-phase approach:
1. Activate Bottleneck Detection and address any issues detected. Then deactivate the facility.
2. Reactivate Bottleneck Detection as a problem determination aid once an issue has been detected that indicates an application performance problem. Actively monitor the situation until the source of the problem is uncovered and addressed or, if no latencies or congestion is identified, look elsewhere than the SAN for the source of the problem. Deactivate Bottleneck Detection when it’s no longer generating alerts.
Pros • Eliminates the potential for alert storms.
• Scope could be limited to a subset of the SAN infrastructure.
• Could be customizable for specific events.
• No alerts or trouble tickets to process when Bottleneck Detection is not activated.
• No active monitoring is required until an issue is identified and Bottleneck Detection is turned on.
Cons • This approach will not detect operational decay.
• More serious situations are not identified as they happen causing a delay and extending an outage or period of performance degradation while problem determination is ongoing.
• Configuration management can create delays also extending the duration of the event.
DATA CENTER BEST PRACTICES GUIDE
Bottleneck Detection Best Practices Guide 15 of 15
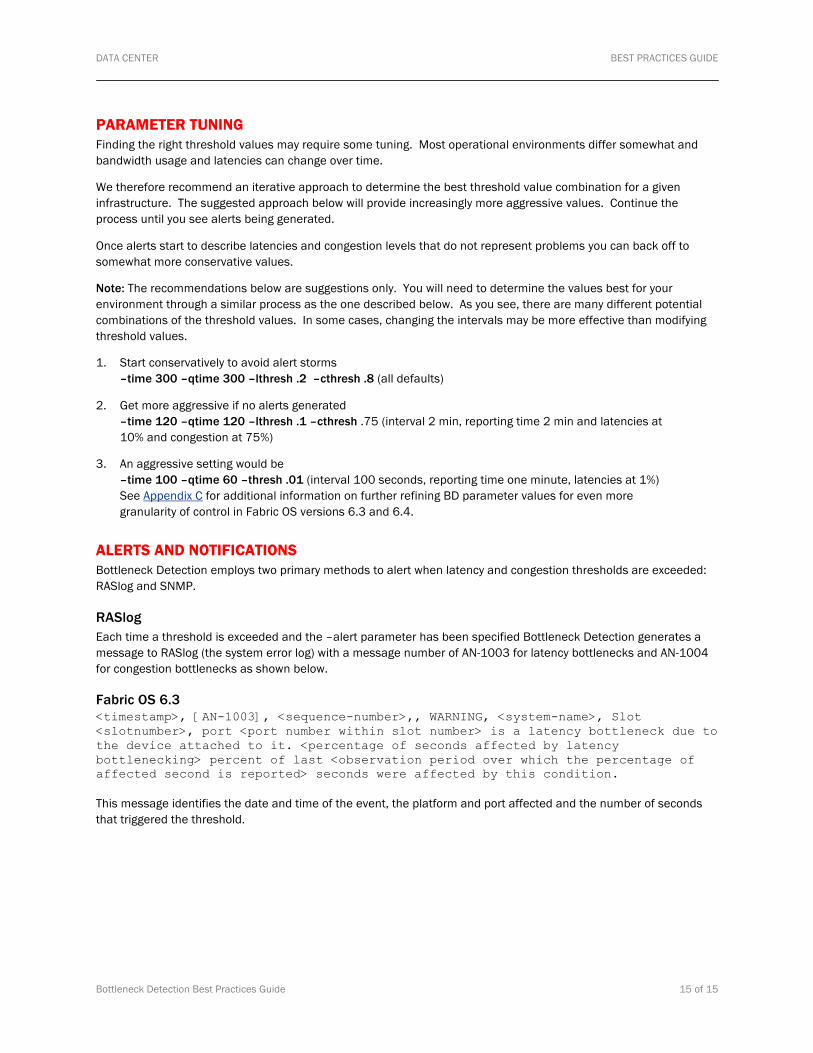
PARAMETER TUNING Finding the right threshold values may require some tuning. Most operational environments differ somewhat and bandwidth usage and latencies can change over time.
We therefore recommend an iterative approach to determine the best threshold value combination for a given infrastructure. The suggested approach below will provide increasingly more aggressive values. Continue the process until you see alerts being generated.
Once alerts start to describe latencies and congestion levels that do not represent problems you can back off to somewhat more conservative values.
Note: The recommendations below are suggestions only. You will need to determine the values best for your environment through a similar process as the one described below. As you see, there are many different potential combinations of the threshold values. In some cases, changing the intervals may be more effective than modifying threshold values.
1. Start conservatively to avoid alert storms –time 300 –qtime 300 –lthresh .2 –cthresh .8 (all defaults)
2. Get more aggressive if no alerts generated –time 120 –qtime 120 –lthresh .1 –cthresh .75 (interval 2 min, reporting time 2 min and latencies at 10% and congestion at 75%)
3. An aggressive setting would be –time 100 –qtime 60 –thresh .01 (interval 100 seconds, reporting time one minute, latencies at 1%) See Appendix C for additional information on further refining BD parameter values for even more granularity of control in Fabric OS versions 6.3 and 6.4.
ALERTS AND NOTIFICATIONS Bottleneck Detection employs two primary methods to alert when latency and congestion thresholds are exceeded: RASlog and SNMP.
RASlog Each time a threshold is exceeded and the –alert parameter has been specified Bottleneck Detection generates a message to RASlog (the system error log) with a message number of AN-1003 for latency bottlenecks and AN-1004 for congestion bottlenecks as shown below.
Fabric OS 6.3 <timestamp>, [AN-1003], <sequence-number>,, WARNING, <system-name>, Slot <slotnumber>, port <port number within slot number> is a latency bottleneck due to the device attached to it. <percentage of seconds affected by latency bottlenecking> percent of last <observation period over which the percentage of affected second is reported> seconds were affected by this condition. This message identifies the date and time of the event, the platform and port affected and the number of seconds that triggered the threshold.
DATA CENTER BEST PRACTICES GUIDE
Bottleneck Detection Best Practices Guide 16 of 16
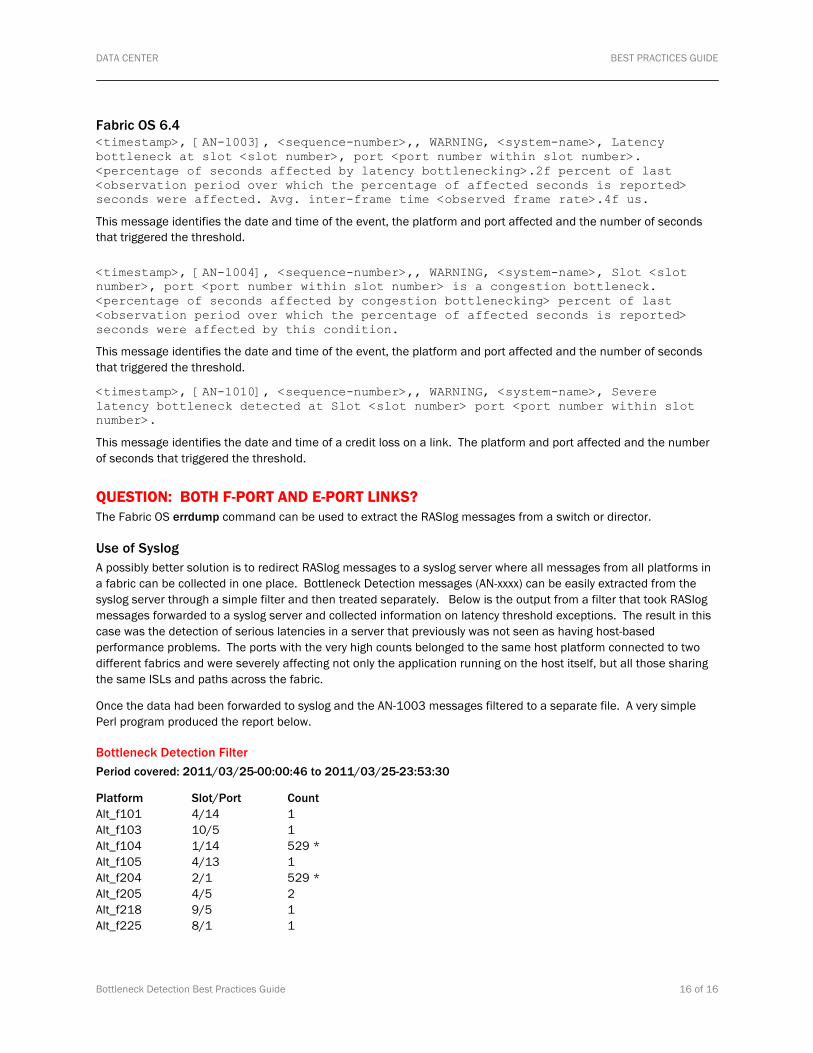
Fabric OS 6.4 <timestamp>, [AN-1003], <sequence-number>,, WARNING, <system-name>, Latency bottleneck at slot <slot number>, port <port number within slot number>. <percentage of seconds affected by latency bottlenecking>.2f percent of last <observation period over which the percentage of affected seconds is reported> seconds were affected. Avg. inter-frame time <observed frame rate>.4f us.
This message identifies the date and time of the event, the platform and port affected and the number of seconds that triggered the threshold.
<timestamp>, [AN-1004], <sequence-number>,, WARNING, <system-name>, Slot <slot number>, port <port number within slot number> is a congestion bottleneck. <percentage of seconds affected by congestion bottlenecking> percent of last <observation period over which the percentage of affected seconds is reported> seconds were affected by this condition.
This message identifies the date and time of the event, the platform and port affected and the number of seconds that triggered the threshold.
<timestamp>, [AN-1010], <sequence-number>,, WARNING, <system-name>, Severe latency bottleneck detected at Slot <slot number> port <port number within slot number>.
This message identifies the date and time of a credit loss on a link. The platform and port affected and the number of seconds that triggered the threshold.
QUESTION: BOTH F-PORT AND E-PORT LINKS? The Fabric OS errdump command can be used to extract the RASlog messages from a switch or director.
Use of Syslog A possibly better solution is to redirect RASlog messages to a syslog server where all messages from all platforms in a fabric can be collected in one place. Bottleneck Detection messages (AN-xxxx) can be easily extracted from the syslog server through a simple filter and then treated separately. Below is the output from a filter that took RASlog messages forwarded to a syslog server and collected information on latency threshold exceptions. The result in this case was the detection of serious latencies in a server that previously was not seen as having host-based performance problems. The ports with the very high counts belonged to the same host platform connected to two different fabrics and were severely affecting not only the application running on the host itself, but all those sharing the same ISLs and paths across the fabric.
Once the data had been forwarded to syslog and the AN-1003 messages filtered to a separate file. A very simple Perl program produced the report below.
Bottleneck Detection Filter Period covered: 2011/03/25-00:00:46 to 2011/03/25-23:53:30
Platform Slot/Port Count Alt_f101 4/14 1 Alt_f103 10/5 1 Alt_f104 1/14 529 * Alt_f105 4/13 1 Alt_f204 2/1 529 * Alt_f205 4/5 2 Alt_f218 9/5 1 Alt_f225 8/1 1
DATA CENTER BEST PRACTICES GUIDE
Bottleneck Detection Best Practices Guide 17 of 17
SNMP A separate Bottleneck Detection MIB, called BD MIB was created in Fabric OS 6.4.0. Refer to Appendix C and the Brocade Fabric OS MIB manual for further details.
CONSTRAINTS There are limits to which Bottleneck Detection can detect latency or congestion events. This is primarily because Bottleneck Detection operates on ports and not flows. Some constraints are described below.
Workload Virtualization • It is difficult to identify individual virtual machines unless they have complete control of a port.
Hypervisors can hide flow detail very effectively so that the source of congestion will appear to be the hypervisor rather than an offending virtual machine.
• Storage access serialization adds overhead and can contribute to latency bottlenecks. An example of this is where storage locking is implemented through SCSI Reserves.
Storage Virtualization In band virtualized storage controllers are both initiators and targets. While congestion and latencies can be identified on both the storage controller and any storage attached to it, it is more difficult to determine where the actual problem can be from the perspective of applications accessing virtualized LUNs.
Most virtualized storage solutions use Fibre Channel in band for control purposes which can increases potential for latency and congestion bottlenecks.
Brocade 48000 Director There is a constraint in Brocade 48000 directors where the number of monitored ports should not exceed 100.
NPIV N-Port ID Virtualization hides flow detail by multiplexing many flows across a single physical link. There is no way to identify the offending flow. This situation is most common in blade-based systems.
DATA CENTER BEST PRACTICES GUIDE
Bottleneck Detection Best Practices Guide 18 of 18
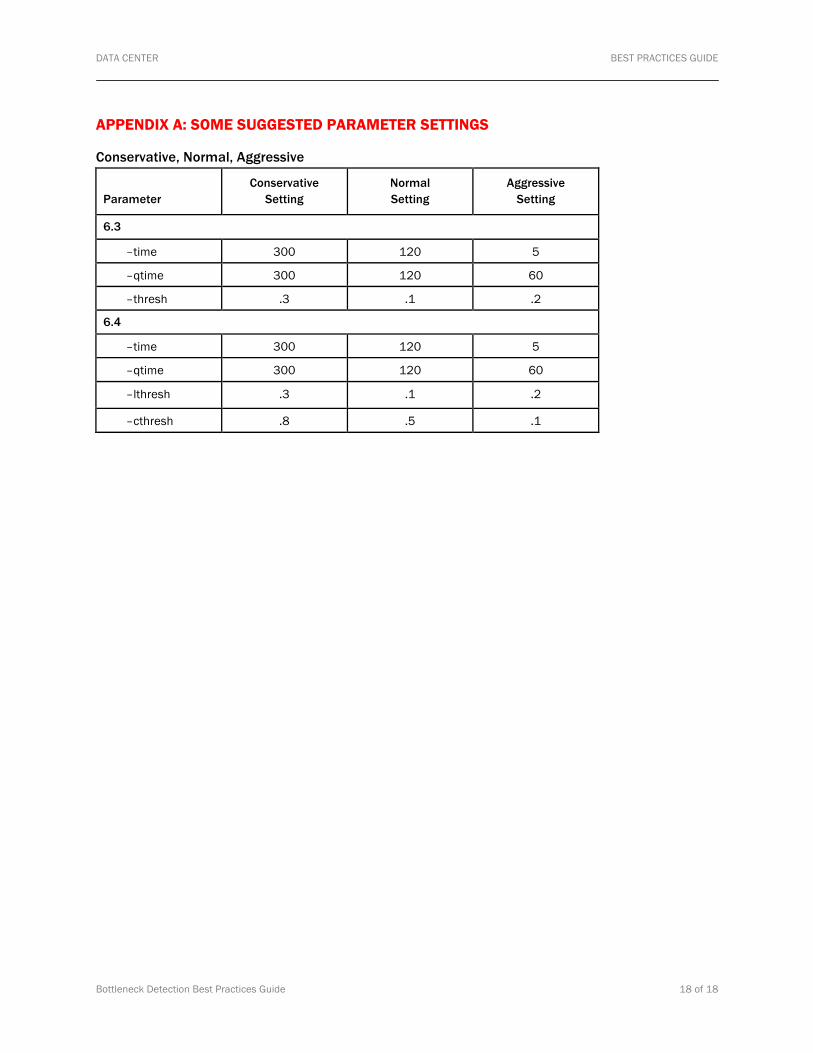
APPENDIX A: SOME SUGGESTED PARAMETER SETTINGS
Conservative, Normal, Aggressive
Parameter
Conservative Setting
Normal Setting
Aggressive Setting
6.3
–time 300 120 5
–qtime 300 120 60
–thresh .3 .1 .2
6.4
–time 300 120 5
–qtime 300 120 60
–lthresh .3 .1 .2
–cthresh .8 .5 .1
DATA CENTER BEST PRACTICES GUIDE
Bottleneck Detection Best Practices Guide 19 of 19
APPENDIX B: ADDITIONAL CONTROLS IN FABRIC OS 6.3 AND 6.4 In FOS v6.3 and 6.4 there are three parameters available via the bottleneckmon command, Threshold, Time, and QTime. Normally these values are more than sufficient to detect device latencies and link congestion.
In rare cases, however, they may not be sufficient and that explains the two additional bottleneck parameters lsubsectimethresh and –lsubsecsevthresh added in Fabric OS 7.0 described above.
To obtain the addiitonal degree of control provided by lsubsectimethresh and csubsecsevthresh prior to 7.0 you must specify the values in a special file on each switch platform.
Note: These specifications are NOT persistent and must be re-created when lost due to switch reboots or a failover occurs.
Affected Seconds Bottleneckmon makes a calculation on what an affected second is, but in FOS v6.x those parameters are not able to be modified via the bottleneckmon command. The parameters used to calculate an affected second are the percentage of time when there are zero transmit buffer credits and the transmit utilization of the port over a second. To adjust the affected second values a configuration file (latencycriteria.conf) is created in the /tmp filesystem on the active CP. Below is a more detailed explanation of the parameters:
Zero Tx Credits Percentage A decimal value with 2 digits of precision between 0 and 1 non-inclusive. When the value is multiplied by 100 it gives a zero tx credits percentage. A port is checked every ~2.5us to see if there are any transmit credits are available, if there are none, the tim_txcrd_z counter is incremented.
Every second a delta is taken on the tim_txcrd_z counter which is used to create a percentage of time there were zero transmit credits by dividing the delta by 380,000 (the maximum number of tim_txcrd_z intervals in a second).
If the percentage of time there were zero transmit credits is greater than the zero tx credits threshold percentage this component of the affected second is true. The zero tx credits percentage threshold is set on the first line of the /tmp/latencycriteria.conf file.
Note: You must issue bottleneckmon –status to force bottleneckmon use the values in the latencycriteria.conf file.
Transmit Utilization An integer value between 1 and 100 inclusive. When used as the denominator and 100 as the divisor (100/x) the calculation gives a transmit utilization percentage. When the transmit utilization percentage is divided by 100 and then multiplied by the maximum transmit bandwidth of any port it gives a transmit utilization.
When the actual port transmit utilization is below the calculated transmit utilization this component of the affected second is true. The transmit utilization value is set on the second line of the /tmp/latencycriteria.conf file, issuing bottleneckmon –status is needed to make bottleneckmon use the values in the latencycriteria.conf file.
Note: You must issue bottleneckmon –status to force bottleneckmon use the values in the latencycriteria.conf file.
Both components of the affected second must be true to count the second as an affected second.
When an alert is sent, it will be an AN-1003 message and follow the standard RASLog message format and contain the following information:
1. The switch name and WWN
2. The slot and port
3. The percentage of affected seconds and the time value
DATA CENTER BEST PRACTICES GUIDE
Bottleneck Detection Best Practices Guide 20 of 20
4. The average time between transmits which is calculated per second and then averaged over the time value. As a reference at 1G with full sized frames the minimum this value could be is 20.25us (a bit is transmitted every 941 picoseconds, full size frame with SOF, header, payload, CRC, & EOF is 2148 bytes, 21480 bits when encoded, and there is a requirement of at least 6 ordered sets between frames, each ordered set is 40 bits encoded, so a minimum of 21520 bits are transmitted)
Example of bottleneckmon alert written to RASlog raslogd: 2011/03/31-20:01:16, [AN-1003], 18075, SLOT 5 | WWN 10:00:00:05:1e:36:46:b8 | FID 128, WARNING, switchname, Latency bottleneck at slot 2, port 1. 5.00 percent of last 60 seconds were affected. Avg. time b/w transmits 19.7811 us.
The current values are:
Threshold: .01
Time: 60
Quiet Time: 60
Zero Tx Crd: .75
TX Utilization: 1
This means that for each 60 second interval if 1% of the seconds (1 second is 1.67% of 60, so if any second is an affected second we will be above the threshold) are affected seconds we will send an alert. Since the quiet time is the same as the time we could see alerts every minute. An affected second is any second that has greater than 75% of the time zero transmit credits are available and the transmit utilization on the port is less than 100% of the maximum (effectively removing the transmit utilization component from the calculation as we expect the utilization to be less than 100%). If a decrease in sensitivity is desired, changing the transmit utilization value to 2 will result in transmit utilization needing to be less than 50% of line rate for the transmit utilization component to be true.
DATA CENTER BEST PRACTICES GUIDE
Bottleneck Detection Best Practices Guide 21 of 21
APPENDIX C: BD MIB Refer to MIB Manual of the version of Fabric OS that you have deployed for a complete and most recent description of the BD MIB
bdTraps The OID represents the BD traps.
bdTrap 1.3.6.1.4.1.1588.2.1.1.51.0.1 Variables “userPortNumber 1.3.6.1.4.1.1588.2.1.1.51.2.2.1.1” “bdWinAvgTime 1.3.6.1.4.1.1588.2.1.1.51.1.5” “nBdType 1.3.6.1.4.1.1588.2.1.1.51.1.7” “bdThreshold 1.3.6.1.4.1.1588.2.1.1.51.1.6” “bdAggrStats 1.3.6.1.4.1.1588.2.1.1.51.2.3” “bdAbsoluteValue 1.3.6.1.4.1.1588.2.1.1.51.2.4” “swVfId 1.3.6.1.4.1.1588.2.1.1.1.2.15” “bdAvgFrameSize 1.3.6.1.4.1.1588.2.1.1.51.2.5”
bdStatus 1.3.6.1.4.1.1588.2.1.1.51.1.1 This object represents the status of bottleneck detection feature if enabled in the switch.
bdLThreshold 1.3.6.1.4.1.1588.2.1.1.51.1.2 This object is the severity threshold for latency bottleneck. This threshold indicates the percentage of one-second intervals affected by latency conditions within a specified time window.
bdCThreshold 1.3.6.1.4.1.1588.2.1.1.51.1.3 This object is the severity threshold for congestion bottleneck. This threshold indicates the percentage of one-second intervals affected by congestion conditions within a specified time window.
bdQTime 1.3.6.1.4.1.1588.2.1.1.51.1.4 The minimum number of seconds between consecutive alerts. The value assigned to this parameter applies to both latency and congestion monitoring.
bdWinAvgTime 1.3.6.1.4.1.1588.2.1.1.51.1.5 The time window in seconds over which the percentage of seconds affected by bottleneck conditions is computed and compared with the threshold.
bdThreshold 1.3.6.1.4.1.1588.2.1.1.51.1.6 This object represents the threshold for BD. Max Access accessible-for-notify This is accessible only for bdTrap and bdClearTrap.
nBdType 1.3.6.1.4.1.1588.2.1.1.51.1.7 This object represents the BD type. Max Access accessible-for-notify This is accessible only for bdTrap and bdClearTrap.
DATA CENTER BEST PRACTICES GUIDE
Bottleneck Detection Best Practices Guide 22 of 22
bdStats BD statistics.
bdNumOfEntries 1.3.6.1.4.1.1588.2.1.1.51.2.1 The number of entries in the statistics table.
bdStatsTable 1.3.6.1.4.1.1588.2.1.1.51.2.2 The table of stats entries represents both types of BD. This can have maximum 30 samples per port for congestion bottleneck and 30 samples per port for latency bottleneck. Each sample in the statistics is taken every 10 seconds.
bdStatsEntry 1.3.6.1.4.1.1588.2.1.1.51.2.2.1 An entry of BD statistics.
userPortNumber 1.3.6.1.4.1.1588.2.1.1.51.2.2.1.1 This object represents the user port indices of bottleneck monitored ports like F_port, E_port, L_port, and FCOE_port.
bdSampleTime 1.3.6.1.4.1.1588.2.1.1.51.2.2.1.2 This object represents the sample time. The value is returned in Epoch[Unix] time.
bdType 1.3.6.1.4.1.1588.2.1.1.51.2.2.1.3 This object represents the bottleneck type.
bdStatsValue10SecsSample 1.3.6.1.4.1.1588.2.1.1.51.2.2.1.4 This sample is an average of 10 samples collected every second.
bdStatsValue60SecsSample 1.3.6.1.4.1.1588.2.1.1.51.2.2.1.5 This sample is an average of 60 samples collected every second.
bdStatsValue300SecsSample 1.3.6.1.4.1.1588.2.1.1.51.2.2.1.6 This sample is an average of 300 samples collected every second.
bdAggrStats 1.3.6.1.4.1.1588.2.1.1.51.2.3 This object represents the aggregate stats value. This value is the sum of all the samples divided by the average window and multiplied by 100.
bdAbsoluteValue 1.3.6.1.4.1.1588.2.1.1.51.2.4 This is the absolute value of bdAggrStats. It is the number of affected seconds.
bdAvgFrameSize 1.3.6.1.4.1.1588.2.1.1.51.2.5 This object represents the average size in bytes of all frames that were transmitted on the ports during the averaging window.
DATA CENTER BEST PRACTICES GUIDE
Bottleneck Detection Best Practices Guide 23 of 23
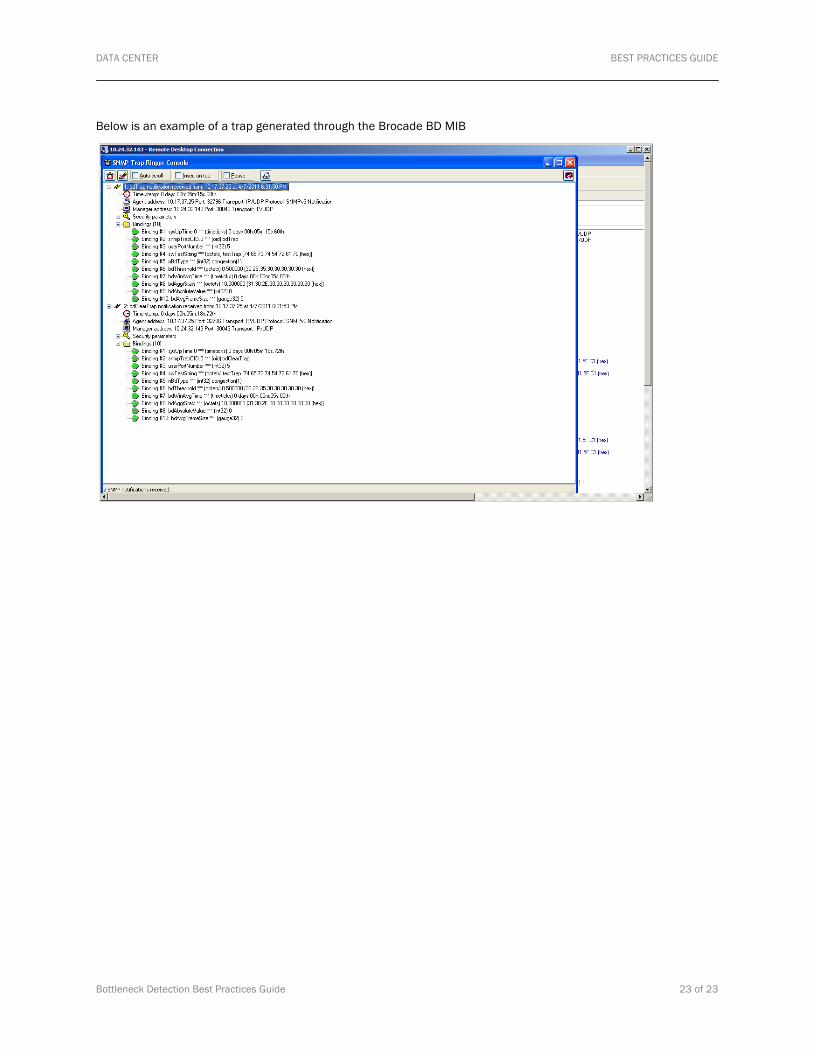
Below is an example of a trap generated through the Brocade BD MIB
DATA CENTER BEST PRACTICES GUIDE
Bottleneck Detection Best Practices Guide 24 of 24
APPENDIX D: REFERENCES
Software and Hardware Product Documentation • Brocade Fabric OS Administrator’s Guide
• Brocade Fabric OS Command Reference Manual
• Brocade Fabric Watch Administrator’s Guide, supporting Fabric OS v6.4.0
• Brocade Fabric OS MIB Reference
• Brocade Fabric OS Troubleshooting and Diagnostics Guide
Technical Briefs www.brocade.com/sites/dotcom/data-center-best-practices/resource-center/index.page
Brocade Compatibility Matrix www.brocade.com/forms/getFile?p=documents/matrices/Brocade_Compatibility_Matrix.pdf
Brocade Scalability Guidelines www.brocade.com/forms/getFile?p=documents/matrices/Brocade_Scalability_Guidelines_100208.pdf
Brocade SAN Health Support Matrix www.brocade.com/forms/getFile?p=documents/matrices/SANHealthSupportMatrix.xls
© 2011 Brocade Communications Systems, Inc. All Rights Reserved. 04/11 GA-BP-383-00
Brocade, the B-wing symbol, BigIron, DCFM, DCX, Fabric OS, FastIron, IronView, NetIron, SAN Health, ServerIron, TurboIron,and Wingspan are registered trademarks, and Brocade Assurance, Brocade NET Health, Brocade One, Extraordinary Networks, MyBrocade, VCS, and VDX are trademarks of Brocade Communications Systems, Inc., in the United States and/or in other countries. Other brands, products, or service names mentioned are or may be trademarks or service marks of their respective owners.
Notice: This document is for informational purposes only and does not set forth any warranty, expressed or implied, concerning any equipment, equipment feature, or service offered or to be offered by Brocade. Brocade reserves the right to make changes to this document at any time, without notice, and assumes no responsibility for its use. This informational document describes features that may not be currently available. Contact a Brocade sales office for information on feature and product availability. Export of technical data contained in this document may require an export license from the United States government.