Embed Size (px)
Citation preview

Broadway Urban Circulator Study
Prepared for:
City of Oakland
October, 2014
WC13-3000
TABLE OF CONTENTS
1.0 PURPOSE AND NEED ................................................................................................................. 1-1
1.1 Study Background ....................................................................................................................................... 1-1
1.2 City Project Goals ......................................................................................................................................... 1-2
1.3 Study Area ...................................................................................................................................................... 1-3
1.4 Local & Regional Planning Context....................................................................................................... 1-5
1.4.1 Transportation Plans and Projects ........................................................................................... 1-5
1.4.2 Transit-Oriented Development Plans ..................................................................................... 1-8
1.5 Statement of Need ...................................................................................................................................... 1-9
1.6 Statement of Purpose............................................................................................................................... 1-10
2.0 EXISTING CONDITIONS ........................................................................................................... 2-11
2.1 Study Area Characteristics ...................................................................................................................... 2-11
2.2 Demographics of Study Area................................................................................................................. 2-14
2.3 Transit Services and Facilities ................................................................................................................ 2-18
2.3.1 BART ................................................................................................................................................. 2-18
2.3.2 AC Transit ....................................................................................................................................... 2-20
2.3.3 Broadway “B” Shuttle ................................................................................................................. 2-24
2.3.4 Amtrak ............................................................................................................................................. 2-25
2.3.5 San Francisco Bay Ferry ............................................................................................................. 2-26
2.3.6 Medical Center Shuttles ............................................................................................................ 2-26
2.4 Traffic and Parking Conditions .............................................................................................................. 2-26
2.4.1 Traffic Conditions......................................................................................................................... 2-26
2.4.2 Parking Conditions ...................................................................................................................... 2-27
3.0 COMMUNITY PARTICIPATION ............................................................................................... 3-29
3.1 Community Meetings ............................................................................................................................... 3-29
3.2 Business Advisory Committee ............................................................................................................... 3-29
3.3 Project Web Site ......................................................................................................................................... 3-30
3.4 Online Survey .............................................................................................................................................. 3-30

3.5 Corridor Walk Audit .................................................................................................................................. 3-31
4.0 EVALUATION METHODOLOGY ............................................................................................... 4-32
4.1 Evaluation Process ..................................................................................................................................... 4-32
4.2 Screening Criteria ....................................................................................................................................... 4-33
5.0 INITIAL SCREENING OF ALTERNATIVES ................................................................................. 5-35
5.1 Description of Initial Alternatives ......................................................................................................... 5-35
5.1.1 Preliminary Alternatives Considered..................................................................................... 5-35
5.1.2 Alternatives Evaluated in Initial Screening ......................................................................... 5-36
5.2 Initial Screening Evaluation .................................................................................................................... 5-37
5.3 Initial Screening Results ........................................................................................................................... 5-40
6.0 FINAL SCREENING OF ALTERNATIVES ................................................................................... 6-42
6.1 Description of Final Alternatives ........................................................................................................... 6-42
6.1.1 Enhanced Bus Alternatives ....................................................................................................... 6-42
6.1.2 Streetcar Alternative ................................................................................................................... 6-49
6.1.3 Service Plan .................................................................................................................................... 6-54
6.2 Final Screening OF TECHNICAL CRITERIA ......................................................................................... 6-56
6.2.1 Ridership ......................................................................................................................................... 6-56
6.2.2 Design & Circulation .................................................................................................................. 6-58
6.2.3 System Integration ...................................................................................................................... 6-60
6.2.4 Economic Development ............................................................................................................ 6-61
6.2.5 Capital Costs .................................................................................................................................. 6-65
6.2.6 Operating & Maintenance Costs ........................................................................................... 6-66
6.2.7 Cost/Benefit ................................................................................................................................... 6-67
6.2.8 Environmental ............................................................................................................................... 6-68
6.3 Final Screening OF Evaluation OBJECTIVES ...................................................................................... 6-70
6.3.1 Evaluation OBJECTIVES .............................................................................................................. 6-70
6.4 Improve the Quality of Transit Service in the Corridor ................................................................ 6-70
6.4.1 Provide Reliable Service that Is Relatively Free of Delay ............................................... 6-70
6.4.2 Enhance Awareness of Transit Services ............................................................................... 6-71
6.4.3 Leverage and Integrate Existing Transit Investments ..................................................... 6-72

6.4.4 Contribute to the Utility and Efficiency of the Overall Transit System within the
Corridor ......................................................................................................................................................... 6-73
6.4.5 Improve Access to Jobs and Social Services for Communities of Concern ............ 6-75
6.5 Provide Safe, Multimodal Travel Options.......................................................................................... 6-76
6.5.1 Minimize Conflicts between Transit and other Modes .................................................. 6-76
6.6 Support Economic and Community Development ........................................................................ 6-77
6.6.1 Support Transit-Oriented Development Consistent with Local and Regional
Policies ........................................................................................................................................................... 6-77
6.6.2 Improve Access to Retail and other Businesses ............................................................... 6-78
6.6.3 Preserve and Enhance the Character and Quality of Life in Existing Neighborhoods
6-78
6.7 Deliver a Project that is Cost-Effective, Feasible, and has Community Support ................. 6-79
6.7.1 Prioritize Projects that would be Cost-Effective to Build and Operate .................... 6-79
6.7.2 Prioritize Projects with a Viable Operator and Administrative Structure ................ 6-80
6.7.3 Prioritize Projects with the Potential to Earn Widespread Community Acceptance 6-
81
6.7.4 Prioritize Projects with a Realistic Phasing and Funding Plan ..................................... 6-82
6.8 Summary ....................................................................................................................................................... 6-83
6.9 Final Screening Results ............................................................................................................................ 6-85
6.9.1 Option #1: Expand B Shuttle Service .................................................................................... 6-86
6.9.2 Option #2: Enhanced Bus to Rockridge .............................................................................. 6-87
6.9.3 Option #3: Streetcar to MacArthur Blvd/MacArthur BART........................................... 6-88
6.9.4 Dedicated Transit Lanes on Broadway ................................................................................. 6-88
7.0 IMPLEMENTATION .................................................................................................................. 7-90
7.1 Next Steps..................................................................................................................................................... 7-90
7.2 Organizational Structure ......................................................................................................................... 7-92
7.2.1 Transit Agency Structure ........................................................................................................... 7-93
7.2.2 City of Oakland Structure ......................................................................................................... 7-93
7.2.3 Non-Profit Corporation (The Portland Model) Structure .............................................. 7-94
7.2.4 Joint Exercise of Powers Authority (JPA) Structure .......................................................... 7-94
7.3 Capital Funding ........................................................................................................................................... 7-95
7.3.1 Federal Capital Funding Sources ........................................................................................... 7-95
7.3.2 Local (Non-Federal) Public Capital Funding Sources ..................................................... 7-98

7.3.3 Local Private Capital Funding Sources .............................................................................. 7-102
7.4 Operations and Maintenance Funding ........................................................................................... 7-106
7.4.1 Farebox Revenue ...................................................................................................................... 7-106
7.4.2 Circulator Stop and Vehicle Sponsorship ........................................................................ 7-107
7.4.3 Other Private Funding ............................................................................................................. 7-107
7.4.4 Flexible Funding from Local Sources ................................................................................. 7-107
7.4.5 Federal Regional Flexible Fund Allocations .................................................................... 7-108
8.0 APPENDIX A ........................................................................................................................... 8-109
9.0 APPENDIX B ........................................................................................................................... 9-115
10.0 APPENDIX C .........................................................................................................................10-124
11.0 APPENDIX D .........................................................................................................................11-160
12.0 APPENDIX E .........................................................................................................................12-162
APPENDICES
APPENDIX A: SYSTEM INTEGRATION
APPENDIX B: ENVIRONMENTAL SCREENING
APPENDIX C: FUNDING OF CIRCULATOR PROJECTS IN OTHER CITIES
APPENDIX D: CAPITAL COST DATA
APPENDIX E: ANNUAL OPERATING & MAINTENANCE COST DATA

List of Figures
Figure 1: Study Corridor ............................................................................................................................................................. 1-4
Figure 2: The Broadway Shuttle (Credit: Eva Silverman, via City of Oakland) ......................................................... 1-6
Figure 3: The Downtown Oakland Shuttle in the 1980s (Credit: Bruce Fitch, via AC Transit) ........................... 1-6
Figure 4: Corridor Employment Density by Block (Jobs per acre) ............................................................................. 2-12
Figure 5: Corridor Population Density by Block (Persons per acre) ......................................................................... 2-13
Figure 6: Ethnic Minority Individuals within One-Quarter Mile of Alignments .................................................... 2-15
Figure 7: Low-Income Households within One-Quarter Mile of Alignments ....................................................... 2-16
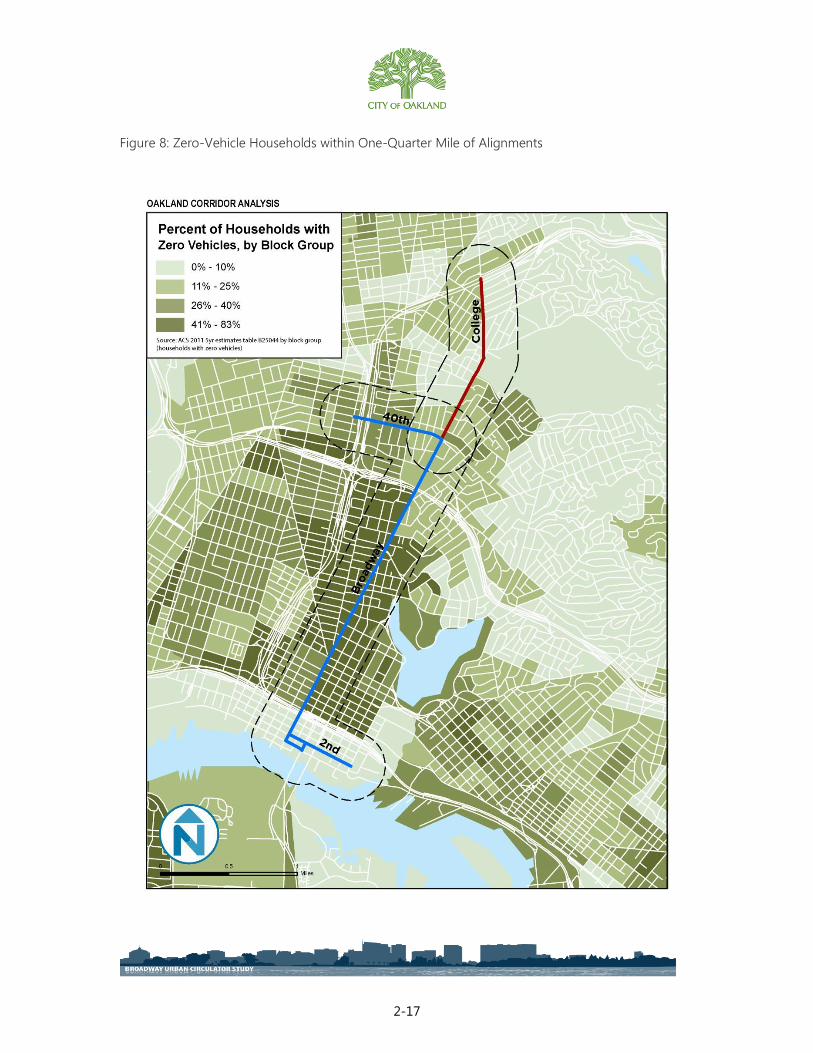
Figure 8: Zero-Vehicle Households within One-Quarter Mile of Alignments....................................................... 2-17
Figure 9: Official BART Map .................................................................................................................................................... 2-19
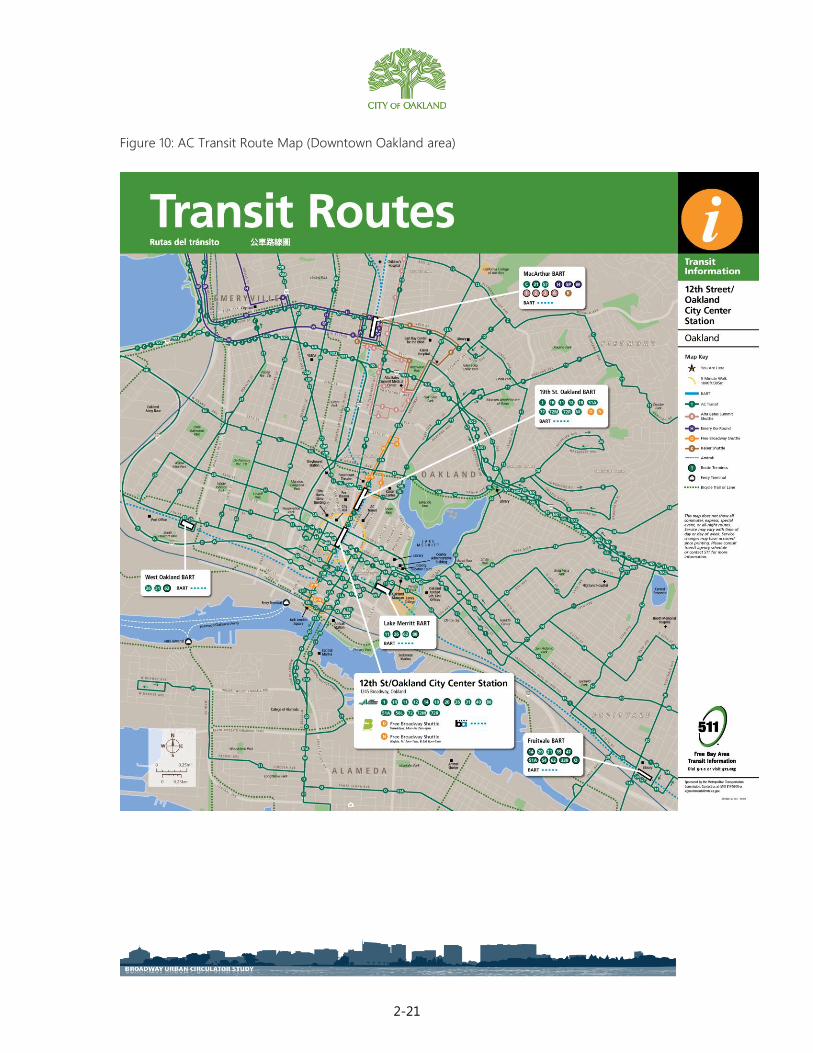
Figure 10: Official AC Transit Map (Downtown Oakland Inset) ................................................................................. 2-21
Figure 11: Official Route 51A Map ....................................................................................................................................... 2-23
Figure 12: Official B Shuttle Map .......................................................................................................................................... 2-25
Figure 13: Enhanced Bus Alternatives ................................................................................................................................. 6-46
Figure 14: Streetcar Alternatives ........................................................................................................................................... 6-51
Figure A-1: Existing Transit Wayfinding Signage in Downtown Oakland ........................................................... 8-111
List of Tables
Table 1: Service Levels at BART Stations ............................................................................................................................ 2-19
Table 2: Number of trips per hour in each direction, AC Transit, Existing Conditions ...................................... 2-23
Table 3: Evaluation Framework .............................................................................................................................................. 4-34
Table 4: Summary OF INITIAL SCREENING ........................................................................................................................ 5-38
Table 5: Conceptual Improvements for Enhanced Bus Stops ..................................................................................... 6-44
Table 6: Service Plan for MacArthur Alternatives ........................................................................................................... 6-55
Table 7: Service Plan for Rockridge Alternative ............................................................................................................... 6-55
Table 10: Order of Magnitude CAPITAL COST Estimate: STREETCAR PHASES .................................................... 6-65
Table 11: Order of Magnitude Estimate: Enhanced Bus Alternatives ...................................................................... 6-66
Table 12: Estimated Annual O&M Costs, All Alternatives ........................................................................................... 6-67
Table 14: Estimated Variability in Peak Travel Times .................................................................................................... 6-71
Table 15: Visibility of Infrastructure and Potential for Public Understanding of the Service .......................... 6-72
Table 16: Potential to Increase Network Connectivity and Provide “First/Last Mile” Connections .............. 6-73
Table 17: Potential Impacts on Demand and Cost-Effectiveness of Other Services/Opportunities to
Reconfigure Impacted Services ..................................................................................................................... 6-74
Table 18: Numbers of Low-Income, Ethnic Minority and Zero-Car Households Within One-Quarter Mile of
Stops ....................................................................................................................................................................... 6-75
Table 19: Opportunities for Physical Conflicts Between Users ................................................................................... 6-76
Table 20: Potential Impact of Project On Type, Form, and Scale of Adjacent Developments ....................... 6-77
Table 21: Multimodal Access to Businesses/Impacts of Design on Businesses ................................................... 6-78
Table 22: Potential to Contribute to Identity and Perceived Quality of Districts ............................................... 6-79
Table 23: Estimated Capital Cost per Rider ....................................................................................................................... 6-80
Table 24: Estimated Operating Cost per Rider ................................................................................................................. 6-80
Table 25: Potential Willingness of Existing Organizations/Potential for New Organization to Administer
and Operate ......................................................................................................................................................... 6-81
Table 26: Likely Level of Support from Community Members, Community Leaders and Policy Makers ... 6-82
Table 27: Potential for Phased Implementation (Based on Viability of Individual Phases) .............................. 6-83
Table 28: Summary Evaluation ............................................................................................................................................... 6-84

1-1
1.0 PURPOSE AND NEED
This report presents a description of transit alternatives that were identified and evaluated to
address the goals, purpose and need for a Broadway Transit Urban Circulator project. The study
considered possible modes and alignments through a comprehensive alternatives analysis
process. This section describes the Purpose and Need for the project in Downtown Oakland.
The Purpose and Need outline the problems to be addressed and the goals set by the
community, to develop a purpose and need statement for the project. A project need is the
transportation deficiency or problem that is identified, and a project purpose is the set of
objectives that will be met to address the transportation deficiency or problem. The purpose and
need statement documents the problem to be addressed in the alternatives analysis and
environmental review process and serves as the basis for the development of project goals,
objectives, and evaluation measures. A well-defined purpose and need statement is critical to
project planning because it helps define the scope of a project, guide the development and
consideration of alternatives, identify potential environmental mitigation measures, provide
legally defensible transportation and environmental decisions, and justify projects for
programming. Though refinements may occur during future study, the purpose and need serves
as an analytical framework for the project as it moves forward.
1.1 STUDY BACKGROUND
The Broadway corridor comprises a robust multimodal transit network and string of commercial
and residential districts stretching from Jack London Square to I-580. AC Transit and BART
provide excellent commuter trunk transit service, enhancing mobility for people throughout the
East Bay and bringing thousands of people into downtown Oakland each day. This study
evaluates bus and rail transit alternatives designed to enhanced the popular circulator service
currently provided by the Broadway Shuttle (the “B”).
The Broadway Shuttle (the “B”) serves a portion of the corridor by connecting transit stations and
commercial districts between Jack London Square and Grand Avenue/27th Street with frequent

1-2
bus service. The B, which is operated by AC Transit and supported by public grants and private
sponsorships, provides “last mile” commuter connections and circulation along Broadway. No
funding sources are committed to the B for more than three years (2015-16). Long-term funding
from dedicated revenue sources is needed to ensure service will not be discontinued.
A route extension may also be desirable in order for the B to serve key districts and destinations
in the Mid-Broadway area, particularly as they develop in the future. The current route travels to
Grand Avenue on weekdays, stopping short of the Broadway Valdez Specific Plan Area (the latest
draft plan calls for 1,278 residential units and two million square feet of office and retail
development). Further along Broadway are the Alta Bates Summit Medical Center campus and the
Kaiser Hospital campus, which is adjacent to Piedmont Avenue (a popular shopping street). West
of Broadway, along MacArthur Boulevard, is the MacArthur BART station, which will also be
examined as a potential extension.
In addition to addressing Broadway’s transit needs, Oakland desires to further support high
density office and residential transit-oriented development and stimulate additional pedestrian-
friendly business activity along the corridor. One of downtown Oakland’s major assets is its six
regional transit stations – Amtrak Capitol Corridor, SF Bay Ferry, AC Transit Uptown Transit Center
and three BART stations. The study will evaluate the potential for a more robust Broadway transit
circulator – including the possibility of implementing a fixed-rail streetcar – to promote economic
development along downtown Oakland’s central spine.
Successful downtown circulators have direct routes that connect multiple markets and
destinations, are a branded service with vehicles that stand out, and provide frequent service
(every 10 to 15 minutes).
1.2 CITY PROJECT GOALS
The City of Oakland’s goals for the Broadway Transit Urban Circulator project are summarized as
follows.
Strengthen Local and Regional Transit
Promote Economic Development
Connect Downtown Oakland’s Neighborhoods

1-3
Identify Sustainable Funding Source(s)
1.3 STUDY AREA
The Broadway Corridor is a multimodal, well-travelled corridor within the city of Oakland
stretching from Jack London Square to Temescal/Rockridge. Two regional transit providers serve
the corridor: Alameda – Contra Costa (AC) Transit, and the Bay Area Rapid Transit District (BART) –
while the SF Bay Ferry and Amtrak stations in Jack London Square also represent major transit
hubs. These services provide mobility for residents of Oakland, communities throughout the East
Bay and beyond. Thousands of trips pass through the city of Oakland daily along this corridor.
The Broadway corridor spans several neighborhoods such as Jack London Square, Old Oakland,
Chinatown, City Center, Lake Merritt, Uptown, Koreatown/ Northgate, Valdez Triangle, Piedmont
Avenue, Mid/Upper-Broadway, the Kaiser and Alta Bates Medical Centers, Temescal, and
Rockridge.

1-4
Figure 1: Study Corridor

1-5
1.4 LOCAL & REGIONAL PLANNING CONTEXT
The Broadway Urban Circulator Study seeks to build upon the previous efforts of multiple plans
and projects along the Broadway Corridor.
1.4.1 TRANSPORTATION PLANS AND PROJECTS
1.4.1.1 Jack London BART Feasibility Study
In 2004, a feasibility study was undertaken to examine options for improved transit connectivity
between Jack London Square (located south of I-880) and the downtown commercial districts
north of I-880. A variety of transit alternatives were considered and the study identified a
streetcar as the preferred mode of transit to connect Jack London Square to Downtown Oakland.
In the interim, the study recommended the restoration of a downtown shuttle service on
Broadway.
1.4.1.2 Broadway Shuttle
Following the 2004 Jack London BART Feasibility Study, the City of Oakland initiated operation of
the Broadway Shuttle (the “B”) in 2010, to provide local circulator service and connect all of the
transit stations and commercial districts between Jack London Square and Grand Avenue/27th
Street. Since 2010, the specially branded free shuttle bus has been operated by AC Transit and
supported by public grants and private sponsorships, and has proven to be very popular with
local residents and riders, carrying approximately 2,756 weekday riders. The “B” was seen both as
a way to provide the connections between JLS and the districts along Broadway, and also as a way
to provide an interim circulator service that could, in part, reveal the demand for the streetcar line
recommended in the 2004 study.
The B Shuttle represents the latest iteration of a local circulator service on the Broadway Corridor
dating back 35 years, including the Broadway Shopper Shuttle, which ran in the late 1990s until
2003, and the Downtown Oakland Shuttle, which ran in the 1980s. Previous shuttle services were
discontinued due to the lack of a stable, long-term funding for service operations.

1-6
Figure 2: The Broadway Shuttle (Credit: Eva Silverman, via City of Oakland)
Figure 3: The Downtown Oakland Shuttle in the 1980s (Credit: Bruce Fitch, via AC Transit)
1.4.1.3 Line 51 Corridor Delay Reduction and Sustainability Project
The Line 51 Corridor Delay Reduction and Sustainability Project will implement targeted capital
improvements to reduce delays and improve reliability along AC Transit’s Lines 51A and 51B.
Improvements along the Broadway corridor include traffic signal upgrades and transit signal

1-7
priority (between 8th
Street and Rockridge BART), stop relocations and consolidations, and bulb
outs at select stops. Improvements are scheduled to be completed by early 2015.
1.4.1.4 East Bay Bus Rapid Transit
AC Transit’s East Bay BRT project will add dedicated bus lanes and enhanced stations in segments
of an alignment extending from the Uptown Transit Center to the San Leandro BART Station,
primarily via International Boulevard in East Oakland. BRT service will replace existing Routes 1
and 1R service in the corridor, making limited stops and operating every five minutes on
weekdays, as well as evenings and weekends. The project is in final design, with service scheduled
to begin in 2017.
Along the Broadway corridor, BRT will operate on Broadway between 20th
and 11th
streets, with
stops at 19th
Street northbound and 20th
Street southbound adjacent to the Uptown Transit
Center, at 14th
Street, and on 11th
and 12th
streets just east of Broadway. The stops on Broadway
will be on the far sides of their respective intersections. Stops will be dedicated to BRT use, with
raised platforms allowing for near-level boarding of vehicles and ticket machines enabling
prepaid boarding.
1.4.1.5 The Emeryville-Berkeley-Oakland Transit Study (EBOTS)
The Emeryville-Berkeley-Oakland Transit Study (currently in progress) is evaluating improvements
to transit service in West Berkeley, Emeryville, and West Oakland. The study is examining multiple
transit improvement scenarios, one of which includes three circulator lines from MacArthur BART,
including one that extends along 40th
to the Kaiser and Summit-Alta Bates Medical Centers
(overlapping with the Broadway corridor). Transit modes under consideration for these circulators
include shuttles, buses, and streetcars.
1.4.1.6 Downtown Oakland Circulation Study
In 2014, the City of Oakland began a circulation study for Downtown Oakland to analyze the
performance of the local street network and prioritize improvements. It is anticipated that the
findings of the Broadway Urban Circulator Study will inform the process of the Downtown
Circulation Study.
1-8
1.4.2 TRANSIT-ORIENTED DEVELOPMENT PLANS
The Broadway corridor is already a focal point for transit-oriented development (TOD) in the Bay
Area. Significant development has already occurred over the past 15 years, and it is anticipated
that land uses will further intensify. A number of transit-oriented development plans have been
completed or are in-progress on the corridor to guide future development:
1.4.2.1 Plan Bay Area
Plan Bay Area, the Regional Transportation Plan / Sustainable Communities Strategy (RTP/SCS)
lays out a regional vision for sustainable development. Plan Bay Area designates the Broadway
corridor as a Priority Development Area. Between Downtown and Jack London Square, the
corridor is designated as a Regional Center, featuring a high intensity of land uses. In the
Mid/Upper Broadway areas, the corridor is designated as a Mixed-Use Corridor, featuring higher
density commercial, residential and mixed-use projects.
1.4.2.2 MacArthur BART Transit Village
The MacArthur BART Transit Village, currently under construction, will replace the station’s surface
parking lot with a mixed-use development featuring 625 housing units, 40,000 square feet of
retail space, and a new parking garage. The transit village is anticipated to reactive the areas
adjacent to MacArthur Station and help foster a new neighborhood center. The transit village lies
at a potential northern terminus location under study in this project.
1.4.2.3 Broadway-Valdez Specific Plan
The Broadway-Valdez Specific Plan provides a blueprint for attracting new retail, office, and
housing development to the Broadway corridor from Grand Ave to I-580. The plan hopes to
accommodate over 1.1 million square feet of new retail, 1,800 new housing units, 4,100 new jobs,
700,000 square feet of office space, and a new hotel. The Specific Plan calls for transit
enhancements along Broadway to strengthen the connection between new developments, BART,
and Downtown Oakland.
1.4.2.4 Brooklyn Basin Project
The Brooklyn Basin project (formerly Oak to Ninth) is Oakland’s largest redevelopment project,
spanning 64 acres east of Jack London Square. The project plans to add 3,100 housing units,

1-9
200,000 square feet of retail space, and 32 acres of parkland to Oakland’s waterfront. The project
lies at the southern edge of this project’s study area and is planning on significant transit service
to span the first/last mile connection to BART and Downtown Oakland.
1.4.2.5 Lake Merritt Station Area Plan
The Lake Merritt Station Area Plan focuses on increasing housing, employment, and retail/services
options around the Lake Merritt BART Station. The plan borders Broadway between 5th
and 10th
Streets, and also includes the Victory Court area between Oak Street and the Brooklyn Basin
project.
1.4.2.6 West Oakland Specific Plan
The West Oakland Specific Plan envisions attracting a greater intensity of residential and
commercial development to West Oakland. While the Specific Plan is not included within our
study area, it includes a broader vision for an enhanced transit “O” spanning Broadway, 40th
,
Mandela Parkway, and 3rd
Street.
1.5 STATEMENT OF NEED
While the Broadway corridor is presently served by a combination of the B Shuttle, Line 51A, and
other AC Transit lines, there is no service dedicated to serving trips along the full length of the
corridor. An expanded transit circulator is needed from Temescal/Rockridge through to Jack
London Square to provide additional direct connectivity between major and emerging
destinations to improve access and mobility. As new development continues to intensify,
additional transit service will be needed to connect these new destinations and neighborhoods to
Downtown Oakland, Jack London Square, existing BART stations, and major AC Transit bus routes.
However, in order to expand transit services, long-term operational funds must be identified.
The need for the Broadway Urban Circulator Study is driven by both transportation and land use
challenges:
Lack of continuous connection between destinations along Broadway between Jack
London Square and Kaiser Hospital/Piedmont Ave
Need for recognizable local transit service dedicated to serving short, local trips

1-10
Need for expansion of transit service to support development in a Plan Bay Area-
designated Priority-Development Area
1.6 STATEMENT OF PURPOSE
The purpose of the Broadway Urban Circulator Study is to enhance mobility for residents,
employees, and visitors of the Broadway Corridor by strengthening connectivity between major
employment and commercial districts, downtown neighborhoods, activity centers, tourist
destinations, and the regional transit network. In addition, the project seeks to support economic
revitalization and transit-oriented development along the corridor. The project has several
overarching goals:
Enhance transit service, particularly for short trips, in the corridor
Provide convenient, frequent, corridor-focused transit service.
Provide safe, multimodal travel options
Support economic and community development
Support environmental sustainability and enhanced public health
Deliver a project that is cost-effective, feasible, financially sustainable, and has community
support
2-11
2.0 EXISTING CONDITIONS
2.1 STUDY AREA CHARACTERISTICS
The Broadway study corridor connects many of Oakland’s densest districts, neighborhoods, and
activity centers. The neighborhoods are listed below, beginning at the southern end of the
corridor and continuing to the northern terminus points near the MacArthur BART and Rockridge
BART stations.
Jack London Square
Chinatown
Old Oakland
Downtown Oakland
Uptown
Pill Hill
Harrison Street/Oakland Avenue
Piedmont Avenue
Temescal
Longfellow
Rockridge
Major employers in or near the study corridor include Alta Bates Medical Center, Kaiser
Permanente Medical Center, Peralta Community College District/Laney College, the Port of
Oakland, and Wells Fargo.
Visit Oakland1 estimates that over 2.5 million people visited Oakland in 2013. Major activity
centers or attractions on or near the study corridor include Chinatown, Jack London Square, the
Fox Oakland Theater, Lake Merritt, the Oakland Museum of California, the Paramount Theater,
and Preservation Park.
Oakland was designated by Art Place America in 2013 as one of America's top twelve art
communities, recognizing Downtown (including Uptown), Chinatown, Old Oakland, and Jack
London Square as communities "that have most successfully combine art, artists and venues for
creativity and expression with independent businesses, retail shops and restaurants, and a
walkable lifestyle to make vibrant neighborhoods."
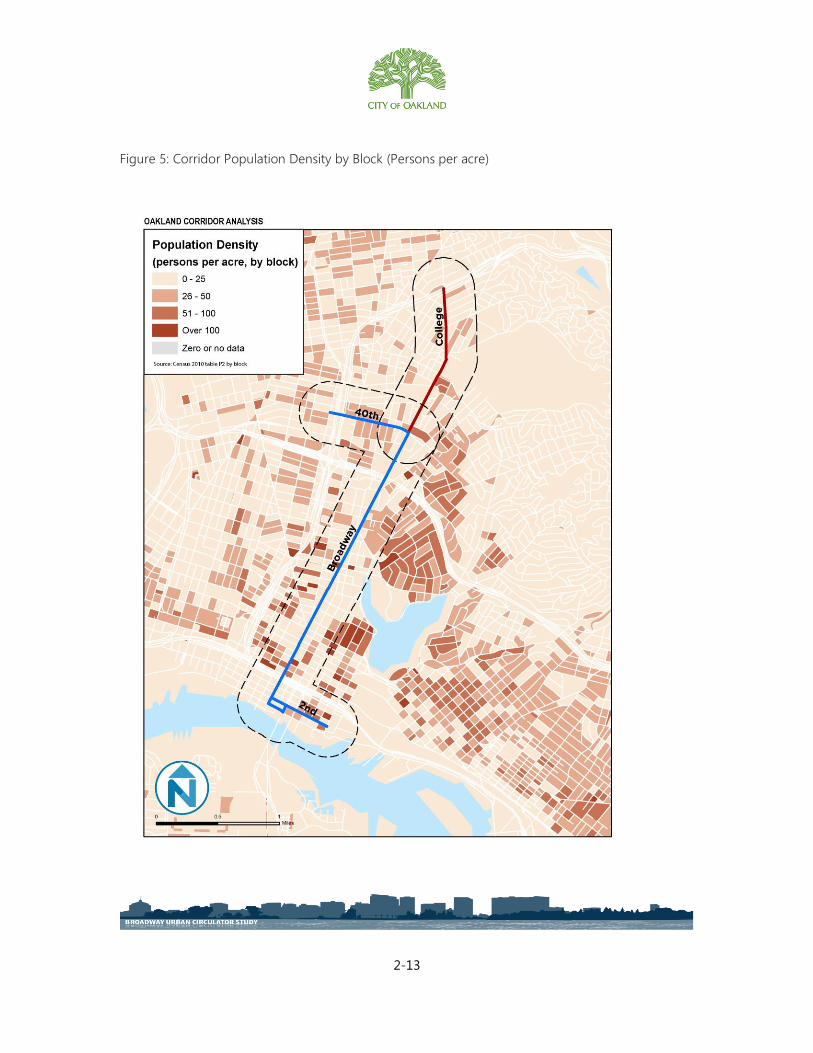
Figures 4 and 5, on the following pages, show the employment density and population density
per acre, along the study corridor.
1 Tourism Facts & Figures, Visit Oakland, www.visitoakland.org.

2-12
Figure 4: Corridor Employment Density by Block (Jobs per acre)
2-13
Figure 5: Corridor Population Density by Block (Persons per acre)

2-14
2.2 DEMOGRAPHICS OF STUDY AREA
The Broadway corridor represents a diverse cross-section of Oakland’s population. The corridor
contains significant socioeconomic diversity.
The City of Oakland is projected to be the third fastest growing jurisdiction in the Bay Area from
2010 to 2040, according to Plan Bay Area2, with expected job growth of 45 percent and growth in
housing units of 30 percent. Downtown Oakland and Jack London Square is the largest job center
in Alameda County with 88,180 jobs in 2010. Employment is projected to grow to 127,600 by
2040. The number of housing units in Downtown Oakland and Jack London Square is projected
to more than double over the next 30 years, from 11,910 in 2010 to approximately 26,200 in 2040.
The 2010 Census yielded the following percentage of population by race for the City of Oakland.
White: 34.5%
Black or African American: 28.0%
Asian: 16.8%
Some other race: 13.7%
Two or more races: 5.6%
American Indian/Alaska Native: 0.8%
Native Hawaiian/Other Pacific Islander: 0.6%
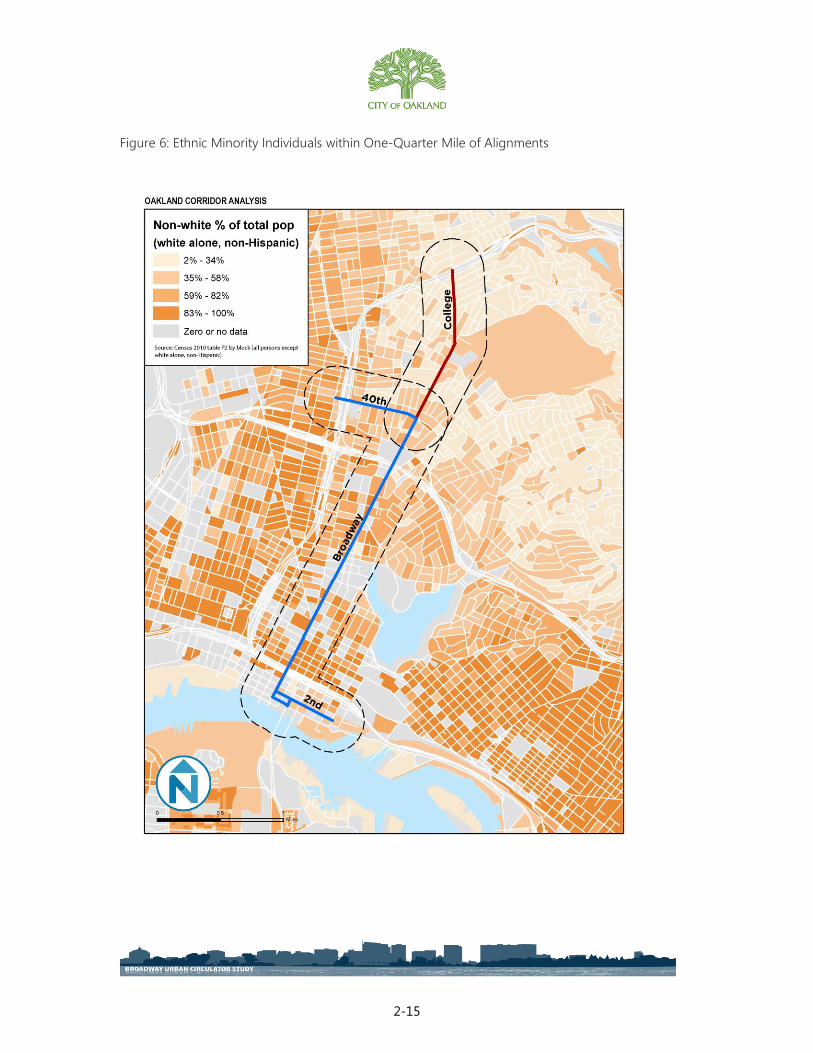
Figure 6 shows the non-white percentage of the total population, by census block group, within a
one-quarter mile catchment area for the study corridor, The figures shows that a significant share
of the population in the corridor, particularly along the central portion of Broadway between 6th
Street and 34th
Street, are ethnic minority individuals,
Figures 7 and 8 provide data on two significant predictors of transit ridership including low
income households and zero vehicle households within the one-quarter mile study catchment
area. The New Starts and Small Starts funding programs administered by the Federal Transit
Administration (FTA) include a mobility metric that factors up ridership forecasts based on the
number of riders from low income or zero vehicle households.
2 Draft Plan Bay Area - Strategy for a Sustainable Region: Draft Forecast of Jobs, Population and Housing, MTC
and ABAG, March 2013.
2-15
Figure 6: Ethnic Minority Individuals within One-Quarter Mile of Alignments

2-16
Figure 7: Low-Income Households within One-Quarter Mile of Alignments
2-17
Figure 8: Zero-Vehicle Households within One-Quarter Mile of Alignments
2-18
2.3 TRANSIT SERVICES AND FACILITIES
An array of fixed-route transit services and facilities already exists in the corridor, including 28 bus
routes operated by the Alameda Contra Costa Transit District, or AC Transit, the City of Oakland’s
B on Broadway circulator, shuttles provided by medical centers in the Pill Hill area, four Bay Area
Rapid Transit (BART) stations, an Amtrak station, and a San Francisco Bay Ferry terminal.
In addition, AC Transit is scheduled to introduce East Bay Bus Rapid Transit (BRT) service to the
corridor in 2017, and the Emeryville-Berkeley-Oakland Transit Study (EBOTS) is evaluating new
and improved transit services between Oakland, Emeryville and Berkeley.
While there are a variety of transit operators in the corridor, the largest providers by far are BART
and AC Transit.
2.3.1 BART
Bay Area Rapid Transit is the regional rail system for San Francisco, Alameda and Contra Costa
counties, with service extending into San Mateo County and an extension currently under
construction to Santa Clara County. There are four BART stations in the corridor: 12th
Street
Oakland City Center and 19th
Street Oaklan d under Broadway in Downtown Oakland, and
MacArthur and Rockridge in the median of State Route 24 to the north, at MacArthur Boulevard
and at College Avenue. In Figure 9, a diagram of the BART system, these stations can be found
near the center.

2-19
Figure 9: Official BART Map
The 12th
Street, 19th
Street and MacArthur stations are served by three of BART’s five lines, while
Rockridge is served by a single line. Service levels at each station are summarized in Table 1.
Note that the Richmond-Millbrae line does not operate evenings or Sundays.
TABLE 1: SERVICE LEVELS AT BART STATIONS
Station
Served by Lines Average Headway (All Service)
Richmond-
Millbrae/
Daly City
Richmond-
Fremont
Pittsburg/Bay
Point-SFO/
Millbrae
Wkday Eve Sat Sun
12th Street
Oakland City
Center
X X X 5 10 6.7 10
19th Street
Oakland X X X 5 10 6.7 10
MacArthur X X X 5 10 6.7 10
Rockridge X 15 20 20 20

2-20
The four BART stations in the corridor are the corridor’s busiest transit nodes. As of April 2014,
average weekday entries at each station were:
12th
Street: 13,437
19th
Street: 12,097
MacArthur: 8,714
Rockridge: 5,419
Additionally, each station serves as a hub for connecting bus services, with thousands of daily
boardings on buses outside of 12th
Street and, to a somewhat lesser extent, 19th
Street, each of
which is served by close to two dozen AC Transit routes.
2.3.2 AC TRANSIT
The Alameda Contra Costa Transit District is the primary bus service provider for western Alameda
and Contra Costa counties. It operates a total of 28 fixed routes in the corridor, including local,
limited-stop, Rapid, Transbay express and All-Nighter services.
AC Transit routes in Downtown Oakland are shown in Figure 10. In the map, north is at top left, so
Broadway runs from the upper-left to bottom-center. As the map illustrates, Broadway, 11th
and
12th
streets in Downtown Oakland constitute the core of the AC Transit system, where the
greatest number of routes converge and overlap.
2-21
Figure 10: AC Transit Route Map (Downtown Oakland area)

2-22
Of the 28 AC Transit routes operating in the Broadway corridor, 12 of them – Routes 1, 1R, 11, 12,
18, 20, 31, 51A, 58L, 72, 72M, and 72R – are local, limited-stop or Rapid3 services operating all day
Monday through Friday on Broadway between the one-way couplet of 11th
(eastbound) and 12th
(westbound) streets and the Uptown Transit Center on 20th
Street at Broadway. Additionally:
eight of the 12 routes operating on Broadway between 11th and 20th
streets (11, 20, 31,
51A, 58L, 72, 72M and 72R) also operate on Broadway between 11th
and the one-way
couplet of 7th
(eastbound) and 8th
(westbound) streets;
four of those routes (58L, 72, 72M and 72R) operate on Broadway south of 7th
Street; and
one route (51A) operates on Broadway north of 20th
Street.
Route 51A also operates on College in the Rockridge area, while Routes 58L, 72 and 72M operate
on Embarcadero and 2nd
Street near Jack London Square. A 13th
all-day service, Route 57,
operates on 40th
Street near the MacArthur BART Station.
The remaining 15 routes in the corridor either do not operate on streets on which any of the
alternatives would operate (Routes 14, 26, 40, 49, and 88) or operate only during the weekday
peak (Transbay Routes C, CB and NL), mid-day (Route 314) or overnight (All-Nighter Routes 800,
801, 802, 805, 840 and 851) periods.
No single AC Transit route covers the entire length of the corridor. Route 51A, however, runs from
Rockridge BART nearly to Jack London, turning off of and onto Broadway at 7th
and 8th
streets,
respectively. From Broadway, it proceeds to Alameda, then the Fruitvale BART Station in East
Oakland. Its alignment is shown in Figure 11. Broadway and College are at left.
3 Rapid routes are limited-stop services with distinctly branded stops and buses and other elements to
reduce delay.

2-23
Figure 11: Official Route 51A Map
Routes 58, 58L, 72, 72M and 72R, meanwhile, continue south on Broadway to the Jack London
Square area, but do not operate on Broadway north of 20th
Street.
Table 2 shows key service characteristics for the 13 routes operating all day on streets included in
the alternative alignments.
TABLE 2: NUMBER OF TRIPS PER HOUR IN EACH DIRECTION,
AC TRANSIT, EXISTING CONDITIONS
Extent of Service From Grand Avenue
To 11th Street
From Grand Avenue
To 7th Street
From Grand Avenue
To Jack London District
Line Peak Off-peak Peak Off-peak Peak Off-peak
1 4 3 -- -- -- --
1R 5 5 -- -- -- --
11 2 2 2 2 -- --
12 3 3 -- -- -- --
18 4 4 -- -- -- --

2-24
TABLE 2: NUMBER OF TRIPS PER HOUR IN EACH DIRECTION,
AC TRANSIT, EXISTING CONDITIONS
Extent of Service From Grand Avenue
To 11th Street
From Grand Avenue
To 7th Street
From Grand Avenue
To Jack London District
Line Peak Off-peak Peak Off-peak Peak Off-peak
51A 6 5 6 5 -- --
58L 2 2 2 2 2 2
72 2 2 2 2 2 2
72M 2 2 2 2 2 2
72R 5 5 5 5 5 5
Shuttle 5 5 5 5 5 5
Total trips/hour 40 38 24 23 16 16
Average wait time
(min) 1.5 1.6 2.5 2.6 3.8 3.8
Source: AC Transit
Of the 28 AC Transit routes in the corridor, Route 51A is both the longest (within the corridor) and
most frequent, at up to six buses per hour. It is defined internally by the agency as a Trunk route,
and it regularly ranks among the highest-performing services in the system for both total
ridership and productivity. Average boardings per weekday at Route 51A stops within the corridor
totaled 4,910 as of Fall 2012.
Along with Route 51B between Rockridge and West Berkeley, Route 51A is the focus of AC
Transit’s Line 51 Corridor Delay Reduction and Sustainability Project (CDRS), an effort to improve
speed and reliability using low-cost measures such as “bus bulb” stops on sidewalk extensions,
transit signal priority and “queue jump” bypasses. AC Transit is currently discussing changes to
City streets with Oakland staff.
2.3.3 BROADWAY “B” SHUTTLE
The B on Broadway shuttle, also known as The Free B or simply The B, is the existing circulator
service in the corridor. Administered by the City of Oakland and operated under contract by AC

2-25
Transit, it operates primarily on Broadway from Jack London Square to Grand Avenue on
weekdays and to 27th
Street on Friday and Saturday nights.
At Jack London, it makes a counterclockwise loop on Embarcadero, Webster and 2nd
streets. At
the north end, the weekday route makes a clockwise loop of Grand, Webster and 20th
streets,
while the weekend night route makes a clockwise loop of 27th
, Valdez and 26th
streets. These
alignments are shown in Figure 12.
Figure 12: Official B Shuttle Map
Service is provided every 10 minutes during peak periods (including lunch hours) , every 15
minutes during the weekday off-peak, and every 12 minutes on weekend nights.
The service is fare-free and uses distinctively branded low-floor buses. Together, these factors
allow for faster loading and unloading, reducing dwell times.
Introduced in 2010, the B has proven popular with downtown residents, workers and visitors, and
as of the first quarter of 2013 average weekday ridership was 2,756. The B is among the most
productive bus routes in the Bay Area outside of San Francisco.
2.3.4 AMTRAK
The Jack London Square Amtrak Station is between Embarcadero and 2nd
Street at Alice Street.
The main Amtrak station for the City of Oakland, it is served by both medium- and long-distance
intercity rail lines.
The Jack London Square station serves 42 trains daily and over 400,000 passengers per year. Most
of the station’s ridership is via the Capitol Corridor, which operates 30 daily trains between the
Sacramento area and San Jose. Amtrak’s San Joaquin service also terminates at Oakland, which

2-26
operates eight daily trains to Bakersfield. Four long-distance Coast Starlight trains also stop at
Oakland on its route between Seattle and Los Angeles.
2.3.5 SAN FRANCISCO BAY FERRY
The Oakland Jack London Square Ferry Terminal is at the foot of Clay Street, two blocks to the
west of Broadway and one block south of Embarcadero. Regularly-scheduled San Francisco Bay
Ferry service is available to Alameda’s Main Street Terminal and to the Ferry Building and Pier 41
in San Francisco (30 trips per weekday, 24 on Saturdays and Sundays) as well as to South San
Francisco (eight trips per weekday). Seasonal service is provided to San Francisco’s AT&T Park and
to Angel Island.
2.3.6 MEDICAL CENTER SHUTTLES
Both Kaiser Permanente and Sutter Health fund shuttle services in the Pill Hill area that are free
and open to the general public. These services provide connections between the MacArthur BART
Station and Kaiser’s Oakland Medical Center and between the station and the Summit Campus of
Sutter’s Alta Bates Summit Medical Center. Kaiser operates two routes from 7 a.m. to 7 p.m.
weekdays, one running every 8 minutes (the Special Medical Office Building/Loop route) and the
other every 20 minutes (the SMOB/Medical Center route). Alta Bates, meanwhile, operates two
routes every 20 minutes from 4:30 a.m. to 9 p.m. weekdays, plus late-night on-call service.
2.4 TRAFFIC AND PARKING CONDITIONS
2.4.1 TRAFFIC CONDITIONS
The Broadway corridor represents a key north-south thoroughfare for automobile traffic in
Oakland. A few key congested areas exist along the Broadway corridor:
On 2nd
and 3rd
Streets at Franklin, loading activities from the Produce District regularly
impede traffic flow
At 5th
and 6th
streets, turning queues into the Webster Tube regularly spill over onto
Broadway

2-27
As noted previously, there is significant bus traffic on Broadway in Downtown Oakland,
which can become congested during peak travel hours
The section of Broadway, between 7th
Street and Grand Avenue, has parallel streets
(Franklin Street, Webster Street) that are currently underutilized.
The Broadway/Grand intersection is among the most congested on the corridor
From Hawthorne to 38th
, seven traffic lights are closely spaced together, including many
with short left turn queues that regularly spill over, slowing traffic flow
In Rockridge, College Avenue is regularly congested due to its limited capacity
It is worth noting that AC Transit’s Line 51A Project will help alleviate traffic congestion on
Broadway by upgrading traffic signals from 8th
Street to College Ave.
The Broadway corridor is also a major bikeway in Oakland. Bike lanes are intended to span the
entire Broadway corridor north of Webster/25th
, plus north of 22nd
St in the northbound direction.
South of Webster/25th, the designated bikeway transitions to the Webster and Franklin couplet.
To the west of Broadway, a parallel bikeway is under development on Telegraph Ave, Clay St, and
Washington St. While the intent is to direct bicyclists to these parallel bikeways, a significant
number of bicyclists continue to use Broadway.
2.4.2 PARKING CONDITIONS
Parking is present intermittently along the Broadway corridor:
Along the entirety of 2nd
and 3rd
streets, street parking is present
Street parking is generally present along Broadway between 2nd
and 10th
, but is not
present between 10th
and 17th
(except a few loading zones), and occurs sporadically
between 17th
and 20th
North of 20th
, street parking is present along the entirety of Broadway, except for a short
stretch adjacent to Kaiser Medical Center
Street parking is present along both 40th
St and College Ave
The Broadway Valdez District Specific Plan Draft EIR (2013) indicated that the
approximately 400 on-street metered parking spaces in the Plan Area, most of which have
a two-hour time limit, have an overall occupancy of 70 to 80 percent during weekday
afternoons.

2-28
A 2011 study of the Jack London Square District indicated that there are approximately
1,593 on-street spaces in the district, with 292 metered parking spaces. Average overall
parking utilization is 68 percent with 60 percent of the block faces experiencing
occupancy levels over 85 percent. The highest overall parking demand for the district
occurs at 11 am with 73 percent occupancy. Parking utilization for the portion of the
district east of Broadway, where the study alignments are located, peaks at 82 percent at
11 am.
3-29
3.0 COMMUNITY PARTICIPATION
3.1 COMMUNITY MEETINGS
Two evening workshops were held to hear directly from City of Oakland residents, employees,
business owners, and transit passengers. Both workshops were held at City Hall based on its
location at the heart of the study corridor. At each workshop, the project team gave a brief
presentation and staffed stations that provided information on the study efforts to date.
The first workshop held in June, 2014 was attended by more than 50 community members. Four
stations were provided with the following topics: (1) Draft Circulator Study Purpose and Need, (2)
Enhanced Bus Alternatives, (3) Streetcar Alternatives, and (4) Economic Development Assessment
& Other Study Metrics. A total of 22 comment cards were submitted at the workshop. A total of
41 e-mails were received with additional comments.
The second workshop held in October, 2014 was attended by more than 40 community members.
The team provided six stations with the following topics: (1) Public Comments Received to Date,
(2) Evaluation of Enhanced Bus Alternatives, (3) Evaluation of Streetcar Alternatives, (4) Economic
Development Evaluation, (5) Draft Study Report – Next Steps, and (6) Study Survey. A total of 20
comment cards were submitted at the workshop. A total of 23 e-mails were received with
additional comments.
To advertise the workshops, announcements were posted on the websites and/or social media
channels of the City of Oakland, AC Transit, and BART. Announcements were also sent to media
outlets such as Channel 2.
3.2 BUSINESS ADVISORY COMMITTEE
A total of more than 20 Downtown Oakland business organizations were invited to participate in
two Business Advisory Committee meetings. The meetings included a review of the draft study
alternatives including alignment and stop locations, study goals, purpose and need, funding
options, and the economic development evaluation methodology. The project study team also
3-30
held focus meetings with individual business organizations such as the Building Owner’s and
Manager’s Association (BOMA)/Oakland-East Bay.
3.3 PROJECT WEB SITE
The study website, at oaklandnet.com/BroadwayTransit, contained project information of potential
interest to community members. It included a description of a project overview, the project
purpose, and study process and schedule. The website also provided project deliverables as well
as details about the two community workshops, a link to an online survey, and staff contact
information for community members with questions about the study.
3.4 SURVEY
The survey, administered through SurveyMonkey, asked a number of questions about
respondents’ key demographic characteristics and use of the B Shuttle and AC Transit.
The survey was taken by 34 people to date. Below are some highlights from the survey results:
When asked how the City should prioritize near-term expansions for the B Shuttle,
participants ranked options in the following order.
1. Extend route north to Kaiser Medical Center & Piedmont Avenue
2. Provide longer weekday service hours (extend to midnight)
3. Provide longer weekend service hours (extend to 1:00 am)
4. Provide more frequent service (5 to 10 minute headways)
When asked how the City should prioritize investment options for a major transit project
in the study corridor, participants ranked options in the following order.
1. Faster Service
2. Real-time arrival electronic display signs
3. Improved wayfinding signage
4. Faster/easier boarding on transit vehicles
5. High quality stations with signing
6. Smoother ride
7. Distinctive branding
3-31
When asked whether they would be willing to pay a fare for an enhanced bus alternative,
93% said yes to a $1 fare, 67% said yes to a $1.50 fare, and 36% said yes to a $2 fare.
When asked whether they would be willing to pay a fare for a streetcar, 93% said yes to a
$1 fare, 73% said yes to a $1.50 fare, and 59% said yes to a $2 fare.
3.5 CORRIDOR WALK AUDIT
A walk audit was performed at the beginning of the study process to identify existing conditions,
opportunities, constraints, barriers, and candidate stop locations. Attending were staff members
from several agencies including the City of Oakland, Alameda County Transportation Commission,
AC Transit, BART, the Capitol Corridor Joint Powers Board, and SF Bay Ferry.

4-32
4.0 EVALUATION METHODOLOGY
4.1 EVALUATION PROCESS
The evaluation process for this Study has been designed for consistency with local, regional, and
federal goals. The evaluation process reflects the Study’s goals and Purpose & Need, previously
outlined in Sections 1.1 and 1.4, respectively. Because it is anticipated that the Study may be the
first step in a Federal Transit Administration (FTA) Small Starts Program funding approval process,
the evaluation framework was designed to be consistent with FTA Project Justification criteria and
related guidance. The six project justification criteria for the FTA Small Starts Program are as
follows.
Mobility (number of transit trips using the project)
Economic Development Effects (transit-supportive plans and policies, optional
quantitative analysis)
Environmental Benefits (benefits to human health, safety, energy, and air quality)
Cost Effectiveness (annual capital and operating cost per trip for project)
Land Use (station area population densities, total employment served by project,
affordable housing share)
Congestion Relief (new metric still under development)
The framework has also been designed to be consistent with Metropolitan Transportation
Commission (MTC) Plan Bay Area Transportation Project Performance Assessment criteria, which
were recently developed by MTC to evaluate proposed transportation projects within the region.
In keeping with best practice in development of evaluation frameworks, a hierarchy of goals (in
this case, “principles” reflecting both the adopted goals and Purpose and Need Framework),
supporting objectives and related criteria has been developed.

4-33
The project includes three rounds of evaluation, described in this document as “preliminary
screening,” “initial evaluation” (Section 5.0), and “final evaluation” (Section 6.0):
Preliminary screening based on qualitative assessments was conducted by the consultant
team following the Walking Audit in order to narrow the range of possible conceptual
alternatives to no more than a half-dozen alternatives that can be subjected to formal
evaluation.
Initial evaluation was conducted using the evaluation framework described below to
narrow the range of remaining alternatives to three final alternatives (not including a no-
build alternative).
Final evaluation was conducted using the same framework, and a preferred alternative
was selected.
A more detailed narrative of the evaluation methodology is available in the technical
compendium.
4.2 SCREENING CRITERIA
The evaluation criteria are displayed below in Table 3.

4-34
TABLE 3: EVALUATION FRAMEWORK
Goals and Objectives Initial Evaluation Final Evaluation
A Improve the quality of transit
service in the corridor. A1 Provide reliable service that is relatively free of delay. Estimated variability in peak travel times
Qualitative assessment based on conceptual
designs and existing traffic Qualitative assessment based on operational analysis
A2 Enhance awareness of transit services. Visibility of infrastructure and potential for public
understanding of service
Qualitative assessment based on conceptual
designs and existing transit network Ridership projections
A3 Leverage and integrate existing transit investments.
Potential to increase network connectivity and
provide “first/last mile” connections to and from
transit nodes
Qualitative assessment based on conceptual
designs and existing transit network See initial
A4 Contribute to the utility and efficiency of the overall
transit system within the corridor.
Potential impacts on demand for and cost-
effectiveness of other services/opportunities to
reconfigure impacted services
Qualitative assessment based on conceptual
designs and existing transit network
Qualitative assessment based on system integration
analysis
A5 Improve access to jobs and social services for
disadvantaged communities.
Numbers of low-income, ethnic minority and zero-car
households within one-quarter mile of stops
Quantitative analysis based on U.S. Census data in
Existing Conditions section See initial
B Provide safe, multimodal
travel options. B1 Minimize conflicts between transit and other modes. Opportunities for physical conflicts between users
Qualitative assessment based on conceptual
designs and existing and proposed street
configurations
Revised qualitative assessment based on conceptual
designs and existing and proposed street configurations
C Support economic and
community development. C1
Support transit-oriented development that is
consistent with local and regional policies.
Potential impact of project on type, form and scale of
adjacent developments.
Qualitative assessment based on conceptual
designs and service levels
Estimated jobs and housing growth above baseline growth
scenario
C2 Improve access to retail and other businesses. Multimodal access to businesses/impacts of design
on businesses
Qualitative assessment based on conceptual
designs and service levels Estimated growth in retail sales and hotel revenue
C3 Preserve and enhance the character of and quality of
life in existing neighborhoods.
Potential to contribute to identify and perceived
quality of districts
Qualitative assessment based on placemaking
opportunities Estimated growth in property values
D
Deliver a project that is cost-
effective, feasible, and has
community support.
D1 Prioritize projects that would be cost-effective to build
and operate. Estimated capital and operating cost per rider
Preliminary capital cost ÷ preliminary annual
boardings
Preliminary annual operating cost ÷ preliminary
boardings
Estimated capital cost (from projections) ÷ estimated
annual boardings (from projections)
Estimated annual operating cost (from estimates) ÷
estimated annual ridership (from projections)
D2 Prioritize projects with a viable operator and
administrative structure.
Potential willingness of existing
organizations/potential for new organization to
administer and operate
Qualitative assessment Qualitative assessment based on operations analysis
D3 Prioritize projects with the potential to earn
widespread community acceptance.
Likely level of support from community members,
community leaders and policy makers Qualitative assessment
Revised qualitative assessment, including environmental
analysis
D4 Prioritize projects with a realistic phasing and funding
plan.
Potential for phased implementation (based on
viability of individual phases)
Qualitative assessment based on conceptual
designs, including alignments, stop locations and
right-of-way configurations
See initial
5-35
5.0 INITIAL SCREENING OF ALTERNATIVES
5.1 DESCRIPTION OF INITIAL ALTERNATIVES
5.1.1 PRELIMINARY ALTERNATIVES CONSIDERED
At the beginning of the study process, a wide range of potential alignments were considered
within the study corridor to connect Jack London Square, Downtown Oakland, and
Temescal/Rockridge. These alternatives were discussed amongst the consultant team, the City of
Oakland, and the Technical Advisory Committee, and narrowed down to seven alternatives that
were carried into the initial screening.
Several alternatives were considered and not carried forwarded for a variety of reasons. This
includes an alignment along West MacArthur Boulevard, a loop around the Kaiser Medical Center,
and an extension of the streetcar extension to waterfront uses such as the Brooklyn Basin project,
the Ferry Terminal, and Howard Terminal. The following provides a brief discussion of reasons
why these alternatives were not pursued.
West MacArthur Boulevard and 40th
Street were considered as alternative routes from the Kaiser
Medical Center to the MacArthur BART station. 40th
Street was selected as the preferred
alignment to the BART station for several reasons including that it more directly serves the BART
station plaza and is consistent with transit route alignments shown in both the West Oakland
Specific Plan and the ongoing Emeryville-Berkeley-Oakland-Transit-Study (EBOTS) being
conducted by the City of Emeryville.
An interim terminus (clockwise) loop around the Kaiser Medical Center – with an alignment on
segments of Broadway, MacArthur Boulevard, and Piedmont Avenue – was considered for the
streetcar alternative. This alternative was not pursued further given the constrained width on
Piedmont Avenue as well as the throwaway costs associated with track improvements that would
not be used with future extensions. An alternative terminus option, with a median platform at 38th
Street, is included in the study alternatives.
An extension of the streetcar alternatives to waterfront uses such as the Brooklyn Basin project,
the Ferry Terminal, and Howard Terminal was not pursued further because it would require an at-
grade crossing of the Union Pacific (UP) freight tracks. While an at-grade streetcar crossing of the
5-36
freight tracks is possible, it would be challenging on several fronts, including a prolonged process
working with UP and the California Public Utilities Commission (CPUC) to obtain their support and
approval. CPUC staff indicated the following concerns: 1) the streetcar would need to get
approval from UP dispatch every time it crosses the tracks (whereas a bus wouldn’t), causing
significant delays 2) Higher likelihood of derailment from diamond crossings and 3) Overhead
wire clearance for the freight/Amtrak trains (off-wire technology notwithstanding). Streetcar
projects in other cities in the US have not had success gaining approvals for at-grade crossings of
major active freight lines.
5.1.2 ALTERNATIVES EVALUATED IN INITIAL SCREENING
The seven conceptual alternatives evaluated in this document were developed and refined by
consultants, staff, and members of the TAG using an iterative, collaborative process. They include
three streetcar alternatives and four bus alternatives, and may briefly be described as:
Streetcar
o Jack London Square-27th
Street
o Jack London Square-MacArthur BART
o Jack London Square-Rockridge BART
Bus
o Brooklyn Basin -27th
Street
o Brooklyn Basin -MacArthur BART
o Brooklyn Basin -Rockridge BART
o Brooklyn Basin-Uptown Transit Center
The fourth bus alternative, Brooklyn Basin-Uptown Transit Center, is not an alternative that serves
the Broadway corridor in its entirety, and thus would only be implemented in combination with
one of the other concepts. For purposes of evaluation, however, it was assessed separately.
The three streetcar alternatives share the intersection of 2nd
and Oak streets in Jack London
Square as one terminus and are identical in terms of alignment and stop locations through 27th
Street and Broadway. The bus alternatives share the Brooklyn Basin development as the southern
terminus location. Along Broadway, all alternatives share a similar alignment and stop locations

5-37
between 2nd
Street and 40th
Street. The mode and northern terminus of each alternative are the
primary differences between them.
5.2 INITIAL SCREENING EVALUATION
Table 4 on the following pages summarizes findings from the evaluation in tabular or matrix
format. Numerical ratings are illustrated using shaded circles, with darker shades and larger circles
representing stronger performance.
A detailed initial screening evaluation can be found in the technical compendium.

5-38
TABLE 4: SUMMARY OF INITIAL SCREENING
Principles Objectives Criteria
Alternatives
Streetcar Enhanced Bus
Jack London
Square-27th
St
Jack London
Square-
MacArthur
BART
Jack London
Square-
Rockridge
BART
Brooklyn
Basin-27th
St
Brooklyn
Basin -
MacArthur
BART
Brooklyn
Basin -
Rockridge
BART
Brooklyn
Basin-Uptown
Transit Center
A Improve the quality of transit
service in the corridor.
A1 Provide reliable service that is
relatively free of delay.
Estimated variability in peak
travel times
A2 Ensure adequate capacity to
serve existing and future
demand.
Throughput
A3 Enhance awareness of transit
services.
Visibility of infrastructure and
potential for public
understanding of service
A4 Leverage and integrate existing
transit investments.
Potential to increase network
connectivity and provide
“first/last mile” connections to
and from transit nodes
A5 Contribute to the utility and
efficiency of the overall transit
system within the corridor.
Potential impacts on demand
for and cost-effectiveness of
other services/opportunities to
reconfigure impacted services
B Provide safe, multimodal travel
options.
B1 Minimize conflicts between
transit and other modes.
Opportunities for physical
conflicts between users
B2 Increase overall capacity for
“person movement” (rather than
vehicle movement) within the
corridor.
Estimated peak hour capacity of
all vehicles along alignment
C Support economic and
community development.
C1 Support transit-oriented
development consistent with
local and regional policies.
Potential impact of project on
type, form and scale of adjacent
developments
C2 Improve access to retail and
other businesses.
Multimodal access to
businesses/impacts of design on
businesses
C3 Preserve and enhance the
character of and quality of life in
existing neighborhoods.
Potential to contribute to
identity and perceived quality of
districts

5-39
TABLE 4: SUMMARY OF INITIAL SCREENING
Principles Objectives Criteria
Alternatives
Streetcar Enhanced Bus
Jack London
Square-27th
St
Jack London
Square-
MacArthur
BART
Jack London
Square-
Rockridge
BART
Brooklyn
Basin-27th
St
Brooklyn
Basin -
MacArthur
BART
Brooklyn
Basin -
Rockridge
BART
Brooklyn
Basin-Uptown
Transit Center
D Support environmental
sustainability and enhanced
public health.
D1 Reduce emissions of CO2 and
other harmful pollutants.
Estimated decrease in number
of vehicle miles traveled
(streetcar)4
− − − −
Estimated decrease in number
of vehicle miles traveled (bus) − − −
E Enhance social equity. E1 Improve access to jobs and
social services for communities
of concern.
Numbers of low-income, ethnic
minority and zero-car
households within one-quarter
mile of stops
F Deliver a project that is cost-
effective, feasible, and has
community support.
F1 Prioritize projects that would be
cost-effective to build and
operate.
Estimated capital cost per rider
(streetcar) − − − −
Estimated capital cost per rider
(bus) − − −
Estimated operating cost per
rider (streetcar) − − − −
Estimated operating cost per
rider (bus) − − −
F2 Prioritize projects with a viable
operator and administrative
structure.
Potential willingness of existing
organizations/potential for new
organization to administer and
operate
F3 Prioritize projects with the
potential to earn widespread
community acceptance.
Likely level of support from
community members,
community leaders and policy
makers
F4 Prioritize projects with a realistic
phasing and funding plan.
Potential for phased
implementation (based on
viability of individual phases)
4 Because modeling of VMT impacts has not yet been conducted, ridership has been used as a proxy for VMT at this stage of the evaluation. Additionally, because different methodologies were used to estimate ridership for streetcar and bus alternatives, streetcar
alternatives have been compared only to other streetcar alternatives, and bus alternatives have been compared only to other bus alternatives for this objective as well as cost-per-rider criteria.

5-40
5.3 INITIAL SCREENING RESULTS
Based on a review of the Draft Initial Evaluation of Alternatives Memo (January 2014), the TAG approved
five alternatives for consideration for the Phase 2 evaluation. The TAG directed that follow-up meetings
occur with City of Oakland and AC Transit to determine whether the enhanced bus alternative should
serve the Brooklyn Basin development. After two follow-up meetings, both agencies concluded that the
core enhanced bus alternatives should not include a connection to the Brooklyn Basin development.
Both AC Transit and City staff felt that it would be best for the enhanced bus and streetcar alternatives to
have similar terminus points, so that the evaluation would reflect the costs and benefits for a common
study area. The recommendation is that the following three alternatives be evaluated in detail.
1. Streetcar: Jack London Amtrak to MacArthur BART
2. Enhanced Bus: Jack London Amtrak to MacArthur BART
3. Enhanced Bus: Jack London Amtrak to Rockridge BART
As the first two alternatives have similar terminus points, the evaluation metrics can be compared on an
apples-to-apples basis.
The evaluation qualitatively addresses a series of potential extension options including a Jack London
Amtrak-Brooklyn Basin extension of the enhanced bus alternative.
Two phasing options will be evaluated as follows, with the latter serving the Kaiser Permanente Oakland
Medical Center area.
a. Jack London Amtrak to 27th
Street
b. Jack London Amtrak to 38th
Street
Additional meetings and correspondence also occurred with City of Oakland and BART staff to review
potential terminus alignments for the streetcar alternatives at the MacArthur BART station. The consultant
team also reviewed planning documents prepared for the EBOTS study, which identified transit
alternatives along the 40th
Street corridor with connections to the MacArthur BART station. It was
determined that the alternative alignments that connected to the MacArthur BART station along 40th
Street for the Broadway Transit Urban Circulator Study were consistent with both the EBOTS alternatives

5-41
and the transit loop alignment identified in the West Oakland Specific Plan. It was also determined that at
least one feasible streetcar terminus alignment is available at the MacArthur BART station.
6-42
6.0 FINAL SCREENING OF ALTERNATIVES
6.1 DESCRIPTION OF FINAL ALTERNATIVES
Three alternatives that are the subject of the final evaluation screening for this study, including two
enhanced bus alternatives and one streetcar alternative, are described in this document. The terminus
points of the three alternatives are identified below.
1. Enhanced Bus Alternative #1: Jack London Amtrak Station (Oak Street) to MacArthur BART Station
2. Enhanced Bus Alternative #2: Jack London Amtrak Station (Oak Street) to Rockridge BART Station
3. Streetcar Alternative #1: Jack London Amtrak Station (Oak Street) to MacArthur BART Station
Enhanced Bus Alternative #1 and Streetcar Alternative #1 have the same terminus points and virtually the
same alignment and station locations. The bus or streetcar circulator vehicles will generally operate in
mixed flow traffic in the curb (outside) or center (inside) travel lane.
A key aspect of all three alternatives is a dedicated transit lane on Broadway between 7th
Street and 22nd
Street. The curb travel lane in this segment of Broadway would be dedicated for exclusive use by transit
vehicles and autos making right turn movements at intersections or mid-block access points.
Phasing and extension options that will be discussed in the study report are also described in this
document. The alignment of the three final study alternatives is shown in Table 5.
6.1.1 ENHANCED BUS ALTERNATIVES
The enhanced bus alternatives evaluated in this study differ from most traditional bus circulator projects
in that they involve a higher level of investment in transit facilities. The anticipated components for the
enhanced bus alternatives include fixed guideway improvements, stop improvements, advanced vehicle
technology, pedestrian improvements adjacent to bus stops, and wayfinding improvements. The following
is a brief description of the scope of those components.
6.1.1.1 Capital Improvements
The enhanced bus alternatives would include the following capital improvements:

6-43
1. Fixed Guideway Improvements
a. Optional reconstruction of curbside travel lane with concrete pavement, lane markings, and
signage for dedicated transit lane on Broadway between 7th
Street and 22nd
Street
b. New traffic signal equipment to provide advanced transit signal priority for corridor from Jack
London Square to 8th
St and along 40th
St (to supplement pending Line 51 transit signal
priority improvements)
2. Stop Improvements
a. Curb bulb-outs approximately 60-120 feet in length (note it is expected that the enhanced
bus alternative would share the new bulb-out stops being constructed in the next 2 years as
part of the Line 51 project along segments of Broadway and College Street)
b. Utilize existing bus stop locations to minimize parking loss
c. Shelter and associated amenities (see Table 3)
d. Potential fare collection equipment
3. Low-Floor, High Capacity Bus Vehicles
a. 6-12 buses, including spares, depending on route length and service plan
b. Potential on-board fare collection equipment
4. Pedestrian Improvements Adjacent to Bus Stops
a. Any necessary sidewalk or street crossing enhancements, to be determined after more
detailed engineering plans are developed
b. New pedestrian scale lighting
5. Wayfinding Improvements
a. Signage improvements directing pedestrians to bus stops
b. Information kiosks at key bus stops showing key local destinations
Table 6-1 shows the conceptual stop enhancements and the primary objectives served by each element.
The concept consists primarily of a toolbox or menu of options to increase the visibility of and user
amenity at stops, to reduce delay through stop design, or both. Measures include:
Sidewalk extension stops (sometimes known as “bulb-outs” or simply “bus bulbs”)

6-44
Stops designed for Circulator service
Large, custom-designed shelters
Highly visible signage (including signs identifying the location of the stop)
Real-time arrival displays (aka “countdown clocks”)
Maps and other information
Ticket vending machines or validators (if a fare is charged)
Designation on platforms of loading areas for wheelchairs and bicycles (if allowed)
Trash receptacle
Security cameras
TABLE 5: CONCEPTUAL IMPROVEMENTS FOR ENHANCED BUS STOPS
Enhanced Bus Elements Reduces
Delay?
Increases
Visibility/
Awareness?
Improves
Customer
Amenity?
Sidewalk extension stops (aka “bulb-outs” or “bus bulbs”) √ √
Stops designed for circulator service √ √
Large, custom-designed shelters √ √
Highly visible signage (incl. signs identifying location of stop) √ √
Custom “branding” service (e.g. unique color and/or style of bus,
signage and shelter) √
Real-time arrival displays (aka “countdown clocks”) √
Maps and other information √
Ticket vending machines or validators allowing for off-board fare
collection (if fare is charged) √ √ √
Visible designation on platform of loading areas for wheelchairs
and bicycles (if permitted) √ √ √
Trash Receptacle √
Security Cameras √
6-45
These measures are most often found in bus rapid transit or BRT projects such as that planned by AC
Transit between Downtown Oakland and San Leandro. Two such stops are planned for BRT on Broadway
at 14th Street and 20th
Street.
The “enhanced bus” concept includes a dedicated transit lane, as described in the introduction above, and
transit signal priority (TSP will be installed at some intersections on Broadway as part of AC Transit’s Line
51 improvement project).
6.1.1.2 Alignment
The enhanced bus vehicles will operate in mixed flow traffic in the curb (outside) travel lanes along the
entire route. The enhanced bus alignment would be located along the following street segments.
1. 2nd
Street : Oak Street to Webster Street
2. Webster Street: 2nd
Street to Embarcadero
3. Embarcadero: Webster Street to Broadway
4. Broadway: Embarcadero to 40th
Street
5. 40th
Street: Broadway to Martin Luther King, Jr. Way (MacArthur BART alternative only)
6. Broadway: 40th
Street to College Avenue (Rockridge BART alternative only)
7. College Avenue: Broadway to Rockridge BART parking lot (Rockridge BART alternative only)

6-46
Figure 13: Enhanced Bus Alternatives
Figure X: Enhanced Bus Alignment

6-47
Near either terminus, multiple alignment variations are available:
At Jack London Square, the enhanced bus could travel along Embarcadero, following the present
route of the B Shuttle (eastbound/southbound) and 72M, or it may run on 2nd
Street, following
the westbound/northbound B route. The Embarcadero alignment option would bring the shuttle
closer to the waterfront and heart of Jack London Square, but crossing the Union Pacific tracks
may present a source of delay. The 2nd
Street alternative may save time and be subject to less
delay from rail crossings, but it may face delays from loading in the Produce District and be
subject to more conflicts with bicyclists.
At MacArthur BART, it is anticipated that the enhanced bus would terminate/ layover along West
St one block west of the station. To turn around, the bus would travel along either 39th
or 41st
Streets.
At Rockridge BART, it is assumed the enhanced bus would follow the existing protocol of the 51A.

6-48
6.1.1.3 Enhanced Bus Maintenance Facility
It is assumed that the buses will be stored and maintained at a facility owned by the bus operator.
6.1.1.4 Enhanced Bus Phasing Options
One phasing option will be evaluated for the enhanced bus alternatives as follows. The station locations
for this initial phase are shown in Table 3.
1. Jack London Square Amtrak to 27th
Street
It is worth noting that individual components for the enhanced bus alternatives may also be phased over
time – each component is independent from one another, and could occur as funding becomes available.
6.1.1.5 Enhanced Bus Extension Options
One potential extension option will be qualitatively discussed for the enhanced bus alternatives as follows.
The conceptual station locations for the extension segment are shown below.
1. Jack London Square Amtrak to Brooklyn Basin Development

6-49
a. Embarcadero @ Landing at Jack London Square
b. Embarcadero and 5th
Avenue
c. 8th
Avenue & 6th
Avenue
6.1.2 STREETCAR ALTERNATIVE
The anticipated components for the streetcar alternative include fixed guideway improvements, stop
improvements, utility relocation, streetcar vehicles, a streetcar vehicle storage and maintenance facility,
pedestrian improvements adjacent to stops, and wayfinding improvements. The following is a brief
description of the scope of those components based on similar streetcar projects.
6.1.2.1 Capital Improvements
1. Fixed Guideway Improvements
a. Track improvements in travel lanes
b. Overhead catenary system – poles in median or curbside, with mast arms or wires to support
overhead trolley wires
c. Reconstruction of curbside travel lane with concrete pavement, lane markings, and signage
for dedicated transit lane on Broadway between 7th
Street and 22nd
Street
d. Traffic Signals – new traffic signals or modifications to existing traffic signals to support
streetcar pre-emption and/or priority treatments
2. Stop Improvements
a. Curb bulb-outs approximately 50-75 feet in length with 8-10 inch high curbs
b. Potential loss of up to 3-4 on-street parking spaces per stop location
c. Shelter and associated amenities
d. Potential fare collection equipment
3. Utility Relocation
a. Any necessary relocation of public (i.e., storm drain, sewer) or private (i.e., gas,
telecommunications) utilities, to be determined after more detailed engineering plans are
developed
4. Streetcar Vehicles

6-50
a. 6-12 streetcar vehicles, including spares, depending on route length and service plan
b. Potential on-board fare collection equipment
5. Vehicle Storage and Maintenance Facility
a. 2-3 acre fenced facility with storage tracks, maintenance building, and wash facilities
b. Track connecting storage/maintenance facility to revenue service track
6. Pedestrian Improvements Adjacent to Streetcar Stops
a. Any necessary sidewalk or street crossing enhancements, to be determined after more
detailed engineering plans are developed
b. New pedestrian scale lighting
7. Wayfinding Improvements
a. Signage improvements directing pedestrians to streetcar stops
b. Information kiosks at key streetcar stops showing key local destinations
6.1.2.2 Alignment
The streetcar vehicles will operate in mixed flow traffic in the curb (outside) travel lanes from the Oak
Street Terminus to the intersection of Broadway/23rd
Street. From that point north, streetcar vehicles will
operate in the center (inside) travel lanes on Broadway and 40th
Street. The streetcar tracks would be
located along the following street segments, as shown in Figure 6-3. Table 6-3 provides a list of
conceptual streetcar stop locations, which are also shown in the attached figure.
1. 2nd
Street : Oak Street to Broadway
2. Webster Street: 2nd
Street to Embarcadero (southbound lane only)
3. Embarcadero: Webster Street to Broadway (westbound lane only)
4. Broadway: Embarcadero to 40th
Street
5. 40th
Street: Broadway to Martin Luther King, Jr. Way

6-51
Figure 14: Streetcar Alternatives

6-52
Near either terminus, multiple alignment options are available:
At Jack London Square, the streetcar may run exclusively on 2nd
Street or travel
eastbound/southbound on 2nd
Street and westbound/northbound on Embarcadero or 3rd
Street.
Each alignment has its advantages and disadvantages:
o 2nd
Street is officially designated as a part of the Bay Trail. Because streetcar tracks are
incompatible with bicycles, a 2nd
Street alignment of any kind would necessitate either the
relocation of the Bay Trail to 3rd
Street or the partial removal of parking and replacement with
a cycle track. Additionally, streetcar operations alongside curbside parking and through the
Produce District present a risk for delay if a car or truck obstructs the trackway.
o 3rd
Street provides more space for streetcar operations due to its greater width, but much of
the additional width is currently utilized as angled parking – an incompatible configuration
with streetcars. The conversion of angled parking to parallel parking would result in some
parking loss. 3rd
Street also provides less direct service to Jack London Square.
o Embarcadero provides direct “front door” access to Jack London Square, but locating
westbound streetcar tracks along the street may be infeasible as the full right-of-way is
owned by Union Pacific Railroad and concerns have been expressed about the proximity of
streetcar tracks to the freight tracks. Although the streetcar would not cross the Union Pacific
tracks, it would run within the ROW and therefore be subject to approval by Union Pacific and
the California Public Utilities Commission, increasing cost, lengthening the project timeline,
and adding uncertainty.
Near MacArthur BART, two stop locations are in need of further study:
o A streetcar would stop at either Webster or Shafter; however, at either of these locations, the
stop would replace a left turn pocket (either northbound or southbound). A review of traffic
volumes and community input is necessary to refine this stop location.
o At MacArthur BART, a more in-depth engineering assessment is necessary to determine the
feasibility of locating a stop adjacent to the station. It appears that a median stop will fit
while preserving the left turn access into the station; however, the positioning of the freeway
pillars limits available space.

6-53

6-54
6.1.2.3 Streetcar Maintenance Facility
Candidate sites for this study were publicly-owned parcels that are generally vacant or underutilized. A
review of privately-owned parcels along the study corridor, conducted with City staff, yielded no viable
candidate sites at this time. The publicly-owned parcels are more affordable and generally more feasible
to develop. A buffer of roughly 2,000 feet was used to capture all potential candidate parcels. Individual
vacant or underutilized parcels that were deemed to be too small were eliminated. A minimum parcel size
of 2 acres is needed for the facility. A total of 14 candidate sites were evaluated. These 14 sites
represented individual parcels or clusters of multiple publicly-owned parcels. Site #8 (shown on Figure 6-
4) includes a cluster of publicly-owned parcels under I-980 at the intersection of 7th
and Castro Street. To
access facilities at either of these locations, streetcar tracks would need to be constructed on 6th
Street
and 7th
Street between Broadway and Castro Street.
6.1.2.4 Streetcar Phasing Options
Two phasing option will be evaluated for the streetcar alternatives as follows, with the latter serving the
Kaiser Permanente Oakland Medical Center area. The station locations for these alternative initial phases
are listed in Table 6-3 and shown in Figure 6-3.
1. Jack London Square Amtrak to 27th
Street
2. Jack London Square Amtrak to 38th
Street
6.1.2.5 Streetcar Extension Options
One potential extension option will be qualitatively discussed for the streetcar alternatives as follows.
1. MacArthur BART station to Emeryville and/or West Oakland via 40th
Street (if streetcar is the
preferred alternative for EBOTS)
6.1.3 SERVICE PLAN
A conceptual service plan consisting of spans and headways for each time period is shown below in Table
6 and Table 7. The service plans vary slightly by alternative: the Rockridge alternative has a slightly longer
span to mirror the Line 51A, whereas the span of the MacArthur alternative is more in line with typical
circulator hours.

6-55
TABLE 6: SERVICE PLAN FOR MACARTHUR ALTERNATIVES
DAYS HOURS OF SERVICE HEADWAY
(Frequency in Minutes)
Monday-Thursday
6 a.m.-7 a.m. 15
7 a.m.-7 p.m. 10
7 p.m.-12 a.m. 15
Friday
6 a.m.-7 a.m. 15
7 a.m.-7 p.m. 10
7 p.m.-1 a.m. 15
Saturday 7 a.m.-1 a.m. 15
Sunday 7 a.m.-12 a.m. 15
TABLE 7: SERVICE PLAN FOR ROCKRIDGE ALTERNATIVE
DAYS HOURS OF SERVICE HEADWAY
(Frequency in Minutes)
Monday-Thursday
5 a.m.-6 a.m. 15
7 a.m.-8 p.m. 10
8 p.m.-12:30 a.m. 15
Friday
5 a.m.-6 a.m. 15
6 a.m.-8 p.m. 10
8 p.m.-1 a.m. 15
Saturday 5:30 a.m.-1 a.m. 15
Sunday 5:30 a.m.-12:30 a.m. 15

6-56
6.2 FINAL SCREENING OF TECHNICAL CRITERIA
This section details the quantitative analysis conducted for the final screening evaluation. In most cases,
each subsection provides a summary of the technical analysis, while a more detailed methodology is
available in the technical compendium. The following topics are summarized:
Ridership
Design & Circulation
Economic Development
Capital Costs
Operations & Maintenance Costs
Cost/Benefit
System Integration
Environmental
6.2.1 RIDERSHIP
Existing transit riders in the study area are served by BART, AC Transit, and the B Shuttle. BART ridership
data from October 2014 indicates that 1,930 daily riders travel within the study area via BART (i.e., they
enter one of the four BART stations in the study area – Rockridge, MacArthur, 19th
Street, or 12th
Street -
and exit at one of the other three stations). All self-contained boardings on AC Transit, between the Jack
London Square District and the Rockridge BART station, totaled 3,283 riders. The B Shuttle currently
serves approximately 2,700 daily riders. AC Transit estimates that about 40% of B Shuttle riders opt to use
the free shuttle instead of AC Transit lines. This totals 7,913 daily transit boardings in the study corridor.
A direct ridership forecast was developed to evaluate both the enhanced bus and streetcar alternatives.
Streetcar ridership was modeled based on ridership patterns of existing streetcar systems in operation,
while bus ridership was modeled based on a modified BRT model to capture the benefits of “enhanced
bus” features without the dedicated lanes typical of BRT. The direct ridership models are quick response
tools that provide preliminary ridership data for comparing alternatives at the feasibility stage. More
detailed ridership forecasts will need to be developed should the City decide to proceed with
implementation of a major circulator project.

6-57
Traditional methods of forecasting transit ridership often employ regional travel demand models to
predict ridership. Such models are relatively unresponsive to changes in station-level land use and transit
service characteristics. With the understanding that station-level land use and transit service
characteristics are decisive factors in explaining ridership at the stop level, Fehr & Peers developed a
Direct Ridership Model calibrated and validated to existing streetcar systems for ridership forecasting.
Direct Ridership Models (DRMs) are directly and quantitatively responsive to land use and transit service
characteristics within the immediate vicinity and within the catchment area of transit stations. They can
predict ridership at individual stations based on local station area and system characteristics. DRMs are
based on empirical relationships found through statistical analysis of station ridership and local station
characteristics.
The effects of station-level variables are expected to be highly significant in accurately forecasting
streetcar ridership. While streetcar systems are used for traditional commute trips, our research with
transit agencies suggests they more often provide access and circulation for downtown or city center
areas. They serve tourist needs and often duplicate existing transit service provided by bus. Thus, it was
expected that individual station-area characteristics greatly affect boardings and overall ridership
projections. Recognizing that variables affecting streetcar ridership are different than those for regional
rail systems, the basis for analysis draws from the characteristics of existing streetcar systems in Portland,
Seattle, and Tacoma. These systems were chosen because they are existing modern streetcar lines in the
US and are therefore similar to the proposed Broadway Streetcar. The BRT model was based on ridership
and other data collected from lines in the San Francisco Bay Area, Los Angeles, Seattle, Eugene, and
Cleveland. The ridership forecasts assume that a fare of approximately $2 is in place. The decision on fare
structure has yet to be made, but most of the streetcar and bus rapid transit surveyed for this work
charged a similar fare.
The MacArthur BART Streetcar was estimated to carry the highest ridership. It is estimated that
approximately 40% of the daily boardings shown for the MacArthur BART streetcar and enhanced bus
alternatives (and associated interim phases) will be riders that would otherwise use existing AC Transit
routes. The Rockridge BART enhanced bus alternative would have a substantially higher share, assuming
that the Route 51A is modified to split service (e.g., the new enhanced bus alternative from Rockridge
BART to Jack London Square, and a new route from the 20th
Street Transit Center to Alameda and the
Fruitvale BART station).
A summary of the ridership estimates both for existing routes and the proposed study alternatives are
shown below.

6-58
Table 8: Weekday Transit Boardings
Route/Alternative Daily Boardings Boardings per Mile
EXISTING TRANSIT SERVICE
B Shuttle 2,700 905
BART (trips within study corridor, Rockridge to 12th
) 1,930 570
Existing AC Transit (trips within study corridor, Rockridge BART
Station to Jack London Square District) 3,283 421
Total Existing BART, AC Transit, and B Shuttle Service 7,913 n/a
STUDY ALTERNATIVES
Jack London Square to MacArthur BART Enhanced Bus 4,404 595
Jack London Square to Rockridge BART Enhanced Bus 5,173 631
Jack London Square to 27th Street Streetcar (Phase) 3,873 922
Jack London Square to MacArthur Boulevard Streetcar (Phase) 4,705 855
Jack London Square to MacArthur BART Streetcar 5,886 795
6.2.2 DESIGN & CIRCULATION
The consultant team and the City of Oakland Public Works Department performed a preliminary
assessment of design and circulation issues to evaluate potential impacts associated with each alternative
for people who drive, bike, and walk on Broadway. A summary of impacts is below.
6.2.2.1 Overall Project Impacts
Regardless of alternative selected, an enhanced transit line on Broadway will change the design and
circulation patterns of the street. The following impacts are worth noting:
Dedicated transit lines on Broadway from 7th
to 22nd
Streets will reduce vehicle capacity; however,
this will improve overall “person-movement” on Broadway given the high volume of bus traffic.
Bulbouts at stops may reduce parking at some locations. In general, these stops will mirror
existing bus stop locations, so it is anticipated these impacts will be minimal.

6-59
Obstructions resulting from double-parked trucks in the Produce District present obstacles to
reliable transit operations along 2nd
and 3rd
6.2.2.2 Enhanced Bus
The enhanced bus will generally result in few impacts to design and circulation apart from those
associated with dedicated transit lanes and bulbouts as noted in 6.2.2.1. A few issues were highlighted,
though, for the alignments along 40th
St and College Ave:
Along 40th
, a higher frequency of curbside buses may increase conflicts with people bicycling
along the existing supersharrow “green carpet” bikeway in the curbside lane. Greater separation
for bicyclists would be necessary to create an optimal bike route.
The presence of bulbouts on College Ave may result in additional traffic congestion given its
single lane of traffic, although bus dwell times would be significantly shorter due than the existing
51A
6.2.2.3 Streetcar
The streetcar alternative would result in some key impacts to design and circulation on Broadway, in
addition to those noted in 6.2.2.1:
Curbside streetcar tracks pose an obstacle to bicycle circulation, as tires can get stuck in “flanges”
(gaps between tracks and pavement). These impacts are particularly significant along 2nd
Street,
which is part of the Bay Trail, and Broadway south of 21st. Either a reconfiguration of 2
nd St or a
relocation of the Bay Trail to 3rd
St is necessary to maintain bicycle circulation; both would result
in a reduction of street parking (removal of one lane of parking on 2nd
, or conversion of angled
parking on 3rd
to parallel parking). Along Broadway, which is not designated as a bicycle route but
receives a high volume of bicyclists, no mitigations are available; however, parallel routes on
Webster/Franklin are available.
Streetcars cannot change direction to avoid traffic congestion or a hazard or obstruction.
Whereas a bus may navigate around obstacles such as a double-parked car or turning queue, a
streetcar would face delays.
Streetcars may lengthen queues at intersections.

6-60
6.2.3 SYSTEM INTEGRATION
The Broadway Urban Circulator would introduce a number of changes to the existing transit network
along the Broadway corridor. Section 7.2 provides an overview of potential operators, while this section
examines how the service will integrate with AC Transit’s services.
The consultant team, in coordination with the TAC, developed a list of potential system integration
concepts that could be undertaken to adapt the network to the streetcar or enhanced bus alternatives.
These concepts seek to mitigate the negative impacts that a reconfiguration could have on riders, while
offsetting them with benefits (at least partially) whenever possible. Both enhanced bus and streetcar
alternatives would impact the existing operations of the B Shuttle, Line 51A, and Line 72/72M. It is
anticipated that the B Shuttle will be replaced regardless of alternative, while the 51A may adapt to a
number of scenarios depending on alternative. The resulting impacts could vary depending on alternative.
For all scenarios, Line 72/72M could also be truncated in Downtown Oakland to avoid duplication in Jack
London Square, if desired.
6.2.3.1 Rockridge BART Alternative
For the Rockridge BART alternative, the most likely scenario is splitting Line 51A into two segments: Jack
London Square-Rockridge and Fruitvale/Alameda-Downtown Oakland. In this scenario, the enhanced bus
would be fully integrated with AC Transit’s system and likely charge a standard AC Transit fare.
A major advantage of this scenario is financial: the net increase in operating costs may be relatively low,
given a low net change in revenue hours (operating costs are discussed in greater depth in 6.2.6). The
primary consequence of this reconfiguration is the loss of one-seat service between Pill Hill and Alameda.
A possible countermeasure to maintain the Pill Hill-Alameda connection could be to combine the
Alameda segment of Line 51A with the Telegraph Ave segment of Line 1.
As an alternative scenario, the 51A and enhanced bus services could be configured to serve different
travel markets (such as a limited bus service); however, this scenario was less preferred by the TAC due to
its impacts to riders.
6.2.3.2 MacArthur BART Alternatives
The MacArthur BART alternatives would generally introduce greater negative impacts to AC Transit’s
network given that they follow a new route that “competes” with existing service. The streetcar alternative

6-61
also introduces a new technology that is unfamiliar to AC Transit as an operator and may have greater
impacts on their operations (as noted in 6.2.2.3). The following system integration scenarios are possible
for Route 51A:
No change: AC Transit’s network could remain largely unchanged with the MacArthur BART
alternatives. This scenario maintains continuity with the existing network to minimize impacts on
riders, but will likely result in inefficiencies and lower farebox recovery on the Broadway corridor.
Spitting/Realigning Route 51A: The 51A may be truncated in Downtown Oakland or combined
with the 1 along Telegraph, while the enhanced bus or streetcar would provide service along
Broadway. To provide service on College and Broadway north of 40th
, a new line could be created
to Downtown Oakland, or the existing 51B could be extended. Given that transit ridership is
generally lower north of 40th
, this line could be less frequent than the existing 51A, if desired.
However, this scenario would negatively impact riders overall by either reducing frequency,
subjecting the 51B to greater delays, or removing a one-seat ride along Broadway (depending on
the ultimate configuration).
Reconfiguring Route 51A to serve distinct travel markets: the 51A may be converted into a limited
service where it interlines with the enhanced bus or streetcar. This scenario also impacts existing
riders by forcing transfers or longer walks for some trips.
6.2.4 ECONOMIC DEVELOPMENT
This section summarizes the findings from an analysis of the potential economic benefits of the Broadway
Circulator project, including both streetcar and enhanced bus alternatives. The following section provides
a description of the following economic development considerations.
A summary of the types of benefits that a transit circulator might be expected to generate in
Oakland;
A description of the economic development benefits evaluated as part of the study; and
Summary results of the analysis.
Overview of the Economic Benefits of Transit Circulator Projects
In recent years streetcars have drawn increasing attention as a tool to promote economic development,
based in part on the success of new streetcar lines in Portland and Seattle. Streetcars are ideal for
connecting employees, residents and visitors with jobs, shops, restaurants and entertainment in urban

6-62
neighborhoods and downtowns. By connecting multiple destinations within a relatively small area and
providing relatively frequent service, they can play an important role in facilitating economic activity.
While an enhanced bus system is expected to provide some of the same benefits, streetcar systems have a
perceived permanence that rubber-tired transit systems do not, which helps to attract private investment.
Because the impact of a new circulator is dependent upon the local market, development and economic
context, there are no “rules of thumb” about the economic impacts of new circulator projects. However,
the experience of recent circulator projects in a few U.S. cities, as well as data from the existing B Shuttle
in Oakland, suggests that a transit circulator has the potential to offer the following types of benefits for
Oakland:
Act to extend the desirable walk distance from a person’s home or place of work, expanding the
customer base for local retail, restaurants and attractions. People who live or work near the
streetcar will gain improved access to nearby shops and restaurants that were previously too far
to access by walking alone. For example, workers in Downtown will be able to take the streetcar
to entertainment and dining options in Jack London Square or Uptown.
Result in positive impacts on property values, especially multifamily residential and commercial.
For example, infill development in Jack London Square or in the Broadway/Valdez District will
benefit from greater connectivity to the jobs and regional transit that are located in Downtown.
Can enable development at higher densities. The streetcar will assist in catalyzing development
at opportunity sites, and may help make certain types of projects more feasible for developers.
Appeal to tourists and convention visitors. A streetcar system provides an amenity for
conventioneers, business travelers and other visitors to Oakland. For example, visitors staying at
Downtown hotels near the Oakland Convention Center would be able to easily visit Jack London
Square.
Enable more efficient use of parking facilities and encourage drivers to “park once.” The
streetcar will allow visitors to park one time even if they are visiting multiple destinations. For
example, a visitor could park and have dinner in Old Oakland before taking the streetcar to
Uptown to see a show at the Fox or the Paramount.
Benefits Evaluated
Based on the types of benefits outlined above, the analysis estimated the following impacts:
Impacts on existing property values;
Value of new development (residential, retail, office, hotel);

6-63
Retail sales impacts;
Impacts on hotel revenues;
City tax revenues, including:
Property tax,
Sales tax,
Transient occupancy tax (TOT),
Business license tax; and
Jobs.
These economic benefits generally accrue to three groups:
Property owners benefit from increased property values and improved development potential
resulting from improved access and connectivity. Existing properties are expected to experience a
rise in value a year before the new transit begins service, while new development will accrue
gradually over time as more projects are built.
Business owners benefit from additional revenue for both retail businesses and hotels along the
transit alignment. The benefits are expected to begin upon the transit’s opening, as it facilitates
access to businesses by workers, residents, shoppers, conventioneers and other visitors.
Local government benefits from the additional property tax, sales tax, TOT, and business license
tax revenues that result from the increases to property values, retail sales, hotel revenues, and
other business activity in the area.
For a range of transit alternatives, the team modeled future development, property values, retail sales,
hotel revenue, and associated tax revenue and jobs between 2014 and 2040. The assumptions used in the
analysis were developed based on a) the results of previous studies of streetcar and bus impacts in other
places; and b) detailed analysis of local conditions, including existing land uses, planned development,
retail sales trends, transient occupancy tax, and development opportunity sites. The analysis focuses on
properties and businesses within three blocks, or about a quarter-mile, of the proposed alignment,
corresponding to an area that is considered to be within easy walking distance of the streetcar. For each
transit scenario, economic benefits are measured in relation to a “baseline” future where there is no
circulator or B shuttle. This allows the benefits to be expressed as an incremental impact separate from
expected general economic growth.

6-64
Summary of Economic Development Findings
This section summarizes the results of the Broadway Circulator economic benefits analysis. The
findings are presented as total impacts in 2040, and/or as a comparison of growth in economic
activity between 2014 and 2040. As described earlier, the impact of each circulator alignment is
compared against a baseline growth scenario that represents expected conditions in the absence
of a new transit investment. The baseline scenario varies with each alignment, since each
alignment incorporates different geographies with unique characteristics. New transit is assumed
to result in a one-time “value premium” generated by increased accessibility and desirability of
locations within a quarter-mile of the circulator alignment. After opening, the quarter-mile area
captures a relatively higher share of regional housing and office growth, job growth, retail sales,
and hotel room nights. The quarter-mile area also achieves higher revenues and, therefore, higher
property values in comparison to the baseline scenario.
The MacArthur BART Streetcar alternative was found to have the greatest economic benefit,
followed by the Rockridge Enhanced Bus and the MacArthur BART Enhanced Bus. A summary of
the results are below:
Table 9: Economic Development Benefits (2014-2040, 2014 Dollars)
MacArthur BART
Enhanced Bus
MacArthur BART
Streetcar
Rockridge Enhanced
Bus
Property Value Growth
over Baseline $260 million $440 million $290 million
Cumulative Retail Sales $300 million $590 million $490 million
Cumulative Hotel
Revenue $75 million $130 million $80 million
Cumulative City of
Oakland Revenue $50 million $90 million $60 million
Housing Growth over
Baseline 520 870 530
Job Growth over Baseline 770 1,300 830

6-65
6.2.5 CAPITAL COSTS
6.2.5.1 Streetcar Cost Estimate
A planning-level cost estimate for the streetcar alternatives was prepared using the latest cost
data from similar projects across the country. This estimate is intended to provide an order-of-
magnitude assessment of costs, while recognizing a level of uncertainty inherent at this stage of
project development. Areas of particular uncertainty include: underground utility conflicts, the
relatively shallow construction of BART stations, basement conflicts, and right of way acquisition
for a maintenance facility. For these reasons, a collective total contingency of 32 percent has
been added to the estimate to capture the level of uncertainty. A more in-depth overview is
available in the technical compendium. It is estimated that a 3.7 mile streetcar from 2nd
& Oak to
40th
& West would cost approximately $204.9 million.
TABLE 10: ORDER OF MAGNITUDE CAPITAL COST ESTIMATE: STREETCAR PHASES
Jack London Square to 27th
Street
Jack London Square to 38th
Street
Jack London Square to
MacArthur BART
TOTAL CUMULATIVE COST $140 million $ 164 million $205 million
CUMULATIVE COST PER MILE $65 million $58 million $55 million
6.2.5.2 Enhanced Bus Cost Estimate
The cost estimate for the enhanced bus alternative was designed to mirror the streetcar estimate
closely: by definition, the enhanced bus and streetcar would share similar stop features, traffic
signal upgrades (for signals not already upgraded by AC Transit’s 51A project), and roadway
striping. The enhanced bus and streetcar would differ with regards to the level of capital
investments necessary for a fixed guideway system – including trackway, utilities, power systems,
and an operations and maintenance facility (it is assumed that the enhanced bus would share AC
Transit’s existing facility and therefore not require any right of way acquisition). For vehicles, a
$750,000 unit cost was assumed to reflect the premium nature of the service over AC Transit’s
existing vehicle fleet (most recent 40’ buses cost approximately $500,000 each). The enhanced bus
would largely avoid many of the engineering uncertainties faced by the streetcar alternatives
(utilities, basements, BART structures, etc.); nevertheless, a contingency of 32 percent was
maintained to capture the planning-level uncertainty of the project. This includes a 22 percent

6-66
allocated contingency (i.e., allocated to the specific items described above) and a 10 percent
unallocated contingency (i.e., applied to the subtotal of all above items).
It is estimated that a 3.7 mile enhanced bus from 2nd
& Oak to 40th
& West will cost
approximately $21,875,700. A 4.1 mile enhanced bus from 2nd
& Oak to Rockridge BART would
cost approximately $23,040,600.
TABLE 11: ORDER OF MAGNITUDE ESTIMATE: ENHANCED BUS ALTERNATIVES
MacArthur BART Rockridge BART
TOTAL COST $22 million $23 million
TOTAL COST PER MILE $5.9 million $6.2 million
6.2.6 OPERATING & MAINTENANCE COSTS
Year-of-estimate (YOE) annual operating and maintenance (O&M) costs were estimated for each
project alternative using a predictive model with the following primary inputs:
Estimated travel times (based on existing AC Transit operations and planned speed
improvements)
Operating plans (service spans and frequencies based on conceptual service plan)
Estimated costs per hour of revenue service operated
A key variable in estimating operating and maintenance costs is the assumption regarding cost
per revenue hour. For the streetcar alternative, a low-end estimate of $293/hour and a high-end
estimate of $313/hour were used, based on operating costs from Portland and Seattle adjusted
for the Bay Area. For the bus alternatives, a low end estimate of $120/hour was used to reflect as
the potential cost of a private contractor, while a high-end estimate of $190/hour was used for AC
Transit’s fully-loaded cost. For each enhanced bus estimate, an allowance of $1,000,000/year was
added to account for maintenance of additional features such as stops and premium buses.
Additional background data is provided in Appendix D.
The estimated range of operating costs for a streetcar is $7.5-8.5 million/year. Due to the
variance in costs between a potential private operator and AC Transit’s typical bus routes, the
enhanced bus range is wider for the MacArthur alternative – $4.4 to 7.0 million/year – and will
largely depend on the operational structure. For the Rockridge alternative, it is assumed this line

6-67
will be a part of AC Transit, and as such, carry the fully-loaded cost; this line would cost $7.6
million/year (the increase in net expenditures would be significantly less if 51A service are
consequently changed).
TABLE 12: ESTIMATED ANNUAL O&M COSTS, ALL ALTERNATIVES
Alternative
Cost
Low High
MacArthur Streetcar $7.5 million $8.5 million
MacArthur Enhanced Bus $4.0 million $5.8 million
Rockridge Enhanced Bus -- $7.3 million*
* The increase in net expenditures would be significantly less if 51A service is consequently changed.
6.2.7 COST/BENEFIT
Two cost/benefit measures were used in this evaluation: operating cost per passenger and capital
cost per annual passenger.
To calculate annual ridership, the estimated weekday ridership was multiplied by an annualization
factor of 290. This figure represents the midpoint between AC Transit’s systemwide figure (280),
Seattle’s South Lake Union Streetcar (290), and the Portland Streetcar (300).
Operating costs per passenger were generally comparable between the streetcar and bus
alternatives, assuming AC Transit’s fully-loaded cost for the bus alternatives. For capital costs, the
cost per passenger for the streetcar alternative was approximately seven times higher than the
bus alternative.
Table 13: Estimated Cost/Benefit
Alternative Operating Cost per
Passenger (Low)
Operating Cost per
Passenger (High)
Capital Cost per
Passenger
MacArthur Streetcar $4.39 $4.98 $120.04
MacArthur Enhanced Bus $2.46 $4.78 $17.13
Rockridge Enhanced Bus -- $5.07 $15.36

6-68
6.2.8 ENVIRONMENTAL
The purpose of this assessment is to indicate the major environmental issues that could result
from the construction and operation of the Broadway Urban Circulator Transit Study (Project).
This section provides a summary of that assessment. More detailed information is provided in
Appendix B.
Environmental issues will be completely addressed in the appropriate environmental document
under the California Environmental Quality Act (CEQA). Federal National Environmental Policy Act
(NEPA) guidelines may apply if the Project sponsor decides to pursue federal funding for project
development and construction. However, issues that may trigger federal agency participation,
permitting, or compliance will be examined in the CEQA document and the necessity of
incorporating NEPA guidelines in the environmental analysis will be addressed, as appropriate.
Recently approved streetcar projects, such as the Tucson Modern Streetcar in Arizona and the
Kansas City Downtown Streetcar in Missouri, have been the subject of an Environmental
Assessment (EA) under NEPA, with a Finding of No Significant Impact (FONSI) decision document.
The environmental review for the Downtown Riverfront Streetcar in Sacramento and the
Downtown Los Angeles Streetcar Project are both currently underway with EAs. An Environmental
Impact Report (EIR) was prepared for the Sacramento project a few years ago, and an Initial Study
(IS) was most recently prepared for the Los Angeles project. An Initial Study is used to determine
the appropriate level of environmental analysis required for a project under CEQA. In the case of
the Downtown Los Angeles project, the IS identified significant environmental impacts that
required further study, and an EIR is being prepared. The information generated in Phase 1 of the
Broadway Urban Circulator study could be used in the preparation of an IS. If the technical
documentation supporting the IS indicates that potentially significant impacts are likely to be
mitigated to a less than significant level, then a Mitigated Negative Declaration (the IS
incorporating committed mitigation measures as appropriate) may be sufficient for gaining
environmental clearance for the Project. If the IS identifies potentially significant impacts that
may not be easily mitigated, are controversial, or are likely to be unavoidable, then an EIR that
compares the environmental effects of No Project with the Project (and other alternatives that
have been considered) is required. An EIR embodies a more comprehensive environmental
analysis than the Initial Study and is accompanied by extensive public involvement. Recent
changes to the Federal Transit Administration’s (FTA) NEPA regulations may allow for a
Categorical Exclusion (CE) to be prepared for a project that is located entirely within existing

6-69
operational right-of-way that is used for transportation purposes. The determination of whether
the CE would apply to a project must be closely coordinated with the FTA.
The environmental assessment in Appendix B describes potential environmental issues that have
been addressed in environmental documents for similar circulator projects including air quality,
biological resources, cultural resources, land use, noise and vibration, and transportation.
The primary environmental issues identified in this assessment focus on potential traffic and
transportation impacts along the alignment, particularly along Broadway and along 2nd
Street in
the warehouse district. At this time, based on the information provided, no environmental fatal
flaws or unavoidable impacts have been identified that would make the proposed alternatives
infeasible or imprudent to implement. Complete environmental analysis will identify any impacts
and measures to avoid, minimize, reduce or mitigate them.

6-70
6.3 SCREENING OF PROJECT OBJECTIVES
6.3.1 PROJECT OBJECTIVES
Evaluations for each of the 16 objectives can be found in the following pages. For each objective,
criteria and factors are first identified. Ratings and their rationale are then provided for each
alternative. Ratings are on a scale of 1 to 5, with 1 representing lowest-performing and 5 highest-
performing (in cases where ratings are proportional to numeric values, for example ridership,
values of 1 and/or 5 may not be assigned). Streetcar and bus alternatives have been compared to
one another in all cases including those involving ridership.
6.4 IMPROVE THE QUALITY OF TRANSIT SERVICE IN THE
CORRIDOR
6.4.1 PROVIDE RELIABLE SERVICE THAT IS RELATIVELY FREE OF DELAY
Criteria: Estimated variability in peak travel times = Qualitative assessment based on operational
analysis.
Rationale:
Factors considered in evaluation:
All alternatives will reduce variability in travel times somewhat from existing conditions
due to delay-reduction strategies that will be implemented as part of all alternatives (e.g.
bus bulbs).
The streetcar alternative will be more vulnerable to delay than bus alternatives because
streetcars cannot move laterally, and therefore cannot avoid traffic incidents/obstructions
blocking the path of travel such as double-parked vehicles or vehicles involved in a
collision.
Review of Google data regarding peak-period traffic congestion suggests that congestion
is generally relatively evenly distributed along each alignment. However, opportunities for
delay would be greater in segments in which there is only one lane of traffic in each
direction, including all streets other than Broadway in the Jack London Square area,

6-71
streets within the MacArthur Transit Village and College Avenue. In these segments, but
most notably on College where traffic volumes are highest, the Rockridge bus alternative
would be particularly susceptible to delay.
The longer the route, the more potential for schedule variability as delays “cascade,” or
are compounded by ever-later arrivals due to increased dwell time from additional
passengers waiting at each stop.
All three final alternatives assume curb-side operations for shared alignment along
Broadway, including dedicated transit-only lanes between 7th
and 22nd
Streets. Therefore,
the exclusive transit-only lanes are not factored into the evaluation of the three
alternatives.
TABLE 14: ESTIMATED VARIABILITY IN PEAK TRAVEL TIMES
Alternative Relative
Performance Rationale
Streetcar
MacArthur 3
Shortest alignment, inability to move laterally to
avoid traffic incidents or obstructions creates
possible source of delay
Enhanced Bus
MacArthur 5 Shortest alignment, ability to move laterally to
avoid traffic incident along travel path.
Rockridge 4
Longest alignment, and traffic congestion on
College Ave segment presents potential source
of delay
6.4.2 ENHANCE AWARENESS OF TRANSIT SERVICES
Criteria: Visibility of infrastructure and potential for public understanding of service = Ridership
projections
Rationale:
The MacArthur BART Streetcar alternative was projected to attract the most daily riders
(5,886), and therefore attract the greatest level of awareness

6-72
The Rockridge BART Enhanced Bus was projected to attract the second-highest ridership
(5,173/weekday)
The MacArthur BART Enhanced Bus was projected to attract the lowest ridership
(4,404/weekday)
TABLE 15: VISIBILITY OF INFRASTRUCTURE AND POTENTIAL FOR PUBLIC
UNDERSTANDING OF THE SERVICE
Alternative Relative
Performance Rationale
Streetcar
MacArthur 5 5,886 weekday riders
Enhanced Bus
MacArthur 3 4,404 weekday riders
Rockridge 4 5,173 weekday riders
6.4.3 LEVERAGE AND INTEGRATE EXISTING TRANSIT INVESTMENTS
Criteria: Potential to increase network connectivity and provide “first/last mile” connections to
and from transit nodes = Qualitative assessment based on conceptual designs and existing transit
network
Rationale:
All alternatives significantly improve transit connectivity, especially “first/last mile” connections;
this is one of the primary benefits of this project.
Connections between major regional transit hubs (BART, Uptown Transit Center at 20th
Street, and
Oakland-Alameda Ferry) the following destinations/neighborhoods considered:
Jack London Square
Old Oakland
Chinatown
Northgate/Koreatown
Pill Hill
Upper Broadway

6-73
Downtown
Uptown
Rockridge
Temescal
TABLE 16: POTENTIAL TO INCREASE NETWORK CONNECTIVITY AND PROVIDE “FIRST/LAST
MILE” CONNECTIONS
Alternative Relative
Performance Rationale
Streetcar
MacArthur 5
Connects BART to Jack London Square and
Downtown Oakland to ferry; connects Pill Hill
and Broadway-Valdez to two BART stations.
Enhanced Bus
MacArthur 5
Connects BART to Jack London Square and
Downtown Oakland to ferry; connects Pill Hill
and Broadway-Valdez to two BART stations.
Rockridge 4
Connects BART to Jack London Square and
Downtown Oakland to ferry; connects Pill Hill
and Broadway-Valdez to BART; and connects
51st/Broadway and Lower College to BART.
However, does not connect to MacArthur BART,
which is closest BART station for parts of Pill Hill
and upper Broadway. (There is also less service at
Rockridge than at MacArthur or downtown BART
stations.)
6.4.4 CONTRIBUTE TO THE UTILITY AND EFFICIENCY OF THE OVERALL
TRANSIT SYSTEM WITHIN THE CORRIDOR
Criteria: Potential impacts on demand for and cost-effectiveness of other services/opportunities
to reconfigure impacted services = Qualitative assessment based on conceptual designs and
existing transit network

6-74
Rationale:
Where alignments overlap with existing services, alternatives will reduce demand on
those services (even if overall demand is increased), making those services less cost-
effective to operate (unless they are reduced or reconfigured).
Depending on alignment, however, some alternatives may present opportunities to
replace existing transit services in a way that improves both service and cost-
effectiveness.
The Rockridge BART alternative integrates into AC Transit’s existing network with
relatively minor changes. The MacArthur BART alternatives would result in inefficiencies
or negative effects on existing riders.
Because they are less maneuverable than buses, streetcars may impact existing services
by impeding their efficient operation, especially in Downtown Oakland where there is a
high concentration of AC Transit bus service.
TABLE 17: POTENTIAL IMPACTS ON DEMAND AND COST-EFFECTIVENESS OF OTHER
SERVICES/OPPORTUNITIES TO RECONFIGURE IMPACTED SERVICES
Alternative Relative
Performance Rationale
Streetcar
MacArthur 3
By overlapping with a long segment of AC
Transit Line 51, this alignment could have an
impact on the ridership and cost-effectiveness of
that service. Streetcar operations may impact bus
operations in Downtown Oakland.
Enhanced Bus
MacArthur 4
By overlapping with a long segment of AC
Transit Line 51A, this alignment could have an
impact on the ridership and cost-effectiveness of
that service.
Rockridge 5
Because it extends to Rockridge BART, the 51A
terminus, this line could serve as a replacement
for the Oakland segment of that route (the
Downtown Oakland-to-Fruitvale segment would
be viable on its own).

6-75
6.4.5 IMPROVE ACCESS TO JOBS AND SOCIAL SERVICES FOR COMMUNITIES
OF CONCERN
Criteria: Numbers of low-income, ethnic minority and zero-car households within one-quarter
mile of stops = Quantitative analysis based on U.S. Census data from existing conditions analysis
Rationale:
Larger projects will tend to improve transit service for greater numbers of disadvantaged
individuals. However, there may be opportunity costs associated with projects that benefit
large numbers of such persons, but may impact others. This is especially true if the cost of
increased operations in one place reduces the funding available for provision of service
elsewhere.
While fares have not yet been defined for the alternatives, and thus are not part of this
analysis, free and discounted fares will be considered as part of this study. Any alternative
that provided free or discounted fares to large numbers of people who did not
necessarily need reduced fares while disadvantaged individuals continued to pay full fare
would be problematic from an environmental justice perspective.
NOTE: Maps illustrating the data used in this analysis can be found in the appendix.
TABLE 18: NUMBERS OF LOW-INCOME, ETHNIC MINORITY AND ZERO-CAR HOUSEHOLDS
WITHIN ONE-QUARTER MILE OF STOPS
Alternative Relative
Performance Rationale
Streetcar
MacArthur 5 Project would serve relatively high numbers of
disadvantaged individuals.
Enhanced Bus
MacArthur 5 Project would serve relatively high numbers of
disadvantaged individuals.
Rockridge 4
Project would serve relatively high numbers of
disadvantaged individuals, but much of the
northern end of the alignment is in more affluent
communities with fewer non-white individuals.

6-76
6.5 PROVIDE SAFE, MULTIMODAL TRAVEL OPTIONS
6.5.1 MINIMIZE CONFLICTS BETWEEN TRANSIT AND OTHER MODES
Criteria: Opportunities for physical conflicts between users = Qualitative assessment based on
conceptual designs and existing and proposed street configurations
Notes:
Increasing transit service increases the potential for conflicts with other modes. The
greater the number of vehicles operating along a route, the greater the potential for
conflict.
Streetcars may cause greater number of conflicts than buses for several reasons:
o Streetcars cannot change direction to avoid a cyclist or another vehicle.
o Streetcar tracks present a hazard for cyclists, as tires can get stuck in “flanges,” or
gaps between tracks and pavement.
o The presence of streetcar tracks may deter motorists from operating in that lane,
increasing conflicts in remaining lanes.
Conflicts are reduced where there are lanes dedicated to one or more modes. All
alternatives include transit-only lanes on Broadway between 7th
and 22th
streets.
There is a greater potential for intermodal conflicts in street segments where there is just
one travel lane in each direction, such as on 2nd
Street or College Avenue.
TABLE 19: OPPORTUNITIES FOR PHYSICAL CONFLICTS BETWEEN USERS
Alternative Relative
Performance Rationale
Streetcar
MacArthur 3
Streetcars create greater potential for
multimodal conflict than buses. Curbside-
running streetcars impede bicycle access on
Broadway and possibly 2nd (if existing parking is
maintained)

6-77
Enhanced Bus
MacArthur 5 Buses create less potential for conflict than
streetcars.
Rockridge 4 Buses create less potential for conflict than
streetcars.
6.6 SUPPORT ECONOMIC AND COMMUNITY
DEVELOPMENT
6.6.1 SUPPORT TRANSIT-ORIENTED DEVELOPMENT CONSISTENT WITH
LOCAL AND REGIONAL POLICIES
Criteria: Potential impact of project on type, form and scale of adjacent development potential =
Estimated jobs and housing growth above baseline growth scenario.
TABLE 20: POTENTIAL IMPACT OF PROJECT ON TYPE, FORM,
AND SCALE OF ADJACENT DEVELOPMENTS
Alternative Relative
Performance Rationale
Streetcar
MacArthur 5 Additional 870 housing units and 1,300 jobs
projected over baseline growth scenario
Enhanced Bus
MacArthur 3 Additional 520 housing units and 770 jobs
projected over baseline growth scenario
Rockridge 3 Additional 530 housing units and 830 jobs
projected over baseline growth scenario

6-78
6.6.2 IMPROVE ACCESS TO RETAIL AND OTHER BUSINESSES
Criteria: Multimodal access to businesses/impacts of design on businesses = Estimated growth in
retail sales and hotel revenue.
TABLE 21: MULTIMODAL ACCESS TO BUSINESSES/IMPACTS OF DESIGN ON BUSINESSES
Alternative Relative
Performance Rationale
Streetcar
MacArthur 5
Additional $590M in retail sales and $130M in
hotel revenue projected over baseline growth
scenario
Enhanced Bus
MacArthur 3
Additional $300M in retail sales and $75M in
hotel revenue projected over baseline growth
scenario
Rockridge 4
Additional $490M in retail sales and $80M in
hotel revenue projected over baseline growth
scenario
6.6.3 PRESERVE AND ENHANCE THE CHARACTER AND QUALITY OF LIFE IN
EXISTING NEIGHBORHOODS
Criteria: Potential to contribute to identity and perceived quality of districts = Estimated growth
in property values
Rationale:
The streetcar and enhanced bus alternatives both will stimulate economic development in
the neighborhoods along the various transit alignments. Based on the data presented in
Section 6.2.4, the MacArthur BART streetcar alternative was found to have the greatest
economic development benefit, followed by the Rockridge Enhanced Bus and the
MacArthur BART Enhanced Bus alternatives.
The economic development changes stimulated by the transit alternatives may result in
the displacement of some existing residents. This potential impact is factored into the
performance ratings below.

6-79
TABLE 22: POTENTIAL TO CONTRIBUTE TO IDENTITY AND
PERCEIVED QUALITY OF DISTRICTS
Alternative Relative
Performance Rationale
Streetcar
MacArthur 3 Additional $440M in property value growth over
baseline growth scenario
Enhanced Bus
MacArthur 3 Additional $260M in property value growth over
baseline growth scenario
Rockridge 3 Additional $290M in property value growth over
baseline growth scenario
6.7 DELIVER A PROJECT THAT IS COST-EFFECTIVE, FEASIBLE,
AND HAS COMMUNITY SUPPORT
6.7.1 PRIORITIZE PROJECTS THAT WOULD BE COST-EFFECTIVE TO BUILD
AND OPERATE
Criteria: Estimated capital and operating cost per rider =
Estimated capital cost (from projections) ÷ estimated annual boardings (from projections)
Estimated annual operating cost (from estimates) ÷ estimated annual ridership (from projections)

6-80
TABLE 23: ESTIMATED CAPITAL COST PER RIDER
Alternative Relative
Performance Rationale
Streetcar
MacArthur 2 Estimated capital cost of $120 per annual
boarding
Enhanced Bus
MacArthur 5 Estimated capital cost of $17 per annual
boarding
Rockridge 5 Estimated capital cost of $15 per annual
boarding
TABLE 24: ESTIMATED OPERATING COST PER RIDER
Alternative Relative
Performance Rationale
Streetcar
MacArthur 3 Estimated operating cost per passenger of $4.39-
4.98 per annual boarding
Enhanced Bus
MacArthur 4 Estimated operating cost per passenger of $2.46-
4.78 per annual boarding
Rockridge 3/5 Estimated operating cost per passenger of $5.07
per annual boarding
6.7.2 PRIORITIZE PROJECTS WITH A VIABLE OPERATOR AND
ADMINISTRATIVE STRUCTURE
Criteria: Potential willingness of existing organizations/potential for new organization to
administer and operate = Qualitative assessment based on operations analysis

6-81
Rationale:
Bus alternatives could relatively easily be administered and operated by an existing
provider of bus service.
The streetcar alternative, on the other hand, would introduce a new mode requiring new
maintenance facilities and procedures, etc. While institutional capacity and willingness to
take on the challenge of introducing a new mode might exist, potential operations would
nonetheless be presented with logistical challenges.
Depending on alignment, opportunities may exist for public/private partnerships
(including institutions, business organizations or others) to help fund and administer
service.
TABLE 25: POTENTIAL WILLINGNESS OF EXISTING ORGANIZATIONS/POTENTIAL FOR NEW
ORGANIZATION TO ADMINISTER AND OPERATE
Alternative Relative
Performance Rationale
Streetcar
MacArthur 3 No existing streetcar operators in area.
Enhanced Bus
MacArthur 5 Many potential operators for bus service.
Rockridge 5 Many potential operators for bus service.
6.7.3 PRIORITIZE PROJECTS WITH THE POTENTIAL TO EARN WIDESPREAD
COMMUNITY ACCEPTANCE
Criteria: Likely level of support from community members, community leaders and policy makers
= Qualitative assessment based on design & circulation assessment, operations analysis,
environmental analysis
Rationale:
The streetcar alternative should attract some support based on their perceived “cache.”
However, this may be undermined by concerns about impacts on traffic, merchants and
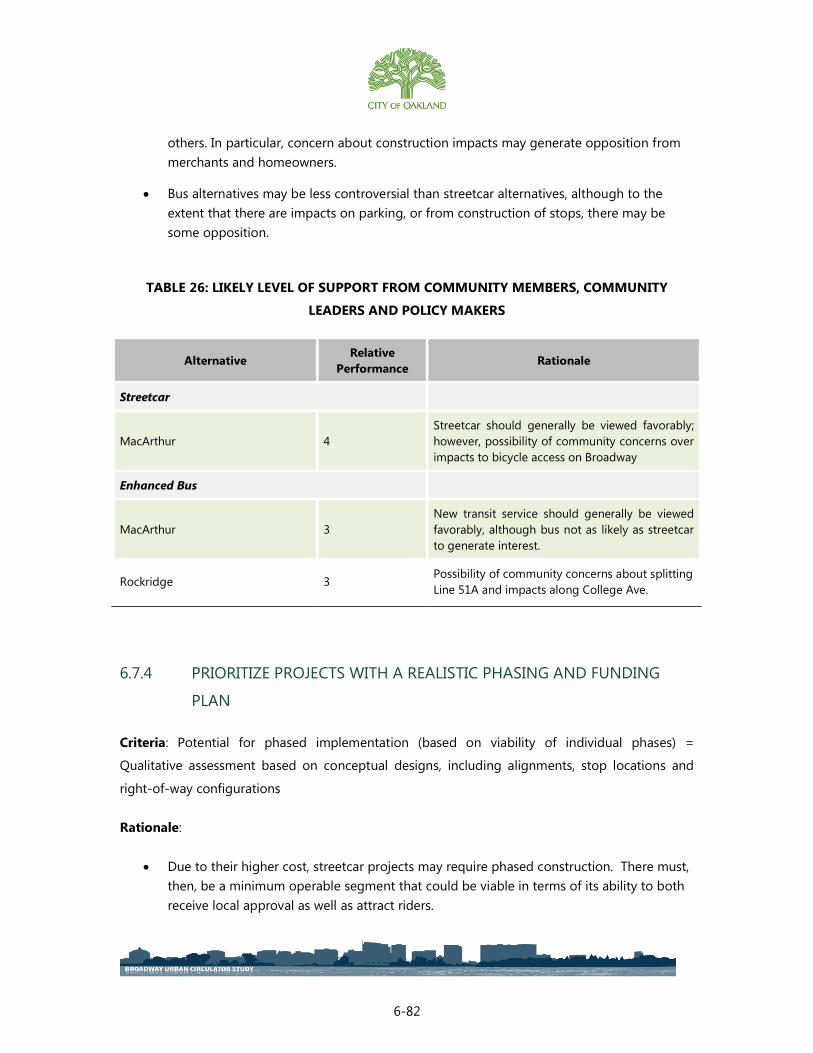
6-82
others. In particular, concern about construction impacts may generate opposition from
merchants and homeowners.
Bus alternatives may be less controversial than streetcar alternatives, although to the
extent that there are impacts on parking, or from construction of stops, there may be
some opposition.
TABLE 26: LIKELY LEVEL OF SUPPORT FROM COMMUNITY MEMBERS, COMMUNITY
LEADERS AND POLICY MAKERS
Alternative Relative
Performance Rationale
Streetcar
MacArthur 4
Streetcar should generally be viewed favorably;
however, possibility of community concerns over
impacts to bicycle access on Broadway
Enhanced Bus
MacArthur 3
New transit service should generally be viewed
favorably, although bus not as likely as streetcar
to generate interest.
Rockridge 3 Possibility of community concerns about splitting
Line 51A and impacts along College Ave.
6.7.4 PRIORITIZE PROJECTS WITH A REALISTIC PHASING AND FUNDING
PLAN
Criteria: Potential for phased implementation (based on viability of individual phases) =
Qualitative assessment based on conceptual designs, including alignments, stop locations and
right-of-way configurations
Rationale:
Due to their higher cost, streetcar projects may require phased construction. There must,
then, be a minimum operable segment that could be viable in terms of its ability to both
receive local approval as well as attract riders.

6-83
Some streetcar projects may simply be too expensive to realistically fund, particularly
given limitations on federal and other funding sources, although project competitiveness
is crucial in determining federal funding opportunities.
Bus alternatives are far less expensive to implement, and some capital improvements can
be made incrementally while service is in operation (some funding sources available to
streetcars, though, may not be available to buses).
TABLE 27: POTENTIAL FOR PHASED IMPLEMENTATION (BASED ON VIABILITY OF
INDIVIDUAL PHASES)
Alternative Relative
Performance Rationale
Streetcar
MacArthur 3
Higher cost of streetcar presents challenges to
implementation. 27th Street could serve as initial
phase of this project. Finding funding for second
phase might be slightly greater challenge due to
lower ridership potential of northern end of
corridor.
Enhanced Bus
MacArthur 5 Relatively inexpensive project
Rockridge 5 Relatively inexpensive project
6.8 SUMMARY
Table 28 on the following pages summarizes findings from the evaluation in tabular or matrix
format. Numerical ratings are illustrated using shaded circles, with darker shades and larger circles
representing stronger performance.

6-84
TABLE 28: SUMMARY EVALUATION
Goals & Objectives
Jack London Square to:
MacArthur BART
Rockridge
BART
Streetcar Bus Bus
A. Improve the
quality of transit
service in the
corridor.
A1 Provide reliable
service that is
relatively free of
delay.
Estimated variability in peak travel
times
A2 Enhance
awareness of
transit services.
Visibility of infrastructure and
potential for public understanding of
service
A3 Leverage and
integrate existing
transit
investments.
Potential to increase network
connectivity and provide “first/last
mile” connections to and from transit
nodes
A4 Contribute to the
utility and
efficiency of the
overall transit
system within the
corridor.
Potential impacts on demand for and
cost-effectiveness of other
services/opportunities to reconfigure
impacted services
A5 Improve access to
jobs and social
services for
disadvantaged
communities.
Numbers of low-income, ethnic
minority and zero-car households
within one-quarter mile of stops
B. Provide safe,
multimodal travel
options.
B1 Minimize conflicts
between transit
and other modes.
Opportunities for physical conflicts
between users
C. Support
economic and
community
development.
C1 Support transit-
oriented
development that
is consistent with
local and regional
policies.
Potential impact of project on type,
form and scale of adjacent
developments.
C2 Improve access to
retail and other
businesses.
Multimodal access to
businesses/impacts of design on
businesses
C3 Preserve and
enhance the
character of and
quality of life in
existing
neighborhoods.
Potential to contribute to identify and
perceived quality of districts.
Potential to displace existing
residents.

6-85
TABLE 28: SUMMARY EVALUATION
Goals & Objectives
Jack London Square to:
MacArthur BART
Rockridge
BART
Streetcar Bus Bus
D. Deliver a
project that is
cost-effective,
feasible, and has
community
support.
D1 Prioritize projects
that would be
cost-effective to
build and
operate.
Capitol Cost per rider
O&M Cost per rider
/
D2 Prioritize projects
with a viable
operator and
administrative
structure.
Potential willingness of existing
organizations/potential for new
organization to administer and
operate
D3 Prioritize projects
with the potential
to earn
widespread
community
acceptance.
Likely level of support from
community members, community
leaders and policy makers
D4 Prioritize projects
with a realistic
phasing and
funding plan.
Potential for phased implementation
(based on viability of individual
phases)
6.9 SCREENING RESULTS
The screening process has demonstrated that the Rockridge BART enhanced bus and the
MacArthur BART streetcar and enhanced bus offer advantages and disadvantages. Each
alternative presents an opportunity to strengthen transit service, enhance local connectivity, and
promote economic development, but each also presents challenges to implementation –
particularly related to funding.
It is clear that the B Shuttle serves a valuable need for local circulation along the Broadway
corridor via an attractive, legible, recognizable service. However, the B Shuttle lacks a sustainable
long-term funding source to ensure its longevity: like the previous Broadway circulators, the B is
vulnerable to service cuts or disappearing altogether since it is funded by grants on a year-by-
year basis. Therefore, in evaluating the alternatives and the relative feasibility of implementation,
6-86
a critical question is whether a viable long-term funding source exists for operations and
maintenance of the service.
This section presents the best three options for consideration, summarizes key benefits, lays out
how each may be implemented, and evaluates the level of difficulty for each.
6.9.1 OPTION #1: EXPAND B SHUTTLE SERVICE
Early outreach indicates there is a strong desire to expand the B Shuttle in service hours,
frequency, and coverage area. The Broadway corridor’s primary cluster of activity centers –
stretching from Kaiser Medical Center to Jack London Square – necessitates a local circulator
service that serves short trips. Three areas of service expansion are suggested for the B:
Extension to Alta Bates and Kaiser Medical Centers: The B Shuttle currently does not serve
the Pill Hill and Mid-Broadway areas, which contain two of Oakland’s largest medical
centers as well as a planned retail district. Moreover, providing some level of connection
to Piedmont Ave (either at Piedmont & MacArthur or proceeding a few blocks north to
Piedmont & 41st) would enhance connectivity between business districts.
More frequent service: The current 10-15 minute headways are not quite frequent
enough to support “walk up” service given the short trip lengths along the corridor.
Frequencies of 5-10 minutes would be more appropriate.
Longer service hours: The B Shuttle’s service hours are limited to support the growing
variety of activities along the corridor. Extending service hours to/beyond 11pm on
weeknights and adding all-day weekend service would better serve the corridor and
appeal to a wider array of riders.
An expanded B Shuttle could serve as a first step toward the subsequent implementation of an
enhanced bus or streetcar, or it could serve as a stand-alone service without future investments.
The expanded B would be compatible with enhanced bus improvements along the shared
portions of the corridor, if phasing these improvements is desired.
A key consideration of expanding the B Shuttle (and maintaining existing service) is developing a
dedicated, sustainable funding source. Currently, shuttle operations are funded largely through a
combination of one-time grants and voluntary private sector funding. Establishment of a
dedicated funding program, likely through a combination of public sector and private sector
6-87
sources (see Section 7.4 for more details), is critical to sustaining transit circulator service in
Downtown Oakland.
6.9.2 OPTION #2: ENHANCED BUS TO ROCKRIDGE
The Rockridge enhanced bus represents the most cost-effective overall transit improvement for
the corridor, assuming it is implemented in conjunction with a restructuring of Route 51A as
discussed earlier in this document as well as with AC Transit and City of Oakland staff. It provides
strong ridership, economic development benefits, and connectivity at a relatively low cost while
integrating with AC Transit’s network relatively well. In contrast, the MacArthur BART enhanced
bus alternative presents challenges to AC Transit’s operations and could negatively impact
existing bus riders by competing with AC Transit’s Route 51A or requiring a significant
reorganization of bus service.
A disadvantage of the Rockridge enhanced bus, should it be structured in a format similar to the
existing Route 51A, is that it could lose some of the circulator characteristic that makes the B
Shuttle so popular. A $2 or $2.10 fare represents a barrier to circulation for relatively short trips
within Downtown Oakland. Yet, any lowering of the fare (and increasing the subsidy on the route)
has Title IV implications due to equity concerns, and a fare-free downtown zone poses obstacles
to enforcement. One possibility is a private sector contribution which subsidizes fares along all or
a portion of the route; for example, fares for the enhanced bus could be set at $1 to promote
circulation between business districts, and the remaining $1-1.10 could be paid for through a
contribution by property owners along the line.
Another consideration of the Rockridge enhanced bus is the increase in operating cost associated
with the maintenance of branded vehicles and stops, as well as any cost increases from splitting
Route 51A. The City of Oakland would likely need to fund this gap via the private sector or a tax
(such as a parking surcharge).
Finally, it is unclear if there is enough private sector support for an enhanced bus alternative to
contribute a sufficient amount to allow the provision of lower fares and cover the higher
maintenance costs.
6-88
6.9.3 OPTION #3: STREETCAR TO MACARTHUR BLVD/MACARTHUR BART
A streetcar to MacArthur BART involves significant funding hurdles – both capital and annual
O&M costs – that suggest it is only a viable option with a robust federal, regional and private
sector contribution. A streetcar provides greater ridership and stronger economic development
benefits than an enhanced bus, but does so at a significantly higher cost. It is a candidate for FTA
Small Starts Funding, but only if a dedicated source can be identified for the annual O&M costs
and for at least half of the capital costs.
The assessment of phasing options for the streetcar alternative indicates that an initial line from
the Jack London Square Amtrak terminus (2nd
Street just west of Oak Street) to Broadway at 38th
Street is the best alternative. The northern terminus stop would be located in the median of
Broadway just south of 38th
Street, approximately 700 feet from the main entrance to the new
Kaiser Medical Center facility. This 2.8 mile line would extend service to both the Alta Bates
Medical Center and the Kaiser Permanente Medical Center in the Pill Hill and Piedmont Avenue
neighborhoods. The estimated capital cost for this initial line is approximately $165 million. The
maximum FTA Small Starts grant is $75 million, so $90 million of the project capital costs must
come from other sources. The estimated annual operating & maintenance cost for this line ranges
from $5.7 to 6.4 million.
There was both strong support and some opposition identified for the streetcar alternatives
during the project outreach process. Support appears to be strong among members of the
business community. Implementation of a streetcar alternative will depend on whether the
community perceives the level of additional economic development and ridership benefits are
worth the additional one-time and ongoing costs.
6.9.4 DEDICATED TRANSIT LANES ON BROADWAY
Regardless of the alternative pursued, it is recommended that the City of Oakland work with its
agency partners to implement dedicated transit lanes (with permitted right turns) along Broadway
between 7th
and 22nd
Streets. Dedicated transit lanes are warranted based on the heavy bus
ridership and relatively modest vehicle traffic on the corridor, and the level of investment that
would occur with any of the above improvement options. Dedicated lanes will reduce delays and
improve reliability for all of AC Transit’s routes as well as the B Shuttle (or enhanced
bus/streetcar).

6-89
Traffic signal upgrades are also recommended along Broadway south of 8th
St to provide transit
signal priority for buses heading to Jack London Square (and potentially Brooklyn Basin). This
investment will benefit transit operational speeds regardless of the alternative pursued.

7-90
7.0 IMPLEMENTATION
7.1 NEXT STEPS
The following actions are recommended based on the evaluation of study alternatives.
1. Approve Funding Plan with stable, long-term local funding sources for existing B Shuttle
operating and maintenance costs
2. Approve new funding sources to extend B Shuttle to Kaiser Permanente Medical Cetner
and expand services hours on nights and weekends
3. Decide on implementing enhanced bus or streetcar as long-term transit circulator option
for the corridor
The Enhanced Bus alternatives would not qualify for FTA Small Starts funding under the design
requirement that at least 50 percent of the alignment consist of fixed-guideway (rail and/or
exclusive right-of-way). The alternatives could, however, qualify under the alternative standards
for a “corridor-based bus project”:
Substantial transit stations,
Traffic signal priority/pre-emption, to the extent, if any, that there are traffic signals on
the corridor,
Low-floor vehicles or level boarding,
Branding of the proposed service, and
10 minute peak/15 minute off peak headways or better while operating at least 14 hours
per weekday.
Historically, virtually all Small Starts recipients have been streetcar or Bus Rapid Transit projects,
not rubber-tire circulators; of 56 projects currently in the New Starts and Small Starts
development processes, none is a local bus service. Additionally, seeking approval for two
separate Small Starts projects in the same corridor could reduce the odds that both would receive
funding. For these reasons, it might make sense to fund the less expensive first phase using other
sources.
7-91
The Enhanced Bus projects could be funded through a variety of other sources, as described in
the previous chapter. The Measure BB funding commitment of $10 million would account for a
share of the capital costs. Other sources are less certain but are likely to include some
combination of local public and private sources, such as commercial parking taxes and/or an
assessment district. They might also include other non-local sources such as a TIGER grant. One
potentially key source of funding that would only be available if the project were sponsored by a
transit agency rather than by the City of Oakland is the FTA Urbanized Area Formula Grant
Program described in the previous chapter, which includes a range of potential funding sources.
While the Enhanced Bus alternatives are substantially less expensive than the Streetcar alternative
in terms of capital costs, operating costs would be comparable (likely about one-third less for an
Enhanced Bus alternative with the same alignment as a Streetcar alternative). Identifying reliable,
sustainable sources of operational funding for whatever Circulator alternative is operated in the
future will be essential to the service’s ongoing survival.
Most existing transit service in the corridor is operated by AC Transit and funded by the agency’s
various sources of operating revenue, including property tax receipts and fare revenues. If the
service were directly operated by AC Transit, it could be funded by these same sources. Similarly,
if the service were operated by another transit agency such as BART, it could be funded using that
agency’s revenue sources. Any funds applied by these agencies to the long-term circulator service
would be accompanied by an associated savings from reduction in other transit service.
However, if the service were not directly operated by a transit agency, new sources of operating
funding would need to be secured. Several possible sources are discussed in the previous chapter,
including farebox revenues, sponsorships and other private funding, and public and private local
sources such as the City’s general fund, dedicated taxes and/or fees (e.g., a Parking Benefit
District) or an assessment district of some kind. It should be noted that the current B shuttle
service does not charge a fare, and charging a fare similar to AC Transit would impact ridership.
In early phases of the project, capital elements that could be used by either Enhanced Bus or
Streetcar service would be implemented, including curbside stops and transit signal priority. In
subsequent phases, additional elements required to operate Streetcar service would be
implemented – the tracks themselves as well as an overhead contact system, median stops, and a
maintenance and storage facility among other requirements. These elements would be
substantially more expensive: capital costs for the MacArthur Streetcar alternative are estimated

7-92
at $205 million, although the actual net cost may be slightly lower (in 2014 dollars), as some
elements could be implemented in an earlier phase.
Unlike the Enhanced Bus project, a Streetcar project would likely be a candidate for the Small
Starts program, which can provide up to $75 million in federal funding. However, depending on
the extent of the streetcar project, this would likely account for less than half of the project cost.
Additionally, the Small Starts program requires a minimum 20 percent local match, and due to its
competitive nature, in practice local matches are typically significantly higher. Local sources that
might be used to fund a Streetcar alternative are described in detail in the previous chapter.
While the combination of funds that might ultimately be used to construct and operate a
streetcar project are uncertain, the project development process is relatively certain – at least so
long as the New Starts/Small Starts project development process is not dramatically altered again,
as it recently was following the passage of MAP-21. As described in the previous chapter, the
next stage in a Small Starts project development process following this alternatives analysis would
be selection of a preferred alternative, at which point the project could formally enter into FTA
Project Development. It would then undergo environmental review (in addition to the federally
required NEPA process, the project would be subject to California Environmental Quality Act or
CEQA review). The various FTA requirements for documentation of benefits and costs would have
to be satisfied; the project would then have to receive an overall rating of “medium” or better
under FTA evaluation criteria. Finally, a Project Management Plan demonstrating organizational
capacity and sufficient funding commitments would have to be developed. At this point the
project would be eligible for a Project Construction Grant Agreement.
7.2 ORGANIZATIONAL STRUCTURE
Several organizational structures are possible. Circulator service could be administered by an
existing transit agency such as AC Transit or BART, the City of Oakland, or a joint powers
authority (JPA) consisting of multiple public agencies. The operator could be a transit agency
either operating it as part of their regular network, or as a contractor to the administrative agency.
Alternatively a private contractor (e.g., First Transit, MV Transportation or Veolia Transportation)
or a new nonprofit organization could also potentially operate the service.

7-93
7.2.1 TRANSIT AGENCY STRUCTURE
The simplest arrangement, from an organizational perspective, would be a single entity
responsible for both administration and operation – a public transit agency. The most obvious
candidate would be AC Transit, which already operates fixed-route bus service in the corridor
including its own services as well as the B on Broadway, which it operates for the City under
contract.
There are reasons AC Transit might not wish to operate a new service, particularly if it were a new
service/vehicle type with new maintenance requirements and if operational funding came from
the same sources as the agency’s existing services, effectively competing with and potentially
reducing the funding available for those services. AC Transit is a special district that receives
funding from a variety of federal, state and local sources. In its Fiscal Year 2014-2015 adopted
budget, fares account for about 16 percent of total revenues, the third-largest source of funding
after property taxes (23 percent) and State Transportation Development Act (TDA) grants (17
percent). The estimated annual O&M cost for Circulator service of between $4.6 and $8.6 million
would amount to approximately 1.3 to 2.5 percent of the agency’s FY14-15 operating budget of
$342.3 million.
Alternately, another existing transit agency such as BART could administer and operate the
service, but the same issues may apply. For BART, in particular, operation of local service could
represent a change in its historic mission as a regional operator of rapid transit service (although
starting this fall, BART will operate a line using non-standard BART technology entirely within the
City of Oakland, the Oakland Airport Connector). BART, too, is a special district, but it derives
most of its operating revenue from fares: in the agency’s preliminary FY15 budget, about 74
percent. Additionally, its operating budget is much larger than AC Transit’s: for FY15, $598.4
million.
Both AC Transit and BART are governed by elected Boards of Directors, making each agency
directly accountable to voters within their respective districts.
7.2.2 CITY OF OAKLAND STRUCTURE
If administrative and operational functions were divided, one relatively simple arrangement would
be a continuation of the existing B on Broadway organizational structure: administration by the

7-94
City of Oakland and operation, under contract, by AC Transit or another entity. This would
essentially be the same arrangement used for Seattle’s South Lake Union streetcar, which is
administered by the City of Seattle and operated under contract by local transit service provider
King County Metro. As the projected operating cost for Circulator service is substantially higher
than for existing B shuttle service, however, the City would be responsible for identifying
additional sources of funding (see following sections).
7.2.3 NON-PROFIT CORPORATION (THE PORTLAND MODEL) STRUCTURE
Another organizational structure would divide responsibilities between the City and a new
nonprofit operator. This would be similar to the existing configuration in Portland, where the
Portland Streetcar system is owned, managed and partially funded by the City of Portland, which
contracts out both construction and operation to the not-for-profit Portland Streetcar, Inc. It
should be noted that the local transit agency, TriMet, provides both partial funding and staff,
including operators and maintenance staff.
7.2.4 JOINT EXERCISE OF POWERS AUTHORITY (JPA) STRUCTURE
Finally, administrative and funding duties could be shared by a JPA consisting of two or more
governmental bodies, such as the City and AC Transit or BART. JPAs are relatively common in the
Bay Area: both Caltrain (the Peninsula Corridor Joint Powers Board) and the Capitol Corridor (the
Capitol Corridor Joint Powers Authority) are overseen by JPAs. Both entities consist of elected
boards that have contracted out day-to-day administration to transit operators (SamTrans and
BART, respectively). Caltrain operation, formerly provided on a contract basis by Amtrak, is now
provided by a private contractor (TransitAmerica Services Inc.), while the Capitol Corridor
continues to be operated under contract by Amtrak.
Whatever the organizational arrangement, it will be essential if Circulator service to succeed that
it is integrated into its surrounding transit network. It should not matter to users who owns and
operates a service, so long as the experience of using that service is not made unduly complicated
by that arrangement.
7-95
7.3 CAPITAL FUNDING
Virtually all downtown circulator projects that require significant capital funding receive funds
through a variety of federal and nonfederal sources. The availability of nonfederal sources is
particularly important because federal funds are generally granted to projects that demonstrate a
substantial local financial commitment.
The following sections summarize available funding for a circulator project in Downtown Oakland.
Funds from most sources would be available regardless of whether the ultimate project is a
rubber tired or streetcar option. Where funding may be limited to a particular mode, or where
one mode would have a distinct advantage, it is noted in the fund source description.
If the City of Oakland and its partner agencies decide to pursue FTA Small Starts funding, a critical
first step in the process will be to obtain commitments for the matching local capital cost fund
sources and local operating & maintenance cost fund sources. This is necessary before FTA will
commit to providing grant funds. Other key project development steps that must be completed
prior to obtaining an FTA grant funding commitment include completion of environmental
documents (both NEPA and CEQA) as well as more detailed preliminary engineering documents,
utility consultation, cost estimates, and ridership forecasts.
7.3.1 FEDERAL CAPITAL FUNDING SOURCES
7.3.1.1 Small Starts
Chapter 49 U.S.C. 5309 authorized the Federal Transit Administration to create the Small Starts
program for fixed-guideway and bus corridor projects requesting Section 5309 Bus and Bus-
Related Facilities funding of up to $75 million, with a total project cost of less than $250 million.
According to FTA’s Small Starts final policy guidance for New and Small Starts Evaluation & Rating
Process (August 2013), FTA’s decision to recommend a project for funding is driven by a number
of factors, including the “readiness” of a project for capital funding, geographic equity, the
amount of funds versus the number and size of the projects in the Section 5309 funding pipeline,
and the project’s overall Small Starts rating. Small Starts grants can cover up to 80% of the total
project costs or a maximum of $75 million. Small Starts funding is consistently a significant
source of capital funds for downtown circulator projects. Although these funds can be used for
7-96
bus and streetcar projects, thus far, the majority of projects receiving Small Starts funds have
either been streetcar projects or bus rapid transit projects rather than bus circulator projects.
The work done as part of this Downtown Circulator Study is an important first step towards
receiving federal Small Starts funding. The federal process for Small Starts has been simplified
under MAP-21 authorization legislation. There are two major approval steps under the process:
Project Development and Project Construction Grant Agreement. Once the City has adopted a
preferred alternative for the Downtown Circulator, it may request approval for the project under
the Project Development phase.
Once designated in Project Development, the project sponsor has two years to complete the
National Environmental Policy Act (NEPA) process and to submit sufficient information on the
cost, financial commitments, and project rating to qualify for a Project Construction Grant
Agreement (PCGA). The PCGA represents the formal financial commitment of the federal
government to the completion of the project. To increase the likelihood of completing the NEPA
process within two years, many agencies that are working to implement circulator projects are
using local funds to prepare concept design documents, conduct environmental scoping, and
develop technical studies prior to entering the project development phase.
Ultimately, documentation of the project value and local decision making process will be required
to gain funding and qualify for a PCGA. Information that will be needed to support this process
includes:
Local Alternatives Analysis Report (this
Circulator Transit Study)
Economic Development Analysis
Land Use Documentation
Cost Effectiveness Estimate
Mobility Benefits Estimate
Environmental Benefits Estimate
Congestion Relief Estimate
Ridership Estimate
Financial Plan
In addition to the criteria, FTA evaluates projects on the local capacity to build the project and its
financial commitment. The Project Management Plan plays a key role in demonstrating the
approach to the project and assurance that there is a local organization capable of delivering the

7-97
project. The financial commitment to the project includes capital and operations. Formal financial
commitments are not necessary to advance into Project Development. During Project
Development, the project sponsor will have to produce formal commitments to deliver local
capital funding and to fund system operation for the next 20 years.
During Project Development the project sponsor must complete the NEPA environmental review
process, formally commit capital funds, provide sufficient information to enable the project to be
rated, achieve a minimum of “medium” overall rating, and prepare a formal cost estimate that
meets the project budget and provides sufficient contingency to assure completion of the project.
The project sponsor in Project Development can conduct engineering through to final
engineering without further approval from FTA. The sponsor can also conduct utility relocation
work, certain right-of-way acquisition and commence procurement. No capital construction
activity can begin until the PCGA is approved unless FTA issues a Letter of No Prejudice (LONP)
for specific acquisition like specialized track.
With these items successfully completed, the project sponsor can be eligible for a Project
Construction Grant Agreement. The PCGA is then used to acquire vehicles and to construct the
project.
Federal funding programs are all competitive and generally require regional concurrence.
Projects receiving federal funds are first listed in the region’s Transportation Improvement
Program (TIP) developed by MTC in coordination with Alameda CTC and the other County CMAs.
Estimated Potential Funding: Up to $75 M (for the streetcar alternative only)
7.3.1.2 TIGER Grants
Transportation Investment Generating Economic Recovery (TIGER) is a discretionary US DOT grant
program that allows it to invest in road, rail, transit and port projects. For fiscal year 2014, $600M
was enacted to become available for investment. The notice of funding availability was issued in
early March 2014, and projects will be awarded on a competitive basis as in previous TIGER grant
rounds. A key criterion is project readiness (shovel ready). A number of modern streetcar projects
have been awarded significant TIGER grants to fund capital investments, including Tucson,
Portland, Atlanta, Salt Lake City and Dallas. No rubber tired circulator projects have received
TIGER funding, but these projects are eligible for TIGER funds.

7-98
Estimated Potential Funding: $5 to $15 M
7.3.1.3 TIFIA Loan Program
The Transportation Infrastructure Finance and Innovation Act (TIFIA) program provides federal
credit assistance to national and regionally-significant surface transportation projects, including
bus and rail transit. The program is designed to fill market gaps and leverage substantial private
match (or co-development) by providing supplemental debt financing. The amount of a TIFIA
loan cannot exceed 33% of the total capital cost of a project. The loans are backed by Federal
revenues. As a transit capital project, the downtown circulator would be eligible. It should be
noted that the portion of capital funding from a TIFIA loan would not count toward the maximum
Federal share under the Federal Small Starts program. It could instead count as part of the “local”
match.
Estimated Potential Funding: LOAN funding of up to $25M (note that a funding source must be
identified to repay any project loan proceeds)
7.3.1.4 FTA Urbanized Area Formula Grant Program
MTC administers the FTA Urbanized Area Formula Grant program, combined with several other
federal transit capital programs. For FY 2014-15 and 2015-16 MTC will allocate $793 million in
regional apportionments of Federal Transit Administration (FTA) Section 5307 Urbanized Area, 5337 State
of Good Repair, and 5339 Bus & Bus Facilities funds (together referred to as Transit Capital Priorities or
TCP) and matching funds. Funds are awarded to transit agencies. It is unlikely that the City of
Oakland would be eligible as a direct beneficiary for these funds, which are available a broad
range of transit maintenance and improvement projects.
Estimated Potential Funding: Unlikely to receive funding unless there is a transit agency sponsor.
7.3.2 LOCAL (NON-FEDERAL) PUBLIC CAPITAL FUNDING SOURCES
Local funds include state, regional, City and private funding. The following is a documentation of
potential sources that have been identified including some descriptions of the source, its
likelihood for use on this project, and approximate estimate of range of funding that it could
produce.

7-99
7.3.2.1 One Bay Area Grant
The One Bay Area Grant program, administered by MTC combines both regional and federal
funding sources available to MTC into a comprehensive grant program that addresses federal
transit guidelines, the State’s climate laws and the sustainable community strategy. Project
identification and selection is coordinated through the CMAs in each county, which is the
Alameda County Transportation Commission (AlaCTC) for projects in Oakland.
In the first two cycles of OBAG funding (2013-14 and 2014-15), approximately $63M was
programmed by Alameda CTC for Alameda County. The program is designed to reward
communities, like Oakland who have accepted and are making progress on priority development
areas and accepting regional housing distributions.
OBAG funds can be applied to all phases of the project development cycle. Grants are
competitive and tend to be relatively small, but are a minimum of $100,000. No OBAG grant in
Alameda County has exceeded $10,000,000. OBAG funds may be used to match other funds, but
are restricted in cases where federal funds cannot be used to match other federal sources. An
11.4% match in nonfederal funds is required for most OBAG grants that include federal funding.
Projects funded with OBAG grants in the current funding cycle include:
Oakland Complete Streets Oakland ($3,851,000)
7th Street West Oakland Transit Village Phase 2 Oakland ($3,288,000)
Lakeside Complete Streets and Road Diet Oakland ($7,000,000)
Oakland - Peralta and MLK Jr. Way Streetscape- Phase I Oakland ($5,452,000)
An OBAG grant could continue the planning, design and environmental phases of a downtown
circulator project in Oakland. In construction, OBAG grant funds could provide the complete
streets corridor improvements that would likely be needed to support the circulator project.
Estimated Potential Funding: $1 to $5M primarily for project development work.
7.3.2.2 Cap and Trade Funds and Core Capacity Transit Grants
Two new funding programs to bolster the Bay Area’s transit network and address climate
concerns were adopted by MTC at the end of 2013. Totaling nearly $10 billion, the programs are a

7-100
direct response to the recently adopted Plan Bay Area, which seeks to reduce the region’s
transportation-related emissions by 18 percent before 2040. MTC is in the process of developing
guidelines for a project selection process for these funds which are likely to include significant
investments in low emission transit maintenance and expansion.
The first program creates a Cap and Trade Funding Framework to guide investment priorities for
some $3.2 billion in state Cap and Trade revenues that the Bay Area anticipates receiving over the
next few decades. Plan Bay Area provides that at least 25 percent of these funds must be invested
in low-income communities, which would include portions of the proposed project
alignment. State legislation (AB 574) supporting the formation of the cap and trade network
identified the following framework for expenditures statewide:
Transportation network and demand management, including, but not limited to, trip-
reduction programs, congestion pricing, and roadway modifications, such as
roundabouts.
Public transportation, including operations, maintenance, and capital costs.
Road and bridge maintenance; operations and retrofits for complete streets, bike, and
pedestrian safety enhancements; safe routes to schools; and urban greening.
Clean transportation fueling infrastructure and support
Multimodal network connectivity to reduce travel distances and improve access to parks,
schools, jobs, housing, and markets for rural and urban communities, including
neighborhood scale planning.
Development and adoption of local plans and land use policies that help to implement
regional plans.
Community infrastructure, including public works and municipal improvements necessary
to support transit-oriented development, affordable housing, infill in existing urbanized
areas, and small walkable communities in rural neighborhoods.
Multi-use facilities and accommodations for bicyclists, pedestrians, and neighborhood
electric vehicles.
Interregional rail modernization and related community infrastructure.
Administrative costs and development and use of evaluation, monitoring, and verification
systems

7-101
In all, the Cap and Trade Funding Framework adopted by MTC includes:
1. $1.05 billion for One Bay Area Grants, which support transit-oriented development and
other local transportation improvements
2. $500 million for a Transit Operating and Efficiency Program (with existing large transit
operators including AC Transit and BART being eligible recipients)
3. $450 million to improve goods movement and mitigate associated environmental
impacts
4. $275 million for MTC’s Climate Initiatives Program, with $75 million going directly to Safe
Routes to School
5. $875 million for the Core Capacity Challenge Grant program
The Core Capacity Challenge Grant program commits $7.5 billion — including $875 million from
the above-referenced Cap and Trade funds, $402 million in bridge toll revenues, and over $3
billion in federal transportation funds — over 15 years for capital improvements to the region’s
largest transit systems: San Francisco Muni, BART and AC Transit. While the City of Oakland would
not be eligible for these funds, one of the large operators could request funds for this project,
especially if the circulator was seen as relieving a capacity constraint on one of the eligible
systems. To receive the money, operators would need to meet certain performance and efficiency
objectives, and match 30 percent of the grant money with their own funds.
Because these are new funding sources, it is unclear how much might be available for new
projects or what the selection criteria for such projects might be. A key element for access to
these funds would be partnership with one of the major transit operators who will have access to
more categories of funding than a municipality such as Oakland.
Estimated Potential Funding: Unknown as regulations are not yet written and Oakland may not be
an eligible recipient.
7.3.2.3 Bridge Toll Funding
On March 2, 2004, voters passed Regional Measure 2 (RM2), raising the toll on the seven State-
owned toll bridges in the San Francisco Bay Area by $1.00. This extra dollar was raised to fund
various transportation projects within the region that have been determined to reduce congestion
or to make improvements to travel in the toll bridge corridors, as identified in SB 916 (Chapter

7-102
715, Statutes of 2004). Specifically, RM2 establishes the Regional Traffic Relief Plan and identifies
specific transit operating assistance and capital projects and programs eligible to receive RM2
funding.
The Bay Area Toll Authority (BATA) is responsible for the collection of the bridge tolls and MTC is
responsible for administering the Regional Measure 2 program. Recently, BATA’s Long Range
Plan (PDF) was updated to incorporate the Regional Measure 2 projects.
While RM2 projects have been identified and the funding source is currently fully subscribed,
future toll increases and longer term funding could be available for alternative transportation
projects. In Alameda County, RM2 funds have been used for enhanced bus and rail projects
throughout the County.
Estimated Potential Funding: Funding Unlikely in current RM2, but could be significant if there is an
update.
7.3.2.4 Alameda County Measure BB
The renewal and expansion of the transportation sales tax in Alameda County, Measure BB, will be
on the ballot in November 2014. Assuming the measure passes as predicted, a total of $10 M has
been allocated for a transit improvement in the Broadway corridor in Oakland. Funds could be
used for on-going project development, design or for capital construction of any phase of the
project. An additional $10M is allocated to a College/Broadway corridor transit priority project in
the Rapid Bus category. The project could also potentially compete for funding under the
Community Development Investment category for connecting people to jobs and schools.
Estimated Potential Funding: $10 M allocated plus opportunity for some additional competitive
funds, up to approximately $5 M.
7.3.3 LOCAL PRIVATE CAPITAL FUNDING SOURCES
7.3.3.1 Community Benefit District/Business Improvement District (CBD/BID)
There are a total of five different Community Benefit Districts already existing within the study
area: The Downtown Oakland Community Benefit District is comprised of a 19-block area
extending from 18th Street between Clay and Franklin to 8th Street between Franklin and
Washington. Broadway runs through the center of the district. In addition, CBDs exist in Jack

7-103
London Square, Lake Merritt/Uptown and Koreatown Northgate (KONO). The associations meet
and function jointly.
CBD formation requires the support of property owners who, in essence, agree to a special
assessment on their property tax in exchange for special benefits that would not otherwise be
provided by the City. A CBD currently lasts up to 10 years and ultimately requires a simple
majority to implement. Funding for a circulator project, either capital or operating could come
from an expansion, extension or reallocation of these funds, subject to a vote of the membership.
Funds from a CBD could be used for both capital and operating funds, and can be bonded to
accelerate project delivery. Expenditures are guided by a “Management Plan” which spells out
how collected funds can be used. The current CBDs generate between $500,000 and $1.5 M per
year or about $5 M in combination.
Estimated Potential Funding: TBD depending on local support but estimated at $1 to $5 M annually.
7.3.3.2 Community Facilities District
A Mello Roos Community Facilities District (CFD) is a tool available for assessing a property tax
levy on properties that benefit from a local facility. The Los Angeles Streetcar has been partially
funded through a CFD. A local CFD example in Oakland is the district funding the Rockridge
Library through a $25 per parcel special tax. Funds raised through a community facilities district
may be used for capital, for loan repayment or for operating funds to support a local project. It is
unlikely that both a CFD and Community Benefit District would be implemented in the same area,
since they are both tools for generating a property tax levy in a confined area. District boundaries
for streetcar projects that have received funds from a local property tax district are typically 1,200
feet to ¼ mile from the route alignment.
Estimated Potential Funding: TBD depending on local support but estimated at $500,000 to $5 M
annually. Would not be used if a CBD is implemented.
7.3.3.3 Developer Fees and Agreements (Transportation Impact Fee)
The City of Oakland is currently completing a nexus study as a precursor to establishing a formal
development fee. While there is no formal fee in place today, the City of Oakland has a history of
negotiating for improvements that increase non-auto mode share and improve access to
development sites. For example, the Brooklyn Basin developer is required to provide a

7-104
connection between that site and BART. The variant alternatives for B-line expansion to Brooklyn
Basin could be funded in part by the developer as they meet this obligation. Similar requirements
could be built into other development agreements. Over time, the City will develop a
development impact fee which could provide flexible funding for transit and multimodal projects
either within a defined area, or city-wide.
Estimated Potential Funding: TBD depending on development levels.
7.3.3.4 Parcel Tax
Parcel taxes are common tools used by California cities to raise money for specific projects in an
era when general property tax rates cannot be raised because of Proposition 13. Parcel taxes can
be bonded to accelerate projects and could be used for both capital and operating funding. The
distinction between a parcel tax and a property levy within a district is that it is City wide and
requires a 2/3 vote of the residents of Oakland. Oakland has levied a number of parcel taxes for a
variety of purposes. The majority of successful parcel taxes in California are for schools, libraries
and other projects of citywide importance.
Estimated Potential Funding: Revenue varies depending on voter interest. Because it covers the
entire city, could raise a significant amount of money.
7.3.3.5 Real Estate Transfer Fee
The Real Estate Transfer fee is paid by property buyers at the time of transaction. Oakland
currently imposes a local fee of $15.00 per thousand per transaction, with some limited
exceptions. This is the highest real estate transfer fee imposed by any city in Alameda County and
one of the highest in the State. The fee could be increased only with a 2/3 super majority of
Oakland voters. Given increasing real estate costs, the amount generated by the fee is increasing
and is likely to continue to increase. Funds from the existing fee could be allocated to the
circulator, either for capital or for operating costs; and/or the fee could be increased by the
voters.
Estimated Potential Funding: Very low likelihood given current rate and citywide vote requirement
7-105
7.3.3.6 Commercial Parking Tax (CPT)
A commercial parking tax could be levied on all off-street parking spaces within the study area
and/or Citywide. Parking tax would be collected by the parking operator and paid to the City.
San Francisco and Seattle both have commercial parking taxes of 25% and 12.5% respectively.
Oakland does not have a commercial parking tax currently. In those examples, portions of the
revenue stream are allocated for major capital projects, with an emphasis on multimodal projects
that reduce the demand for parking expansion. There is no statutory limit to the tax and it can be
used for a wide variety of transportation uses. This revenue stream can be bonded to pay for
capital projects.
Commercial parking tax funds are subject to competing priorities including general fund uses,
construction and maintenance of parking facilities and other needs. However, depending on the
rate they have the potential to provide needed capital and operating funds.
Estimated Potential Funding: $1 - $5 Million
7.3.3.7 Parking Benefit District
The City of Oakland is scheduled to begin a downtown parking study later this year. This could
include assessing the possibility of establishing a parking benefit district which would spend a
portion of meter revenue collected in the district on local priorities, which could include the
circulator. Parking revenues can be bonded to accelerate a capital project. Specifics of the
district boundaries and the amount of funding available for what range of projects has not yet
been determined.
Estimated Project Funding: TBD
7.3.3.8 General Obligation Voter-Approved Bonds
The City of Oakland could issue such bonds upon voter approval to levy an assessment on real
property, payable by property owners. These “Unlimited Tax GO bonds” (UTGO) must be
approved by two-thirds of voters, and can be used for capital projects. Bonds are generally raised
against a specific asset or revenue source. GO bonds are backed by a promise by the City of
Oakland to levy ad valorem property taxes in an unlimited amount as necessary to pay debt
service. Because Oakland has bonded for many different projects in the past, there is some
question about the amount of bonding authority that may be available to the City. Voters are
7-106
generally more supportive of bonding than taxing, because taxes do not increase to pay for a GO
Bond.
Estimated Range of Project Funding: TBD
7.3.3.9 The City of Oakland General Fund
The City’s General Fund is composed of a number of funding sources including property tax
revenues, sales tax revenues, fees and fines. The City’s budget annually includes an allocation of
General Fund revenue for transportation purposes, often matching other sources. The City of
Oakland may elect to fund a portion of this project’s capital or operating needs from its General
Fund. Because any allocation from the General Fund would compete directly with other Citywide
needs, this should be considered “last in” funding.
Estimated Range of Project Funding: TBD
7.4 OPERATIONS AND MAINTENANCE FUNDING
Operating and maintenance (O&M) funds for circulator projects in California must come from one
or more local funding sources as federal and state funds are not available for this purpose.
Appendix C provides information on O&M funding sources for circulator projects in other cities.
The most common funding sources include farebox revenues, transportation sales tax revenues,
parking fees, parking benefit districts, local funding districts, transit agency funds, local city funds,
and sponsorships/advertising.
The following section describes sources that have been identified as potential contributors to the
operating and maintenance costs of the circulator. Once an operating plan and operator is
finalized, the operating funding plan can be more fully established. A funding plan will be
required prior to receiving a full funding construction agreement from FTA under Small Starts.
7.4.1 FAREBOX REVENUE
Fares are generally an important part of funding operating costs of a transit system. The current
B-Line is unique in that it offers a free fare option for short trips between Jack London Square and
downtown Oakland. With the expansion of the downtown circulator and eventual

7-107
implementation of a streetcar line, it may be necessary to charge passengers a fare for service. A
fare of $2.00 per trip was included in the ridership estimate. Given fare discounts, an average fare
of $1.25 per trip would generate approximately $1.6-2.1 million per year (assuming a ridership
range of 4,400-5,900 per weekday based on the alignment and service plan described in Section
6.2 and an annualization factor of 290).
7.4.2 CIRCULATOR STOP AND VEHICLE SPONSORSHIP
Various options are available for sponsorship of circulator stops and vehicles, once stops are
upgraded. Stop sponsorships, which provide branding of the glass panels at shelters, have been
sold in many cities implementing a circulator. Some systems such as Tampa’s TECO Trolley also
sold naming rights for the system. This practice builds on the more standard practice of selling
advertising at stations and on vehicles and allows stations to remain uncluttered by ads while still
generating revenue. The amount generated by sponsorships and naming rights varies but
generally provides less than 15% of the operating cost of a system.
7.4.3 OTHER PRIVATE FUNDING
Additional efforts to raise revenue through streetcar promotions, sponsorships, annual pass sales,
business promotions, and potentially private contributions may be possible. Portland Streetcar,
for example, has been successful in raising private funds on the order of $300,000 annually
through a non-profit corporation. Amazon.com, Inc., recently provided $5.5 million in funding
including a fourth streetcar vehicle for the South Lake Union line and a 10-year commitment to
provide operating funding for a 12-hour service span and increased frequency. Adding service to
Kaiser and other “pill hill” locations may allow those institutions to eliminate or reduce their own
shuttles, supporting the circulator as an alternative.
7.4.4 FLEXIBLE FUNDING FROM LOCAL SOURCES
A number of sources described under the capital plan might be able to provide on-going
operating funds. Funding could be drawn from a Community Benefit District or Community
Facilities District, as well as contributions from a parcel tax, parking tax or parking benefit district.
The size of contributions from these sources varies, but several sources combined could provide a
significant share of funding towards the operation of the circulator.

7-108
7.4.5 FEDERAL REGIONAL FLEXIBLE FUND ALLOCATIONS
Each region is granted flexible funds in a four-year cycle, traditionally for highway road capital
projects or operations. It is possible to request a portion of these funds to go toward a first two-
years operating commitment of rail transportation projects. A number of other modern streetcar
projects have received federal flex funds for operations, including the Washington DC streetcar.

8-109
8.0 APPENDIX A
System Integration
(Note: The following text is a full description of the system integration assessment that is
summarized in Section 6.2.3.)
As described in Section 2.4, an array of transit services and facilities already exists in the corridor.
There are two BART stations (12th
Street Oakland City Center and 19th
Street Oakland) below
Broadway in Downtown Oakland, and each of the project alternatives terminates at a BART station
to the north (MacArthur or Rockridge). Additionally, Broadway in Downtown Oakland is the core
of the AC Transit bus network, with a dozen all-day services converging on the street between
11th
Street and the Uptown Transit Center at 20th
Street, adjacent to the 19th
Street BART Station.
Finally, there is both an Amtrak station and a ferry terminal near Jack London Square.
Each of the project alternatives would enhance the utility of existing transit services in the corridor
by providing additional connections to and from the existing regional and local networks.
Most notably, the alternatives would serve as feeders or first/last mile connectors to BART. The
existing B circulator was developed in large part to improve transit connectivity between the 12th
Street BART Station and Jack London Square. It was based in part on recommendations from a
2004 BART study of alternatives for improved connectivity to Jack London Square, and the service
is funded in part by the owners of Jack London Square.
However, the existing shuttle does not extend north past Grand Avenue on weekdays or 27th
Street on Friday and Saturday evenings. It therefore does not connect directly to much of the
Broadway/Valdez redevelopment area, which extends from 23rd
Street north to Interstate 580 (I-
580). Each of the alternatives would improve transit connectivity between the 19th
Street BART
Station and Broadway/Valdez, although the 27th
Street phasing option would provide only partial
connectivity.
The alternatives would also improve connectivity between Broadway/Valdez and AC Transit’s
Uptown Transit Center hub, the future northern terminus for BRT service, as well as between
Broadway/Valdez and the Jack London Square Amtrak Station and ferry terminal.

8-110
To the north, the streetcar alternative and both enhanced bus alternatives would connect to BART
stations, but benefits would vary depending on the terminus station and the alternative. Because
BART service levels are higher at MacArthur Station than at Rockridge Station, and because
MacArthur is more easily accessible from most points in the BART system, the alternatives
terminating at MacArthur would provide greater connectivity to BART. The MacArthur BART
alternatives would also improve connectivity between BART and major destinations in the
northern part of the corridor – the large hospitals in Pill Hill – while many of the most popular
destinations to the north, the College Avenue retail corridor, are already within walking distance
of the Rockridge Station.
It should be noted and understood that while the alternatives would improve transit connectivity
in the corridor, the extent to which they would improve connectivity varies not just by alternative,
but depending on the degree of connectivity that already exists. Additionally, existing connections
could potentially be eliminated or reduced in utility in response to the project (see following
section for a discussion of possible impacts). Key existing connections in the corridor include:
Downtown Oakland to Jack London. In addition to the existing B Shuttle, which would
ultimately be replaced by whatever project alternative is selected, AC Transit Routes 58L,
72, 72M and 72R also operate between the core of Downtown Oakland, including the 12th
Street and 19th
Street BART stations, and Jack London Square. Routes 58L, 72 and 72M
continue east from Broadway and the Square to the Amtrak Station. The combined
average weekday frequency on all four routes is approximately five-and-a-half minutes,
and they share stops downtown, meaning that Jack London-bound passengers can take
the first bus that comes along. Their utility as connecting services could be improved by
changes to branding and passenger information including new signage. The requirement
to pay full fare for a relatively short trip, however, would continue to act as something of
a deterrent. Figure A-1 shows an existing wayfinding sign near the 12th
Street BART
Station.

8-111
Figure A-1: Existing Transit Wayfinding Signage in Downtown Oakland
Downtown Oakland to Broadway/Valdez. Similarly, existing AC Transit service already
provides connections between the BART stations in the Downtown Oakland core and
Broadway north of downtown. Route 51A operates every 10 minutes peak, every 12
minutes off-peak, and will be made faster and more reliable by the Line 51 Corridor Delay
Reduction and Sustainability Project. Just as for AC Transit service between Downtown
and Jack London, the utility of Route 51A as a connecting service could be improved
using branding and passenger information, a significantly less expensive investment than
new service. However, the route’s length –8.8 miles – and lack of dedicated running way
makes it challenging to operate reliably5.
MacArthur BART to Pill Hill. AC Transit Route 57 provides a connection between the
MacArthur BART station and Kaiser Hospital, and is within ¼ mile of the Alta Bates
Medical Center. Shuttles funded by Sutter Health, the operator of Alta Bates, and by
Kaiser Permanente are open to hospital employees, patients, and the general public
5 The route was even longer prior to 2009, when Route 51 was split into Routes 51A and 51B in an effort to
improve reliability.

8-112
including nearby residents. These shuttles are free and relatively frequent. They do not,
however, currently operate late nights or on weekends.
Impacts
While the project alternatives are designed to improve transit service in the corridor, there could
be negative impacts in addition to the benefits. Most notably:
The existing B Shuttle service would ultimately be replaced. While the replacement
services being evaluated by this study would be better in most ways, the B is a free
service – so any replacement service charging a fare, even a fare lower than that for other
services in the corridor, would negatively impact the affordability of circulator service in
the corridor. (It should be noted, however, that operation of the B Shuttle requires
substantial subsidy and does not have a sustainable funding source, so there is no
guarantee that a fare might not be charged at some future point for the service,
particularly if it were to expand.)
If service on Route 51A, which would largely overlap with Circulator service in the
corridor, were maintained at current levels, then ridership, productivity, and cost-
effectiveness could all be impacted significantly. Alternately, service could be reduced in
response to new Circulator service, but in segments where the routes did not overlap –
north of 40th
Street if one of the MacArthur alternatives were selected – overall transit
service levels would be reduced.
This issue has been a primary concern of this study, and a number of possible service
concepts have been developed and discussed with AC Transit, including:
o Eliminating the Oakland segment of Route 51A, and replacing it with Circulator service.
If the Rockridge Enhanced Bus alternative were selected, the Circulator could replace
Route 51A along its alignment. A reconfigured 51A might then run between Fruitvale
BART and the 20th
Street Transit Center. Depending on funding sources for the
Circulator, this could reduce AC Transit operating costs while increasing service levels
in the corridor (as the Circulator would operate every 10 minutes all day, rather than
every 12 minutes in the mid-day). However, transfers would be required for some
existing one-seat rides, including trips between Alameda and the Pill Hill area.
o Eliminating the Oakland segment of Route 51A, and replacing it in non-Circulator
segments with other services. If one of the MacArthur BART alternatives were selected,
the Oakland segment of Route 51A could be eliminated as described above, and
another AC Transit route could serve the segment between Rockridge and 40th
Street.
The most obvious candidate is Route 51B, which might be extended via College and

8-113
Broadway to MacArthur BART. While this would restore some one-seat rides that
were converted to two-leg trips when Route 51 was split into Routes 51A and 51B,
transfers would be required for some existing one-seat rides on Route 51A6. Also,
reliability on Route 51B would be impacted.
o Splitting Route 51A into two lines, and reducing service on the Oakland segment.
Alternately, Route 51A could be split into two routes serving the Alameda and
Oakland segments, with reduced service levels on the Oakland route. This would
maintain one-seat rides between points north and south of 40th
Street and would
reduce costs. However, in addition to reducing service levels north of 40th
, this would
increase wait times for passengers transferring between Route 51B and the Oakland
segment of Route 51A.
o Realigning Route 51A. Another alternative would be to retain Route 51A and maintain
current service levels, but realign segments of the route in order to avoid duplication
of Circulator service. In order to avoid simply shifting the problem of duplicative
service to another corridor, existing service would have to be at least partly replaced.
One option, if the Rockridge Circulator alternative were selected, would be to realign
Route 51A onto Telegraph Avenue north of Downtown Oakland, replacing the
segment of Route 1 that will be “orphaned” by the introduction of BRT service and
elimination of Route 1 service south of Downtown Oakland in 2017.
o Reconfiguring service on the Oakland segment of Route 51A to serve distinct travel
markets. Another approach would be to retain Route 51A and maintain current
service levels, but operate limited-stop service in segments overlapping with
Circulator service. Route 51A could then serve as a “faster alternative” to the
Circulator. However, this would reduce access and impact the legibility of the route,
which would be a “hybrid” local- and limited-stop service.
o Revising Circulator alternatives to service distinct travel markets. Alternately, the
Circulator might provide limited-stop service in overlapping segments; however,
limited-stop service is less effective and appropriate on shorter routes serving shorter
trips, where the time savings from skipping stops is reduced and where riders are
more sensitive to longer travel times to and from stops.
6 As of Fall 2012, there were 1,079 average weekday boardings on Route 51A north of 40th Street, 22
percent of the total for the corridor. Of these, 996 were in the southbound direction, including 480 at the
Rockridge BART Station and 215 at the first stop north of 40th, at 42nd Street adjacent to Oakland Technical
High School. Assuming that most of those boarding north of 40th Street are continuing to destinations
south of 40th Street, this suggests that roughly 800 passengers with existing one-seat rides would be
required to transfer.

8-114
It might be possible to combine some of the above concepts, for example by both extending
Route 51B and realigning Route 51A to use Telegraph. In any case, all Circulator alternatives
would have some negative impacts on the existing transit network, as AC Transit would be
required to choose between reduced cost-effectiveness on Route 51A and service changes that
would impact some existing riders. Depending on their decision, however, these impacts might be
limited, and they could be at least partly offset by benefits in other areas.

9-115
9.0 APPENDIX B
Environmental Screening
(Note: The following text is a full description of the environmental assessment that is summarized in
Section 6.2.8.)
The purpose of this assessment is to indicate the major environmental issues that could result
from the construction and operation of the Broadway Urban Circulator Transit Study (Project).
Environmental issues will be completely addressed in the appropriate environmental document
under the California Environmental Quality Act (CEQA). Federal National Environmental Policy Act
(NEPA) guidelines may apply if the Project sponsor decides to pursue federal funding for project
development and construction. However, issues that may trigger federal agency participation,
permitting, or compliance will be examined in the CEQA document and the necessity of
incorporating NEPA guidelines in the environmental analysis will be addressed, as appropriate.
Recently approved streetcar projects, such as the Tucson Modern Streetcar in Arizona and the
Kansas City Downtown Streetcar in Missouri, have been the subject of an Environmental
Assessment (EA) under NEPA, with a Finding of No Significant Impact (FONSI) decision document.
The environmental review for the Downtown Riverfront Streetcar in Sacramento and the
Downtown Los Angeles Streetcar Project are both currently underway with EAs. An Environmental
Impact Report (EIR) was prepared for the Sacramento project a few years ago, and an Initial Study
(IS) was most recently prepared for the Los Angeles project. An Initial Study is used to determine
the appropriate level of environmental analysis required for a project under CEQA. In the case of
the Downtown Los Angeles project, the IS identified significant environmental impacts that
required further study, and an EIR is being prepared. The information generated in Phase 1 of the
Broadway Urban Circulator study could be used in the preparation of an IS. If the technical
documentation supporting the IS indicates that potentially significant impacts are likely to be
mitigated to a less than significant level, then a Mitigated Negative Declaration (the IS
incorporating committed mitigation measures as appropriate) may be sufficient for gaining
environmental clearance for the Project. If the IS identifies potentially significant impacts that
may not be easily mitigated, are controversial, or are likely to be unavoidable, then an EIR that
compares the environmental effects of No Project with the Project (and other alternatives that
have been considered) is required. An EIR embodies a more comprehensive environmental

9-116
analysis than the Initial Study and is accompanied by extensive public involvement. Recent
changes to the Federal Transit Administration’s (FTA) NEPA regulations may allow for a
Categorical Exclusion (CE) to be prepared for a project that is located entirely within existing
operational right-of-way that is used for transportation purposes. The determination of whether
the CE would apply to a project must be closely coordinated with the FTA. The appropriate level
of environmental analysis will be determined during Phase 2 of this study.
CONTEXT
The Broadway Urban Circulator Transit Study has resulted in further study of three alternatives:
Enhanced Bus Alternative #1: Jack London Amtrak Station (Oak Street) to
MacArthur BART Station
Enhanced Bus Alternative #2: Jack London Amtrak Station (Oak Street) to Rockridge
BART Station
Streetcar Alternative #1: Jack London Amtrak Station (Oak Street) to MacArthur
BART Station
DESCRIPTION OF STUDY ALTERNATIVES
The Broadway Urban Circulator Transit Study evaluates two enhanced bus alternatives and one
streetcar alternative. Enhanced Bus Alternative #1 and Streetcar Alternative #1 have the same
terminus points and virtually the same alignment and station locations. The bus or streetcar
circulator vehicles will generally operate in mixed flow traffic in the curb or outside travel lane.
The bus or streetcar circulator vehicles will generally operate in mixed flow traffic in the curb or
outside travel lane.
A key element of all three alternatives is a dedicated transit lane on Broadway between 7th
Street
and 22nd
Street. The curb travel lane in this segment of Broadway would be dedicated for
exclusive use by transit vehicles and autos making right turn movements at intersections or mid-
block access points.
Components of the enhanced bus alternatives include fixed guideway improvements, stop
improvements, advance vehicle technology, pedestrian improvements adjacent to bus stops, and
wayfinding improvements.
9-117
Components of the streetcar alternative include fixed guideway improvements, stop
improvements, utility relocation, streetcar vehicles, a streetcar vehicle storage and maintenance
facility, pedestrian improvements adjacent to stops, and wayfinding improvements.
ENHANCED BUS ALTERNATIVE #1: JACK LONDON AMTRAK STATION (OAK STREET) TO
MACARTHUR BART STATION
The alignment of this alternative would be located along the following street segments.
1. 2nd
Street: Oak Street to Webster Street
2. Webster Street: 2nd
Street to Embarcadero
3. Embarcadero: Webster Street to Broadway
4. Broadway: Embarcadero to 40th
Street
5. 40th
Street: Broadway to Martin Luther King, Jr. Way
ENHANCED BUS ALTERNATIVE #2: JACK LONDON AMTRAK STATION (OAK STREET) TO
ROCKRIDGE BART STATION
The alignment of this alternative would be the same as in Enhanced Bus Alternative #1, but with
deviations located along the following street segments, instead of along 40th
Street proceeding
west to Martin Luther King, Jr. Way. The alignment would continue up Broadway from 40th
Street
to College Avenue, and then proceeding along College Avenue to the Rockridge BART Station
parking lot.
STREETCAR ALTERNATIVE #1: JACK LONDON AMTRAK STATION (OAK STREET) TO MACARTHUR
BART STATION
The streetcar tracks would be located along the same street segments as Enhanced Bus
Alternative #1, though the alignment would be limited to one direction on the Embarcadero
(Westbound) and on Webster Street where travel is in the southbound direction only.

9-118
POTENTIAL ENVIRONMENTAL ISSUES
This environmental screening is preliminary in nature and is not intended to substitute for the
review of the project alternatives under the California Environmental Quality Act (CEQA), and/or
the National Environmental Policy Act (NEPA), this memorandum indicates whether any
preliminary information reveals any environmental fatal flaws that may require modification to the
project alternatives. A brief discussion of potential environmental issues that may be problematic
to the further development of the project is also discussed. Should the proposed project advance
for further consideration in the project development process, a more detailed analysis of all
environmental topics discussed herein will be provided in accordance with state and/or federal
environmental laws and regulations.
The alternatives are all located within the Broadway Corridor in City of Oakland, a dense, built up
urban environment, with extensive commercial, mixed-use and residential development, and
roadways. The alternatives traverse many different communities that present a variety of
conditions.
ENVIRONMENTAL ISSUES FOR SEGMENTS COMMON TO ALL ALTERNATIVES
The portions of the proposed alignments that are common to all three alternatives include:
2nd
Street: Oak Street to Webster Street
Webster Street: 2nd
Street to Embarcadero
Embarcadero: Webster Street to Broadway
Broadway: Embarcadero to 40th
Street
Air Quality – The entire corridor is within the boundaries of the San Francisco Bay Area Air Basin
(Bay Area) that has been designated as non-attainment for ozone and particulate matter
according to state and federal standards. If federal funds are used for the project, or if any federal
action is required, the project would be subject to a project level review and interagency
consultation to determine if the construction of the project will result in adverse air quality
impacts of fine particulate matter in the project area. If the project is deemed to have localized
impacts, the project will be labeled as a “project of air quality concern” or POAQC. Depending
upon the type of fuel used for the enhanced buses, some air pollutants could be emitted, unless

9-119
the vehicles are electrically powered. The streetcar alternative would be electrically powered and
would not likely emit air pollutants locally during operation. The only local operational air quality
effects by the proposed project would be indirect, by any influence it would have on motor
vehicle traffic volumes/flows, or at crossings of local streets by the streetcar line.
Biological Resources - In these segments of the alignment, there are no naturally occurring
biological communities are known to currently exist, as habitat for flora or fauna are rarely
encountered in built urban environments, except where landscaped areas feature plants that have
adapted to harsh conditions. None of these would likely be defined as threatened or endangered
species.
Cultural Resources – A number of sites within the project area are listed in the National Register of
Historic Places, as well as being listed as designated local and/or national historic landmarks.
These include, Oakland City Hall, and the Paramount Theatre (2025 Broadway). The area known as
“Old Oakland”, which served as the western terminus of the Transcontinental Railroad in the
1870’s, is comprised of 10 historic buildings that date back to the 1860s, 4 of which are located on
Broadway. These are:
Delger Block, 969 Broadway
Wilcox Building, 827 Broadway
Studio Building, 807 Broadway
Sanford Building, 801 Broadway
The potential for ground-borne noise and vibration impacts would need to be evaluated, as it
pertains to these and other historic resources within in the corridor.
Land Use –The land uses in the part of the corridor south of Interstate 880 (I-880) are primarily
mixed-use industrial, commercial, and residential. In the Waterfront Warehouse District on the
north side of 2nd
Street, warehouses have been converted into entertainment venues and office
space. The entire Broadway corridor spans several neighborhoods and planning areas, which are
the subjects of Specific Area Plans, such as the Broadway-Valdez Retail District. Several residential
development projects are also currently in the planning and permitting process, including projects

9-120
along 2nd
Street, Broadway. Redevelopment projects are planned in the Jack London Square area,
and the MacArthur BART Station Transit Village is currently under construction.
Local land use polices that support transit are in place in the city of Oakland, with emphasis along
major arterials and transit corridors. The proposed alternatives would be compatible with these
policies and plans.
Noise and Vibration – Residential and historic architectural structures are located within a
transportation corridor that is heavily used by a variety of transportation modes. The addition of
fixed guideway bus or rail transit may introduce further noise and/or vibration impacts. The
potential for these impacts, particularly due to ground borne noise will need to be evaluated. The
new residential uses along 2nd
Street, and along 40th
Street should be further considered.
Transportation – In the segment of the alignment on 2nd
Street between Oak and Webster, transit
vehicles have the potential to conflict with the loading and unloading activities at the warehouses
in the Waterfront Warehouse District. A number of AC Transit bus routes operate along
Broadway, and the new bus rapid transit project would also operate within the corridor from
11th
/12th
streets to 20th
Street via Broadway. The BRT would operate in the mixed-flow travel
lanes, with one stop on Broadway at 14th
Street. The proposed alignment of the alternatives
would operate in mixed flow traffic in the curb travel lane, with a dedicated transit lane on
Broadway between 7th and 22nd streets. This would in effect become a fixed guideway for
enhanced buses and for cars making right turns at intersections. However, there is limited curb
space between 11th
and 14th
Streets on Broadway. The addition of the transit vehicle signal
priority treatments for the entire corridor could help to minimize any traffic safety impacts.
Additionally, the proposed transit bulb stop locations would remove on-street parking spaces,
which could have some economic impacts to local businesses. Bicycle lanes throughout the
project corridor could also be impacted by the location of the transit bulb stops.
At this time, based on the information provided, no fatal flaws or unavoidable impacts are
anticipated in these segments. However, a complete traffic analysis will be required to
ensure that proper mitigation strategies are applied to facilitate transit operations without
impeding traffic circulation in the warehouse district, and particularly along Broadway,
where other transit services operate in mixed flow travel as well.

9-121
ENVIRONMMENTAL ISSUES FOR ENHANCED BUS ALTERNATIVE #1 SEGMENTS
40TH
STREET: BROADWAY TO MARTIN LUTHER KING, JR. WAY
Noise and Vibration – Residences are located along the north side of 40th
Street near the
MacArthur BART Station. Existing AC Transit services operate along 40th
Street, however the
addition of new services operating in the curb lane adjacent to these residences has the potential
for noise and vibration impacts that would need to be evaluated.
ENHANCED BUS ALTERNATIVE #2: JACK LONDON AMTRAK STATION (OAK STREET) TO
ROCKRIDGE BART STATION
In this alignment, all of the segments described above, except for the segment on 40th
Street
traveling west toward Martin Luther King, Jr. Way, are included, and would have similar potential
environmental issues. The two new segments for the alignment to the Rockridge BART Station
are discussed below.
BROADWAY: 40TH
STREET TO COLLEGE AVENUE
Transportation - This segment would share the alignment and transit bulb stops being
constructed as part of the improvements to AC Transit’s Line 51. As a result, on-street parking
spaces would be lost, which could result in economic impacts to local businesses.
COLLEGE AVENUE: BROADWAY TO ROCKRIDGE BART STATION PARKING LOT
Transportation - This segment would also share the alignment and transit bulb stops for Line 51.
In addition to the loss of on-street parking spaces, College Avenue is a heavily used local travel
corridor, which could affect transit travel times. A complete transportation analysis is needed to
identify potential conflicts between pedestrians, traffic and other transit services.
At this time, based on the information provided, no fatal flaws or unavoidable impacts are
anticipated in these segments. However, a complete traffic analysis will be required to
ensure that proper mitigation strategies are applied to facilitate transit operations,
pedestrian flow, and traffic circulation particularly along College Avenue.

9-122
ENVIRONMENTAL ISSUES FOR STREETCAR ALTERNATIVE #1 SEGMENTS
WEBSTER STREET: 2ND
STREET TO EMBARCADERO (SOUTHBOUND LANE ONLY)
Noise and Vibration - In this segment of the alignment, the streetcar alternative would operate
with the southbound flow of traffic, for one block. The turning movement could generate
potential noise impacts, which would need to be evaluated.
EMBARCADERO: WEBSTER STREET TO BROADWAY (WESTBOUND LANE ONLY)
Noise and Vibration - In this segment of the alignment, the streetcar alternative would operate
within the westbound flow of traffic, to return to Broadway. Multiple turning movements, both
westbound from the Embarcadero to Broadway, and well as eastbound on 2nd
Street from
Broadway, could generate potential noise impacts, which should be evaluated.
BROADWAY: EMBARCADERO TO 40TH
STREET
Transportation – Along Broadway, which is already a busy travel corridor for several transportation
modes, the addition of the streetcar in general traffic could raise safety concerns for motorists
and pedestrians, who would be unaccustomed to the new mode of transportation with tracks and
rails. In cities where new rail transit has been introduced, conflicts between rail and turning
vehicles have been commonplace. The curb travel lane on Broadway between 7th and 22nd
streets would be dedicated for the exclusive use of the streetcars and for cars making right turns
at intersections. However, there is limited curb space between 11th
and 14th
Streets on Broadway.
The addition of the advanced traffic signal priority for the entire corridor could help to minimize
any traffic safety impacts. Additionally, the new bus bulb stop locations would remove existing
on-street parking spaces, which could have some economic impacts to local businesses.
At this time, based on the information provided, no fatal flaws or unavoidable impacts are
anticipated in these segments. However, a complete noise and vibration analysis will be
required to ensure that proper mitigation strategies are applied to facilitate transit
operations.
ANCILLARY FACILITIES
A storage and maintenance facility for the streetcar vehicles with minimum parcel size of 2 acres
would be required. The preferred site includes two parcels or compilations of public owned
9-123
parcels, under Interstate 980 (I-980), at the northwest corner of 7th
Street/Castro Street or the
southeast corner of 7th
and Castro streets. To access facilities at either of these locations, streetcar
tracks would need to be constructed on 6th Street and 7th Street between Broadway and Castro
Street. There are some residential uses in the vicinity that could be affected by maintenance
operations. An evaluation of potential visual and noise impacts upon the residential land uses
would need to be conducted.
Two sites are under consideration for the location of the streetcar storage and maintenance
facility. At the northwest corner of 7th
Street/Castro Street, or the southeast corner of 7th
Street/Castro Street, approximately 2 acres would be required. Tracks along 6th Street and 7th
Street between Broadway and Castro would also need to be constructed.
Additionally, to power the streetcar system, traction power support poles, catenary, and
substations would need to be placed within the public right of way. Substations that convert
electrical current to the proper voltage for streetcar may require additional space and would be
placed intermittently along the alignment. The location of the traction power and small substation
facilities developed during the design phase would need be unobtrusive on the urban landscape,
in order to reduce visual, land use or displacement impacts. At this time, based on the
information provided, no fatal flaws or unavoidable impacts related to project traction
power or substation facilities are anticipated at this time.
SUMMARY
The primary environmental issues identified in this assessment focus on potential traffic and
transportation impacts along the alignment, particularly along Broadway and along 2nd
Street in
the warehouse district. At this time, based on the information provided, no environmental
fatal flaws or unavoidable impacts have been identified that would make the proposed
alternatives infeasible or imprudent to implement. Complete environmental analysis will
identify any impacts and measures to avoid, minimize, reduce or mitigate them.

10-124
10.0 APPENDIX C
Funding of Circulator Project in Other Cities
(Note: The following text supplements the funding discussion that is provided in Sections 7.3 and
7.4.)
Most of the recent urban circulator projects implemented in the United States have included a
variety of funding sources, including funding from federal and local public sources, combined
with private funding through business districts, local improvement districts, and/or value capture
mechanisms. Redevelopment funding, an historically important value capture mechanism in
California, is no longer available, increasing the challenge to fund projects in the State.
The following examples show how other cities have put funding packages together for their urban
circulator projects.
Atlanta Streetcar
Currently under construction, Phase One of the Atlanta Streetcar, which is comprised of 12 stops
along a 2.7 mile corridor that includes the Sweet Auburn District, Georgia State University and
Centennial Olympic Park, will provide last mile connectivity to MARTA and other transit services in
downtown Atlanta.
Capital Funding7
The total capital cost for Phase One of the Atlanta Streetcar is $92 million. Approximately half of
the capital funding for the project comes from a TIGER II FTA Federal grant. The remainder was
generated through three local funding sources including a significant contribution from Recovery
Zone Bonds which will be repaid through value capture. Atlanta also has access to regional
Livable Centers Initiative Funding which is similar in scope to the Bay Area’s One Bay Area Grant
program. A Downtown Improvement District provided about 15% of the capital costs and will
contribute to operating funding.
7 http://streetcar.atlantaga.gov/what-is-the-atlanta-streetcar/how-is-the-project-funded/

10-125
Atlanta Streetcar Capital Funding Sources
Source Funds
TIGER II Federal Transit Administration grant funds $47.6 million
City of Atlanta Recovery Zone Bond funds /
Department of Watershed Management Clean Water
Program
$32.6 million
Atlanta Regional Commission Livable Centers
Initiative Program $6.45 million
TIGER II FTA grant funds 51%
City of Atlanta Recovery Zone Bond funds /
Department of Watershed
Management Clean Water program
35%
Atlanta Downtown Improvement
District 7%
Atlanta Regional Commission
Livable Centers Initiative Program
7%

10-126
Atlanta Downtown Improvement District (ADID) $6 million
Operating Funding
At present operating costs are being finalized pending the selection of an operator. Committed
20 year operating funds will be derived from a combination of fare box revenue, advertising,
federal grant funds, Atlanta Downtown Improvement District contributions and City of Atlanta car
rental and hotel tax proceeds. 8
8 http://streetcar.atlantaga.gov/what-is-the-atlanta-streetcar/how-is-the-project-funded/
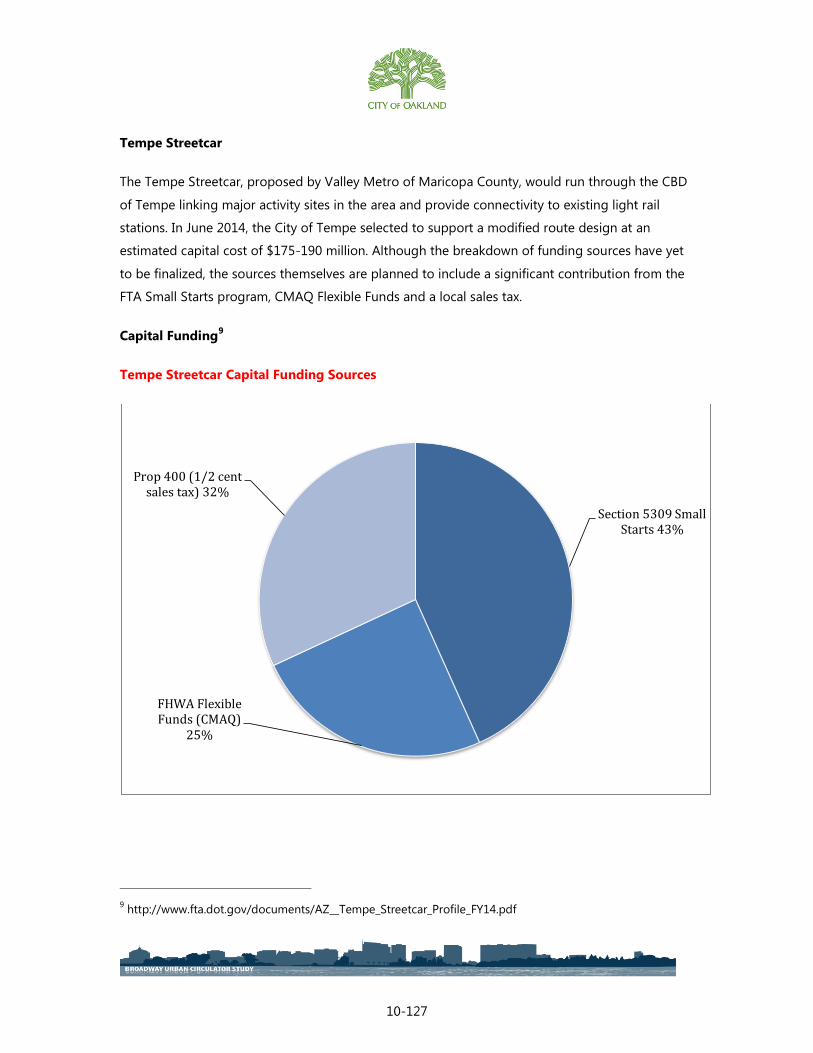
10-127
Tempe Streetcar
The Tempe Streetcar, proposed by Valley Metro of Maricopa County, would run through the CBD
of Tempe linking major activity sites in the area and provide connectivity to existing light rail
stations. In June 2014, the City of Tempe selected to support a modified route design at an
estimated capital cost of $175-190 million. Although the breakdown of funding sources have yet
to be finalized, the sources themselves are planned to include a significant contribution from the
FTA Small Starts program, CMAQ Flexible Funds and a local sales tax.
Capital Funding9
Tempe Streetcar Capital Funding Sources
9 http://www.fta.dot.gov/documents/AZ__Tempe_Streetcar_Profile_FY14.pdf
Section 5309 Small Starts 43%
FHWA Flexible Funds (CMAQ)
25%
Prop 400 (1/2 cent sales tax) 32%

10-128
Source Funds
Federal 5309 Small Starts $56 million
FHWA Flexible Funds (CMAQ) $32.10 million
Local Proposition 400 (1/2-cent sales tax) $41.24 million
Operating Funding
The City of Tempe will be responsible for operating costs, which will be derived from sales tax and
other funding sources including real estate transfer funds.10
The City is in the process of working
with downtown property owners to establish an improvement district that can help with funding.
Fares are expected to cover about 20% of operating cost.
10 http://www.valleymetro.org/projects_and_planning/project_detail/tempe_streetcar

10-129
Cincinnati Streetcar
Currently under construction, the first phase of the Cincinnati Streetcar will feature 18 stops along
a 3.6 mile route linking employment centers in the neighborhoods of Downtown, Rhine and
Uptown.11
Committed Funding12
At present there is currently $148 million in funding that has been committed to the project, $45.1
million from federal sources and $102.9 million from local sources. Local sources include a
variety of value capture mechanisms including a development fund and City property taxes, as
well as the proceeds from sale of property that can be redeveloped after implementation.
Cincinnati Streetcar Committed Funding Sources
11 http://www.cincinnati-oh.gov/streetcar/design-route/
12 http://www.cincinnati-oh.gov/streetcar/streetcar-funding/
Urban Circulator Grant 17%
CMAQ 3%
TIGER 3 11%
SORTA Rail ROW <1%
City Property Taxes 23%
City Income Taxes 3%
TIF 7%
Blue Ash Airport Sale 18%
Development Fund Revenue
9%
Reprogramed Capital & TIF
Resources 5%
Duke Energy/Streetlight
Sales 4%

10-130
Source Funds
FTA Urban Circulator Grant $24.9 million
USDOT TIGER 3 $15.9 million
OKI CMAQ $4 million
FTA SORTA Rail ROW Grant $268,000
City Property Tax Capital $33.4 million
Blue Ash Airport Sale ($15m in escrow pending Duke utility
relocation) $26 million
Development Fund Revenue $14 million
Tax Increment Financing (TIF) $11 million
Reprogrammed Capital & TIF Resources $7.4 million
Duke Energy/Streetlight Sale $6.5 million
City Income Tax Capital $4.6 million

10-131
Operating Funding
Operating funds have yet to be finalized but are expected to come in part from a City
contribution and in part through fares and the transit operator’s general operating budget.
Portland Streetcar
The Portland Streetcar, a 7.35 mile alignment, was constructed in five phases.13
Each phase had a
slightly different funding profile, but all phases included both Federal and local funds. A unique
feature of the Portland Streetcar’s early phases was the very small contribution of federal funds
and the range of local sources, including a Local Improvement District and City Parking Bonds.
Segment Trackage Capital
Budget
Completed
1 Legacy Good Samaritan
Hospital – Portland State Univ. 2.4mi double track $56.9 million 2001
2 Portland State Univ. -
RiverPlace 0.6mi double track $16 million 2005
3 RiverPlace – SW Gibbs St. 0.6mi single track $15.8 million 2006
4 SW Moody & Gibbs – SW
Lowell 0.4mi single track $14.45 million 2007
5 Pearl District - OMSI
3.35 double track $148.27
million 2012
13 http://www.portlandstreetcar.org/pdf/capital_and_operations_detail_FY2014.pdf

10-132
Capital Funding14
Segment 1 Capital Funding Sources
Source Funds
City Parking Bonds $28.6 million
Local Improvement District $9.6 million
Federal Transportation Funds $5 million
14 http://www.portlandstreetcar.org/pdf/capital_and_operations_detail_FY2014.pdf
Parking Bonds 50%
Local Improvement
District 17%
TIF 13%
Federal Transportation
Funds 9%
City Parking Fund 4%
City General Fund 3%
City Transportation
Fund 3%
HUD Grant 1%
Misc. <1%

10-133
City Parking Fund $2 million
City General Fund $1.8 million
City Transportation Fund $1.7 million
HUD Grant $0.5 million
Miscellaneous $0.2 million
Segment 2 Capital Funding Sources
TIF 52%
Transportation Land Sale
19%
Local Improvement
District 19%
HUD Grant 5%
Transportation Fund 4%
Misc. 1%
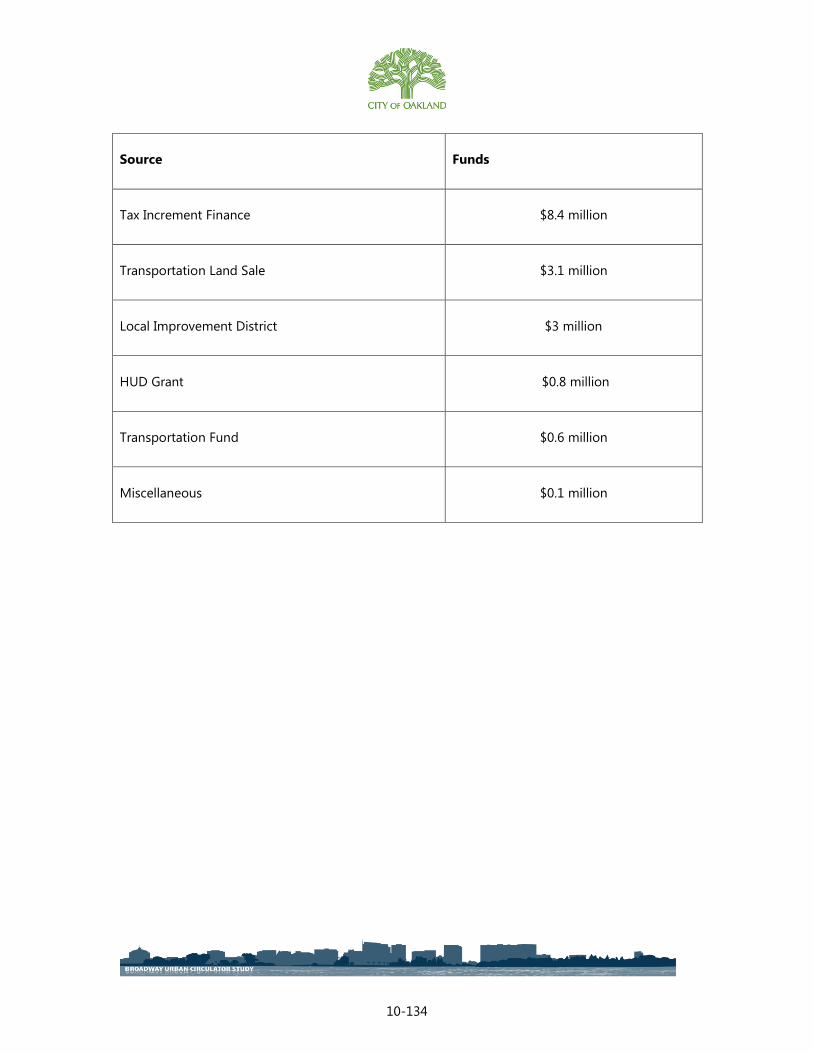
10-134
Source Funds
Tax Increment Finance $8.4 million
Transportation Land Sale $3.1 million
Local Improvement District $3 million
HUD Grant $0.8 million
Transportation Fund $0.6 million
Miscellaneous $0.1 million

10-135
Segment 3 Capital Funding Sources
Source Funds
Regional Transportation Funds $10 million
Tax Increment Finance $3.8 million
Local Improvement District $2 million
Regional Transportation
Funds 63%
TIF 24%
Local Improvement
District 13%
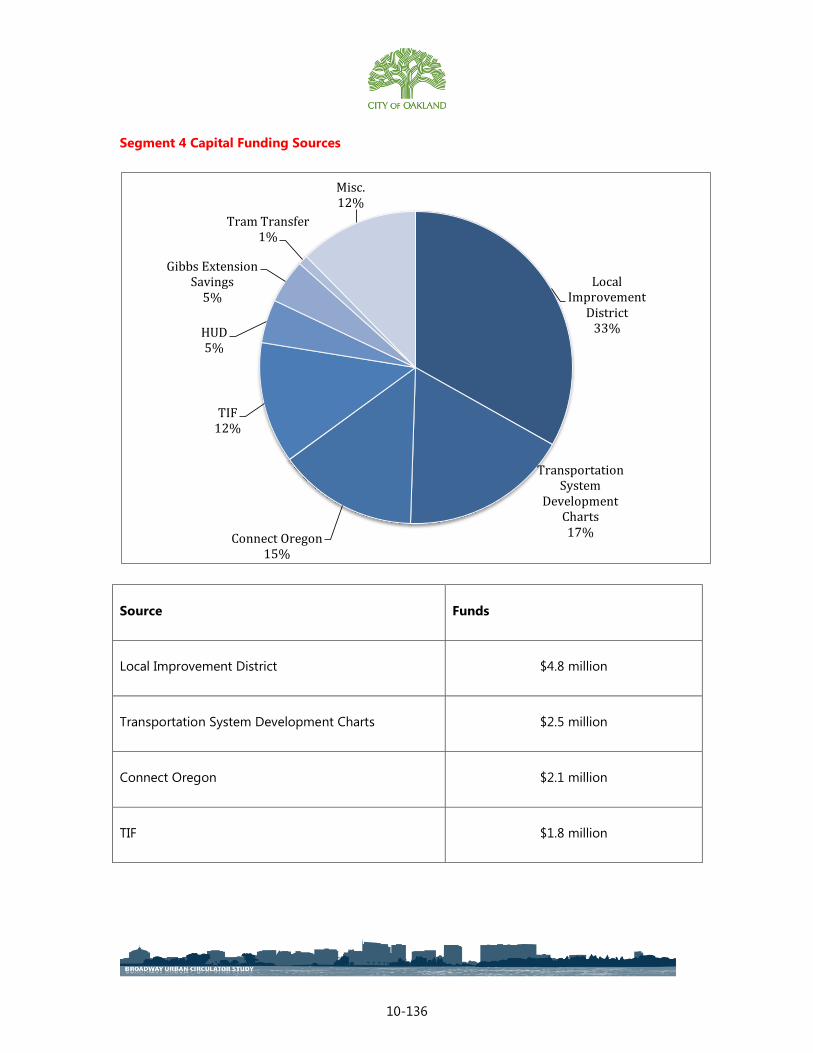
10-136
Segment 4 Capital Funding Sources
Source Funds
Local Improvement District $4.8 million
Transportation System Development Charts $2.5 million
Connect Oregon $2.1 million
TIF $1.8 million
Local Improvement
District 33%
Transportation System
Development Charts 17% Connect Oregon
15%
TIF 12%
HUD 5%
Gibbs Extension Savings
5%
Tram Transfer 1%
Misc. 12%

10-137
HUD $0.65 million
Gibbs Extension Savings $0.66 million
Tram Transfer $0.15 million
Miscellaneous $1.79 million

10-138
Segment 5 Capital Funding Sources
Source Funds
Federal Transit Administration $75 million
Portland Development Commission $27.68 million
State Fund for Vehicles $20 million
Local Improvement District $15.5 million
FTA 51%
State Fund for Vehicles
14%
Local Improvement
District 10%
Portland Development Commission
19%
Regional Funds 2%
SDC/Other City Funds
4%
Stimulus Funds <1%

10-139
SDC/Other City Funds $6.11
Regional Funds $3.62 million
Stimulus Funds $0.36 Million
Operating Funding
For Fiscal Year 2014 the total operations budget for the entire 7.45 mile alignment was $9.7
million. Operating costs are split between the City of Portland, TriMet, who is the operator, and
funding raised by Portland Streetcar, a private non-profit supporter of the streetcar service.
FY14 Operating Budget Funding Sources
TriMet 42%
City of Portland 45%
Portland Streetcar 13%

10-140
Source Funds
City of Portland, Office of Transportation $4.4 million
TriMet $4.1 million
Portland Streetcar, Inc. $1.2 million

10-141
Seattle Streetcar
The South Lake Union line, the first completed line of the Seattle Streetcar, features 11 stops
along 2.6 miles of track connecting the rapidly growing South Lake Union neighborhood with
Downtown Seattle.15
Capital Funding
The initial South Lake Union line was made possible by the creation of a Local Improvement
District which provided private funding from the local land owners for nearly half of the capital
cost of implementation.16
LID funds are collected through a special assessment on annual real
estate taxes paid on properties within the district. Establishing such a substantial assessment was
possible because a substantial portion of the land along the corridor was owned by a small
number of land owners who were enthusiastic about the project.
15 http://www.seattlestreetcar.org/slu.htm
16 http://www.seattlestreetcar.org/about/docs/faqCosts.pdf

10-142
Seattle Streetcar Capital Funding Sources
Local Improvement District $25.7 million
Federal $14.9 million
Surplus Property Proceeds $8.5 million
State $3 million
Federal 29%
State 6% Local
Improvement District
49%
Surplus Property Proceeds
16%

10-143
Operational Funding
The City has developed a sponsorship program which is expected to generate approximately
$500,000 per year to be spent towards operational costs. In addition, existing transit funds have
been shifted from bus routes that have been made redundant from the opening of Sound
Transit’s LINK, a new regional light rail line. Operation and maintenance costs are approximately
$2 million a year.17
17 http://www.seattlestreetcar.org/about/docs/faqCosts.pdf

10-144
Downtown Denver Circulator (Free MetroRide)
Free MetroRide, known as the Downtown Denver Circulator during the planning phase, is a
rubber tired transit shuttle service intended to complement the Downtown Denver 16th
Street
Mall Shuttle and local bus network between Union Station and Civic Center Station. The project
was conceived as part of the 2004 Regional Transportation District (RTD) FasTracks Plan in which
voters in the Denver metro area approved a 0.4 percent sales and use tax increase for a multi-
billion dollar expansion of rail and bus services in the region. Operational costs (approximately
$800,000 per year) are covered in the most recent FasTracks financial plan, which assumes no tax
increase.18
Emery Go Round
An assessment district known as the Property and Business Improvement District (PBID) was
created by the City of Emeryville in 2001 to fund shuttle services within the City. Assessments in
the district, which are only levied against business parcels, provide the Emeryville Transportation
Management Association with funding for a shuttle service known as the Emery Go Round
(EGR).19
Since 2011, ever increasing ridership has caused the TMA’s operating costs to exceed
revenue. On June 3, 2014 the City Council approved a $400,000 allocation from the General Fund
to assist in the operations of the Go Round. The current PBID is due to expire in 2016; however
the Board of the TMA is considering the recommendation of a 2.5% increase in the PBID Levy
Assessment to the City Council to cover an anticipated deficit.20
DC Circulator
The DC Circulator is a high-frequency shuttle bus service that operates routes throughout
Washington D.C. and into Rosslyn, VA. The service is operated as a public/private partnership
between the District Department of Transportation, Washington Metropolitan Area Transit
Authority and DC Surface Transit, Inc, a non-profit private organization.21
18 http://www.rtd-fastracks.com/media/uploads/dus/RTD_Circulator_white_paper_FINAL.pdf
19 http://www.epoa.us/wp-content/uploads/2012/05/PBID_ENGINEERS_REPORT.PDF
20 http://www.emerygoround.com/uploads/media_items/june-2015-agenda-packet.original.pdf
21 http://www.dccirculator.com/Home/About.aspx
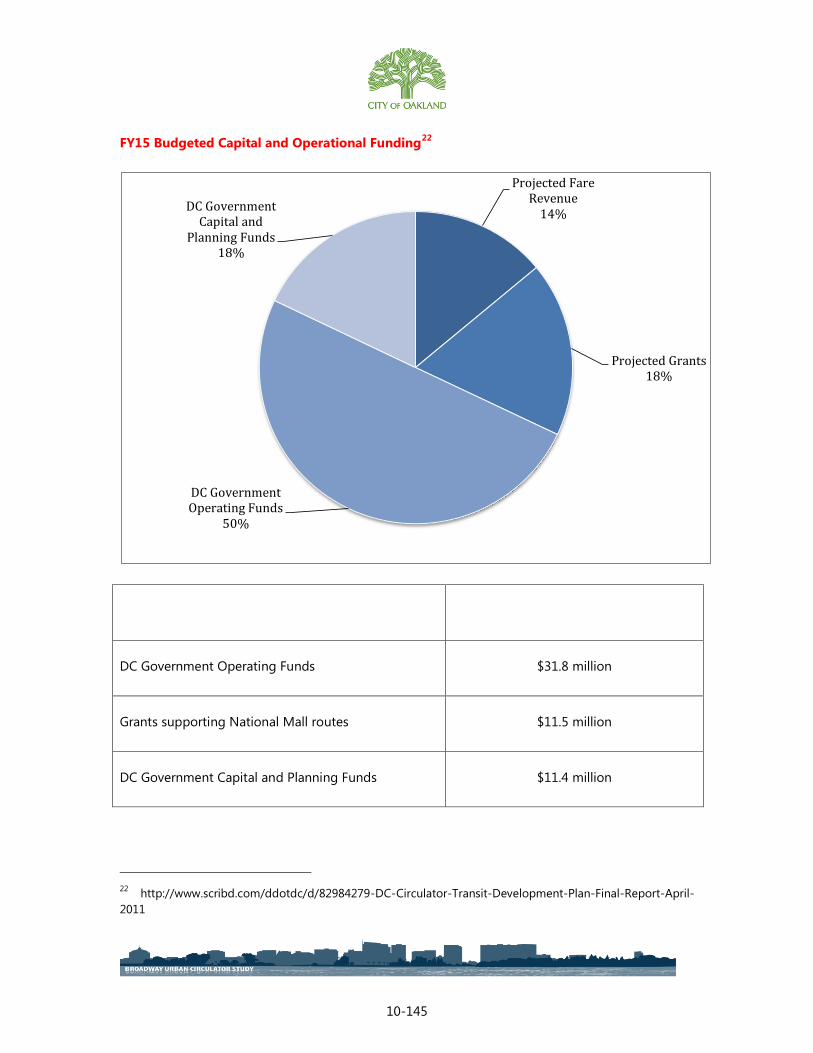
10-145
FY15 Budgeted Capital and Operational Funding22
DC Government Operating Funds $31.8 million
Grants supporting National Mall routes $11.5 million
DC Government Capital and Planning Funds $11.4 million
22 http://www.scribd.com/ddotdc/d/82984279-DC-Circulator-Transit-Development-Plan-Final-Report-April-
2011
Projected Fare Revenue
14%
Projected Grants 18%
DC Government Operating Funds
50%
DC Government Capital and
Planning Funds 18%

10-146
Fare Revenue $8.9 million

10-147
CIRCULATOR CAPITAL FUNDING OPTIONS
As the prior examples show, virtually all downtown circulator projects that require significant
capital funding receive funds through a variety of federal and nonfederal sources. The availability
of nonfederal sources is particularly important because federal funds are generally granted to
projects that reduce the share required to be funded through federal sources.
The following sections summarize available funding for a downtown circulator project in
Downtown Oakland. Funds from most sources would be available regardless of whether the
ultimate project is a rubber tired or streetcar option. Where funding may be limited to a
particular mode, or where one mode would have a distinct advantage, it is noted in the fund
source description.
Federal Capital Funding Sources
Small Starts. Chapter 49 U.S.C. 5309 authorized the Federal Transit Administration to create the
Small Starts program for fixed-guideway and bus corridor projects requesting Section 5309 Bus
and Bus-Related Facilities funding of up to $75 million, with a total project cost of less than $250
million. According to FTA’s Small Starts final policy guidance for New and Small Starts Evaluation
& Rating Process (August 2013), FTA’s decision to recommend a project for funding is driven by a
number of factors, including the “readiness” of a project for capital funding, geographic equity,
the amount of funds versus the number and size of the projects in the Section 5309 funding
pipeline, and the project’s overall Small Starts rating. Small Starts grants can cover up to 80% of
the total project costs or a maximum of $75 million. Small Starts funding is consistently a
significant source of capital funds for downtown circulator projects. Although these funds can be
used for bus and streetcar projects, thus far, the majority of projects receiving Small Starts funds
have either been streetcar projects or bus rapid transit projects rather than bus circulator projects.
The work done as part of this Downtown Circulator Study is an important first step towards
receiving federal Small Starts funding. The federal process for Small Starts has been simplified
under MAP-21 authorization legislation. There are two major approval steps under the process:
Project Development and Project Construction Grant Agreement. Once the City has adopted a
preferred alternative for the Downtown Circulator it may request approval for the project under
the Project Development phase.

10-148
Once designated in Project Development, the project sponsor has two years to complete the
National Environmental Policy Act (NEPA) process and to submit sufficient information on the
cost, financial commitments, and project rating to qualify for a Project Construction Grant
Agreement (PCGA). The PCGA represents the formal financial commitment of the federal
government to the completion of the project.
Ultimately, documentation of the project value and local decision making process will be required
to gain funding and qualify for a PCGA. Information that will be needed to support this process
includes:
Alternatives Analysis Report (Center City Connector Transit Study)
Economic Development Analysis
Land Use Documentation
Cost Effectiveness Estimate
Mobility Benefits Estimate
Environmental Benefits Estimate
Congestion Relief Estimate
Ridership Estimate
Financial Plan
In addition to the criteria, FTA evaluates projects on the local capacity to build the project and its
financial commitment. The Project Management Plan plays a key role in demonstrating the
approach to the project and assurance that there is a local organization capable of delivering the
project. The financial commitment to the project includes capital and operations. Formal financial
commitments are not necessary to advance into Project Development. During Project
Development, the project sponsor will have to produce formal commitments to deliver local
capital funding and to fund system operation for the next 20 years.
10-149
During Project Development the project sponsor must complete the NEPA environmental review
process, formally commit capital funds, provide sufficient information to enable the project to be
rated, achieve a minimum of “medium” overall rating, and prepare a formal cost estimate that
meets the project budget and provides sufficient contingency to assure completion of the project.
The project sponsor in Project Development can conduct engineering through to final
engineering without further approval from FTA. The sponsor can also conduct utility relocation
work, certain right-of-way acquisition and commence procurement. No capital construction
activity can begin until the PCGA is approved unless FTA issues a Letter of No Prejudice (LONP)
for specific acquisition like specialized track.
With these items successfully completed, the project sponsor can be eligible for a Project
Construction Grant Agreement. The PCGA is then used to acquire vehicles and to construct the
project.
Federal funding programs are all competitive and generally require regional concurrence.
Projects receiving federal funds are first listed in the region’s Transportation Improvement
Program (TIP) developed by MTC in coordination with Alameda CTC and the other County CMAs.
Estimated Potential Funding: Up to $75 M
TIGER Grants. Transportation Investment Generating Economic Recovery (TIGER) is a
discretionary US DOT grant program that allows it to invest in road, rail, transit and port projects.
For fiscal year 2014, $600M was enacted to become available for investment. The notice of
funding availability was issued in early March 2014, and projects will be awarded on a competitive
basis as in previous TIGER grant rounds. A key criterion is project readiness (shovel ready). A
number of modern streetcar projects have been awarded significant TIGER grants to fund capital
investments, including Tucson, Portland, Atlanta, Salt Lake City and Dallas. No rubber tired
circulator projects have received TIGER funding, but these projects are eligible for TIGER funds.
Estimated Potential Funding: $5 to $15 M
TIFIA Loan Program. The Transportation Infrastructure Finance and Innovation Act (TIFIA)
program provides federal credit assistance to national and regionally-significant surface
transportation projects, including bus and rail transit. The program is designed to fill market gaps
and leverage substantial private match (or co-development) by providing supplemental debt

10-150
financing. The amount of a TIFIA loan cannot exceed 33% of the total capital cost of a project. The
loans are backed by Federal revenues. As a transit capital project, the downtown circulator would
be eligible. It should be noted that the portion of capital funding from a TIFIA loan would not
count toward the maximum Federal share under the Federal Small Starts program. It could
instead count as part of the “local” match.
Estimated Potential Funding: LOAN funding of up to $25M
FTA Urbanized Area Formula Grant Program. MTC administers the FTA Urbanized Area
Formula Grant program, combined with several other federal transit capital programs. For FY
2014-15 and 2015-16 MTC will allocate $793 million in regional apportionments of Federal
Transit Administration (FTA) Section 5307 Urbanized Area, 5337 State of Good Repair, and 5339
Bus & Bus Facilities funds (together referred to as Transit Capital Priorities or TCP) and matching
funds. Funds are awarded to transit agencies. It is unlikely that the City of Oakland would be
eligible as a direct beneficiary for these funds, which are available a broad range of transit
maintenance and improvement projects.
Estimated Potential Funding: Unlikely to receive funding unless there is a transit agency sponsor.
Potential Local (Non-Federal) Public Capital Funding Sources
Local funds include state, regional, City and private funding. The following is a documentation of
potential sources that have been identified including some descriptions of the source, its
likelihood for use on this project, and approximate estimate of range of funding that it could
produce.
One Bay Area Grant. The One Bay Area Grant program, administered by MTC combines both
regional and federal funding sources available to MTC into a comprehensive grant program that
addresses federal transit guidelines, the State’s climate laws and the sustainable community
strategy. Project identification and selection is coordinated through the CMAs in each county,
which is the Alameda County Transportation Commission (AlaCTC) for projects in Oakland.
In the first two cycles of OBAG funding (2013-14 and 2014-15), approximately $63M was
programmed by Alameda CTC for Alameda County. The program is designed to reward
communities, like Oakland who have accepted and are making progress on priority development
areas and accepting regional housing distributions.

10-151
OBAG funds can be applied to all phases of the project development cycle. Grants are
competitive and tend to be relatively small, but are a minimum of $100,000. No OBAG grant in
Alameda County has exceeded $10,000,000. OBAG funds may be used to match other funds, but
are restricted in cases where federal funds cannot be used to match other federal sources. An
11.4% match in nonfederal funds is required for most OBAG grants that include federal funding.
Projects funded with OBAG grants in the current funding cycle include:
Oakland Complete Streets Oakland ($3,851,000)
7th Street West Oakland Transit Village Phase 2 Oakland ($3,288,000)
Lakeside Complete Streets and Road Diet Oakland ($7,000,000)
Oakland - Peralta and MLK Jr. Way Streetscape- Phase I Oakland ($5,452,000)
An OBAG grant could continue the planning, design and environmental phases of a downtown
circulator project in Oakland. In construction, OBAG grant funds could provide the complete
streets corridor improvements that would likely be needed to support the circulator project.
Estimated Potential Funding: $1 to $5M primarily for project development work.
Cap and Trade Funds and Core Capacity Transit Grants. Two new funding programs to bolster
the Bay Area’s transit network and address climate concerns were adopted by MTC at the end of
2013. Totaling nearly $10 billion, the programs are a direct response to the recently adopted Plan
Bay Area, which seeks to reduce the region’s transportation-related emissions by 18 percent
before 2040. MTC is in the process of developing guidelines for a project selection process for
these funds which are likely to include significant investments in low emission transit maintenance
and expansion.
The first program creates a Cap and Trade Funding Framework to guide investment priorities for
some $3.2 billion in state Cap and Trade revenues that the Bay Area anticipates receiving over the
next few decades. Plan Bay Area provides that at least 25 percent of these funds must be invested
in low-income communities, which would include portions of the proposed project
alignment. State legislation (AB 574) supporting the formation of the cap and trade network
identified the following framework for expenditures statewide:

10-152
Transportation network and demand management, including, but not limited to, trip-
reduction programs, congestion pricing, and roadway modifications, such as
roundabouts.
Public transportation, including operations, maintenance, and capital costs.
Road and bridge maintenance; operations and retrofits for complete streets, bike, and
pedestrian safety enhancements; safe routes to schools; and urban greening.
Clean transportation fueling infrastructure and support
Multimodal network connectivity to reduce travel distances and improve access to parks,
schools, jobs, housing, and markets for rural and urban communities, including
neighborhood scale planning.
Development and adoption of local plans and land use policies that help to implement
regional plans.
Community infrastructure, including public works and municipal improvements necessary
to support transit-oriented development, affordable housing, infill in existing urbanized
areas, and small walkable communities in rural neighborhoods.
Multi-use facilities and accommodations for bicyclists, pedestrians, and neighborhood
electric vehicles.
Interregional rail modernization and related community infrastructure.
Administrative costs and development and use of evaluation, monitoring, and verification
systems
In all, the Cap and Trade Funding Framework adopted by MTC includes:
1. $1.05 billion for One Bay Area Grants, which support transit-oriented development and
other local transportation improvements
2. $500 million for a Transit Operating and Efficiency Program (with existing large transit
operators including AC Transit and BART being eligible recipients)

10-153
3. $450 million to improve goods movement and mitigate associated environmental
impacts
4. $275 million for MTC’s Climate Initiatives Program, with $75 million going directly to Safe
Routes to School
5. $875 million for the Core Capacity Challenge Grant program
The Core Capacity Challenge Grant program commits $7.5 billion — including $875 million from
the above-referenced Cap and Trade funds, $402 million in bridge toll revenues, and over $3
billion in federal transportation funds — over 15 years for capital improvements to the region’s
largest transit systems: San Francisco Muni, BART and AC Transit. While the City of Oakland would
not be eligible for these funds, one of the large operators could request funds for this project,
especially if the circulator was seen as relieving a capacity constraint on one of the eligible
systems. To receive the money, operators would need to meet certain performance and efficiency
objectives, and match 30 percent of the grant money with their own funds.
Because these are new funding sources, it is unclear how much might be available for new
projects or what the selection criteria for such projects might be. A key element for access to
these funds would be partnership with one of the major transit operators who will have access to
more categories of funding than a municipality such as Oakland.
Estimated Potential Funding: Unknown as regulations are not yet written and Oakland may not be
an eligible recipient.
Bridge Toll Funding. On March 2, 2004, voters passed Regional Measure 2 (RM2), raising the toll
on the seven State-owned toll bridges in the San Francisco Bay Area by $1.00. This extra dollar
was raised to fund various transportation projects within the region that have been determined to
reduce congestion or to make improvements to travel in the toll bridge corridors, as identified in
SB 916 (Chapter 715, Statutes of 2004). Specifically, RM2 establishes the Regional Traffic Relief
Plan and identifies specific transit operating assistance and capital projects and programs eligible
to receive RM2 funding.
The Bay Area Toll Authority (BATA) is responsible for the collection of the bridge tolls and MTC is
responsible for administering the Regional Measure 2 program. Recently, BATA’s Long Range
Plan (PDF) was updated to incorporate the Regional Measure 2 projects.

10-154
While RM2 projects have been identified and the funding source is currently fully subscribed,
future toll increases and longer term funding could be available for alternative transportation
projects. In Alameda County, RM2 funds have been used for enhanced bus and rail projects
throughout the County.
Estimated Potential Funding: Funding Unlikely incurrent RM2, but could be significant if there is an
update.
Alameda County Measure BB. The renewal and expansion of the transportation sales tax in
Alameda County, Measure BB, will be on the ballot in November 2014. Assuming the measure
passes as predicted, a total of $10 M has been allocated for a transit improvement in the
Broadway corridor in Oakland. Funds could be used for on-going project development, design or
for capital construction of any phase of the project. An additional $10M is allocated to a
College/Broadway corridor transit priority project in the Rapid Bus category. The project could
also potentially compete for funding under the Community Development Investment category for
connecting people to jobs and schools.
Estimated Potential Funding $10 M allocated plus opportunity for some additional competitive
funds, up to approximately $5 M.
Potential Local Private Capital Funding Sources
Community Benefit District/Business Improvement District (CBD). There are a total of five
different Community Benefit Districts already existing within the study area: The Downtown
Oakland Community Benefit District is comprised of a 19-block area extending from 18th Street
between Clay and Franklin to 8th Street between Franklin and Washington. Broadway runs
through the center of the district. In addition, CBDs exist in Jack London Square, Lake
Merritt/Uptown and Koreatown Northgate (KONO). The associations meet and function jointly.
CBD formation requires the support of property owners who, in essence, agree to a special
assessment on their property tax in exchange for special benefits that would not otherwise be
provided by the City. A CBD currently lasts up to 10 years and ultimately requires a simple
majority to implement. Funding for a circulator project, either capital or operating could come
from an expansion, extension or reallocation of these funds, subject to a vote of the membership.

10-155
Funds from a CBD could be used for both capital and operating funds, and can be bonded to
accelerate project delivery. Expenditures are guided by a “Management Plan” which spells out
how collected funds can be used. The current CBDs generate between $500,000 and $1.5 M per
year or about $5 M in combination.
Estimated Potential Funding: TBD depending on local support but estimated at $1 to $5 M annually.
Community Facilities District. A Mello Roos Community Facilities District (CFD) is a tool
available for assessing a property tax levy on properties that benefit from a local facility. An
example of a CFD in Oakland is the district funding the Rockridge Library through a $25 per
parcel special tax. Funds raised through a community facilities district may be used for capital, for
loan repayment or for operating funds to support a local project. It is unlikely that both a CFD
and Community Benefit District would be implemented in the same area, since they are both tools
for generating a property tax levy in a confined area.
Estimated Potential Funding: TBD depending on local support but estimated at $500,000 to $5 M
annually. Would not be used if a CBD is implemented.
Developer Fees and Agreements. The City of Oakland is currently completing a nexus study as
a precursor to establishing a formal development fee. While there is no formal fee in place today,
the City of Oakland has a history of negotiating for improvements that increase non auto mode
share and improve access to development sites. For example, the Brooklyn Basin developer is
required to provide a connection between that site and BART. The variant alternatives for B-line
expansion to Brooklyn Basin could be funded in part by the developer as they meet this
obligation. Similar requirements could be built into other development agreements. Over time,
the City will develop a development impact fee which could provide flexible funding for transit
and multimodal projects either within a defined area, or city-wide.
Estimated Potential Funding: TBD depending on development levels.
Parcel Tax. Parcel taxes are common tools used by California cities to raise money for specific
projects in an era when general property tax rates cannot be raised because of Proposition 13.
Parcel taxes can be bonded to accelerate projects and could be used for both capital and
operating funding. The distinction between a parcel tax and a property levy within a district is
that it is City wide and requires a 2/3 vote of the residents of Oakland. Oakland has levied a

10-156
number of parcel taxes for a variety of purposes. The majority of successful parcel taxes in
California are for schools, libraries and other projects of citywide importance.
Estimated Potential Funding: TBD depending on voter interest. Because it covers the entire city,
could raise a significant amount of money.
Real Estate Transfer Fee. The Real Estate Transfer fee is paid by property buyers at the time of
transaction. Oakland currently imposes a local fee of $15.00 per thousand per transaction, with
some limited exceptions. This is the highest real estate transfer fee imposed by any city in
Alameda County and one of the highest in the State. The fee could be increased only with a 2/3
super majority of Oakland voters. Given increasing real estate costs, the amount generated by
the fee is increasing and is likely to continue to increase. Funds from the existing fee could be
allocated to the circulator, either for capital or for operating costs; and/or the fee could be
increased by the voters.
Estimated Potential Funding: TBD
Commercial Parking Tax (CPT). A commercial parking tax could be levied on all off-street
parking spaces within the study area and/or Citywide. Parking tax would be collected by the
parking operator and paid to the City. San Francisco and Seattle both have commercial parking
taxes of 25% and 12.5% respectively. Oakland does not have a commercial parking tax currently.
In those examples, portions of the revenue stream are allocated for major capital projects, with an
emphasis on multimodal projects that reduce the demand for parking expansion. There is no
statutory limit to the tax and it can be used for a wide variety of transportation uses. This revenue
stream can be bonded to pay for capital projects.
Commercial parking tax funds are subject to competing priorities including general fund uses,
construction and maintenance of parking facilities and other needs. However, depending on the
rate they have the potential to provide needed capital and operating funds.
Estimated Potential Funding: $1 - $5 Million
Parking Benefit District. The City of Oakland is currently investigating the option of establishing
a parking benefit district which would spend a portion of meter revenue collected in the district
on local priorities, which could include the circulator. Parking revenues can be bonded to
10-157
accelerate a capital project. Specifics of the district boundaries and the amount of funding
available for what range of projects has not yet been determined.
Estimated Project Funding: TBD
General Obligation Voter-Approved Bonds. The City of Oakland could issue such bonds upon
voter approval to levy an assessment on real property, payable by property owners. These
“Unlimited Tax GO bonds” (UTGO) must be approved by a majority of voters, and can be used for
capital projects. Bonds are generally raised against a specific asset or revenue source. Because
Oakland has bonded for many different projects in the past, there is some question about the
amount of bonding authority that may be available to the City. Voters are generally more
supportive of bonding than taxing, because taxes do not increase to pay for a GO Bond.
Estimated Range of Project Funding: TBD
City of Oakland General Fund. The City’s General Fund is composed of a number of funding
sources including property tax revenues, sales tax revenues, fees and fines. The City’s budget
annually includes an allocation of General Fund revenue for transportation purposes, often
matching other sources. The City of Oakland may elect to fund a portion of this project’s capital
or operating needs from its General Fund. Because any allocation from the General Fund would
compete directly with other Citywide needs, this should be considered “last in” funding.
Estimated Range of Project Funding: TBD
CIRCULATOR OPERATING AND MAINTENANCE FUNDING
While cobbling together sources for transit capital investments is often a complicated an
multidimensional problem, identifying consistent funding for operations and maintenance is even
more challenging. Most transit investments are sponsored by transit agencies who reallocate
current operating funds to operate the new service, often paid for in part by increasing operating
speeds or by reducing parallel and overlapping service.
In the case of the proposed circulator, it is not clear that such savings will be available to pay for
service. One possibility would be to form a Joint Powers arrangement, either formally or
informally with AC Transit, who will be able to support the circulator in the broader context of
their other routes. Savings on existing routes, if any, could be allocated to service on the

10-158
circulator. In addition, transit operators have access to some funds that the City would not be
able to pursue on its own.
The following sources have been identified as potential contributors to the operating and
maintenance costs of the circulator. Once an operating plan and operator is finalized the
operating funding plan can be more fully established. A funding plan will be required prior to
receiving a full funding construction agreement from FTA under Small Starts.
Farebox Revenue. Fares are generally an important part of funding operating costs of a transit
system. The current B-Line is unique in that it offers a free fare option for short trips between
Jack London Square and downtown Oakland. With the expansion of the downtown circulator and
eventual implementation of a streetcar line, it may be necessary to charge passengers a fare for
service. A fare of $2.00 per trip was included in the ridership estimate. Given fare discounts, an
average fare of $1.25 per trip would generate approximately 1.6-2.1 million per year (assuming a
ridership range of 4,400-5,900 per weekday based on the alignment and service plan described in
Section 6.2 and an annualization factor of 290).
Circulator Stop and Vehicle Sponsorship. Various options are available for sponsorship of
circulator stops and vehicles, once stops are upgraded. Stop sponsorships, which provide
branding of the glass panels at shelters, have been sold in many cities implementing a circulator.
Some systems such as Tampa’s TECO Trolley also sold naming rights for the system. This
practice builds on the more standard practice of selling advertising at stations and on vehicles
and allows stations to remain uncluttered by ads while still generating revenue. The amount
generated by sponsorships and naming rights varies but generally provides less than 15% of the
operating cost of a system.
Other Private Funding. Additional efforts to raise revenue through streetcar promotions,
sponsorships, annual pass sales, business promotions, and potentially private contributions may
be possible. Portland Streetcar, for example, has been successful in raising private funds on the
order of $300,000 annually through a non-profit corporation. Amazon.com, Inc., recently provided
$5.5 million in funding including a fourth streetcar vehicle for the South Lake Union line and a 10-
year commitment to provide operating funding for a 12-hour service span and increased
frequency. Adding service to Kaiser and other “pill hill” locations may allow those institutions to
eliminate or reduce their own shuttles, supporting the circulator as an alternative.

10-159
Flexible Funding from Local Sources. A number of sources described under the capital plan
might be able to provide on-going operating funds. Funding could be drawn from a Community
Benefit District or Community Facilities District, as well as contributions from a parcel tax, parking
tax or parking benefit district. The size of contributions from these sources varies, but several
sources combined could provide a significant share of funding towards the operation of the
circulator.
Federal Regional Flexible Fund Allocations. Each region is granted flexible funds in a four-year
cycle, traditionally for highway road capital projects or operations. It is possible to request a
portion of these funds to go toward a first two-years operating commitment of rail transportation
projects. A number of other modern streetcar projects have received federal flex funds for
operations, including the Washington DC streetcar.

11-160
11.0 APPENDIX D
Capital Cost Data
TABLE D-1: ORDER OF MAGNITUDE ESTIMATE: STREETCAR ALTERNATIVES

11-161
TABLE D-2: ORDER OF MAGNITUDE ESTIMATE: ENHANCED BUS ALTERNATIVES
MacArthur BART Rockridge BART
New Traffic Signals $324,000 $324,000
Traffic Signal Upgrades (TSP) $1,620,000 $810,000
Signing and Striping Allowance $243,000 $243,000
Enhanced Bus Stop $6,480,000 $6,966,000
Enhanced Station Amenities Allowance $3,240,000 $3,483,000
Vehicles $7,980,000 $9,120,000
SUBTOTAL $19,887,000 $20,946,000
Unallocated Contingency (10%) $1,988,700 $2,094,600
TOTAL $21,875,700 $23,040,600
PER MILE $5,912,351 $6,227,189
Note: An allocated contingency of 22% is incorporated into the subtotal costs for all six cost
categories.

12-162
12.0 APPENDIX E
Annual Operating & Maintenance Cost Data
TABLE E-1
OPERATING & MAINTENANCE COSTS PER SERVICE HOUR
Agency-Jurisdiction/Mode 2010 2011 2012
AC Transit Bus $161.47 $169.01 $182.30
Seattle Bus $144.39 $148.75 $155.38
Seattle Streetcar -- $208.26 $238.09
Portland Bus $134.39 $136.19 $141.93
Portland Streetcar -- $218.36 $227.09