Embed Size (px)
Citation preview
PIT Project
Behaviour of steel framed structures under fire conditions
British Steel Fire Test1:
Reference ABAQUS model using grillage representation forslab
Research Report
Report R99-MD1
Abdel Moniem Sanad
The University of Edinburgh
School of Civil & Environmental Engineering
Edinburgh, UK
December, 1999
11
TABLE OF CONTENTS
11.. GGEEOOMMEETTRRIICC DDEESSCCRRIIPPTTIIOONN 33
11..11.. LLaayyoouutt 33
11..22.. FFiinniittee eelleemmeenntt mmeesshh 33
22.. MMAATTEERRIIAALL BBEEHHAAVVIIOOUURR 55
22..11.. SSeeccttiioonn bbeehhaavviioouurr ffoorr sstteeeell mmeemmbbeerrss 66
22..22.. SSllaabb mmooddeelllliinngg 77
33.. CCOONNNNEECCTTIIOONNSS BBEETTWWEEEENN MMEEMMBBEERRSS 1100
44.. BBOOUUNNDDAARRYY CCOONNDDIITTIIOONNSS 1100
55.. LLOOAADDIINNGG 1111
55..11.. DDiissttrriibbuutteedd llooaadd 1111
55..22.. TThheerrmmaall llooaadd 1111
66.. CCOOMMPPAARRIISSOONN WWIITTHH TTEESSTT DDAATTAA 1133
66..11.. DDeefflleeccttiioonn aatt mmiidd--ssppaann 1133
66..22.. DDeefflleeccttiioonn aatt oonnee tthhiirrdd ooff ssppaann 1133
66..33.. DDeefflleeccttiioonn aatt tthhee lliimmiitt ooff tthhee hheeaatteedd zzoonnee 1144
66..44.. DDeefflleeccttiioonn nneeaarr tthhee ccoolluummnn 1144
77.. CCOONNCCLLUUSSIIOONN 1166
88.. RREEFFEERREENNCCEESS 1166
9. LIST OF ABAQUS INPUT FILES 17
22
LIST OF FIGURES :
Figure 1 : Model of Test1
Figure 2 : Cross section of the steel elements
Figure 3 : Cross section of the concrete slab
Figure 4 : Steel stress-strain relationship at high temperature
Figure 5 : Concrete stress-strain relationship at high temperature
Figure 6 : Axial Force- Axial Strain relationship at high temperature in the longitudinal direction
Figure 7 : Moment-Curvature relationship at high temperature in the longitudinal direction
Figure 8 : Axial Force- Axial Strain relationship at high temperature in the lateral direction
Figure 9 : Moment-Curvature relationship at high temperature in the lateral direction
Figure 10 : Boundary conditions in the numerical model
Figure 11 : Temperatures in the joist and the slab during the fire
Figure 12 : Deflection of the tested beam at mid-span
Figure 13 : Deflection of the tested beam at 2.7m from column
Figure 14 : Deflection of the tested beam at 0.9m from column
Figure 15 : Deflection of the tested beam at 0.35 m from column
NOTES:
1. In the description of the numerical model below we use the following terms :
2. “ the plane” to define the plane of the floor.
3. “ joist” means a steel beam, and the “test joist” means the heated joist during the fire test.
4. “vertical” means vertical to the slab plane.
5. “ in-plane” means in the plane of the slab.
6. “ joist longitudinal direction” or “ longitudinal direction” to mean parallel to the joist lengthcoordinate.
7. “ transverse direction” to mean at right angle to the joist longitudinal direction (i.e. in thedirection of the longitudinal axis of the ribs).
8. “Reference vertical coordinate” is the interface between the slab and joist.

33
Description of finite element model for
Cardington first fire test
1. GEOMETRIC DESCRIPTION
1.1. Layout
The test was performed on the seventh floor of the building. The fire compartment was arranged tostudy the behaviour of a secondary beam.spanning between two columns. The dimension of thecompartment was 8mx3m. The tested beam was of 9m span connected semi-rigidly to columns ateither end. A standard composite profiled deck slab was used to span the 3m between equallyspaced secondary beams connected to colums or primary beams (also spanning 9m).
Longitudinal slab elements
Lateral slab elements
Sec. beam 3
Sec. beam 2
Sec. beam 1
Secondary beam 4
Column
Primary beam
Heated zone
Model of f ire test1
Figure 1
1.2. Finite element mesh
Figure 1 shows the finite element model of the test. The area affected by the fire is indicated bydashed lines. In the direction of the heated beam (longitudinal), the model extends from the centreof the heated compartment to the column and continues to the centre of the adjacent compartment.

44
In the transverse direction, the model extends 4.5m on either side of the heated beam (to centrelineof the next slab span). In the model, each structural steel member is idealized by an appropriatebeam element. Figure 2 shows the typical cross-section of the steel members and table I, gives thedimensions of the column, primary and secondary beams respectively. The centroid of the secondaryjoists is located 152.5mm below the reference vertical coordinate of the joist’s top flange. Thecolumn is modelled using a similar beam elements.
hj
tw
wj
tf
x
y
Typical cross section of the steel beams
Figure 2
hj (mm) wj (mm) tf (mm) tw (mm)
Column 260.2 255.9 17.3 10.6
Primary beams 602 301 14.8 10.6
Secondary beams 303.8 151.9 10.2 6.1
Table 1
Dimensions of the steel members
The slab behaviour is modelled by a grill age type idealization using beam elements to represent theslab behaviour in both the longitudinal and transverse directions. In the longitudinal direction, theslab element has a rectangular section with 70mm depth and an effective width equal to 2250mm,calculated according to the Eurocode 4 (ENV1994) for a simply supported beam case. In thetransverse direction, slab elements have a trapezoidal shape and the geometry of the concretesection in this direction is shown in figure 3. The thickness of the steel deck used is 9mm.Reinforcement of one layer of A142 mesh was provided. Table 2 gives the dimensions of thesections in both directions.

55
hcb
wc
hc
x
y
hc
wcb
α
dsasds
Cross section of the composite slab
Figure 3
wcmm
wcbmm
hct mm hcbmm
αα(°°)
as mm2 ds mm
Slab in transversedirection
300 136 70 60 65 42.6 55
Slab in longitudinaldirection
2250
- 70 - - 319.5 55
Table 2
Dimensions of slab sections
2. MATERIAL BEHAVIOUR
For steel structures under high temperature the relationship between stress and strain changesconsiderably. At increased temperature, the material properties degrade and it’s capacity to deformincreases which is measured by the reduction of the Young’s modulus. In the finite element model,the relation between the stress and the strain under high temperature is defined according to theEurocode 3 (ENV1993). The relation is elastic-perfect plastic at ambient temperature, and thereduction of the material properties starts at a temperature higher than 100C as shown in figure 4.Identical material behaviour is assumed for both tension and compression.
Similarly, the behaviour of concrete is characterised by material property degradation with increasedtemperature. The stress-strain relationship is then defined according to the Eurocode 2 (ENV1992)as shown in figure 5. Here, the initial elastic behaviour is followed by a plastic hardening curve upto the ultimate stress, after which, a decaying zone represents the post-crushing behaviour forconcrete. This relationship has the advantage of allowing the definition of a stress level for largeplastic deformations, usually reached during fire conditions. It may be noted that no tension isconsidered in the model for the concrete at both ambient and elevated temperature, however thetensile resistance of the reinforcement and the steel deck is considered.

66
Properties of steel at high temperature
0
50
100
150
200
250
300
350
400
450
0.000 0.005 0.010 0.015 0.020 0.025 0.030Strain (%)
Str
ess
(MP
a)
20 ºC100 ºC200 ºC300 ºC400 ºC500 ºC600 ºC700 ºC800 ºC900 ºC1000 ºC
� � � � � � � � � � � � � � �
Figure 4
Steel stress-strain relationship at high temperature
Properties of concrete at high temperature
0
5
10
15
20
25
30
35
40
45
50
0.000 0.005 0.010 0.015 0.020 0.025 0.030
Strain (%)
Str
ess
(MP
a)
20 ºC100 ºC200 ºC300 ºC400 ºC500 ºC600 ºC700 ºC800 ºC900 ºC1000 ºC
� � � � � � � � � � � �
Figure 5
Concrete stress-strain relationship at high temperature
2.1. Section behaviour for steel members
For all steel members, the classic linear beam element applying the hypotheses of plane surfaceremains plane is used. Each point on the cross section, along each member, follows the stress-strainrelationship (figure 4) as a function of the point’s temperature. This takes into consideration the

77
variable temperature profile applied across the section and the corresponding material propertiesduring different stages of the fire. The connections between different steel members (beam tocolumn connection and beam to beam connection) are modelled by rigid connections whereboundary conditions are imposed on the relative displacement of the joining elements.
2.2. Slab modelling
In a reinforced concrete slab, more complex behaviour has to be modelled. The different behaviourof concrete in tension and compression, the orthotropic behaviour of concrete due to the reinforcingmesh and the decking steel and the development of membrane action need to be considered in orderto provide a realistic representation of the slab behaviour. In the numerical model developed in thispaper, the concrete modelli ng is based on the global behaviour of the concrete section, with theabove factors taking into consideration. The slab is modelled by two sets of beam elements runningparallel and perpendicular to the secondary beams. In each direction, the beam elements, have a pre-defined force-strain and moment-curvature relationship. These relationships are calculated based onthe geometry and the material properties of the section in each direction and taking into account thevariable temperature over the same section and the corresponding material properties (O’Connorand al. 1995).
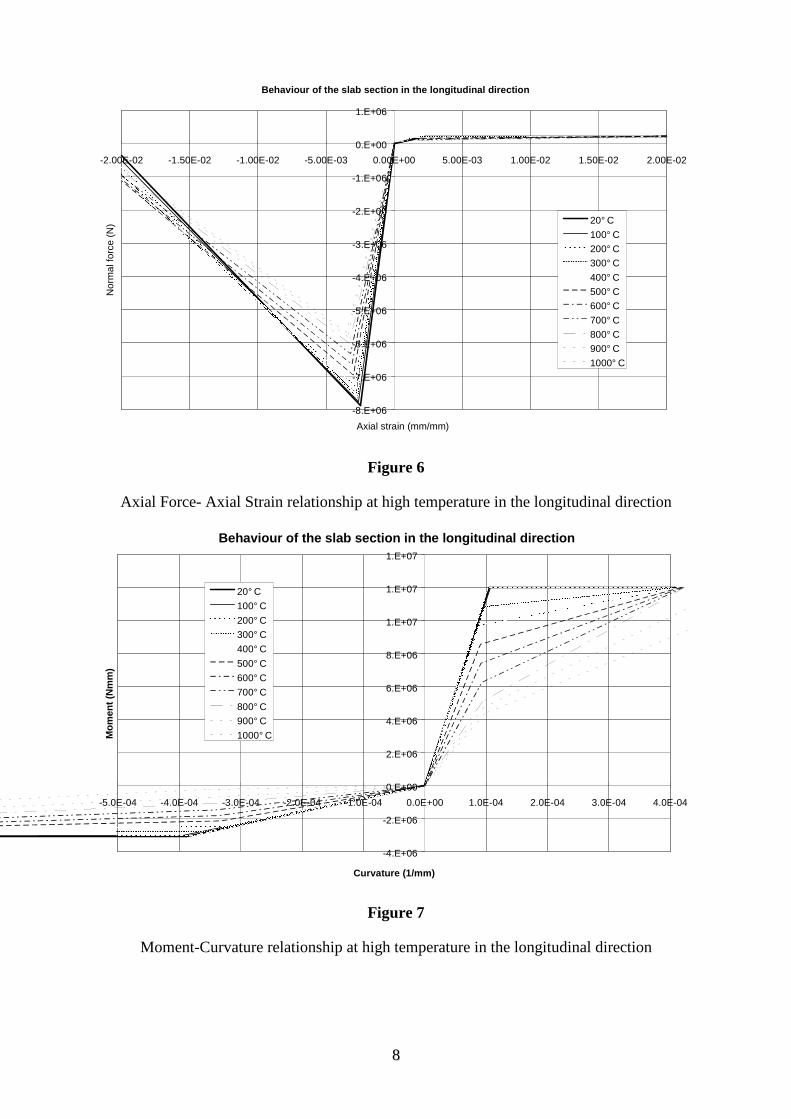
The behaviour of the slab in the longitudinal direction (direction of the joist longitudinal axis) ismodelled by beam elements, using bili near moment/curvature and force/strain relationships whichare uncoupled (figure6,7). The yield points for the force relationship in each sense are given by thesection's plastic resistance for normal force (with different values for tension and compression).The yield points for the bending relationship are given by the section's plastic resistance for bending(with different values for sagging and hogging). The post-yield behaviour is modelled by a linearrelationship (moment/curvature and force/strain), decreasing from the yield point to the ultimatesection resistance based on the steel reaching the limiti ng strain for yield strength.
The behaviour of the slab in the direction normal to the joist (transverse) is modelled by beamelements. The transverse bending and transverse membrane action of the slab is modelled by beamelements with their longitudinal axis in the transverse direction, using bili near moment/curvatureand force/strain relationships which are uncoupled (figure8,9). The yield points for the forcerelationship in each sense are given by the section's plastic resistance for normal force (withdifferent values for tension and compression). The yield points for the bending relationship aregiven by the section's plastic resistance for bending (with different values for sagging and hogging).These beam ribs have a very high bending stiffness about a vertical axis (i.e. relating to bendingdeformations in the horizontal plane) to ensure that the membrane shear stiffness of the slab isrepresented (that is: this bending stiffness is 100 times the value for bending of an individual rib).The beam used in modelli ng the slab are 3D beam element which has torsional and weak axisbending properties, with linear elastic behaviour for both the torsional and the bending about theweak axis.
88
Behaviour of the slab section in the longitudinal direction
-8.E+06
-7.E+06
-6.E+06
-5.E+06
-4.E+06
-3.E+06
-2.E+06
-1.E+06
0.E+00
1.E+06
-2.00E-02 -1.50E-02 -1.00E-02 -5.00E-03 0.00E+00 5.00E-03 1.00E-02 1.50E-02 2.00E-02
Axial strain (mm/mm)
Nor
mal
forc
e (N
) 20° C
100° C
200° C
300° C
400° C
500° C
600° C
700° C
800° C
900° C
1000° C
Figure 6
Axial Force- Axial Strain relationship at high temperature in the longitudinal direction
Behaviour of the slab section in the long itudinal direction
-4.E+06
-2.E+06
0.E+00
2.E+06
4.E+06
6.E+06
8.E+06
1.E+07
1.E+07
1.E+07
-5.0E-04 -4.0E-04 -3.0E-04 -2.0E-04 -1.0E-04 0.0E+00 1.0E-04 2.0E-04 3.0E-04 4.0E-04
Curvature (1/mm)
Mom
ent (
Nm
m)
20° C
100° C
200° C
300° C
400° C
500° C
600° C
700° C
800° C
900° C
1000° C
Figure 7
Moment-Curvature relationship at high temperature in the longitudinal direction

99
Behaviour of the slab section in the lateral direction
-2.E+06
-2.E+06
-1.E+06
-1.E+06
-1.E+06
-8.E+05
-6.E+05
-4.E+05
-2.E+05
0.E+00
2.E+05
-2.00E-02 -1.50E-02 -1.00E-02 -5.00E-03 0.00E+00 5.00E-03 1.00E-02 1.50E-02 2.00E-02
Axial strain (mm/mm)
Nor
mal
forc
e (N
) 20° C
100° C
200° C
300° C
400° C
500° C
600° C
700° C
800° C
900° C
1000° C
Figure 8
Axial Force- Axial Strain relationship at high temperature in the lateral direction
Behaviour of the slab section in the lateral direction
-4.E+06
-2.E+06
0.E+00
2.E+06
4.E+06
6.E+06
8.E+06
1.E+07
1.E+07
-2.00E-04 -1.50E-04 -1.00E-04 -5.00E-05 0.00E+00 5.00E-05 1.00E-04 1.50E-04 2.00E-04
Curvature (1/mm)
Mom
ent (
Nm
m)
20° C
100° C
200° C
300° C
400° C
500° C
600° C
700° C
800° C
900° C
1000° C
Figure 9
Moment-Curvature relationship at high temperature in the lateral direction

1100
3. CONNECTIONS BETWEEN MEMBERS
The beam models for the longitudinal and transverse action of the slab (ribs) are connected to thejoist only at the crossing points using rigid beam type connection. This provide a rigid beambetween two nodes to constrain the displacement and rotation of the slab’s node to the displacementand rotation of the joist’s node, corresponding to the presence of a rigid beam between the twonodes. The vertical separation of the joist centroid and the longitudinal slab is properly modelled.The centroid of the longitudinal slab is taken as 35mm below the slab surface and the thickness ofthe longitudinal slab as 70mm. The effective width of the longitudinal slab is taken as 2250mmthroughout the length of the beam.
The vertical separation between the joist centroid and the transverse slab is properly represented,with the centroid of the transverse ribs taken as 55mm below the slab surface. Each of the twosecondary beams (joists) which run parallel to the heated joist has a composite slab connected to it.The end of the each secondary beams (joists) is connected to the primary beams (joists), which has acomposite slab connected to it as well .
The secondary beam (joist) opposite to the tested joist (beyond the column on the same axe as thetest joist) is modelled by beam elements and has a composite slab connected to it. The testedsecondary beam and the opposite secondary beam are connected to the column at the level of theircentre line. The 2 primary beams are connected to the column at the level of their centre line. Theeffect of the slab beyond the column is modelled by applying boundary conditions, on the rotationsand displacement of the primary beam, column, and secondary beam beyond the column.
4. BOUNDARY CONDITIONS
The column is completely fixed at it’s bottom end and free to displace vertically at the top end.Column rotation about the vertical axe is fixed at the level of the connection with the secondarybeams. For all secondary joists, symmetrical conditions are imposed at mid-span (Longitudinaldisplacement and rotation about transverse horizontal axis are fixed. Rotations about the verticalaxe is fixed at mid span as well . For the primary beams; their far end are restrained against allrotations, and against vertical and lateral displacements. At the location of connection with the 2secondary beams, rotation about the vertical and lateral (parallel to the primary beam) axes arerestrained. The longitudinal displacement (parallel to the secondary beams) are restrained isrestrained as well .
Each longitudinal slab is connected to a secondary beam (joist), thus have same boundaryconditions as the joist below it (symmetrical conditions at mid-span). The longitudinal slab abovethe test joist is connected to the longitudinal slab over the adjacent joist (continuous over thecolumn). The longitudinal slab above the secondary joists (parallel to the test joist) are connectedto the longitudinal slab over the primary beam. For the transverse slab: the slab is treated astranslationally and rotationally continuous over the test joist and over the two other secondarybeams. The rotations about vertical and lateral directions are fixed at the far end points which arefixed against horizontal displacement in the direction of the rib axis, and horizontal displacementnormal to the rib axis. These points are free to move vertically (perpendicular to the plane of theslab). Figure 10 shows the boundary conditions used in the model. The symbolic one arrowindicates a displacement restraint in the arrow direction and two arrows indicates a rotationalrestraint around the arrow direction.

1111
Figure 10
Boundary conditions in the numerical model
5. LOADING
5.1. Distributed load
The self weight of the structure and the live load applied during the test are combined to give animposed floor load of 5.48KN/m2. In the numerical model a distributed load of 5.48 kPa is appliedto the slab by means of the uniformly distributed loads on the ribs of 1.644 kN/m. This ismaintained at constant value throughout the thermal loading process. Non linear geometric andmaterial effects were modelled based on the large deformation theory using the Newton-Raphsonmethod.
5.2. Thermal load
The effect of f ire on the structure is modelled by increasing the temperature linearly from ambienttemperature to the maximum temperature reached for each member respectively. The thermal effecton the structure was modelled by considering both, the expansion of each element and the thermalgradient across its section. These two factors are applied to the reinforced concrete slab as well asthe joist. Thermal loading is applied only to the compartment heated zone and outside it accordingto the test measurements. It is applied by defining the final temperature (800°C a the joist centroid)and assuming a linear variation from the initial temperature (20°C) to the final temperature. Thejoist has temperature profile along its total length, and vertical variations in temperature areincluded as a vertical temperature gradient, following the test measurements. steel beam.Temperature gradients are modelled in both the slab and the joist. For the beam finite elementsadopted here, the temperatures are defined as a centroidal temperature and a vertical differencebetween the extreme fibre and the centroid. The extreme fibre temperature of the lower flange of

1122
the joist (LFT), which is used as the reference temperature here, is thus the combination of the inputcentroidal value and the gradient value.
For the slab, only the zone within the compartment is heated. The parts of the slab which lie outsidethe compartment zone are treated as remaining at ambient temperature at all times. The heatingeffect for the slab (membrane and gradient values) are applied both to the longitudinal slab and thetransverse slab models separately. The temperature of all points in the slab which lie within thecompartment are treated as equal at a given height within the slab. Each rib has a constanttemperature over its heated length and is considered to be at ambient temperature outside thefurnace. It may be noted here that the temperature applied to the slab is the mean temperature actingon its geometric centre and the gradient across its thickness is the mean gradient deduced from thetemperature distribution calculated separately for the longitudinal and the transverse directions. Figure11 shows an example of the measured temperature during the fire for the slab and the beam at midspan. In the model, the temperature of the beam varies from one location to another according to themeasured temperatures. In this report the default temperature chosen to describe the differentphenomena during the fire, is the temperature of the lower flange of the beam at mid span.
Temperature distribution during fire
0
100
200
300
400
500
600
700
800
900
0 20 40 60 80 100 120 140 160
Time from start of fire (min)
Tem
pera
ture
(°C
)
Mid point of lower flange Mid point of top flange lower po int of the thick s lab top po int of the thick s lab lower po int of the thin slab top po int of the thin slab
Figure 11
Temperatures in the tested beam and the slab during the fire
In the numerical model, the time lag between the test joist lower flange temperature and the upperflange temperature is represented by assuming a linear increase in the difference between the LFTand the UFT, starting from 0 at ambient temperature to 100°C at the maximum temperature(LFT=850°C). The relationship between the lower flange temperature (LFT = T1) and the slabcentroidal temperature (SCT = T2) is characterised by a linear relationship with the followingcoordinates (T1,T2): (20,20), (800,360). The relationship between the lower flange temperature(LFT = T1) and the slab temperature gradient (SGT = DT3) is characterised by a linear relationshipwith the following coordinates (T1,DT3): (20,0), (800,5) (i.e. the centroidal temperature and the
1133
gradient are arranged to give the top surface of the slab rising to 85 degrees at the end of the test,whilst the lower surface reaches 735°C when the lower flange temperature reaches 800°).
6. COMPARISON WITH TEST DATA
6.1. Deflection at mid-span
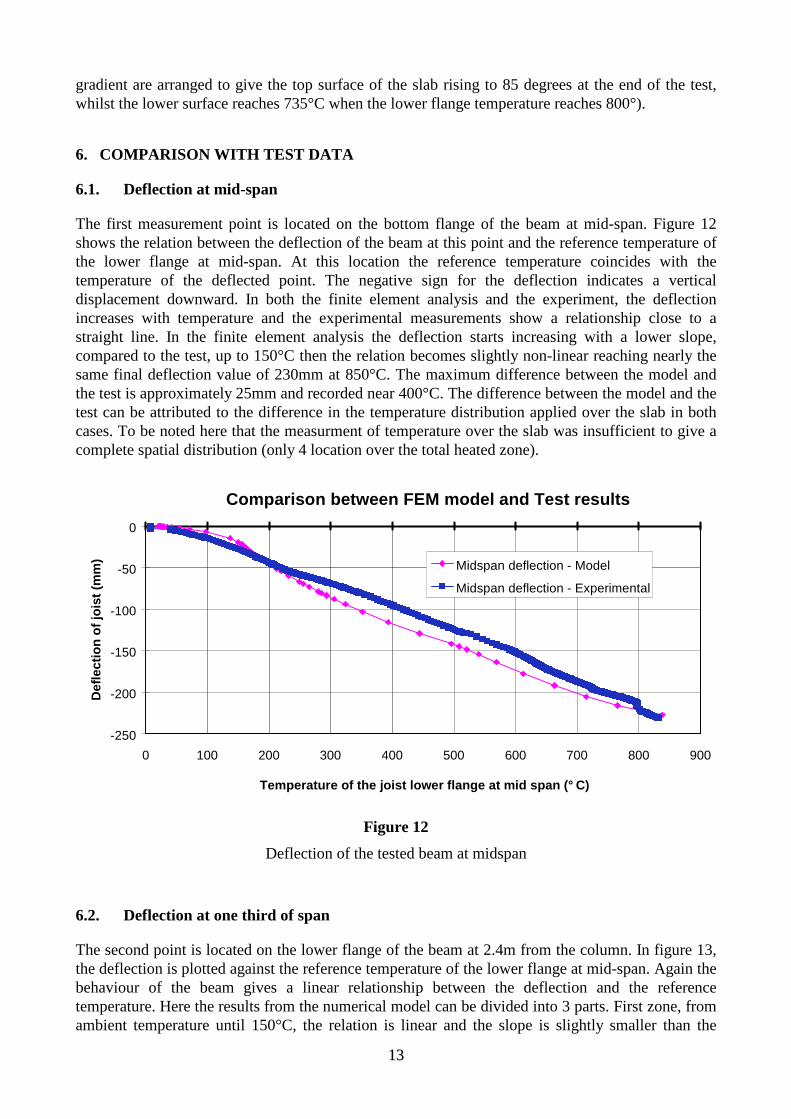
The first measurement point is located on the bottom flange of the beam at mid-span. Figure 12shows the relation between the deflection of the beam at this point and the reference temperature ofthe lower flange at mid-span. At this location the reference temperature coincides with thetemperature of the deflected point. The negative sign for the deflection indicates a verticaldisplacement downward. In both the finite element analysis and the experiment, the deflectionincreases with temperature and the experimental measurements show a relationship close to astraight line. In the finite element analysis the deflection starts increasing with a lower slope,compared to the test, up to 150°C then the relation becomes slightly non-linear reaching nearly thesame final deflection value of 230mm at 850°C. The maximum difference between the model andthe test is approximately 25mm and recorded near 400°C. The difference between the model and thetest can be attributed to the difference in the temperature distribution applied over the slab in bothcases. To be noted here that the measurment of temperature over the slab was insuff icient to give acomplete spatial distribution (only 4 location over the total heated zone).
Comparison between FEM model and Test results
-250
-200
-150
-100
-50
0
0 100 200 300 400 500 600 700 800 900
Temperature of the joist lower flange at mid span (° C)
Def
lect
ion
of jo
ist (
mm
) Midspan deflection - Model
Midspan deflection - Experimental
Figure 12
Deflection of the tested beam at midspan
6.2. Deflection at one third of span
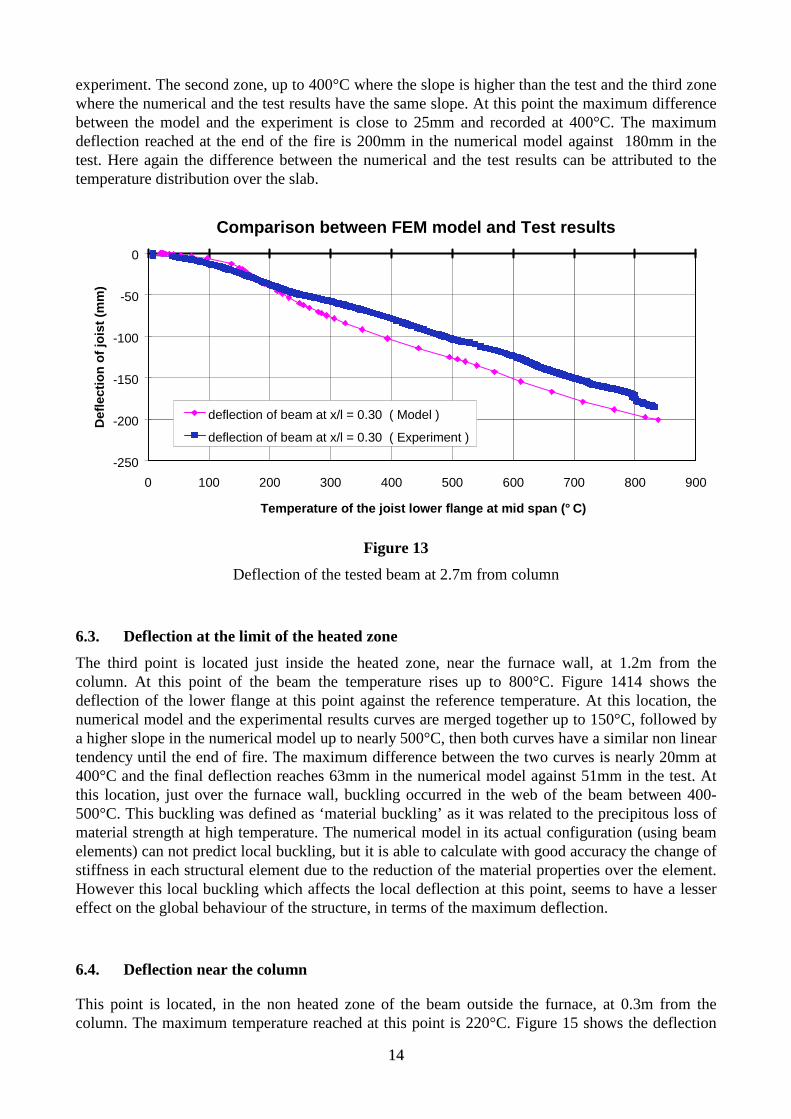
The second point is located on the lower flange of the beam at 2.4m from the column. In figure 13,the deflection is plotted against the reference temperature of the lower flange at mid-span. Again thebehaviour of the beam gives a linear relationship between the deflection and the referencetemperature. Here the results from the numerical model can be divided into 3 parts. First zone, fromambient temperature until 150°C, the relation is linear and the slope is slightly smaller than the
1144
experiment. The second zone, up to 400°C where the slope is higher than the test and the third zonewhere the numerical and the test results have the same slope. At this point the maximum differencebetween the model and the experiment is close to 25mm and recorded at 400°C. The maximumdeflection reached at the end of the fire is 200mm in the numerical model against 180mm in thetest. Here again the difference between the numerical and the test results can be attributed to thetemperature distribution over the slab.
Comparison between FEM model and Test results
-250
-200
-150
-100
-50
0
0 100 200 300 400 500 600 700 800 900
Temperature of the joist lower flange at mid span (° C)
Def
lect
ion
of jo
ist (
mm
)
deflection of beam at x/l = 0.30 ( Model )
deflection of beam at x/l = 0.30 ( Experiment )
Figure 13
Deflection of the tested beam at 2.7m from column
6.3. Deflection at the limit of the heated zone
The third point is located just inside the heated zone, near the furnace wall , at 1.2m from thecolumn. At this point of the beam the temperature rises up to 800°C. Figure 1414 shows thedeflection of the lower flange at this point against the reference temperature. At this location, thenumerical model and the experimental results curves are merged together up to 150°C, followed bya higher slope in the numerical model up to nearly 500°C, then both curves have a similar non lineartendency until the end of f ire. The maximum difference between the two curves is nearly 20mm at400°C and the final deflection reaches 63mm in the numerical model against 51mm in the test. Atthis location, just over the furnace wall , buckling occurred in the web of the beam between 400-500°C. This buckling was defined as ‘material buckling’ as it was related to the precipitous loss ofmaterial strength at high temperature. The numerical model in its actual configuration (using beamelements) can not predict local buckling, but it is able to calculate with good accuracy the change ofstiffness in each structural element due to the reduction of the material properties over the element.However this local buckling which affects the local deflection at this point, seems to have a lessereffect on the global behaviour of the structure, in terms of the maximum deflection.
6.4. Deflection near the column
This point is located, in the non heated zone of the beam outside the furnace, at 0.3m from thecolumn. The maximum temperature reached at this point is 220°C. Figure 15 shows the deflection

1155
curve in the numerical and the experimental curves at this point. In the test, the deflection increasesup to 16mm at 560°C (reference temperature) then it decreases and stabili ses at 14mm. In thenumerical model the deflection increases, in a non linear manner, and reaches a maximum valueslightly higher then 6mm at 450°C then it decreases and stabili ses just below 4mm. We can see thatthe predictions from the numerical model show a behaviour comparable to the test.
Comparison between FEM model and Test results
-100
-90
-80
-70
-60
-50
-40
-30
-20
-10
0
0 100 200 300 400 500 600 700 800 900Temperature of the joist lower flange at mid span (° C)
Def
lect
ion
of jo
ist (
mm
)
deflection of beam at x/l = 0.10 ( Model )
deflection of beam at x/l = 0.10 ( Experiment )
Figure 14
Deflection of the tested beam at 0.9m from column
Comparison between FEM model and Test results
-50
-45
-40
-35
-30
-25
-20
-15
-10
-5
0
0 100 200 300 400 500 600 700 800 900
Temperature of the joist lower flange at mid span (° C)
Def
lect
ion
of jo
ist (
mm
)
deflection of beam at x/l = 0.04 ( Model )
deflection of beam at x/l = 0.04 ( Experiment )
Figure 15
Deflection of the tested beam at 0.35 m from column

1166
From the above comparisons, between the finite element predictions and the test measurements, wecan see that the numerical model is in agreement with the test over the total time of the fire and thedifferent approaches used in the model, described above, can predict with acceptable accuracy theglobal behaviour of the structure under fire conditions.
7. CONCLUSION
In this paper we described a finite element model developed to simulate the first full scale fire testcarried in the large building test facilit y at Cardington. The test was dedicated to study the behaviourof a restrained composite beam under fire conditions. The composite action between the slab andthe beam was assured in the model by means of rigid elements coinciding with the shear studlocations. The connections between different steel members were modelled by imposingdisplacement constraints to the nodes of the members. Using the general purpose finite elementprogram ABAQUS, a numerical model capable of predicting the behaviour of the composite framedstructures under fire condition was developed.
The results of the numerical model were compared with the experimental measurements at fourdifferent locations on the tested beam, inside and outwith the heated zone. The comparisons showedgood agreement between the model and the test measurement for the total time of f ire at differentpoints of the tested beam. The finite element model developed in this paper has been developedwith the aim of understanding local and global structural behaviour during fire. In the authorsopinion redundant structure behaviour in fire is dominated by the effects of restrained thermalexpansion and a variety of loadpaths are mobili sed during the course of the loading. These issuesare currently being explored through further application of the model described here and will bereported in greater detail i n subsequent publications.
8. REFERENCES
Abaqus (1994) : Abaqus theory manual and users manual, version 5.4, Hibbit, Karlsson andSorensen Inc., Pawtucket, Rhode Island, USA
P.N.R. Bravery (1993): Cardington large building test facilit y, Construction details for the firstbuilding, internal report British Steel plc.
D.J. O’Connor and al. (1995) : Determination of the fire endurance of model concrete slabs using aplastic analysis methodology, The Structural Engineer, Volume 73, No 19/3.
Eurocode 2 (1995) : Design of concrete structures - Part1-2 : General rules - Structural fire design,ENV 1992-1-2.
Eurocode 3 (1995) : Design of steel structures - Part1-2 : Fire resistance, ENV1993-1-2.
Eurocode 4 (1994) : Design of composite steel and concrete structures - Part1-1 : General rules andrules for buildings, ENV 1994-1-1.
B.R. Kirby (1995) : Behaviour of a multi -storey steel framed building subject to natural fires: Test1-restrained beam, deflection measurements, Document ref; S423/1/Part D1, British Steel plc.
B.R. Kirby (1995) : Behaviour of a multi -storey steel framed building subject to natural fires: Test1-restrained beam, temperature measurements, Document ref; S423/1/Part T1, British Steel plc.